
The Identification of Risks for Drinking Water Intakes in Urbanized Area: The Case Study of Toruń (Central Poland)


1
Faculty of Earth Sciences and Spatial Management, Nicolaus Copernicus University, Lwowska 1, 87-100 Toruń, Poland
2
Centre for Underwater Archaeology, Nicolaus Copernicus University, Lwowska 1, 87-100 Toruń, Poland
3
Toruń Waterworks, Department of Surface Water Intakes “Drwęca-Jedwabno”, Dworcowa 1B, 87-162 Lubicz, Poland
4
Faculty of Engineering, University of Environmental Management in Tuchola, Pocztowa 13, 89-500 Tuchola, Poland
*
Author to whom correspondence should be addressed.
Water 2021, 13(23), 3378; https://doi.org/10.3390/w13233378
Submission received: 1 October 2021
/
Revised: 17 November 2021
/
Accepted: 25 November 2021
/
Published: 1 December 2021
(This article belongs to the Special Issue Assessment and Management of Flood Risk in Urban Areas)
Abstract
:This article discusses the problem of natural hazards connected with climatic changes and their influence on water safety. A medium-sized town in central Poland which is supplied with consumption water from both underground water intakes and surface water resources was selected as a case study. Natural hazards, such as droughts or floods, were identified and the risk of the occurrence of natural hazards concerning water supply systems assessed. The findings of the archived data analysis for the period 1971–2020 helped to identify extreme circumstances, the occurrence of which had an impact on secure water supplies in terms of quantity. Moreover, the results obtained indicate that the greatest influence had all the situations connected with the Drwęca low water discharge, which in the long term could lead to temporary water shortages. In the analyzed period, there was a significant increase in the number of days without precipitation, together with a statistically significant increase in the average annual air temperature. Meteorological hazards related to days without precipitation far outweighed the occurrence of days with intense precipitation. The analysis of water table fluctuations observed at the Jedwabno infiltration intake showed a high sensitivity of the aquifer to atmospheric conditions.
1. Introduction
The pressure on water resources is increasingly heavier and frequently contributes to a decline in available water resources [1]. This phenomenon is particularly visible in arid and semiarid zones, and in the Mediterranean region [2,3,4,5,6]. European countries situated in the temperate climate zone are experiencing problems with water intended for human consumption more frequently. According to the European Environment Agency [7], the balance between water demand and water availability has reached a critical level in many European areas as a result of overexploitation of water as well as prolonged periods of low precipitation or drought. The most serious consequences are expected in southern and southeastern regions of Europe, which already suffer from water shortages [8]. Poland is regarded as one of the countries with most limited water resources in Europe per capita [9,10,11]. According to the international classification of the size of water resources proposed by Falkenmark et al. [12], Poland is included in the regions where the size of water resources is close to the threshold of water stress. Changeable climatic conditions pose a risk to water security systems of many countries. The example of serious threats to the continuity of drinking water supply to consumers was the drought that affected both Poland and Europe in 2015. The consequences of the drought were felt in various sectors of the domestic economy, such as agriculture, industry, and national inland waterways transport [13,14,15]. As a result of the meteorological drought, the flows of the largest rivers in Poland have reached the lowest values over the past decades [16,17,18], whereas in the case of smaller watercourses, a complete disappearance of flows in the river bed has been observed [19].
Bearing in mind the fact that both surface and underground water resources are characterized by considerable spatial and temporal variability, the challenge of supplying the population with drinking water constitutes one of the most significant problems for water management policy. Global projections for the future indicate that climate change may increase the risk of water stress and compromise water safety as well as increase the risk of drought and flood in many regions of the world, including Poland [20]. It will have an impact on water supply for people and industry, agriculture, and conventional generation of energy. This problem is particularly visible in urbanized areas, where large concentrations of population have contributed to an enormous increase in water demand. Increasing population of cities is associated with the creation of new housing estates and the creation of vast suburban zones, often in places where there are drinking water intakes. Such a situation causes threats to both the quantity and quality of water [21,22,23]. Taking into account these aspects related to climate change in areas of human pressure, water-related conflicts may arise in relation to three categories of problems: too little water, too much water, or dramatically polluted water [24]. It is important that the climatic and hydrogeological issues of urban areas are interpreted jointly, as urbanization modifies almost all elements of the natural environment [22].
This article discusses the problem of natural hazards connected with climatic changes and their influence on water safety. The main aim of the study is to identify natural hazards, i.e., floods and droughts, and to assess the risk of natural hazards in supplying the inhabitants of urbanized areas with drinking water. As the case study, a medium-sized city in central Poland was selected, which is supplied from both groundwater and surface water intakes. In the conclusion, strategies pertaining to water resources management and their efficiency in the light of the municipal adaptation plans to future climatic changes are discussed.
2. Research Background (Risk Analysis and Regulations in Poland in Comparison to the European Union)
Collective drinking water supply in Poland is carried out by water and sewage management companies. They are obliged by law to ensure continued water supplies of proper quality. Water and sewage management companies are also under obligation to perform regular quality controls of water supplies, which involve the analyses of physical and chemical, bacteriological, and organoleptic parameters immediately after leaving water and sewage management companies, in the water distribution network and finally directly at homes of independent recipients [25]. Polish legal solutions concerning collective drinking water supply are regulated by the Act of Law from 7 June 2001 [26] pertaining to collective water supply and collective sewage disposal. Since 1 May 2004, Poland has been a member state of the European Union and as such is obliged to comply with the requirements of the Water Framework Directive [27]. In 2015, Directive 98/83/EC of the European Commission from 3 November 1998, concerning the quality of consumption water [28], was revised and a new approach to water safety based on risk management in the whole supply chain of drinking water was introduced [29] (European Commission Directive 2015/1787 from 6 October 2015, with amendments to annexes 2 and 3 of the Directive 98/83/EC). It was the implementation of the recommendation of World Health Organization (WHO) [30], stating that the most effective method of ensuring coherent consumption water supplies is to apply complex methods of risk management assessments, which involve all stages of water supply systems, from the intake to the consumer.
According to the WHO guidelines [30] concerning the quality of consumption water, a risk assessment methodology for water supply systems was introduced under the name Water Safety Plan (WSP), the implementation of which is recommended as the most effective tool for the continued safety of water supplies. The Water Safety Plan requires, firstly, assessing risk that involves all the stages of water supply; secondly, implementing and monitoring measures of controlling risk management; and thirdly, continuous reporting and updating. These plans are formulated according to the principle of multiple safety barriers, hazard analysis, critical control points, and other organized management methods.
The necessity to introduce risk assessment for water supply systems in Poland is confirmed by the results of reports drawn up by the Supreme Audit Office [31]. The report concludes that the urban population of large agglomerations in Poland is not sufficiently covered for the occurrence of emergency situations concerning water supply systems.
In order to assess safety risks of water supplies properly, probable hazards which may lead to water contamination, operational restrictions of water pipelines, or disruptions in water supply should be recognized on the basis of individual features of water supply systems. The next step involves conducting the identification of all potential hazards in relation to biological, physical, chemical, and radiological factors, among many others that determine public health. Due to the fact that risk assessment of consumption water intakes in Poland did not become obligatory in Poland until the adoption and implementation of Water Law from 20 July 2017 [32], there are no previously established criteria or methods concerning hazard assessment, and such assessments have so far been scarce [33,34,35]. The preparation of risk analysis is carried out on the basis of different methodologies and assessment systems. The following study focuses on a three-stage risk matrix that has been used to assess risk for a consumption water intake in the case of a middle-sized town in Poland.
The most important natural risks to consumption water intakes include events connected with the occurrence of natural disasters such as floods, droughts, and severe precipitation or violent storms. In many cases, a regular water supply system collapses after such extreme events due to various forms of contamination. In these circumstances, secondary effects of the triggering events prove to be more acute than primary effects [36].
3. Research Area
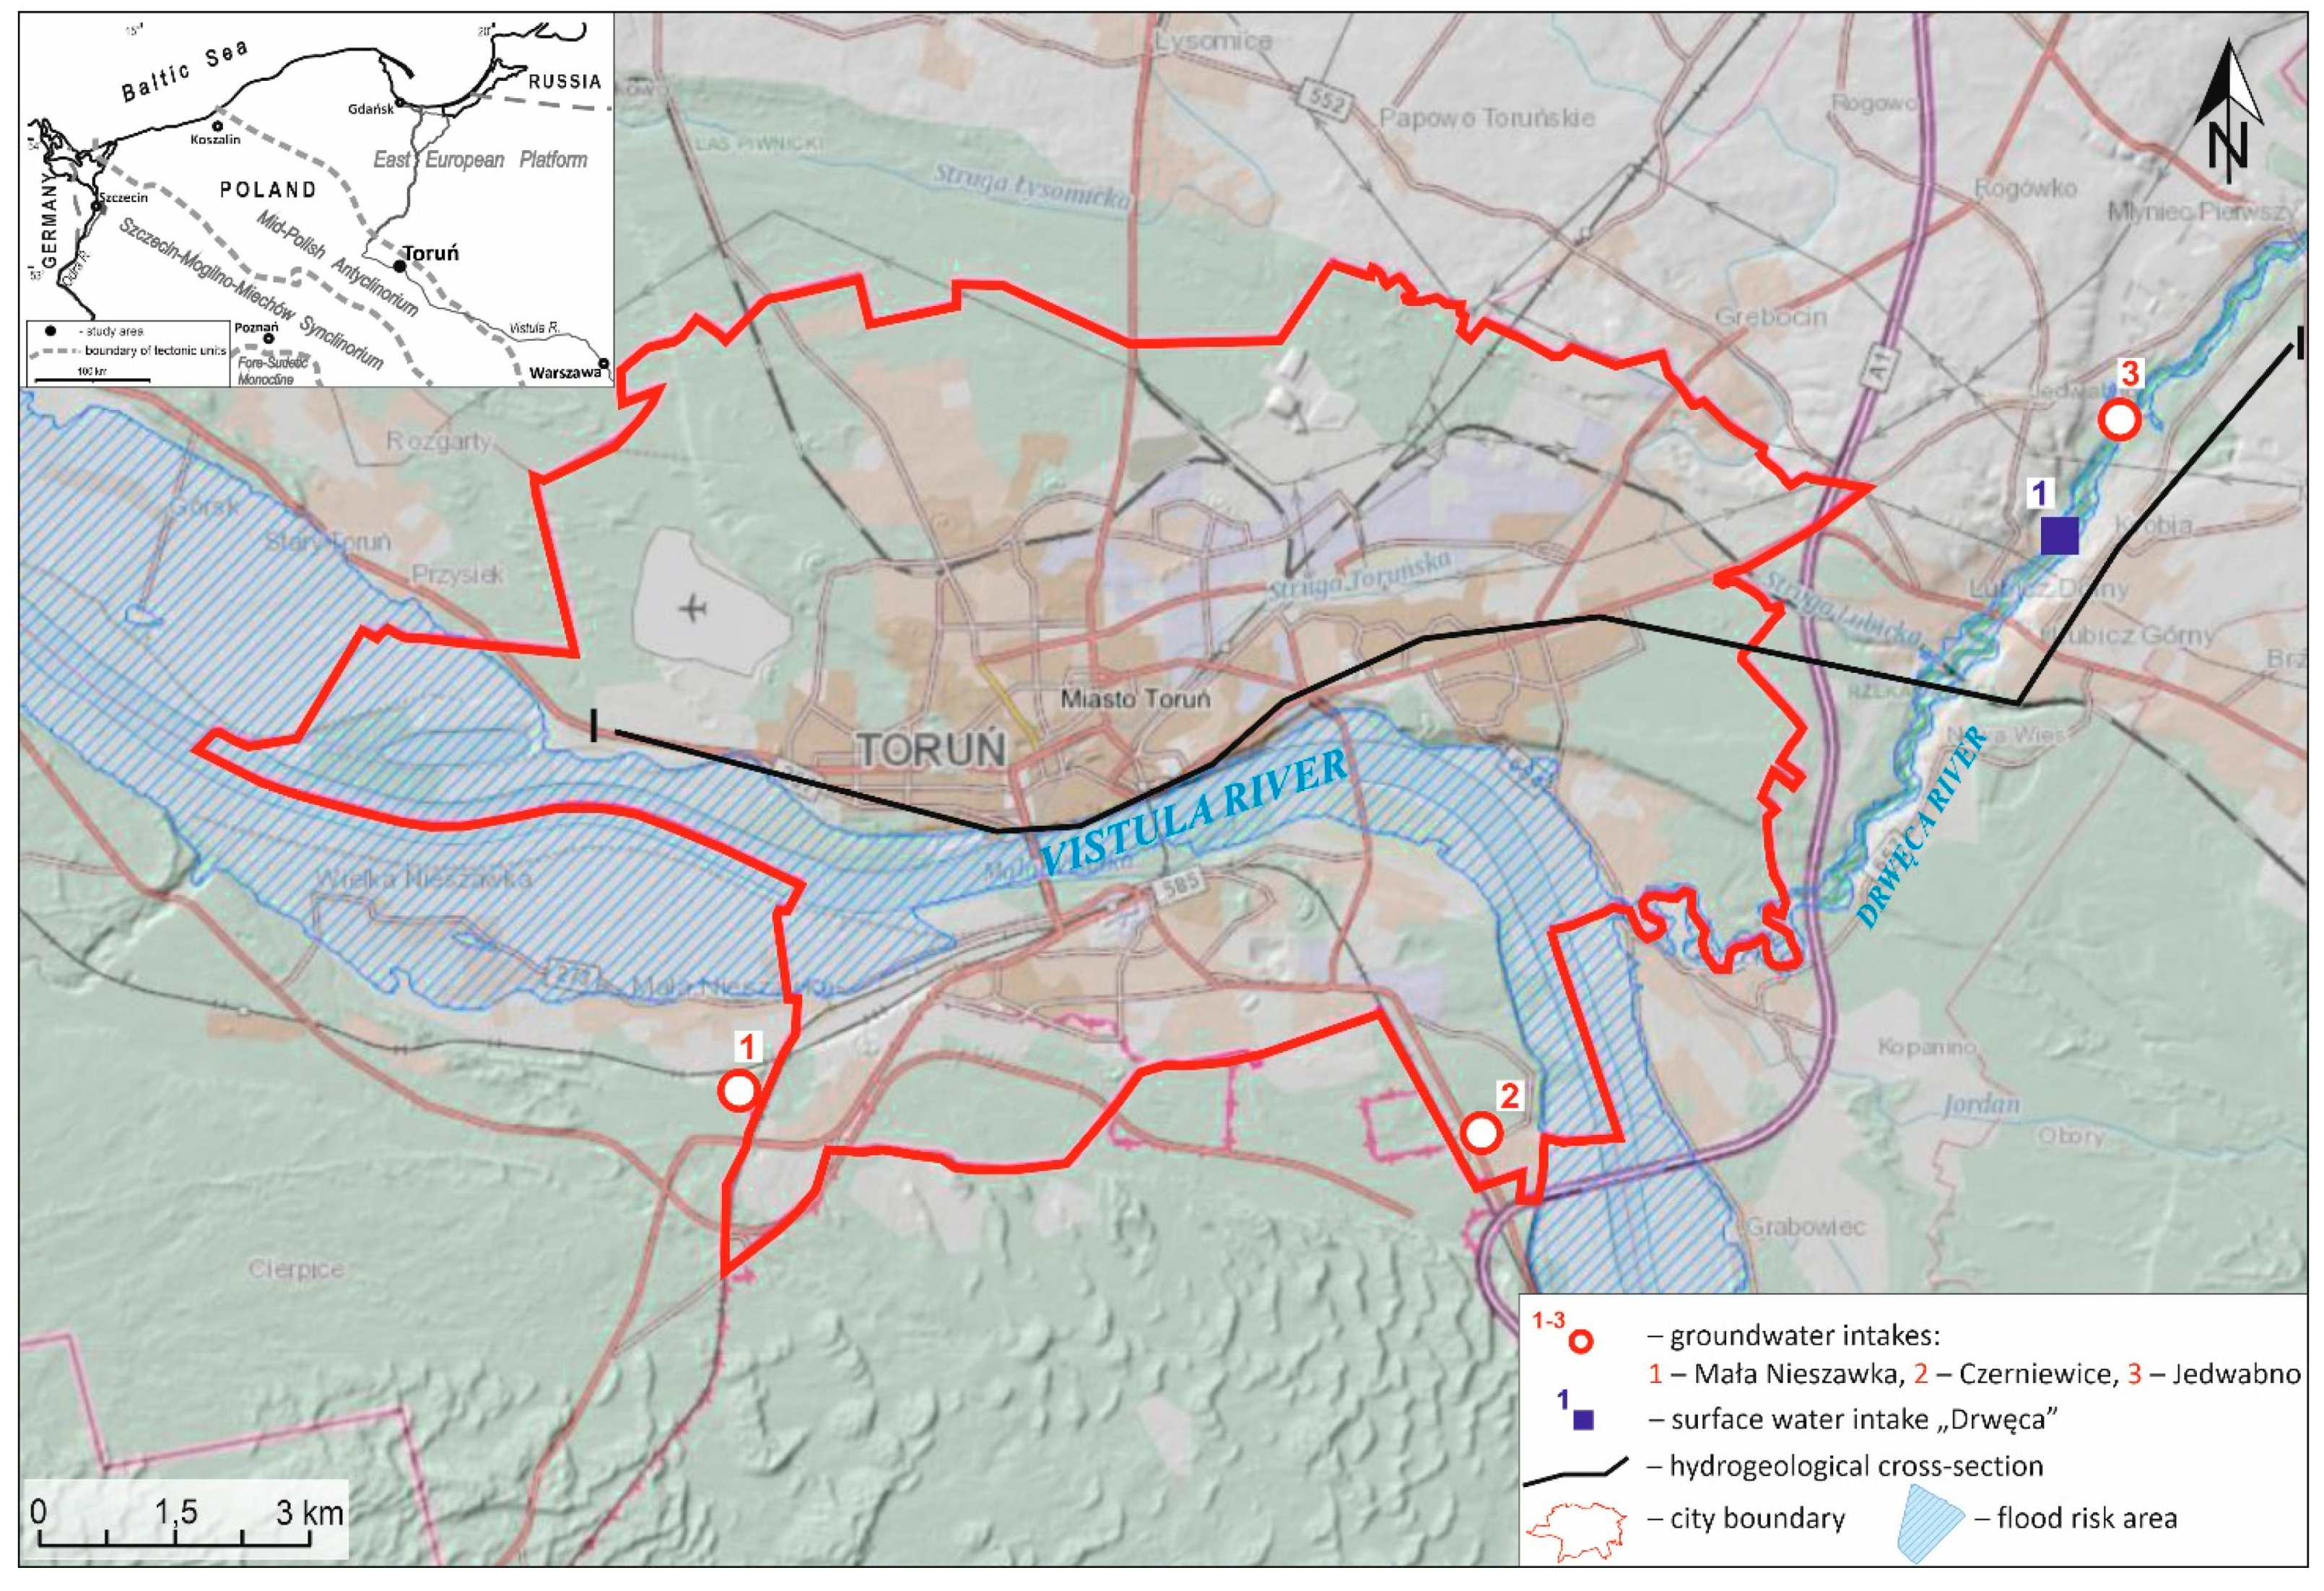
Toruń is a medium-sized town situated in the heart of Poland. The area of Toruń does not exceed 116 km2. The town lies on the Vistula River, the largest river in Poland, and the Drwęca River, its right-side tributary (Figure 1). The population of Toruń in 2019 was 201,447 inhabitants. It constituted 9.72% of the population of the Kuyavian and Pomeranian voivodship and 0.52% of the total population of Poland. Toruń is one of the oldest towns in Poland, which was located and obtained municipal rights in 1233.
3.1. Hydrogeological Condition
In Toruń, two areas characterized by different hydrogeological conditions can be distinguished: the area of the proglacial valley—the structural basin of Toruń together with the Drwęca River Valley, and the postglacial upland including the area of Chełmno and Dobrzyń Lakeland and the Inowrocław Plain.
Aquifers in the vicinity of Toruń are multilevel by nature and occur in the Quaternary (Pleistocene and Holocene, Pleistocene), Neogene (Miocene), and Upper Cretaceous formations (Figure 2).
Within the structural basin of Toruń and the Drwęca River Valley, only one valley groundwater aquifer connected with the Quaternary terraces of the Vistula River and the Drwęca River can be found. It is composed of various-grained sands and river accumulation gravels. The static water level is free and on the flood and lower alluvial terraces it is shallow, most commonly not exceeding a depth of 5 m [37].
In the northern parts of the upland, only one Quaternary (Pleistocene) aquifer, which occurs as an interclay or subclay water-bearing level, has been hitherto recognized. In the southern part, within the Quaternary sediments, three sandy layers heavily affected by water inflow have been determined. Two of them, the interclay and subclay layers, are common and they are locally interconnected. The third aquifer occurs only in the Quaternary (Pleistocene) land depression. The aquifers are composed of fluvioglacial sediments, the thickness of which is between 5 and 20 m; however, locally they can even reach a thickness of 40 m [38].
The Neogene (Miocene) aquifer occurs locally directly beneath the Quaternary sands of the valley water-bearing level, which are heavily affected by water inflow. This aquifer creates a combined Holocene, Pleistocene, and Miocene water-bearing level. It consists of fine-grained and medium-grained silica sands with interbeds of sludge, lignite dust, and lignite inserts belonging to lignite formation [37].
Ordinary water of the Upper Cretaceous aquifer has a limited range [37]. It occurs within a narrow strip of land (approximately 10 km), adjacent to the right bank of the Vistula River. In the remaining area, water of the Cretaceous water-bearing level is mineralized. Its water drainage property is connected with cracks and crevasses of the Upper Cretaceous carbonate sediments: marlstones, limestones, marly limestones, and marly bedrocks [38].
The area of the municipality of Toruń belongs to the regional system of groundwater circulation, the drainage base of which is the Vistula River, and locally the Drwęca River. The recharge of the aquifer occurs by direct infiltration of precipitation in the zone of shallow groundwater, by lateral inflow of water from upland areas, and through groundwater filtration from overlying aquifers to deeper water-bearing levels [39]. The main recharge areas of the Pleistocene and the Pleistocene and Holocene aquifers are connected with the areas of the Chełmno and Dobrzyń Lakeland, Inowrocław Plain, and the alluvial terraces of the Toruń Structural Basin and the Drwęca River Valley.
3.2. Groundwater and Surface Water Intakes
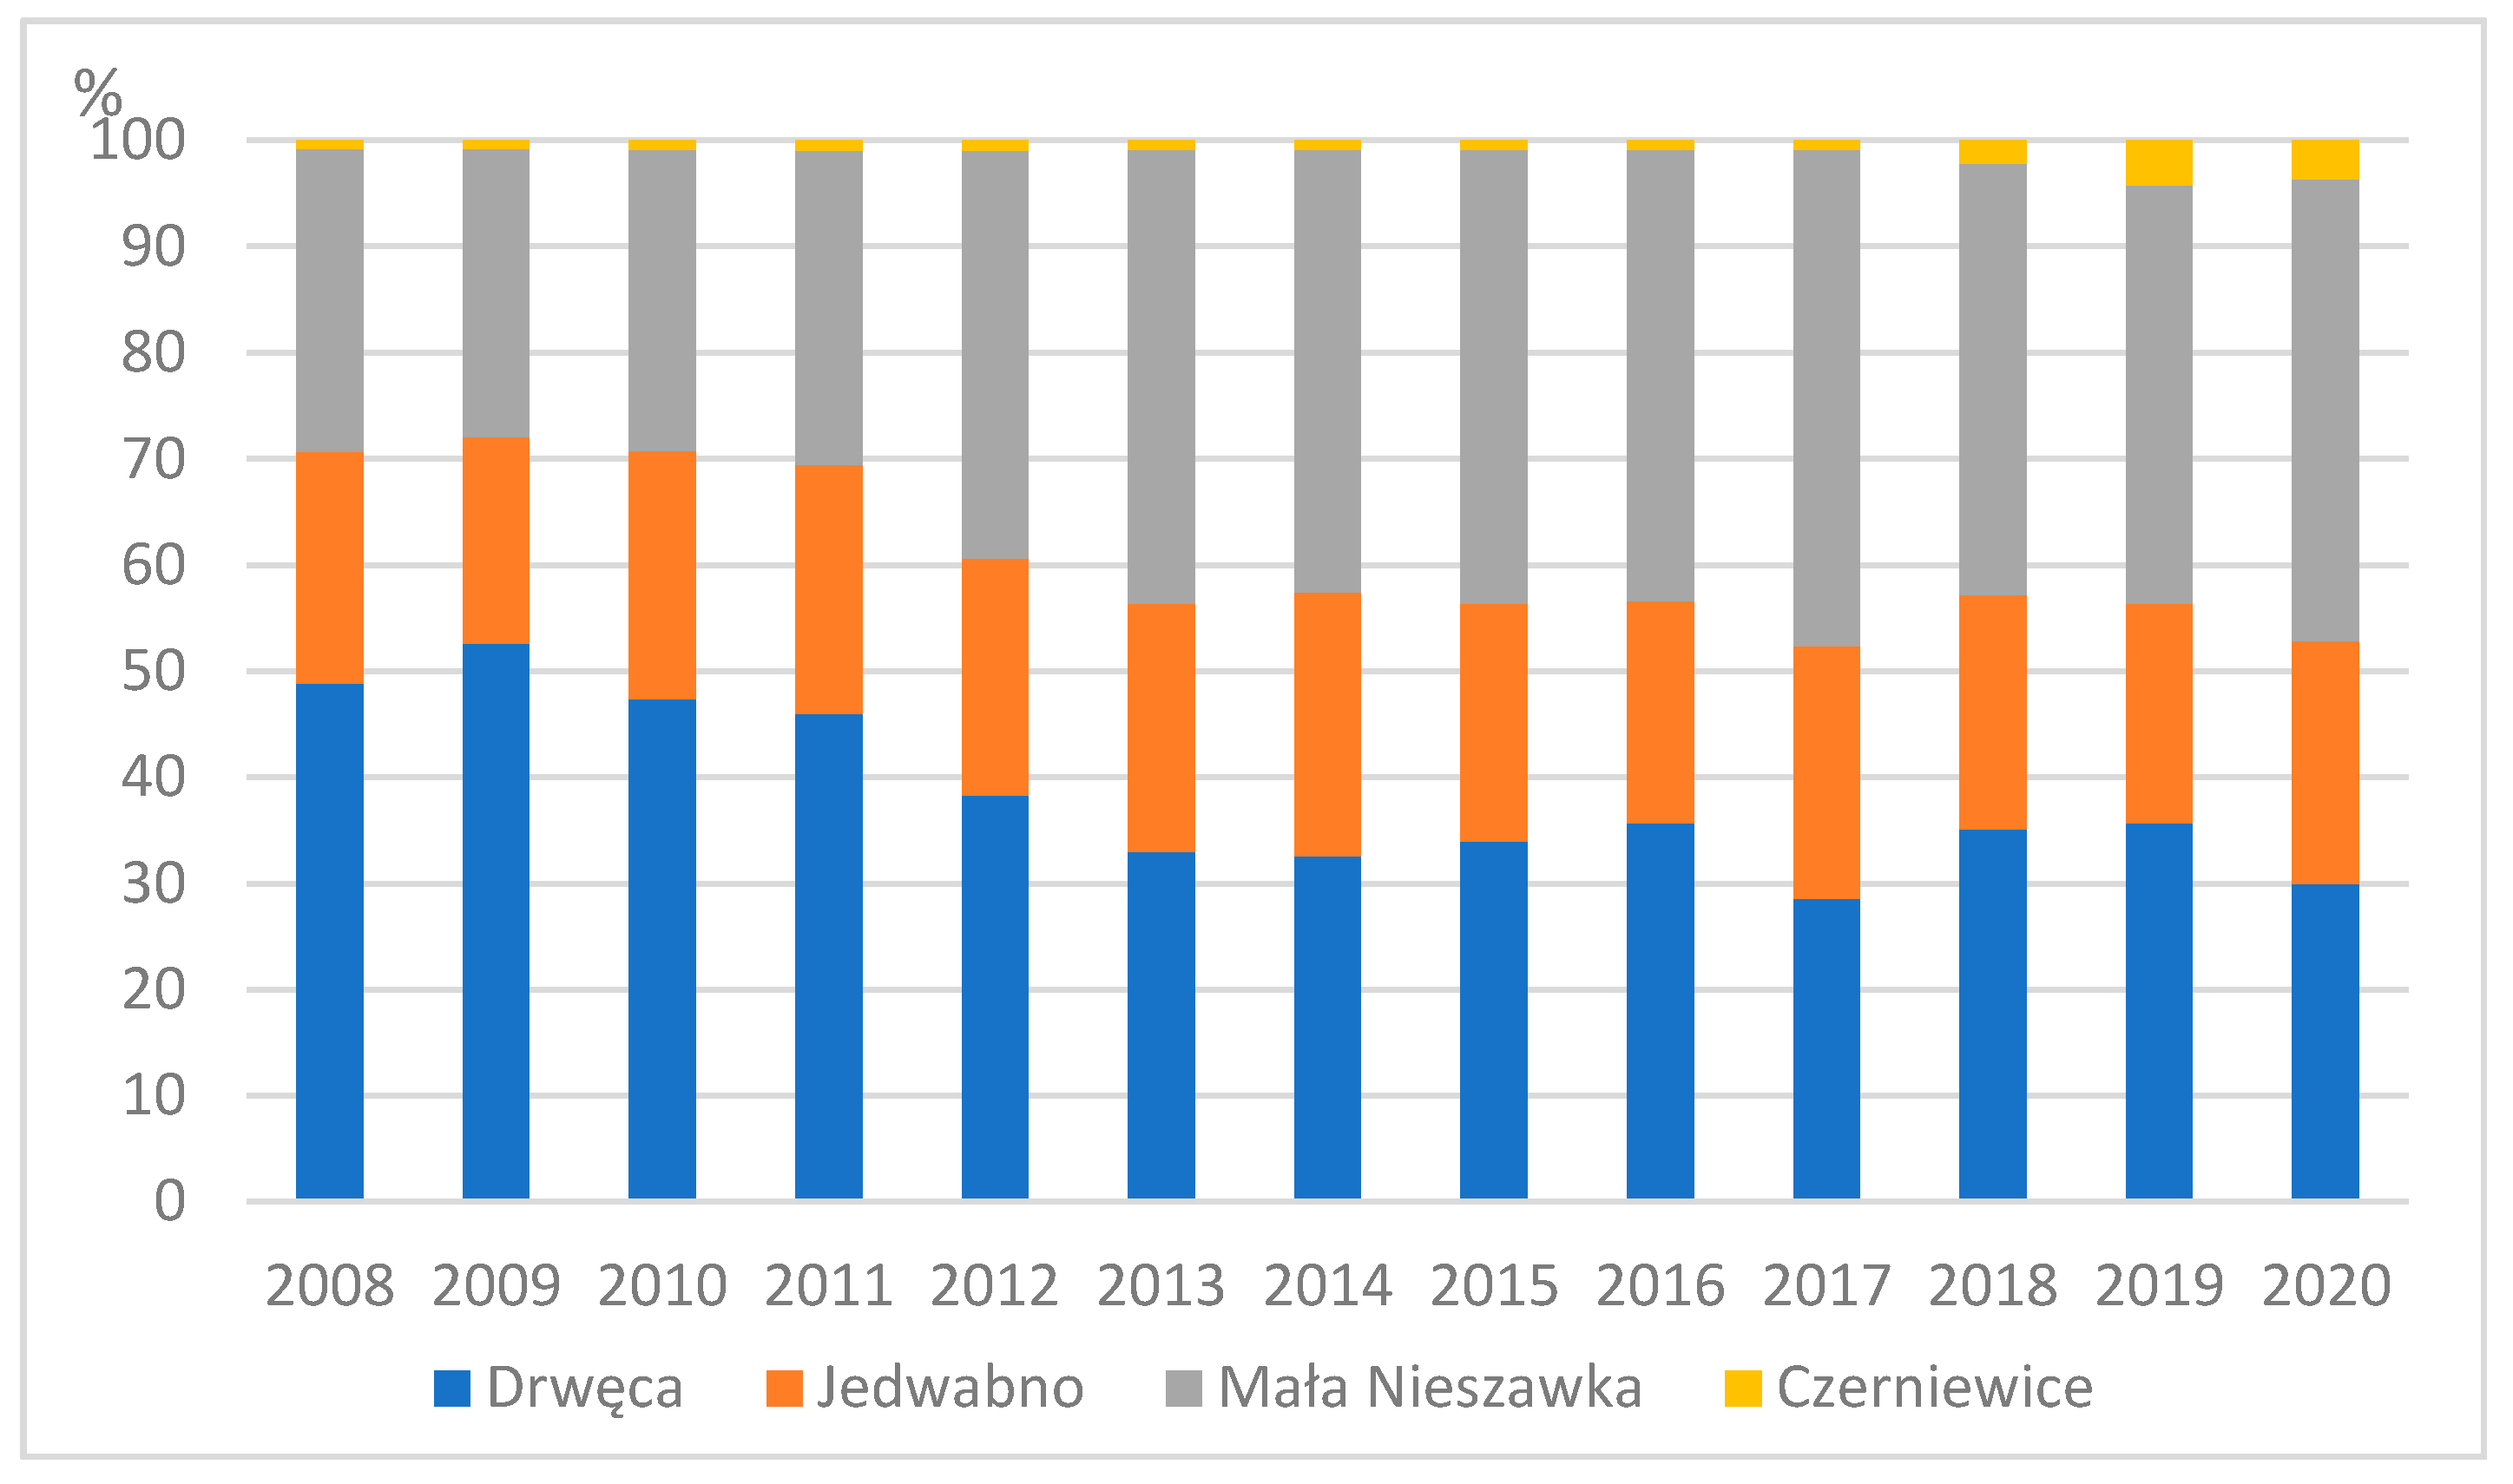
Along with the social and economic development of Toruń toward the end of the 1970s, the demand for drinking water increased. The existing underground water intakes were insufficient, and therefore, toward the end of the 1970s, a surface intake of consumption water from the Drwęca River was constructed, and currently it constitutes one of the main sources of water supply for the inhabitants of Toruń. In addition to this one, there are three other water intakes in operation: the infiltration water intake in Jedwabno and two underground water intakes: one in Mała Nieszawka, and another in Czerniewice. The water taken from the Drwęca surface intake and from the infiltration intake in Jedwabno is channeled to the Drwęca–Jedwabno water treatment plant in Lubicz. The Mała Nieszawka water intake has its own water treatment plant. Currently, the highest quantitative contribution of water fed into the supply water system comes from the underground water intake in Mała Nieszawka. According to the general annual balance for 2020, the Mała Nieszawka water intake supplied 43.4% of all the water taken for the needs of the whole water supply system. The remaining intakes supplied accordingly less water. The surface intake from the Drwęca supplied 29.9%, the infiltration water intake in Jedwabno 23.0%, and the underground water intake in Czerniewice only 3.7% of the total balance of abstracted water (Figure 3).
The needs of Toruń in terms of water supply for public utility and industrial purposes are covered by two underground water intakes: Mała Nieszawka and Czerniewice, and the infiltration intake in Jedwabno, which is located in the Drwęca River Valley. All three intakes are operated by Toruńskie Wodociągi Ltd. Underground water contributes to half of all water supplies for the municipality of Toruń. The remaining part comes from the municipal surface water intake from the Drwęca River in Lubicz. Regardless of municipal intakes, underground water is also operated in Toruń by industrial company intakes [38].
The greatest amount of water is abstracted in the underground water intake in Mała Nieszawka, which supplies water for the inhabitants of the western and southern districts of Toruń. This intake works at its full capacity. The remaining intakes supplement the demand for specific amounts of water. The Jedwabno infiltration intake and the Drwęca surface intake supply the eastern part of Toruń with water, where a large residential estate is located, which is the dormitory district of Toruń.
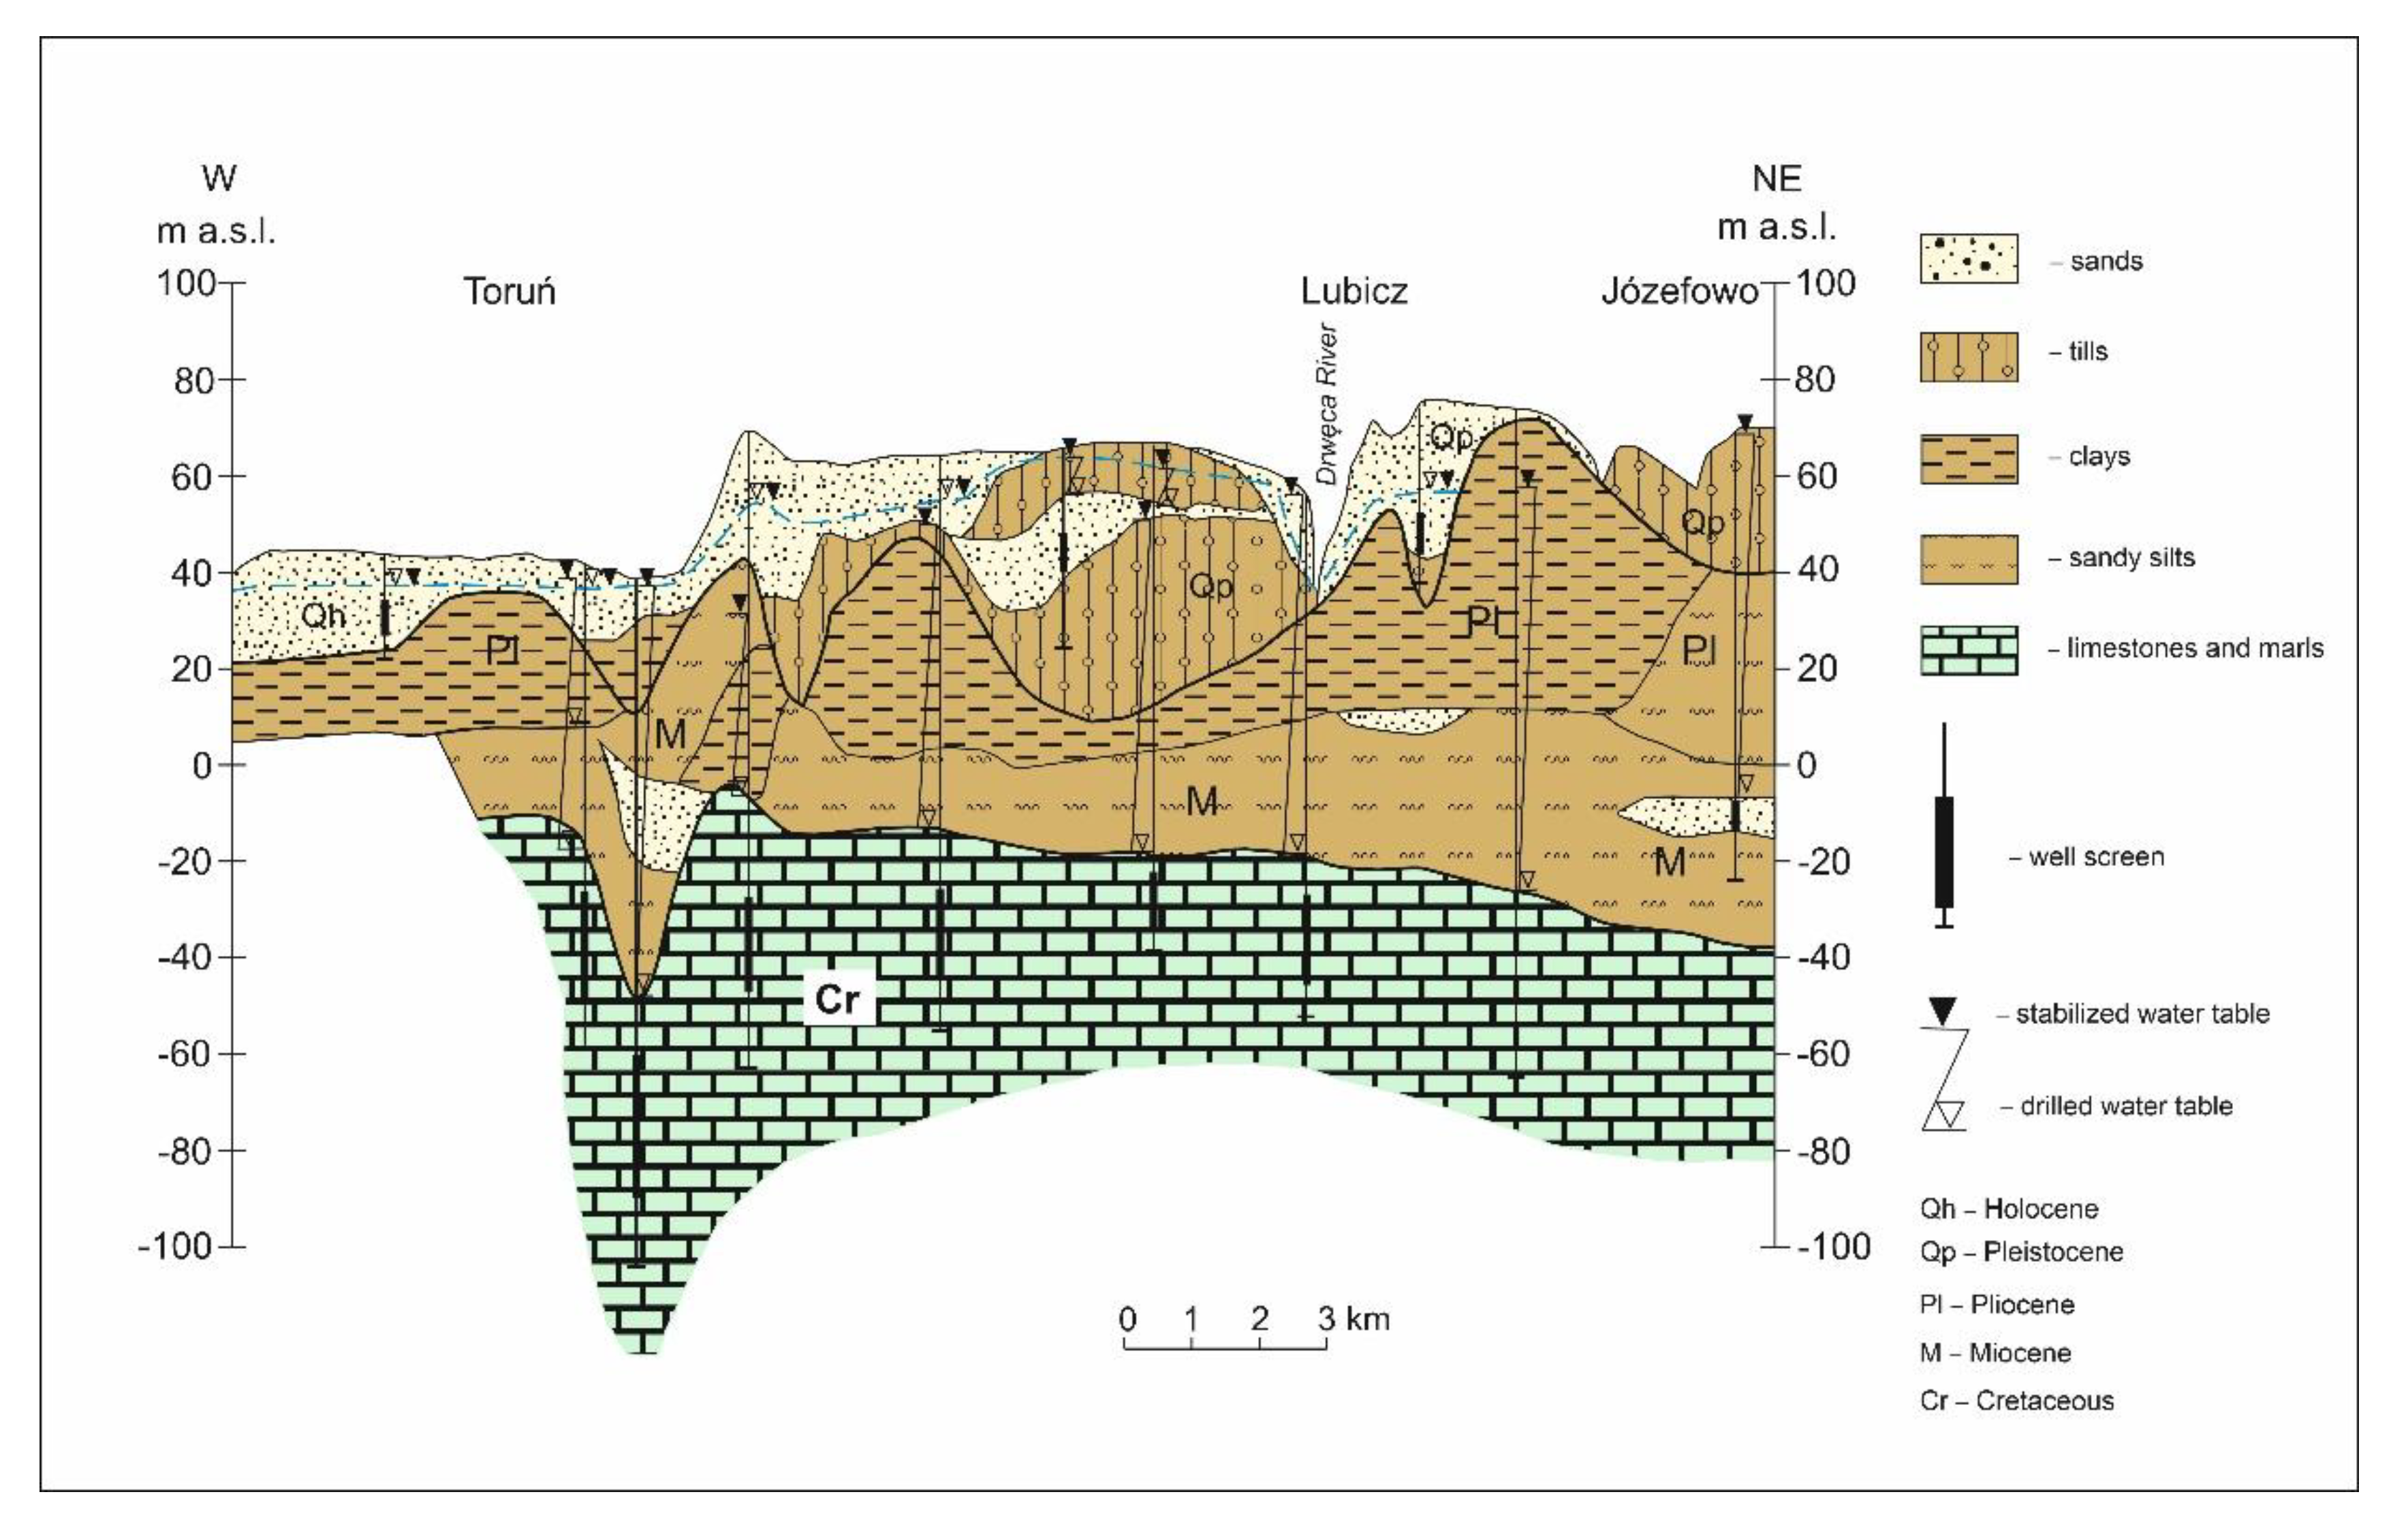
The Jedwabno infiltration intake is situated on the narrow right terrace of the Drwęca River and is only 15 km from the estuary of the Drwęca into the Vistula. In 2020, the intake consisted of 13 operational well-holes, 4 of which perform the function of replacement well openings. In addition to the wells, there are 8 observation wells within the intake, monitoring the quantitative and qualitative state of the water taken. In addition to well-holes, there are six observation holes within the intake. Operational holes create a 550 m barrier located within the perimeter of 10–30 m from the right bank of the Drwęca River. The wells that constitute the intake abstract Quaternary water-bearing formations (various-grained sands), which form an aquifer with a free water table. These sediments are connected with the buried river valley deeply indented in the Pliocene sludge. In the vicinity of the Jedwabno intake, the width of the valley varies between 500 and 900 m, whereas the thickness of the abstracted Quaternary sands ranges from several to 27 m, with the average value at the level of approximately 20 m. The aquifer recharge comes about primarily as a result of the infiltration of rainwater, water inflow from elevations situated above the river valley, and water infiltration from the Drwęca River. The lack of a natural barrier in the form of poorly permeable formations on the surface results in poor insulation of the abstracted aquifer, which as a consequence is exposed to the hazard of dirt penetration. The hydrogeological cross-section of this intake is presented in Figure 4.
The additional supplement of water abstracted from the Jedwabne intake is the surface water intake from the Drwęca River. The Drwęca intake is a bay intake of surface water from the Drwęca River. Water is abstracted from the reservoir, the surface of which reaches approximately 42 ha and which constitutes a part of the Drwęca River. From the side of the lower Drwęca, the reservoir is locked by a damming barrage—a weir, which is a hydrotechnical structure situated in the meander of the river, 12.7 km from its estuary into the Vistula. The purpose of this barrage is to dam water in the regulated riverbed of the Drwęca River as well as to maintain a suitable level of water in the bay.
A detailed risk analysis has been conducted for the surface intake from the Drwęca River and the infiltration intake in Jedwabno, which, considering their location within the flood zone of the Drwęca and the specificity of the intake, are the most vulnerable to the possibility of interruptions in water supplies.
4. Research Methodology and Data
In order to assess the safety of water supplies in Toruń in terms of the occurrence of potential natural hazards and emergency situations, an analysis of historical record was conducted. The emphasis was placed exclusively on natural risks, the occurrence of which may have an impact on the amount of consumption water abstracted from the surface water intake on the Drwęca River and from the infiltration water intake in Jedwabno.
The identification of meteorological hazards was conducted on the basis of daily precipitation totals and mean daily air temperatures recorded at the meteorological station in Toruń. In the study, the number of days with no precipitation and with daily precipitation over 30 and 50 mm was taken into consideration. For the purpose of hydrological risk assessment, daily rates of the Drwęca River discharge recorded at the hydrological station in Elgiszewo were used. The water gauging station in Elgiszewo is situated approximately 14 km from the infiltration intake and 18 km from the surface intake. The Drwęca River catchment area, closed at the level of the Elgiszewo water gauging station, is 5019.48 km2. The meteorological and hydrological records date back to the period 1971–2020 and come from the Institute of Meteorology and Water Management—National Research Institute. The meteorological and hydrological data were analyzed statistically. For the values of the annual sums of precipitation, air temperature and flows of the Drwęca River, the trends of changes in these parameters in the analyzed period were investigated. For this purpose, the nonparametric Mann–Kendall test [40,41], the Mann–Kendall Z statistic, and the slope β expressed by the Theil–Sen estimator [42,43] were used. The detailed methodology of calculating trends can be found in the literature [2,15,44]. For the purpose of assessing natural risks connected with drinking water supply safety, the threshold method of identifying floods and low-water periods was adopted. This method was successfully applied by Yevjevich [45]. The risk of flooding was identified on the basis of exceeding the threshold flow rate, which was calculated for the long-term period of 1951–2020. However, as far as the threshold flow rate for the low-water periods is concerned, the SNQ value was adopted.
The amount of water drawn from particular intakes that supplies the inhabitants of Toruń with consumption water was obtained from the Toruńskie Wodociągi Ltd. water supply and sewage system company. The data collected include daily values of water abstracted from particular intakes within the time period between 2008 and 2020.
The risk assessment involving hazard identification and risk analysis was carried out on the basis of the applicable standard, PN-EN 15975-2 [46]. PN-EN 15975-2 defines the risk management system as a process dealing with hazard identification and possible hazardous events as well as risk assessment and control concerning disruptions of water supply from the intake to the consumer. Risk assessment involves estimating the likelihood of the occurrence of hazardous events together with their potential consequences. The recommended methodology of the applicable standard is based on risk matrices and can be successfully applied in risk analysis in accordance with the requirements of Water Law, which is currently in force.
The following study presents a three-stage risk matrix which was applied to assess the level of risk for the infiltration water intake in Jedwabno. This intake is the most vulnerable to natural hazards and simultaneously constitutes an important element in the water supply system to the Drwęca–Jedwabno water treatment plant. The purpose of the risk analysis conducted in this study is to identify and define all the actual and presumed facilities or activities that can particularly affect the quality and quantity of water resources in a specific intake. For these reasons, a thorough analysis of land use and spatial planning of the area of the intake and its immediate neighborhood was carried out, together with an analysis concerning methods, forms, quality, and quantity of underground water drawn, with special reference to the area of water runoff to the intake. A wide variety of materials were used for the purposes of this analysis, including topographical, hydrogeological, geological and geoenvironmental maps, CORINE Land Cover database, geoportal, and the human pressure layer from the Polish Geological Institute—National Research Institute. During the process of hazard identification, the following factors should be taken into consideration:
- −
- Current and potential future water abstraction at the intake by the owner and other groundwater consumers;
- −
- Groundwater and surface water chemical status in the vicinity of the intake;
- −
- Possibility of the occurrence of road accidents and various equipment malfunctions, which may lead to water contamination at the intake;
- −
- Influence of forecasted and observed climate changes, driving rains, and floods on groundwater status;
- −
- A range of other events that may adversely affect water status at intakes.
It is assumed that the risk measure is the level of risk understood as risk probability multiplied by risk consequences.
The risk analysis for the Jedwabno water intake was carried out according to the method recommended by [47] and modified by [48]. This method involves the application of a three-parameter risk analysis matrix for every identified hazard. The risk of each hazard occurrence (R) is determined on the basis of the following formula:
R = P · C · V
The parameters adopted to assess the size of the risk (R) follow:
- −
- Probability described as the frequency of emergency (P);
- −
- Resulting (severity or damage) consequences of hazards (C);
- −
- Vulnerability to emergency, which within the area from the runoff to the intake can be associated with the time of water supply to the intake (V).
The categorization of particular parameters applied in the following analysis is presented in Table 1, Table 2 and Table 3.
The recommended methodology is entirely consistent with the regulations and standards reflected in the national legislation, and are integrated into requirements connected with the water safety plans. The risk analysis conducted in this study is the first analysis of its kind for the infiltration water intake in Jedwabno. Depending on the results obtained, the water supply company may decide to delineate an indirect protection zone.
5. Results and Discussion
5.1. Natural Risks Identification
5.1.1. Meteorological Hazards
In order to assess the risks, first and foremost, meteorological conditions that can be a source of primary or secondary hazard to groundwater intakes were analyzed. The meteorological conditions are discussed on the basis of data that included total annual precipitation and mean annual air temperature recorded at the meteorological station in Toruń for the period 1971–2020 (Figure 5).
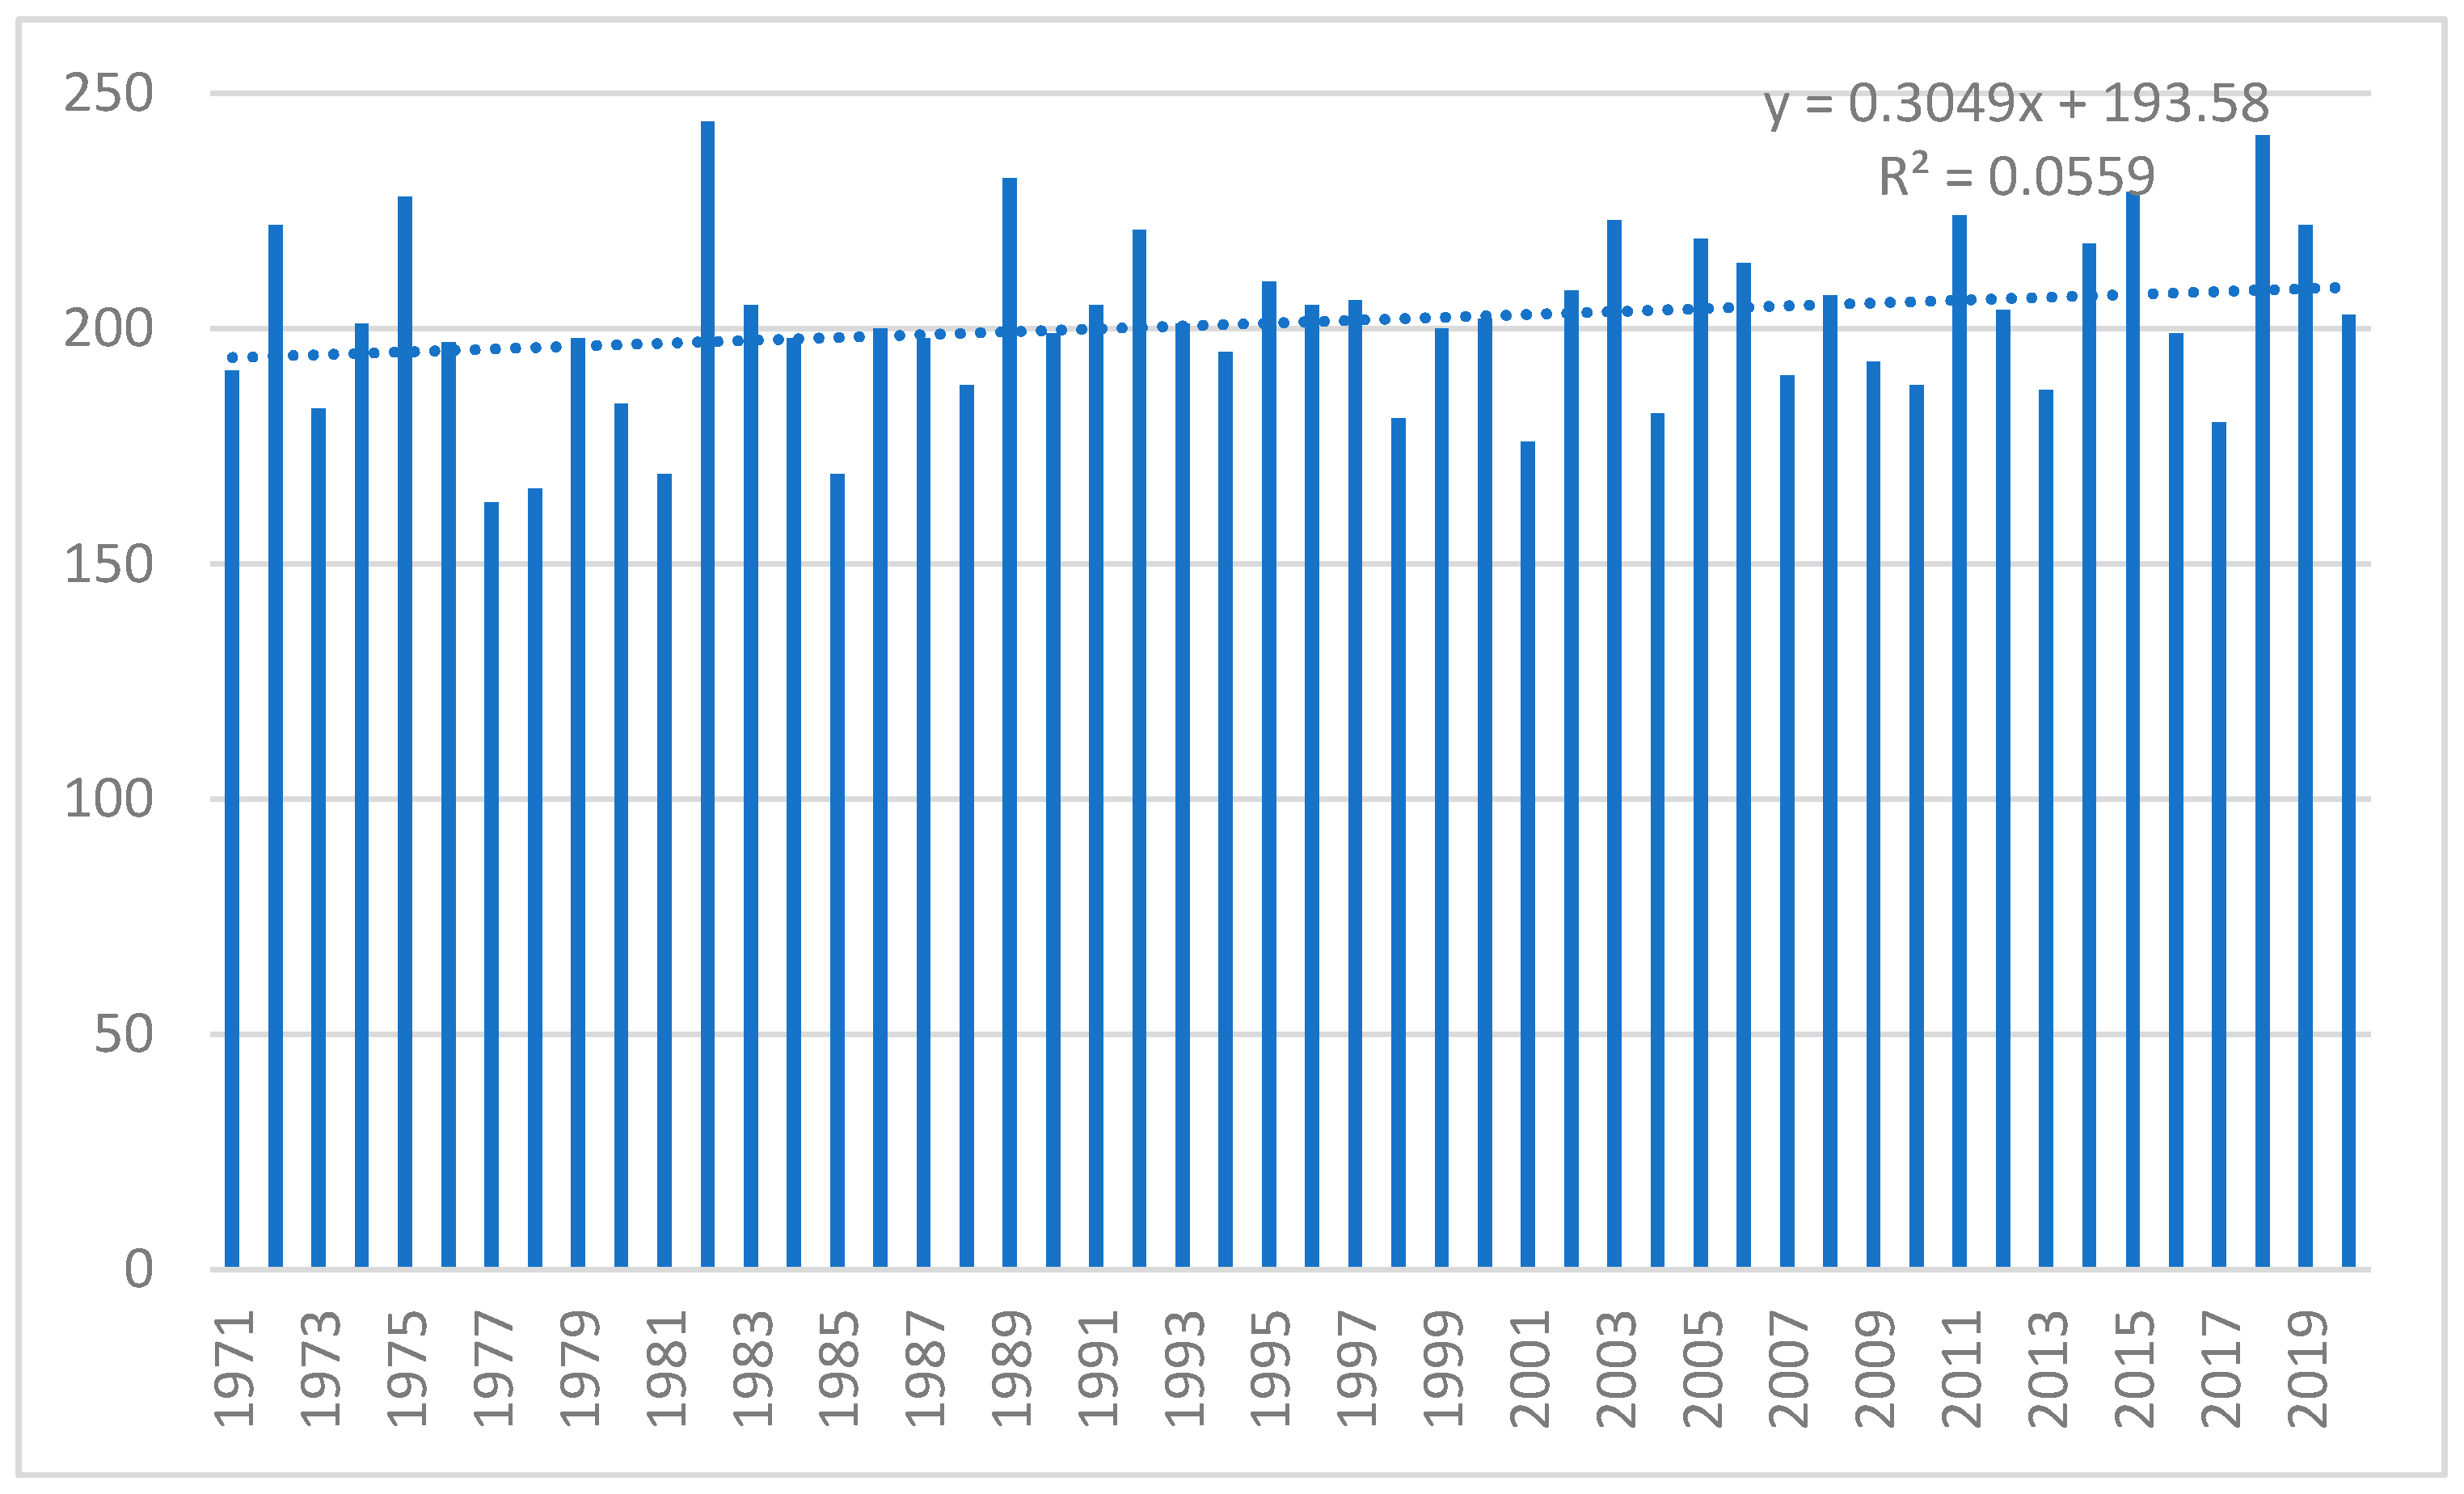
The mean annual precipitation total within the analyzed multiannual period reached 5409 mm, whereas the mean annual air temperature did not exceed 8.6 °C. The highest precipitation value was recorded in 1980 (843.3 mm) and 2010 (832.2 mm). The maximum daily precipitation at the level of 1016 mm was recorded on 15 July 1980. This precipitation value was three times higher than the maximum mean monthly precipitation. Figure 5 shows the upward trend of precipitation and air temperature levels. Within the analyzed multiannual period, on average 201 days without any precipitation were recorded, which constitutes 55.1% days per year. The fewest days without any precipitation were recorded in 1977 (163 days, which means 44.6% days per year), and the most in 1982 (244 days, which means 66.8% days per year). Within the years with a large number of days without any precipitation, there were recorded dry years with the lowest annual precipitation totals. Between 1971 and 2020, an upward trend of days without any precipitation was recorded (Figure 6). An additional element which will exacerbate the phenomenon of drought is heat waves with temperatures exceeding 30 °C. According to Wibig [50], an increase in frequency and intensity of heat waves can be observed in Poland in recent years. As a consequence of the lack of precipitation or low precipitation, the amount of available water resources will be considerably smaller.
The detailed analysis is based on the data from the period between 2008 and 2020, which demonstrate a considerable increase in air temperature. Mean air temperature in this period was considerably higher (9.3 °C) in comparison with the years 1971–2020 (8.6 °C). The upward trend in air temperature was statistically significant (Table 4). Mean annual precipitation amounted to 557 mm and was marginally higher than in the period 1971–2020 (540.9 mm). An increase of the number of days without any precipitation between 2008 and 2020 is statistically insignificant.
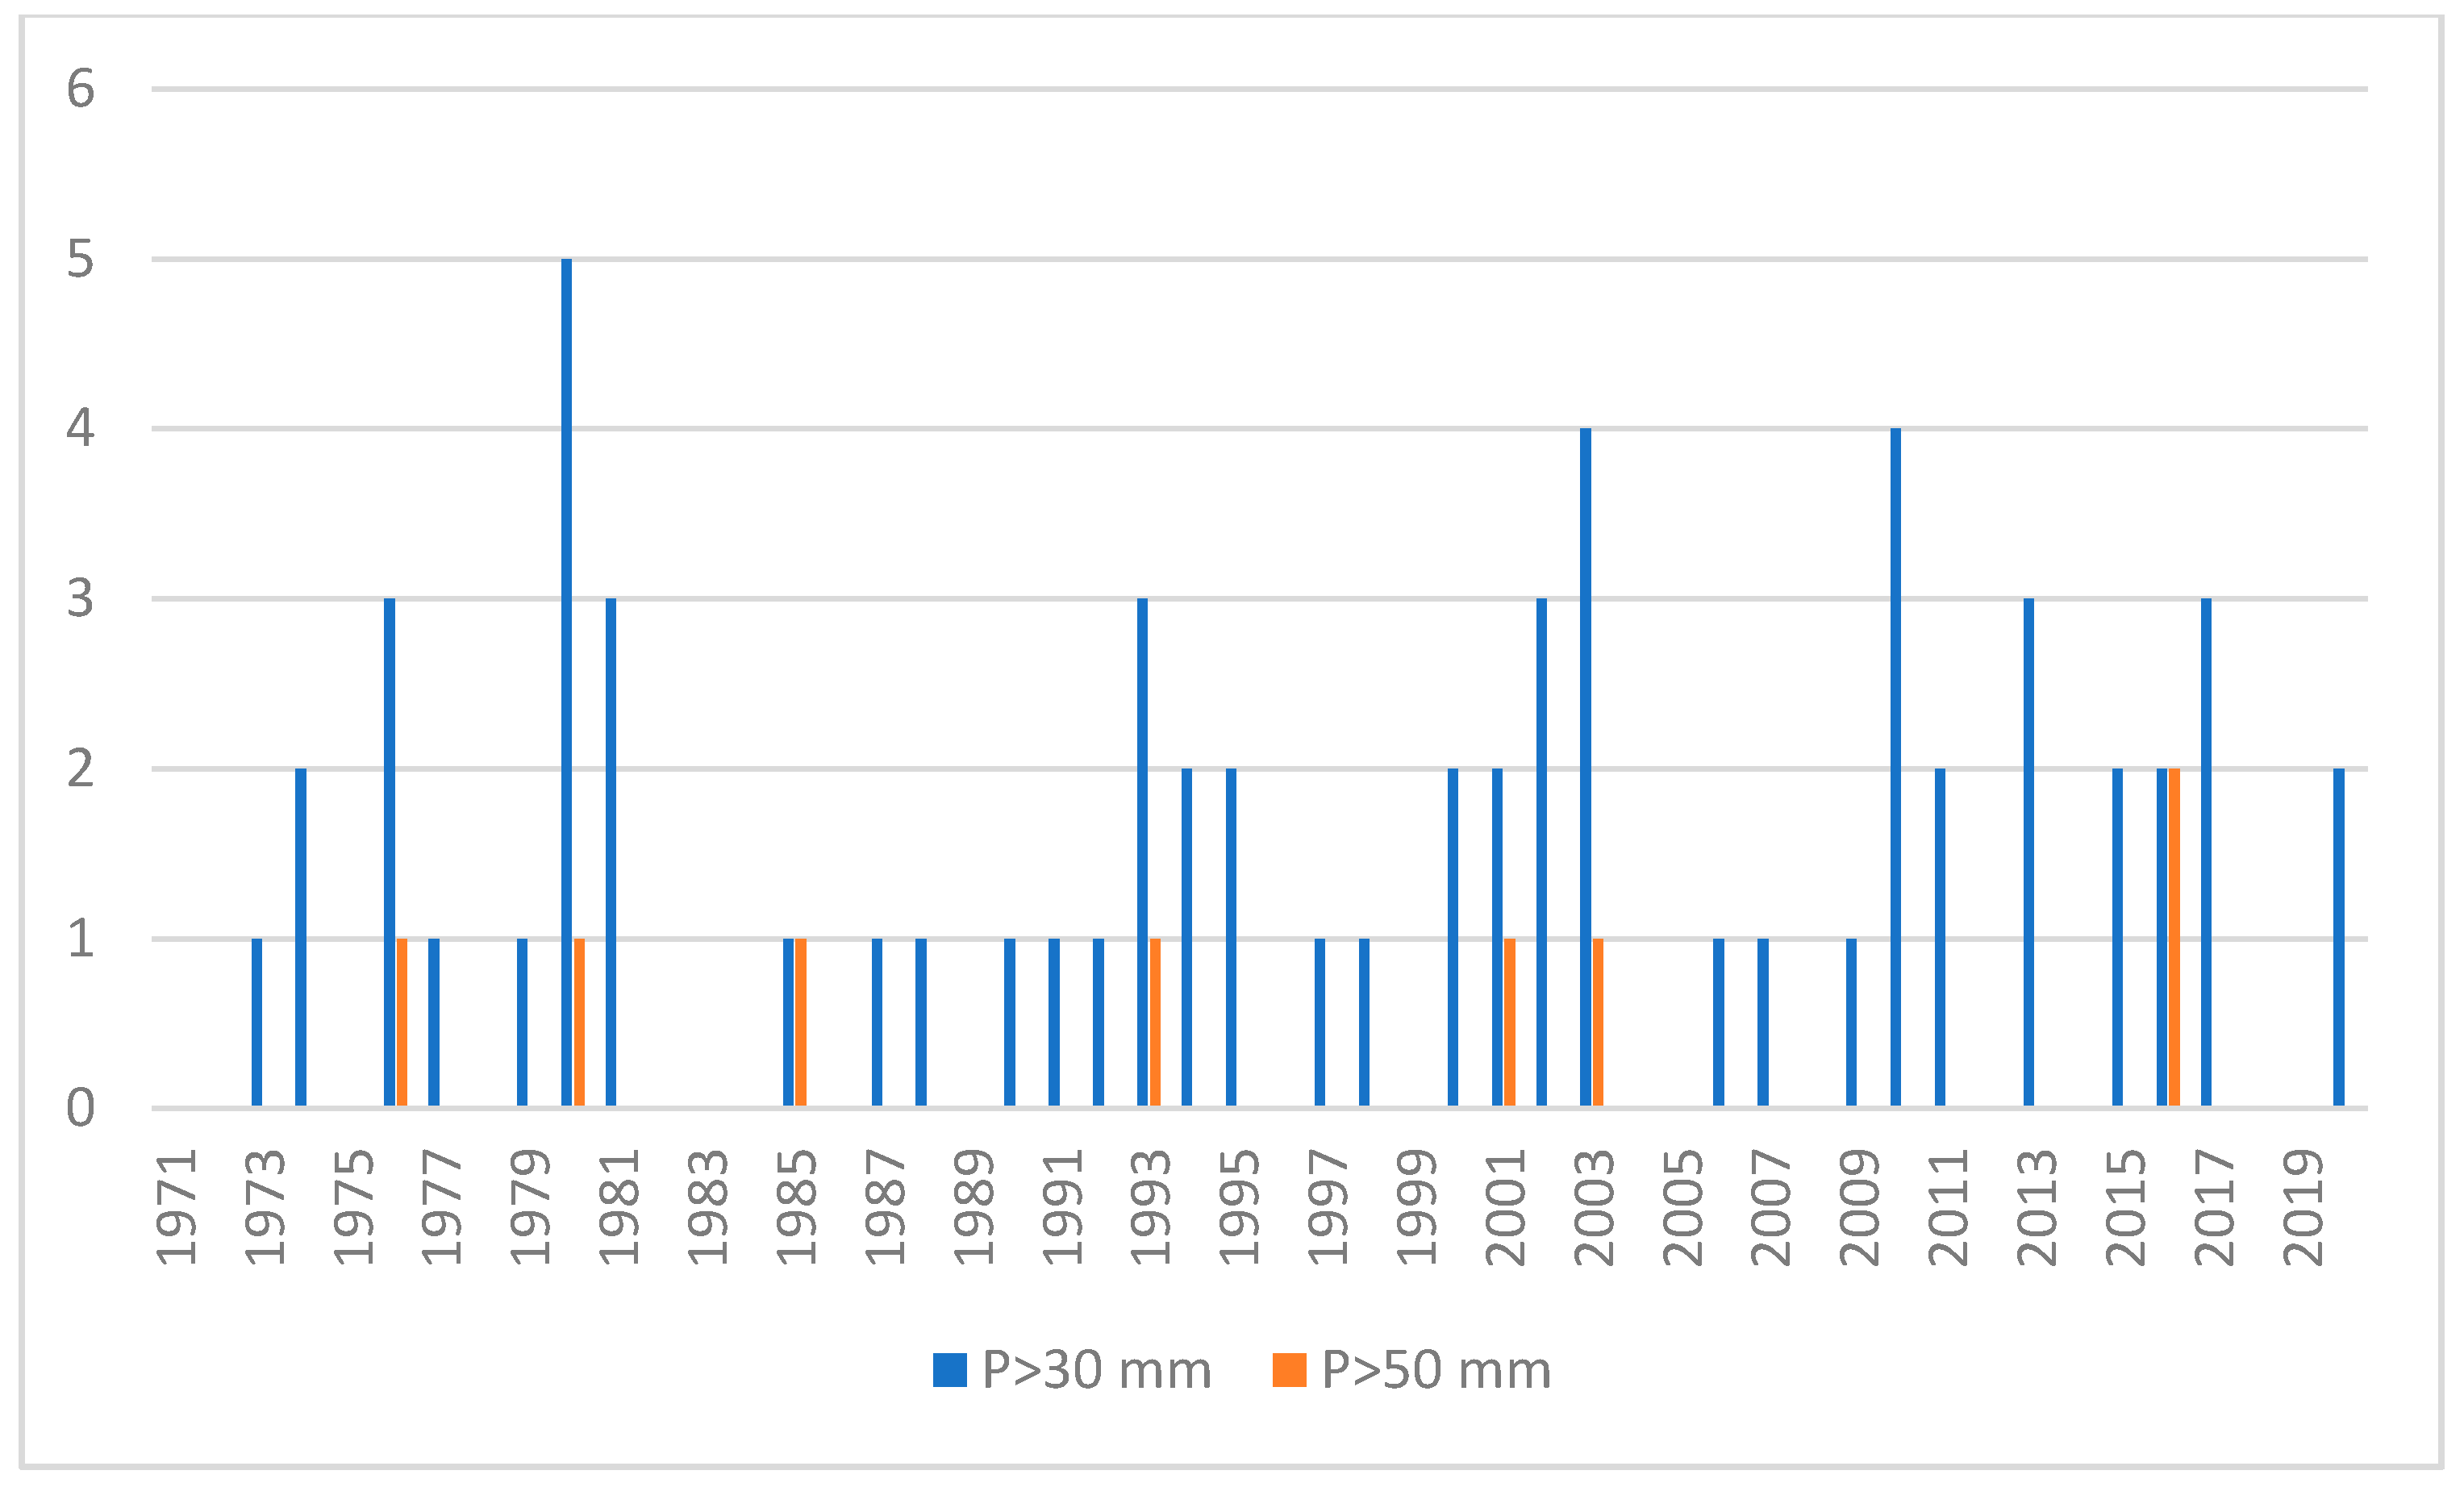
Other meteorological risks include hazards connected with heavy rainfall. The daily precipitation total, slightly exceeding 30 mm, is taken as a prewarning threshold in alerts issued by the Institute of Meteorology and Water Management—National Research Institute. The daily total precipitation most frequently does not cause major damage in the environment unless it occurs within a very short period of time. The occurrence of heavy rainfall over 50 mm during one day causes meteoric water to drop off linearly in the form of “streams” in most convenient locations, which is particularly visible in urbanized areas. The number of days with daily precipitation over 30 mm during one year was a maximum of 5 days, whereas extremely heavy rains over 50 mm occurred occasionally and lasted at most 2 days (Figure 7). Meteorological risks connected with the occurrence of drought (days without any precipitation) greatly outnumber those associated with high precipitation, which can endanger the safety of water supplies.
5.1.2. Hydrological Risks
Hydrological risks, which have a significant impact on the functioning of both surface and infiltration water intakes, include floods and droughts. Both infiltration and surface intakes can be found in the flood hazard zone with the likelihood of occurrence 1% and 10%, respectively.
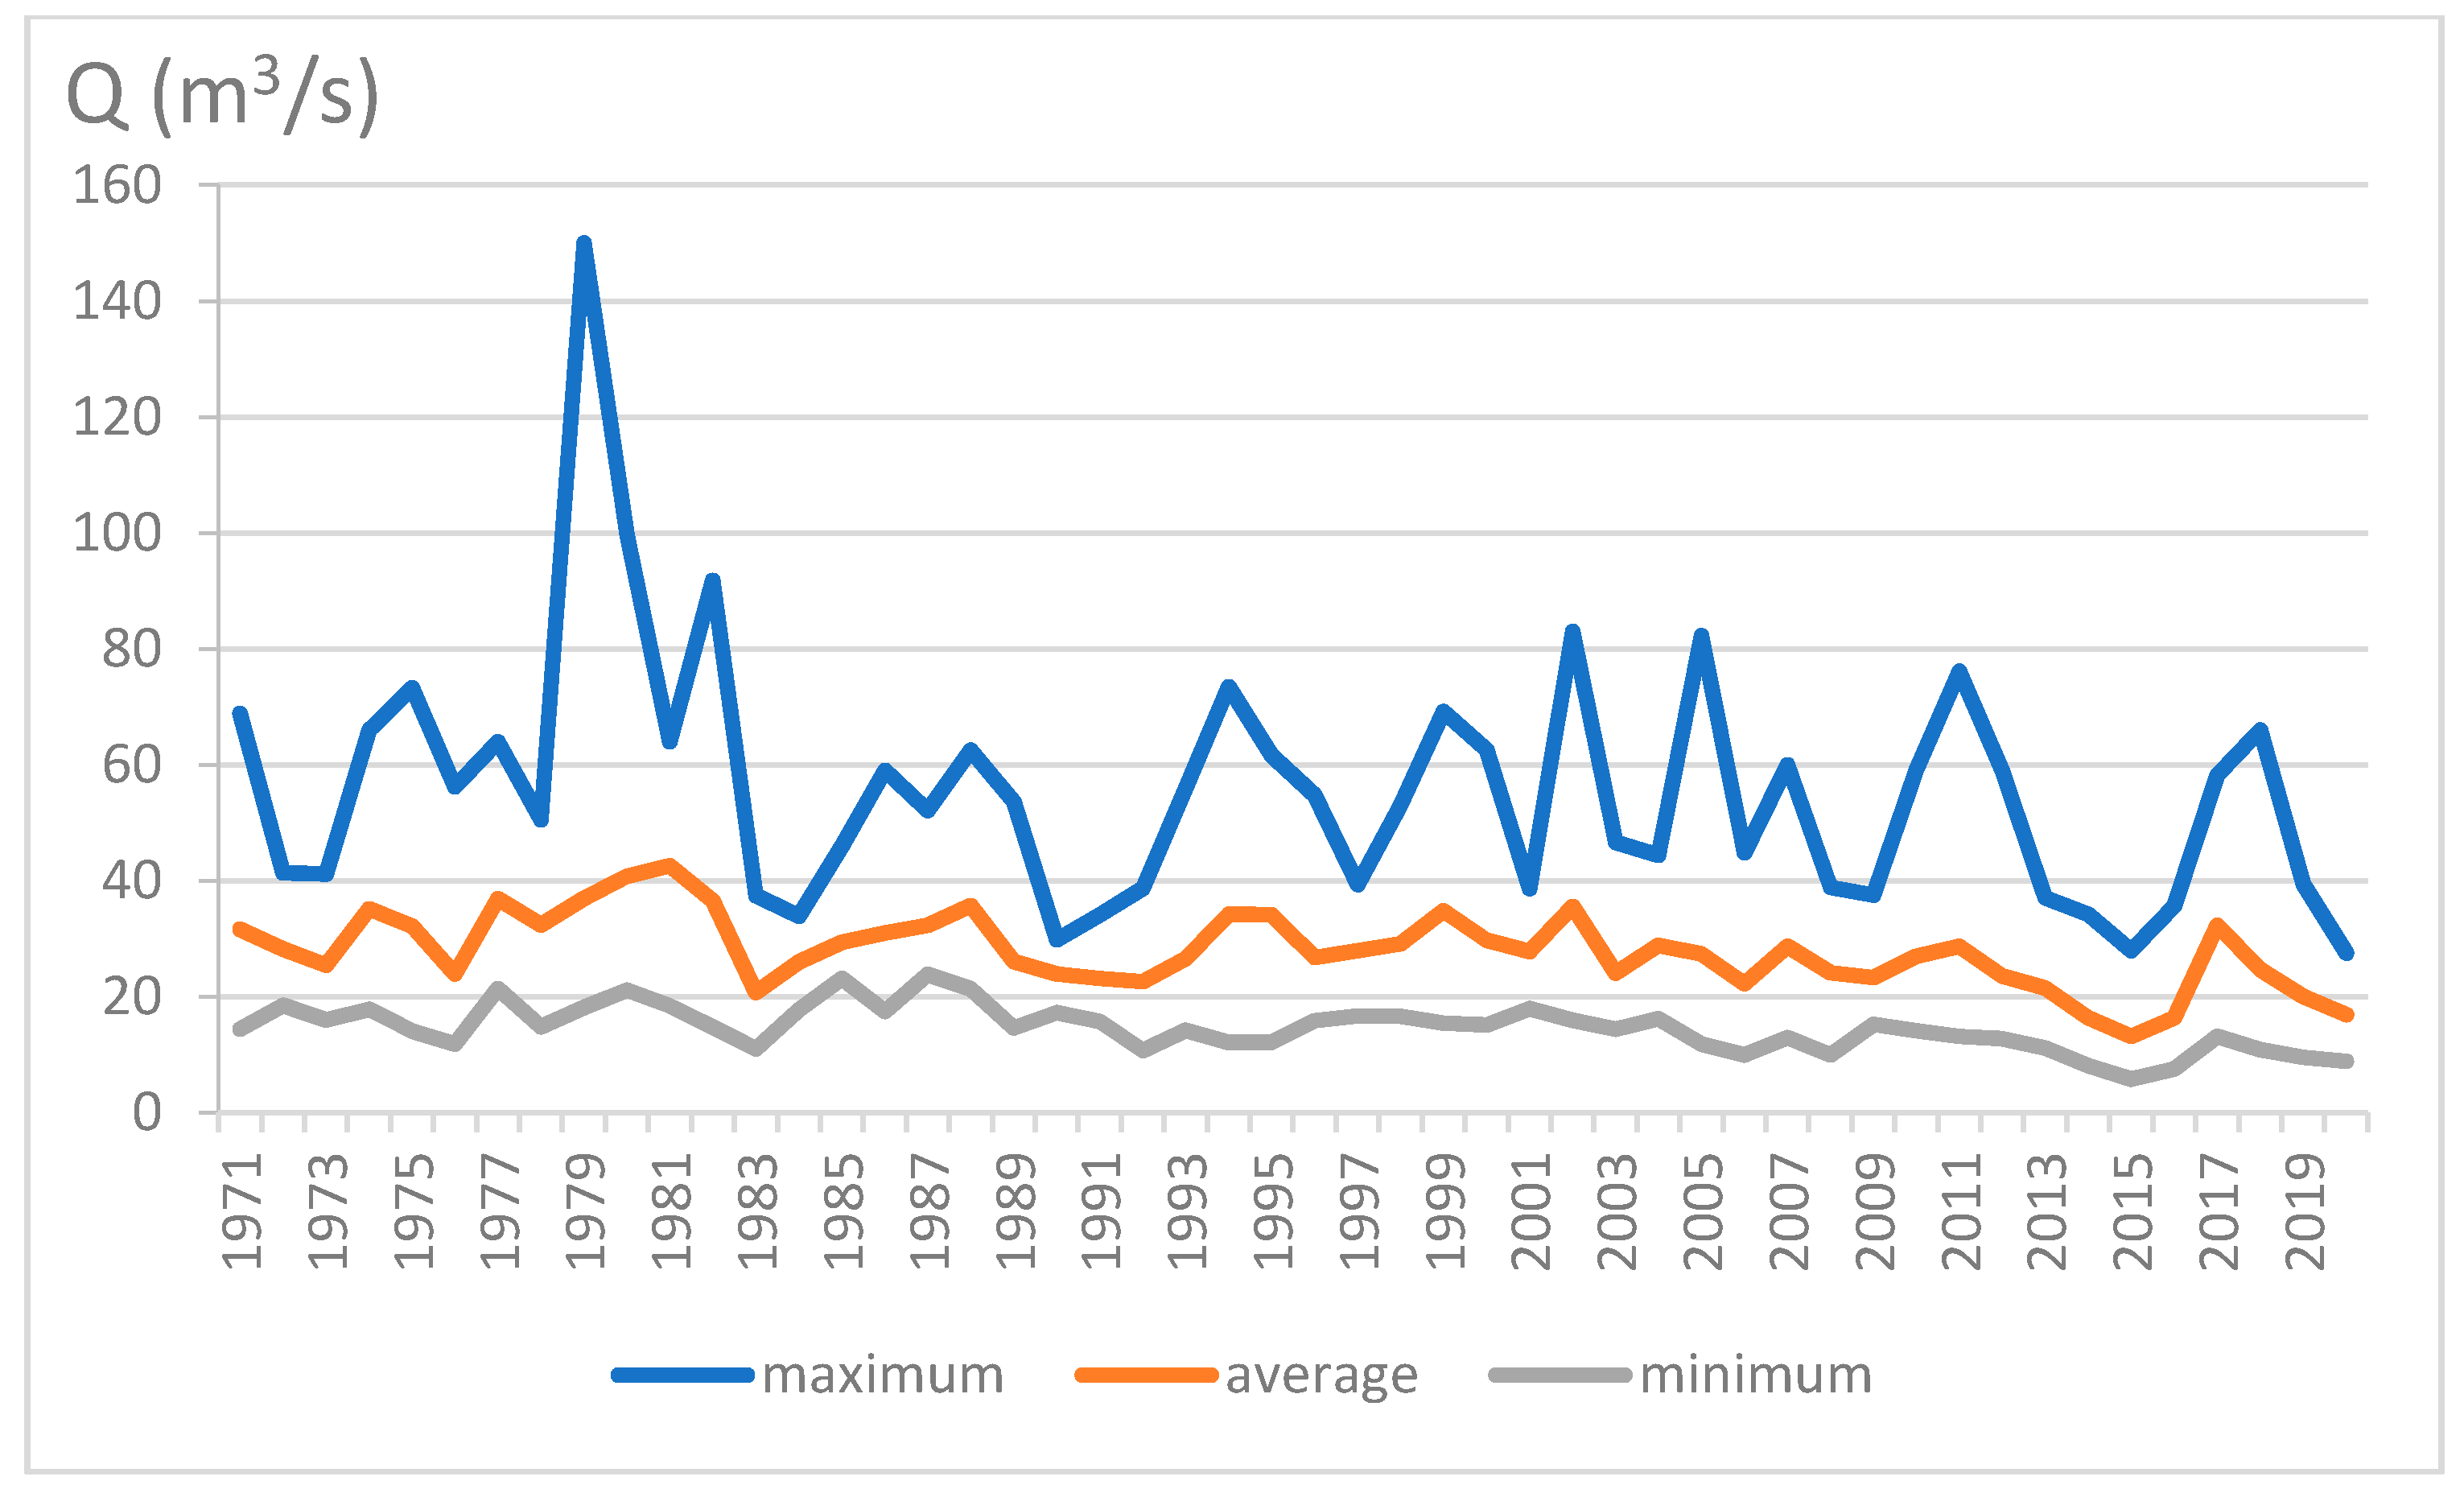
During the analyzed period between 1971 and 2020, the mean multiannual discharge reached 28.0 m3/s, which means 5.6 dm3·s−1 km−2. This value is comparable to the water resources of the Vistula River. The mean specific multiannual runoff (1951–2015) in the Vistula River basin reached 5.4 dm3·s−1 km−2 [51]. The highest discharge level of the Drwęca River at the hydrological station in Elgiszewo amounted to 150 m3/s and was recorded in 1979 (Figure 8). The analysis of the maximum, average, and minimum flows in the analyzed multiyear period showed statistically significant downward trends (Table 5).
Between 2008 and 2020, when water abstraction from intakes was analyzed, lower maximum and average values of water discharge were recorded than for the case in the period from 1971 to 2020. The mean Drwęca River discharge at Elgiszewo hydrological station reached 22.2 m3/s, which corresponded with the specific runoff at the level of 4.4 dm3 s−1 km−2. From the point of view of water safety, only extreme hazards, which include floods and droughts, are of great significance. SWQ (average of maximum multiyear discharge) was adopted as the threshold value, which constituted the borderline discharge rate above which floods occurred. However, as far as the borderline flow rate for the low-water periods is concerned, the SNQ (average of minimum multiyear discharge) value was adopted.
The number of days with the discharge value above SWQ varied; between 2008 and 2020, it was only 6 days per year, but between 1971 and 2020 was average 15 days in year (Figure 9).
A hydrological drought can be one of the reasons for serious problems with water resources management in the affected area. It poses a hazard for surface water intake safety in terms of a decline in the level of surface waters and an increase in pollutant concentration, for which a significant number of water supply and sewage management companies are not prepared. Drought also causes a lowering of the groundwater table, which constitutes a threat to the continuity of water supply. The number of days with water discharge below SNQ during one year was twice higher than with floods between 1971 and 2020 (Figure 10). It was particularly visible in 2014 and 2015, when the number of days with drought were 211 and 209, respectively.
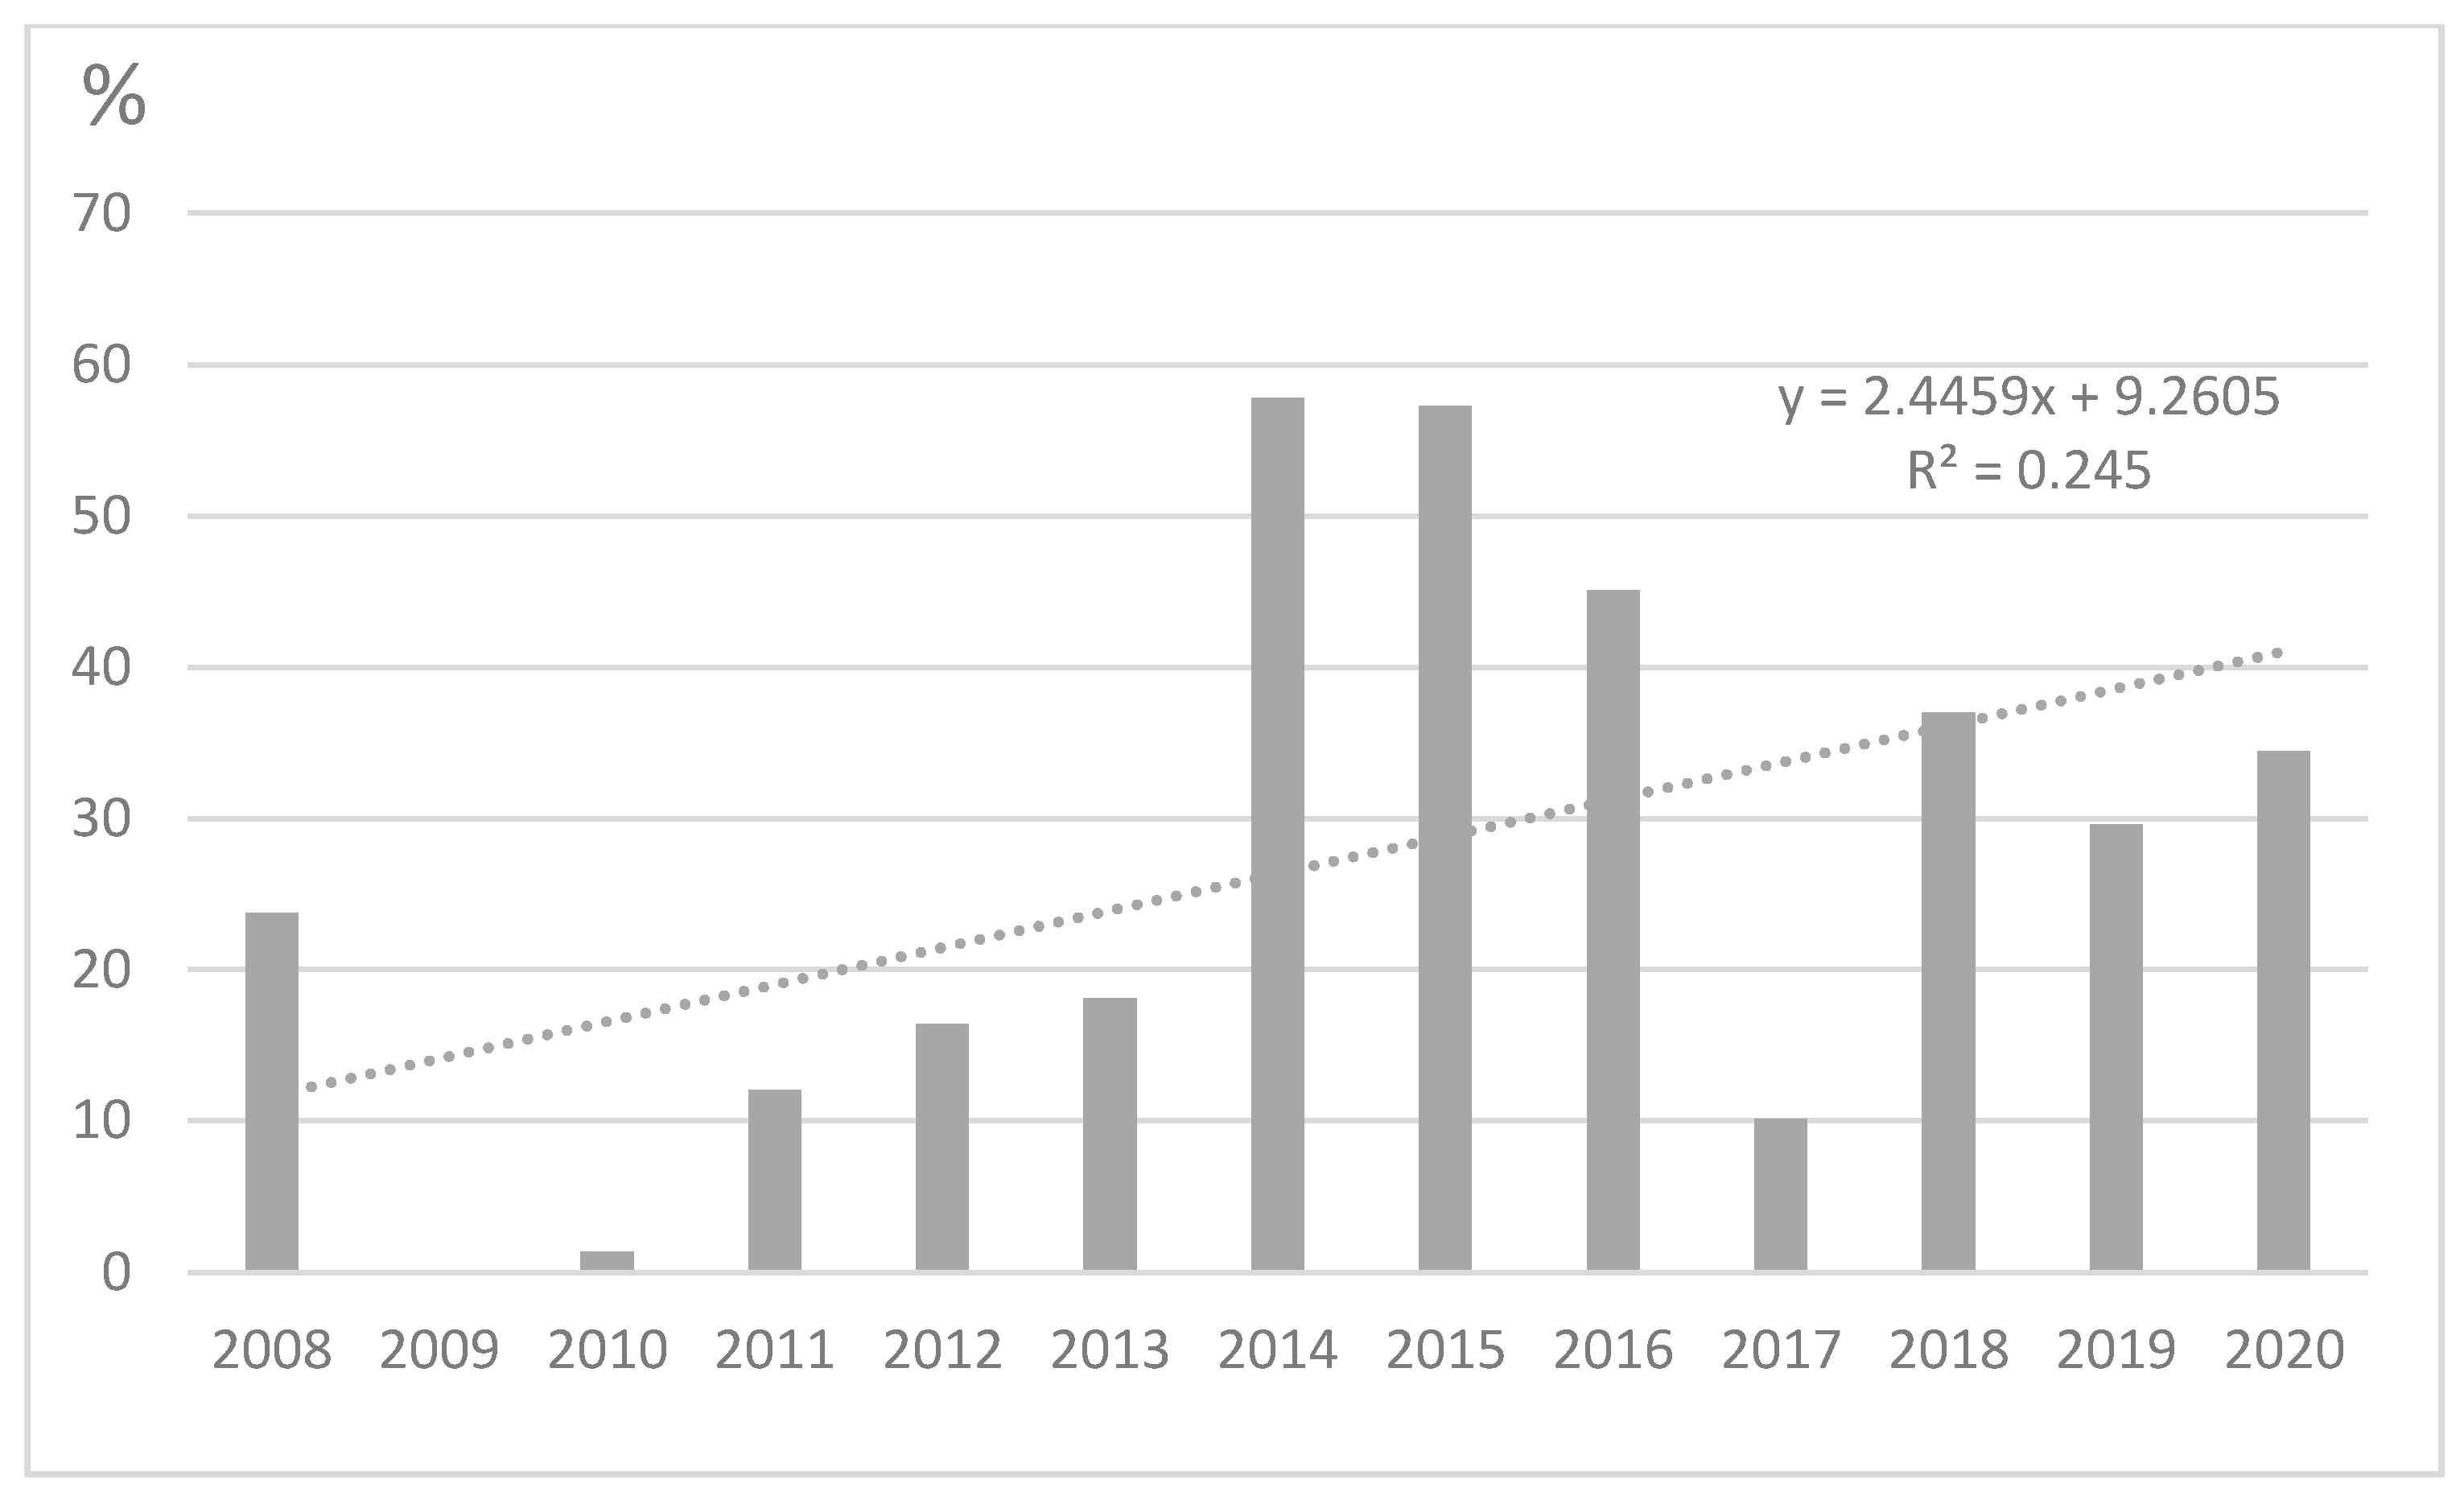
The total number of days with floods and hydrological droughts in extreme situations constituted 57.8% of all days in the year (2014), whereas the average number of days per year between 2008 and 2020 was 26.4% of all the days per year (Figure 11).
5.2. Water Intake at the Drwęca–Jedwabno Water Treatment Plant
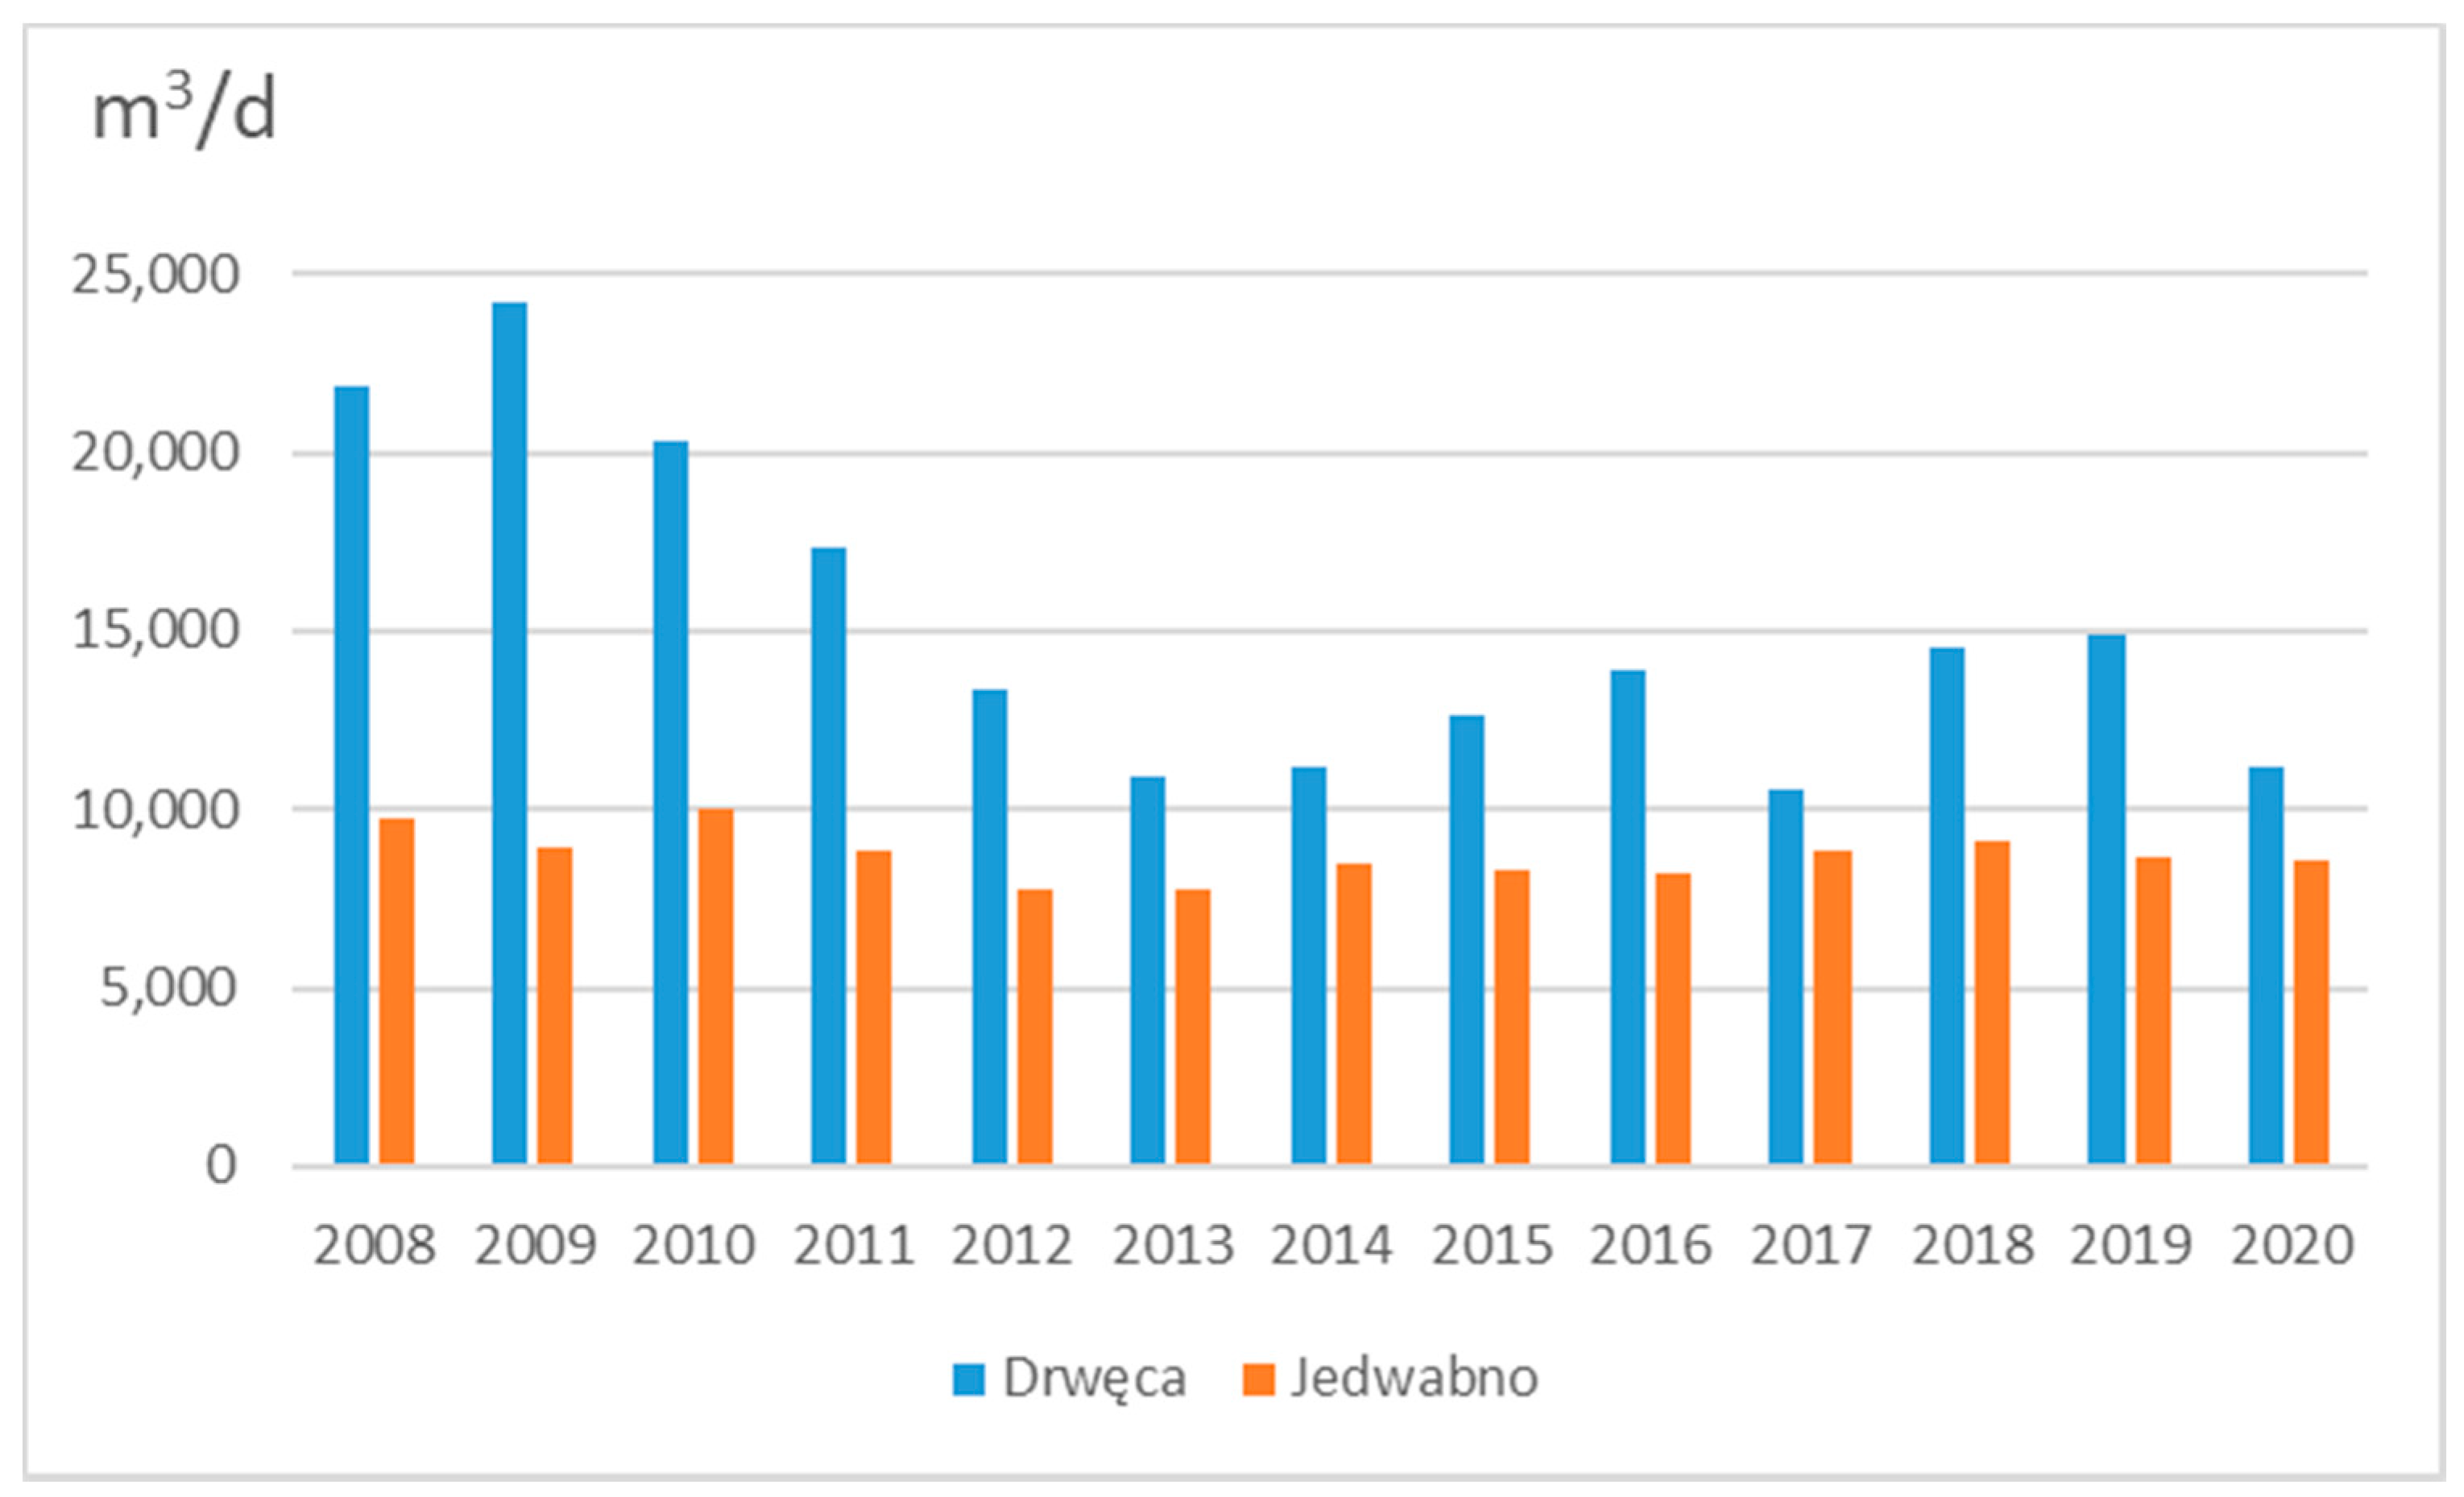
The amount of water drawn from the infiltration intake in Jedwabno and the Drwęca surface intake is presented in Figure 12.
The annual mean amount of water abstracted from the Drwęca River is characterized by a significant variation from 10,603.2 m3/d in 2017 to 24,203.8 m3/d in 2009 (Figure 12). The greatest annual water abstraction range occurred in 2008 and reached 31,594.7 m3/d. The groundwater abstraction level from the Jedwabno intake is considerably lower. The annual mean amount of water abstracted within the analyzed multiannual period ranged from 7767.9 m3/d in 2013 to 10061.5 m3/d in 2010.
On average, within the analyzed period, 63.5% of all the water drawn comes from the Drwęca surface intake. In the period of the highest level of water abstraction in 2009, the water abstraction from the Drwęca surface intake constituted 73% of all water drawn. In 2017, the level of water abstraction from the Drwęca surface intake constituted only 54.5% of all the amount of water drawn, which means that half of the total amount of water drawn came from the Drwęca surface intake whereas the other half from the infiltration intake in Jedwabno.
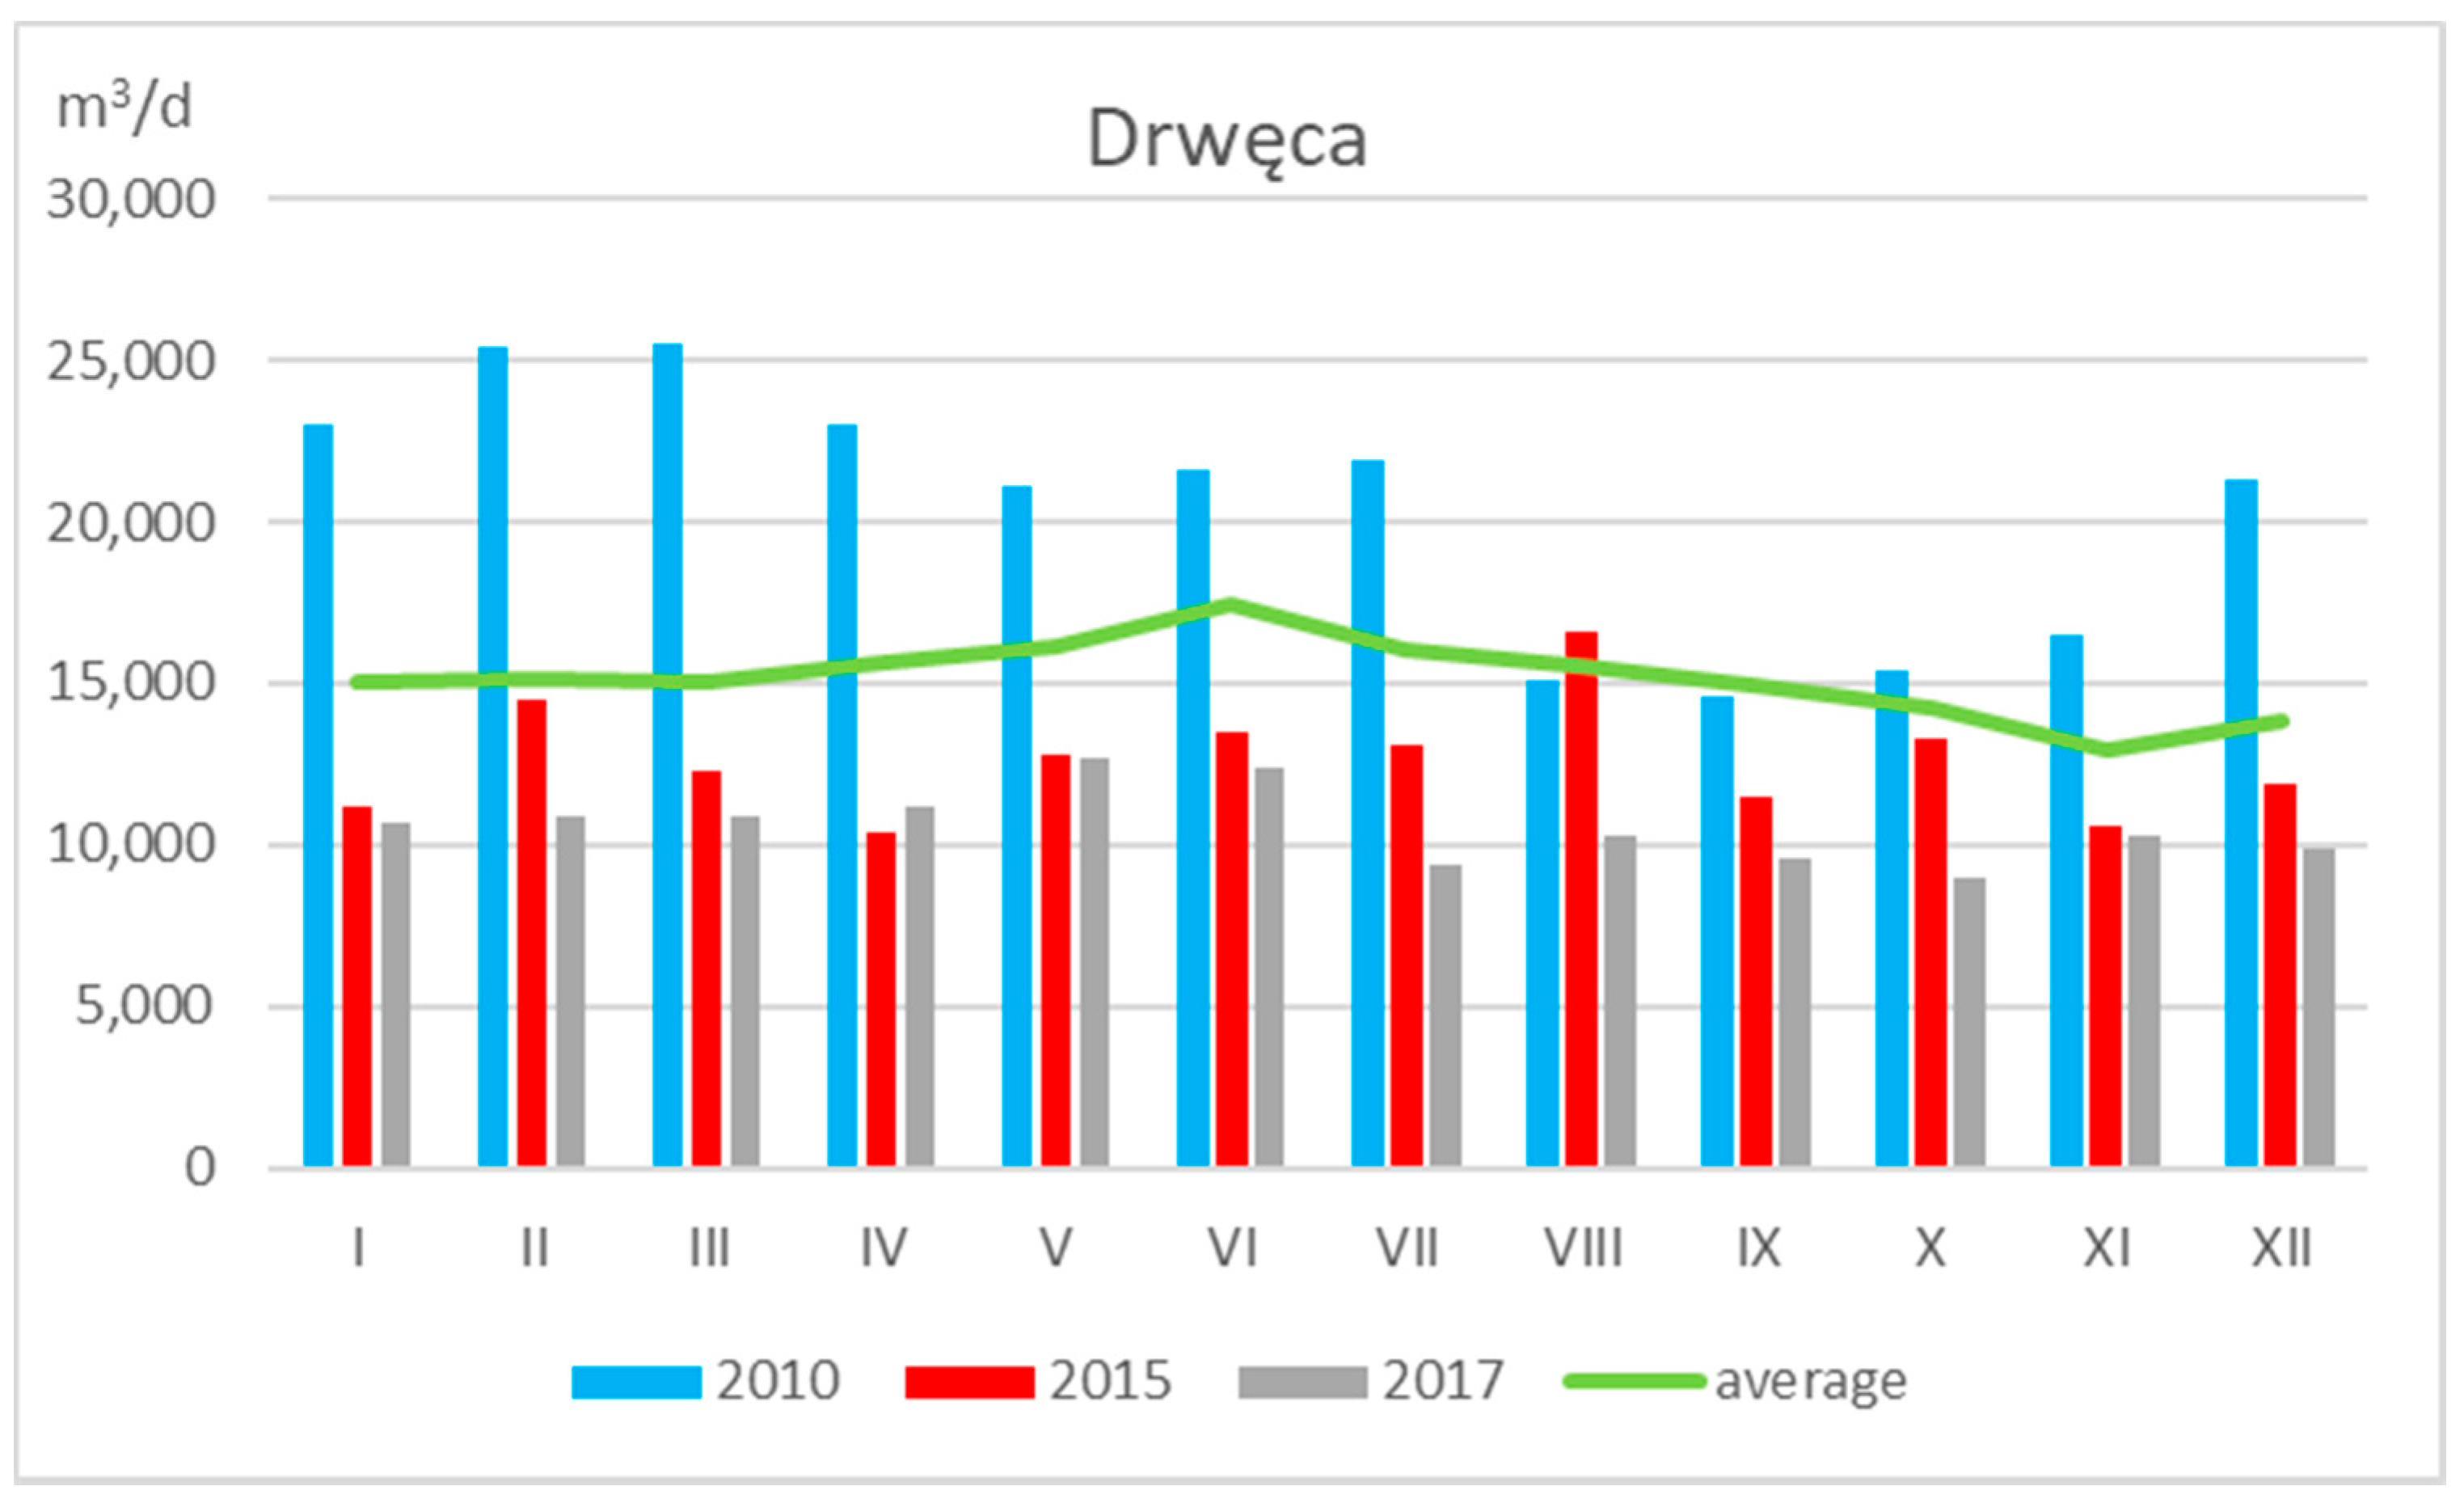
In particular months, the amount of water drawn from specific intakes is more varied. It is particularly visible at the Drwęca surface intake where in the period between January and July, the water abstraction level is the highest, whereas it is much lower in the second half of the year. This situation is associated with low river discharges in this period. In the same period, a slightly greater increase in the amount of water drawn from the infiltration intake in Jedwabno is recorded, especially between August and October (Figure 13 and Figure 14).
The safety of the surface water intake affected by extreme weather conditions is put at risk during summer seasons, particularly between the months of August and October when river water discharge levels are low.
5.3. Fluctuations in Surface Water Levels
Surface water levels were examined in eight different piezometers located near the wells abstracting water from the infiltration water intake. The lack of any insulation layer causes that the surface water level in those wells largely depends on the impact of meteorological and hydrological conditions. It was confirmed by the data included in Table 6, that the ranges of water table fluctuations in the past 13 years even reach a value of 5 m in piezometers P-4 and P-5. In the case of the remaining piezometers, the difference between the highest and the lowest water table measurements fluctuates between 2 and 4 m. The highest range of fluctuations can be observed in piezometers P-4 and P-5, located beyond the direct intake protection zone. The remaining piezometers are located within the immediate neighborhood of the operating wells. During the process of interpreting the analysis of water table levels on an annual basis, it should be emphasized that the measured levels and the position of the groundwater table in the area of the well are considerably affected by the volume of abstracted water. Undoubtedly, the activity of the wells located within a close distance from one another significantly distorts the overall hydrodynamic conditions in the area of the Jedwabno intake and is closely correlated with the level of water abstraction from particular holes.
The smallest depth to the water table in all piezometers was recorded in 2011. This situation confirms the reaction of free water table to high precipitation levels, which were recorded in Poland in 2010 (Figure 15).
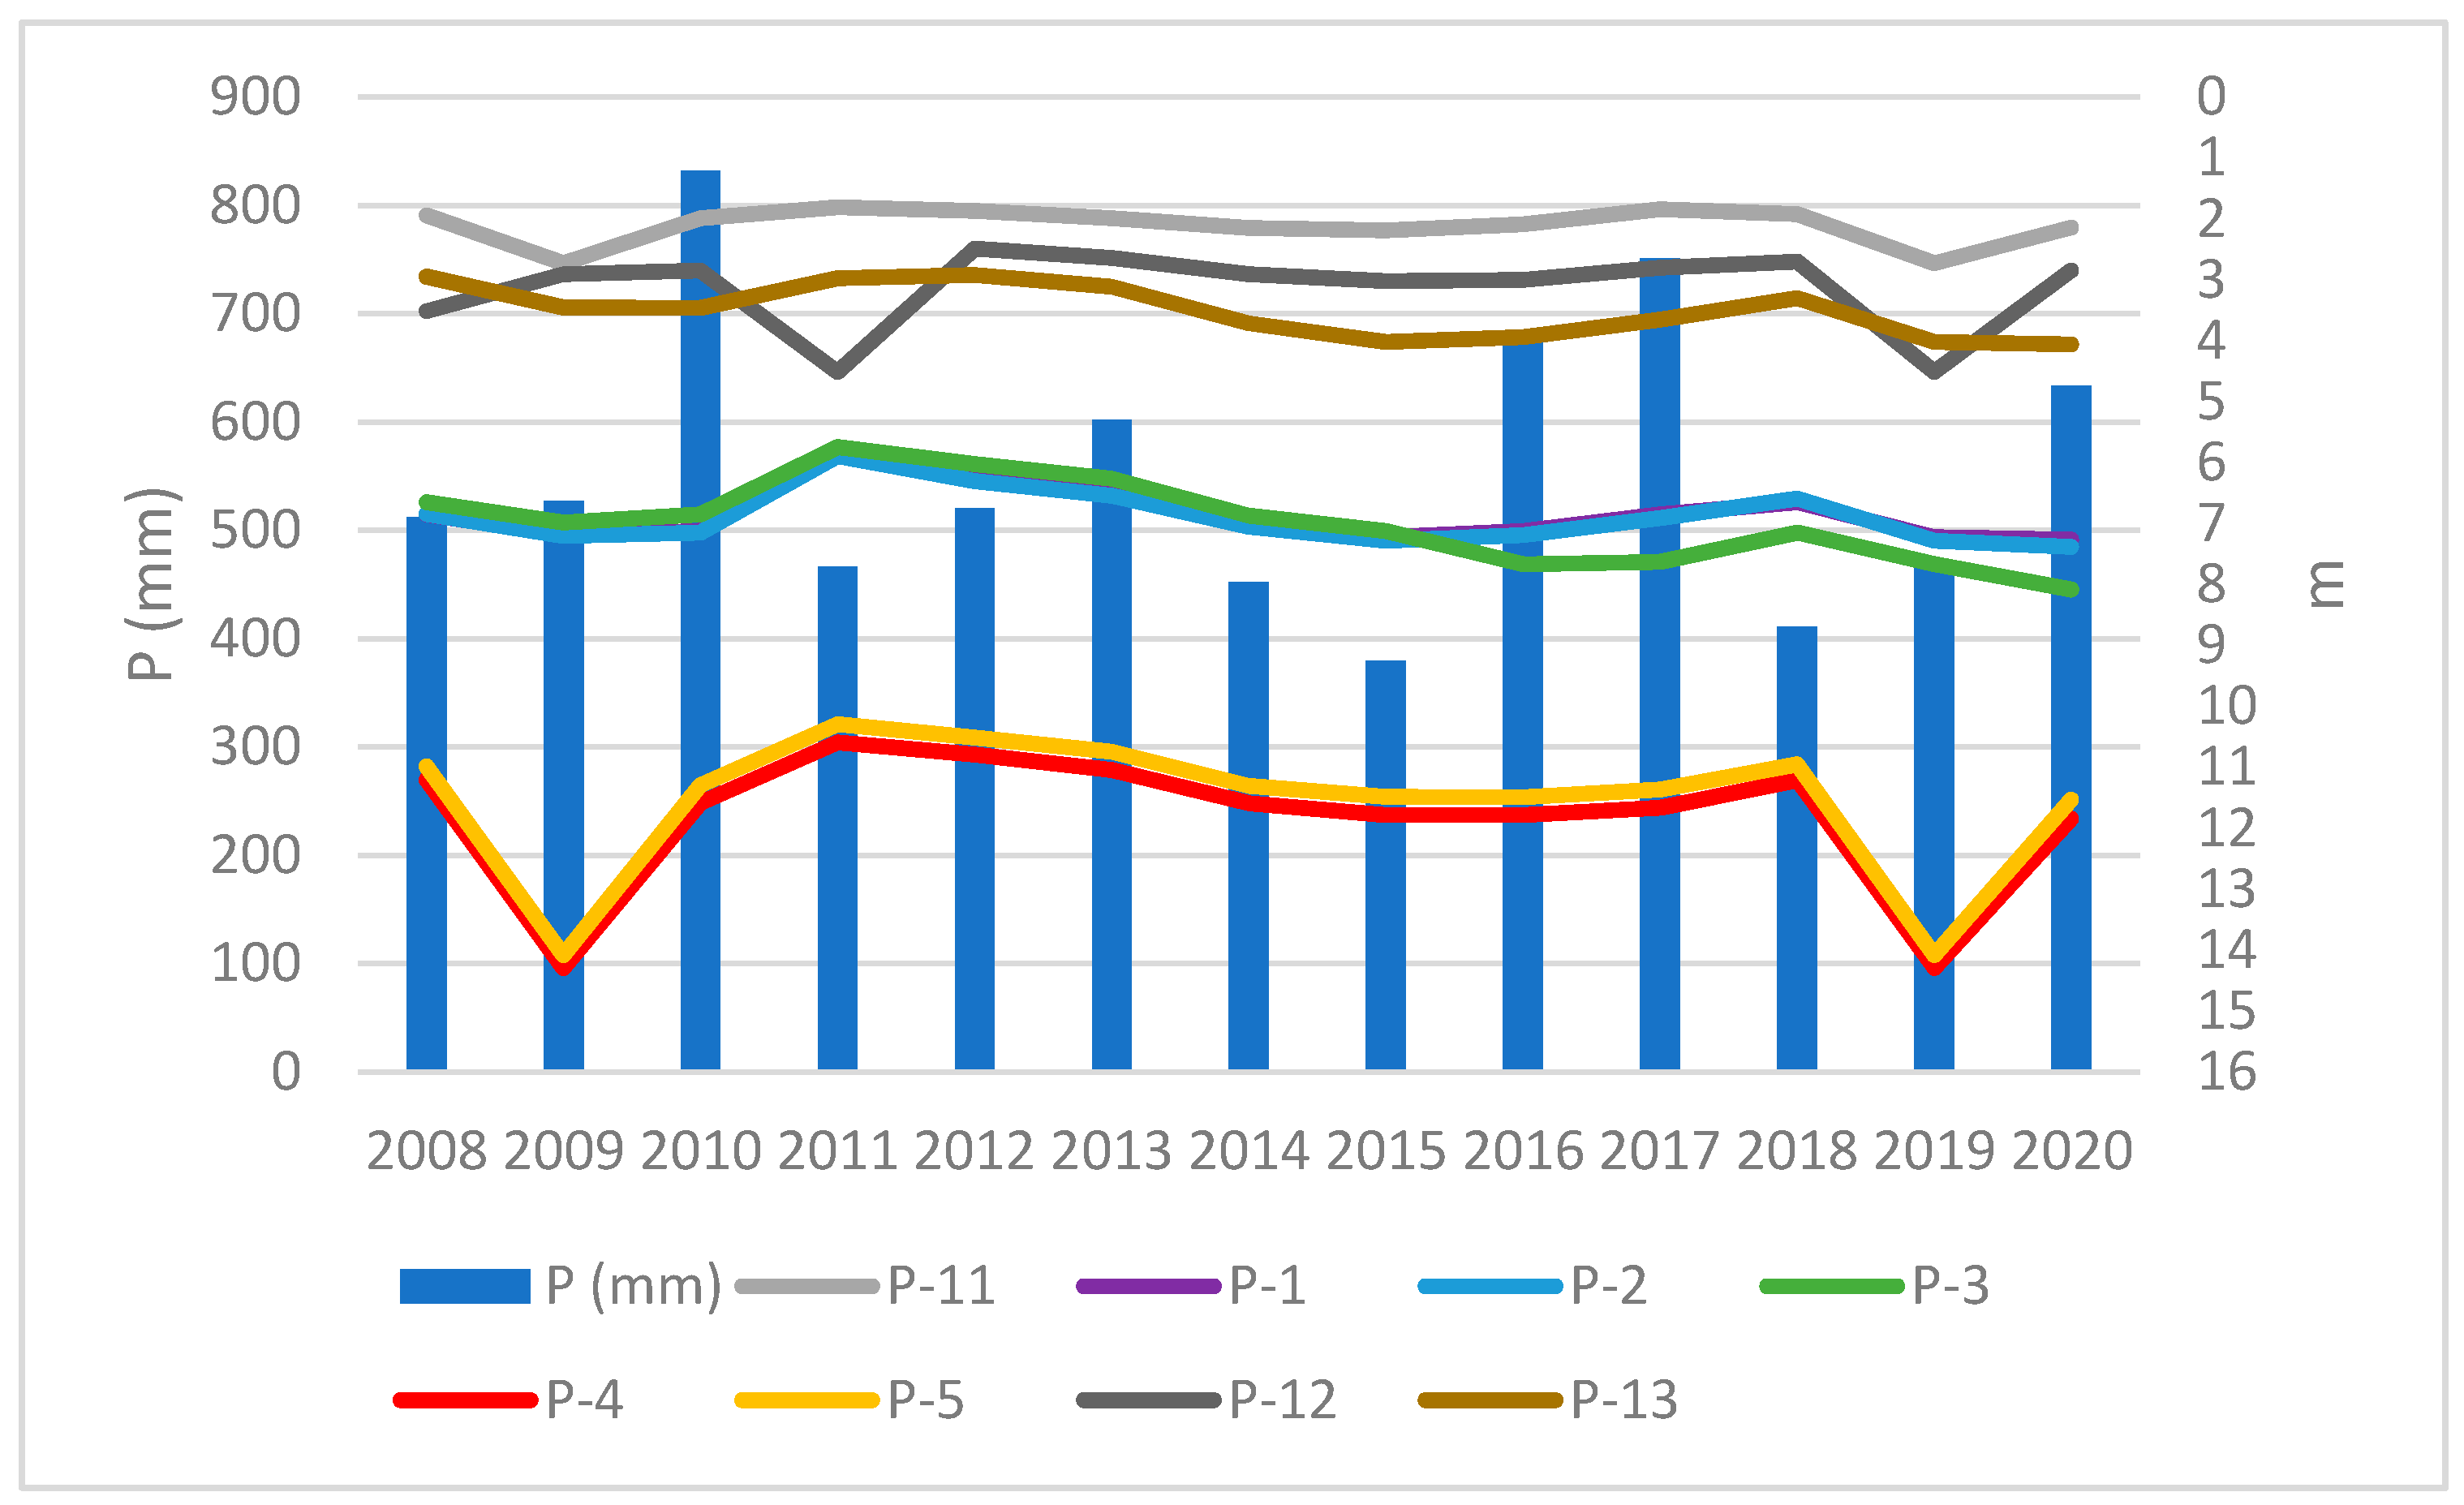
The largest drop in water table level occurred in piezometers during 2009, 2019, and 2020, which was a consequence of the reaction to low annual precipitation totals in 2008, 2018, and 2019 (Figure 16).
The annual size of water abstraction at the Jedwabno intake in the wet year of 2011 and in the dry years of 2019 and 2020 was recorded at a similar level of 8600 m3/d. The observed water table fluctuations in the multiannual period reveal a great sensitivity of the aquifer to weather conditions.
5.4. Vulnerability of Water Intake to Risks
The risk assessment analysis in the following study concerns the infiltration water intake in Jedwabno, which constitutes an important element in the water supply system for the Drwęca–Jedwabno water treatment plant. The methodology applied in the following study was discussed in Section 4. The three-step scale has been adopted.
On the basis of the value of the risk indicator (R), the following classification of risk was adopted [48,49]:
- −
- Acceptable R < 20;
- −
- Controlled 20 < R < 50;
- −
- Unacceptable R > 50.
The risk analysis for the Jedwabno intake was carried out in two variants: the first variant (W1) and the second variant (W2) (Table 7). The first variant (W1) assumes that the intake operates in compliance with all security measures. It should be therefore understood that there are no emergency situations or unexpected events that could affect either quantitative or qualitative status of groundwater drawn from the intake. The second variant (W2) assumes that the security measures are not observed. It should be noted here that the analysis conducted in this study has a qualitative rather than quantitative character and is the result of a subjective evaluation by the authors of the study. The probability parameter (P) of the emergency situation (failure) is determined on the basis of Table 1. The severity of the emergency results parameter (C) is determined according to Table 2 for both variants, but in the case of W1, it is assumed that all the security measures are continuously complied with, by which it is understood that all actions and activities are taken in order to avert or eliminate the risk, or at least to reduce the level of risk to the minimum. The vulnerability to risk parameter (V) is determined according to Table 3, the basis for which is the calculated time of groundwater flow from the surface of the upper floor of the aquifer.
The potential sources of groundwater pollution have been divided into three categories: point sources, linear sources, and area sources.
Within the area of water runoff to the intake there are no point sources of pollution. The linear sources of pollution include municipal and district roads and the Drwęca River. The area sources of pollution include arable lands, dispersed urban development, and opencast mining infrastructures.
In light of the risk assessment analysis presented above, the most serious risk is posed by the Drwęca River. Both high and low water discharges are the result of climatic changes (lack of precipitation or excessive precipitation, very high air temperature) and considerably affect the fluctuations in the levels of groundwater.
The analysis of extreme events that occurred on the Drwęca River was carried out for the period 1971–2020. Table 8 presents the categorization of the probability of the occurrence of emergency events that threaten the water intake in Jedwabno. Days with high (above SWQ) or low (below SNQ) flows were assumed as a threatening event.
5.5. Discussion
In this study, the identification of meteorological and hydrological risks that can adversely affect water supply safety for inhabitants of a middle-sized town in Poland was conducted. The main source of water supply for the inhabitants of Toruń is the groundwater intake in Mała Nieszawka. This intake provides 43.4% of water in the overall water balance abstracted for the requirements of the water supply system. This intake operates at full capacity. The Drwęca surface water intake and the infiltration water intake in Jedwabno provide additional resources that cannot be provided by the intake in Mała Nieszawka. On average, it constitutes 52.9% of all water resources delivered into the supply system. Supplying the inhabitants of Toruń with water from several intakes constitutes a vital element of diversification of water resources. In order to avoid interruptions in water supply, it is absolutely necessary that a number of different sources of drinking water should be used. Taking advantage of numerous sources of water should be indispensable and widespread [52]. Regular exploitation of diverse water resources in order to meet the demand for potable water is widely practiced and has been witnessed in many countries [53]. Many studies show proposals of new methods of assessing water supply diversifications, which partly take into consideration climatic changes that may result in the reduction of water intake capacity [54]. Depending on local conditions and the specific character of single water supplies, general guidelines will need to be adjusted to their practical application [55].
One effective method of consistently ensuring drinking water supply safety is the application of complex risk assessment and risk management policies, which include all the most significant steps in the process of supplying consumption water from water resources to individual consumers. The occurrence of natural disasters such as floods or low-water levels is not limited exclusively to water quantity, but has its further reaching consequences. In many cases, the regular water supply system collapses due to, for example, different forms of water contamination [36]. Recently, research has been carried out on the impact of climatic changes on water quality, focusing primarily on droughts [56,57,58]. In many areas under study, it has been shown that the deterioration of water quality resulted from both low water discharge levels and long periods of drought [59,60]. The high frequency of drought in this area contributes to the necessity of improving the strategy of water quality management as well as water quantity management during dry periods. It particularly concerns surface water intakes [61]. Effective urban consumption water supply management requires three different approaches—adaptation, vulnerability, and resistance—to understanding the influence of climate, such as pollution or restricted availability of preferred sources of drinking water, owing to hazards associated with climate which endanger water safety [62,63]. Risk identification and assessment is the starting point for risk management plans. The proposed risk assessment method was used to assess the risk for the Jedwabno infiltration water intake based on a three-stage risk matrix. This method only partially takes into account climate change that can lead to a reduction in the production capacity of water supplies. The analysis of meteorological and hydrological conditions in recent years has shown that, in the case of the intake of surface waters, the risks associated with occurrences of droughts and floods may affect the security of water supply. The superior goal of this study is to increase the awareness of managers and decision makers about the problems arising from climate change.
Risk management plans connected with drinking water (RMP) document risk assessment and risk pertaining to water management. They constitute the basis for maintaining and improving drinking water supply safety. The successful preparation of risk management plans is comparable to health and safety requirements on the level of realization within the framework of daily consumption water supply in the studied area [64].
An important part in this process is played by the national and regional policy. In response to the risks connected with climatic changes, Toruń as a municipality has an adaptation program to climatic hazards. The City Council Resolution 285/2019 from 21 November 2019, adopted the Adaptation Plan for the Town of Toruń to climatic changes until 2030, conducted on behalf of the Ministry of Environment as part of the project Infrastructure and Environment 2014–2020 called “Developing adaptation plans to climatic changes for towns with the population level over 100,000”.
The primary goal of the adaptation plan is to develop the best solutions possible to adjust Toruń to climatic changes by reducing its vulnerability or enhancing its resistance to extreme climatic phenomena (floods and droughts), and by increasing the potential of the town to cope with the results of these detrimental phenomena.
6. Conclusions
The analysis of the climatic and hydrological conditions of the last 50 years (1971–2020) showed an increase in extreme phenomena having a large impact on groundwater and surface water intakes. A slight increase in annual precipitation and a significant increase in the number of days without precipitation (on average 55.1% of days per year) were noted in the analyzed multiyear period, but these trends were not statistically significant. A statistically significant increasing trend was recorded for mean annual air temperature. Other extreme hazards include those associated with intense, short-term precipitation. Days with extreme precipitation (more than 30 and 50 mm per day) occurred sporadically and accounted for 2 to 5 days per year. Meteorological hazards related to drought (days without precipitation) far outweighed the occurrence of days with intense precipitation. The analysis of water table fluctuations observed at the Jedwabno infiltration intake showed high sensitivity of the aquifer to atmospheric conditions.
In the case of the surface water intake, the greatest influence was exerted by events connected with the flows of the Drwęca River. Statistically significant decreasing trends of flows were recorded during the analyzed period. The number of days with low flows outnumbered the number of days with high flows. Decreasing low flows over a longer period of time could lead to temporary water shortages, which was especially noticeable in the summer–autumn period.
The applied methodology of water intake risk assessment provides an example of the possibility of a simple risk assessment considering extreme meteorological–hydrological events. The groundwater risk assessment conducted in the study showed the highest risk from the Drwęca River. Both high and low flows in the river, shaped by climatic conditions (lack or too intensive precipitations, high air temperature), influence the changes of groundwater level and in extreme conditions can cause floods around the area of the intake.
The example of water intake in Toruń indicates that the identification of hazards depends largely on local environmental, climatic, and anthropogenic conditions. The methodology of identification and assessment of hazards proposed in this paper can be applied to water intakes functioning in different regions of Poland. Knowing the probability of occurrence of threats identified at a given intake, it is possible to develop procedures which enable quick responses to changes that have occurred.
Author Contributions
Conceptualization, K.K.-W.; methodology, K.K.-W. and I.J.; software, K.K.-W. and I.J.; validation, K.K.-W. and I.J.; formal analysis, K.K.-W. and I.J.; investigation, K.K.-W. and I.J.; resources, K.K.-W., I.J. and Ł.G.; data curation, K.K.-W. and I.J.; writing—original draft preparation, K.K.-W. and I.J.; writing—review and editing, K.K.-W. and I.J.; visualization, K.K.-W. and I.J.; supervision, K.K.-W.; project administration, K.K.-W.; funding acquisition, I.J. All authors have read and agreed to the published version of the manuscript.
Funding
This research received no external funding.
Institutional Review Board Statement
Not applicable.
Informed Consent Statement
Not applicable.
Data Availability Statement
The data presented in this study have been made available by the Institute of Meteorology and Water Management, the National Research Institute and the Toruńskie Wodociągi Ltd.
Acknowledgments
The article was funded by the “Strategy of excellence—research university” program, financed by the Ministry of Science and Higher Education—Project: Urban Soil Environment.
Conflicts of Interest
The authors declare no conflict of interest.
References
- Kubiak-Wójcicka, K. Variability of Air Temperature, Precipitation and Outflows in the Vistula Basin (Poland). Resources 2020, 9, 103. [Google Scholar] [CrossRef]
- Tal, A.; Khateeb, N.A.; Nagouker, N.; Akerman, H.; Diabat, M.; Nassar, A.; Angel, R.; Sadah, M.A.; Hershkovitz, Y.; Gasith, A.; et al. Chemical and biological monitoring in ephemeral and intermittent streams: A study of two transboundary Palestinian–Israeli watersheds. Int. J. River Basin Manag. 2010, 8, 185–205. [Google Scholar] [CrossRef] [Green Version]
- Datry, T.; Boulton, A.J.; Bonada, N.; Fritz, K.; Leigh, C.; Sauquet, E.; Tockner, K.; Hugueny, B.; Dahm, C.N. Flow intermittence and ecosystem services in rivers of the Anthropocene. J. Appl. Ecol. 2018, 55, 353–364. [Google Scholar] [CrossRef] [PubMed] [Green Version]
- Stubbington, R.; Chadd, R.; Cid, N.; Csabai, Z.; Morais, M.; Munné, A.; Pařil, P.; Pešić, V.; Tziortzis, I.; Verdonschot, R.C.M. Biomonitoring of intermittent rivers and ephemeral streams in Europe: Current practice and priorities to enhance ecological status assessments. Sci. Total Environ. 2018, 618, 1096–1113. [Google Scholar] [CrossRef] [PubMed]
- Mostafa, S.M.; Wahed, O.; El-Nashar, W.Y.; El-Marsafawy, S.M.; Zeleňáková, M.; Abd-Elhamid, H.F. Potential Climate Change Impacts on Water Resources in Egypt. Water 2021, 13, 1715. [Google Scholar] [CrossRef]
- Elewa, H.H.; Zelenakova, M.; Nosair, A.M. Integration of the Analytical Hierarchy Process and GIS Spatial Distribution Model to Determine the Possibility of Runoff Water Harvesting in Dry Regions: Wadi Watir in Sinai as a Case Study. Water 2021, 13, 804. [Google Scholar] [CrossRef]
- European Environment Agency. 2009. Available online: https://www.eea.europa.eu/data-and-maps/indicators/use-of-freshwater-resources-3/eea-2009 (accessed on 3 July 2021).
- Stein, U.; Özerol, G.; Tröltzsch, J.; Landgrebe, R.; Szendrenyi, A.; Vidaurre, R. European Drought and Water Scarcity Policies. In Governance for Drought Resilience, Land and Water Drought Management in Europe; Bressers, H., Nanny, B., Corinne, L., Eds.; SpringerNature: Basingstoke, UK, 2016; pp. 17–43. [Google Scholar] [CrossRef] [Green Version]
- Kubiak-Wójcicka, K.; Piątkowski, K. Evaluation of water and wastewater infrastructure in communes od kujawsko-pomorskie voivodeship. Infrastruct. Ecol. Rural. Areas 2017, 1, 907–922. [Google Scholar] [CrossRef]
- Kubiak-Wójcicka, K.; Machula, S. Influence of Climate Changes on the State of Water Resources in Poland and Their Usage. Geosciences 2020, 10, 312. [Google Scholar] [CrossRef]
- Kubiak-Wójcicka, K. Assessment of water resources in Poland. In Quality in Water Resources in Poland; Zeleňáková, M., Kubiak-Wójcicka, K., Negm, A.M., Eds.; Springer: Cham, Switzerland, 2021; pp. 15–34. [Google Scholar] [CrossRef]
- Falkenmark, M. The massive water scarcity threatening Africa-why isn’t it being addressed. Ambio 1989, 18, 112–118. [Google Scholar]
- Van Lanen, H.A.J.; Laaha, G.; Kingston, D.G.; Gauster, T.; Ionita, M.; Vidal, J.-P.; Vlnas, R.; Tallaksen, L.M.; Stahl, K.; Hannaford, J.; et al. Hydrology needed to manage droughts: The 2015 European Case. Hydrol. Process. 2016, 30, 3097–3104. [Google Scholar] [CrossRef] [Green Version]
- Kubiak-Wójcicka, K.; Pokropski, T. Natężenie ruchu żeglugowego na dolnej Wiśle na podstawie analizy śluzowań we Włocławku w latach 1997–2016 (Intensity of inland navigation on the lower Vistula River based on the analysis of lockage in Włocławek in the years 1997–2016). Pr. Geogr. 2019, 156, 79–99. (In Polish) [Google Scholar] [CrossRef]
- Kubiak-Wójcicka, K.; Nagy, P.; Zeleňáková, M.; Hlavatá, H.; Abd-Elhamid, H.F. Identification of ExtremeWeather Events Using Meteorological and Hydrological Indicators in the Laborec River Catchment, Slovakia. Water 2021, 13, 1413. [Google Scholar] [CrossRef]
- Bąk, B.; Kubiak-Wójcicka, K. Impact of meteorological drought on hydrological drought in Toruń (central Poland) in the period of 1971–2015. J. Water Land Dev. 2017, 2, 3–12. [Google Scholar] [CrossRef] [Green Version]
- Staśko, S.; Buczyński, S. Drought and its effects on spring discharge regimes in Poland and Germany during the 2015 drought. Hydrol. Sci. J. 2018, 63, 741–751. [Google Scholar] [CrossRef]
- Kaznowska, E.; Hejduk, A.; Kępiński, C. The Vistula river low flows in Warsaw in the 21st Century. Acta Sci. Pol. Form. Circumiectus 2018, 17, 29–38. [Google Scholar] [CrossRef]
- Solarczyk, A.; Kubiak-Wójcicka, K. The exhaustion of water resources in the Kuyavian-Pomeranian voivodship in drought condition in 2015. Res. Rural. Dev. Water Manag. 2019, 1, 118–125. [Google Scholar] [CrossRef]
- The Intergovernmental Panel on Climate Change (IPCC). Climate change 2013: The physical science basis. In Contribution of Working Group I to the 5th Assessment Report of the Intergovernmental Panel on Climate Change; Cambridge University Press: Cambridge, UK; New York, NY, USA, 2013. [Google Scholar]
- Nowicki, Z. (Ed.) Wody Podziemne Miast Wojewódzkich Polski; Informator PSH, Państwowy Instytut Geologiczny: Warszawa, Poland, 2009. [Google Scholar]
- Małecki, J.J. Wpływ urbanizacji na stany charakterystyczne zwierciadła wód podziemnych—Analiza wyników badań prowadzonych na stacji naukowo-badawczej Wydziału Geologii UW w Warszawie. Biul. Państw. Inst. Geologicznego 2013, 456, 377–384. [Google Scholar]
- Dragon, K.; Górski, J. Przyczyny zanieczyszczenia wód podziemnych ujęcia Tursko dla miasta Pleszewa (województwo wielkopolskie). Przegląd Geol. 2008, 56, 465–471. [Google Scholar]
- Kowalczak, P.; Kundzewicz, Z.W. Water-related conflicts in urban areas in Poland. Hydrol. Sci. J. 2011, 56, 588–596. [Google Scholar] [CrossRef] [Green Version]
- Radzka, E.; Jankowska, J. System zarządzania jakością wody pitnej w Polsce (Management system of drinking water quality in Poland). Zesz. Nauk. Uniw. Przyr. Humanist. W Siedlcach 2015, 107, 221–230. [Google Scholar]
- Ustawa z dnia 7 czerwca 2001 r. o zbiorowym zaopatrzeniu w wodę i zbiorowym odprowadzaniu ścieków (Dz.U. 2001 Nr 72 poz. 747) z późniejszymi zmianami.
- Dyrektywa 2000/60/WE Parlamentu Europejskiego i Rady z dnia 23 października 2000 r. ustanawiająca ramy wspólnotowego działania w dziedzinie polityki wodnej.
- Framework for Action for the Management of Small Drinking Water Supplies; European Union: Mestreech, The Netherlands, 2014; ISBN 978-92-79-44633-7. [CrossRef]
- Dyrektywa Komisji (UE) 2015/1787 z dnia 6 października 2015 r. zmieniająca załączniki II oraz III do dyrektywy Rady 98/83/WE w sprawie jakości wody przeznaczonej do spożycia przez ludzi.
- WHO. Guidelines for Drinking-Water Quality, 4th Edition, Incorporating the 1st Addendum. 2011. Available online: https://www.who.int/water_sanitation_health/publications/drinking-water-quality-guidelines-4-including-1st-addendum/en/ (accessed on 22 March 2021).
- Najwyższa Izba Kontroli. Informacja o Wynikach Kontroli. Zapewnienie Bezpieczeństwa Zaopatrzenia W Wodę Dużych Aglomeracji Miejskich Na Wypadek Wystąpienia Sytuacji Kryzysowych. 2017. LKA.410.022.2016. Available online: https://www.nik.gov.pl/plik/id,14969,vp,17439.pdf (accessed on 10 May 2021).
- Ustawa Prawo wodne z dnia 20 lipca 2017 roku (Dz. U. 2017 poz. 1566) z późniejszymi zmianami.
- Kończak, B.; Janson, E. Risk analysis for groundwater intake in an old mining shaft with increased chloride content, Upper Silesia, Southern Poland. J. Water Health 2021, 19, 2. [Google Scholar] [CrossRef]
- Lidzbarski, M. Analiza ryzyka w procesie ustanawiania strefy ochronnej ujęć wód podziemnych „Osowa” i „Dolina Radości” w Gdańsku. Biul. Państwowego Inst. Geol. 2019, 475, 125–132. [Google Scholar] [CrossRef]
- Szpak, D.; Rak, J.R.; Boryczko, K.; Piedgoń, I.; Żywiec, J. Risk assessment for the selected Surface water intake. J. KONBiN 2020, 50, 147–155. [Google Scholar] [CrossRef]
- Sarkar, R.; Vogt, J. Drinking water vulnerability in rural coastal areas of Bangladesh during and after natural extreme events. Int. J. Disaster Risk Reduct. 2015, 14, 411–423. [Google Scholar] [CrossRef]
- Pomianowska, H. Mapa Hydrogeologiczna Polski, Arkusz Toruń (321); Państwowy Instytut Geologiczny: Warszawa, Poland, 2002. [Google Scholar]
- Lidzbarski, M.; Prussak, E. Informator PSH p.t. Wody Podziemne Miast Polski—Miasta Powyżej 50 000 Mieszkańców-Toruń”, 2007. Available online: https://www.pgi.gov.pl/dokumenty-pig-pib-all/psh/psh-materialy-informacyjne/informatory-psh/wody-podziemne-miast-polski/4175-torun/file.html (accessed on 20 September 2021).
- Bobiński, W.; Hrybowicz, G.; Bliźniuk, A.; Kwecko, P.; Bojakowska, I.; Wołkowicz, S. Objaśnienia do Mapy Geośrodowiskowej Polski, Arkusz Toruń (321); Państwowy Instytut Geologiczny: Warszawa, Poland, 2007. [Google Scholar]
- Mann, H.B. Non-parametric tests against trend. Econom. J. Econom. Soc. 1945, 13, 245–259. [Google Scholar]
- Kendall, M.G. Rank Correlation Measures; Charles Griffin: London, UK, 1975. [Google Scholar]
- Theil, H. A rank-invariant method of linear and poly-nomial regression analysis. Ned. Acad. Wet. Process 1950, 53, 386–392. [Google Scholar]
- Sen, P.K. Estimates of the regression coefficient based on Kendall’s tau. J. Am. Stat. Assoc. 1968, 63, 1379–1389. [Google Scholar] [CrossRef]
- Kubiak-Wójcicka, K.; Zeleňáková, M.; Blištan, P.; Simonová, D.; Pilarska, A. Influence of climate change on low flow conditions. Case study: Laborec River, eastern Slovakia. Ecohydrol. Hydrobiol. 2021, in press. [Google Scholar] [CrossRef]
- Yevjevich, V. An Objective Approach to Definition and Investigation of Continental Hydrological Droughts; Hydrology Paper No. 23; Colorado State University: Fort Collins, CO, USA, 1967; Available online: https://mountainscholar.org/bitstream/handle/10217/61303/HydrologyPapers_n23.pdf;sequence=1 (accessed on 20 October 2020).
- Norma PN-EN 15975-2 Bezpieczeństwo zaopatrzenia w wodę do spożycia—Wytyczne dotyczące zarządzania kryzysowego i ryzyka—Część 2: Zarządzanie ryzykiem.
- Tchórzewska-Cieślak, B. Metody Analizy i Oceny Ryzyka Awarii Podsystemu Dystrybucji Wody; Oficyna Wydawnicza Politechniki Rzeszowskiej: Rzeszów, Poland, 2011. [Google Scholar]
- Witczak, S.; Kania, J.; Kmiecik, E. Nowe podejście dotyczące ustanawiania stref ochronnych ujęć wód podziemnych jako elementu planów bezpieczeństwa wody. In Bezpieczeństwo Zbiorowego Zaopatrzenia W Wodę Na Terenach Objętych Antropopresją; Malina, G., Ed.; Polskie Stowarzyszenie Inżynierów i Techników Sanitarnych w Częstochowie: Częstochowa, Poland, 2018; pp. 9–18. [Google Scholar]
- Tchórzewska-Cieślak, B. Zarządzanie bezpieczeństwem dostaw wody. J. KONBiN 2017, 41, 171–188. [Google Scholar] [CrossRef] [Green Version]
- Wibig, J. Heat waves in Poland in the period 1951–2015: Trends, patterns and driving factors. Meteorol. Hydrol. Water Manag. 2017, 6, 1. [Google Scholar] [CrossRef]
- Kubiak-Wójcicka, K. Long-term variability of runoff of Vistula river in 1951-2015. In Air and Water Components of the Environment; Faculty of Geography: Cluj-Napoca, Romania, 2019; pp. 109–120. [Google Scholar] [CrossRef]
- Szpak, D.; Tchórzewska-Cieślak, B. The Use of Grey Systems Theory to Analyze the Water Supply Systems Safety. Water Resour. Manag. 2019, 33, 4141–4155. [Google Scholar] [CrossRef] [Green Version]
- Elliot, M.; Foster, T.; MacDonald, M.C.; Harris, A.R.; Kellogg, J.; Schwab, K.J.; Hadwen, W.L. Addressing how multiple household water sources and uses build water resilience and support sustainable development. NPJ Clean Water 2019, 2, 6. [Google Scholar] [CrossRef] [Green Version]
- Boryczko, K.; Rak, J. Method for Assessment of Water Supply Diversification. Resources 2020, 9, 87. [Google Scholar] [CrossRef]
- Rickert, B.; van den Berg, H.; Bekure, K.; Girma, S.; de Roda Husman, A.M. Including aspects of climate change into water safety planning: Literature review of global experience and case studies from Ethiopian urban supplies. Int. J. Hyg. Environ. Health 2019, 222, 744–755. [Google Scholar] [CrossRef]
- Zwolsmann, J.J.G.; van Bokhoven, A.J. Impact of summer droughts on water quality of the Rhine River—A preview of climate change? Water Sci. Technol. 2007, 56, 45–55. [Google Scholar] [CrossRef]
- Van Vliet, M.T.H.; Zwolsman, J.J.G. Impact of summer droughts on the water quality of the Meuse river. J. Hydrol. 2008, 353, 1–17. [Google Scholar] [CrossRef]
- Elsdon, T.S.; De Bruin, M.B.N.A.; Diepen, N.J.; Gillanders, B.M. Extensive drought negates human influence on nutrients and water quality in estuaries. Sci. Total Environ. 2009, 407, 3033–3043. [Google Scholar] [CrossRef]
- Mimikou, M.A.; Baltas, E.; Varanou, E.; Pantazis, K. Regional impacts of climate change on water resources quantity and quality indicators. J. Hydrol. 2000, 234, 95–109. [Google Scholar] [CrossRef]
- Kim, J.-S.; Lee, J.-H.; Park, S.-Y.; Chen, J.; Chen, H. Water quality risk assessment for drought conditions: A case study of the Korean Nakdong River basin. In Proceedings of the IOP Conference Series: Earth and Environmental Science; IOP Publishing: Bristol, UK, 2019; Volume 351, p. 012017. [Google Scholar]
- Nostarti, K. The effects of hydrological drought on water quality. In Water Quality: Current Trends and Expected Climate Change Impacts, Proceedings of the Symposium H04 Held during IUGG2011, Melbourne, Australia, 28 June–7 July 2011; IAHS Publication: Wallingford, UK, 2011; Volume 348, pp. 51–56. [Google Scholar]
- Luh, J.; Royster, S.; Sebastian, D.; Ojomo, E.; Bartram, J. Expert assessment of the resilience of drinking water and sanitation systems to climate-related hazards. Sci. Total Environ. 2017, 592, 334–344. [Google Scholar] [CrossRef]
- Kohlitz, J.; Chong, J.; Willetts, J. Rural Drinking Water Safety under Climate Change: The Importance of Addressing Physical, Social, and Environmental Dimensions. Resources 2020, 9, 77. [Google Scholar] [CrossRef]
- Susanto, A.; Purwanto, P.; Putro, E.K.; Yuliasari, F. Drinking Water Risk Management Plan: A Case Study in the Ore Processing Industry. Safety 2019, 5, 58. [Google Scholar] [CrossRef] [Green Version]
Figure 1.
Research area.

Figure 2.
Hydrogeological map (own study based on [37]).
Figure 2.
Hydrogeological map (own study based on [37]).
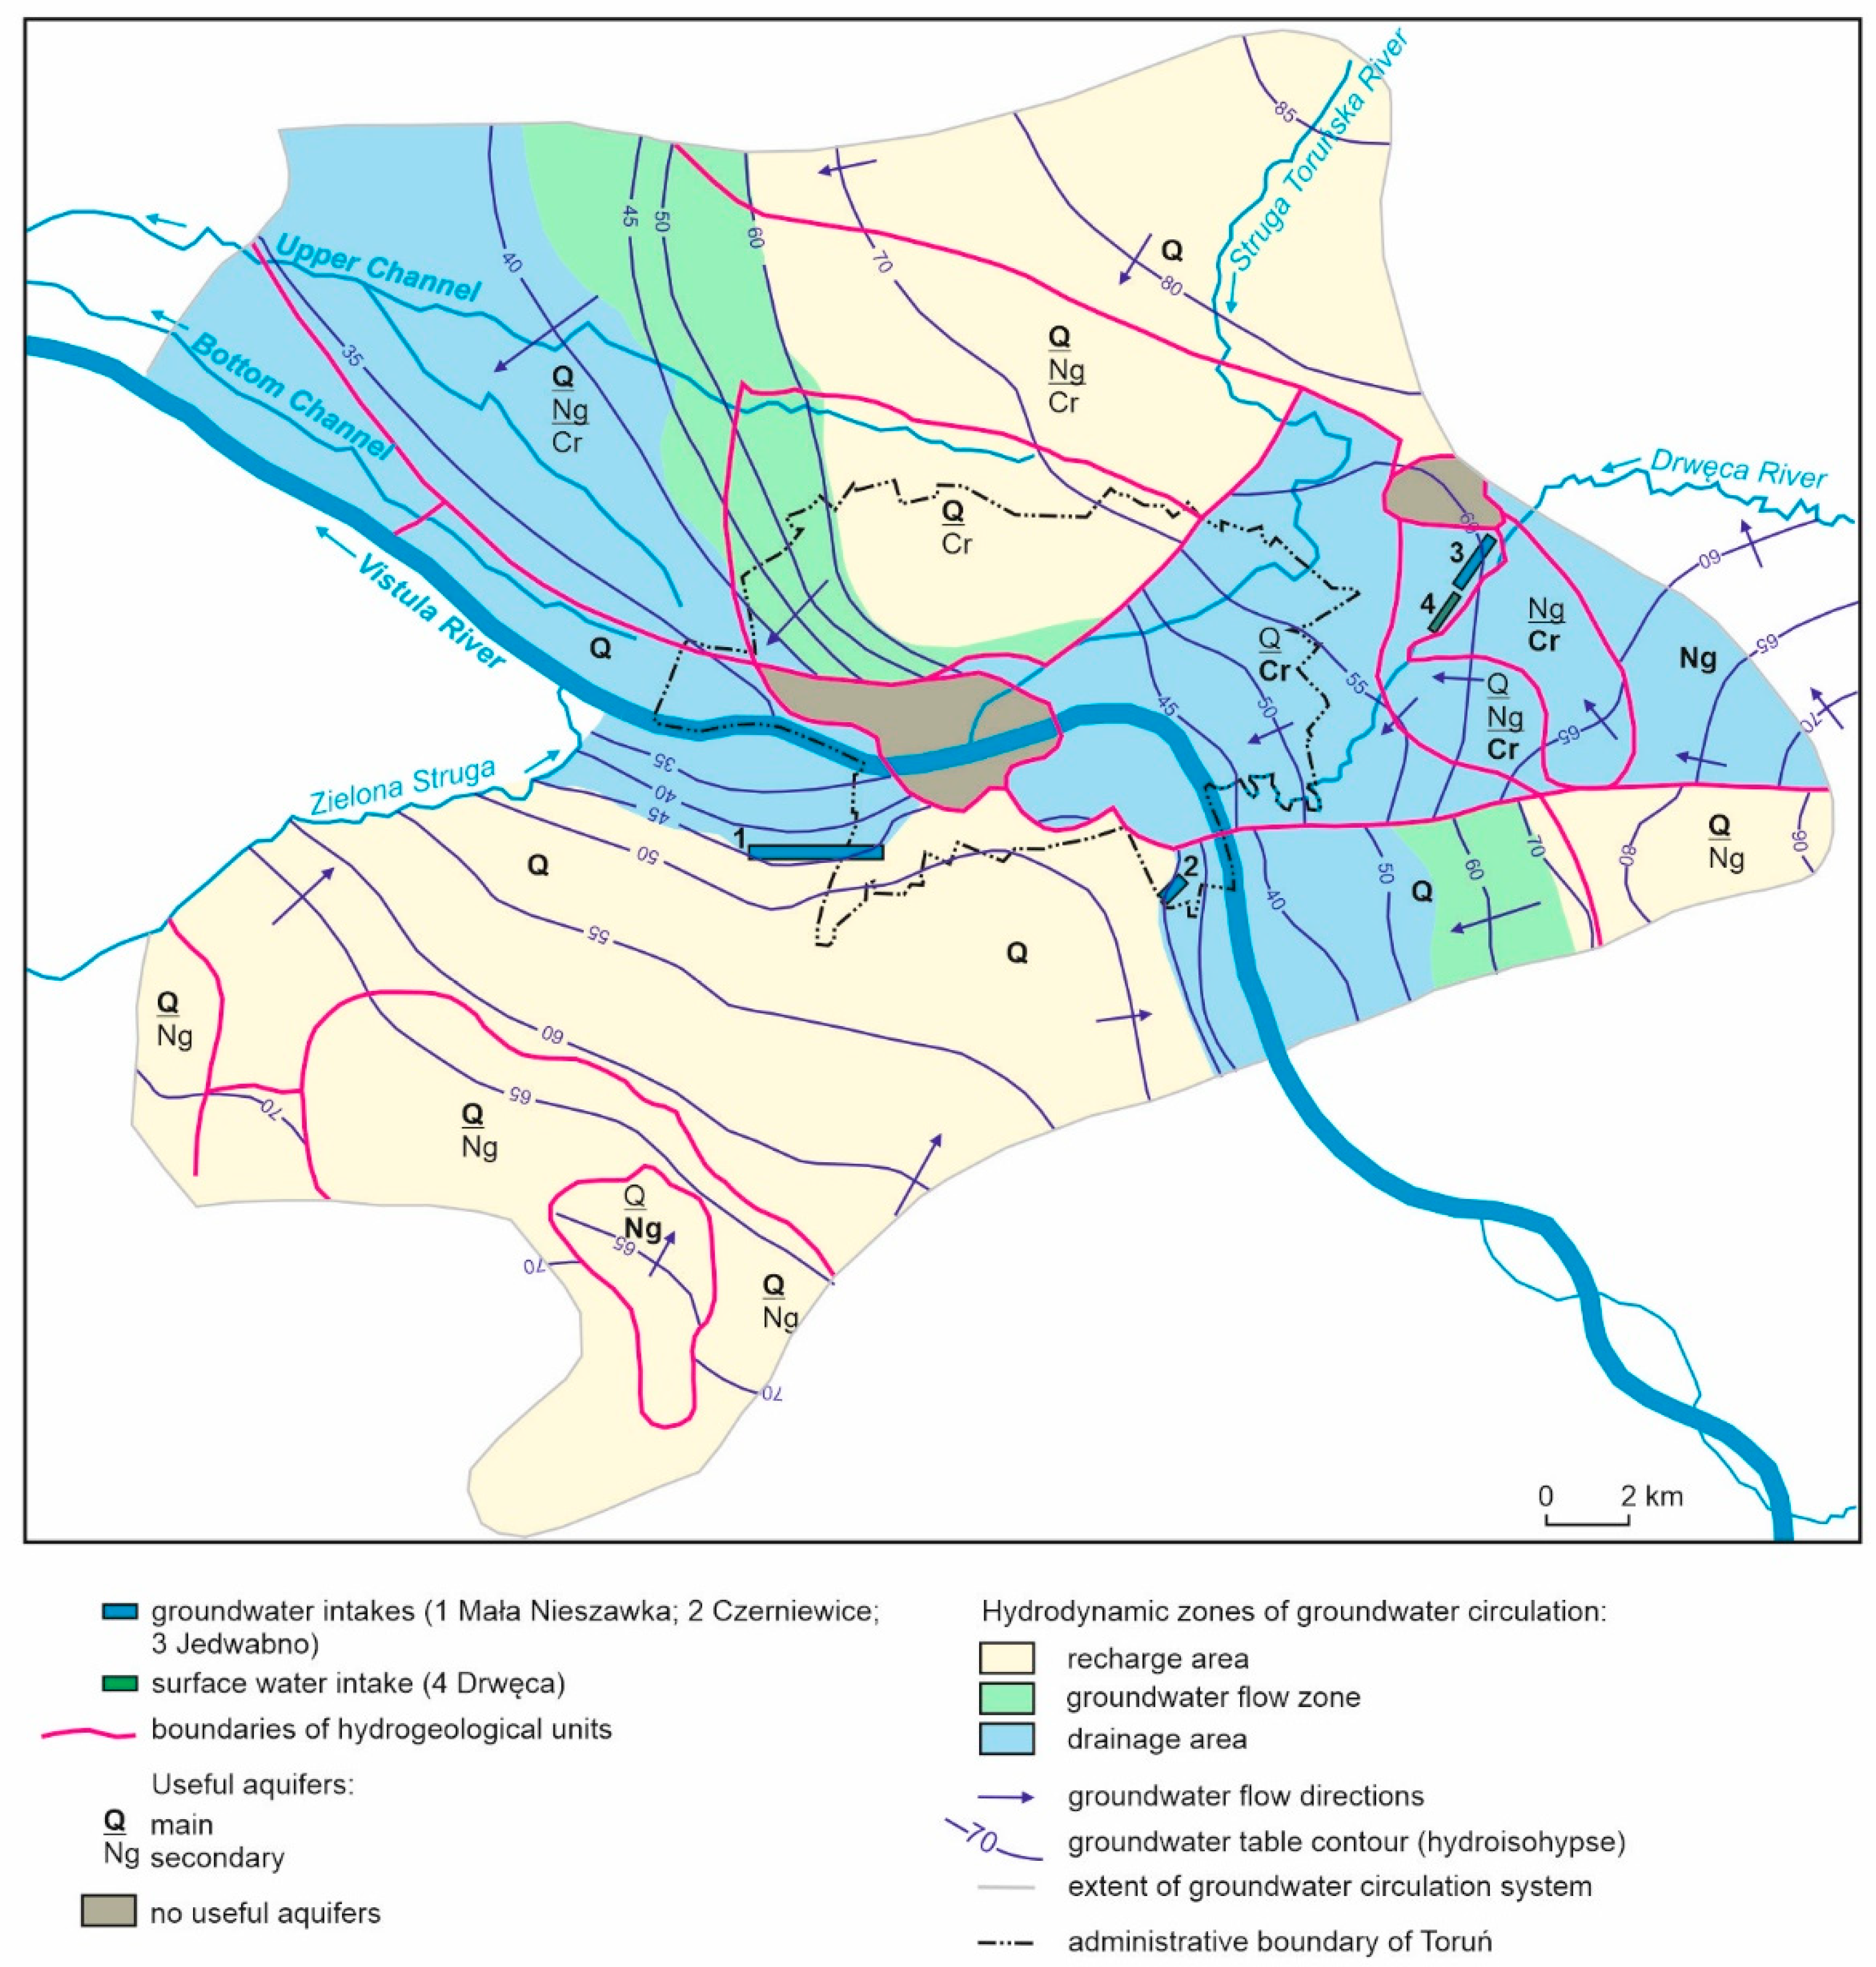
Figure 3.
The contribution of water channeled into the water supply system from particular water intakes according to the total water balance.
Figure 3.
The contribution of water channeled into the water supply system from particular water intakes according to the total water balance.

Figure 4.
The hydrogeological cross-section of the intake area.

Figure 5.
Annual precipitation (P) total and mean annual air temperature (T) recorded at the meteorological station in Toruń for the period 1971–2020.
Figure 5.
Annual precipitation (P) total and mean annual air temperature (T) recorded at the meteorological station in Toruń for the period 1971–2020.
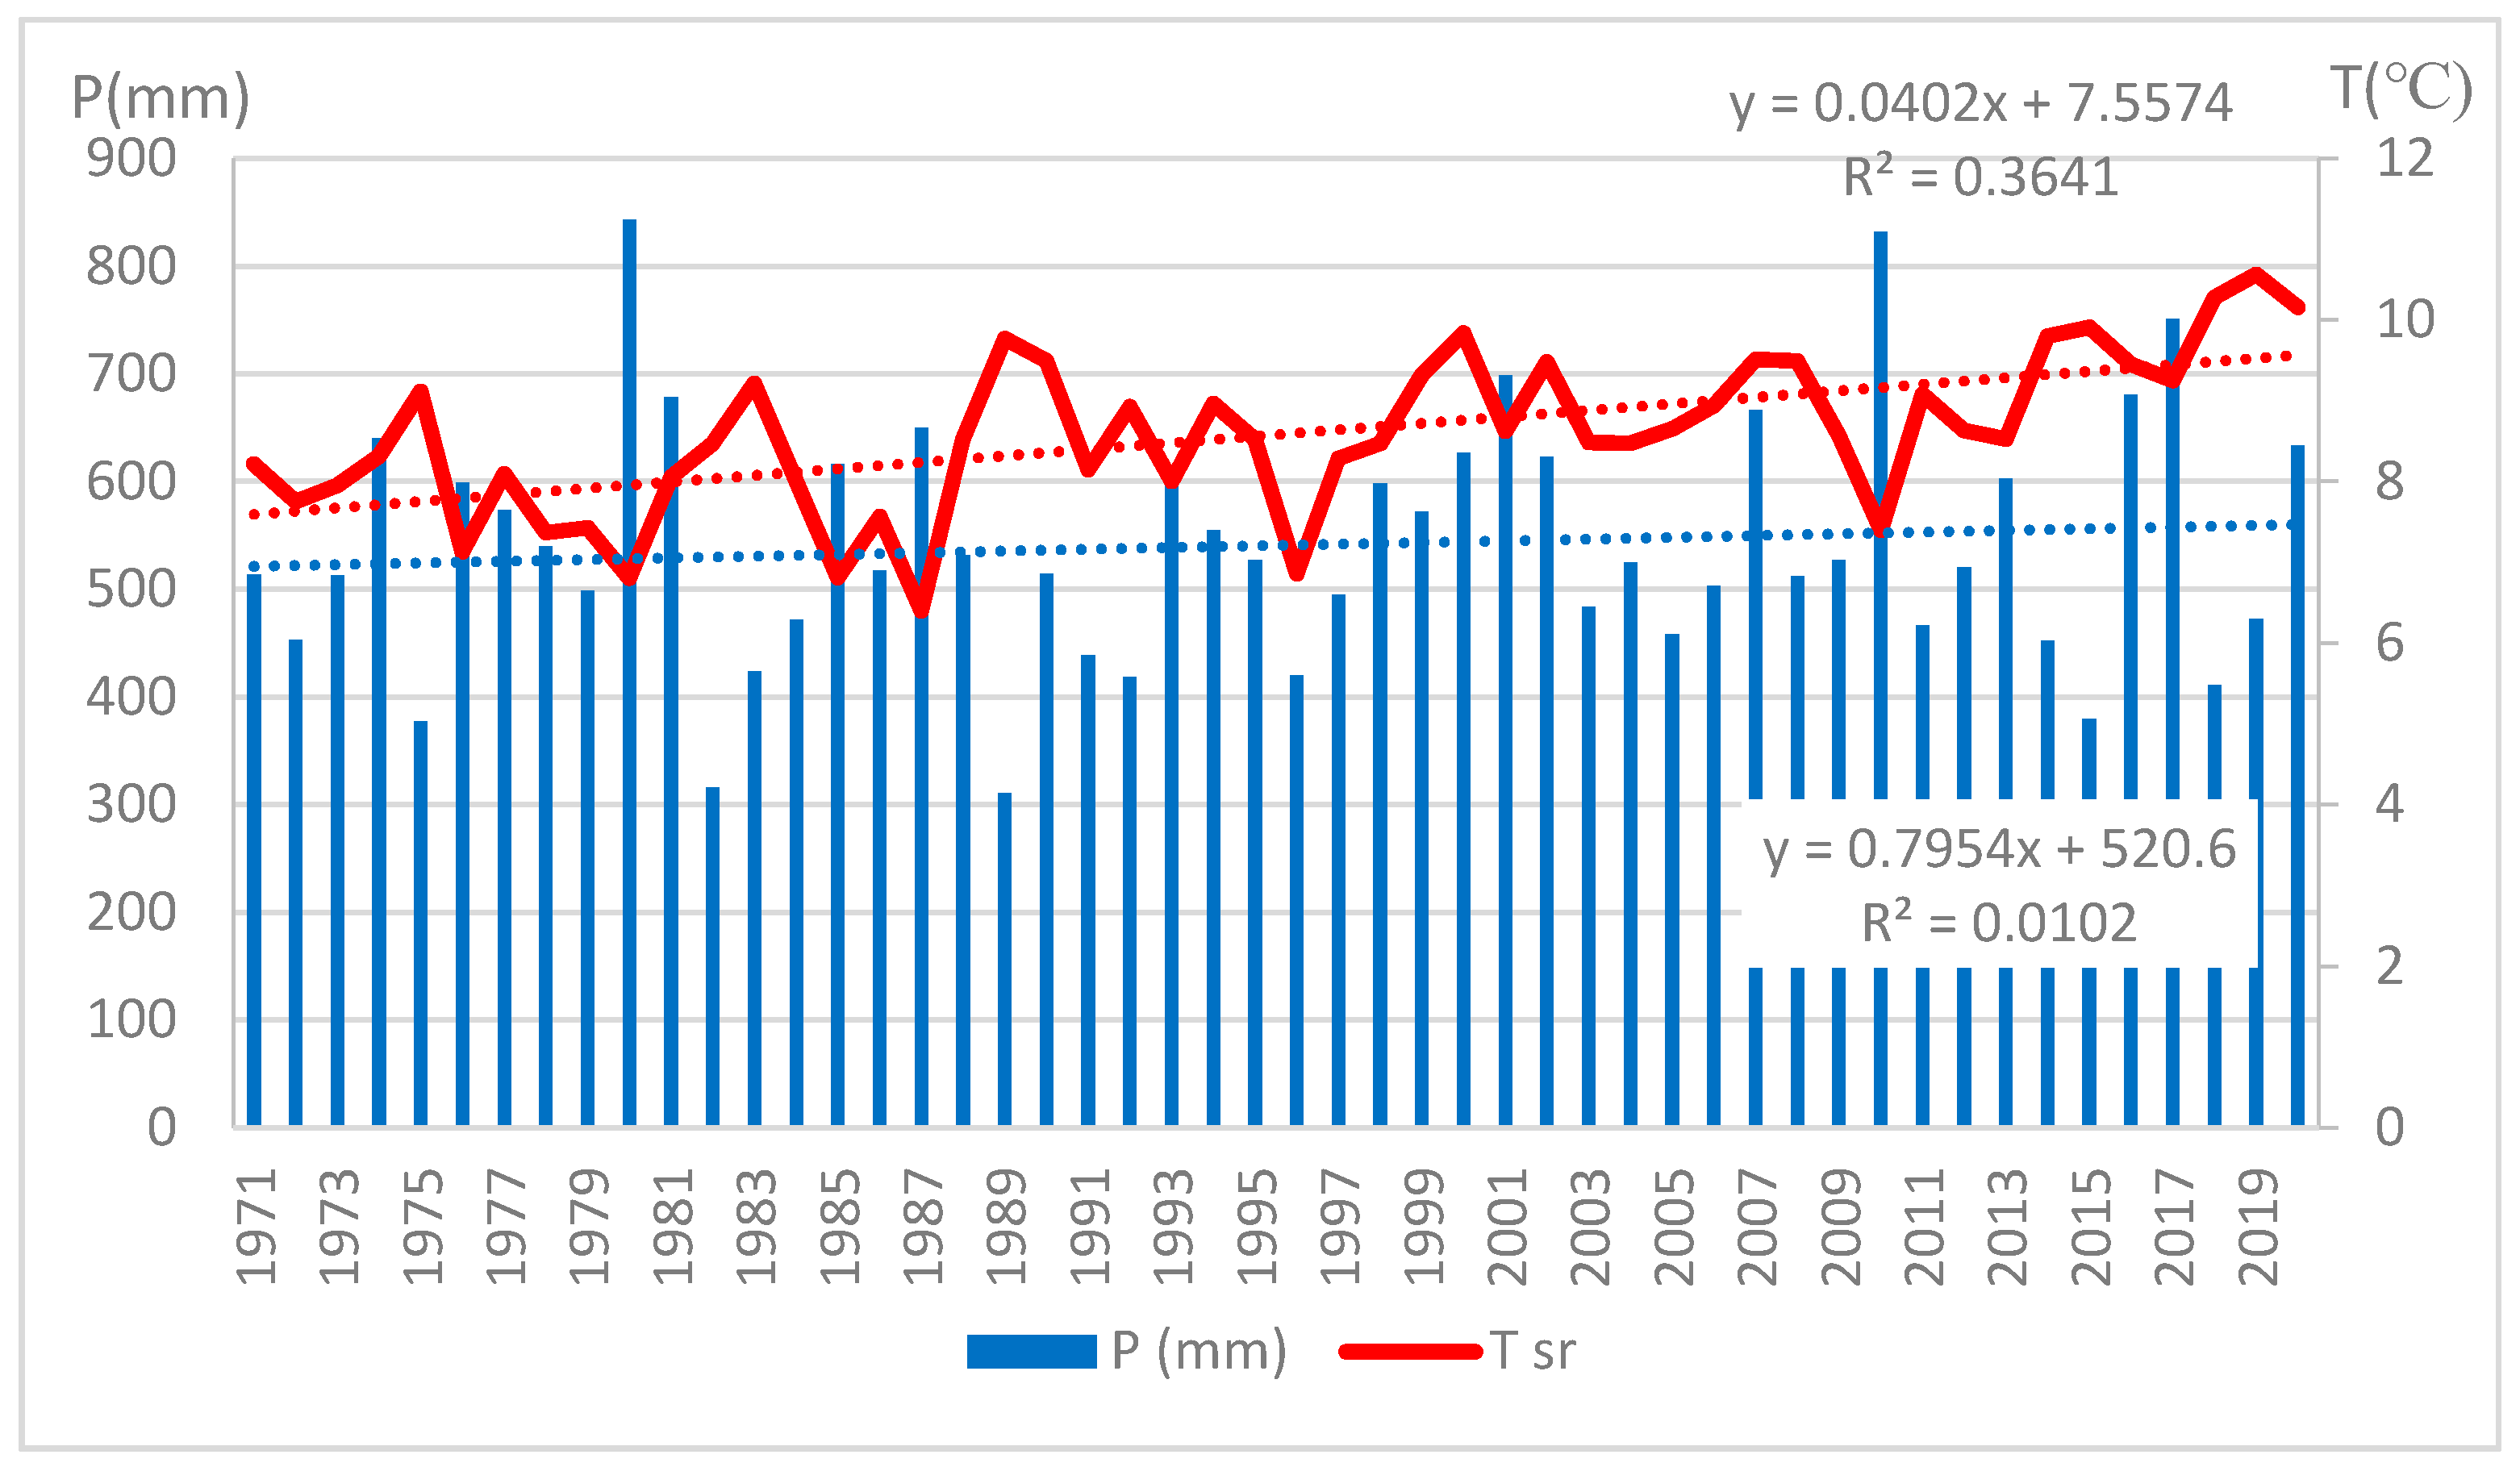
Figure 6.
The number of days without any precipitation per year recorded at the meteorological station in Toruń for the period 1971–2020.
Figure 6.
The number of days without any precipitation per year recorded at the meteorological station in Toruń for the period 1971–2020.

Figure 7.
The number of days with daily precipitation (P) over 30 and 50 mm recorded at the meteorological station in Toruń.
Figure 7.
The number of days with daily precipitation (P) over 30 and 50 mm recorded at the meteorological station in Toruń.

Figure 8.
Maximum, average, and minimum annual discharge rates of the Drwęca River recorded at the hydrological station in Elgiszewo during 1971–2020.
Figure 8.
Maximum, average, and minimum annual discharge rates of the Drwęca River recorded at the hydrological station in Elgiszewo during 1971–2020.

Figure 9.
The number of days with discharge levels above SWQ (days with floods) in the period 1971–2020.
Figure 9.
The number of days with discharge levels above SWQ (days with floods) in the period 1971–2020.
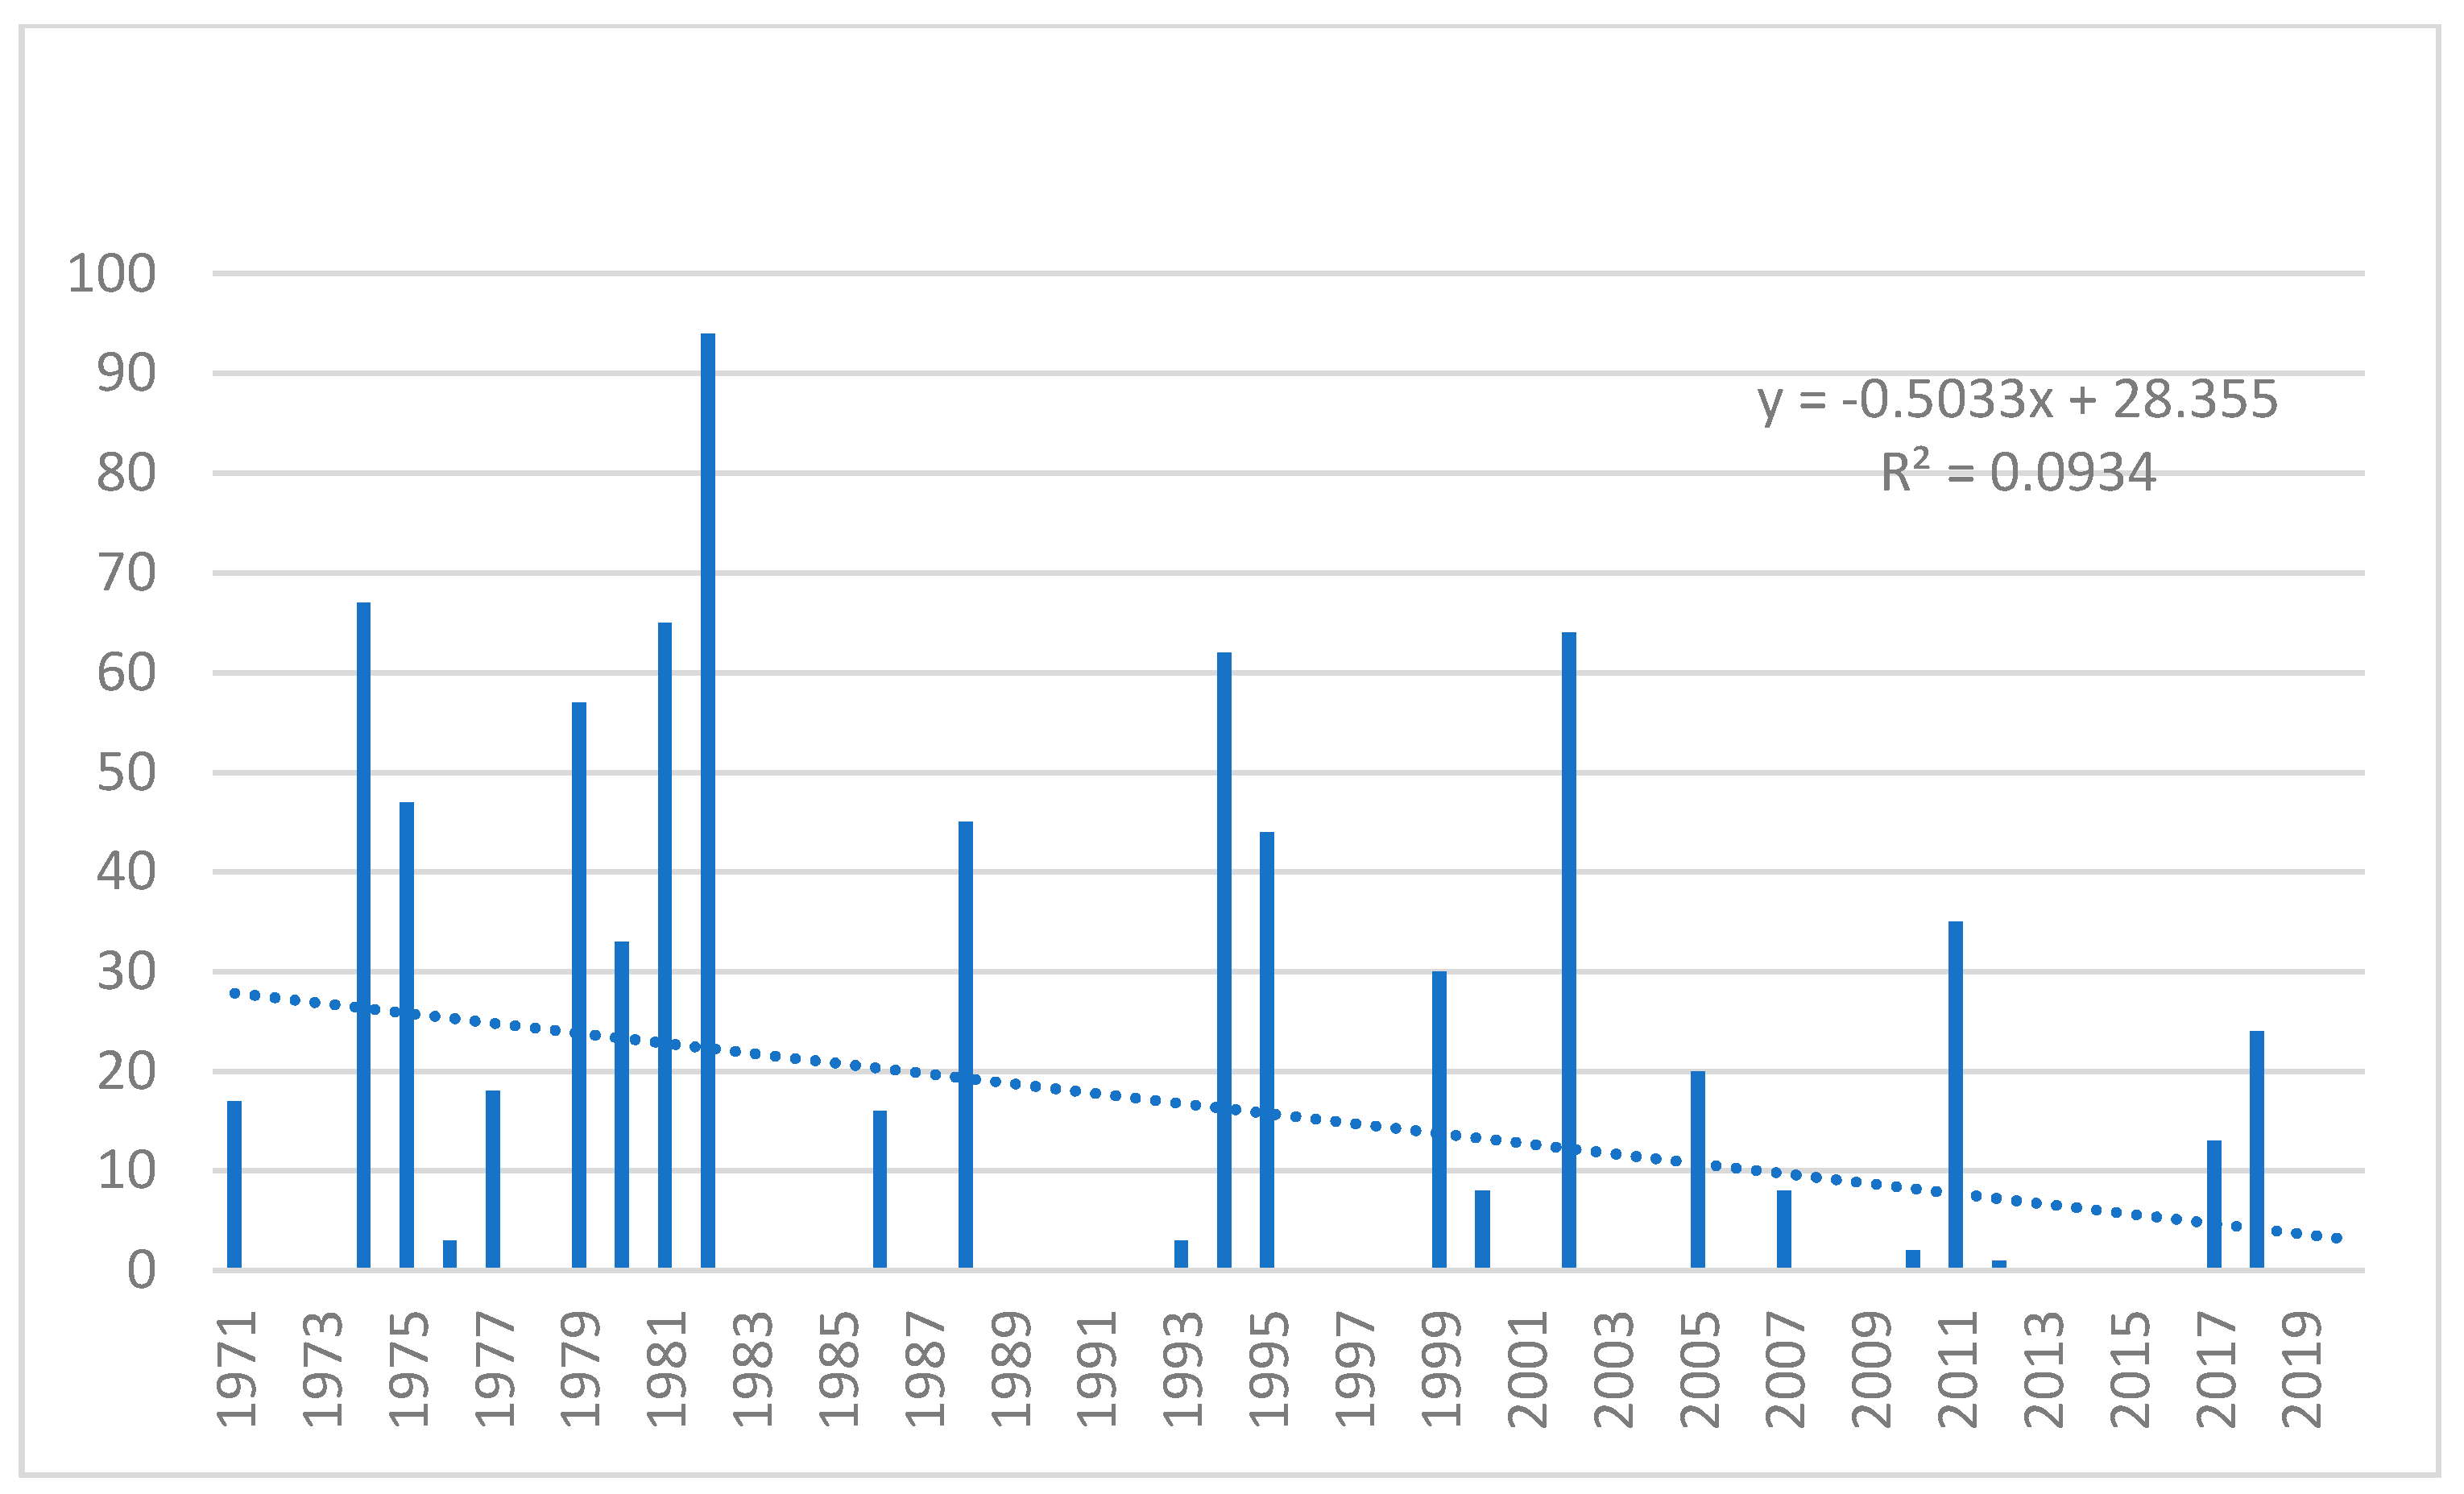
Figure 10.
The number of days per year with water discharge levels below SNQ.
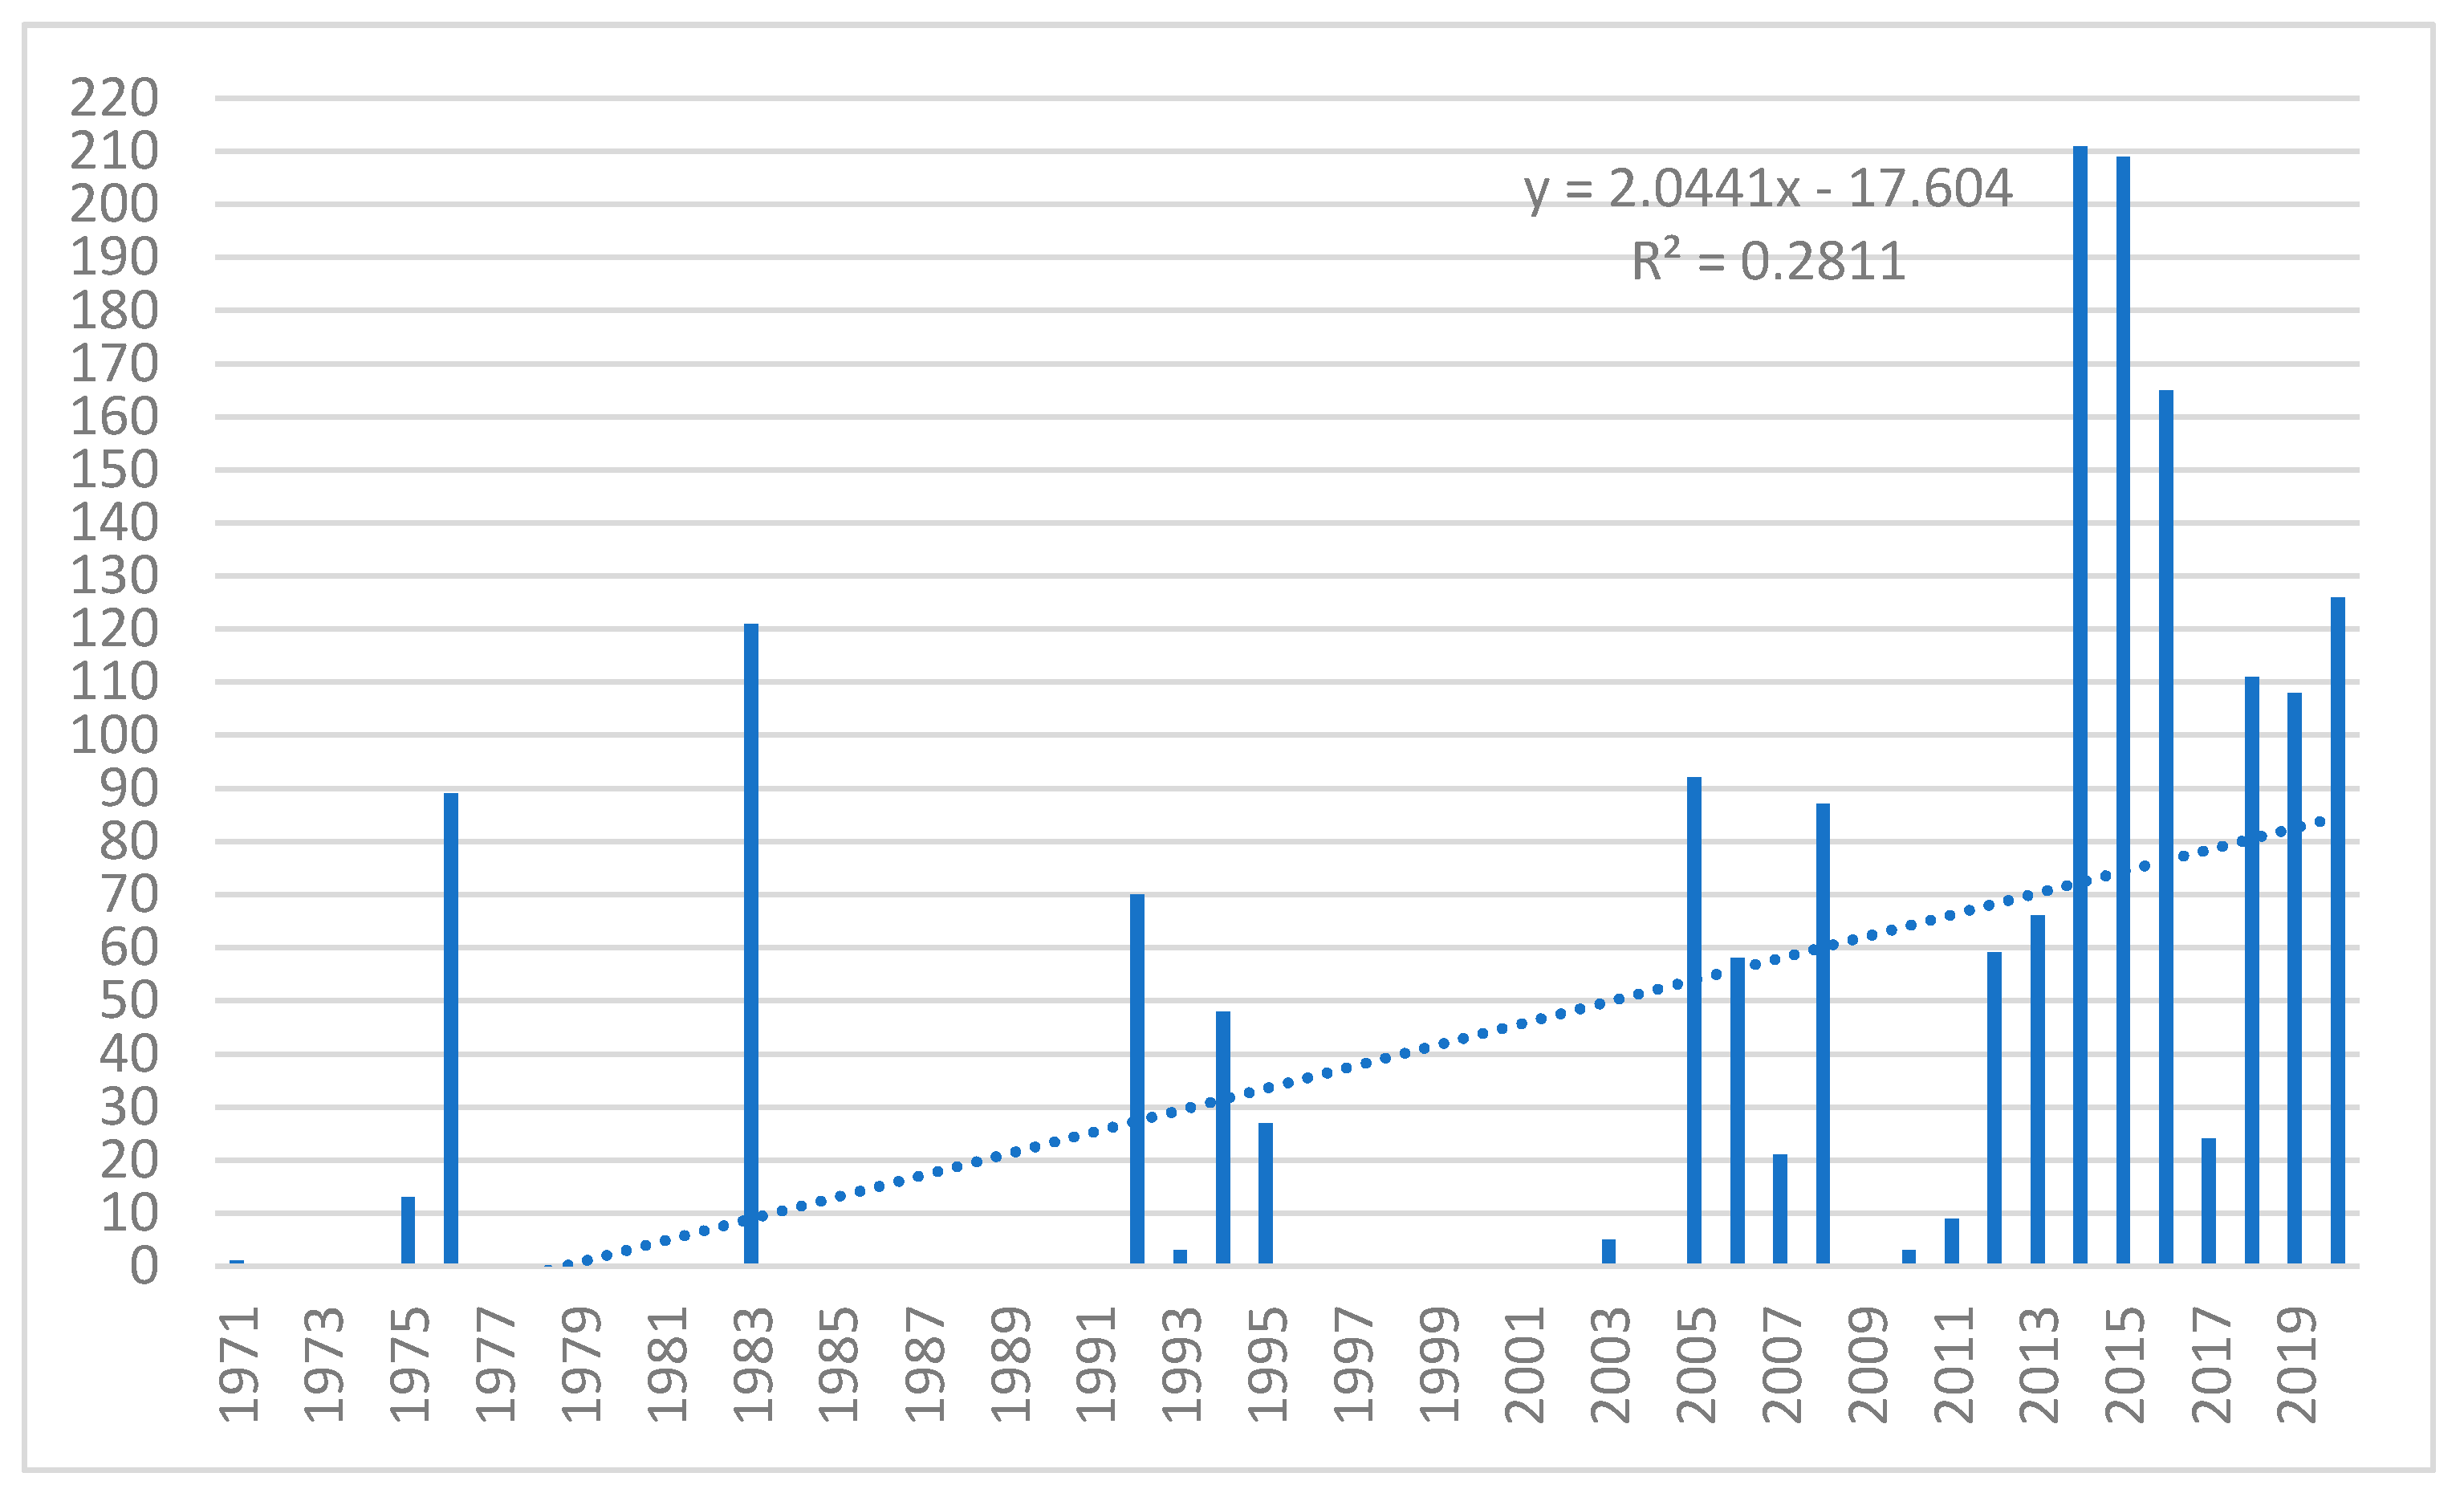
Figure 11.
The percentage of the number of days with droughts (below SNQ) and floods (above SWQ).

Figure 12.
Annual volume of water measured in m3/day abstracted from the Drwęca surface intake and from the infiltration intake in Jedwabno within the period 2008–2020.
Figure 12.
Annual volume of water measured in m3/day abstracted from the Drwęca surface intake and from the infiltration intake in Jedwabno within the period 2008–2020.

Figure 13.
Monthly water abstraction level measured in m3/d from the Drwęca surface intake, shown for wet (2010), dry (2015), and average (2017) years.
Figure 13.
Monthly water abstraction level measured in m3/d from the Drwęca surface intake, shown for wet (2010), dry (2015), and average (2017) years.

Figure 14.
Monthly water abstraction level measured in m3/d from the infiltration intake in Jedwabno, shown for wet (2010), dry (2015), and average (2017) years.
Figure 14.
Monthly water abstraction level measured in m3/d from the infiltration intake in Jedwabno, shown for wet (2010), dry (2015), and average (2017) years.
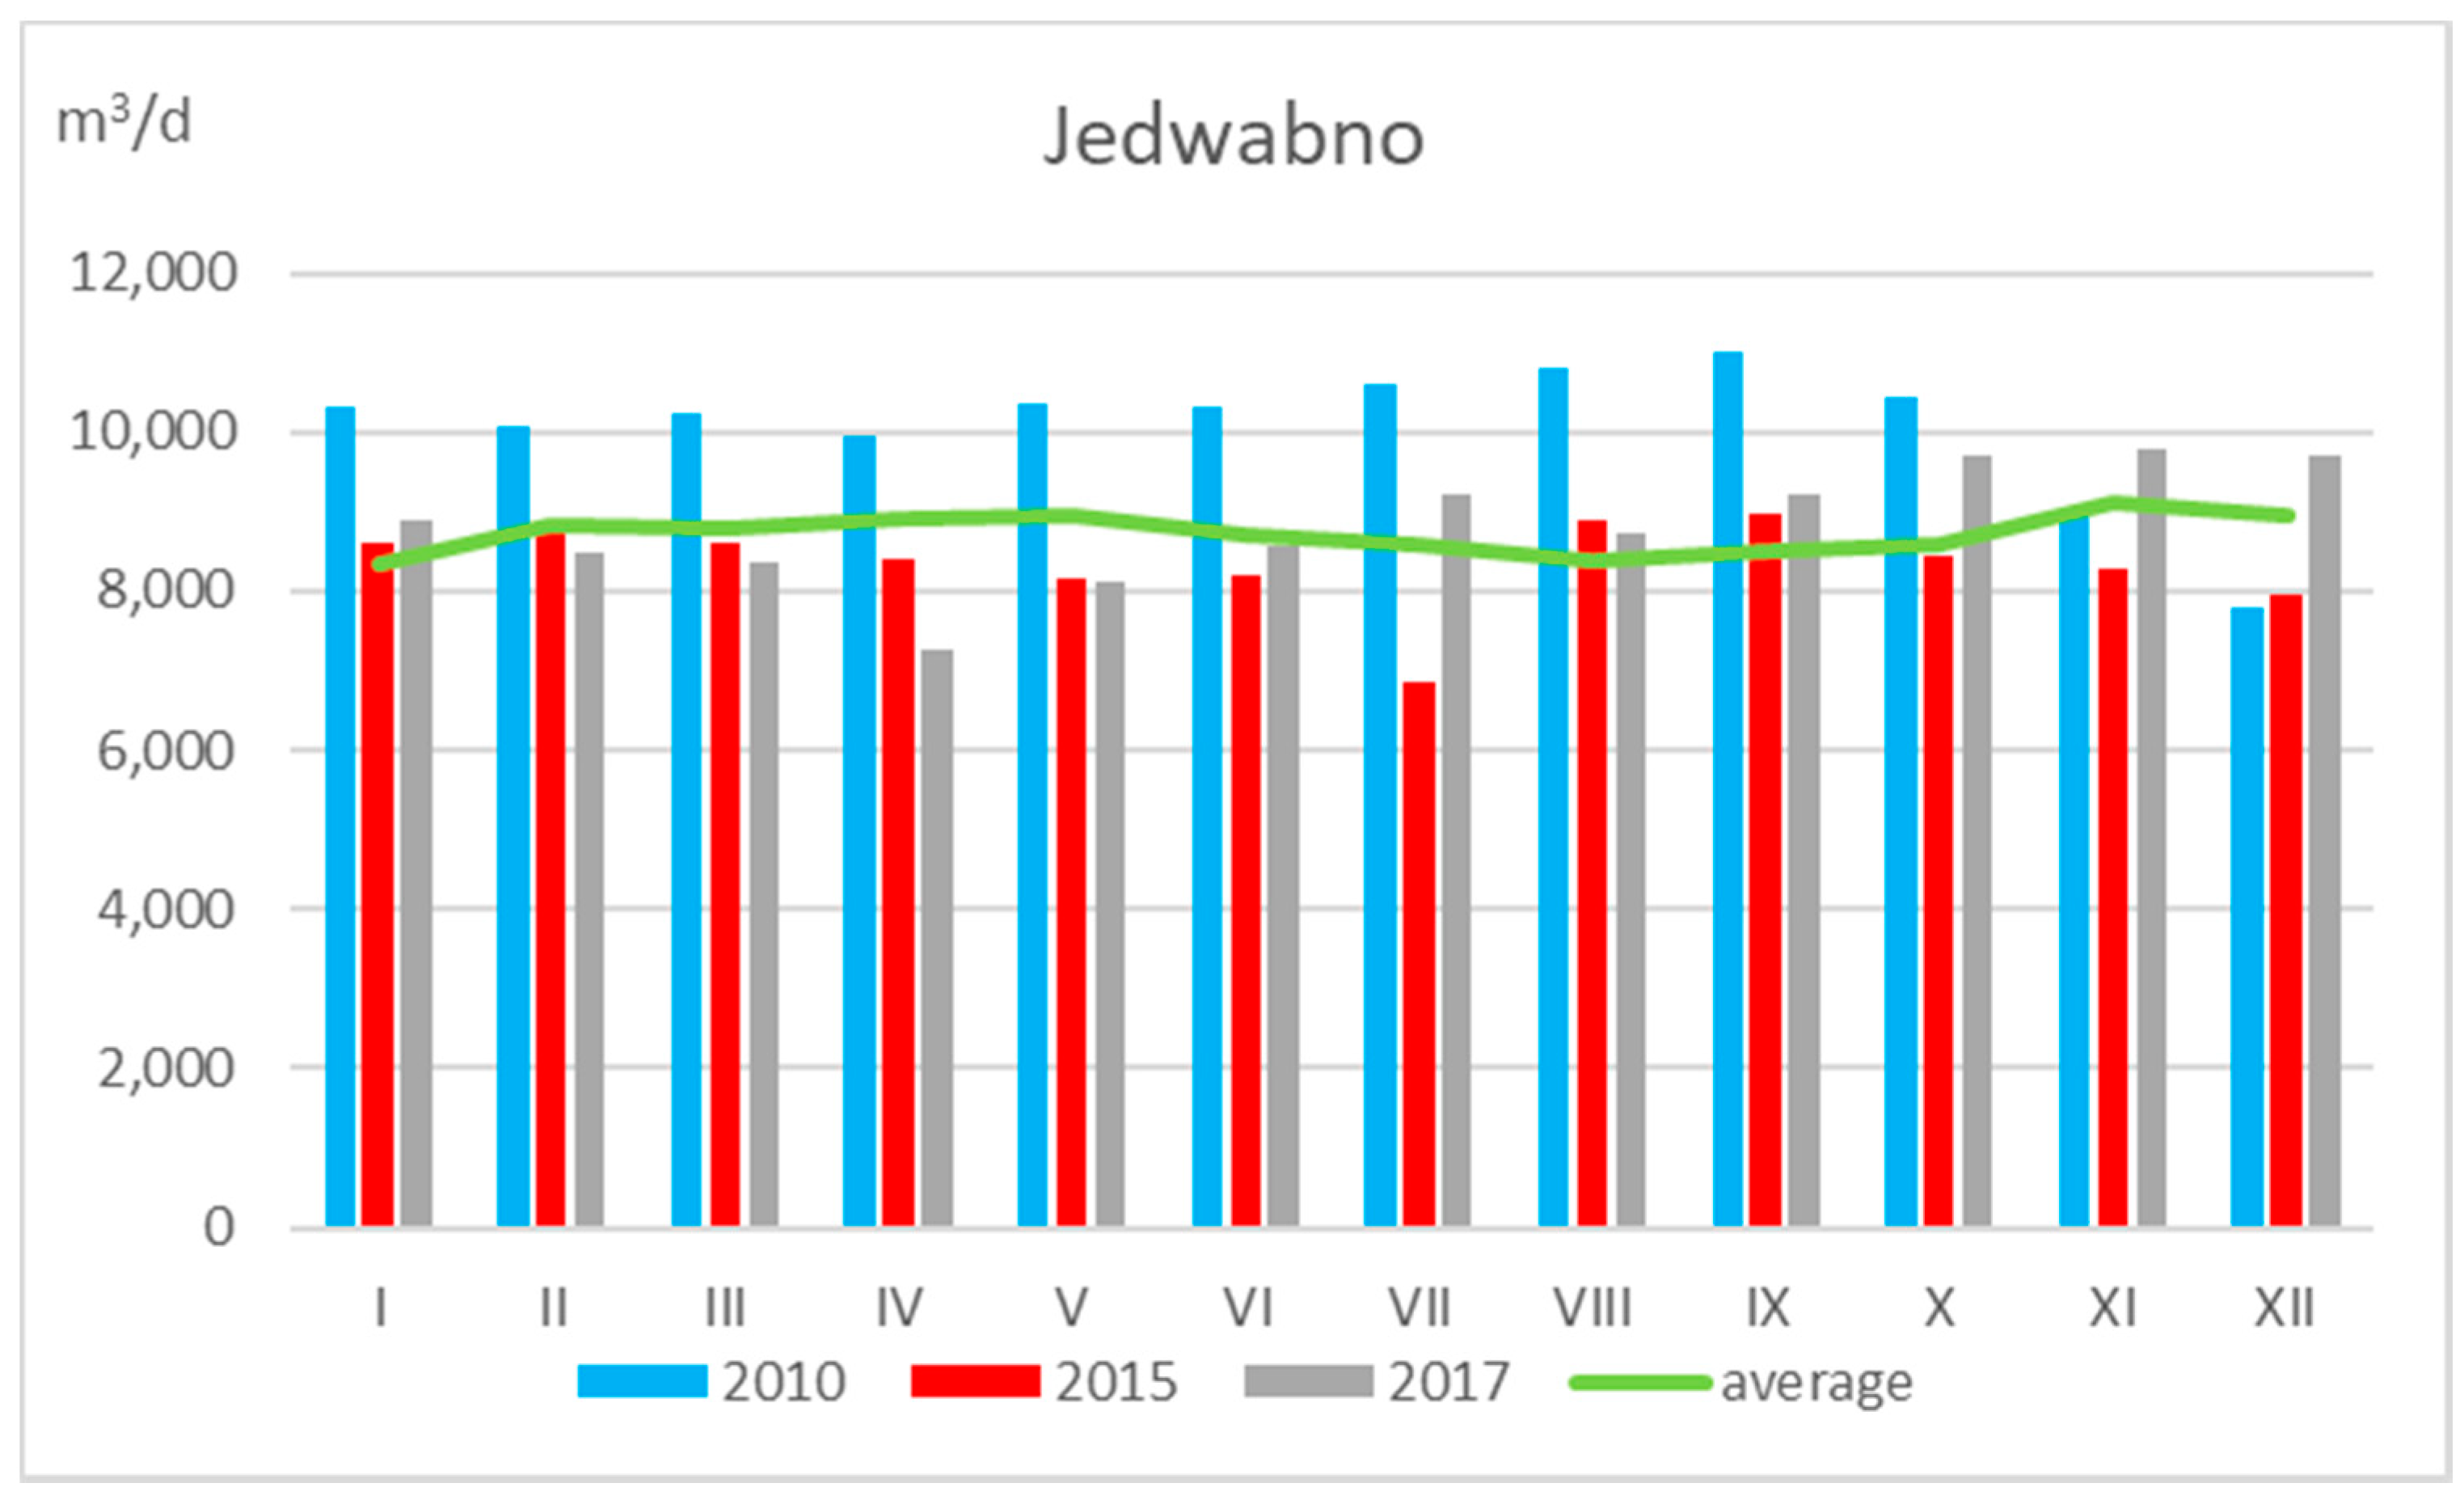
Figure 15.
The highest water table levels in piezometers in comparison with annual precipitation totals in the period 2008–2020.
Figure 15.
The highest water table levels in piezometers in comparison with annual precipitation totals in the period 2008–2020.
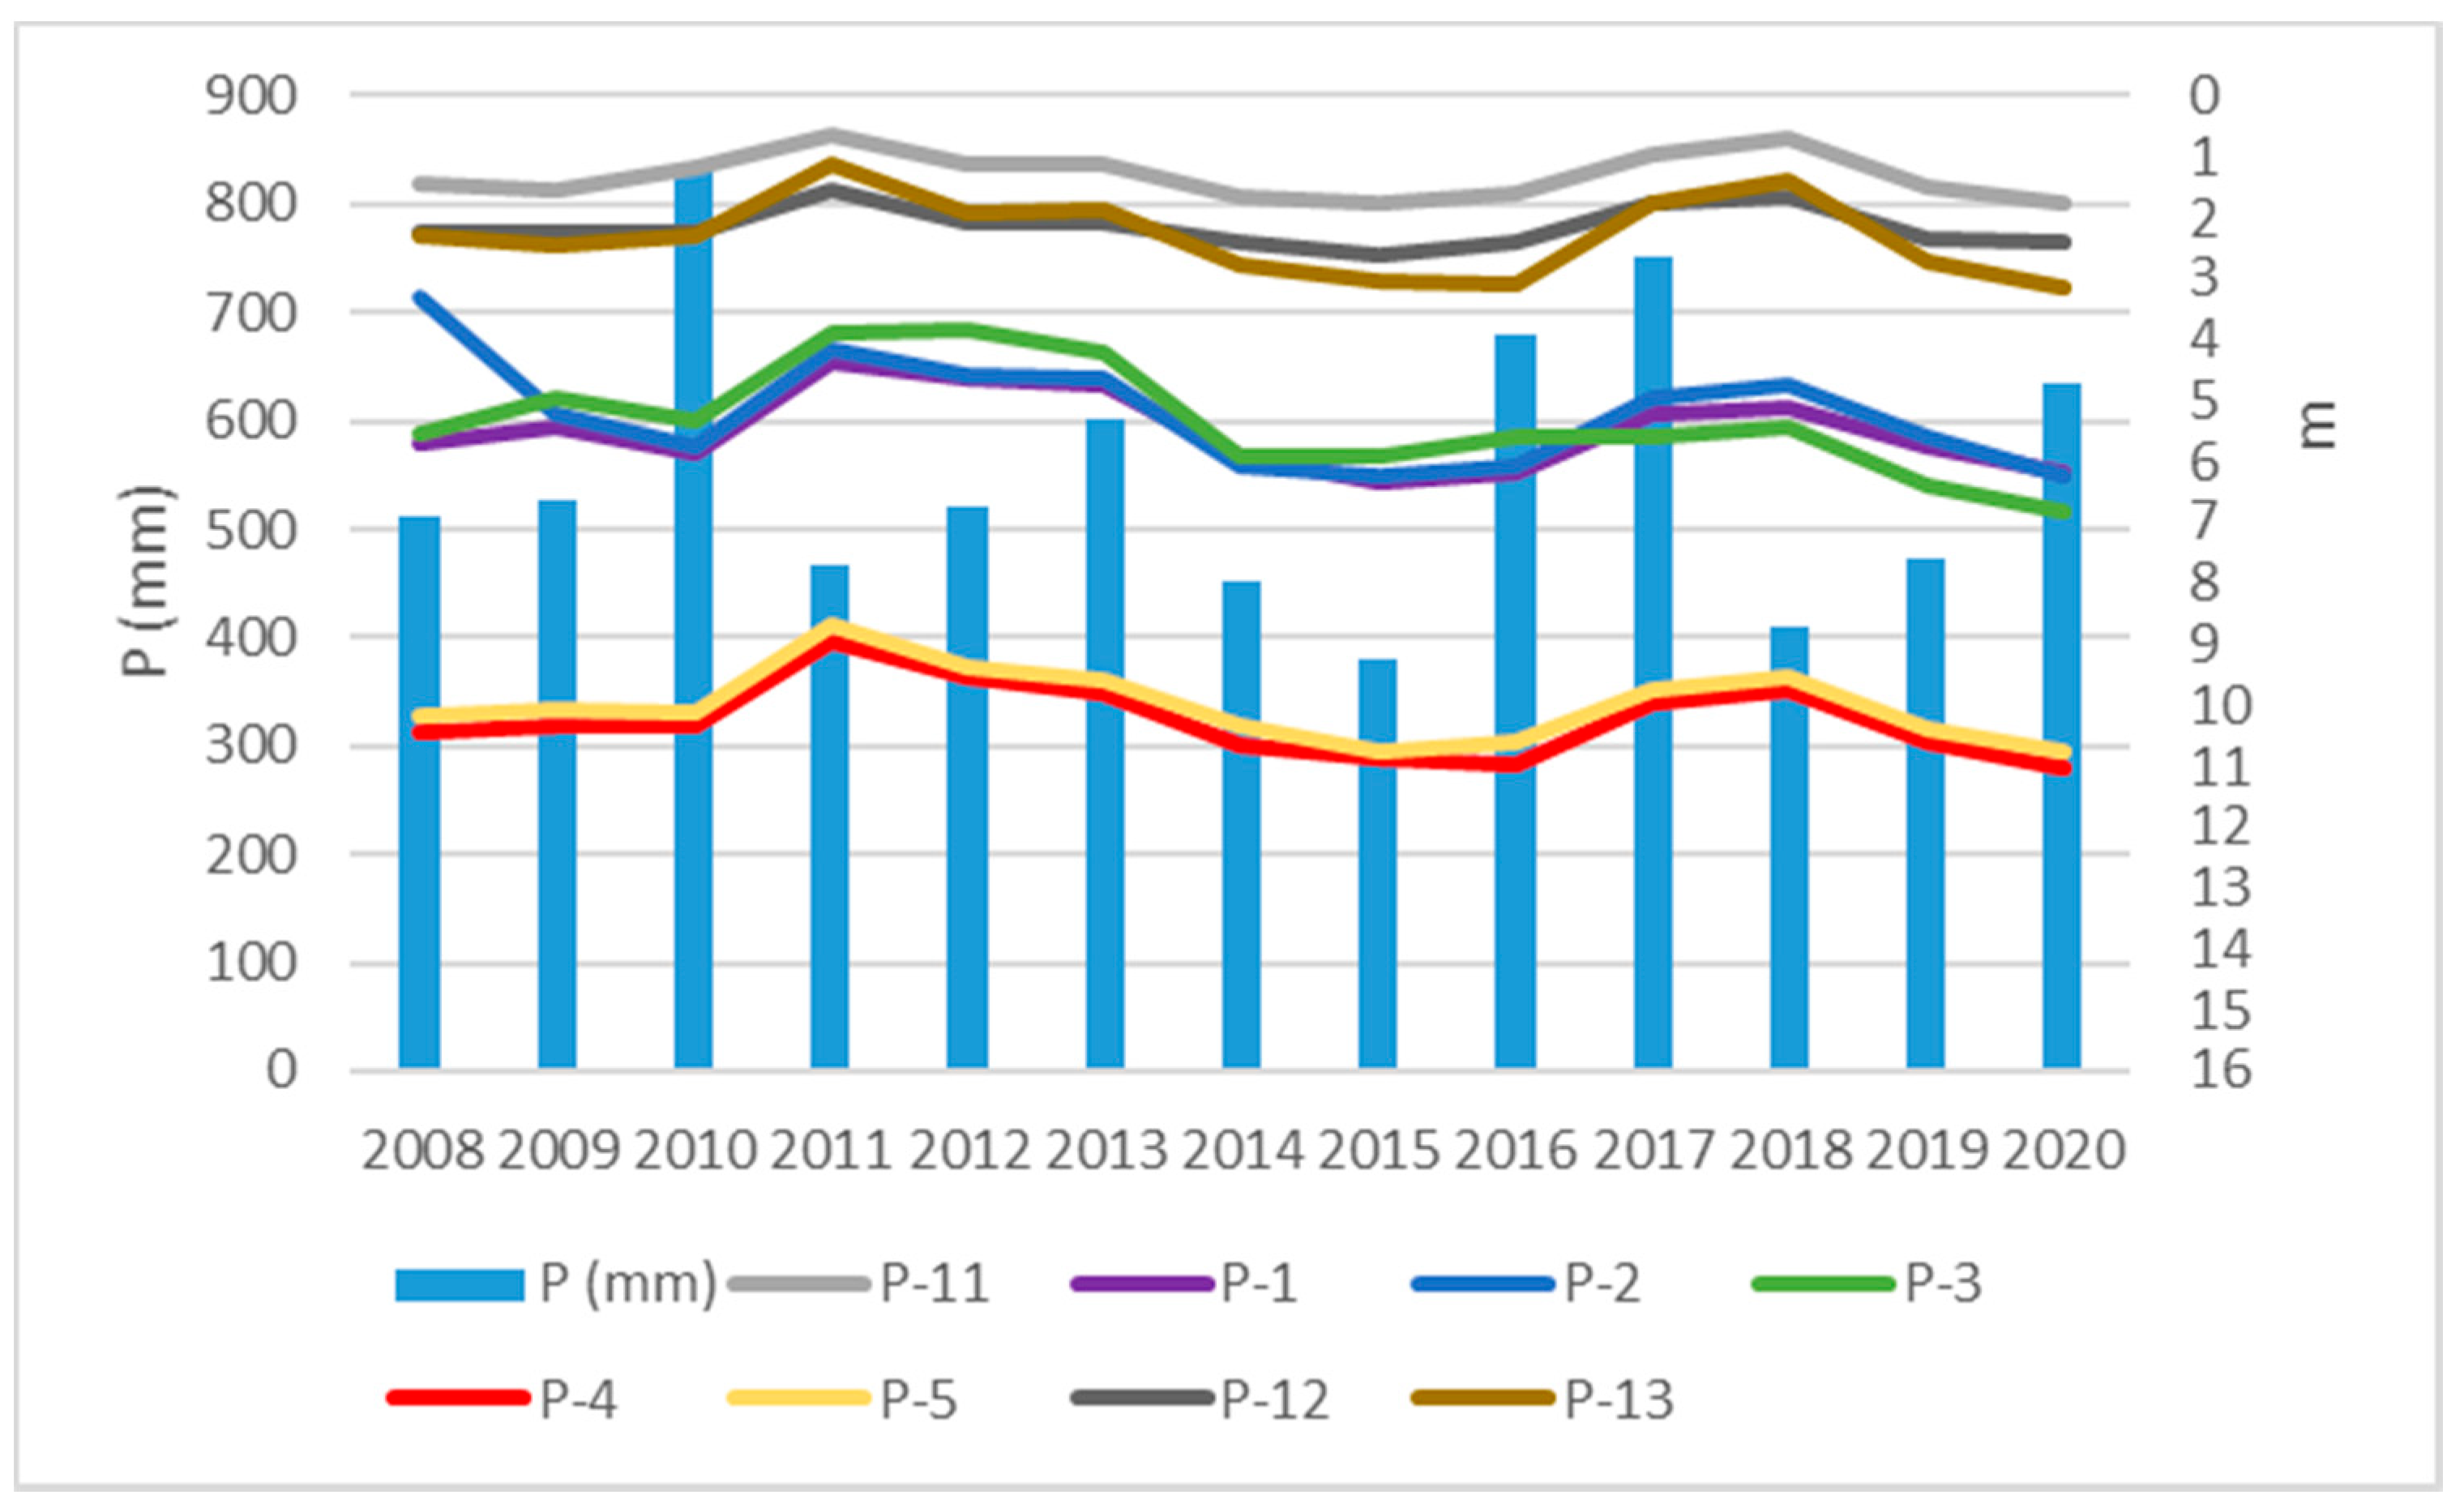
Figure 16.
The lowest position of water table in piezometers in comparison with precipitation totals in the period 2008–2020.
Figure 16.
The lowest position of water table in piezometers in comparison with precipitation totals in the period 2008–2020.

Table 1.
The categorization of the parameter of probability (P) (own study based on [49], modified by [48]).
| Probability | Frequency of Emergency (Emergency/Year) | Parameter Value |
|---|---|---|
| Very unlikely | <0.1 | 1 |
| Unlikely | 0.1–0.2 | 2 |
| Rather unlikely | 0.2–0.5 | 3 |
| Quite likely | 0.5–12.0 | 4 |
| Very Likely | >12.0 | 5 |
Table 2.
The categorization of the parameter of results (C) (own study based on [49], modified by [48]).
| Severity of Emergency Results | Parameter Value |
|---|---|
| Irrelevant—very little damage, local deterioration of water quality, no health hazard for the consumer | 1 |
| Low—little damage, discernible organoleptic changes in water quality (smell, color, turbidity), no health hazard for the consumer | 2 |
| Moderate—average damage, considerable organoleptic water nuisance (stench, color, turbidity), health hazard for the consumer | 3 |
| High—serious damage, possible exposure of a large group of consumers to the hazard of poor quality water consumption, grounds for emergency escalation, the likelihood of a domino effect | 4 |
| Disastrous—excessive damage, possible exposure of a large group of consumers to the hazard of poor quality water consumption, tests results revealing a high level of toxic substances, the necessity of hospital treatment for the exposed population | 5 |
Table 3.
The categorization of the parameter of vulnerability to emergency (V) (own study based on [49], modified by [48]).
| Probability | Time Period of the Water Runoff from the Pollution Hotspot to the Water Intake (Years) | Parameter Value |
|---|---|---|
| Very low | >25 | 1 |
| Low | 5–25 | 2 |
| Medium | 1–5 | 3 |
| High | 0.1–1 | 4 |
| Very high | <1 | 5 |
Table 4.
Statistical analysis of the meteorological data in Toruń for 1971–2020.
| Parameter | Trend/10 Year | S Mann–Kendall Statistics | Normalized Z Test Statistics | Trend |
|---|---|---|---|---|
| Toruń | ||||
| Precipitation (mm) | 7.95 | 59 | 0.485 | Nonsignificant |
| Temperature (°C) | 0.40 | 563 | 4.701 | Increasing |
| The number of days without any precipitation per year | 3.05 | 217 | 1.807 | Nonsignificant |
Calculations for significance at 0.05.
Table 5.
Statistical analysis of the hydrological data in Elgiszewo during 1971–2020.
| Parameter | Trend/10 Year | S Mann–Kendall Statistics | Normalized Z Test Statistics | Trend |
|---|---|---|---|---|
| Elgiszewo | ||||
| Discharge average (m3/s) | −2.45 | −451 | −3.764 | Decreasing |
| Discharge maximum (m3/s) | −4.51 | −258 | −2.150 | Decreasing |
| Discharge minimum (m3/s) | −1.66 | −556 | −4.642 | Decreasing |
Calculations for significance at 0.05.
Table 6.
The range of water table fluctuations in observation holes at the Jedwabno intake in the period 2008–2020.
Table 6.
The range of water table fluctuations in observation holes at the Jedwabno intake in the period 2008–2020.
| Piezometer | Minimum Depth to Water Table (Depth below Ground Level (m)) | Year | Maximum Depth to Water Table (Depth below Ground Level (m)) | Year | Range of Fluctuations 2008–2020 |
|---|---|---|---|---|---|
| P-11 | 0.63 | 2011 | 2.73 | 2019 | 2.10 |
| P-1 | 4.36 | 2011 | 7.26 | 2020 | 2.90 |
| P-2 | 3.28 | 2008 | 7.38 | 2020 | 4.10 |
| P-3 | 3.82 | 2012 | 8.08 | 2020 | 4.26 |
| P-4 | 8.96 | 2011 | 4.29 | 2019 | 5.33 |
| P-5 | 8.71 | 2011 | 14.08 | 2019 | 5.37 |
| P-12 | 1.54 | 2011 | 4.51 | 2019 | 2.97 |
| P-13 | 1.12 | 2011 | 4.06 | 2020 | 2.94 |
Table 7.
Risk assessment for the infiltration intake in Jedwabno.
| Potential Groundwater Hazards | Variant Adopted | Risk Assessment Parameters | Risk Indicator Value | Risk Assessment | ||
|---|---|---|---|---|---|---|
| P | C | V | ||||
| Municipal and district roads | W1 | 1 | 1 | 2 | 2 | Acceptable |
| W2 | 2 | 2 | 3 | 12 | Acceptable | |
| Drwęca River | W1 | 3 | 3 | 4 | 36 | Controlled |
| W2 | 5 | 4 | 5 | 100 | Unacceptable | |
| Arable lands | W1 | 2 | 1 | 2 | 4 | Acceptable |
| W2 | 3 | 2 | 3 | 18 | Acceptable | |
| Dispersed urban development (Jedwabno) | W1 | 2 | 1 | 1 | 2 | Acceptable |
| W2 | 3 | 2 | 2 | 12 | Acceptable | |
| Opencast mining area (fine aggregates) | W1 | 2 | 2 | 2 | 8 | Acceptable |
| W2 | 4 | 3 | 3 | 36 | Controlled | |
Table 8.
The categorization of the extreme events probability parameter.
| Probability | Number of Emergency Events | Frequency of Emergency (Emergency Events/Observation Years) | Parameter Value |
|---|---|---|---|
| Very unlikely | 0–10 | <0.2 | 1 |
| Unlikely | 10–50 | 0.2–1.0 | 2 |
| Rather unlikely | 50–90 | 1.0–2.0 | 3 |
| Quite likely | 90–211 | 2.0–4.0 | 4 |
| Very Likely | >211 | >4.0 | 5 |
Publisher’s Note: MDPI stays neutral with regard to jurisdictional claims in published maps and institutional affiliations. |
© 2021 by the authors. Licensee MDPI, Basel, Switzerland. This article is an open access article distributed under the terms and conditions of the Creative Commons Attribution (CC BY) license (https://creativecommons.org/licenses/by/4.0/).
Share and Cite
MDPI and ACS Style
Kubiak-Wójcicka, K.; Jamorska, I.; Górski, Ł. The Identification of Risks for Drinking Water Intakes in Urbanized Area: The Case Study of Toruń (Central Poland). Water 2021, 13, 3378. https://doi.org/10.3390/w13233378
AMA Style
Kubiak-Wójcicka K, Jamorska I, Górski Ł. The Identification of Risks for Drinking Water Intakes in Urbanized Area: The Case Study of Toruń (Central Poland). Water. 2021; 13(23):3378. https://doi.org/10.3390/w13233378
Chicago/Turabian StyleKubiak-Wójcicka, Katarzyna, Izabela Jamorska, and Łukasz Górski. 2021. "The Identification of Risks for Drinking Water Intakes in Urbanized Area: The Case Study of Toruń (Central Poland)" Water 13, no. 23: 3378. https://doi.org/10.3390/w13233378
Note that from the first issue of 2016, this journal uses article numbers instead of page numbers. See further details here.