1. Introduction
Flood-related events have been the most frequent natural hazard disaster type between 2000–2019, incurring the largest average annualized losses at a global scale compared with any other natural hazard [
1,
2,
3,
4]. Soft adaptation approaches such as early warnings systems are considered effective tools that enhance the safety and resilience of people to the impacts of flood events (e.g., [
5,
6,
7,
8]). Indeed, it has become widely accepted that real-time monitoring and early warnings systems provide necessary information tools that enable people living in exposed areas to respond accordingly in order to minimize potential injuries, loss of life and/or livelihoods (e.g., [
9,
10,
11]).
Flash flooding in particular poses significant early warning challenges due to short catchment response times of <2–3 h compared with the time required for making informed decisions on emergency response and resourcing e.g., [
12,
13]. These challenges are exacerbated in ungauged catchments where people, lifelines and infrastructure are exposed e.g., [
13]. While much progress has been made in weather forecasting over the last few decades [
12], challenges remain in forecasting flash floods which are influenced by a combination of geomorphic, hydrological, soil moisture capacity and antecedent trigger conditions [
14,
15,
16].
In the Pacific Small Islands Developing States (SIDS) region, weather forecasting and early warning systems (EWS) have typically taken a hazard-centric approach in terms of tracking, estimating and alerting affected people of what a specific event ‘might be’ in terms of magnitude and extent (with several hours to days lead time). Over the last decade, however, Pacific SIDS are increasingly integrating impacts-based approaches into EWSs (i.e., what a specific weather event ‘might do’ in terms of exposure and losses) [
16]. These shifts reflect responses by Pacific SIDS in delivering on global and regional framework targets such as the 2015–2030 Sendai Framework targets [
17], and the Framework for Resilient Development in the Pacific [
18].
Extreme rainfall-induced fluvial and pluvial flooding are an annual risk faced by many populated centres in high volcanic islands across the tropical Pacific SIDS region (e.g., [
19]). Many catchments in these settings are typically characterized as short and steep, with rapid critical rainfall to flood peak durations. This results in extremely limited observations-based (or nowcast) early warnings and response lead times, and motivates the shortening of alerting lead times through the incorporation of forecast-based techniques. For example, the Vaisigano River catchment in Samoa, has an extreme critical peak duration of approximately 1-h resulting in very short warnings and response lead times.
In this paper, we present a case study of a pilot impacts-based flood early warning decision support system developed for the Vaisigano River which flows through the Samoan capital of Apia. The aim of the pilot was to implement a context-specific, real-time, automated river monitoring and forecast-based flood early warnings decision support system capable of alerting hazard monitoring and emergency responders of imminent flooding with up to 24–48 h lead time. We describe the methods and analysis used in the development of different system components, including a web-based information portal which enables interaction with the decision support information tools. We discuss the practical implications of the developed system based on operational testing during the 2020/2021 tropical cyclone season in Samoa, with recommendations offered for future research.
2. The Vaisigano Catchment
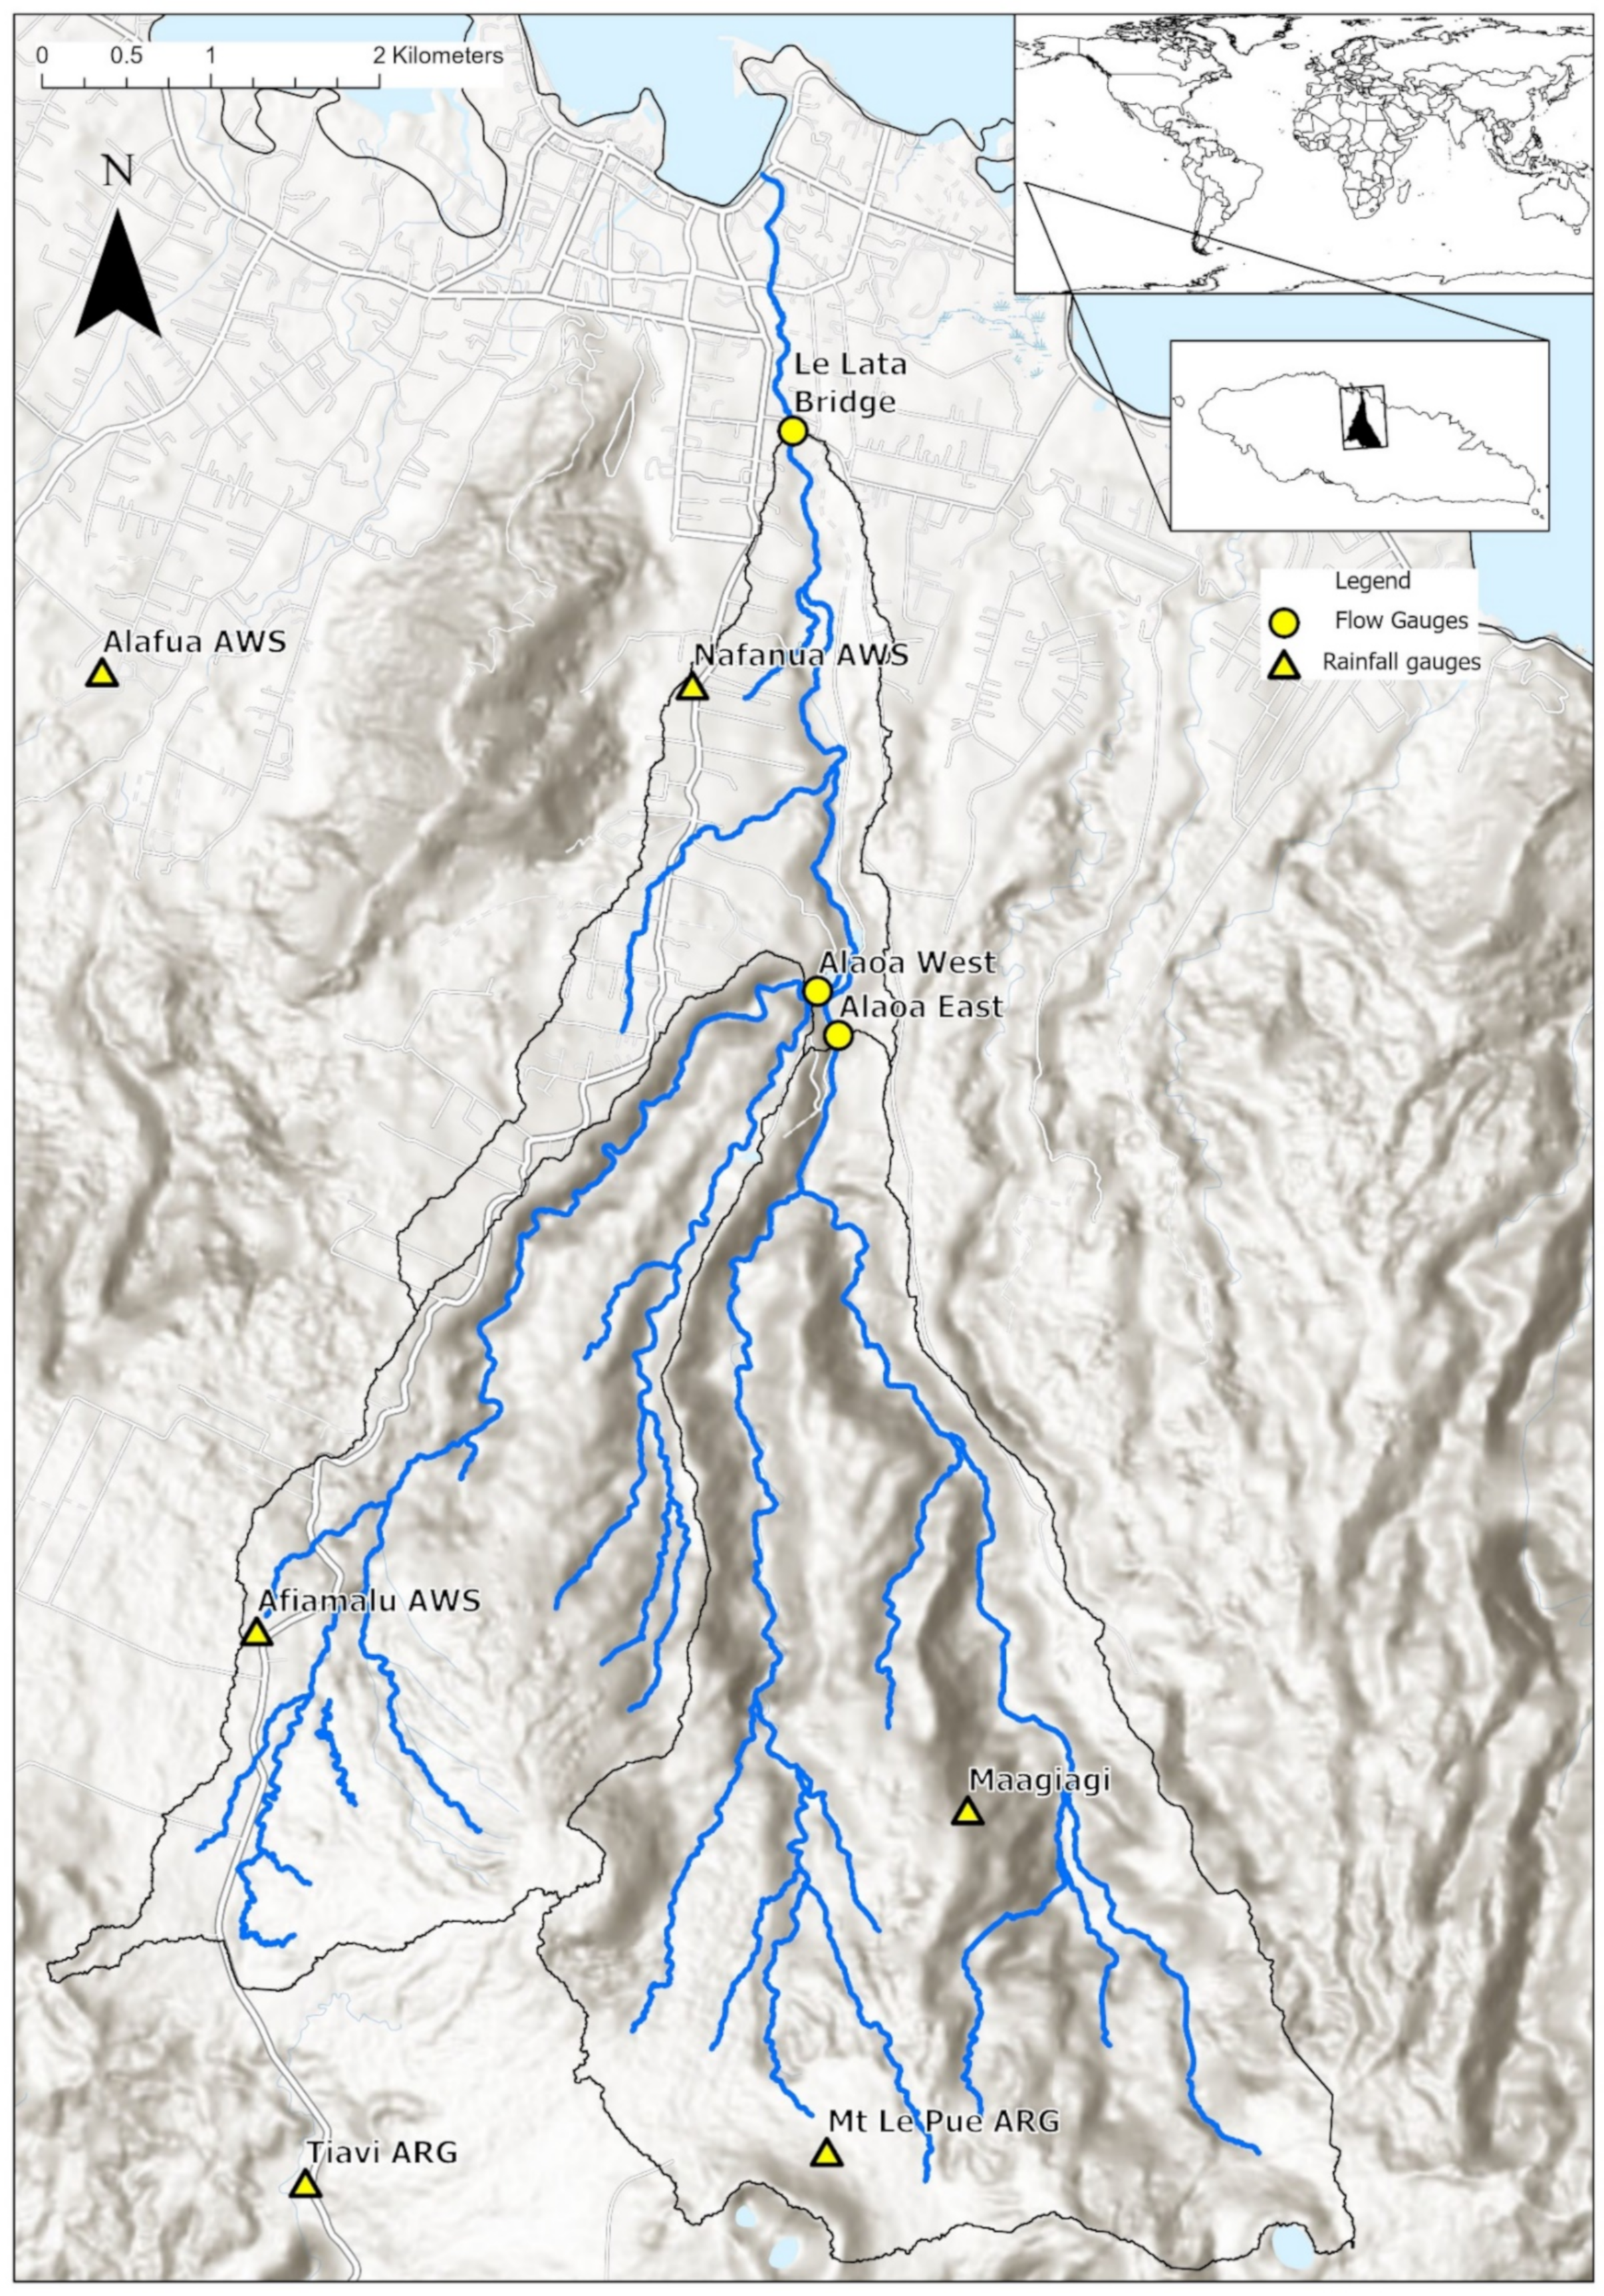
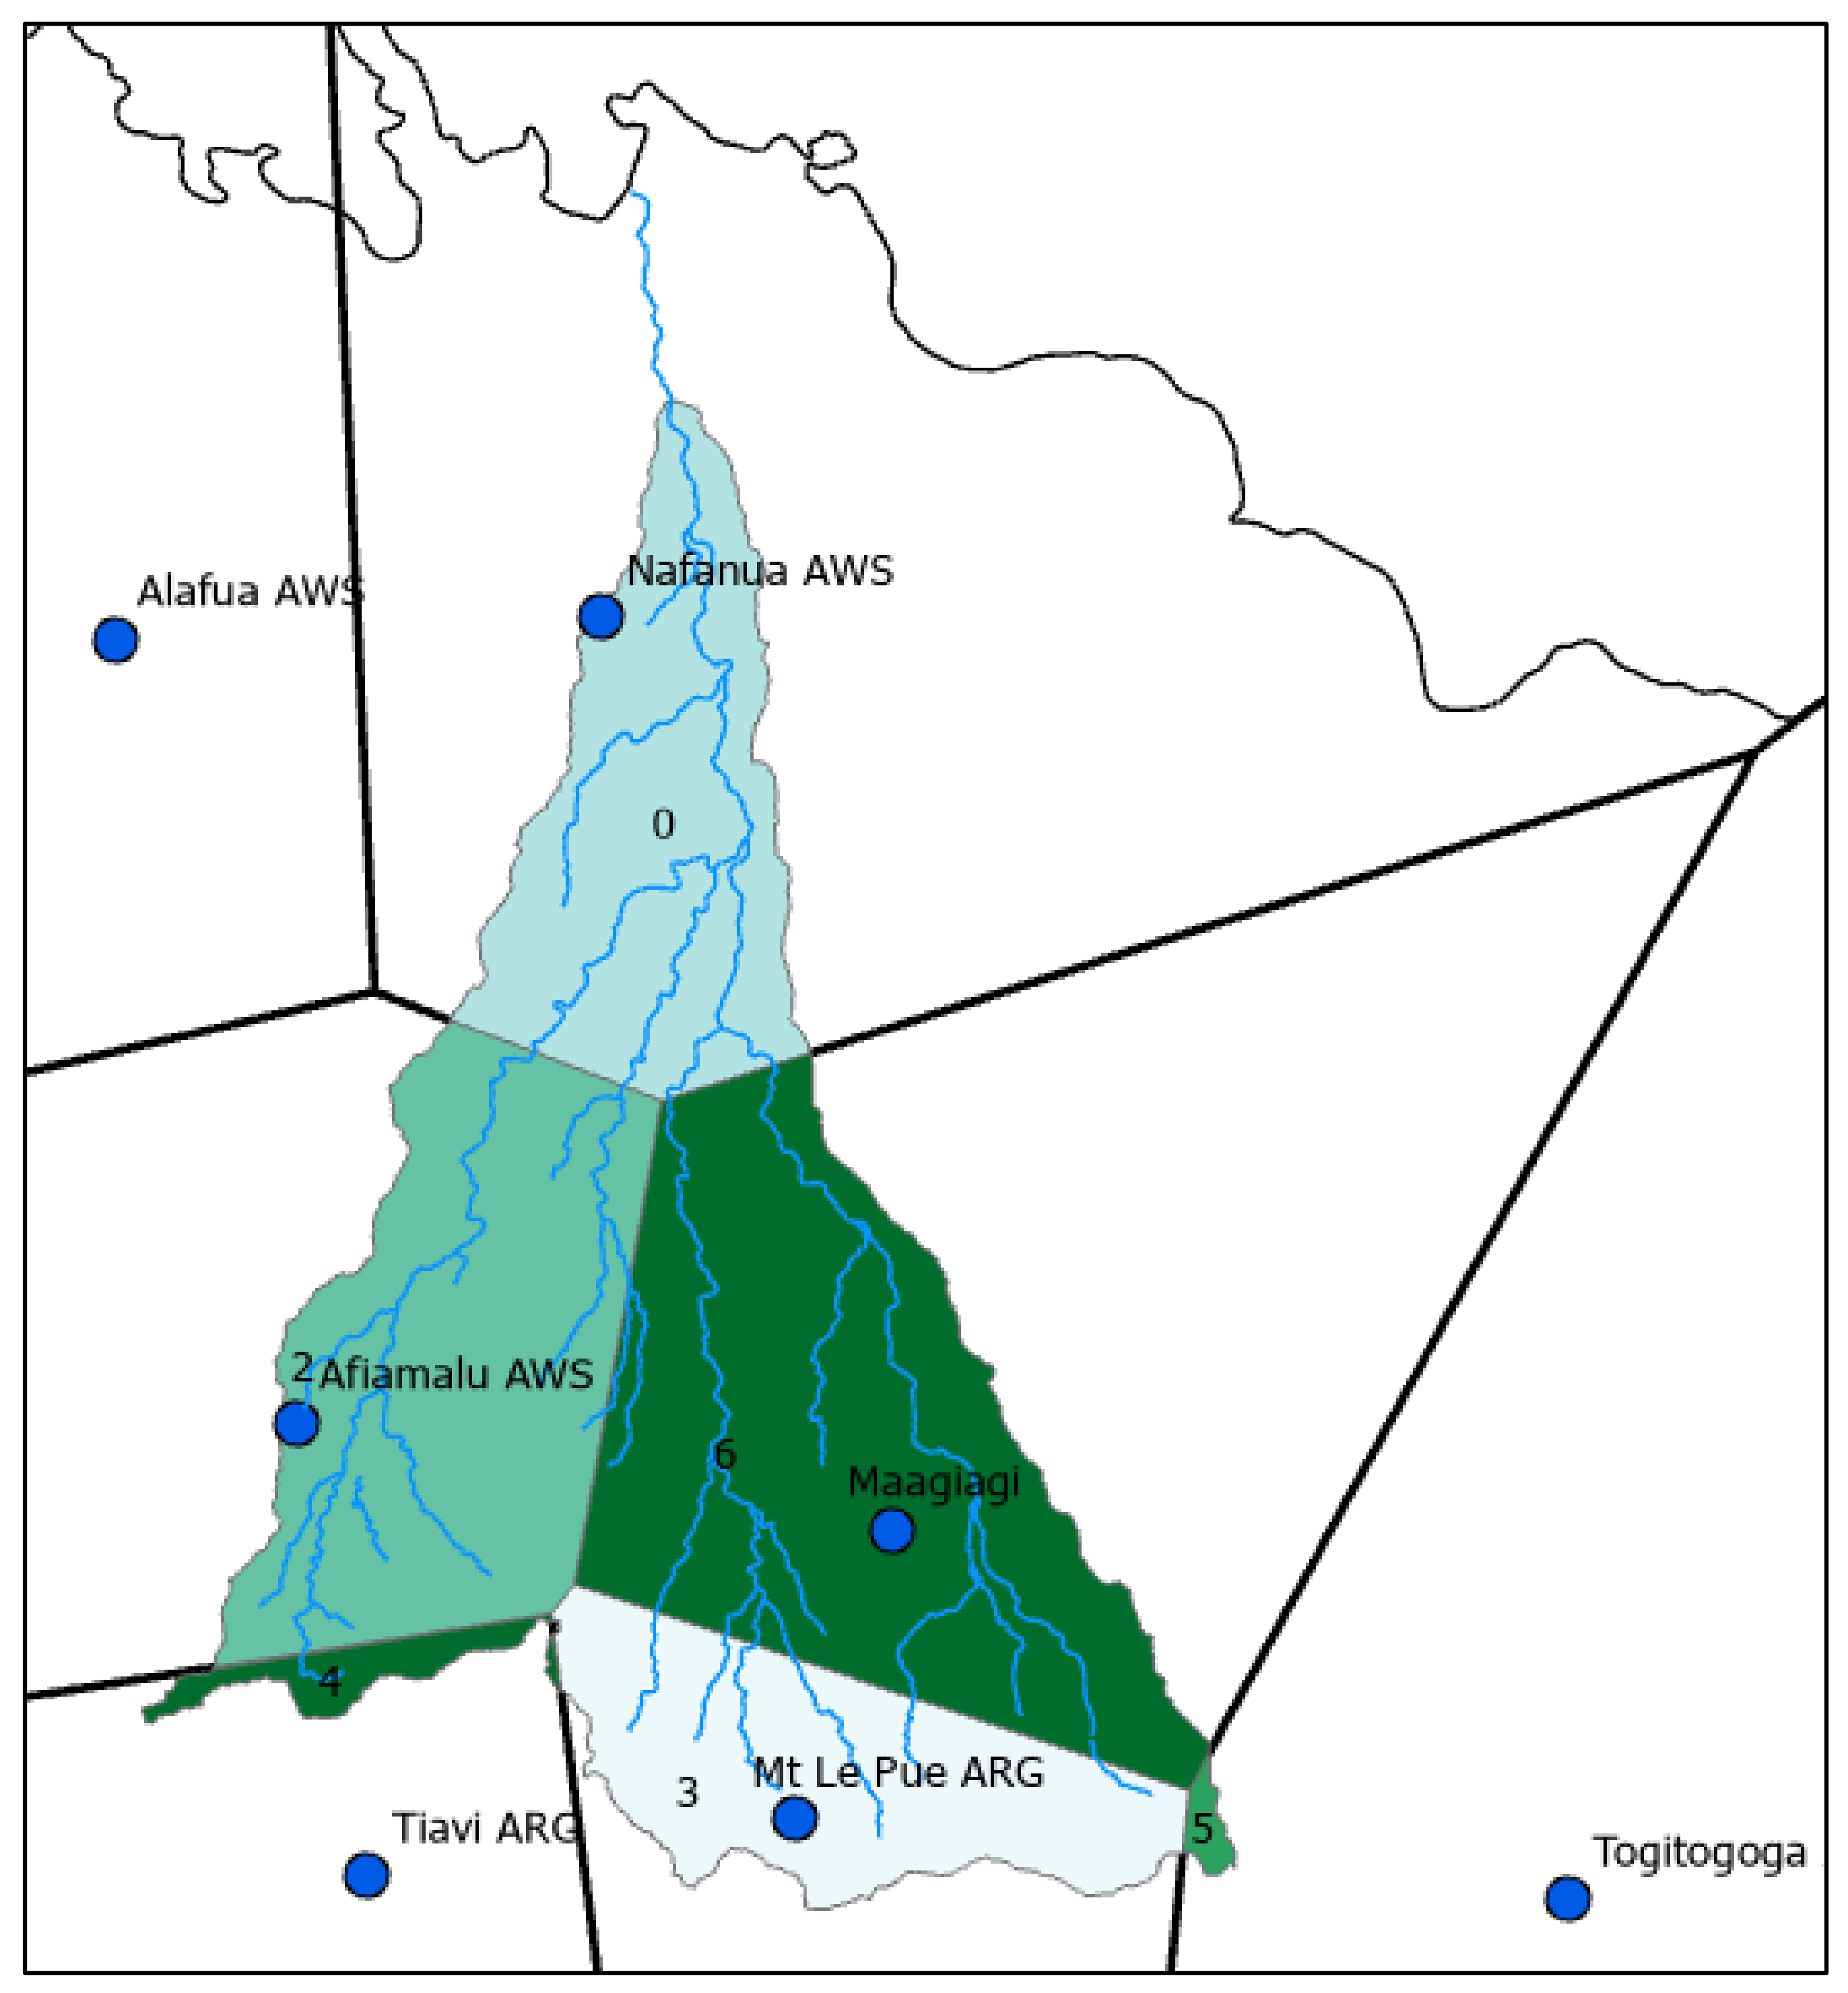
The Vaisigano catchment is located in the central north of Upolu Island and is characterized by a short, steep, funnel-shaped drainage morphology covering an area of approximately 33 km
2 [
20] (
Figure 1). The catchment extends approximately 12 km from sea level to an elevation of 1158 m along Upolu’s volcanic spine [
20,
21]. The catchment comprises three main tributaries that converge into a single channel at the Alaoa confluence approximately 4.5 km from the coastline, exiting at the Vaisigano bridge in Apia (
Figure 1). It is worth noting that Apia itself is generally less than 1 m above mean sea level and was developed in a deltaic/wetland environment which multiple rivers east and west of the catchment drain through.
The average annual rainfall in the catchment is between 3000–6000 mm, with about 70% occurring during the wet or tropical cyclone season from November to April. There is an approximate 1500 mm difference between annual rainfall in the upper reaches of the catchment (e.g., Afiamalu), compared with the lower plains (e.g., Nafanua).
Morphological drainage characteristics of the catchment favour rapid-rising floods during periods of intense rainfall, with rapid critical storm peak durations of approximately 1 h which can activate ephemeral stream channels in the wider floodplain [
22,
23]. This will be particularly exacerbated by ongoing climate change where rainfall intensities are estimated to be more severe in the Samoa region by the year 2100 [
24].
Urban growth accompanied by residential and commercial development in the floodplains over the last century have rendered a significant proportion of infrastructure and up to several thousand people exposed to the potential impacts of flooding. Indeed, this was demonstrated by several flood events which occurred this millennium: the 2001 [
21], 2012 [
25], and 2018 [
26] flood events. Up to 14 people lost their lives in the 2012 event, with up to US
$204 million in damage and losses [
27]. The 2012 disaster triggered significant national investment in hard and soft adaptation measures aimed at enhancing the safety and resilience of assets within the catchment, and minimize the impacts of future events in the light of changing climate (e.g., [
27,
28]). A key soft adaptation investment was to enhance real-time river monitoring and early warnings systems which can support emergency decisions in response to imminent flooding with sufficient lead time.
3. System Development: Methodologies and Analysis
The combined physical and exposure characteristics of the Vaisigano catchment results in short flood early warnings response lead times using observation-based monitoring (or nowcasting) systems only. Hence, the incorporation of a real-time forecast-based solution was required to enable longer lead times. In addition, the inclusion of accurate precomputed hazard exposure representations depicting the likely magnitude and extent of forecast flooding as well as areas/assets that could be affected, would provide necessary response planning tools that enable prioritization of emergency resources (including the identification of potential recovery needs).
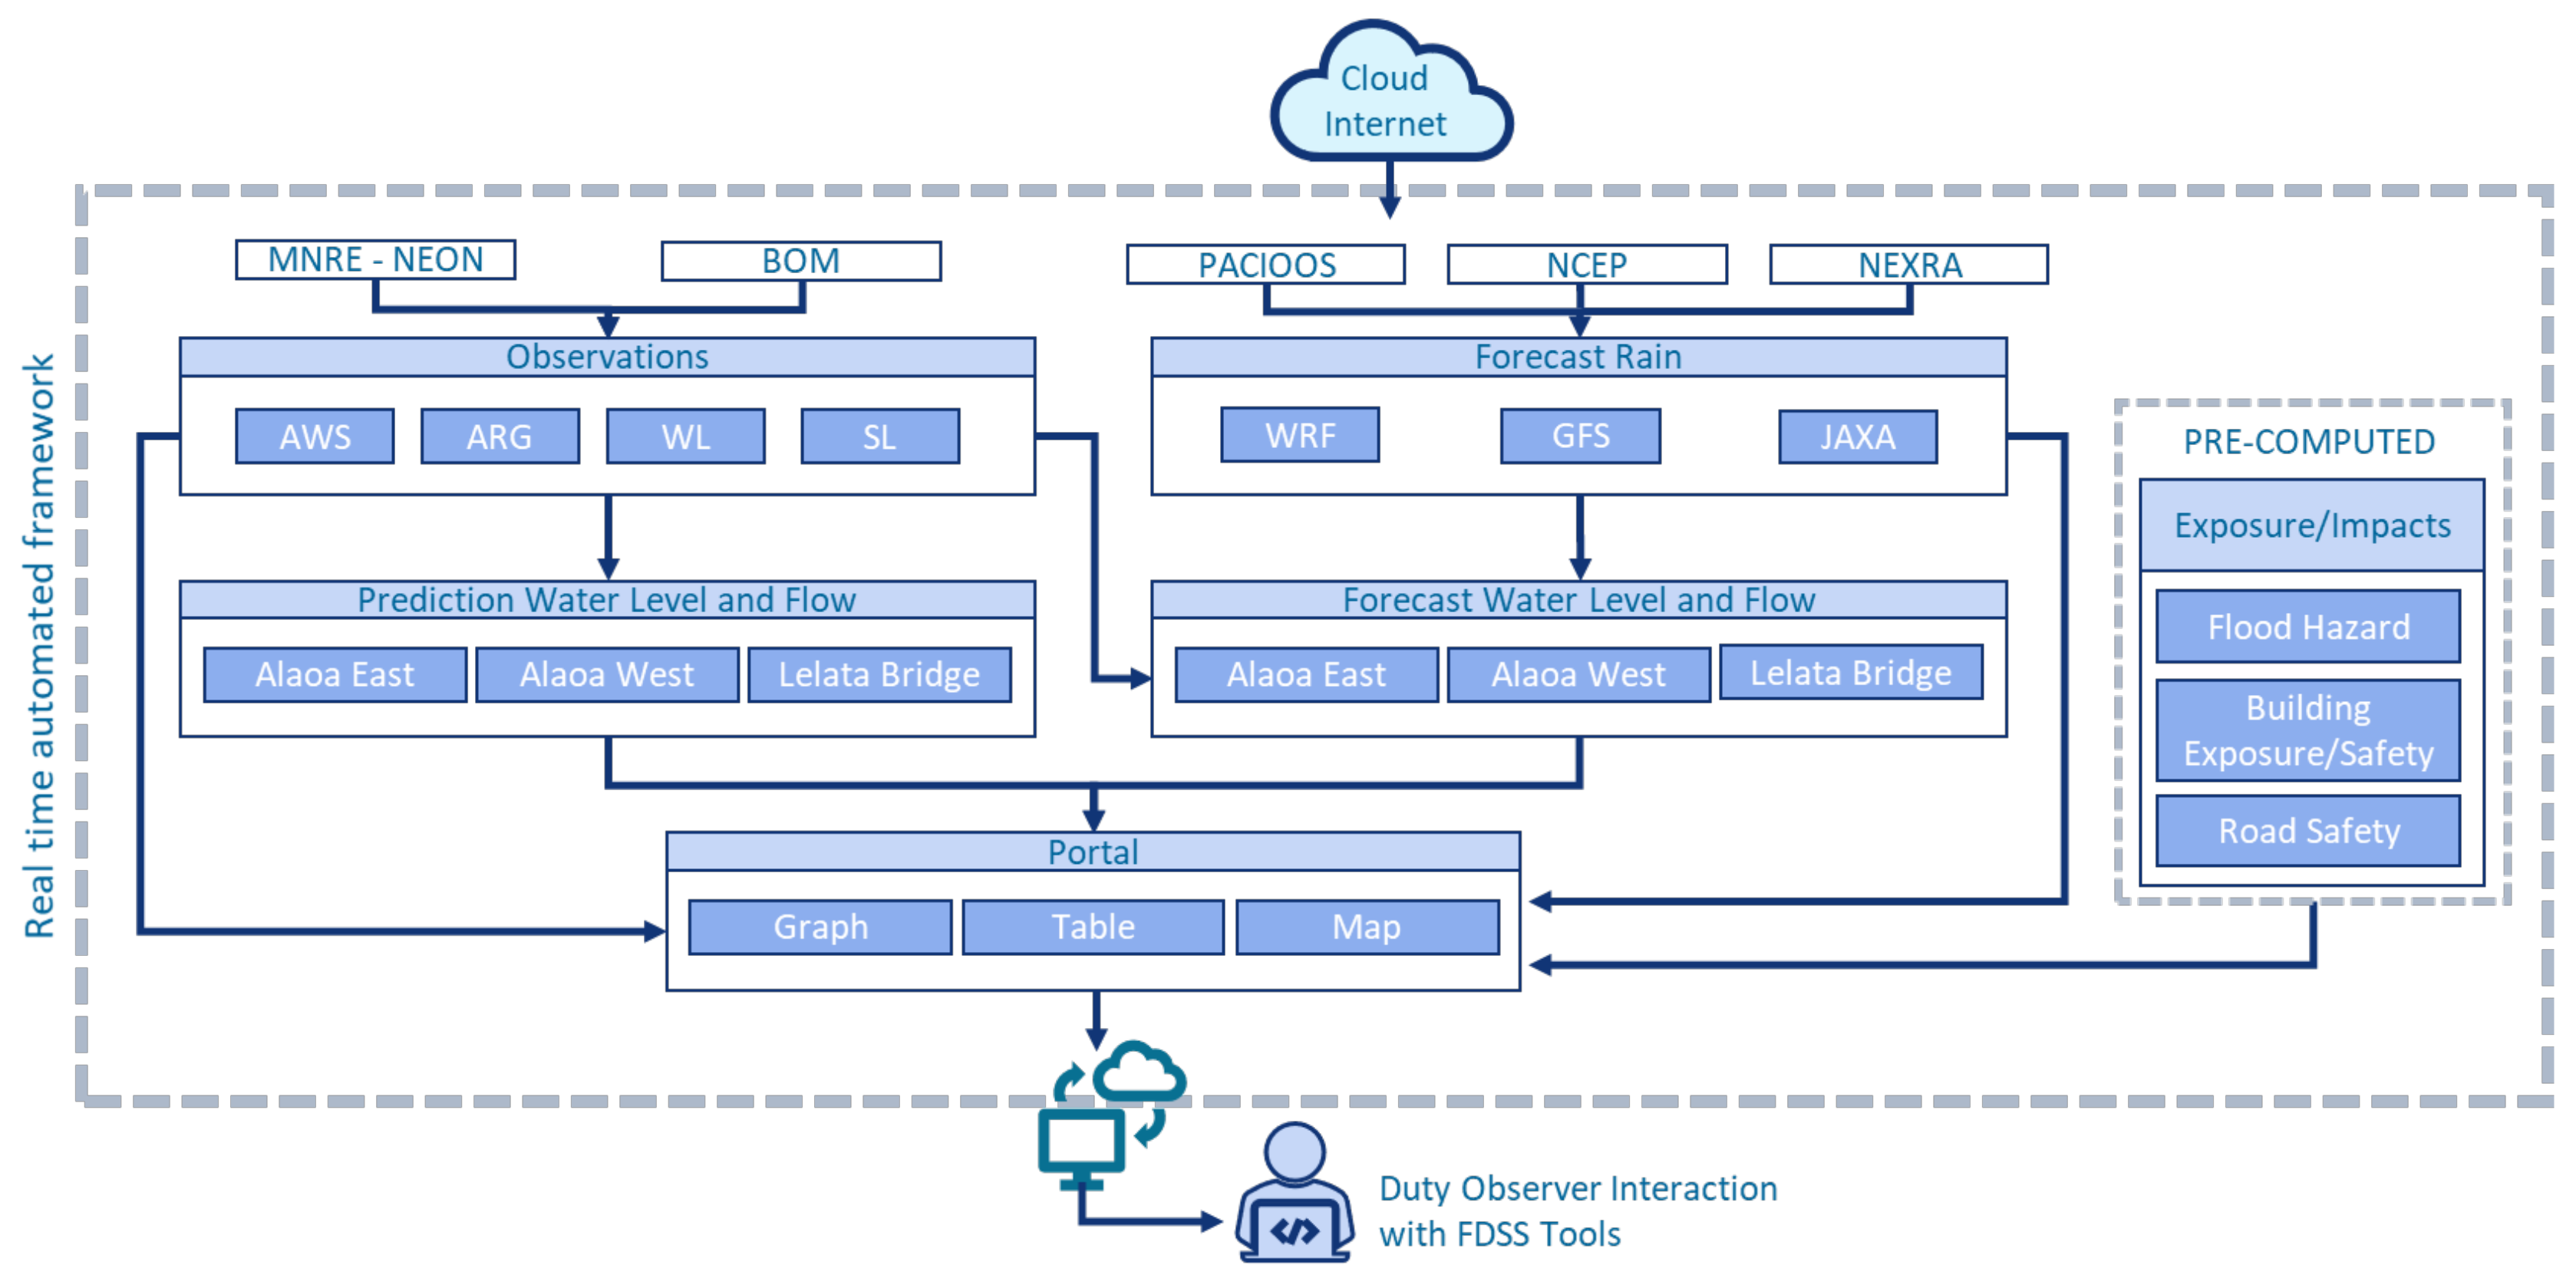
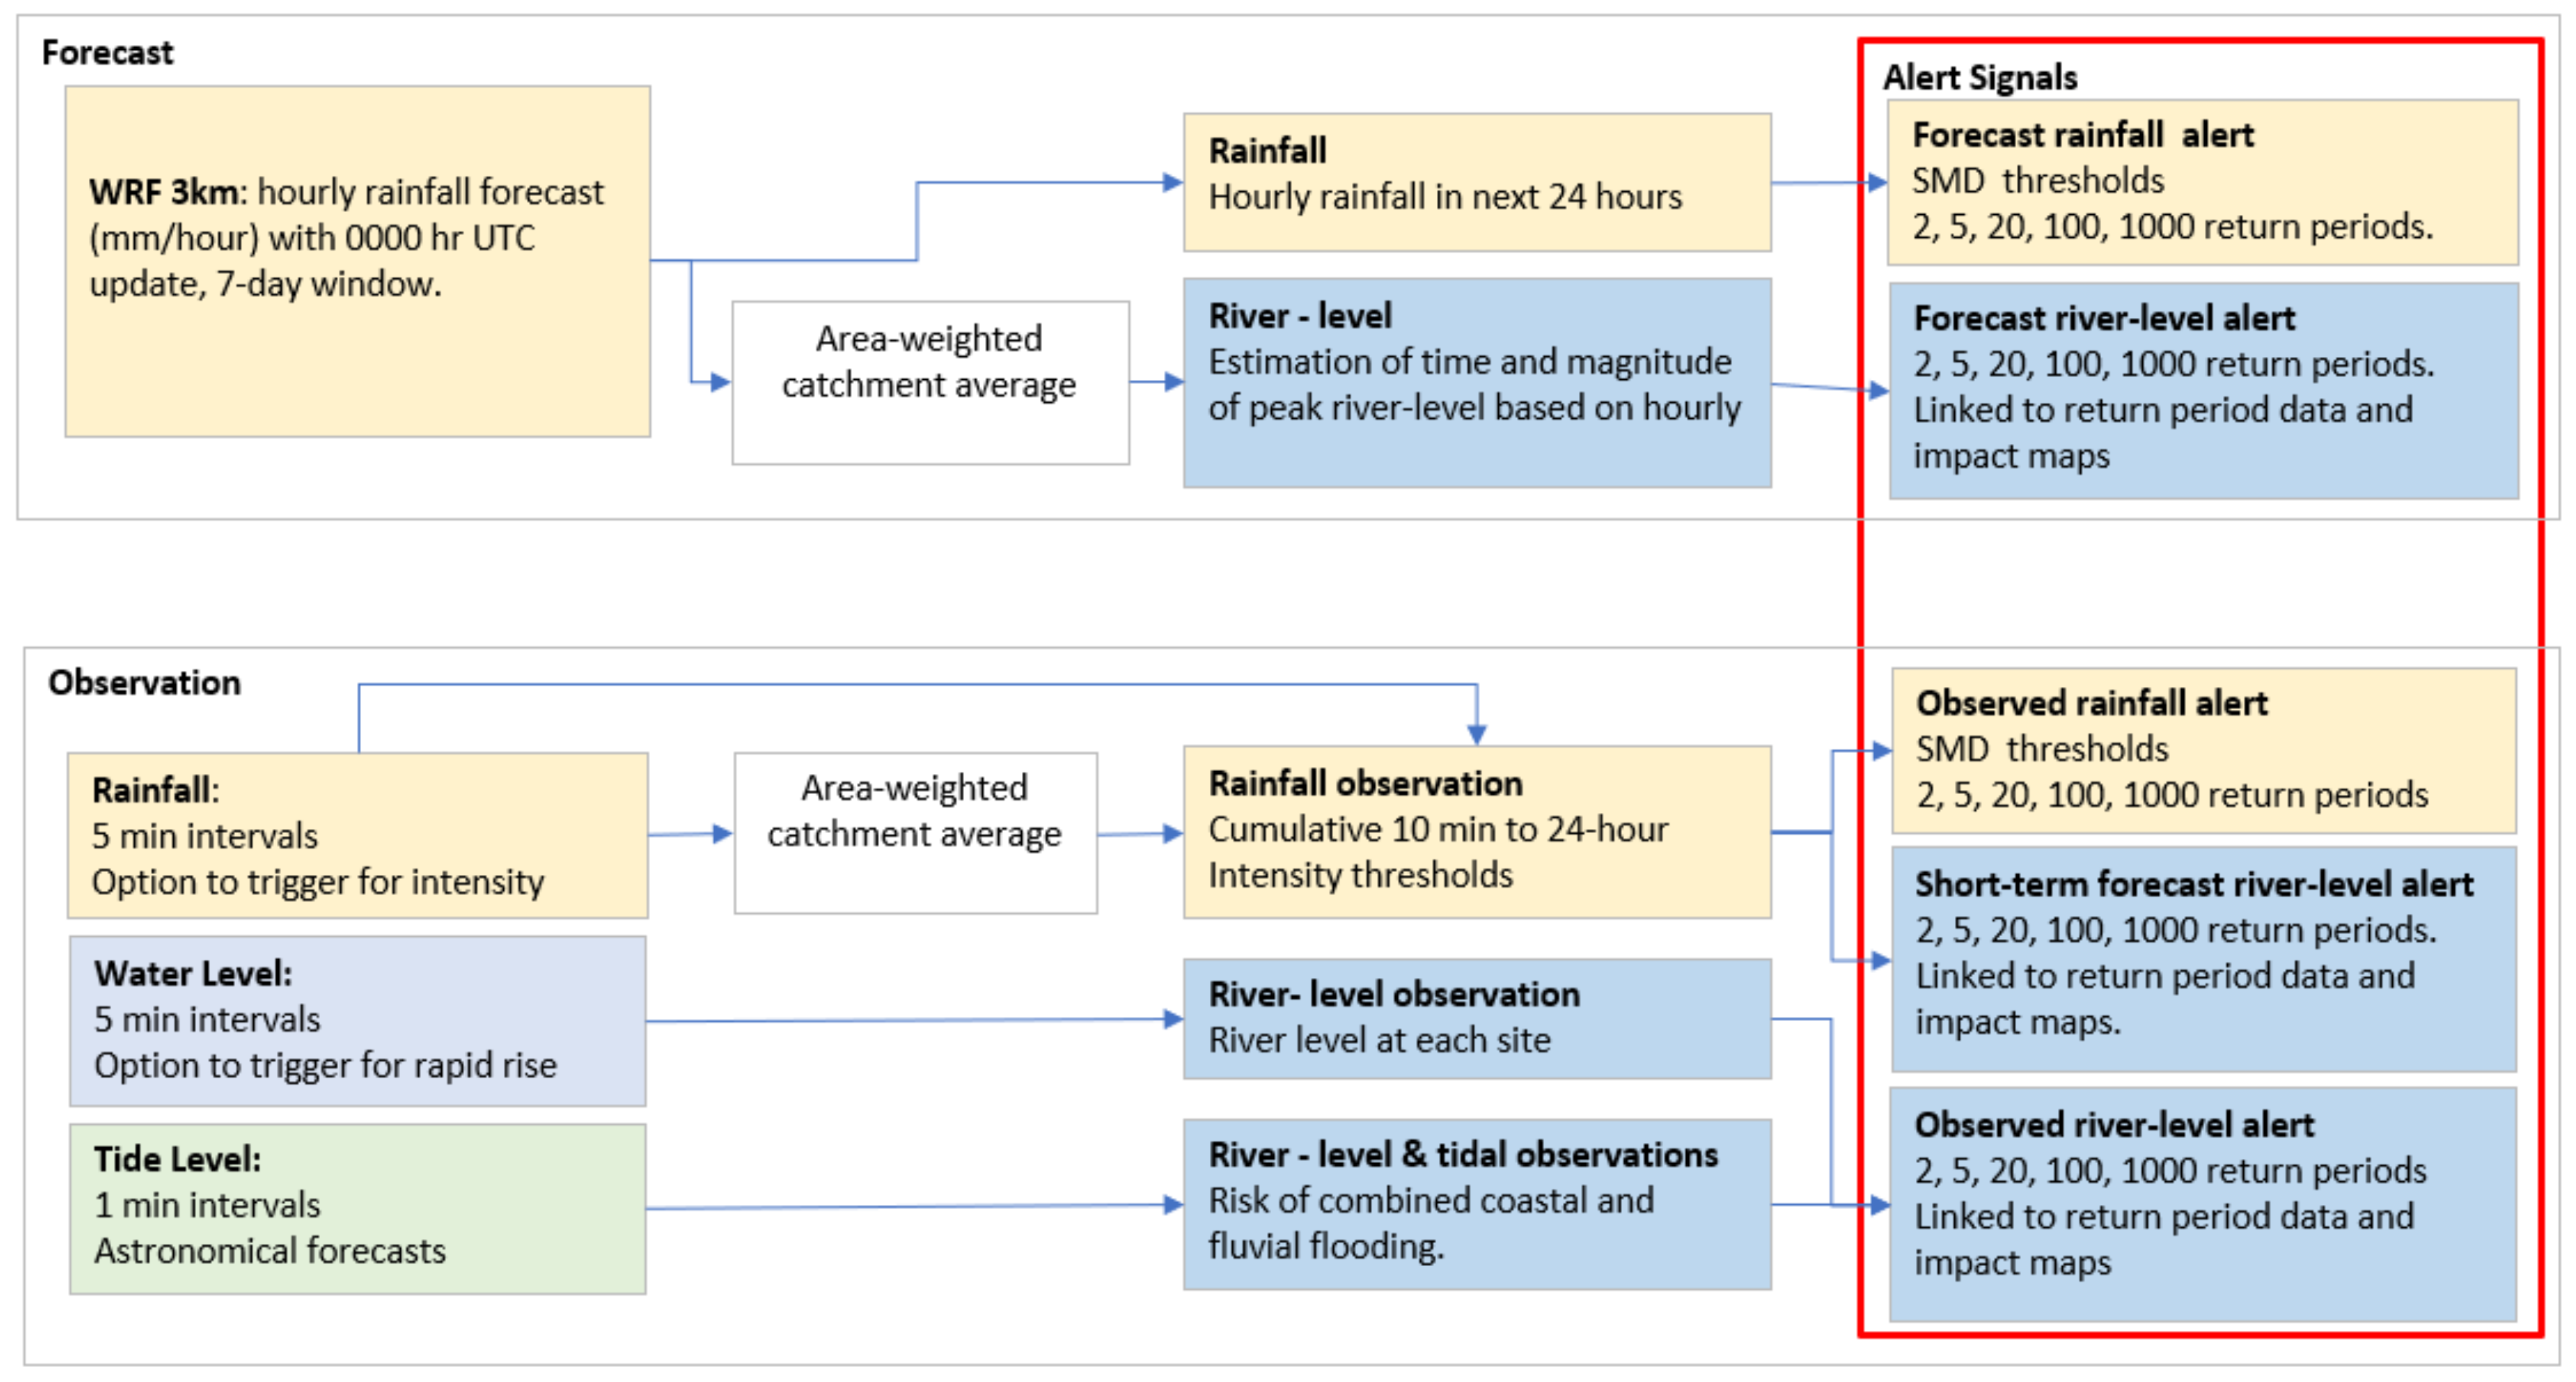
The necessity for a precomputed impacts forecast approach recognizes the current technological and financial limitations in rapidly simulating accurate two-dimensional (2D) flood inundation models with only a few hours of warning lead time. Here, we describe the data, methodologies and analysis undertaken to develop the Vaisigano flood decision support system (FDSS) framework which encompasses these various capabilities (
Figure 2).
3.1. Observations and Forecast Data
Near real-time rainfall and river stage/flow monitoring data from gauges located within and around the Vaisigano catchment (
Figure 1) provided a basis for developing the observations-based elements of the system. Five (5) minute rainfall data are telemetered from each rain gauge every 10 min via dual mobile (primary) and satellite (backup) communications networks, which are accessible through a web-based telemetry management system (MNRE-NEON) administered by the Samoa Ministry of Natural Resources and Environment (MNRE) (
Figure 2) [
29]. Similarly, 5-min stage and flow data from each river gauge are telemetered via dual communications, although data packets are sent every 5 min. These data were used along with historical hindcast analysis, described in the sections below, to formulate empirical-based flood thresholds and predictive nowcasting tools capable of alerting flood monitoring and emergency responders of imminent flooding with up to 3-h lead time.
The Weather Research and Forecasting (WRF) numerical weather prediction (NWP) 3 km rainfall model, available for Samoa through the Pacific Islands Ocean Observing System (PACIOOS), provided a means to enable the forecast-based elements of the system. Forecasts of hourly rainfall intensities up to 48 h in advance are updated every 24 h, with site-specific raw data (csv files) obtained via a THREDDS Data Server (TDS) [
30]. Integration of these data with the real-time observation baselines using similar empirical relationships as those developed for the nowcasting tools enabled the development of automated and manual tools capable of providing forecast-based alerts with up to 48-h lead time.
Real-time sea level data (1-min) from the Apia tide gauge accessible via the Climate and Oceans Support Program for the Pacific (COSPPac) enabled the tidal state and residual coinciding with a nowcast/forecast flood event to be monitored. This provides a proxy for understanding the effect this might have in exacerbating surface flooding in the coastal, lowest reaches of the catchment.
3.2. Flood Frequency Analysis
Rainfall and river flow thresholds for different return period events were required to produce representative real-time forecasts of flood magnitude (up to 48 h lead time), and corresponding precomputed hazard exposure.
3.2.1. Rainfall Analysis
Five (5) and ten (10) minute historical rainfall data held within the Samoa Tideda hydrological and Climate Database for the Environment (CliDE) archives were used to assess and/or validate previously established rainfall return period thresholds (
Table 1) [
22].
Both daily and sub-daily records for Afiamalu, Nafanua, Alaoa, Le Pue and Tiavi sites were particularly crucial as they represented the spatial variability of available data within the catchment (
Figure 1), with maximum daily rainfall extremes of over 400 mm recorded at Afiamalu, Nafanua, and Alaoa. The most significant large rainfall event since 2010 was associated with tropical cyclone Evans in 2012. Overall rainfall records suggest that the event was between a 20- to >100-year return period event (5% to <1% annual exceedance probability), and was compounded by antecedent rainfall of 174 mm at Afiamalu and 120.5 mm at Alaoa during the preceding 24-h period. This caused multiple landslips within the catchment [
25]. On average it was estimated that up to 206 mm of rainfall fell within a 2-h period [
31]. The 24-h rainfall recorded at Afiamalu was 413.8 and 467 mm at the Alaoa gauge. Other gauges within the catchment recorded less (e.g., 144 mm at Apia and 207 mm at Nafanua), illustrating the high spatial variability of rainfall even for large events. Maximum hourly rainfall for the on 13 December 2012 event varied from 56 mm/hour between 12 and 1pm to 85 mm/h from 2 to 3pm at Afiamalu, and from 12.2 to 156.8 mm/hour at the Alaoa gauge [
31]. Again, this illustrates the local spatial variability of rainfall in the catchment.
Data from seven operational rain gauges located within or near the catchment (i.e., Afiamalu, Nafanua, Alaoa, Mt Le Pue, Tiavi, Maagiagi and Togitogiga) were used to produce area-weighted catchment averaged rainfall and rainfall-surface runoff relationships (detailed in
Section 3.2.2), to enable reliable estimation of real-time nowcast and forecast peak flow and level for river gauges at Alaoa West, Alaoa East and Lelata Bridge (
Figure 1). Thiessen polygons were drawn around each of the above rainfall gauges with only the gauges at Nafanua, Afiamalu, Maagiagi and Le Pue intersecting with the polygons (
Figure 3). This enabled calculation of the area associated with each rainfall polygon (Equation (1)) to underpin the estimation of area-weighted average rainfall for each sub-catchment (Equations (2)–(4)):
If one or more rain gauges breaks down or becomes faulty, then the following assumptions are applied:
If Tiavi data are missing then use data from the next closest gauge (which in order of priority) Le Pue, Afiamalu, Togitogiga, Maagiagi, Alafua, or Nafanua;
If Le Pue data are missing then use data from the next closest gauge (which in order of priority) Tiavi, Togitogiga, Afiamalu, Maagiagi, Nafanua, or Alafua;
If Togitogiga data are missing then use data from the next closest gauge (which in order of priority) Le Pue, Tiavi, Maagiagi, Afiamalu, Nafanua, or Alafua;
If Afiamalu data are missing then use data from the next closest gauge (which in order of priority) Maagiagi, Le Pue, Tiavi, Alafua, Nafanua or Togitogiga; and
If Nafanua data are missing then use data from the next closest gauge (which in order of priority) Alafua, Afiamalu, Maagiagi, Le Pue, Tiavi or Togitogiga.
Rainfall thresholds for design event durations were identified using rainfall intensity-duration-frequency (IDF) curves previously established at Afiamalu (
Table 2) [
22,
23,
32]. These were used to identify thresholds required to trigger early warnings for a given real-time nowcast or forecast event. For example, 1-h rainfall intensity of 156.8 mm observed at Afiamalu during the 2012 flood represents an event greater than a 100-year return period event (
Table 2).
3.2.2. Flood Stage and Flow Thresholds
Stage and flow data from the operational gauges at Alaoa West, Alaoa East and Lelata were used to identify/monitor flow thresholds that are expected to be exceeded based on real-time observations/forecasts of rainfall. Long-term records at these sites along with a rating curve developed in [
22] for flows up to 15 m
3/s at the Alaoa East gauging station were used. The associated rating equations for different stage-flow ranges at Alaoa East up to a stage of 3.2 m and discharge of 75 m
3/s are shown in and are summarized in
Table 3.
These stage-discharge data, along with preliminary analysis by [
23], provided a basis to derive flood frequency distributions from Alaoa East (
Table 4). For design events up to the 10-year return period (10% annual exceedance probability), the flow magnitudes were within 10% of previous flow estimates as detailed in [
33]. For higher magnitude design events, flows have increased from those previously available (e.g., the 100-year return period event increased from 331 to 542 m
3/s) (
Table 5) [
23].
Modelled flow levels at Lelata for the 5-, 20-, 100- and 1000-year return period events were derived using the area weighted sub-catchment areas and rescaling of peak flows to Alaoa East and Alaoa West (
Table 5). Compared to the values shown in
Table 5, the rescaled flows for Alaoa East are higher for the 5- and 20-year return period conditions but are lower for the 100- and 1000-year return periods. Similar trends are reflected at the Lelata gauge site [
23].
3.3. Peak Flow Estimation
Forecasts of peak flows estimated using the relationships described in
Section 3.1 and
Section 3.2 for the Alaoa East gauged site were used to provide short-term warnings of potential high flows at this location; based on observed/nowcast rainfall and stage-flow as well as forecast rainfall sourced from the WRF model (see
Figure 2). This site is particularly important due to the absence of reliable gauged data at the Lelata and Alaoa West sites. A unit hydrograph approach was used to predict the flood hydrograph at this site using the procedure adapted from [
34]. This approach was used because of the lack of detailed soil or vegetations maps at the site that could be used to inform a more physically based model. Also, as the model was to be hosted by a web-based service, it was more convenient to use an empirical-based model that could be hard-coded into the system. The key steps involved in developing the model included:
Identifying observed flow data for the given catchment. These data should be available in the required temporal resolution (duration) of the unit hydrograph (e.g., 10-min, 1 h or 3 h);
Identifying an appropriate flow event (i.e., where river flow starts and ends at a common baseflow value and exhibits a standard hydrograph shape);
Plotting the direct runoff hydrograph (i.e., observed flow/baseflow) and then calculate the area under the hydrograph curve to determine the volume of runoff for the event (trapezoidal method);
Calculating the rainfall excess (mm) by dividing the volume of runoff by the catchment area (m2); and
Calculating each temporal ordinate of the unit hydrograph by dividing each observed discharge ordinates (t1, t2, t3, …, tx) by the excess rainfall figure described above.
To use the unit hydrograph to predict the direct runoff resulting from each 1 mm of rainfall, the following steps were used:
Subtract the estimated ‘rainfall loss’ from the rainfall timeseries to get ‘effective rainfall’;
Multiply each rainfall value by the unit hydrograph to obtain multiple direct runoff hydrographs (one for each rainfall increment, and each lagged by a successive time increment); and
Calculate the sum of all the direct runoff hydrographs and add the baseflow component of observed data to obtain the flow timeseries.
Implementation of the unit hydrograph method in the FDSS allowed the starting condition (baseflow) to be determined from observed conditions. In addition, the rainfall loss factor was made dependent on antecedent rainfall conditions, thus acting as a surrogate for the extent of soil saturation at the start of each storm event.
Flow event data, which captured the extreme flood in 2012, were used to calculate the 10-min unit hydrograph at Alaoa East, as both the rainfall and flow data were available in 10-min increments during this period. For each identified event, a baseflow value was calculated from the flow before rainfall commenced. The 10-min data were re-scaled to create a 1-h unit hydrograph which we use to predict flow from real-time forecast rainfall data.
3.4. Alert Thresholds
Flood thresholds used to trigger an alert were primarily based on the rainfall and water-level thresholds described in
Section 3.2 and
Section 3.3. In addition, rainfall thresholds identified from IDF curves derived for American Samoa [
22,
33] were used to compensate for data gaps or short available records within the Vaisigano catchment. A simplified schema showing the analytical data flow from real-time observations and forecasts to alert triggers are shown in
Figure 4.
Observed water level alerts are determined directly from in-catchment water level gauges at Lelata, Alaoa East and Alaoa West. The thresholds (5-, 20-, 100-, 1000-year return periods) at which an alert is signalled are based on those identified within the most recent flood modelling of the catchment presented in [
23]. Thresholds for the Alaoa East and Alaoa West site were derived by rescaling the estimates for the Lelata using flow per unit area.
Observed rainfall alerts are based on information taken from [
22], i.e., from data that have been derived for American Samoa [
33]. Rainfall thresholds can be either a rainfall intensity or a total amount of rain over a specified period. Observed rainfall is also used to predict water level at each river gauging station, enabling advanced warning of up to 1 h or more depending on rainfall intensity, of the likelihood of water level thresholds being exceeded at those locations.
Two NWP sources provide medium-term rainfall forecasts:
Weather Research and Forecasting Model (WRF) (3 km resolution) 1-h rainfall, available at 00 UTC, for a 7-day window; and
NOAA Global forecast systems (GFS) forecast (~20 km resolution) 3-h rainfall, available at 00, 06, 12, 18 UTC, for a 10 day window.
Alert signal thresholds for forecast rainfall in addition to observed rain and water levels, include:
A threshold of 5 mm/10-min to indicate risk of flooding;
A threshold of 25 mm/12-h for two consecutive timeframes is also used to indicate increased flood risk;
A threshold of 75 mm/24-h used to indicate increased flood risk.
Flood warnings issued by MNRE are conveyed via available communications outlets (e.g., website, national media stations, social media), and guided by the MNRE Forecast Operations Plan [
35].
3.5. Flood Hazard and Impacts Analysis
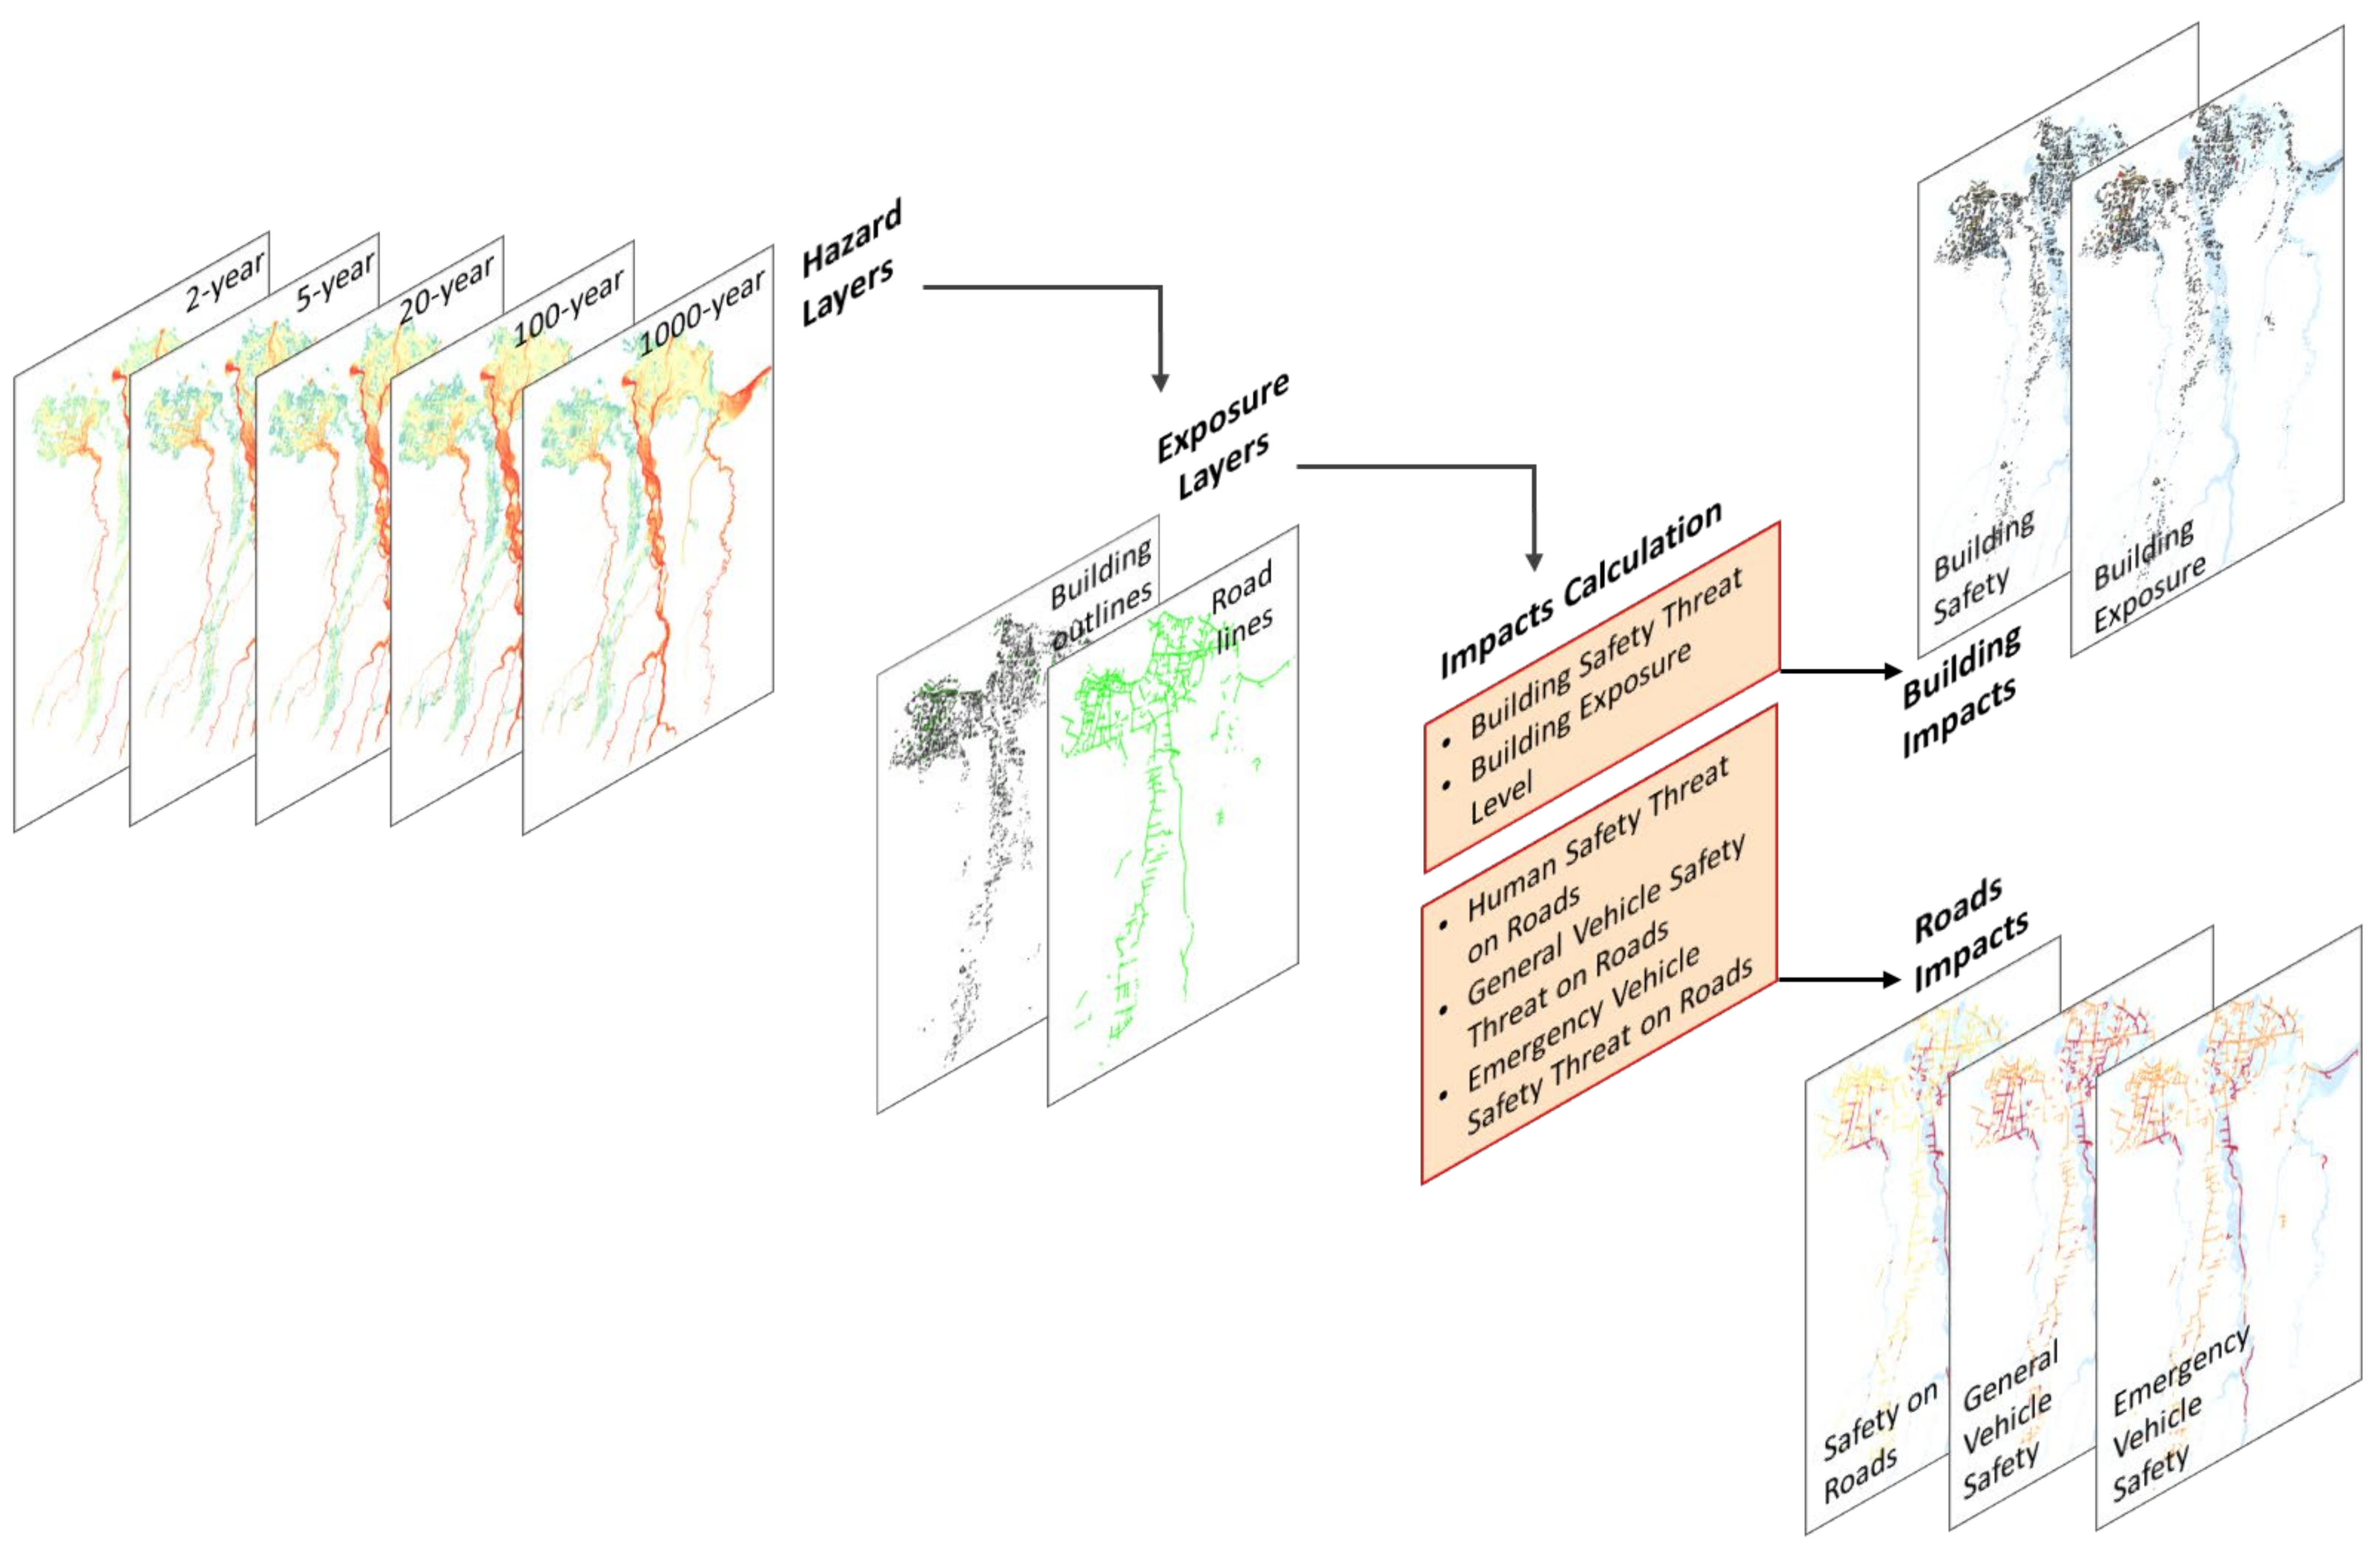
To facilitate the rapid representation of inundation hazard and exposure for a given forecast flood magnitude, it was necessary to compile a library of precomputed scenarios corresponding to the given forecast flood event. This was particularly crucial due to the flashy nature of the Vaisigano catchment and current computational limitations in simulating real-time, on-the-fly, hydrodynamic simulations of flood hazard intensity. To this end, the multi-hazard model framework supported by RiskScape software [
36] was configured to analyse building and road exposure to flooding hazards. The RiskScape software engine combines spatial layers representing hazards and exposures (i.e., elements at risk) with vulnerability functions in a model workflow to quantify the impacts from hazard events. Here, we used flood hazard layers represented by available TuFlow 2D flood inundation modelled depth and velocity hazard intensities (2 m grid resolution) for the 2-, 5-, 20-, 100- and 1000-year return period flood scenarios [
22]. These were intersected with exposure layers representing building polygon and road polyline features to calculate metrics on the exposure and threat to safety at building and road locations (
Figure 5).
The hydraulic model was configured by Filer et al. (2019) [
22] using a rectangular grid domain (5.3 × 7.5 km), with base topography and nearshore bathymetry derived using the 5 m LiDAR digital elevation model (DEM) produced in [
37]. DEM modifications enabled hydraulic features such as river channels and infrastructure (e.g., road crests, bridges, culverts) to be represented in the model outputs. Variable roughness was applied to represent different land uses and ranged from Manning’s coefficients of 0.02 (roads, car parks) to 0.3 (buildings). The model was calibrated against the 2012 and 2018 flood events, with the results showing good modelled-to-observed water levels within a desirable tolerance of 0.25 m [
22].
The flood hazard layers are representative of existing mitigation works in the Vaisigano catchment (e.g., levee segments) as well as the rainfall and river stage-flow relationships described in
Section 3.2 and 3.3. In addition, each hazard layer represents the estimated flood hazard intensities coinciding with storm/high tide to provide conservative indications of expected impacts to a forecast flood event. Digital building outlines used in this analysis were obtained from the 2009 Pacific Catastrophe Risk Assessment and Financing Initiative (PACRAFI) database available for Apia [
38]. This polygon dataset was manually updated in QGIS software using 2020 Google satellite base imagery to include outlines of new buildings constructed since 2009, and exposed to the 1000-year maximum available scenario. Road polylines were obtained from the Open Street Map (OSM) database [
39], and split into 10 m segments. These provided the input exposure layers for RiskScape to calculate flood exposure metrics (building count and road length) and human threat to safety at building and road locations (
Figure 5).
Threat to safety functions represent the human stability response to maximum flood depth-velocity (DV) at building locations [
40]. Here, ordinal categories (e.g., none, low, medium high, extreme), describe the relative threat to a person’s safety at ground-level for each building location and 10-m road segment. Similar categories determine the safety of persons located in a vehicle (e.g., sedan, truck, fire-engine) at the time of maximum flood DV on roads [
41]. Human threat to safety for each flood event was reported at feature- and village-scale web-supported GIS files for ingestion and display as decision-ready maps and tables on the FDSS portal.
4. Flood Decision Support System (FDSS): Operations Portal
The FDSS Portal provides a centralized web-based information interface/dashboard that incorporates multiple information tools, enabling MNRE and other authorized operators to monitor and predict/forecast imminent flood events in real-time. This includes rapid access to decision-ready tools for determining the potential impacts in advance. The portal is built within the Climate Data for the Environment Services application Client (CliDEsc) framework [
42] and provides a flexible platform for future MNRE data visualization needs.
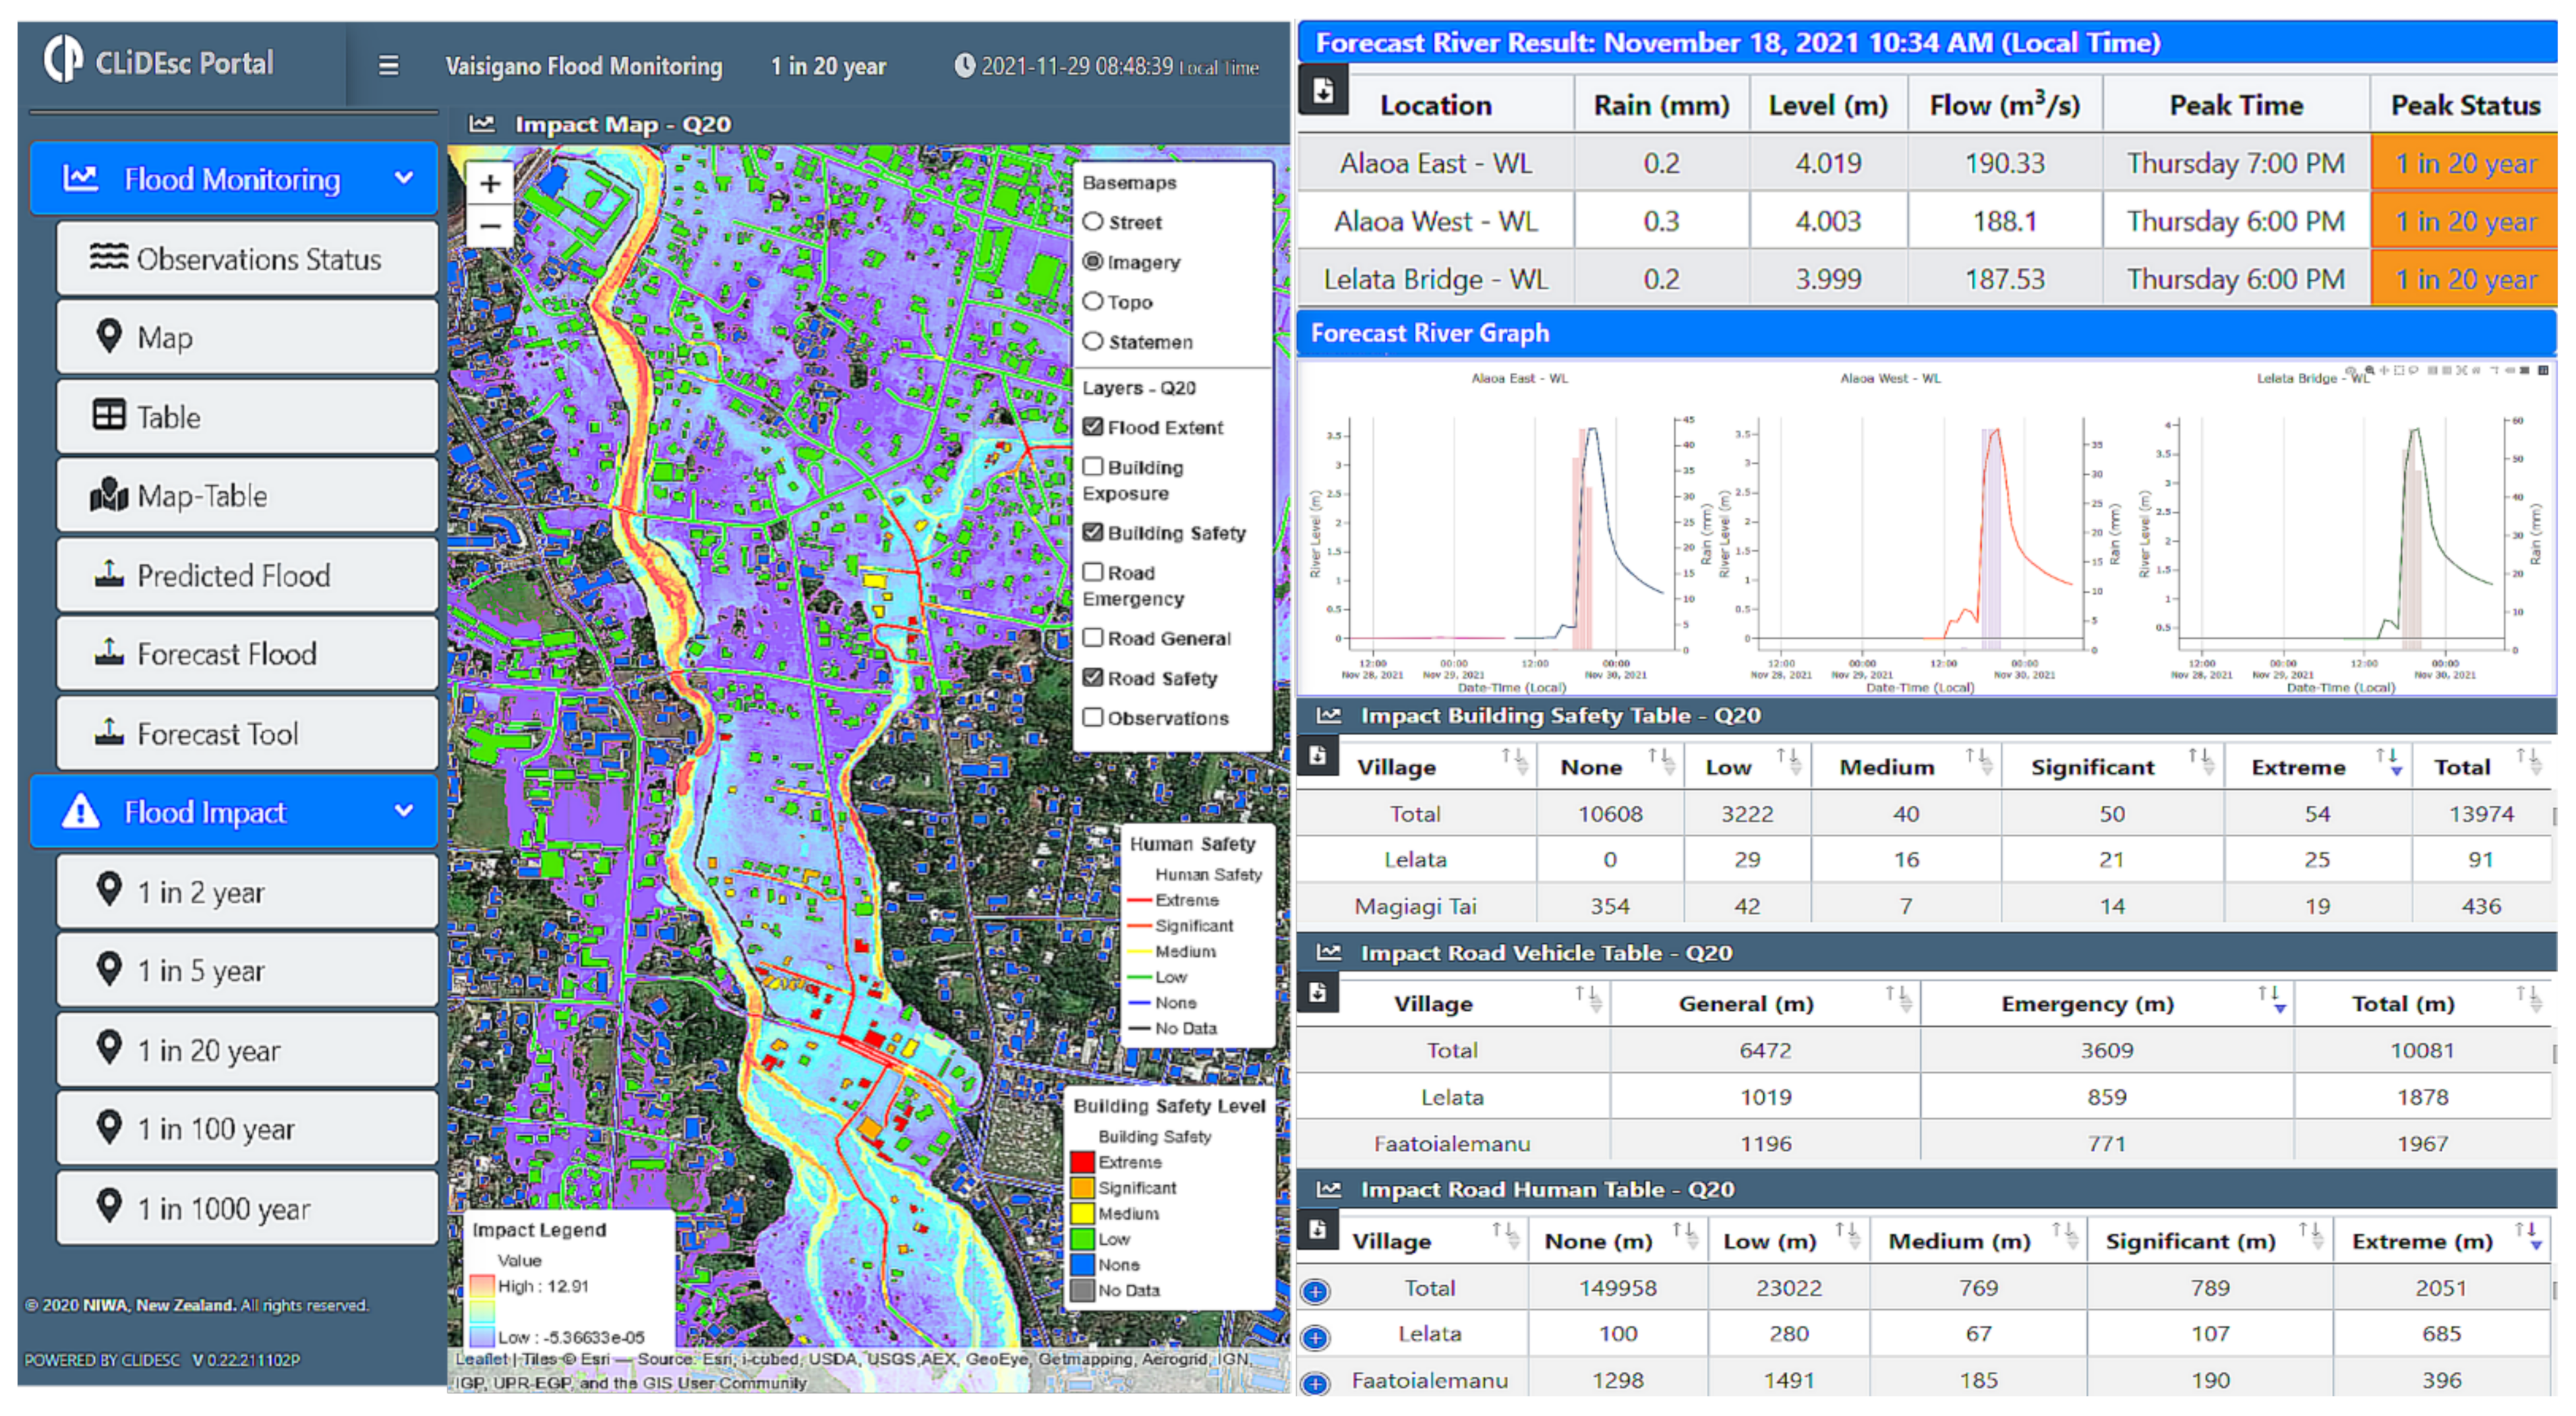
The portal is cloud-based and is password-protected. It can be configured to enable additional or new data/information sources required to support hydrometeorological or climate operational decision-making as these needs arise in future. Information ingested and displayed within the Vaisigano FDSS includes (
Figure 6), but is not limited to:
Real time rainfall and river stage data from monitoring stations within and surrounding the Vaisigano catchment;
Real time sea-level data from the Apia tide gauge;
Nowcast (observations-based) flood prediction tool;
Real time NWP (WRF 3 km) rainfall forecasts and flood forecast tools; and
Pre-computed flood hazard and exposure/impacts maps and data tables for available flood scenarios.
5. System Performance
Significant rainfall events which occurred during the 2020–2021 tropical cyclone season provided a basis to operationally test the system and identify ongoing gaps for future development. In particular, the rainfall events on 18 December 2020, 7 January and 22 February 2021 proved useful in assessing the efficiency of the prediction model.
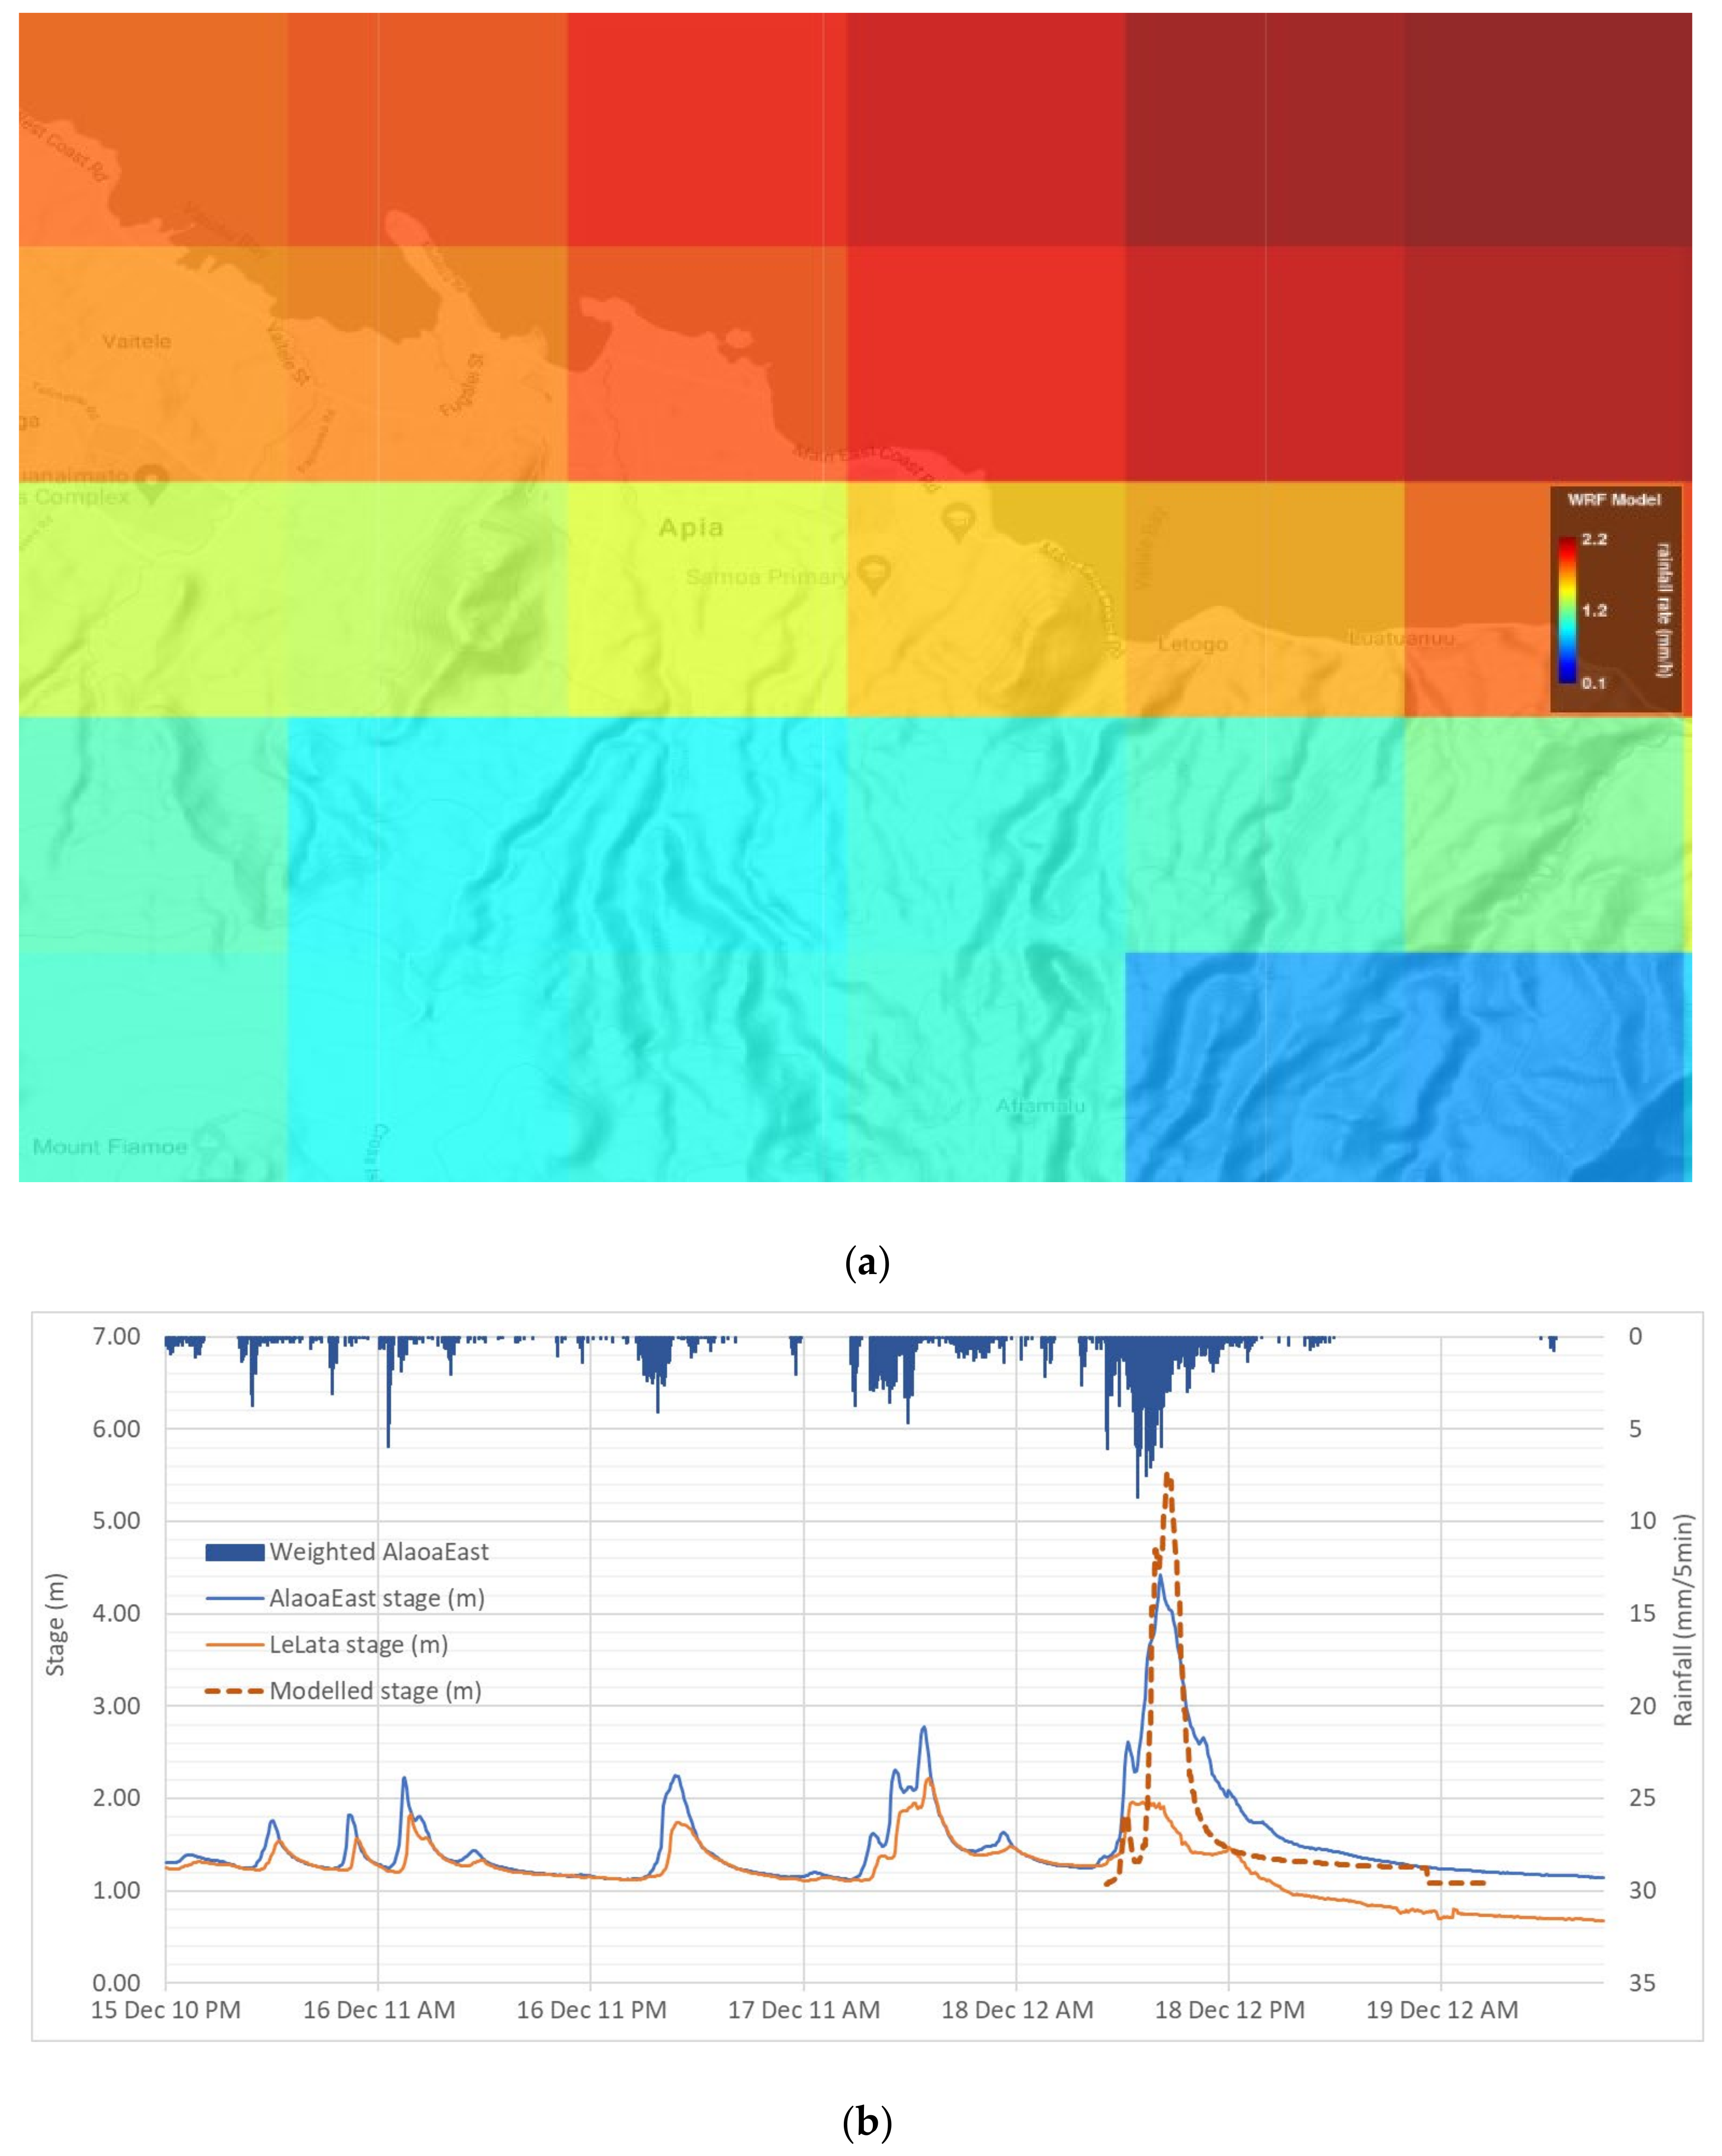
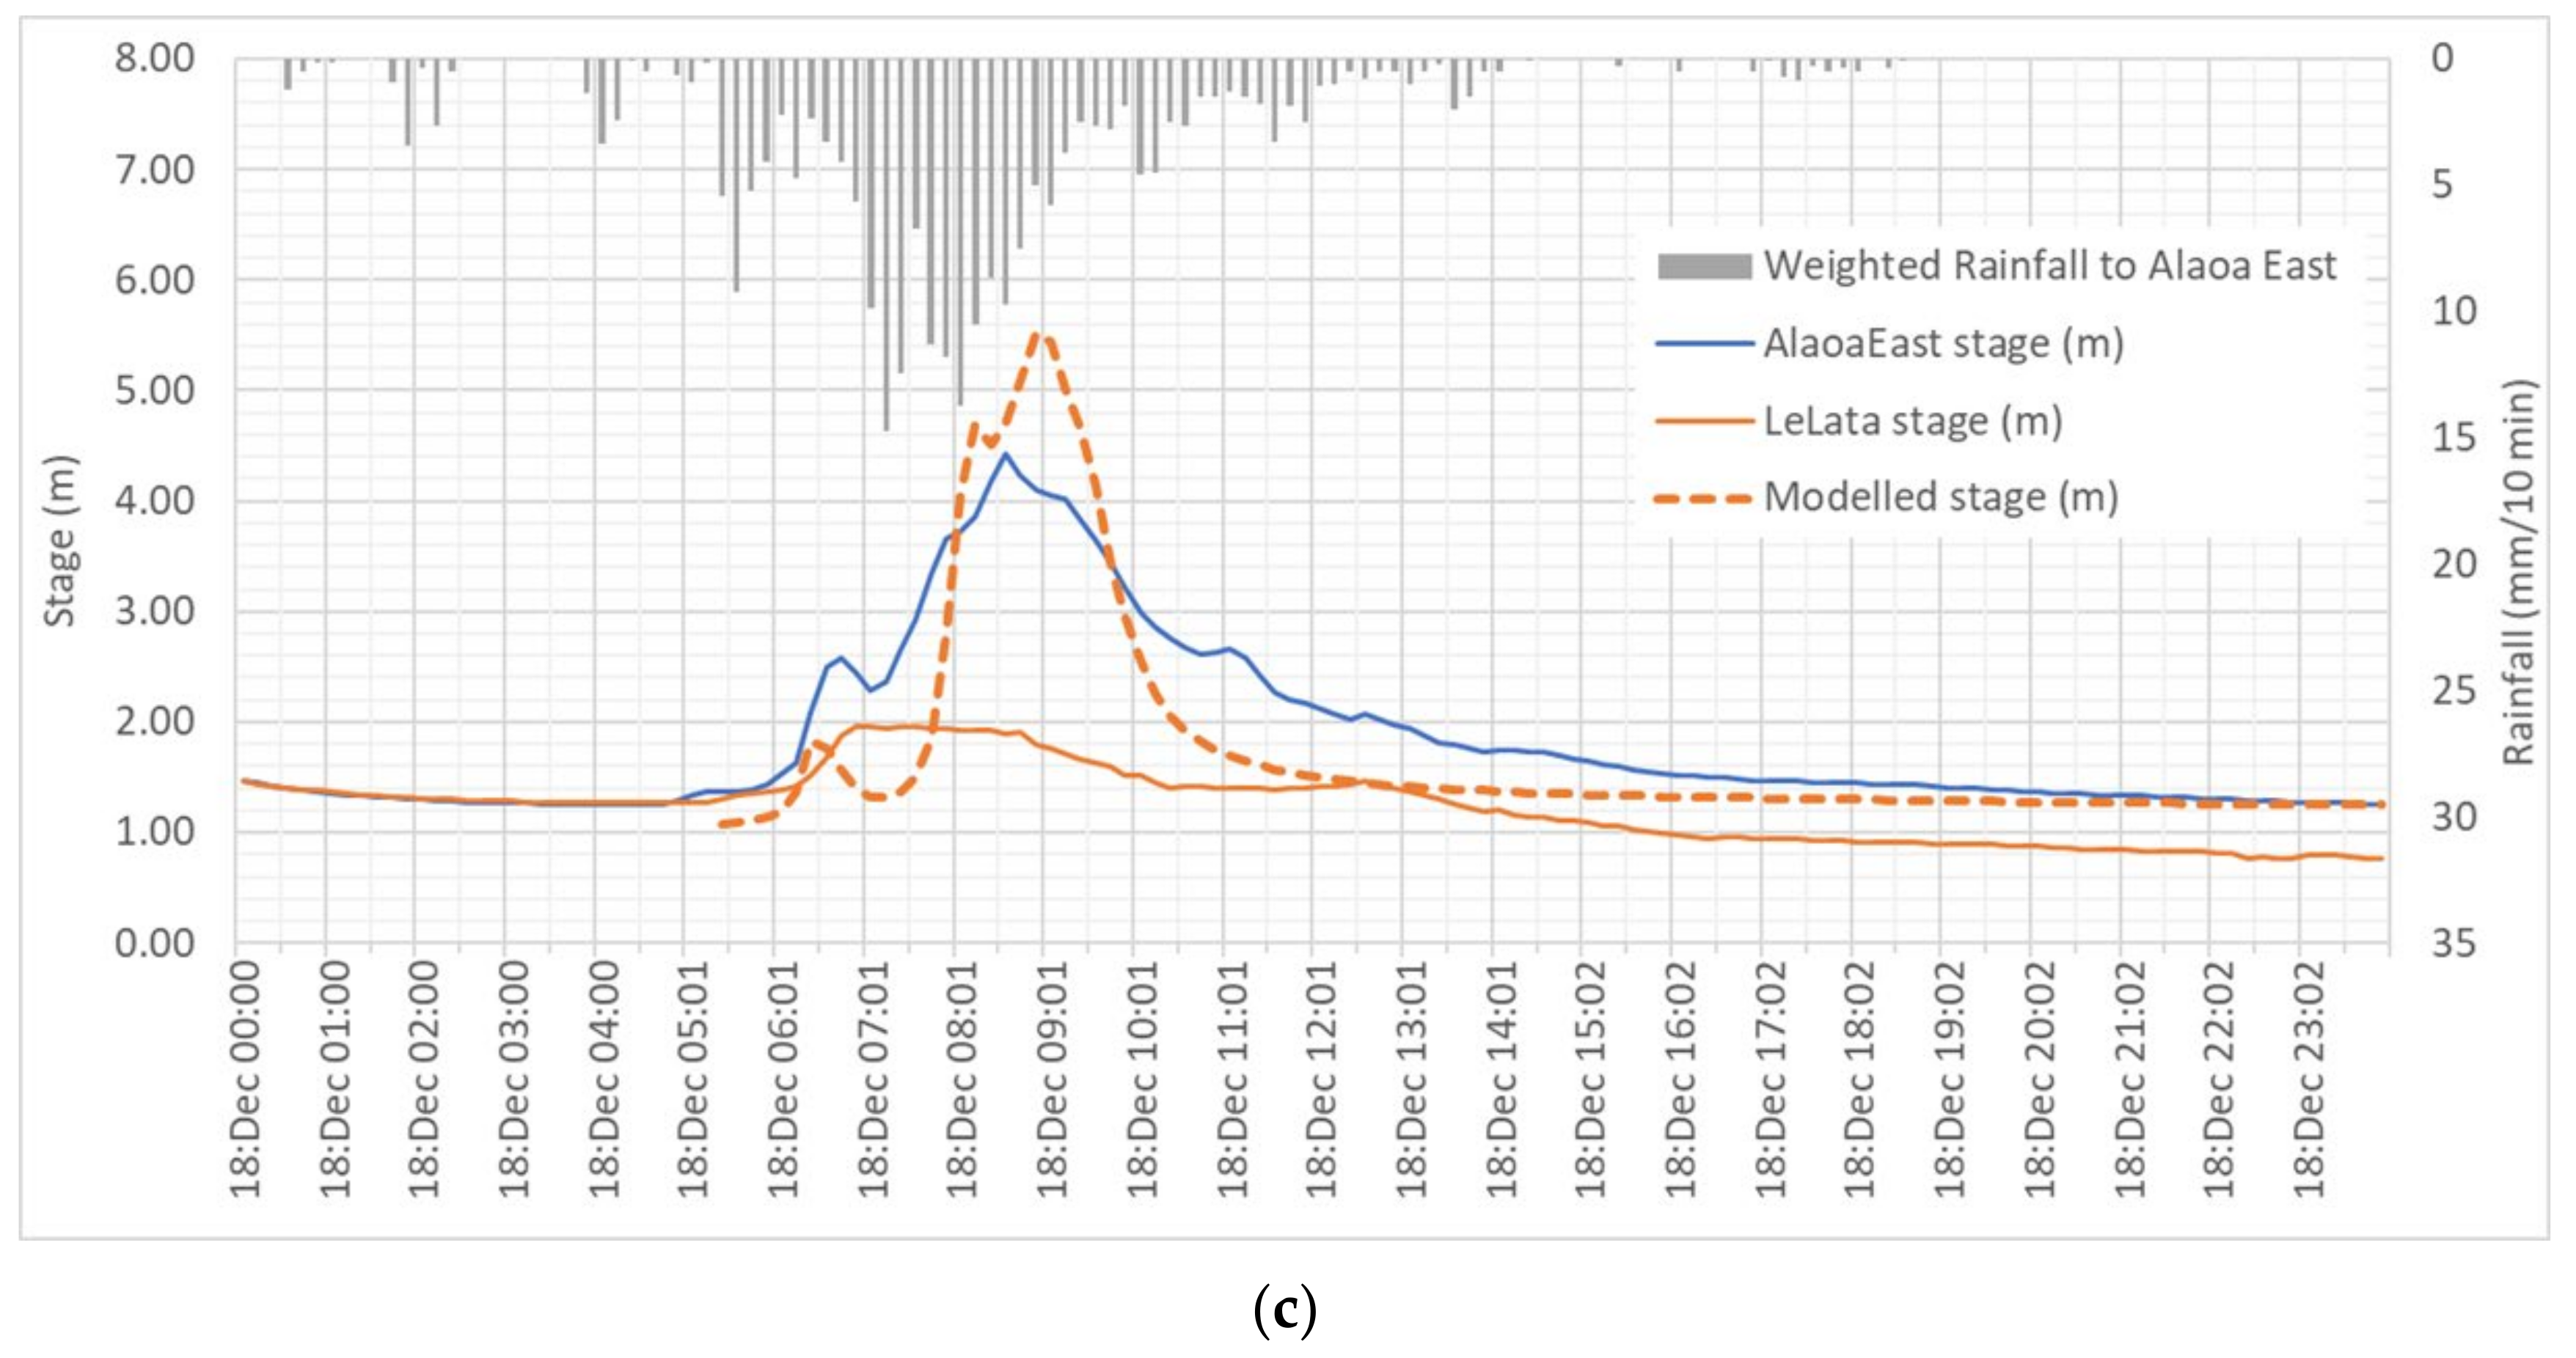
Figure 7 illustrates the river levels recorded at Alaoa East and Lelata flow gauging stations from the 15 to 19 December 2020 [
43], associated with the 18 December 2020 flooding. Higher rainfall was observed at Afiamalu rainfall station than Le Pue during this period highlighting the high local spatial variability in the catchment (as previously described in
Section 3.2). Whilst the 5-, 10-, and 60-min rainfall intensities at Afiamalu were all less than 1-year return period flood, the 24-h rainfall accumulation of 392 mm from 2 pm on the 17 to 18 December was greater than a 25-year event (
Table 5). For the same period, 316 mm of rainfall was recorded at the Le Pue site, equivalent to between a 5- to 10-year event [
33].
The data at this and subsequent events on 7 January 2021 and 22 January 2021 have been used to validate and improve the prediction accuracy of the FDSS system by increasing the amount of data that the 10-min and 1-h unit hydrographs are based upon. That is, these recent extreme events have extended the pool of data from which the hydrographs are derived.
Modelled stage at Alaoa East are also shown in
Figure 7. It should be noted that the river stage is based on area-weighted rainfall for the Alaoa East catchment and correlation of modelled and observed flows yielded an R
2 value of 0.87 for this event.
Uncertainty
The current system was developed under conditions of data scarcity and discontinuity. Uncertainty surrounding the validity of rating curves for each streamflow dataset presented a particular challenge. The uncertainty is produced because of limited opportunity to measure river flows during high flow conditions, and ongoing changes in channel morphology during such conditions without associated changes to the rating curve information. For example, it can be seen in
Figure 7 that the flood peak at the Lelata site on 18th December 2020 was not recorded because the river over-topped the monitored channel at just below 2 m and resulted in a flat hydrograph. Limited data for the development of river rating curves mean that assumptions made during construction of the unit hydrographs will impact the performance of the model in predicting the magnitude of peak flows.
A second source of uncertainty lies within the area-weighted rainfall estimates used by the model for each catchment, which despite being informed by new rain-gauges within the catchment will be susceptible to errors for spatially heterogeneous storm events. The impact of rainfall estimation uncertainty on model performance at this site will be reported in a subsequent publication.
To improve model performance, the model was calibrated using the rainfall loss factor which was dynamically set to reflect different antecedent soil moisture at the start of each rainfall event. It should be noted, however, that the model was less accurate at predicting lower peak flows.
6. Practical Implications
This pilot has demonstrated the suitability of integrating real-time forecast with observations of rainfall, river level/flow and precomputed representations of flood magnitude and exposure to warn responders of imminent flooding with adequate alert lead times in a short, steep, flashy tropical Pacific catchment. Indeed, this was exemplified by the extreme rainfall and subsequent flooding on 18 December 2020. In this case, responders were alerted up to 24 h lead time, enabling an evidence-based evacuation of affected residents several hours before the Vaisigano River overtopped its channel.
While the developed FDSS tools have proven effective in helping to inform evacuation response decisions which minimize the threat of injuries and loss of life, key challenges to guide future work include, but are not limited to:
Nevertheless, the FDSS provides a first order solution towards impacts-based forecasting for the Samoa region which is consistent with Pacific [
16,
18] and international [
17] efforts. Future extension of the framework to build on the capabilities developed in this pilot would help to safeguard the effectiveness of the FDSS in minimizing flood threats to injury, lives and livelihoods in Samoa, with potential applications to similar SIDS contexts.
7. Conclusions
This paper aimed to describe a pilot flood decision support system (FDSS) for the Vaisigano River, Samoa, which is comprised of a suite of integrated rainfall/river observations and forecast tools that are linked with precomputed hazard exposure scenarios to enable real-time flood-impacts warnings forecasting for the Vaisigano catchment.
A number of challenges face the development of such systems in data sparse areas. In particular, the availability of sufficient and consistent historic rainfall and flow data is required to design, calibrate and validate even parsimonious runoff models such as those used in the developed system. Despite such challenges, this study illustrates that it is possible to develop an early warning system by identifying specific thresholds of hazard (flood) occurrence and then targeting prediction capability on those thresholds. Although, the absence of soil and vegetation data as well as the need for model parsimony were pivotal in the decision to use the unit hydrograph approach for peak flow prediction.
The effectiveness of the developed FDSS was demonstrated in the lead up to the 18th December 2020 extreme rainfall and flooding, whereby residents in affected floodplains were successfully warned and evacuated several hours prior to river channel overtopping. This was achieved through the use of a multi-layered warning system that provided 1-h resolution rainfall and river level forecasts (30-h into the future); 10-min resolution prediction of rainfall and river level (24-h into the future); and real-time rainfall and river level monitoring.
While this pilot provides a benchmark for future work and extension to other catchments in the Samoa region, the findings offer a conceptual framework for developing similar impacts-based flood decision support systems in comparable Pacific Islands and SIDS contexts.
Author Contributions
Conceptualization, S.W., J.G., B.M. and M.I.; methodology, S.W., B.M., J.G., M.O., E.R., R.P., M.L. and G.E.; software, B.M., J.G., S.W., G.E., M.O. and R.P.; validation, J.G., B.M., M.O., E.R. and R.P.; formal analysis, E.R., M.L., M.I., S.M. and J.C.T.; investigation, B.M., J.G., S.W., M.O., R.P., E.R., M.L., S.M. and J.C.T.; resources, G.E., S.W., M.I., E.R., M.L., S.M. and J.C.T.; data curation, B.M., E.R., J.C.T., M.O. and S.W.; writing—original draft preparation, S.W. and J.G.; writing—review and editing, B.M., R.P., E.R., M.L. and M.I.; visualization, B.M., J.G. and S.W.; supervision, M.I., G.E. and S.W.; project administration, S.W. and M.L.; funding acquisition, M.I., G.E. and S.W. All authors have read and agreed to the published version of the manuscript.
Funding
This pilot project was enabled through the Government of Samoa’s Green Climate Fund, Vaisigano Catchment Project No: MNRE-2019/001 implemented by the Samoa Ministry of Natural Resources and Environment (E.R.; M.L.; M.I.; S.M. and J.C.T.), and NIWA Taihoro Nukurangi Project No: MNR20901 and CARH2206 (S.W.; J.G.; B.M.; M.O.; R.P. and G.E.). The APC was funded by NIWA Taihoro Nukurangi, Project No:MNR20901.
Institutional Review Board Statement
Not applicable.
Informed Consent Statement
Not applicable.
Data Availability Statement
Hydrometeorological and climate data used in this study are available via formal request to the Samoa Ministry of Natural Resources and Environment, and were sourced from the MNRE-NEON, BOM CliDE and MNRE-NIWA Tideda databases.
Acknowledgments
The authors would like to thank Tuaifaiva Titimanu Simi, Ta’inau Mulipola Ausetalia Titimaea, Amituana’i Lameko Simanu, Alan Porteous and Doug Ramsay for the helpful advice provided throughout this research. The Australian Bureau of Meteorology, Tides Unit through the Pacific Sea Level & Geodetic Monitoring project as part of the Climate and Oceans Support Program in the Pacific (COSPPac), is thanked for facilitating the integration of the Apia tide gauge data. BMT Ltd. are thanked for providing the flood inundation layers via the Samoa Ministry of Natural Resources and Environment. Three anonymous reviewers are thanked for their helpful comments which improved the paper.
Conflicts of Interest
The authors declare no conflict of interest.
References
- Centre for Research on the Epidemiology of Disasters (CRED); United Nations Office for Disaster Risk Reduction (UNSIDR). Human Cost of Disasters: An Overview of the Last 20 Years (2000–2019); UNDRR: Geneva, Switzerland, 2020. [Google Scholar]
- Marsh McLean. Sunk Costs: The Socioeconomic Impact of Flooding; Rethinking Flood Series, Report 1; Marsh and McLean Companies Inc.: New York, USA, USA, 2021. [Google Scholar]
- Xu, W.; Cong, J.; Proverbs, D.; Zhang, L. An Evaluation of Urban Resilience to Flooding. Water 2021, 13, 2022. [Google Scholar] [CrossRef]
- Armal, S.; Porter, J.R.; Lingle, B.; Chu, Z.; Marston, M.L.; Wing, O.E.J. Assessing Property Level Economic Impacts of Climate in the US, New Insights and Evidence from a Comprehensive Flood Risk Assessment Tool. Climate 2020, 8, 116. [Google Scholar] [CrossRef]
- United Nations Development Programme (UNDP). Five Approaches to Build Functional Early Warning Systems; United Nations Development Programme: New York, NY, USA, 2018. [Google Scholar]
- The European Climate Adaptation Platform (Climate-ADAPT). Establishment of Early Warning Systems. Available online: https://climate-adapt.eea.europa.eu/metadata/adaptation-options/establishment-of-early-warning-systems (accessed on 1 October 2021).
- World Meteorological Organization (WMO). 2020 State of Climate Services: Risk Information and Early Warning Systems; WMO-No. 1252; World Meteorological Agency: Geneva, Switzerland, 2020. [Google Scholar]
- Duminda, P.; Ousmane, S.; Jetal, A.; Hamid, M.; Mohamed, R. Challenges and Technical Advances in Flood Early Warning Systems (FEWSs). In Flood Impact Mitigation and Resilience Enhancement; Huang, G., Ed.; Intech Open: London, UK, 2020. [Google Scholar] [CrossRef]
- Chen, G.; Hou, J.; Zhou, N.; Yang, S.; Tong, Y.; Su, F.; Huang, L.; Bi, X. High-Resolution Urban Flood Forecasting by Using a Coupled Atmospheric and Hydrodynamic Flood Models. Front. Earth Sci. 2020, 8, 545612. [Google Scholar] [CrossRef]
- Schroeter, S.; Richter, H.; Arthur, C.; Wilke, D.; Dunford, M.; Wehner, M.; Ebert, E. Forecasting the impacts of severe weather. Aust. J. Emerg. Manag. 2021, 36, 76–83. [Google Scholar] [CrossRef]
- Handmer, J.; Nalau, J. Understanding Loss and Damage in Pacific Small Island Developing States. In Loss and Damage from Climate Change. Climate Risk Management, Policy and Governance; Mechler, R., Bouwer, L., Schinko, T., Surminski, S., Linnerooth-Bayer, J., Eds.; Springer: Cham, Switzerland, 2019. [Google Scholar] [CrossRef] [Green Version]
- Bucherie, A.; Werner, M.; van den Homberg, M.; Tembo, S. Flash Flood warning in context: Combining local knowledge and large-scale hydro-meteorological patterns. Nat. Hazards Earth Syst. Sci. Discuss. 2021, preprint. [Google Scholar] [CrossRef]
- Li, Z.; Zhang, H.; Singh, V.P.; Yu, R.; Zhang, S. A Simple Early Warning System for Flash Floods in an Ungauged Catchment and Application in the Loess Plateau, China. Water 2019, 11, 426. [Google Scholar] [CrossRef] [Green Version]
- Drobot, S.; Parker, D.J. Advances and challenges in flash flood warnings. Environ. Hazards 2007, 7, 173–178. [Google Scholar] [CrossRef]
- Young, A.; Bhattacharya, B.; Zevenbergen, C. A rainfall threshold-based approach to early warnings in urban data-scarce regions: A case study of pluvial flooding in Alexandria, Egypt. J. Flood Risk Manag. 2021, 14, e12702. [Google Scholar] [CrossRef]
- United Nations Economic and Social Commission for Asia and the Pacific (UN-ESCAP). Seasonal Outlook to Socio-Economic Impact Based Forecasting: Proposed Methodology and Key Results; Asia-Pacific Disaster Report 2021, Working Paper 02; ICT and Disaster Risk Reduction Division, UN-ESCAP: Bangkok, Thailand, 2020. [Google Scholar]
- UNISDR (United Nations Office for Disaster Risk Reduction). Sendai Framework for Disaster Risk Reduction 2015–2030; UNISD: Geneva, Switzerland, 2015. [Google Scholar]
- SPC; SPREP; PIFS; UNDP; UNISDR; USP. Framework for Resilient Development in the Pacific: An integrated Approach to Address Climate Change and Disaster Risk Management (FRDP); Pacific Community (SPC): Suva, Fiji, 2017; ISBN 978-982-00-1034-5. [Google Scholar]
- Yeo, S.; Esler, S.; Taaffe, F.; Jordy, D.; Bonte-Grapentin, M. Urban Flood Risk Management in the Pacific: Tracking Progress and Setting Priorities; UFCOP, World Bank Group: Washington, DC, USA, 2017. [Google Scholar]
- Baisyet, P.M. Vaisigano River Watershed Management Plan; Food and Agricultural Organization (FAO): Rome, Italy, 1990. [Google Scholar]
- Yeo, S. A Review of Flooding in Apia, Samoa; SOPAC Technical Report 338; South Pacific Applied Geosciences Commission (SOPAC): Suva, Fiji, 2001. [Google Scholar]
- Filer, B.; Dearnley, C.; Buchanan, M.; Caddis, B. Review of the Interdependence of Flood Mitigation Options for the Vaisigano River Catchment; Prepared for United Nations Development Programme, Client Reference GCF SAM 001/17, BMT Document Reference: R.B22946.006.01.; BMT Eastern Australia Pty Ltd.: Brisbane, Australia, 2019. [Google Scholar]
- Water Technology Pty Ltd.; UNDP. Updated Flood Study of the Vaisigano River–Volume 1, 2 and 3; Prepared for the Ministry of Natural Resource and Environment, Water Technology; Water Technology Pty Ltd.: Melbourne, Australia, 2014.
- Intergovernmental Panel on Climate Change (IPCC). AR6 Climate Change 2021: The Physical Science Basis. Available online: https://www.ipcc.ch/report/ar6/wg1/ (accessed on 30 August 2021).
- The World Bank. Samoa Post-Disaster Needs Assessment Cyclone Evans 2012; Report No. ACS4432; The World Bank: Washington, DC, USA, 2013. [Google Scholar]
- Flood List. Samoa–Tropical Cyclone Gita Causes Landslides and Flooding. Available online: https://floodlist.com/australia/samoa-tropical-cyclone-gita-causes-landslides-and-flooding (accessed on 1 October 2021).
- Green Climate Fund. Strengthened Adaptive Capacity and Reduced Exposure to Climate Risks of Vulnerable Livelihoods and Infrastructure in the Vaisigano River Catchment, Environmental and Social Management Framework and Management Plan. Available online: https://pims.undp.org/attachments/5919/214510/1700637/1700918/FP-UNDP-021116-5919-Annex%20VI%20(b).pdf (accessed on 1 October 2021).
- The World Bank. Draft Early Warning System Needs Assessment and Investment Plan for the Pacific Islands–Samoa. Available online: https://documents1.worldbank.org/curated/en/983251584942847169/pdf/Early-Warning-System-Needs-Assessment-and-Investment-Plan-for-the-Pacific-Islands-Samoa.pdf (accessed on 30 August 2021).
- Williams, S.; Griffiths, J.; Miville, B.; O’Driscoll, M.; Kinsman, M.; Porteous, A.; Paulik, R.; Elley, G. Vaisigano Flood Monitoring, Early Warning and Decision Support System: Final Report; Vaisigano Catchment Project No. MNRE-2019-001, NIWA Client Report No. 2021070EI; NIWA: Christchurch, New Zealand, 2021. [Google Scholar]
- Samoa PacIOOS. WRF Simulations at UHM. Available online: http://www.soest.hawaii.edu/MET/Faculty/wrf/arwGS/arw_samoa_3km.html (accessed on 1 October 2021).
- MNRE; GHD Ltd. Vaisigano Flood of December 2012 Report on Damage and Possible Causes; GHD Ltd.: Christchurch, New Zealand, 2013. [Google Scholar]
- Lumbroso, D.; Titimaea, A.; Penaia, A.; Bonte-Grapentin, M. Samoa Technical Report 13th July–3rd August 2006, WS 3.5.4 Capacity Building in Flood Risk Management; EU-SOPAC Project Report 69c; SOPAC Commission: Suva, Fiji, 2008. [Google Scholar]
- Perica, S.; Dietz, S.; Heim, S.; Hiner, L.; Maitaria, K.; Martin, D.; Pavlovic, S.; Roy, I.; Trypaluk, C.; Unruh, D.; et al. Point Precipitation Frequency Estimates 2015. Available online: https://hdsc.nws.noaa.gov/hdsc/pfds/pfds_printpage.html?lat=34.4297&lon=-117.4522&da (accessed on 30 August 2021).
- Sherman, L. Stream Flow from Rainfall by the Unit Graph Method. Eng. News Rec. 1932, 108, 501–505. [Google Scholar]
- Ministry of Natural Resources and Environment (MNRE). Samoa Meteorological Services Forecasting Operational Plan, 3rd ed.; Ministry of Natural Resources and Environment: Apia, Samoa, 2020.
- Schmidt, J.; Matcham, I.; Reese, S.; King, A.; Bell, R.; Henderson, R.; Smart, G.; Cousins, J.; Smith, W.; Heron, D. Quantitative multi-risk analysis for natural hazards: A framework for multi-risk modelling. Nat. Hazards 2011, 58, 1169–1192. [Google Scholar] [CrossRef]
- FUGRO. Report of Survey: Airborne Lidar Bathymetric and Topographic Survey of Samoa 2015; Contract: ECRCR-LIB 2.1, Fugro LADS Document Reference No: TLCS00.047.008, Issue No: 1.00; Fugro LADS Corporation Pty Ltd.: Adelaide, Australia, 2015. [Google Scholar]
- Pacific Community (SPC). Pacific Risk Information System. Available online: http://pcrafi.spc.int/ (accessed on 1 October 2021).
- Australia and Oceania OpenStreetMap Data. Available online: https://download.geofabrik.de/australia-oceania.html (accessed on 30 October 2020).
- Cox, R.J.; Shand, T.D.; Blacka, M.J. Australian Rainfall and Runoff Revision Project 10: Appropriate Safety Criteria for People; Water Research Laboratory, Stage 1 Report P10/S1/006; Australian Rainfall and Runoff (AR&R): Manly Vale, Australia, 2010. [Google Scholar]
- Paulik, R. Methods for Estimating Vehicle Impacts from Flood Hazards in RiskScape; NIWA Client Report No: 2016008WN; NIWA: Wellington, New Zealand, 2016. [Google Scholar]
- CliDEsc. Available online: https://clidesc.readthedocs.io/en/latest/ (accessed on 18 October 2021).
- Flood List. Samoa–Damaging Floods and Landslides Strike After Heavy Rain. Available online: https://floodlist.com/australia/samoa-floods-landslides-december-2020 (accessed on 1 October 2021).
- Global Forecast System. Available online: https://www.ncei.noaa.gov/products/weather-climate-models/global-forecast (accessed on 1 October 2021).
- ECMWF Forecasts. Available online: https://www.ecmwf.int/en/forecasts (accessed on 1 October 2021).
- Dazzi, S.; Vacondio, R.; Mignosa, P. Flood Stage Forecasting Using Machine-Learning Methods: A Case Study on the Parma River (Italy). Water 2021, 13, 1612. [Google Scholar] [CrossRef]
- Ivanov, V.; Xu, D.; Dwelle, C.; Sargsyan, K.; Wright, D.; Katopodes, N.; Kim, J.; Tran, V.; Warnock, A.; Fatichi, S.; et al. Breaking Down the Computational Barriers to Real-Time Urban Flood Forecasting. Geophys. Res. Lett. 2021, 48, e2021GL093585. [Google Scholar] [CrossRef]
- Merz, B.; Kuhlicke, C.; Kunz, M.; Pittore, M.; Babeyko, A.; Bresch, D.N.; Domeisen, D.I.V.; Feser, F.; Koszalka, I.; Kreibich, H.; et al. Impact forecasting to support emergency management of natural hazards. In Rev. Geophys.; 2021; Volume 58. [Google Scholar]
- Practical Action. Transforming Lives Through Ingenuity: Practical Action and Early Warning Systems; Practical Action Publishing: Rugby, UK, 2020. [Google Scholar]
- Marchezini, V.; Horita, F.E.A.; Matsuo, P.M.; Trajber, R.; Trajber, M.A.; Olivato, D. A Review of Studies on Particimpory Early Warning Systems (P-EWS): Pathways to Support Citizen Science Initiatives. In Early Warning Systems (P-EWS): Pathways to Support Citizen Science Initiatives.; 2018; Volume 6. [Google Scholar]
- Zhang, X.; Zhong, Q.; Zhang, R.; Zhang, M. People-centered early warning systems in China: A bibliometric analysis of policydocuments. In Int. J. Disaster Risk. Reduct.; 2020; Volume 51. [Google Scholar]
Figure 1.
Monitored sub-catchments in the Vaisigano River catchment boundary showing perennial and ephemeral tributaries in relation to the downstream urban areas of Apia. The distribution of rainfall and river level/flow monitoring stations used in this study are shown.
Figure 1.
Monitored sub-catchments in the Vaisigano River catchment boundary showing perennial and ephemeral tributaries in relation to the downstream urban areas of Apia. The distribution of rainfall and river level/flow monitoring stations used in this study are shown.
Figure 2.
Simplified flood decision support system (FDSS) schema showing key data components and information workflow. Real-time observations (or nowcast) and forecast data are integrated with a library of precomputed flood hazard and impacts data, which are accessible to local operators as decision-ready tools on a web-based portal. This relatively low-cost FDSS was developed between February 2020 and April 2021.
Figure 3.
Thiessen polygons for automatic rain gauges (ARG) and automatic weather stations (AWS) in or near the Vaisigano catchment.
Figure 3.
Thiessen polygons for automatic rain gauges (ARG) and automatic weather stations (AWS) in or near the Vaisigano catchment.
Figure 4.
Schematic of alerting criteria used to indicate increased flood risk. This is pre-configured and displayed on the predicted ‘Flood Status’ and ‘Peak Expected Time’ tools on the flood decision support system (FDSS) web-portal.
Figure 4.
Schematic of alerting criteria used to indicate increased flood risk. This is pre-configured and displayed on the predicted ‘Flood Status’ and ‘Peak Expected Time’ tools on the flood decision support system (FDSS) web-portal.
Figure 5.
Conceptual representation of the impact model workflow in RiskScape. Here, flood inundation depth (D) and depth-velocity (DV) represent hazard layers, building and road objects represent exposure layers, with impacts calculated from vulnerability functions relating D and DV hazard with building and roads exposure and threat to safety levels.
Figure 6.
Vaisigano flood decision support system (FDSS) web-portal interface tools (example forecast event only). In this example, time series of forecast flood peak and magnitude at river gauge sites along with corresponding maps/tables of flood hazard and human safety at building/road locations are displayed.
Figure 7.
(a) Forecast rainfall for 9am on 18th December 2020 local Samoan time (WRF model issued at 0000 UTC on 17th December 2020). (b) Observed 5-min and (c) 10-min river stage at Lelata and Alaoa East river gauging sites, and weighted rainfall for Alaoa East associated with the 18th December 2020 flooding.
Table 1.
Historic rainfall and flow timeseries for the Vaisigano catchment used in this study.
Table 1.
Historic rainfall and flow timeseries for the Vaisigano catchment used in this study.
| Parameter | Monitoring
Station | 2009 | 2010 | 2011 | 2012 1 | 2013 | 2014 | 2015 | 2016 | 2017 | 2018 2 | 2019 | 2020 |
|---|
| Rainfall | Lake Lanotoo | | | ✓ | ✓ | ✓ | ✓ | ✓ | ✓ | ✓ | ✓ | ✓ | ✓ |
| | Mt. Le Pue | | | | | ✓ | ✓ | ✓ | ✓ | ✓ | ✓ | ✓ | |
| | Tiavi | | | | | | | ✓ | ✓ | ✓ | ✓ | ✓ | |
| | Alaoa West | | | | | ✓ | ✓ | ✓ | ✓ | ✓ | ✓ | ✓ | ✓ |
| | Afiamalu AWS | | ✓ | ✓ | ✓ | ✓ | ✓ | ✓ | ✓ | ✓ | ✓ | ✓ | ✓ |
| | Nafanua AWS | | ✓ | ✓ | ✓ | ✓ | ✓ | ✓ | ✓ | ✓ | ✓ | ✓ | |
| River Level | Lelata Bridge | | | | | | | | | | ✓ | ✓ | ✓ |
| | Alaoa West | | | | | | | | | | ✓ | ✓ | |
| | Alaoa East | ✓ | ✓ | ✓ | ✓ | ✓ | ✓ | ✓ | ✓ | ✓ | ✓ | ✓ | ✓ |
Table 2.
Intensity-Duration-Frequency (IDF) threshold values used in this study.
Table 2.
Intensity-Duration-Frequency (IDF) threshold values used in this study.
| Duration | Rainfall Intensity (mm/h) for Different Return Period Events 1 |
|---|
| 1 in 5 Year | 1 in 10 Year | 1 in 25 Year | 1 in 50 Year | 1 in 100 Year |
|---|
| 5-min | 313 | 365 | 412 | 450 | 493 |
| 10-min | 242 | 283 | 320 | 350 | 382 |
| 15-min | 204 | 240 | 270 | 295 | 323 |
| 30-min | 142 | 166 | 187 | 204 | 223 |
| 1-h | 90 | 105 | 119 | 129 | 142 |
| 2-h | 57 | 66 | 72 | 80 | 87 |
| 3-h | 40 | 47 | 50 | 57 | 62 |
Table 3.
Rating curve equations for different stage-flow ranges at Alaoa East river gauge.
Table 3.
Rating curve equations for different stage-flow ranges at Alaoa East river gauge.
| Stage (m) | Discharge Equation (m3/s) |
|---|
| 0 to 0.125 | Discharge = 0.470 × Stage1.232 |
| >0.125 to ≤0.375 | Discharge = 0.470 × Stage1.233 |
| >0.375 to ≤0.6 | Discharge = 0.470 × Stage1.234 |
| >0.6 to ≤0.825 | Discharge = 2.799 × Stage3.807 |
| >0.825 to ≤1.0625 | Discharge = 2.374 × Stage3.345 |
| >1.0625 to ≤1.3125 | Discharge = 2.364 × Stage3.261 |
| >1.3125 to ≤1.5625 | Discharge = 2.421 × Stage3.114 |
| >1.5625 to ≤1.825 | Discharge = 2.455 × Stage3.076 |
| >1.855 to ≤2.1125 | Discharge = 2.424 × Stage3.101 |
| >2.1125 to ≤2.375 | Discharge = 2.409 × Stage3.110 |
| >2.375 to ≤2.85 | Discharge = 2.710 × Stage2.965 |
| >2.85 | Discharge = 4.360 × Stage2.446 |
Table 4.
Design event flows for Alaoa East station adapted from [
23].
Table 4.
Design event flows for Alaoa East station adapted from [
23].
| Return Period (Years) | Design Event Flows at Alaoa East Gauge (Eastern Catchment) | Design Flows at Electric Power Corporation Weir
(Eastern, Central and Western Catchments) (m3/s) |
|---|
| Flow (m3/s) | Level (m Gauge Datum) |
|---|
| 1 | 17 | 1.7 | 29 |
| 2 | 41 | 2.6 | 69 |
| 5 | 82 | 3.2 | 139 |
| 10 | 131 | 3.6 | 222 |
| 20 | 204 | 4.0 | 346 |
| 50 | 358 | 4.8 | 608 |
| 100 | 542 | 5.4 | 921 |
| 200 | 814 | 6.4 | 1384 |
| 500 | 1382 | 7.8 | 2350 |
| 1000 | 2052 | 9.3 | 3489 |
Table 5.
Predicted critical rainfall characteristics for 5-, 20-, 100- and 1000-year return period and associated predicted flows at Lelata Bridge and re-scaled critical flows for Alaoa East and Alaoa West using catchment areas.
Table 5.
Predicted critical rainfall characteristics for 5-, 20-, 100- and 1000-year return period and associated predicted flows at Lelata Bridge and re-scaled critical flows for Alaoa East and Alaoa West using catchment areas.
| | | Return Period Event | Source |
|---|
| 5-Year | 20-Year | 100-Year | 1000-Year |
|---|
| Rainfall | Total (mm) | 93.5 | 127.0 | 133.7 | 337.3 | [33] |
| | Duration (mins) | 45.0 | 60.0 | 45.0 | 45.0 | [22] |
| | Intensity (mm/h) | 133.2 | 127.0 | 190.5 | 240.4 | [32], estimated from 30 and 60 min for the 45 min critical duration events |
| Flow (m3/s) | Lelata Bridge | 550.0 | 690.0 | 862.0 | 1137.0 | [22] |
| | Alaoa East | 292.0 | 366.0 | 458.0 | 604.0 | Scaled by area from the Lelata Bridge model in [22] |
| | Alaoa West | 181.0 | 227.0 | 284.0 | 374.0 | Scaled by area from the Lelata Bridge model in [22] |
| Publisher’s Note: MDPI stays neutral with regard to jurisdictional claims in published maps and institutional affiliations. |
© 2021 by the authors. Licensee MDPI, Basel, Switzerland. This article is an open access article distributed under the terms and conditions of the Creative Commons Attribution (CC BY) license (https://creativecommons.org/licenses/by/4.0/).


 ,
, 


