
Proposing the Optimum Withdrawing Scenarios to Provide the Western Coastal Area of Port Said, Egypt, with Sufficient Groundwater with Less Salinity

 ,
,  , , and
Abstract
:1. Introduction
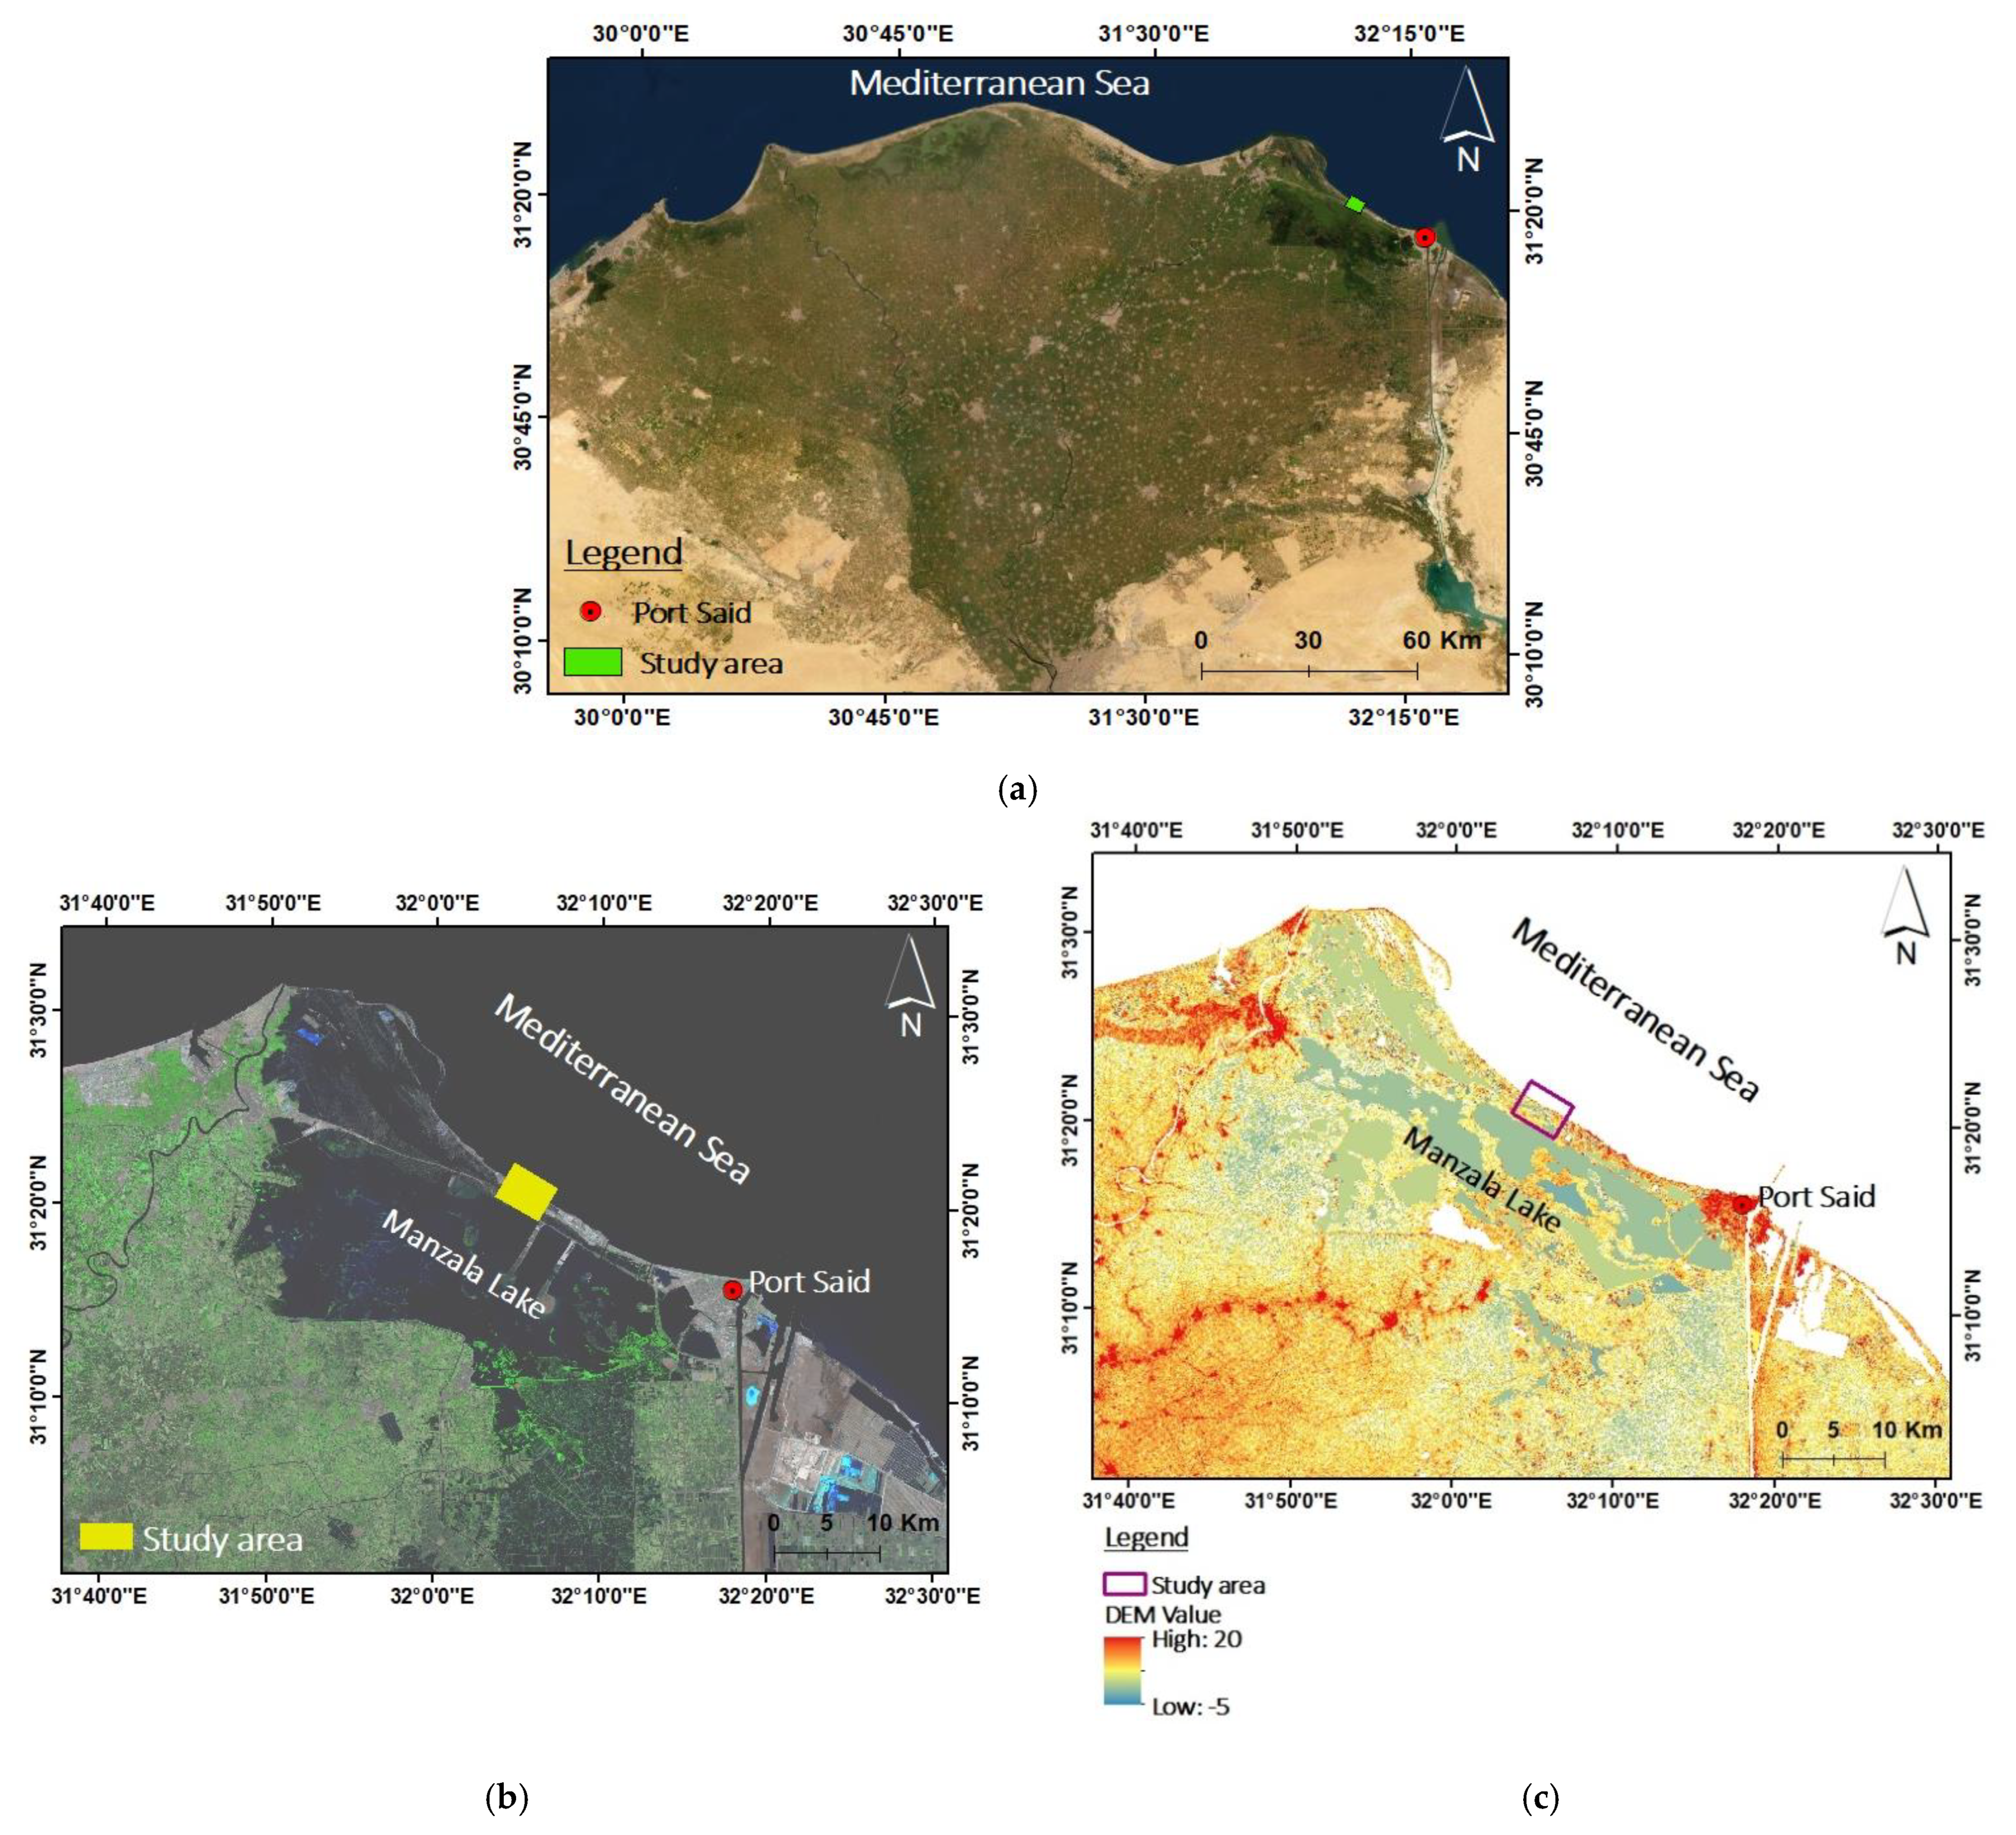
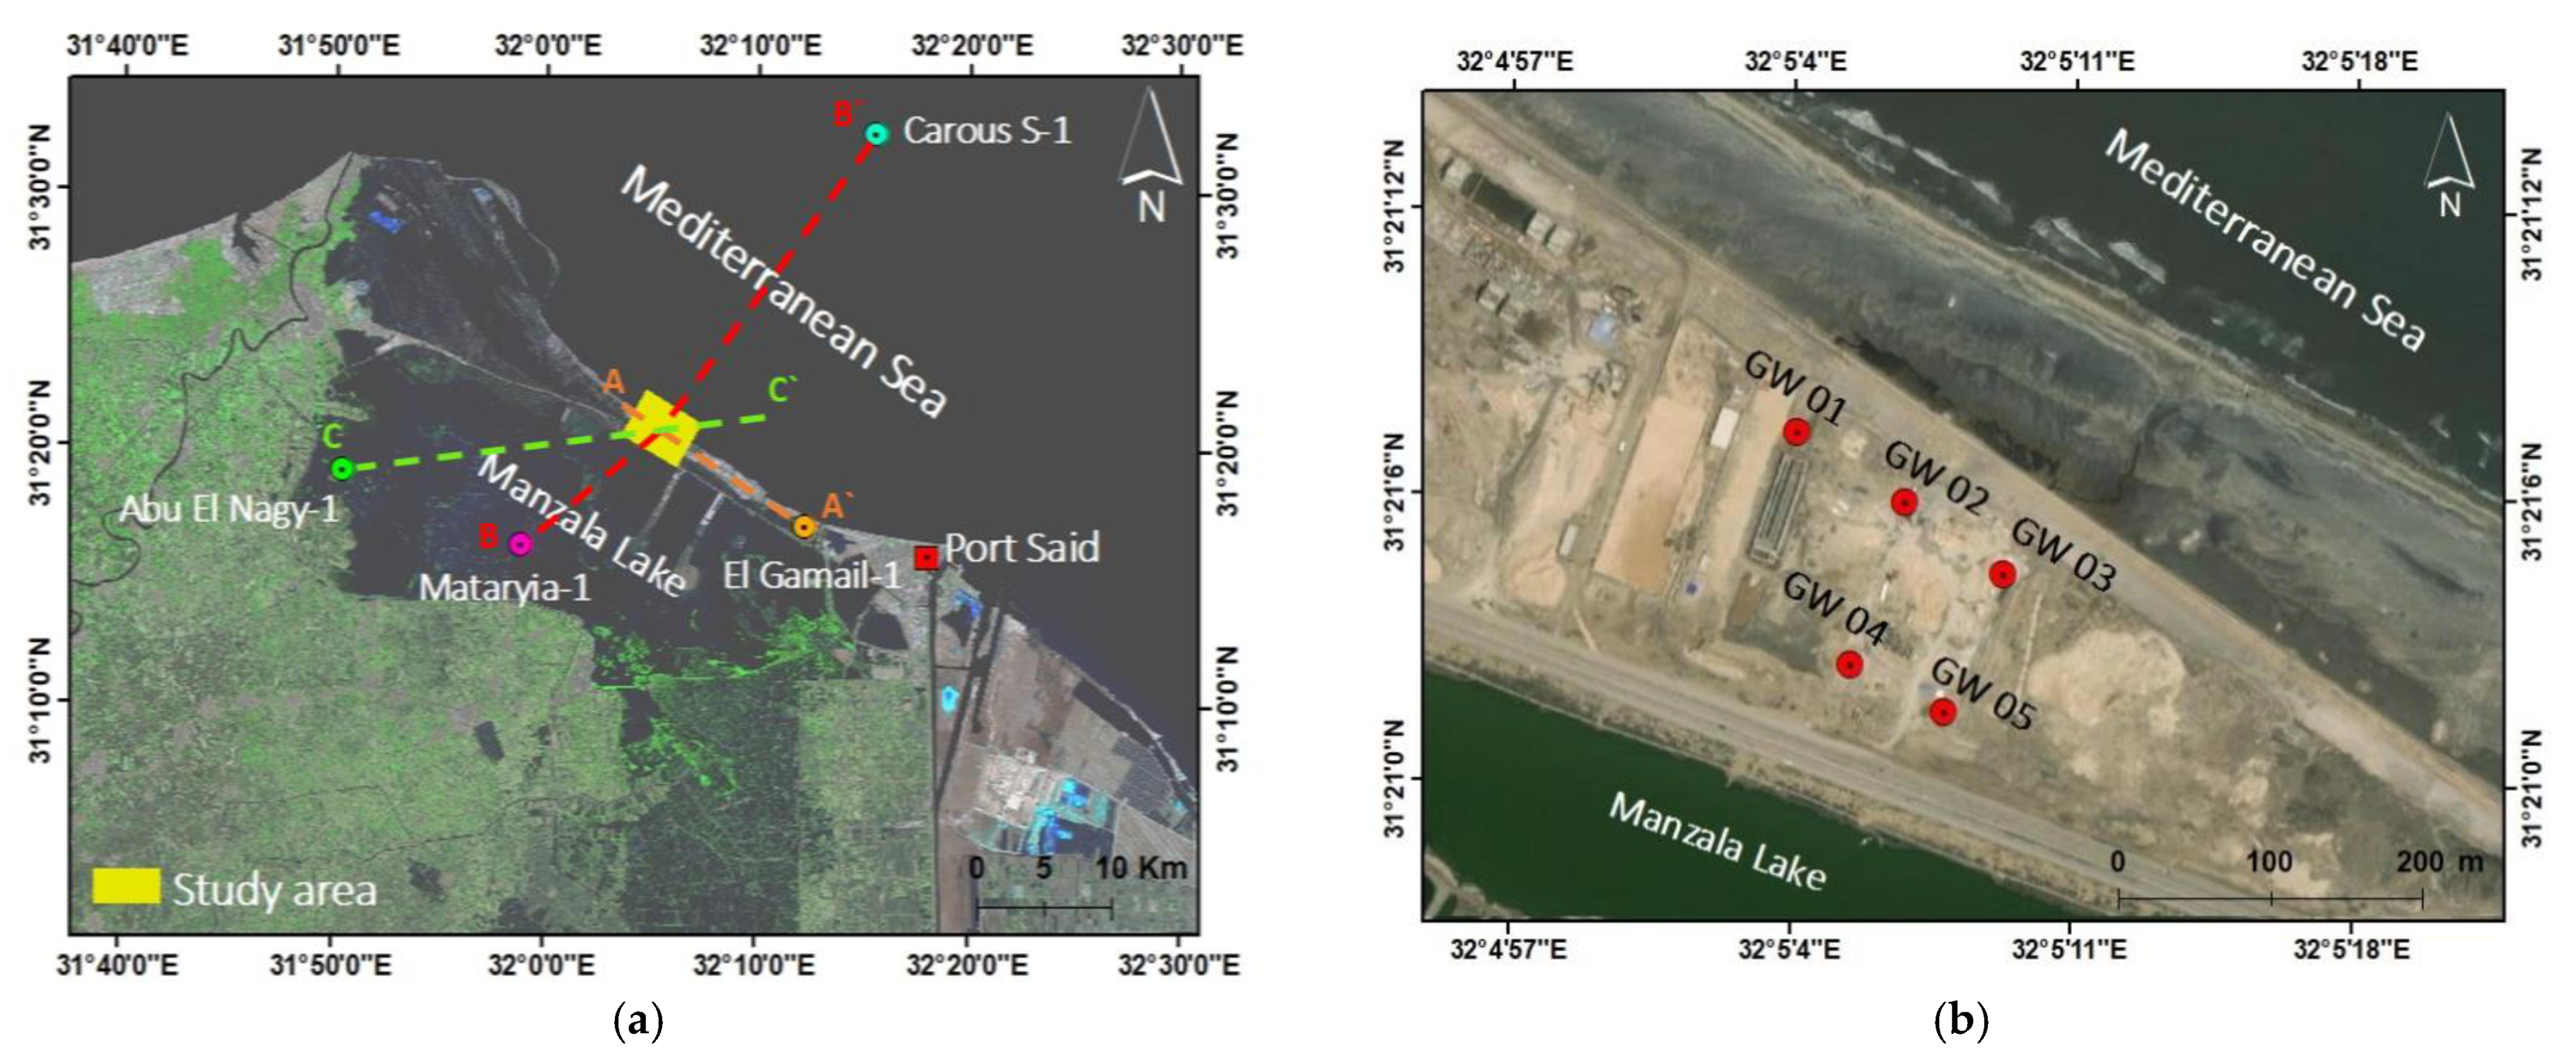
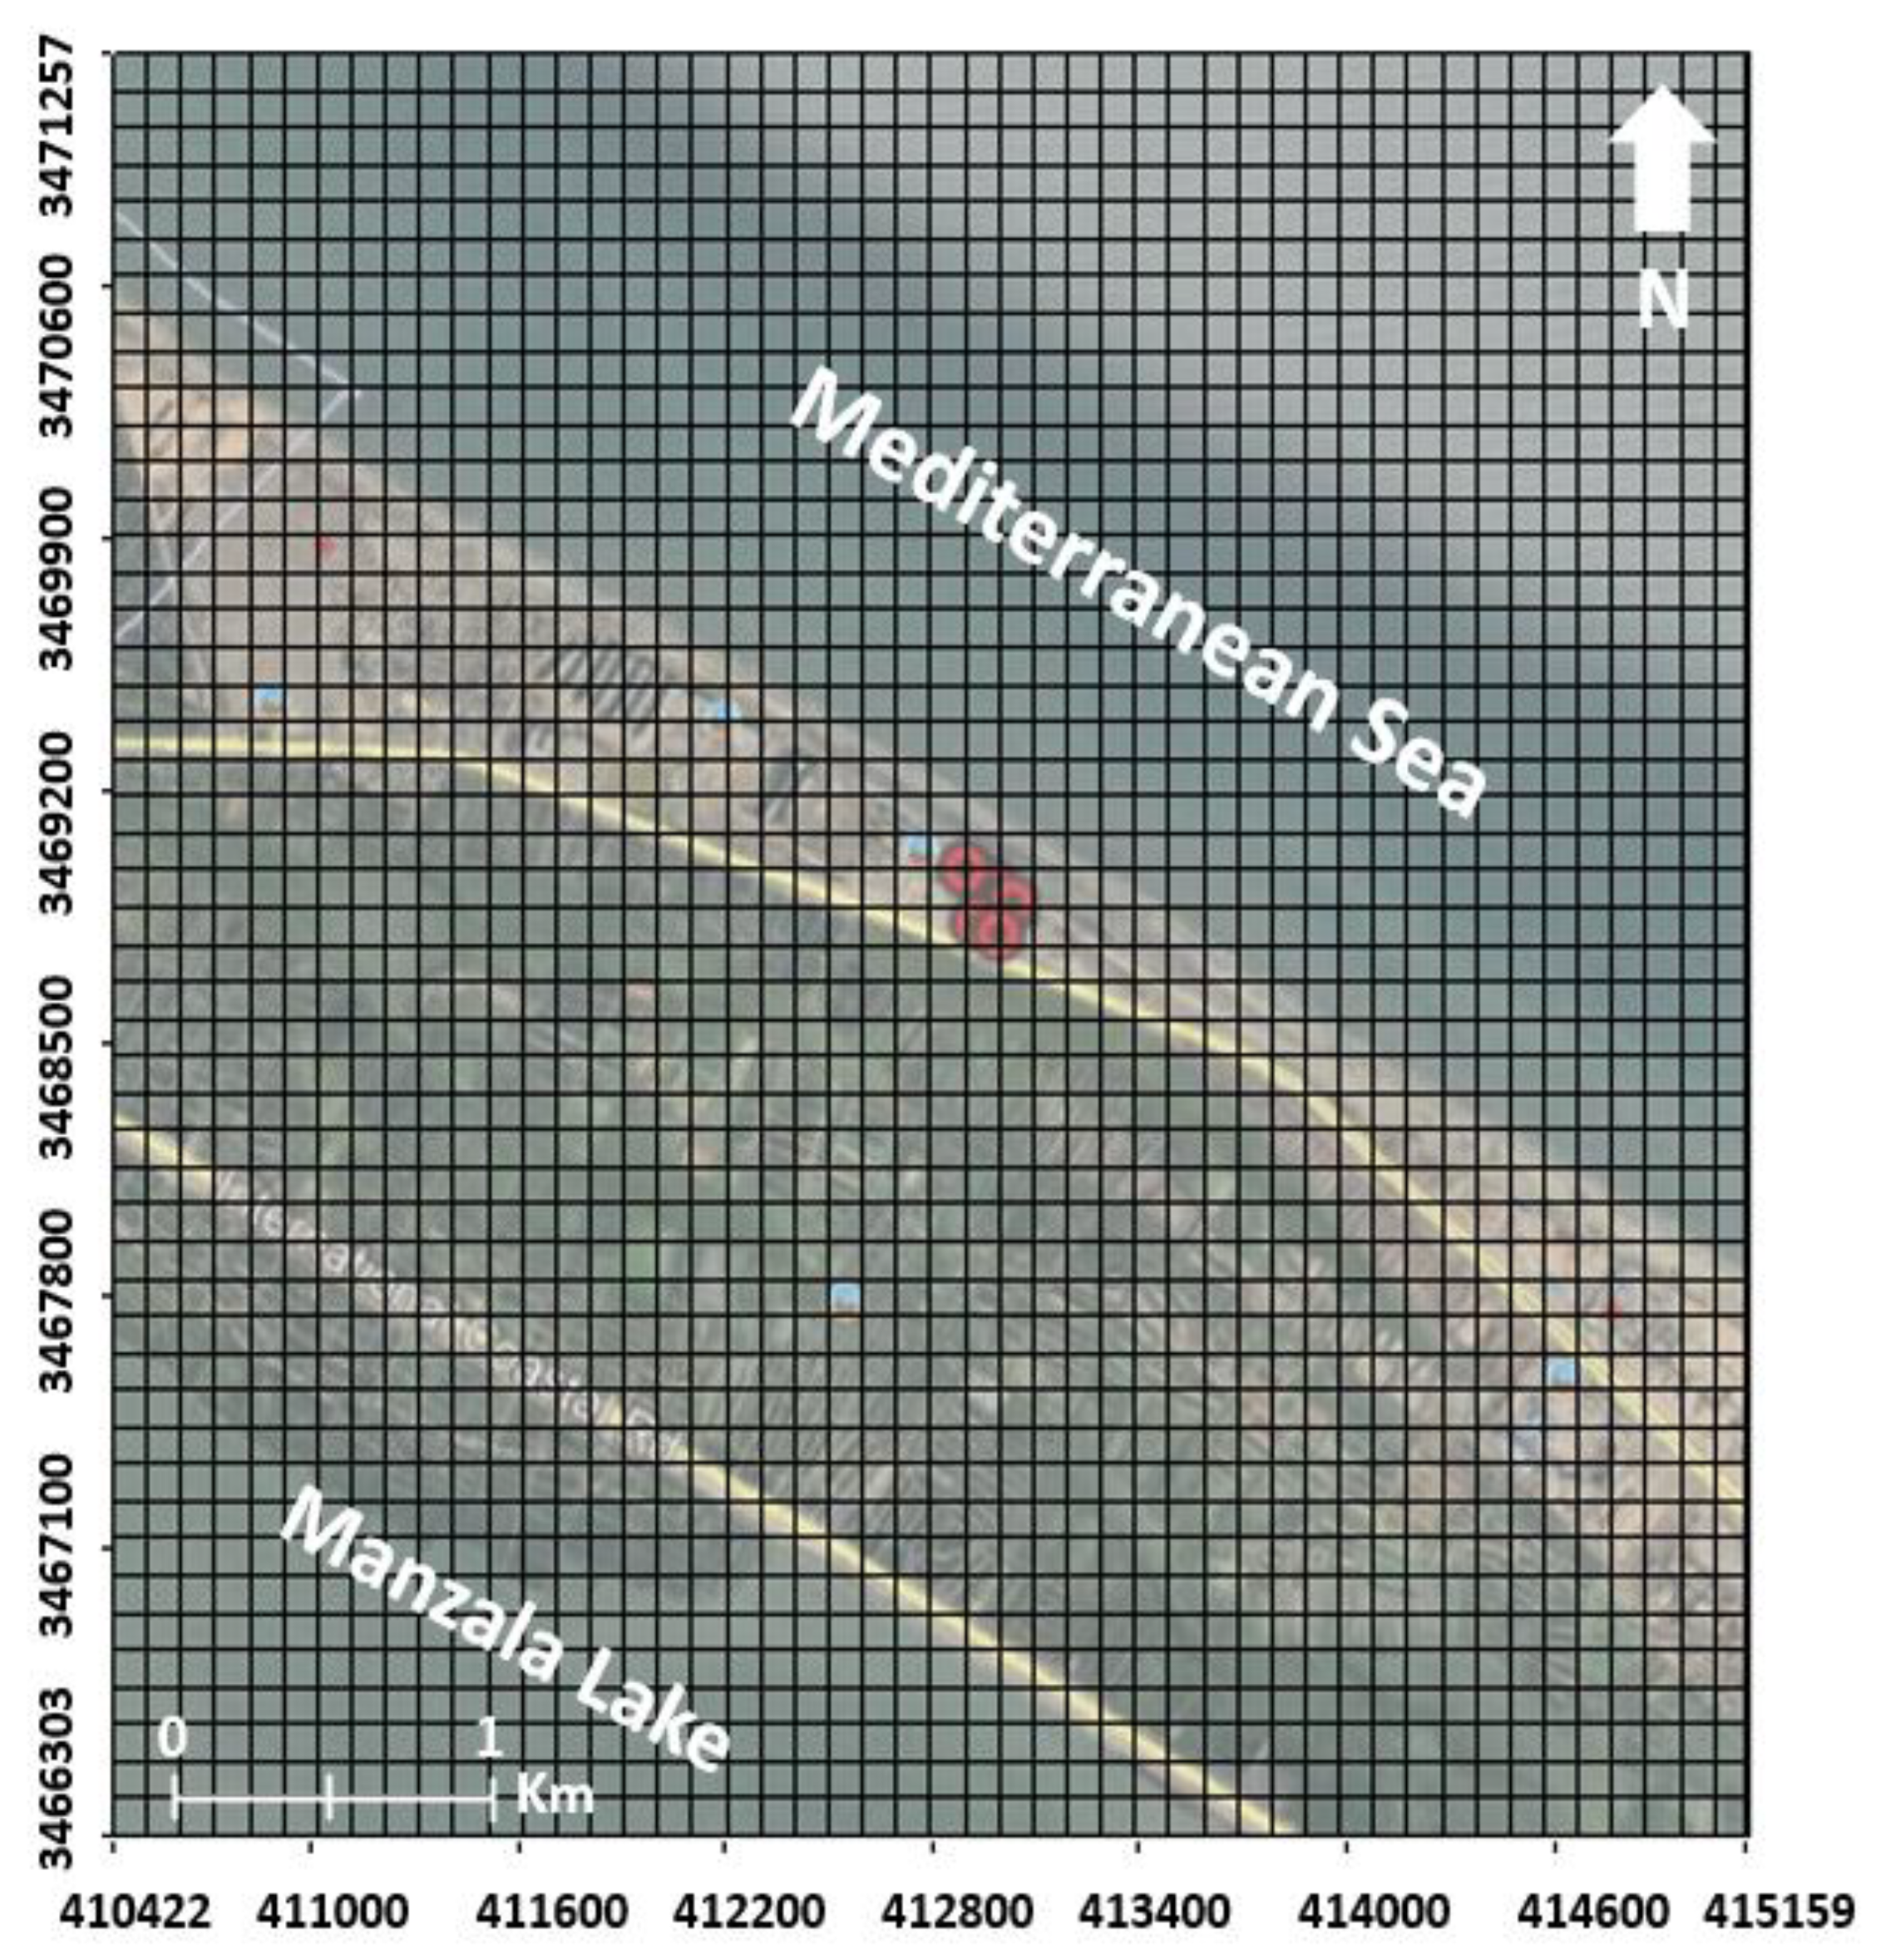
2. The Study Area
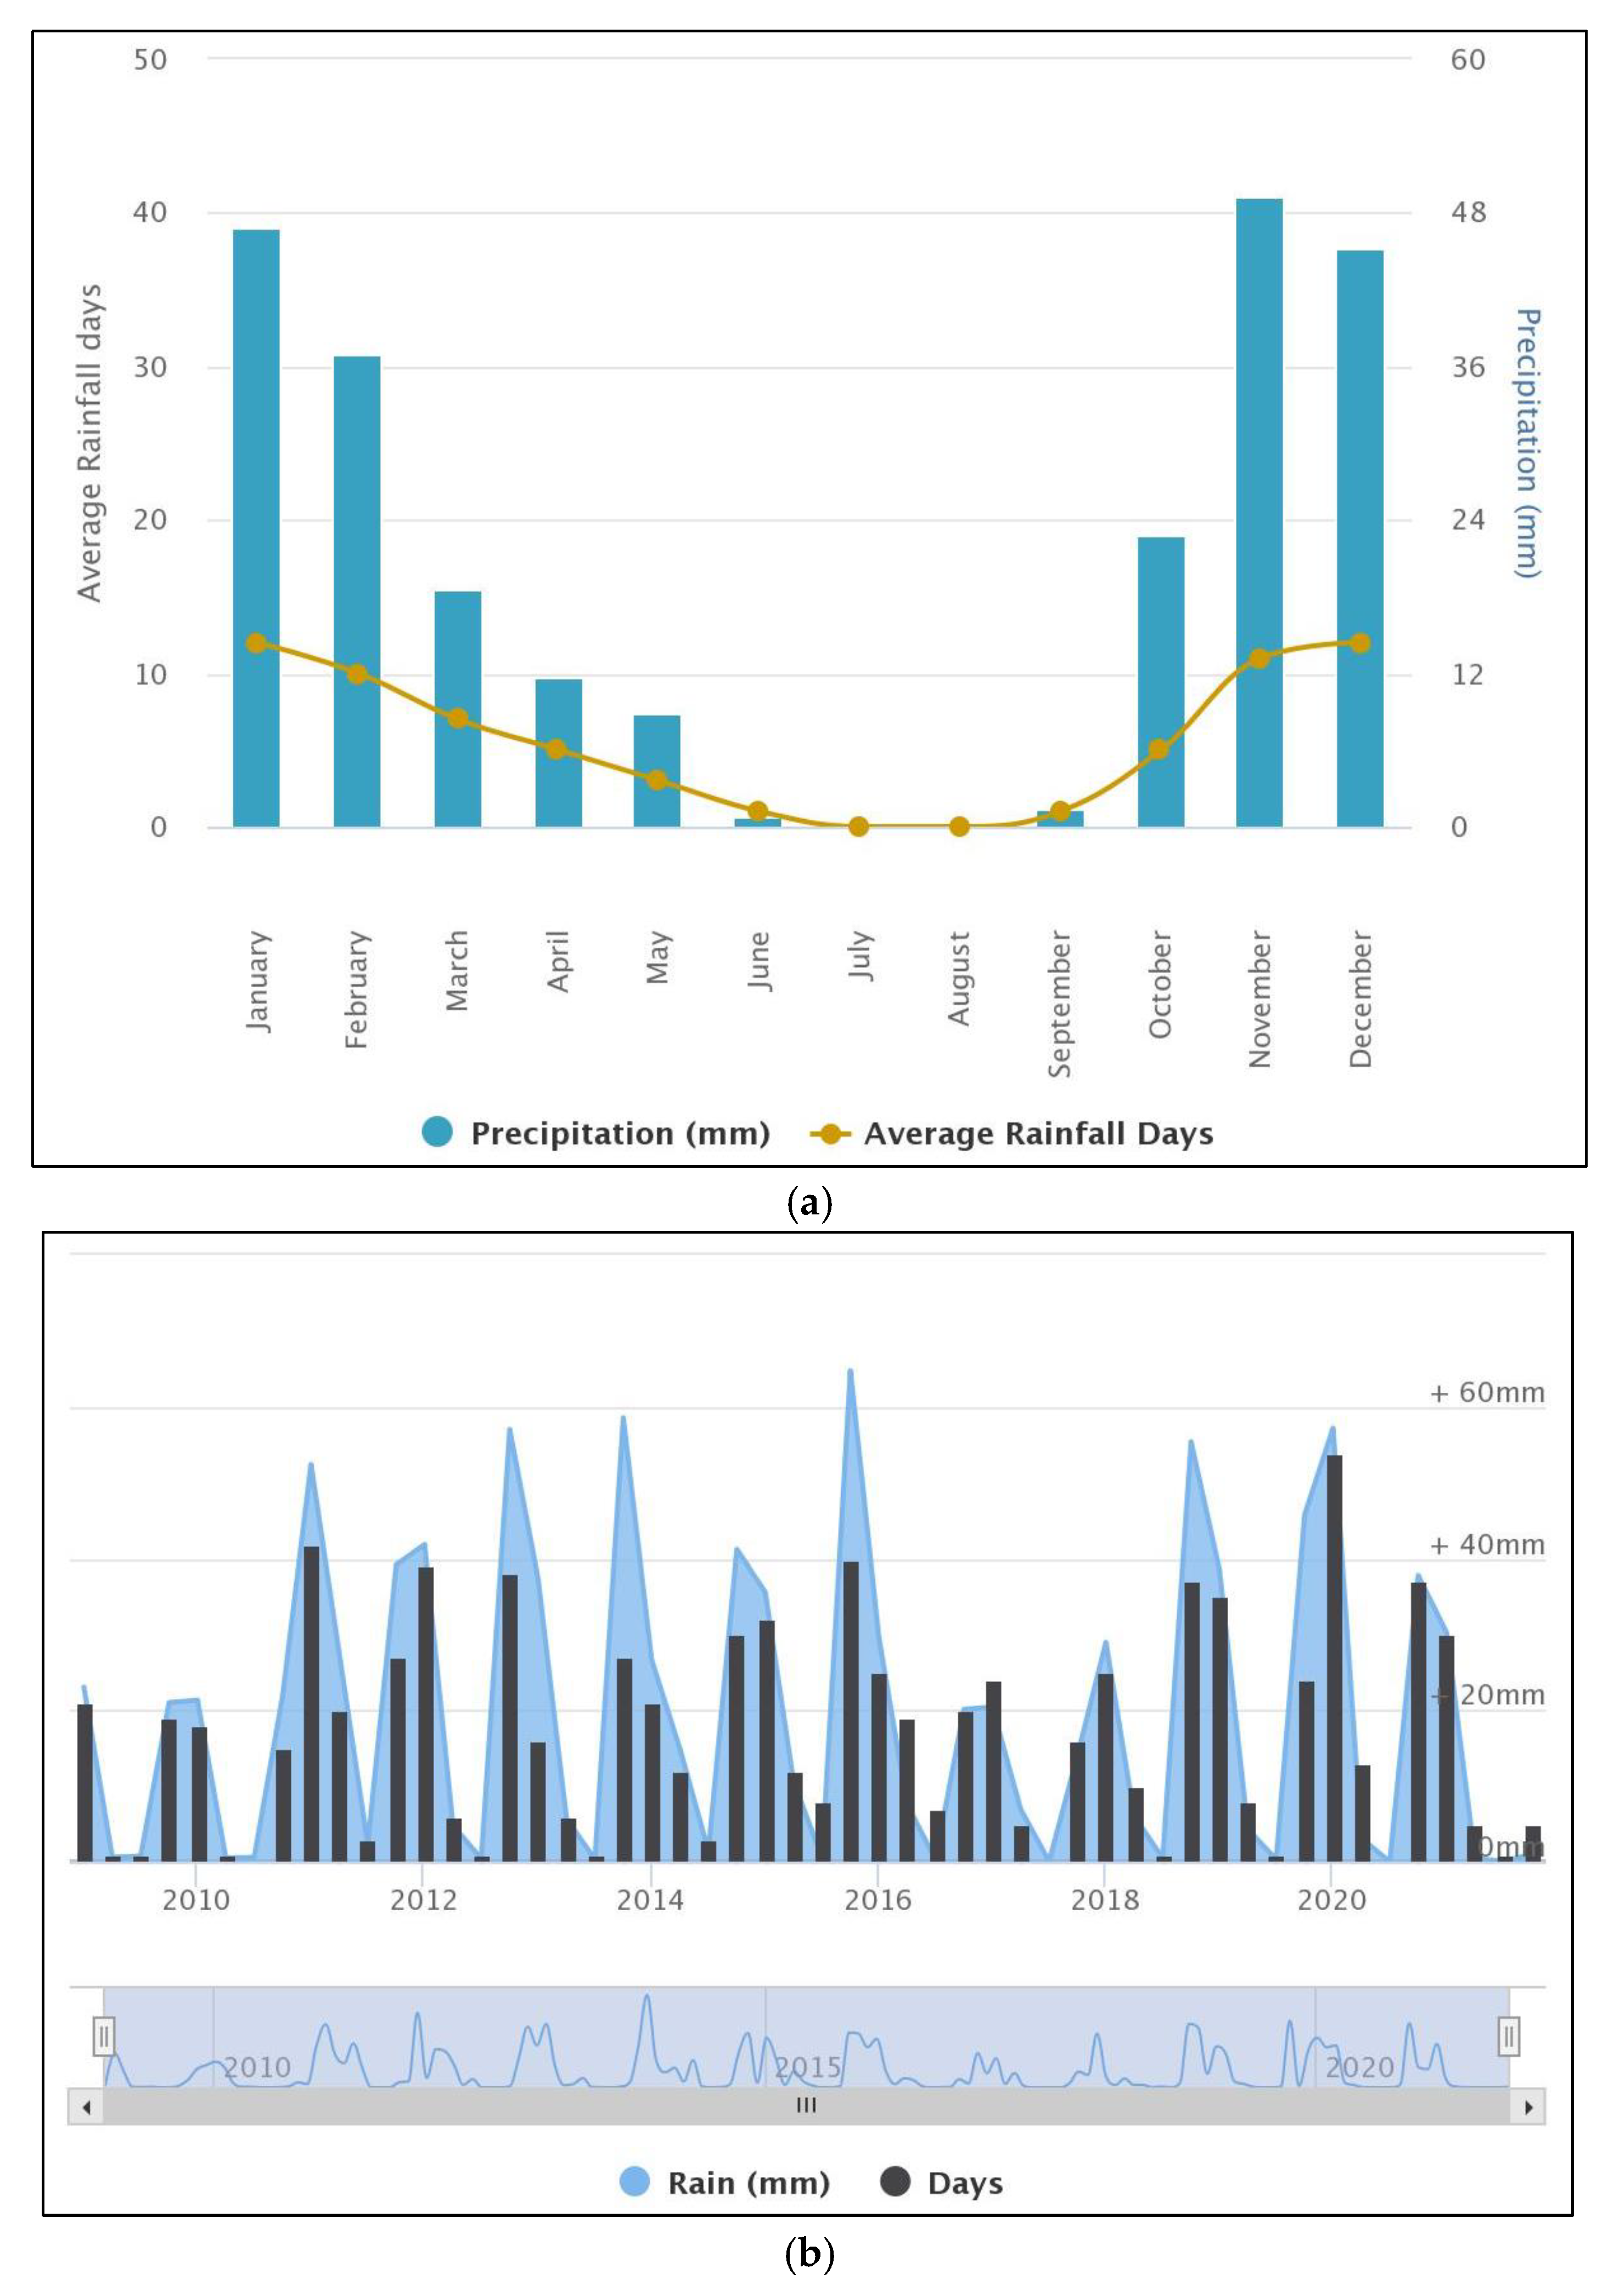
2.1. Meteorological Data of the Study Area
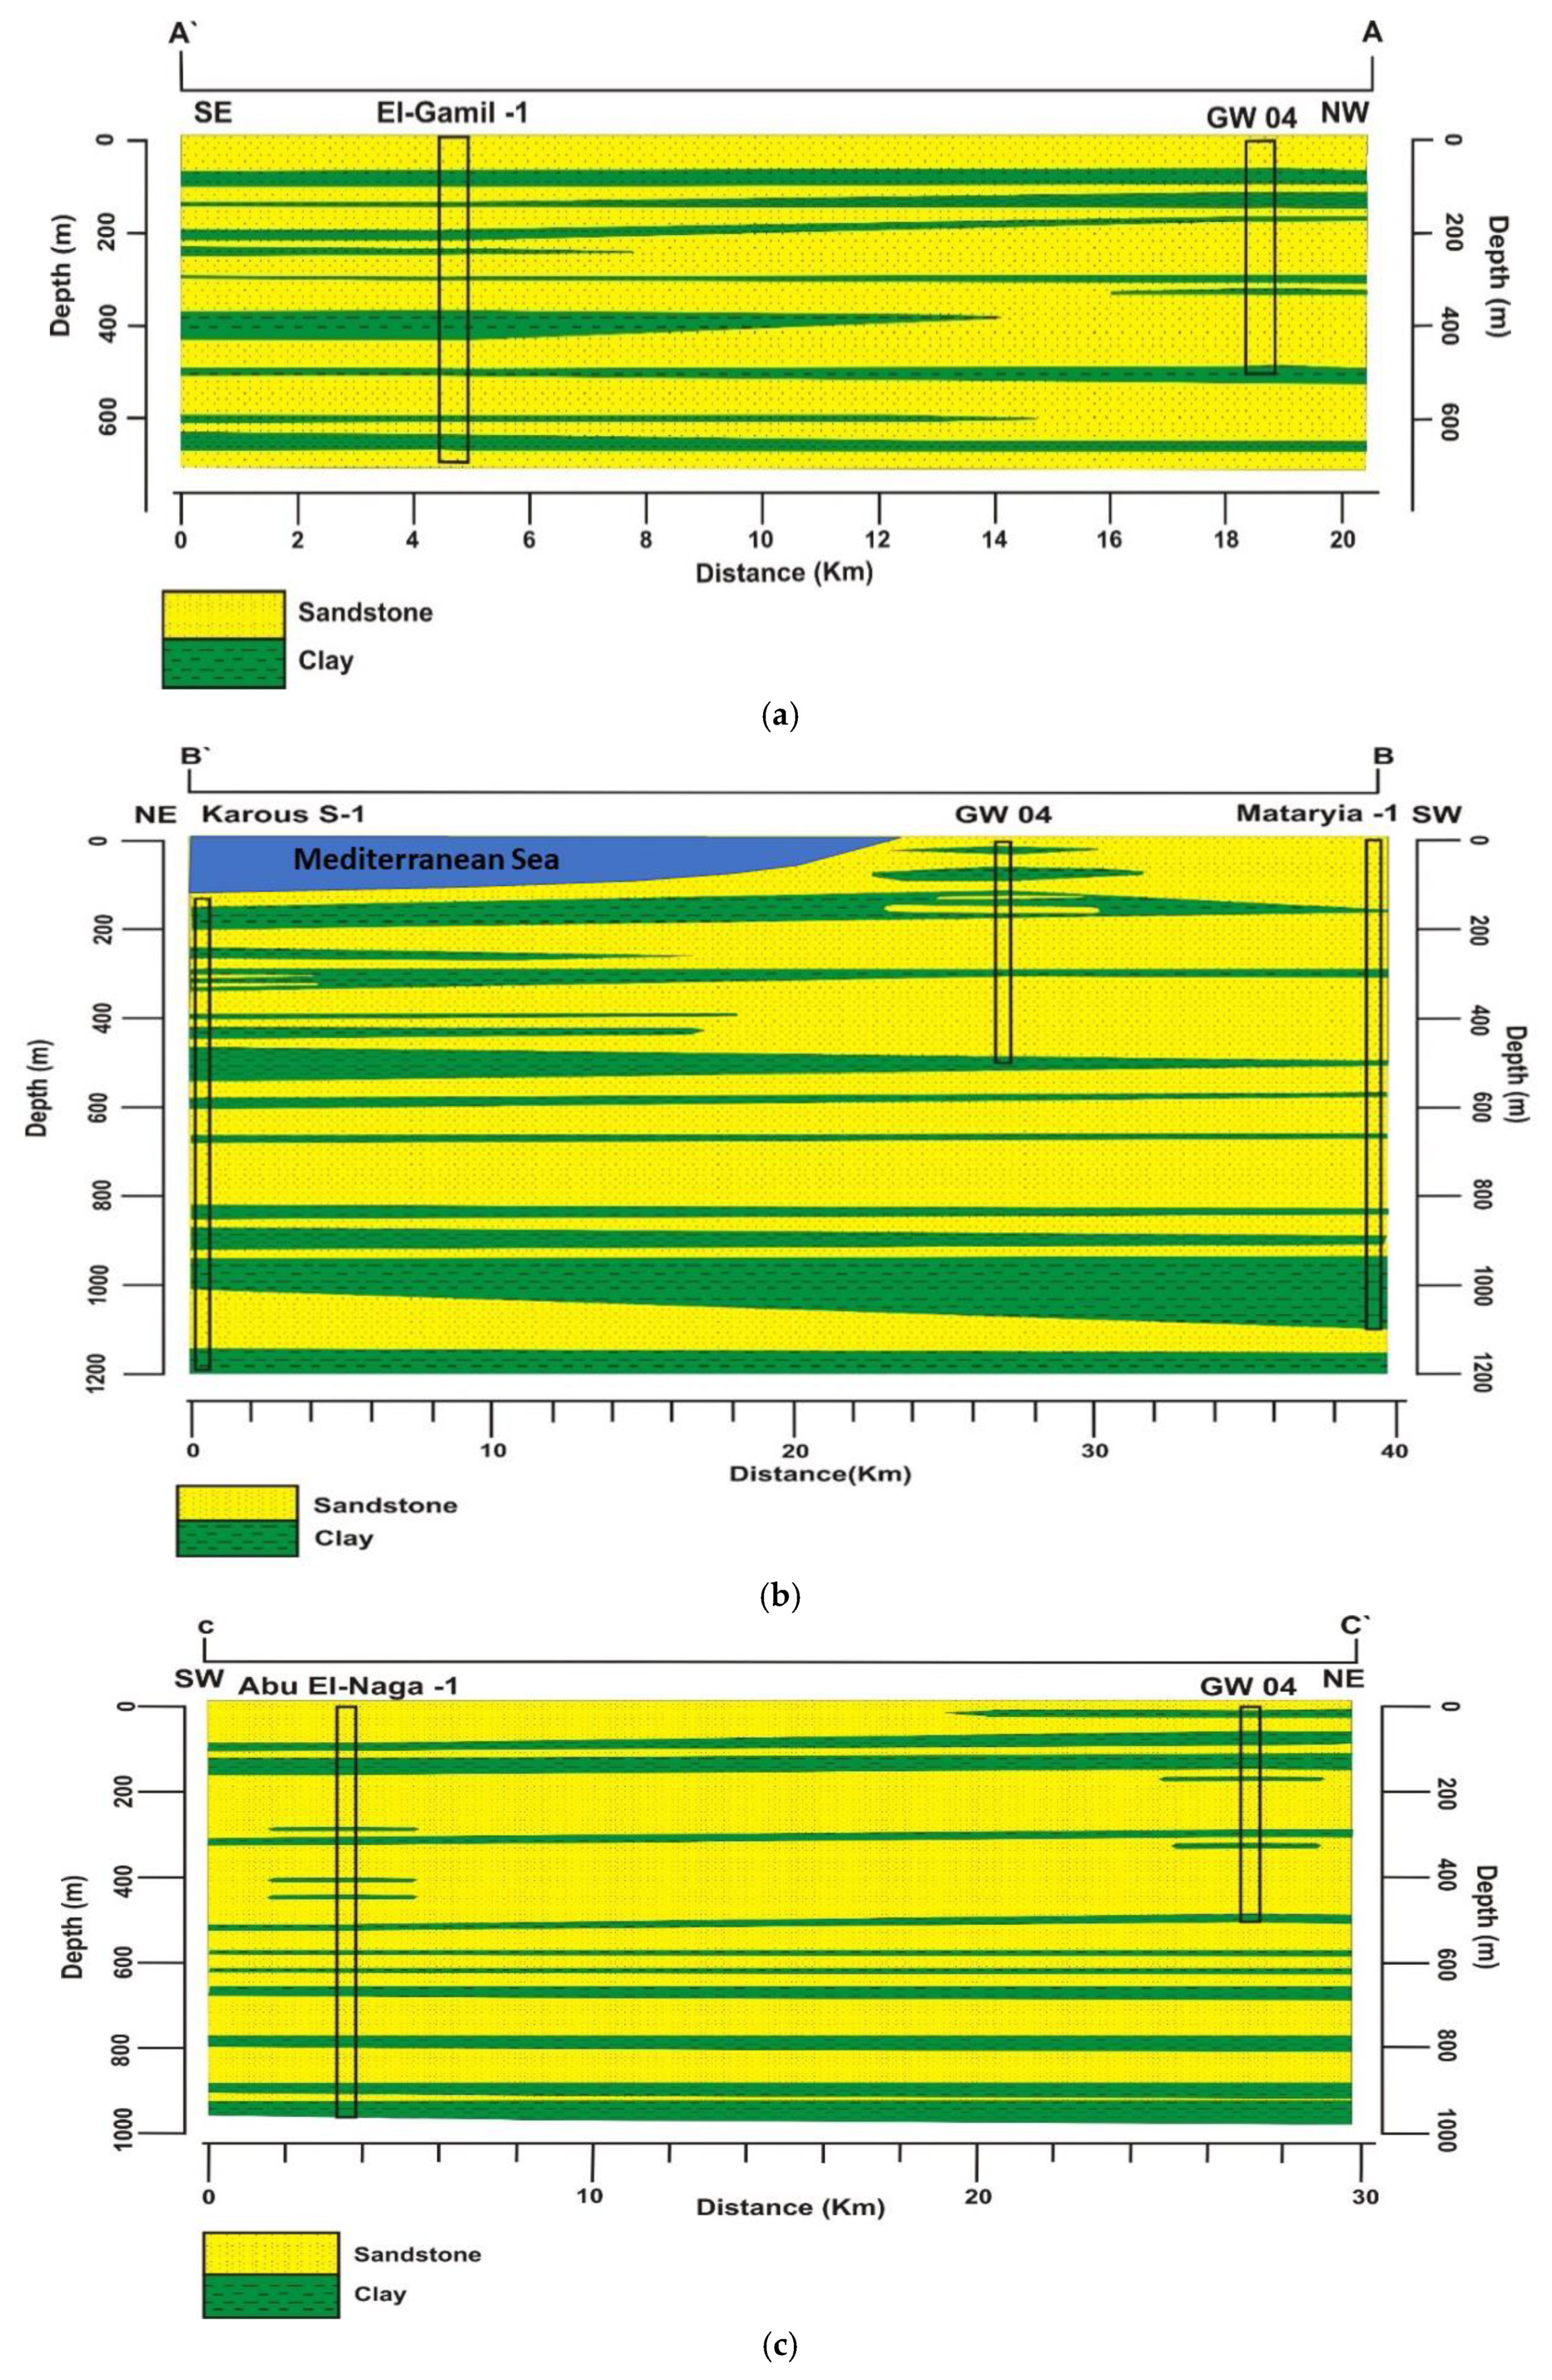
2.2. Geological Setting
2.3. Hydrogeological Setting
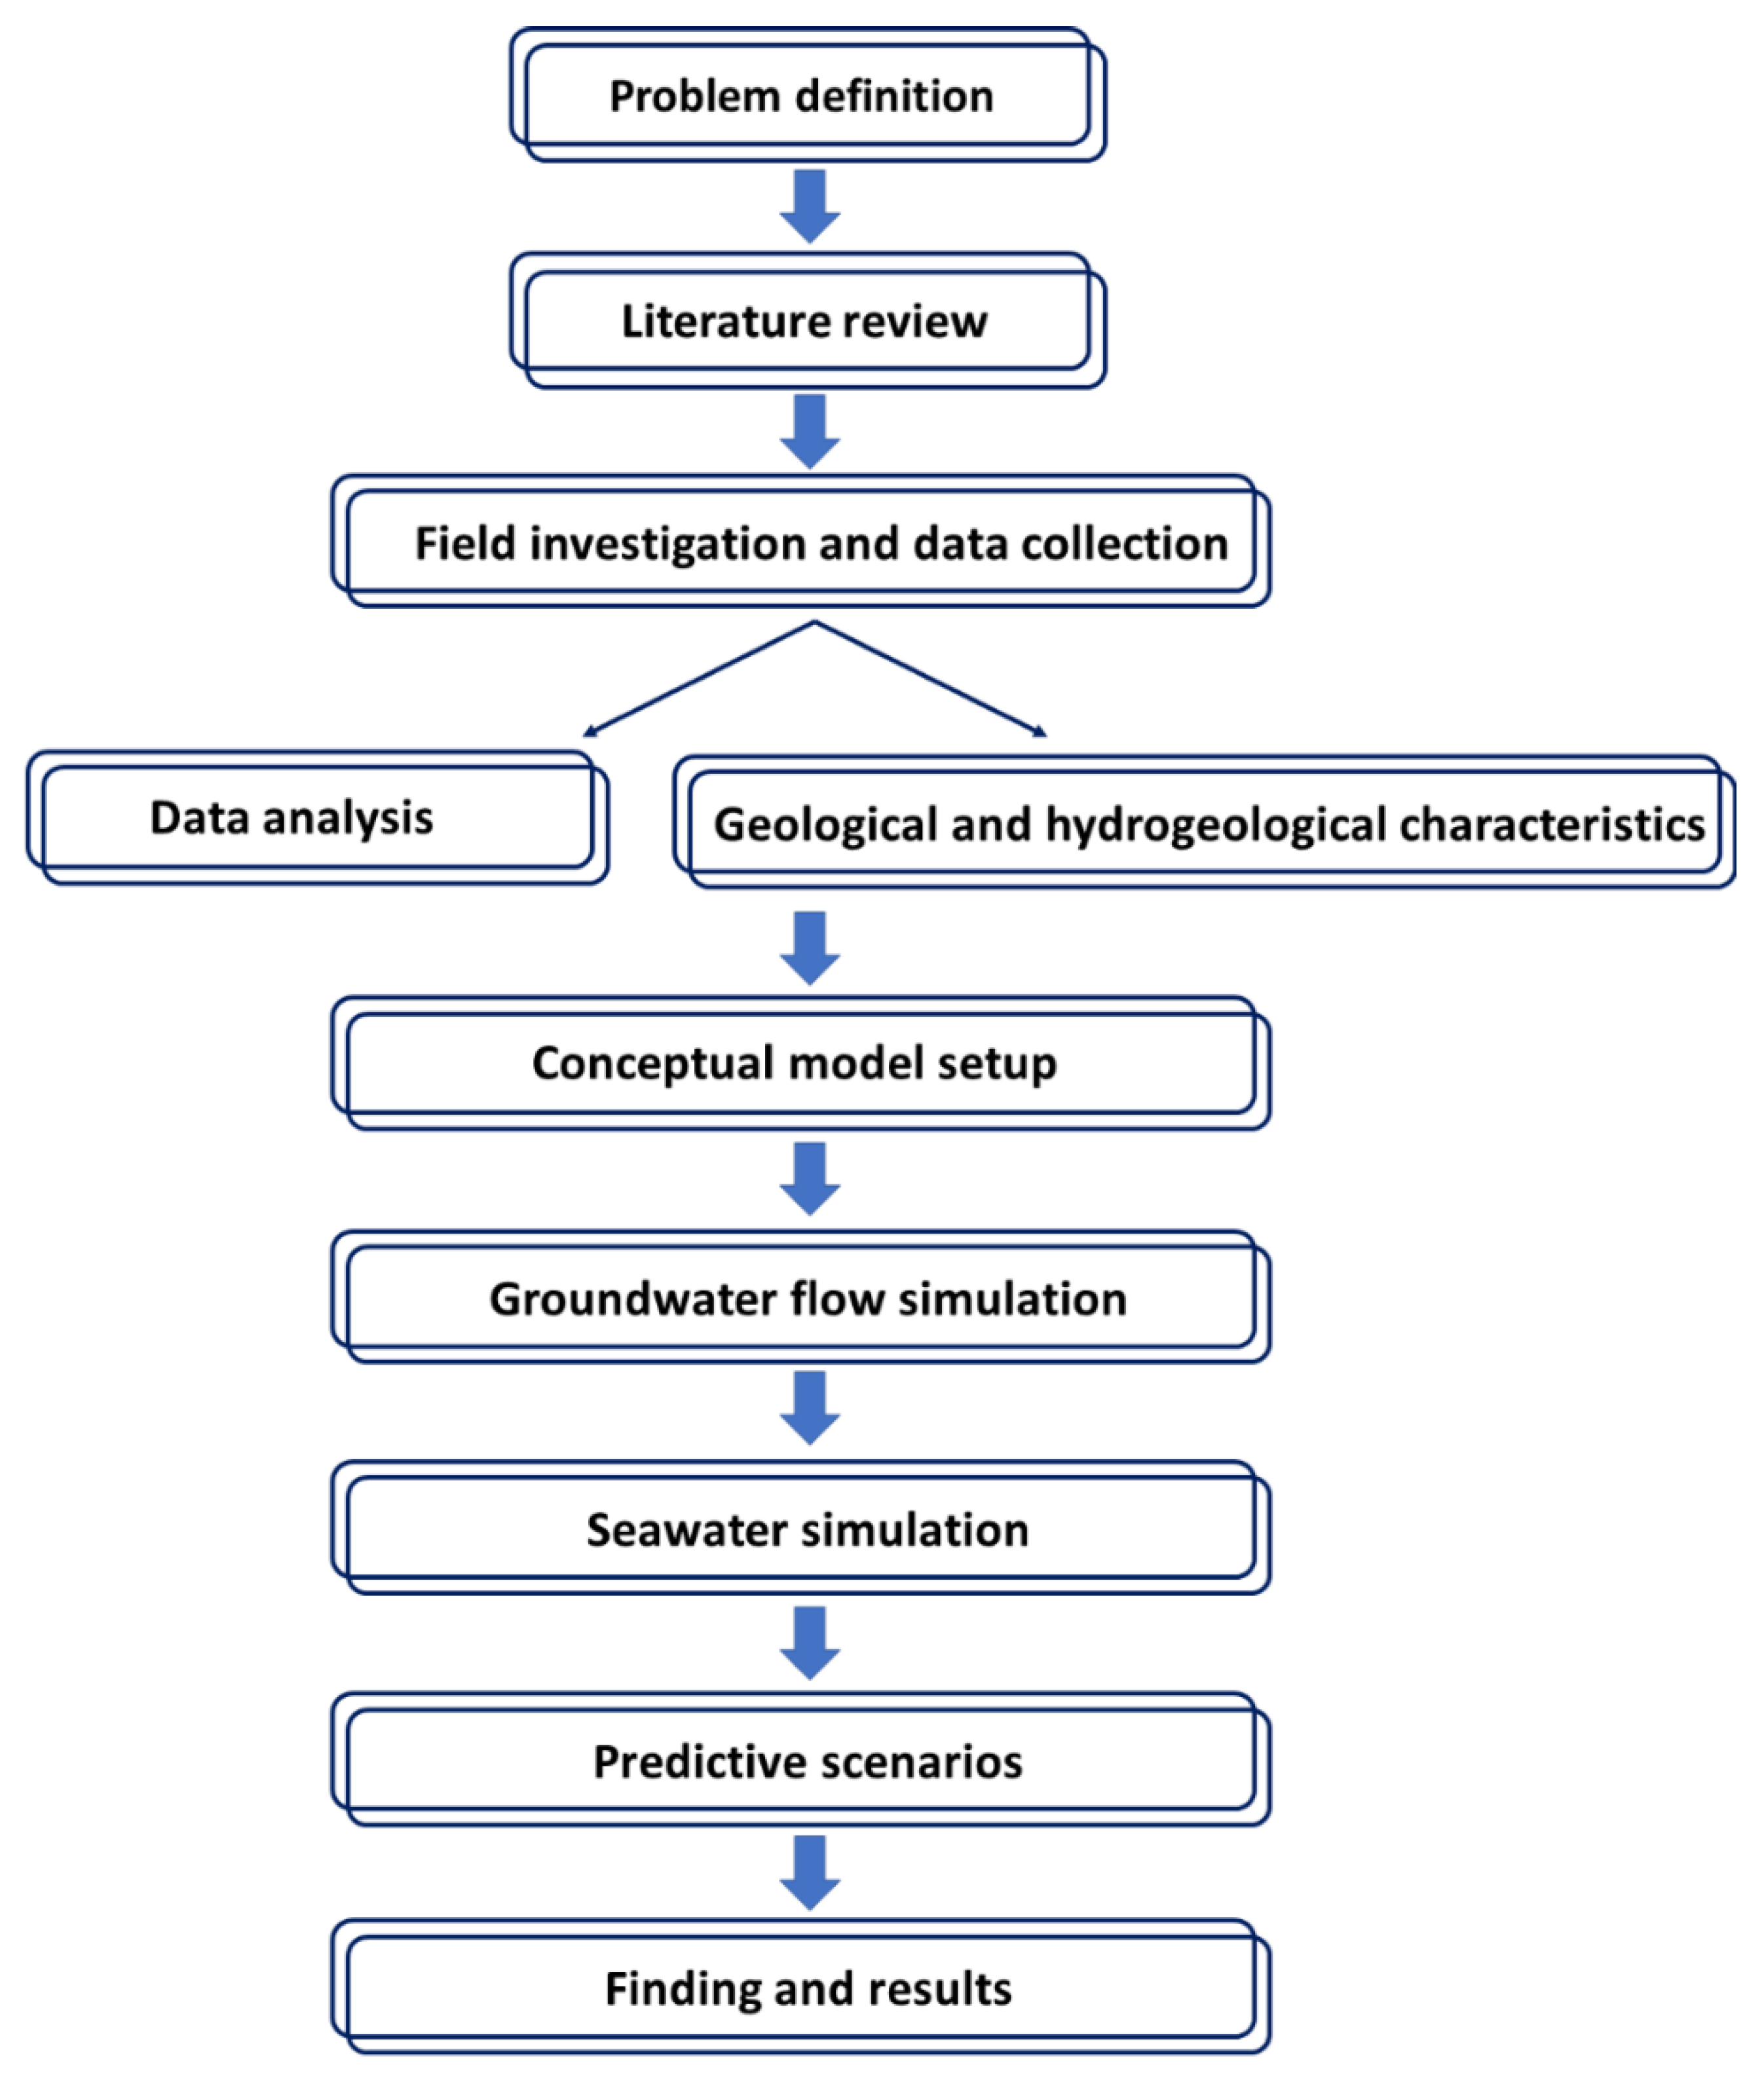
3. Methodology
- The change in well abstraction rate;
- The different numbers of abstraction wells;
- The spacing between the abstraction wells;
- The change in screen depth in the abstraction wells.
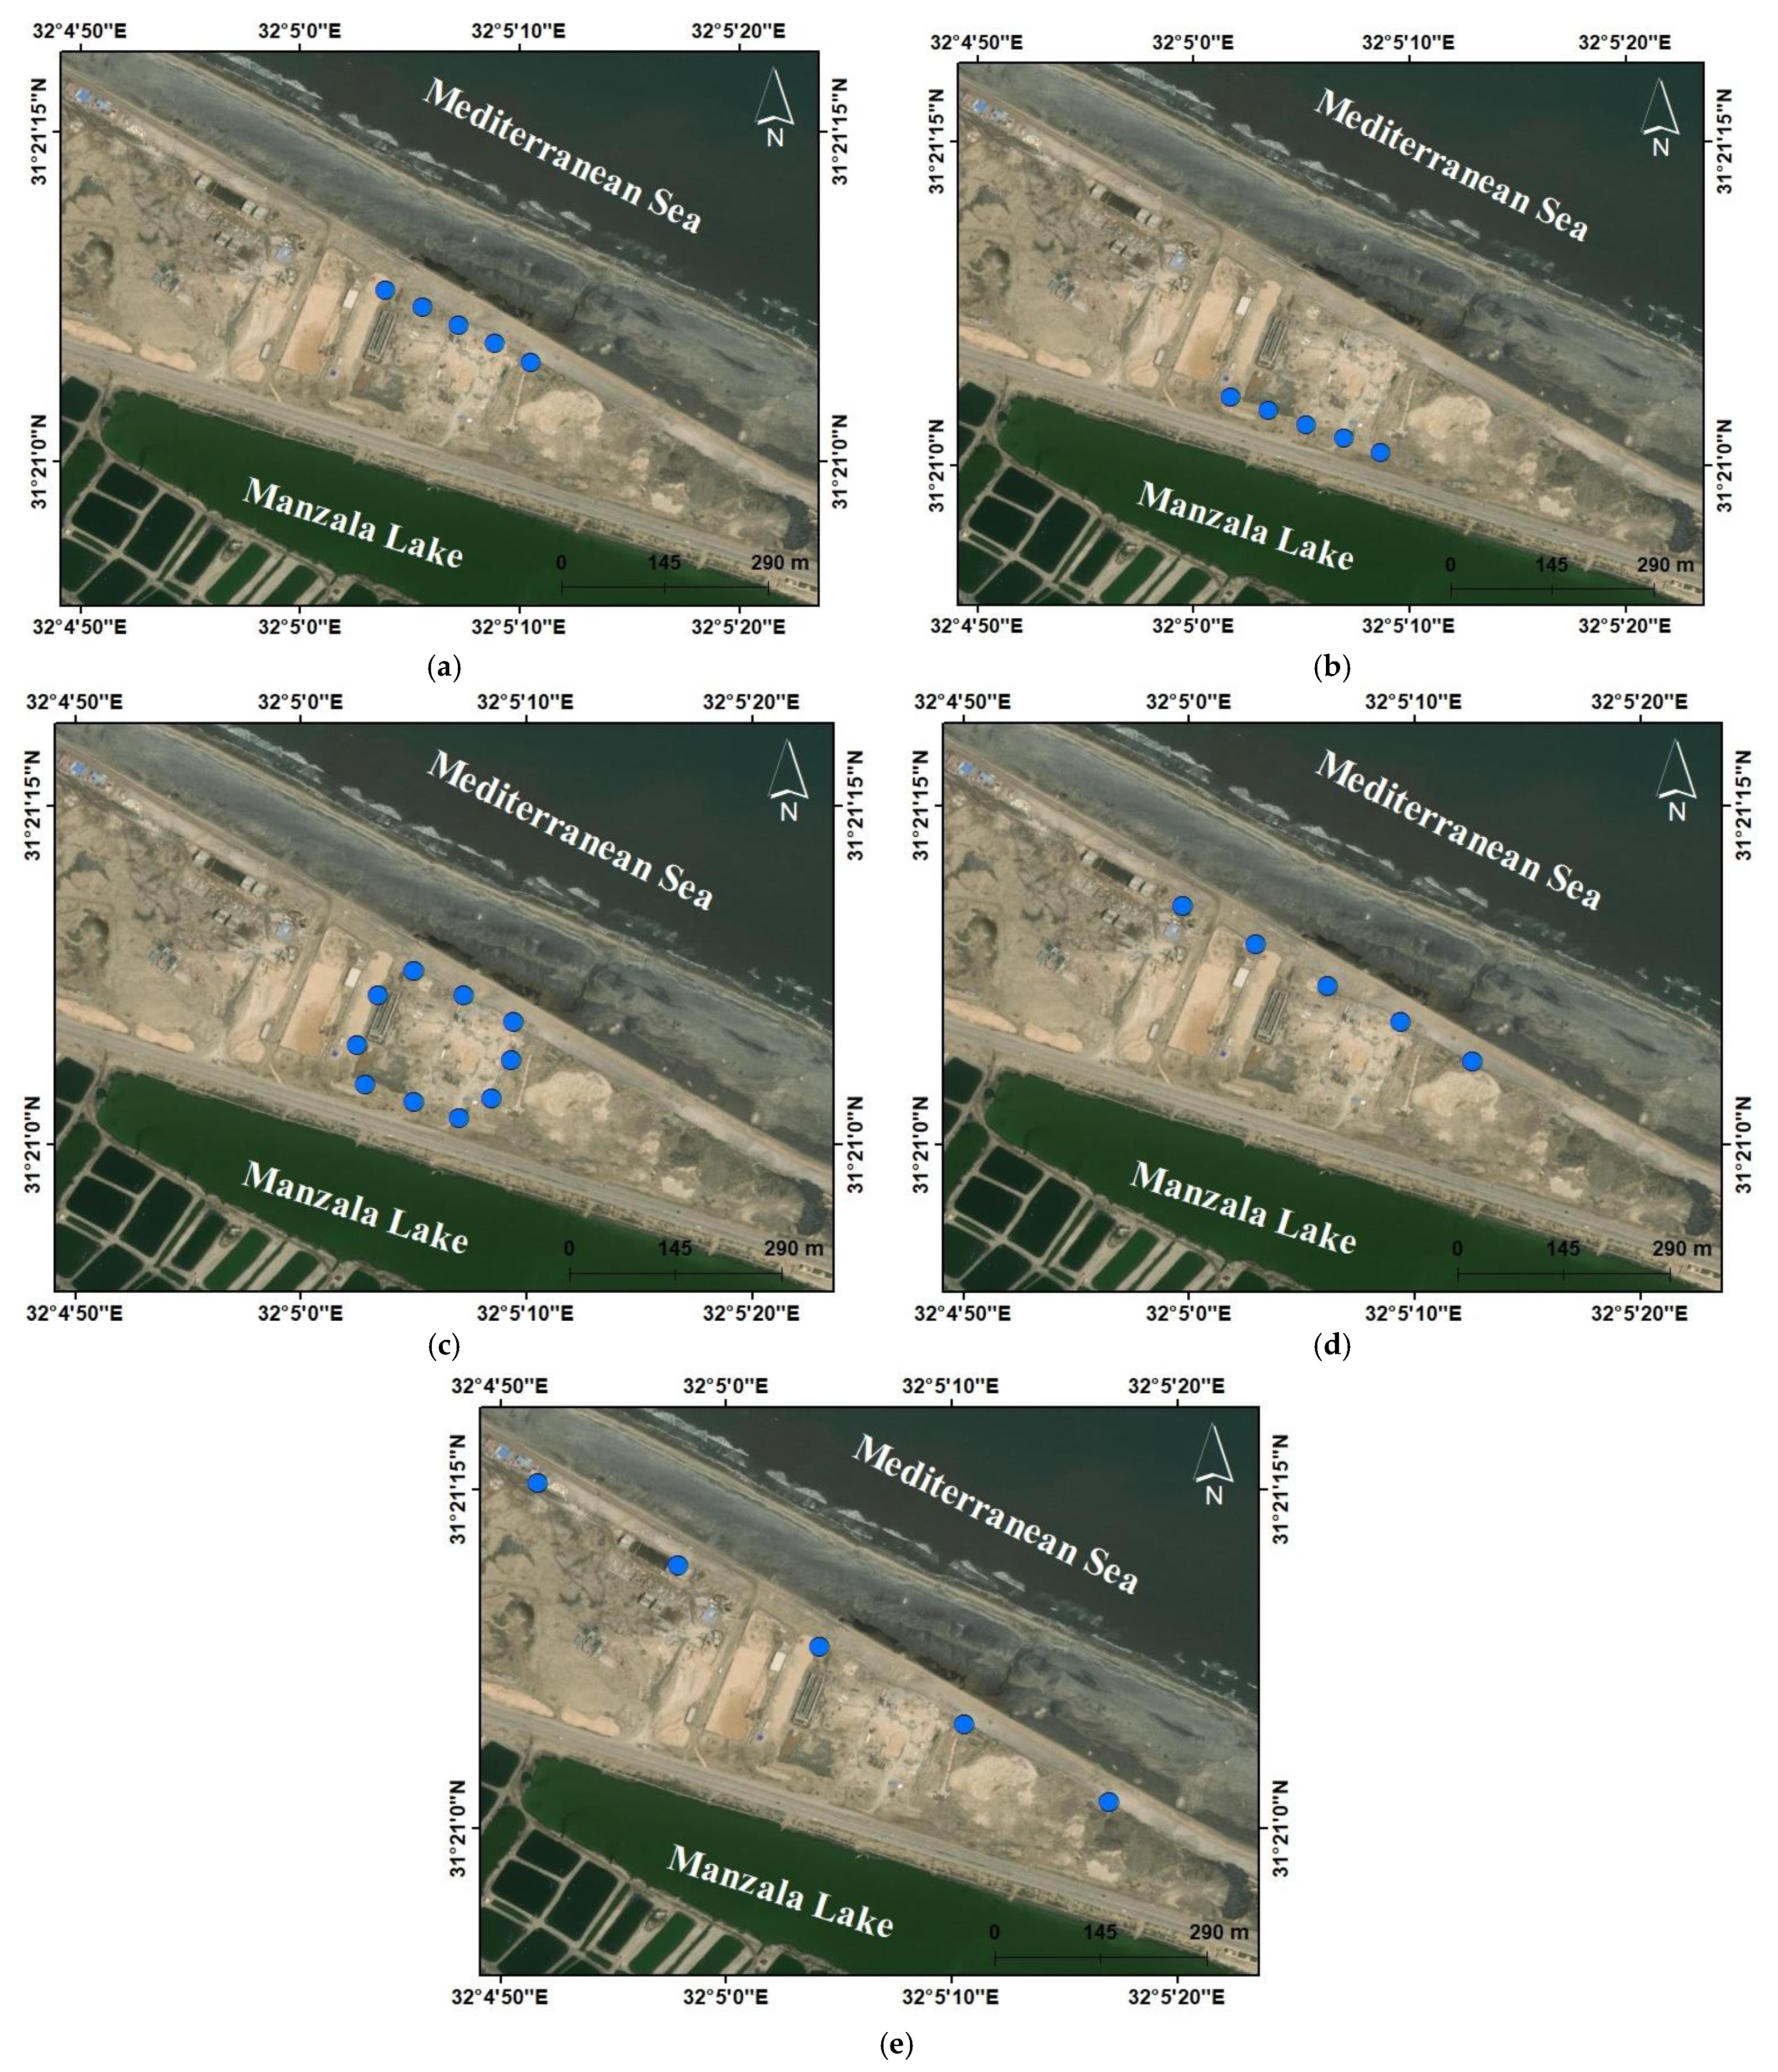
- The first arrangement of the wells (Figure 6a) consists of five wells located in the northern part of the study area being used with two screen depths (unconfined aquifer and leaky confined aquifer); for each screen depth, different well abstraction rates are considered:
- Sc a.1: screen depth in aquifer A, with total pumping of 50,000 m3/day;
- Sc a.2: screen depth in aquifer A, with total pumping of 100,000 m3/day;
- Sc a.3: screen depth in aquifer A, with total pumping of 150,000 m3/day;
- Sc a.4: screen depth in aquifer B, with total pumping of 50,000 m3/day;
- Sc a.5: screen depth in aquifer B, with total pumping of 100,000 m3/day;
- Sc a.6: screen depth in aquifer B, with total pumping of 150,000 m3/day.
- The second arrangement of the wells (Figure 6b) consists of five wells on the southern part of the study area with different well abstraction rates from aquifer B (leaky confined aquifer):
- Sc b.1: total pumping from 5 proposed wells of 50,000 m3/day;
- Sc b.2: total pumping from 5 proposed wells of 100,000 m3/day;
- Sc b.3: total pumping from 5 proposed wells of 150,000 m3/day.
- The third arrangement of the wells (Figure 6c) consists of ten wells with different well abstraction rates from aquifer B (leaky confined aquifer):
- Sc c.1: total pumping of 50,000 m3/day;
- Sc c.2: total pumping of 100,000 m3/day;
- Sc c.3: total pumping of 150,000 m3/day.
- The fourth arrangement of five wells (Figure 6d) considers a spacing between wells of 100 m and different abstraction rates from aquifer B (leaky confined confined):
- Sc d.1: total pumping of 50,000 m3/day;
- Sc d.2: total pumping of 100,000 m3/day;
- Sc d.3: total pumping of 150,000 m3/day.
- The fifth arrangement of five wells (Figure 6e) considers a spacing between wells of 200 m and different abstraction rates from aquifer B (leaky confined confined):
- Sc e.1: total pumping of 50,000 m3/day;
- Sc e.2: total pumping of 100,000 m3/day;
- Sc e.3: total pumping of 150,000 m3/day.
3.1. Model Geometry
3.2. Boundary Condition
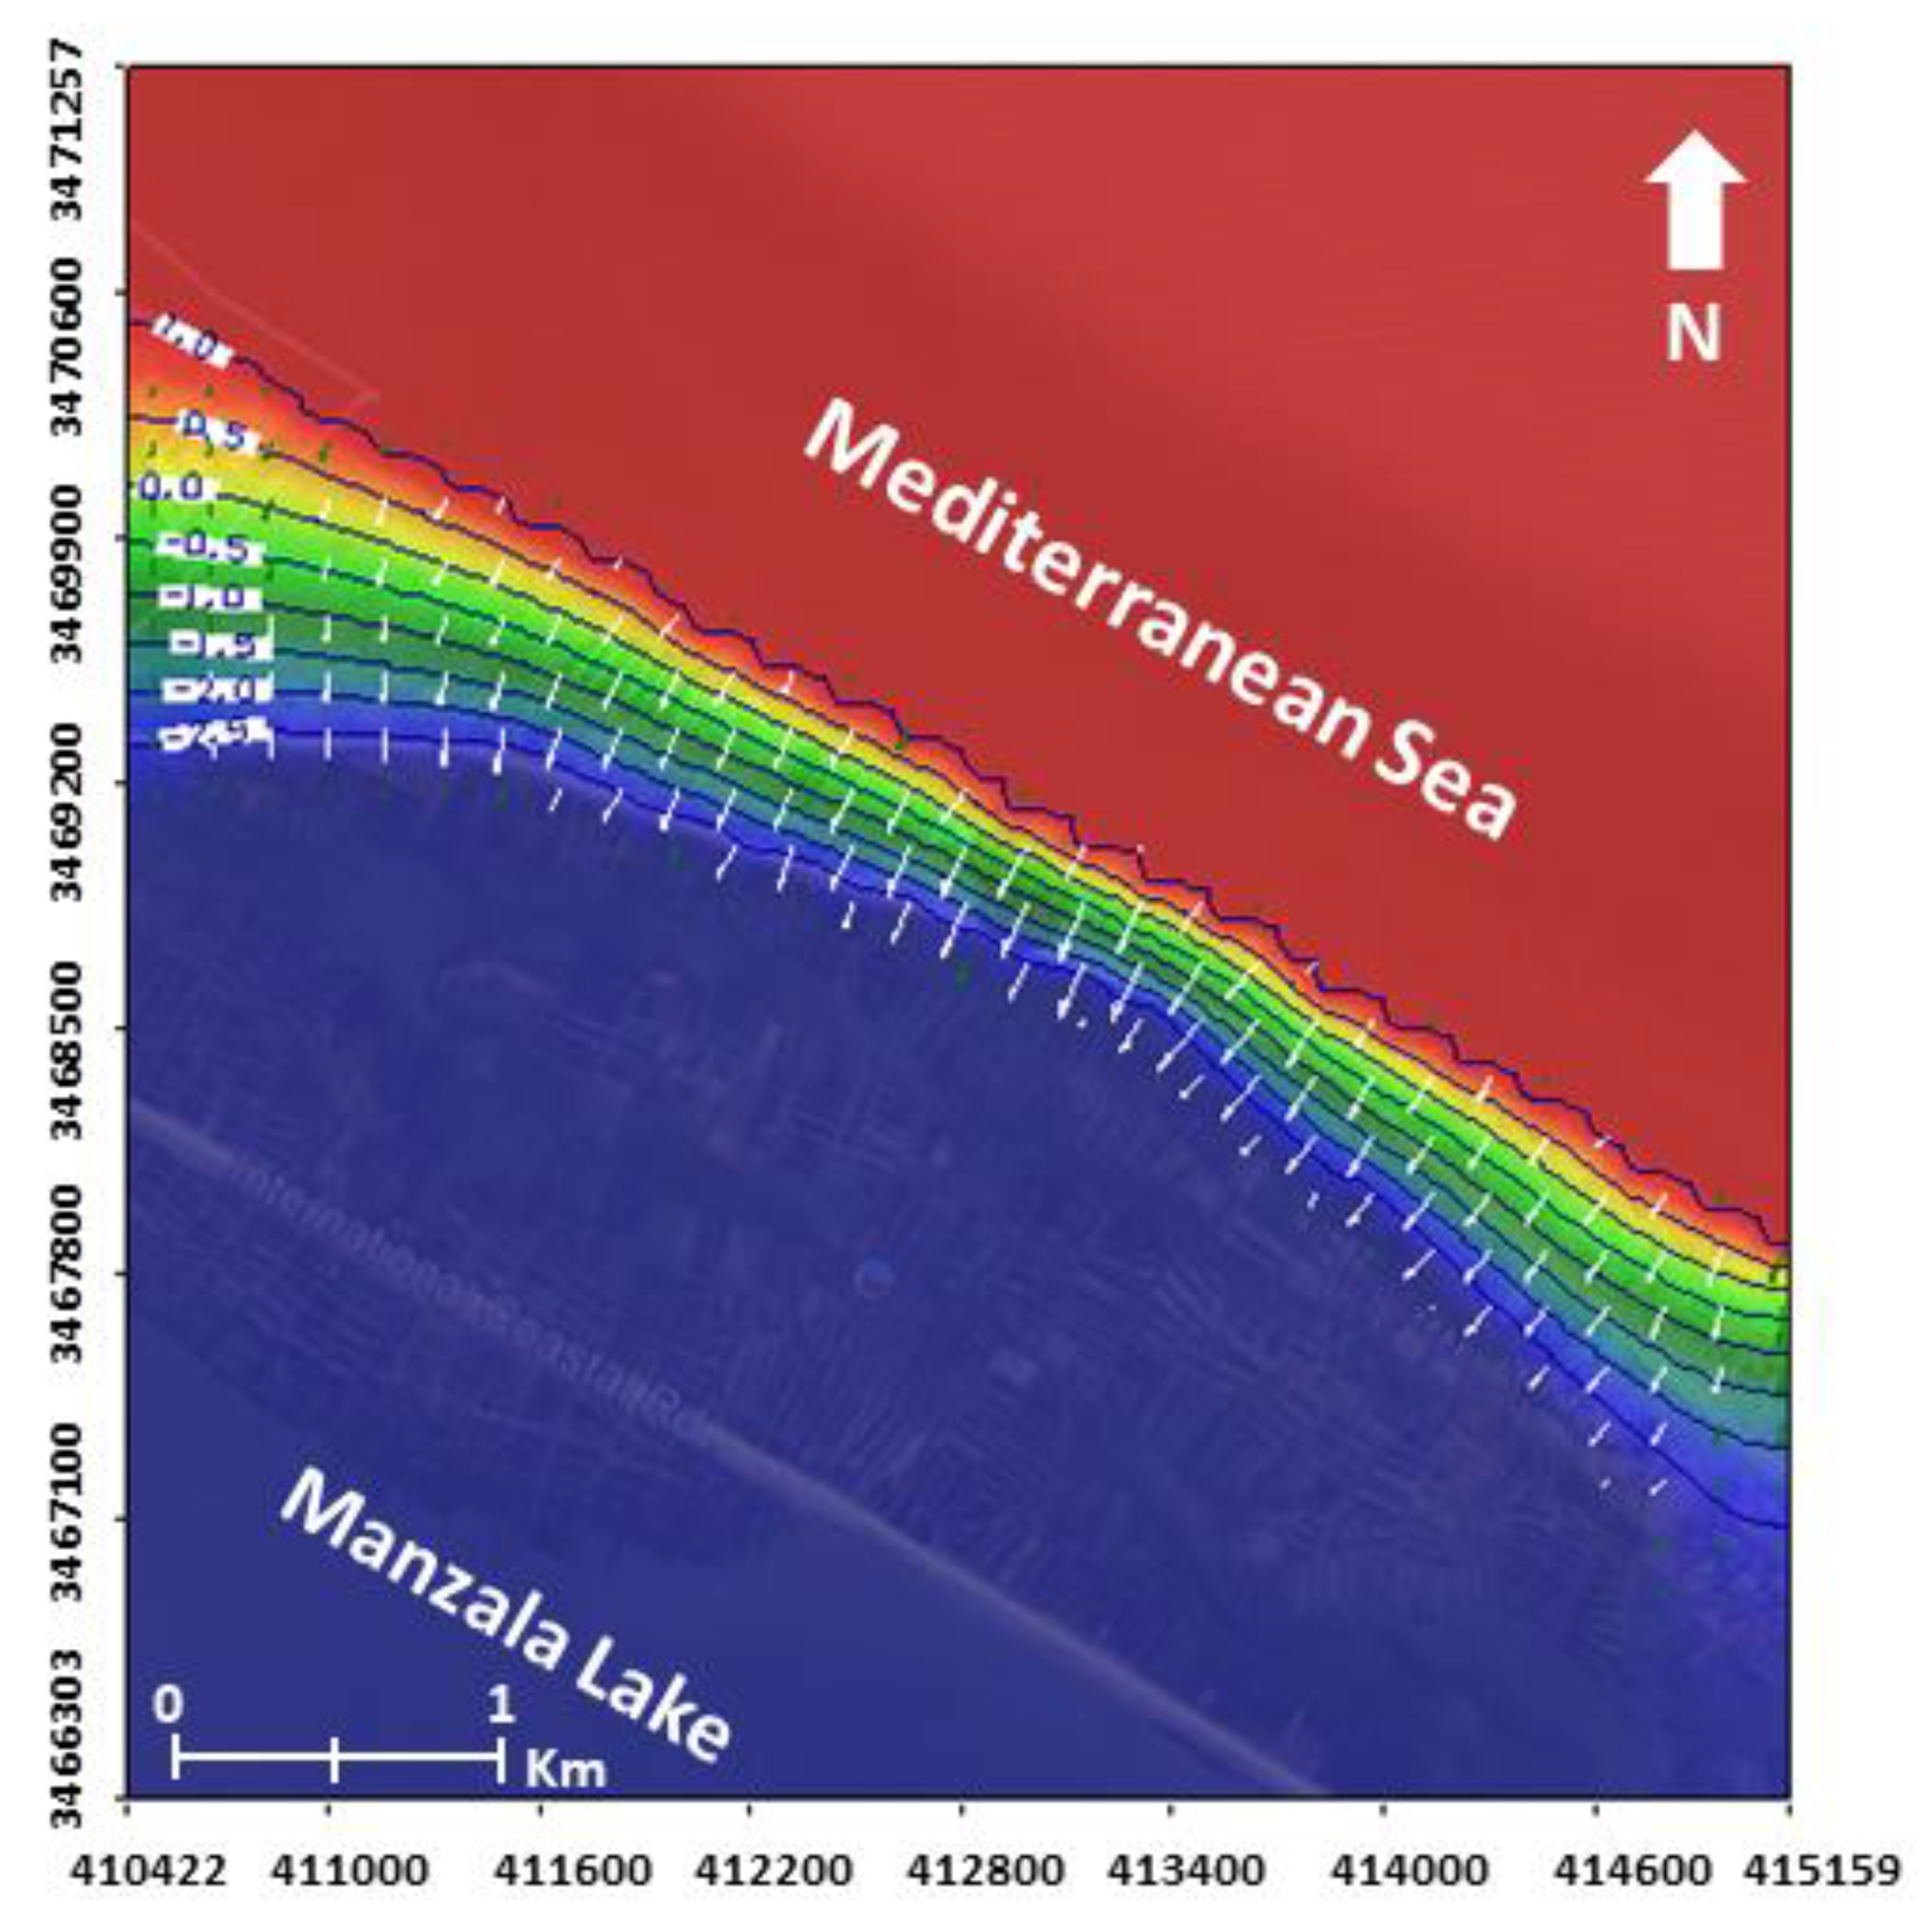
- Northern boundary: Mediterranean Sea representing the northern constant head and constant salinity concentration (40,600 mg/L), according to water analysis.
- Southern boundary: Manzala Lake representing the southern constant head with a -3 value and constant salinity concentration (50,760 mg/L), according to water analysis.
3.3. Hydrogeological Parameters
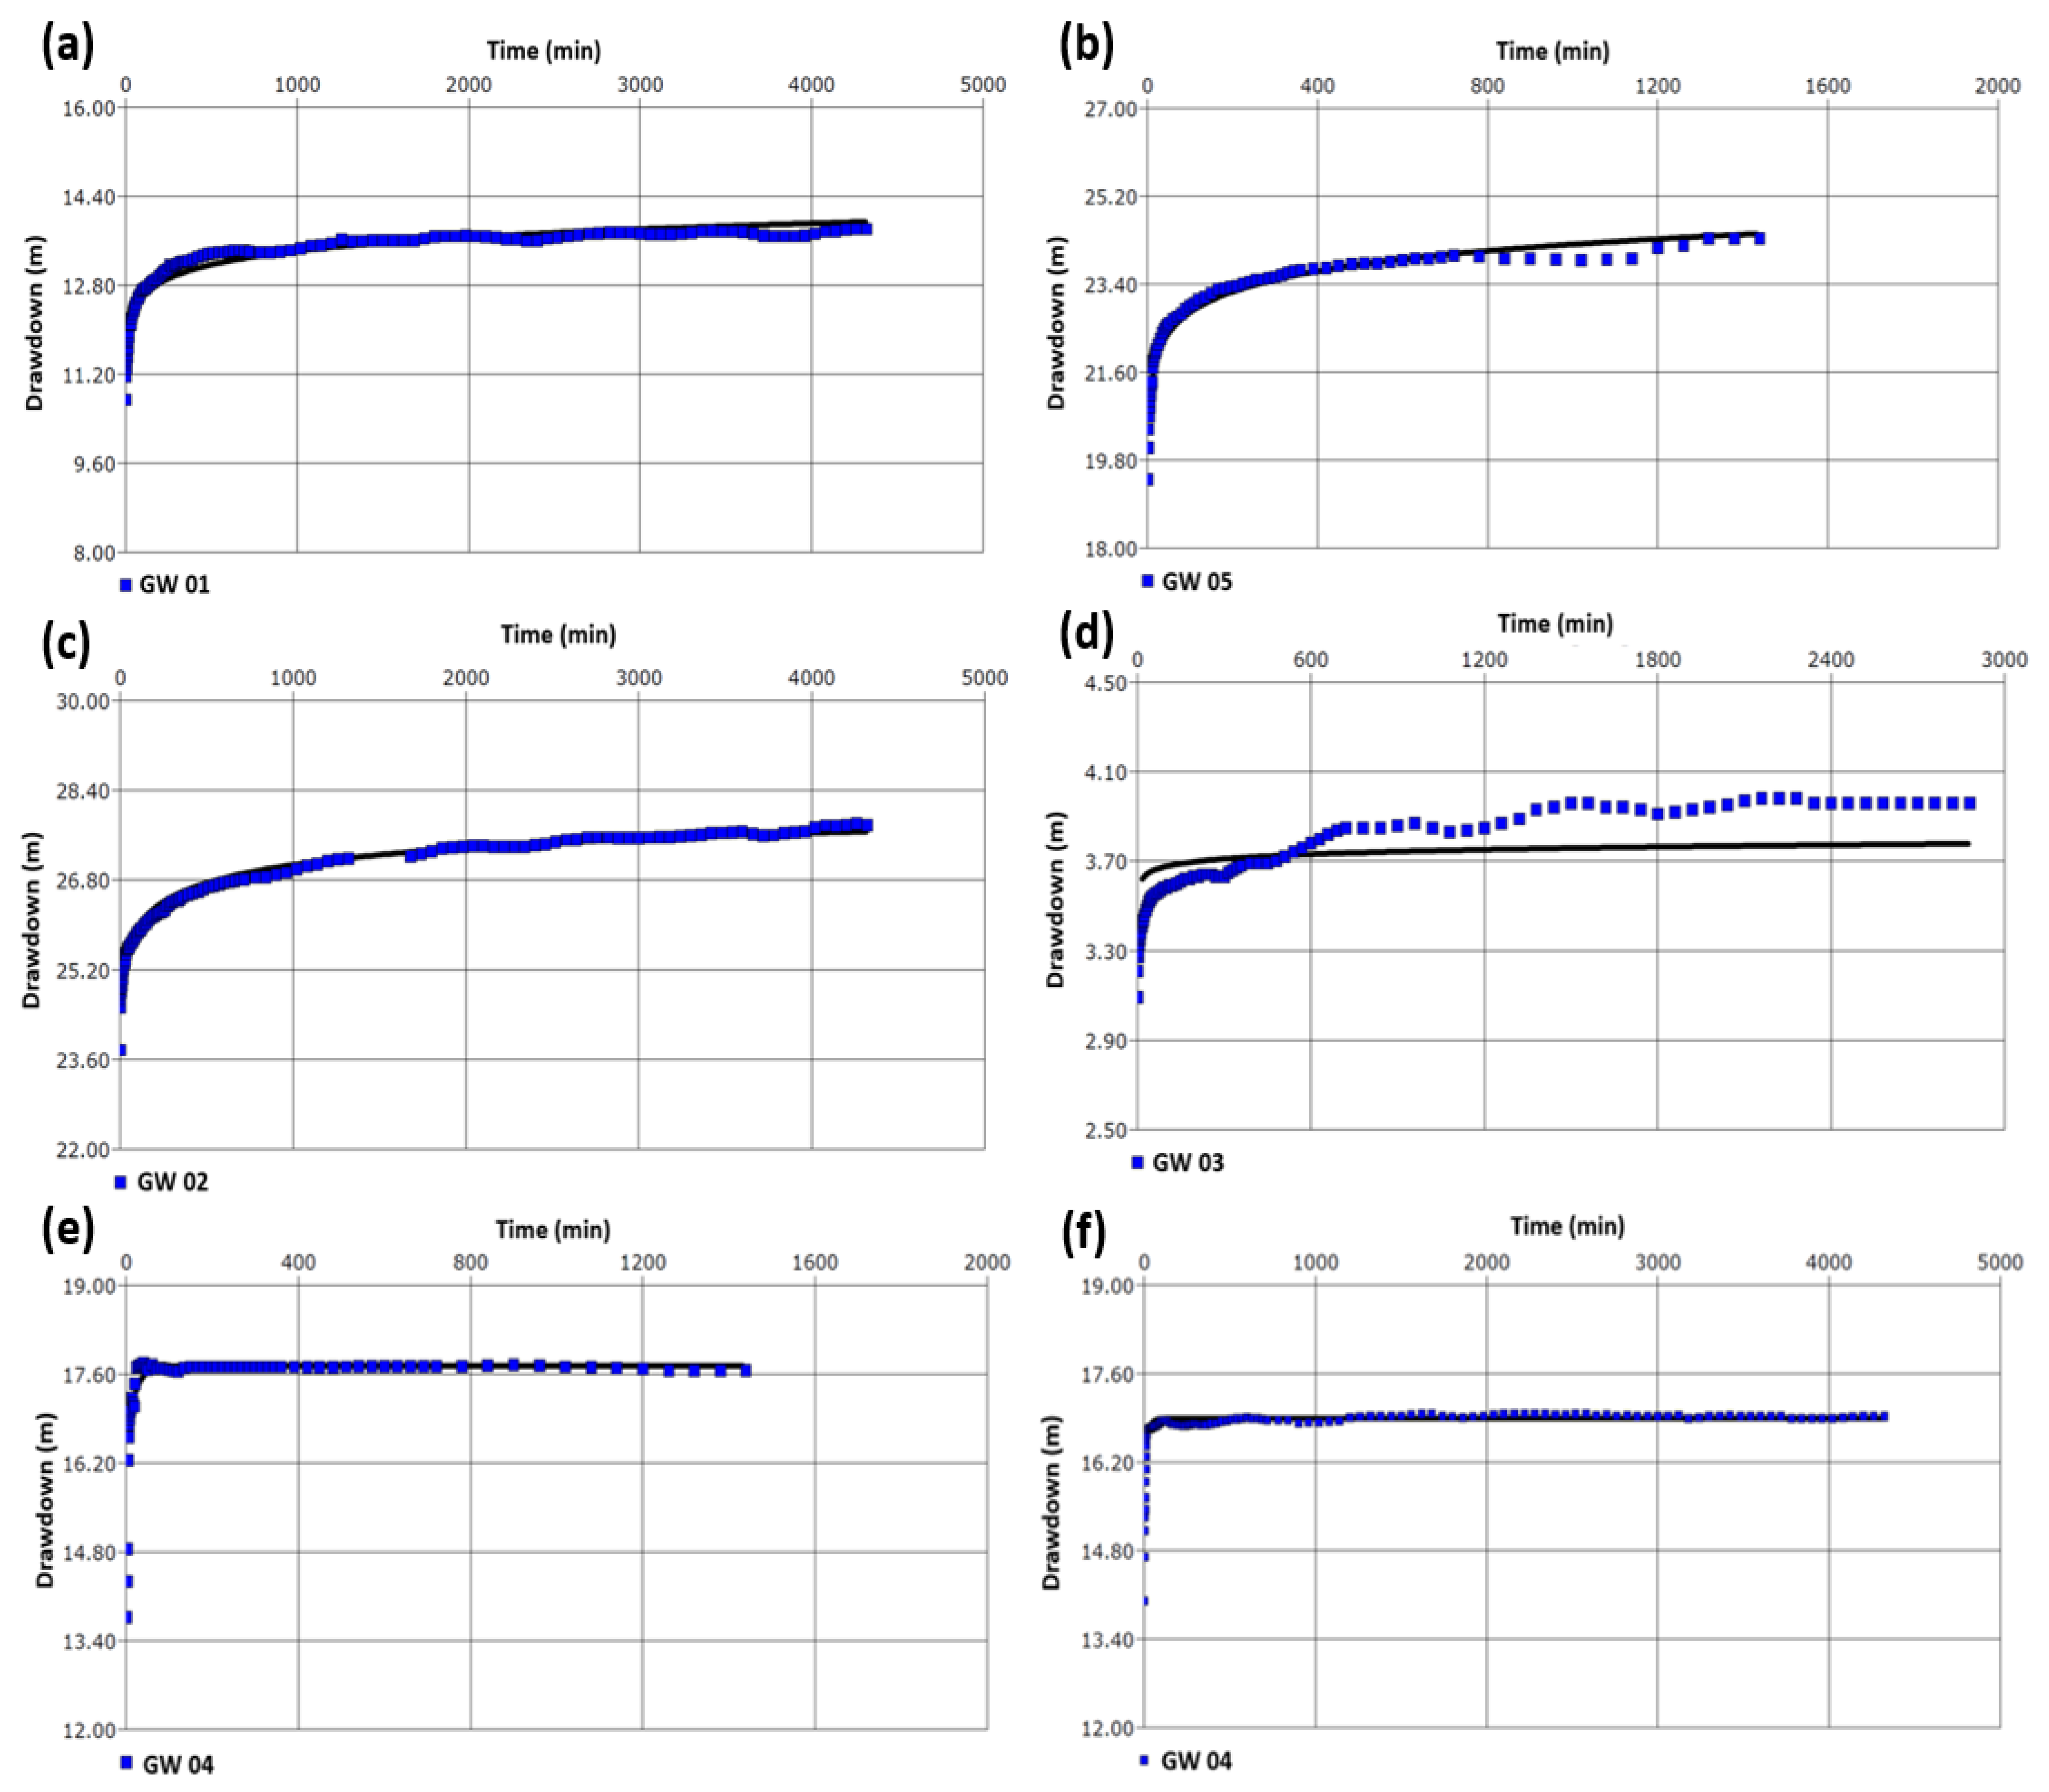
- GW 01: According to the pumping tests analysis by Theis, with Jacob correction for unconfined aquifer, the transmissivity values ranged from 586 to 1150 m2/d.
- GW 05: According to the pumping tests analysis by Theis, with Jacob correction for unconfined aquifer, the transmissivity values ranged from 1010 to 1270 m2/d.
- GW 02: According to the pumping tests analysis by Theis, for confined aquifer, the transmissivity values ranged from 1140 to 1170 m2/d.
- GW 03: According to the pumping tests analysis by Theis, for confined aquifer, the transmissivity values ranged from 763 to 890 m2/d.
- GW 04: According to the pumping tests analysis by Theis, for confined aquifer, the transmissivity values ranged from 1110 to 1950 m2/d.
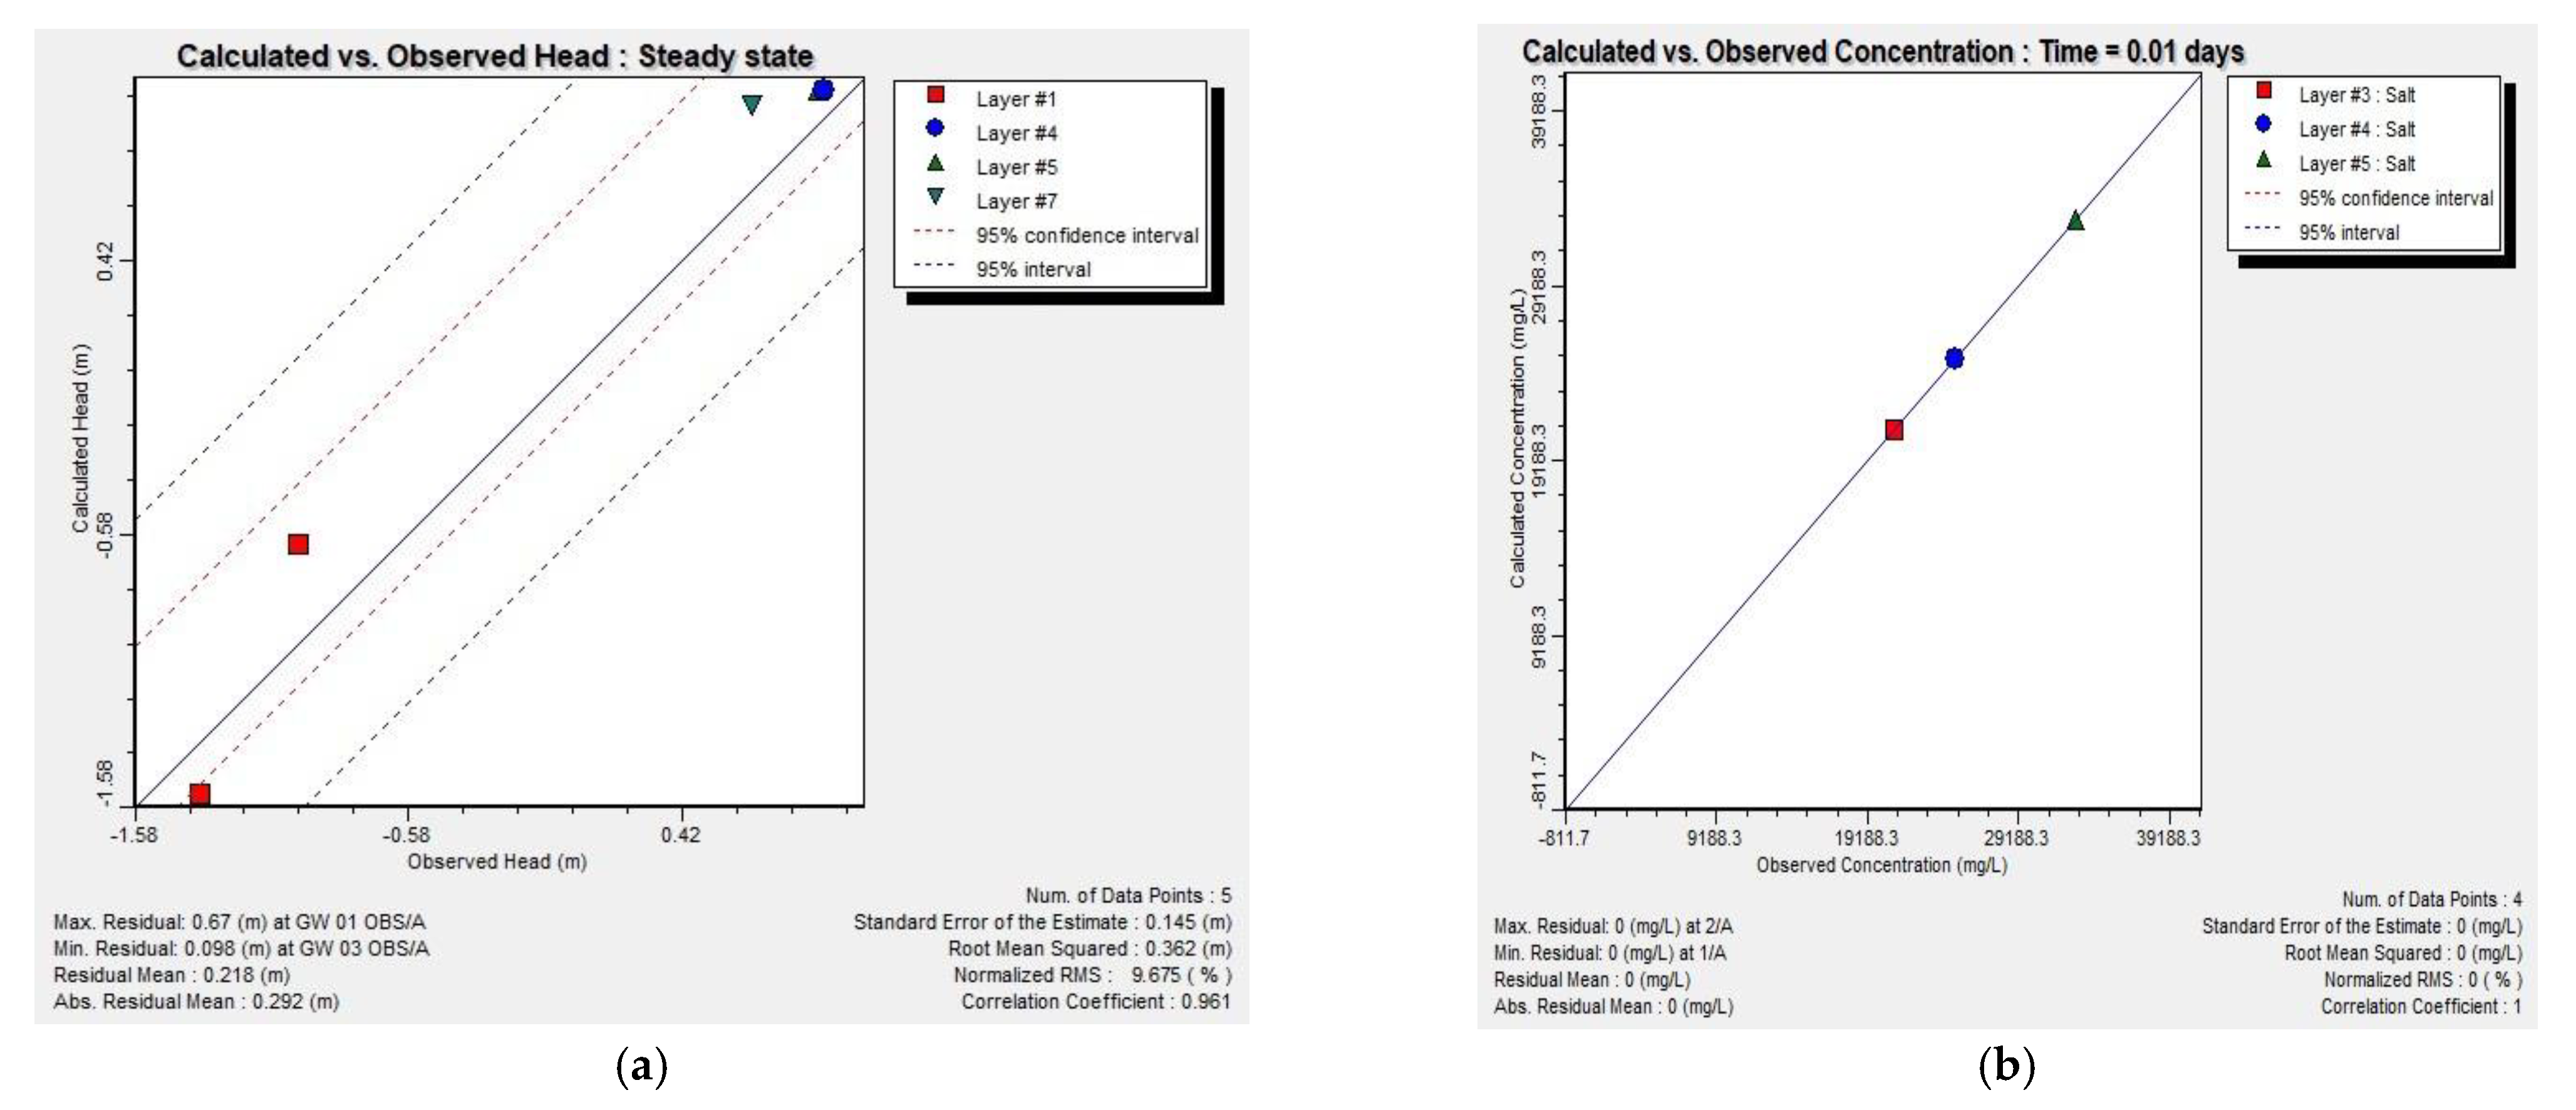
3.4. Model Calibration
4. Results
4.1. Groundwater Flow Model
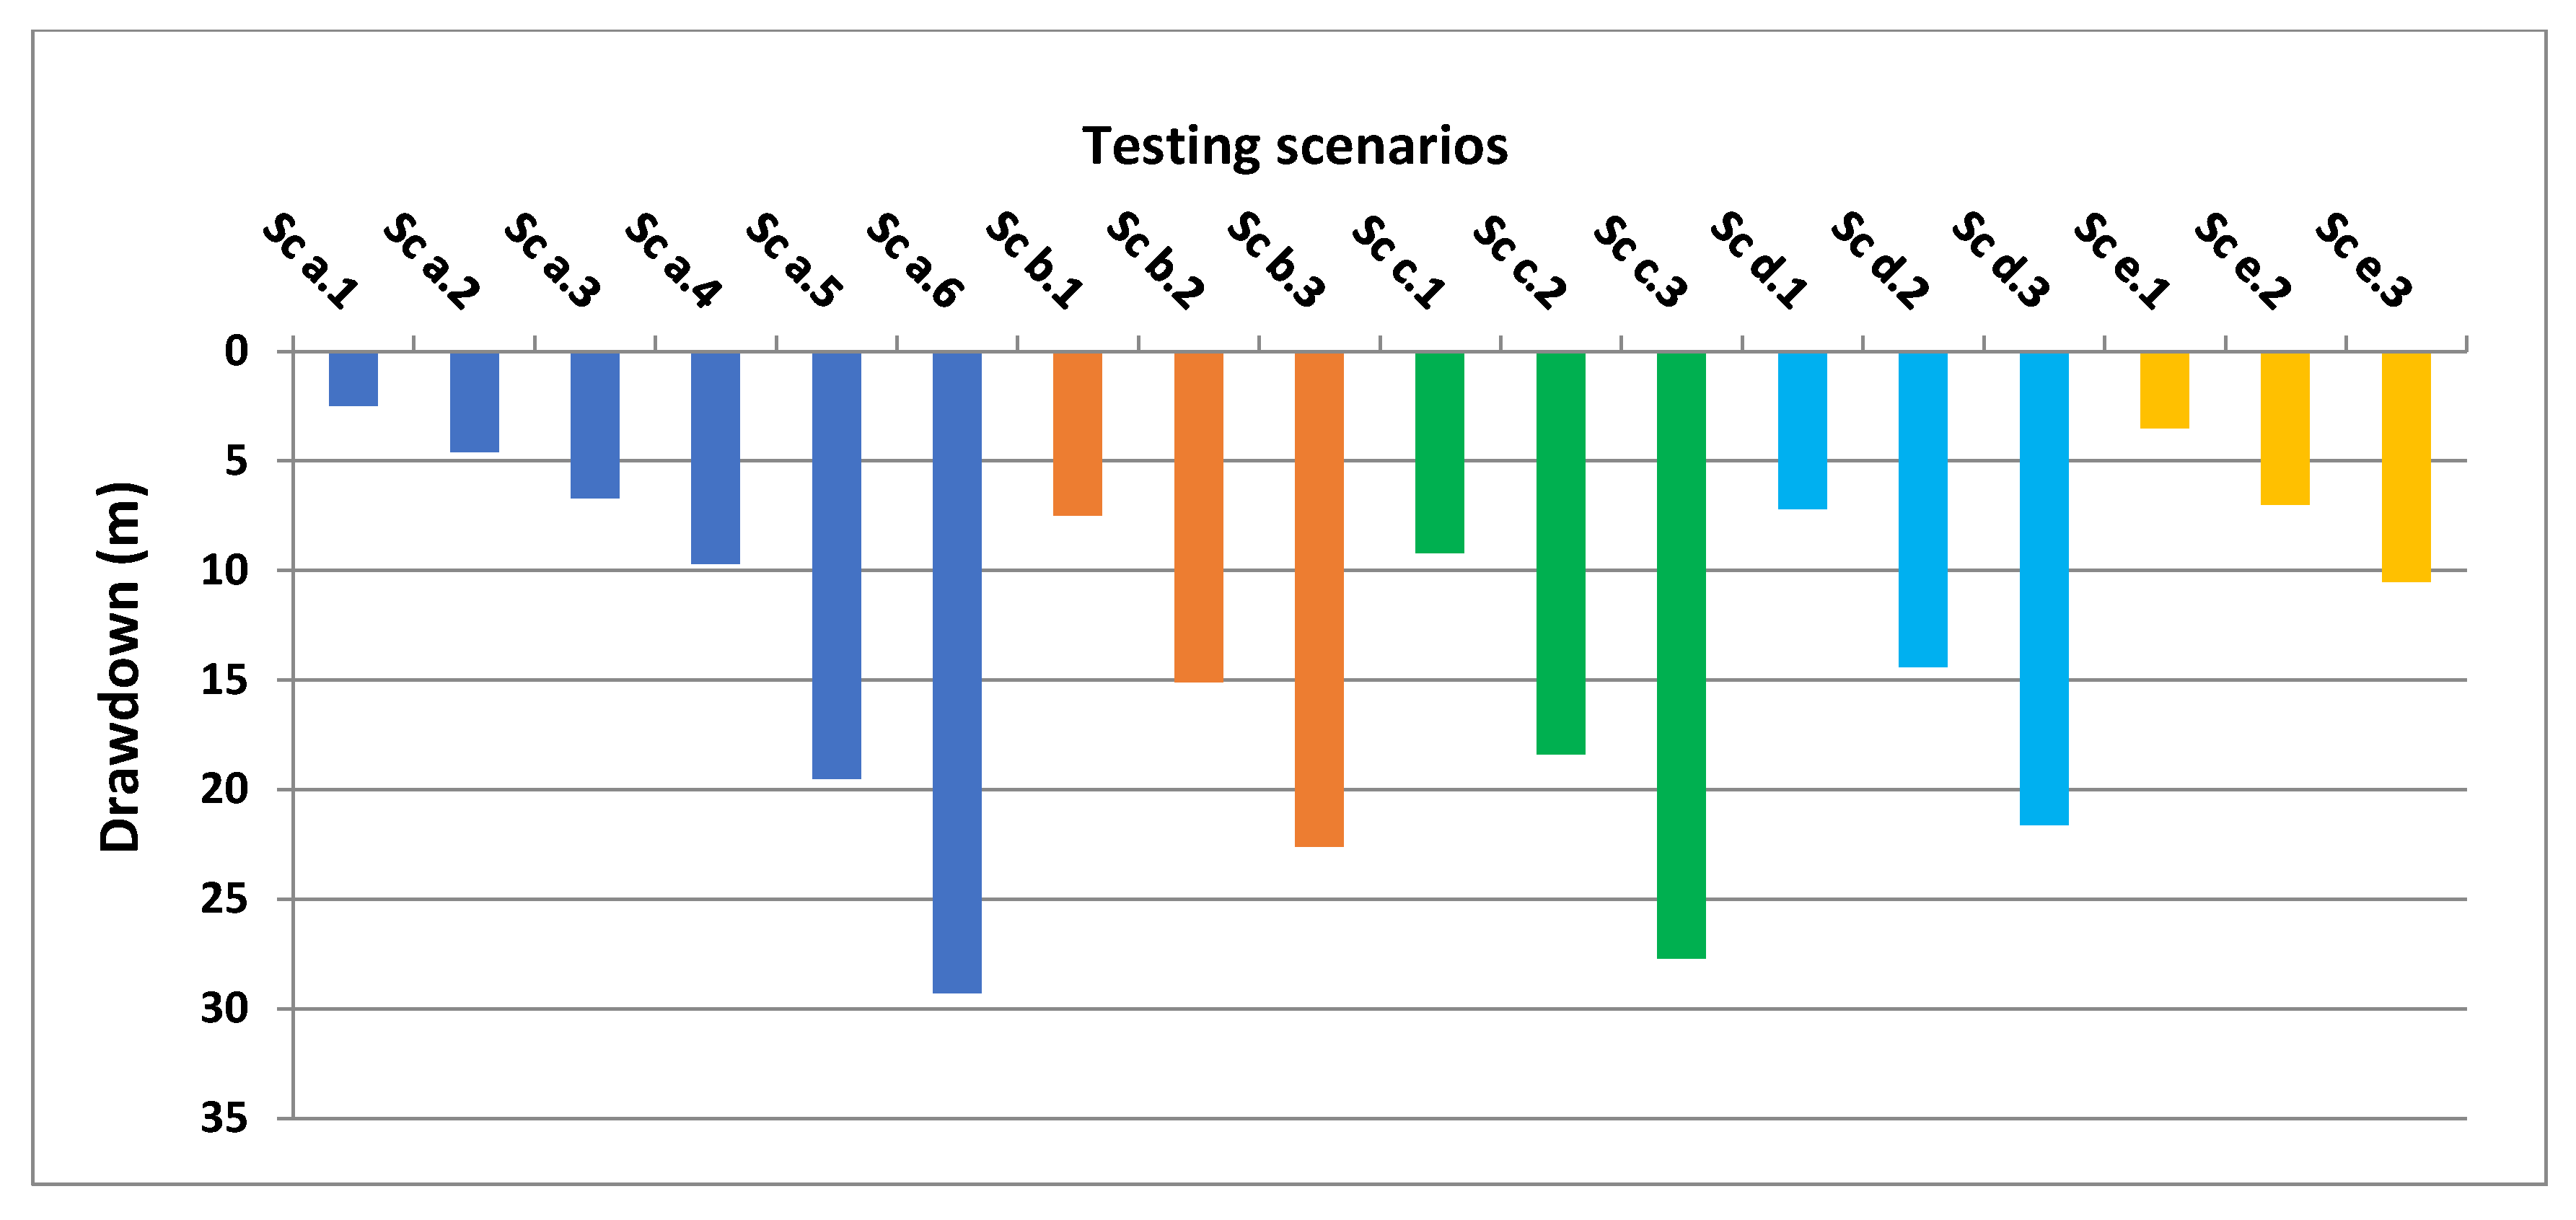
- The first three scenarios (Sc a.1, Sc a.2 and Sc a.3) refer to extraction from the first aquifer, with wells located at a distance of about 165 m from the sea, showing the drawdown of the water level would range, over time, from 2.5 m in Sc a.1 (50,000 m3/day) to 6.7 m in Sc a.3 (150,000 m3/day); according to the remaining three scenarios (Sc a.4, Sc a.5 and Sc a.6), in which extraction is performed from the second aquifer, the drawdown of the water level would range, over time, from 9.7 m in Sc a.4 (50,000 m3/day) to 29.3 m in Sc a.6 (150,000 m3/day).
- For scenarios Sc b.1, Sc b.2 and Sc b.3, where extraction is performed from the second aquifer, with wells located at a distance of about 300 m from the sea, the drawdown of the water level would range, over time, from 7.5 m in Sc b.1 (50,000 m3/day) to 22.6 m in Sc b.3 (150,000 m3/day).
- For scenarios Sc c.1, Sc c.2 and Sc c.3, where extraction is divided into 10 wells instead of 5, from the second aquifer, the drawdown of the water level would range, over time, from 9.2 m in Sc c.1 (50,000 m3/day) to 27.7 m in Sc c.3 (150,000 m3/day).
- For scenarios Sc d.1, Sc d.2 and Sc d.3, where extraction is performed from the second aquifer, with wells located at a distance of about 165 m from the sea with distance of 100 m between wells, the drawdown of the water level would range, over time, from 7.2 m in Sc d.1 (50,000 m3/day) to 21.6 m in Sc d.3 (150,000 m3/day).
- For scenarios Sc e.1, Sc e.2 and Sc e.3, where extraction is performed from the second aquifer, with wells located at a distance of about 165 m from the sea with a distance of 200 m between wells, the drawdown of the water level would range, over time, from 3.5 m in Sc e.1 (50,000 m3/day) to 10.7 m in Sc e.3 (150,000 m3/day).
4.2. Simulation of Saltwater Intrusion
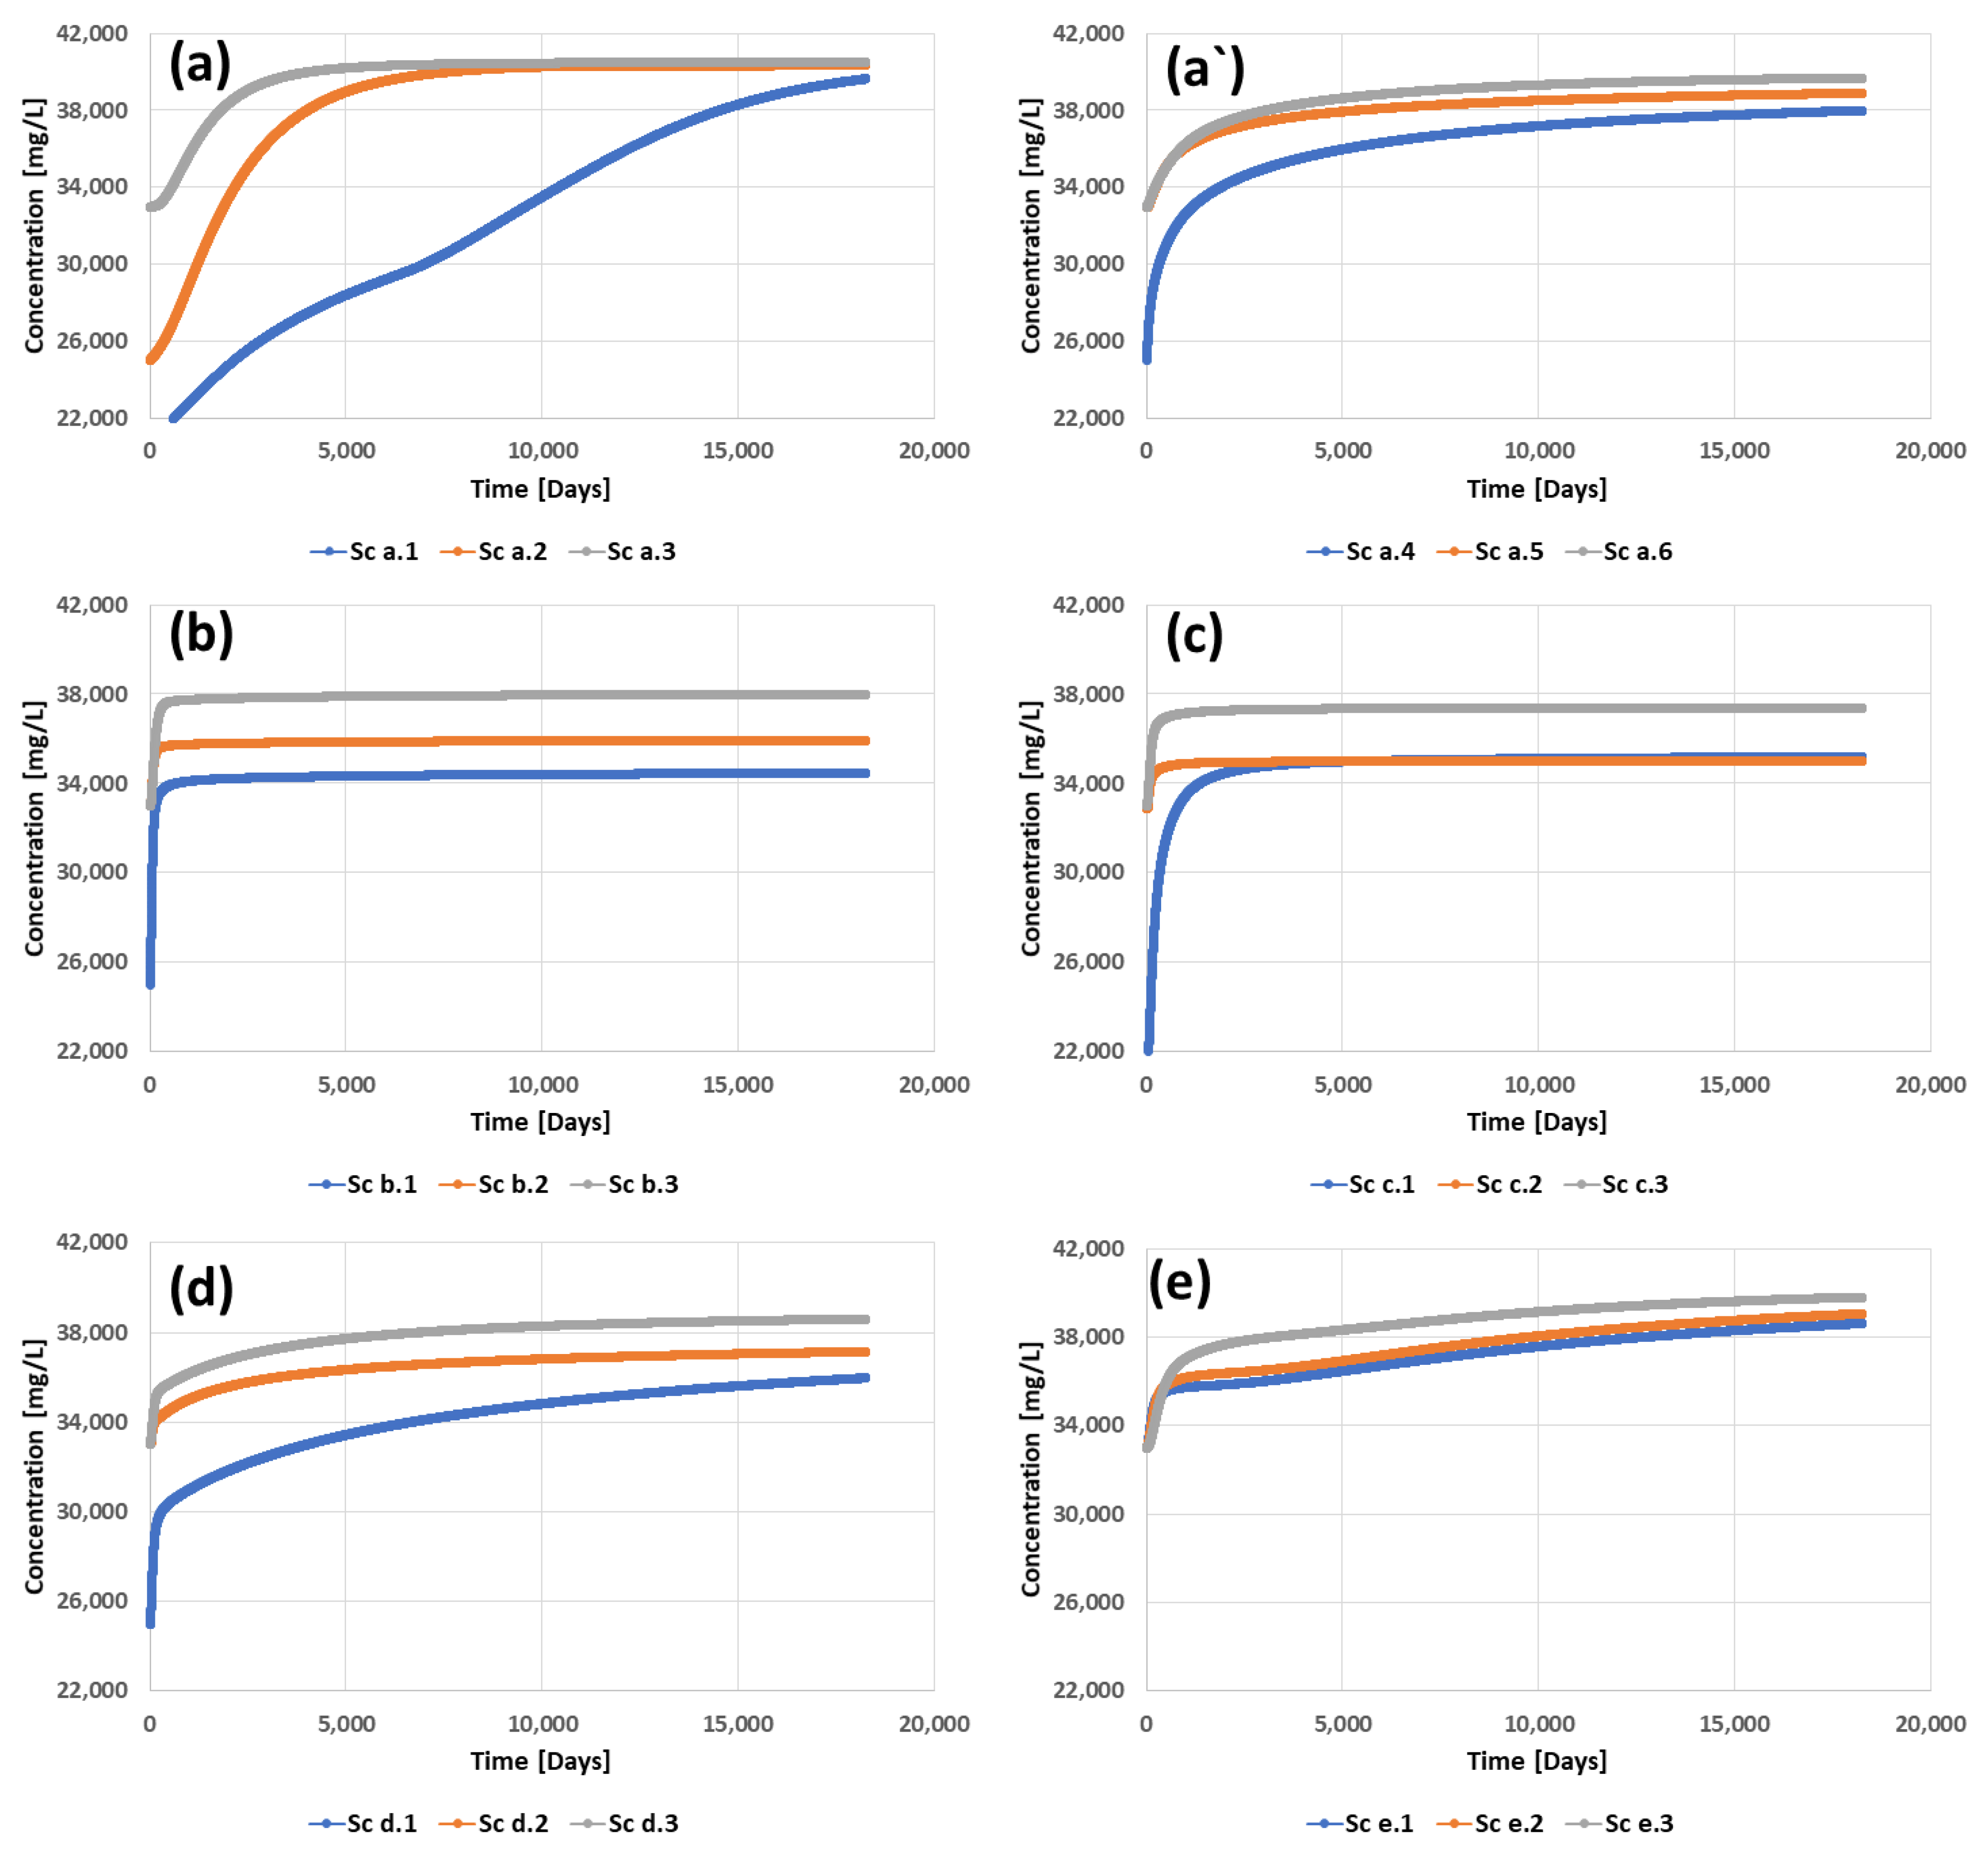
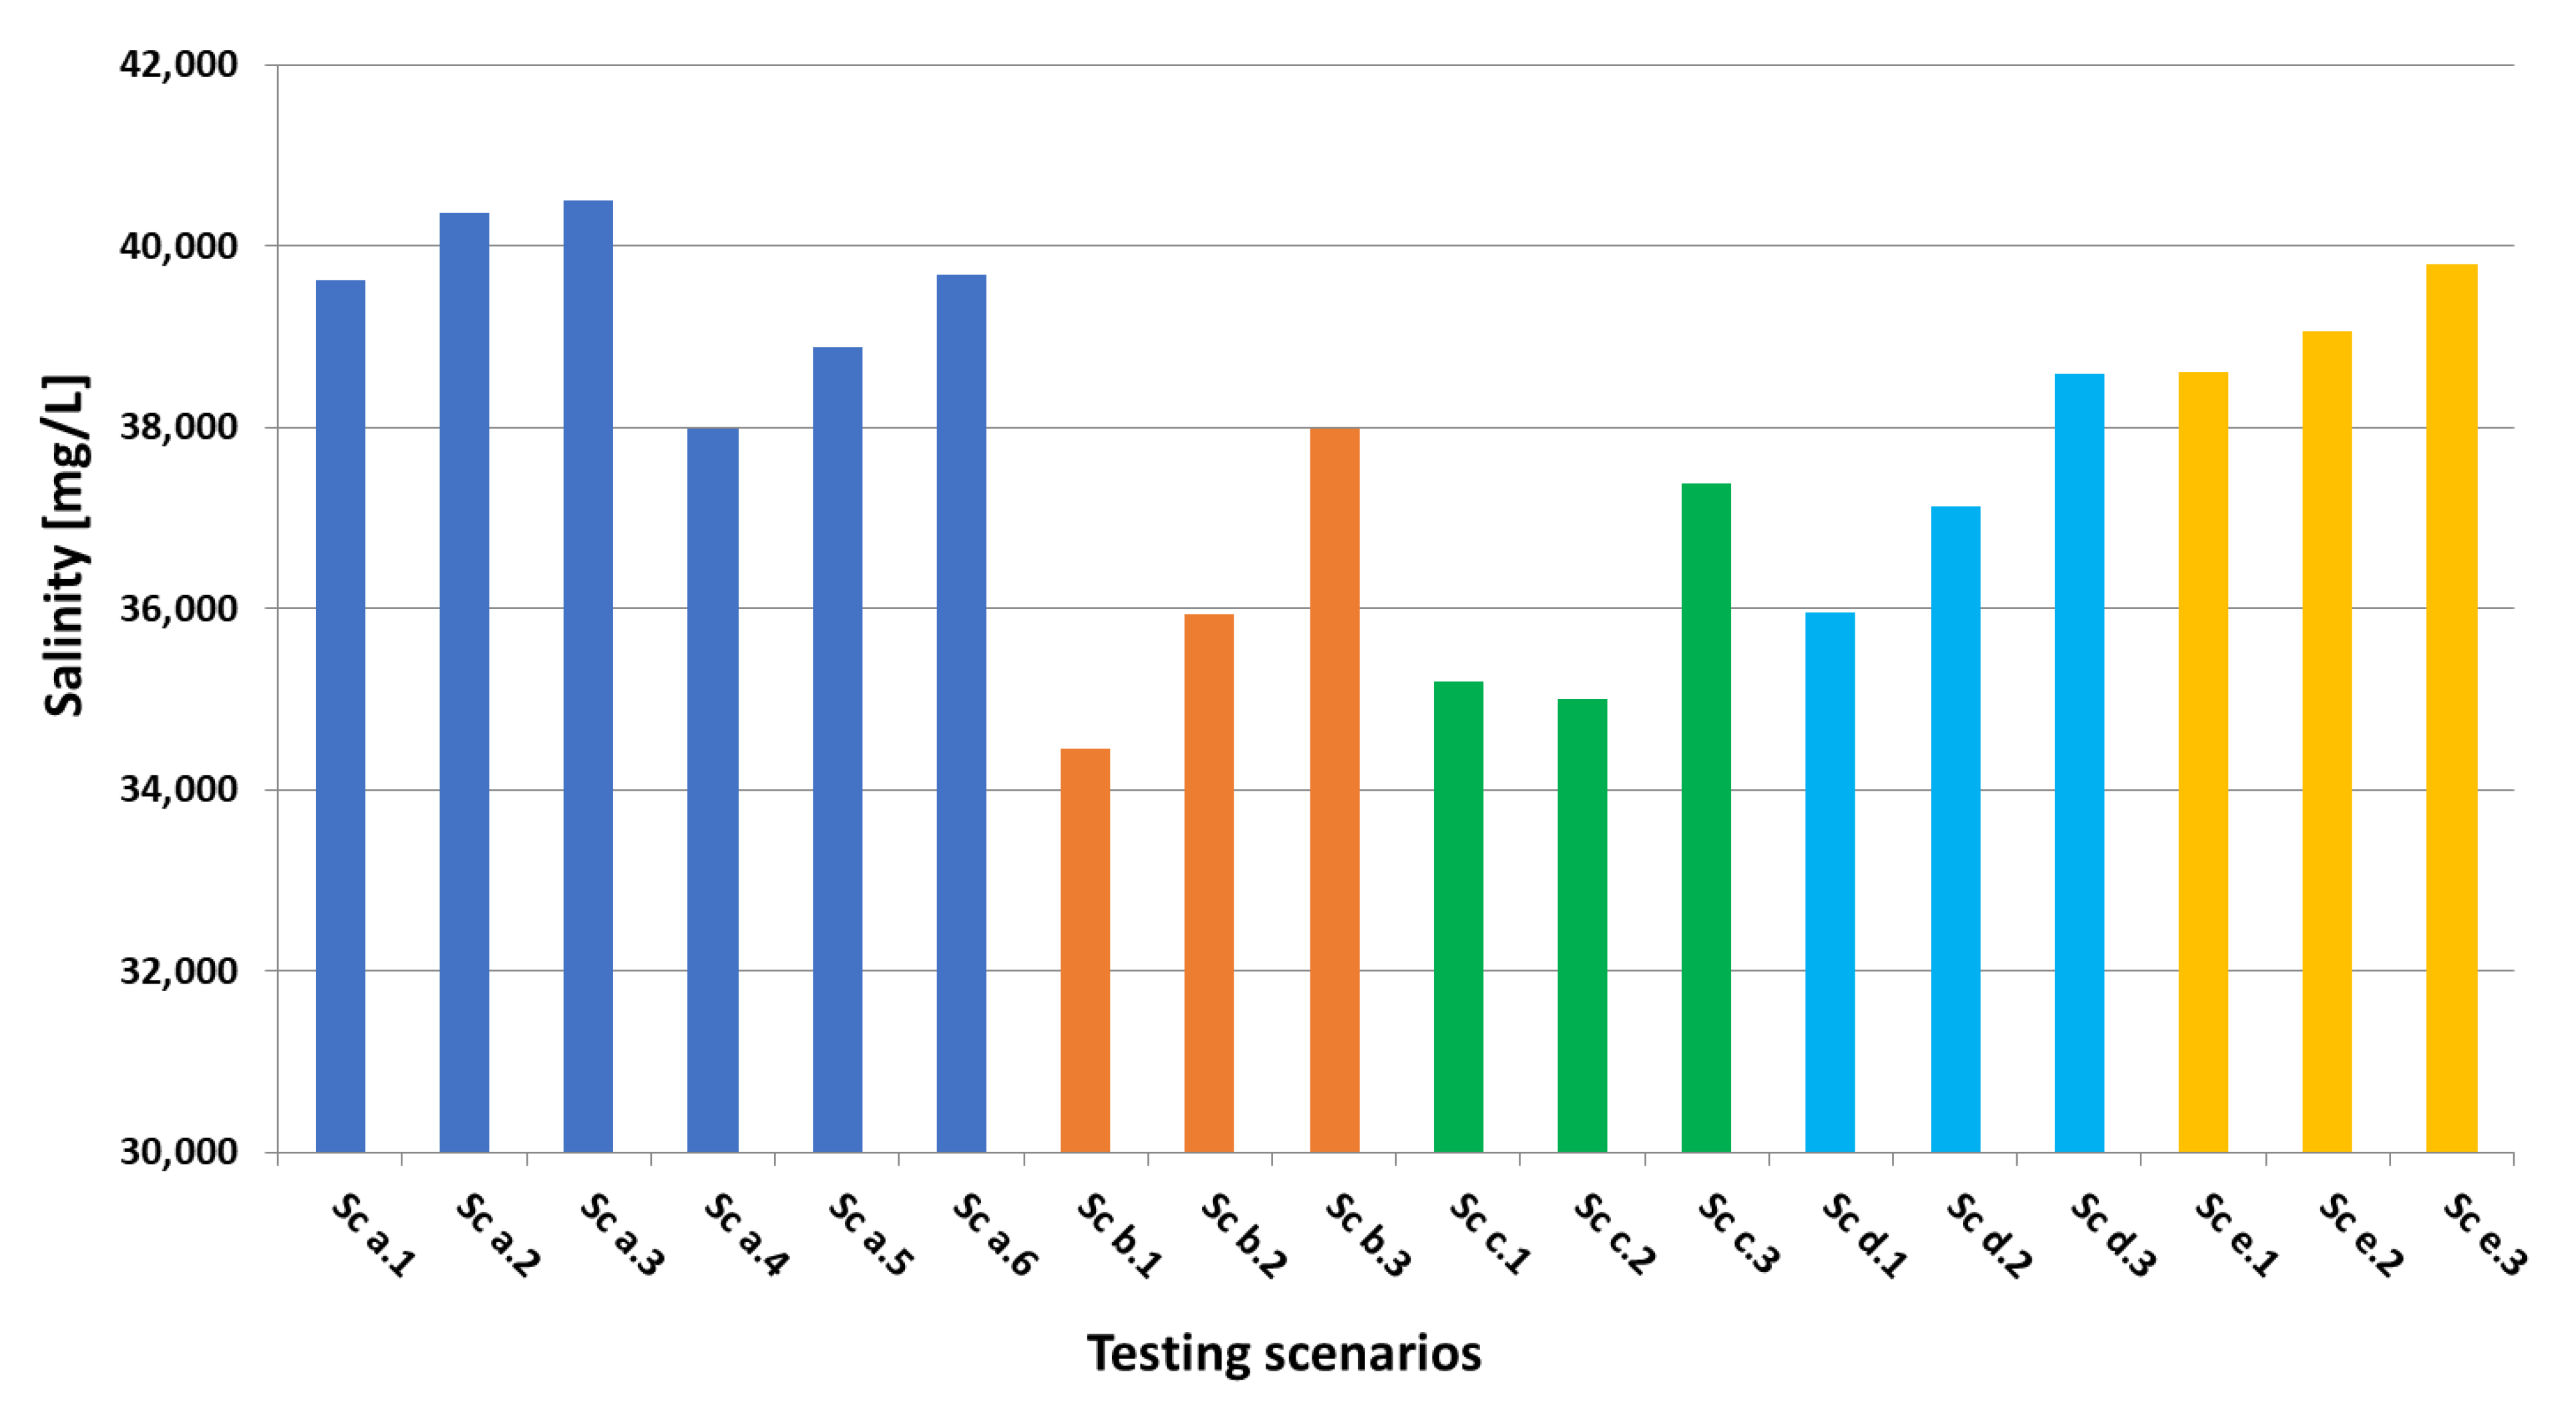
- According to scenarios Sc a.1, Sc a.2 and Sc a.3 (Figure 12a), which refer to extraction from the first aquifer, over time, the salinity of the water would reach about 40,000 mg/L when the largest amount is extracted, which is 150,000 m3/day; however, these scenarios were excluded because they required studying the effect of the extraction of this amount of groundwater on the facilities, foundations and infrastructure of the station, as well as on the nearby facilities. According to scenarios Sc a.4, Sc a.5 and Sc a.6 (Figure 12a`), in which extraction is performed from the second aquifer, with wells located at a distance of about 165 m from the sea, the salinity would range from 38,000 to 40,000 mg/L.
- For scenarios Sc b.1, Sc b.2 and Sc b.3 (Figure 12b), in which extraction is performed from the second aquifer, with wells located at a distance of about 300 m from the sea, the salinity would range from 34,000 to 38,000 mg/l.
- For scenarios Sc c.1, Sc c.2 and Sc c.3 (Figure 12c), in which extraction is performed from 10 wells instead of 5, from the second aquifer, the salinity would range from 35,000 to 38,000 mg/L.
- For scenarios Sc d.1, Sc d.2 and Sc d.3 (Figure 12d), in which extraction is performed from the second aquifer, with wells located at a distance of about 165 m from the sea with a distance of 100 m between wells, the salinity would range from 36,000 to 38,500 mg/L.
- For scenarios Sc e.1, Sc e.2 and Sc e.3 (Figure 12e), in which extraction is performed from the second aquifer, with wells located at a distance of about 165 m from the sea with a distance of 200 m between wells, the salinity would range from 38,500 to 40,000 mg/L.
5. Conclusions
Author Contributions
Funding
Institutional Review Board Statement
Informed Consent Statement
Data Availability Statement
Acknowledgments
Conflicts of Interest
References
- RIGW. Hydrogeological Map of Nile Delta, Scale 1: 500,000, 1st ed.; MWRI Publishing Unit: Cairo, Egypt, 1992. [Google Scholar]
- Eltarabily, M.G.A.; Negm, A.M. Groundwater management for sustainable development east of the nile delta aquifer. In Groundwater in the Nile Delta; Springer: Berlin/Heidelberg, Germany, 2017; pp. 687–708. [Google Scholar]
- Bear, J.; Cheng, A.H.-D.; Sorek, S.; Ouazar, D.; Herrera, I. Seawater Intrusion in Coastal Aquifers: Concepts, Methods and Practices; Springer Science & Business Media: Berlin/Heidelberg, Germany, 1999; Volume 14. [Google Scholar]
- Negm, A.M.; Sakr, S.; Abd-Elaty, I.; Abd-Elhamid, H.F. An overview of groundwater resources in Nile Delta aquifer. Groundw. Nile Delta 2018, 73, 3–44. [Google Scholar]
- Abd-Elhamid, H.; Javadi, A.; Abdelaty, I.; Sherif, M. Simulation of seawater intrusion in the Nile Delta aquifer under the conditions of climate change. Hydrol. Res. 2016, 47, 1198–1210. [Google Scholar] [CrossRef]
- Boumaiza, L.; Chesnaux, R.; Drias, T.; Walter, J.; Huneau, F.; Garel, E.; Knoeller, K.; Stumpp, C. Identifying groundwater degradation sources in a Mediterranean coastal area experiencing significant multi-origin stresses. Sci. Total. Environ. 2020, 746, 141203. [Google Scholar] [CrossRef] [PubMed]
- Elbeih, S.F.; Negm, A.M.; Kostianoy, A. Environmental Remote Sensing in Egypt; Springer Nature: Basingstoke, UK, 2020. [Google Scholar]
- Abou El-Magd, I.; El-Zeiny, A. Quantitative hyperspectral analysis for characterization of the coastal water from Damietta to Port Said, Egypt. Egypt. J. Remote Sens. Space Sci. 2014, 17, 61–76. [Google Scholar] [CrossRef] [Green Version]
- El-Magd, A.; Zakzouk, M.; Abdulaziz, A.M.; Ali, E.M. The potentiality of operational mapping of oil pollution in the mediterranean sea near the entrance of the suez canal using sentinel-1 SAR data. Remote Sens. 2020, 12, 1352. [Google Scholar] [CrossRef] [Green Version]
- El-Magd, I.A.; Zakzouk, M.; Ali, E.M.; Abdulaziz, A.M. An open source approach for near-real time mapping of oil spills along the mediterranean coast of Egypt. Remote Sens. 2021, 13, 2733. [Google Scholar] [CrossRef]
- Abd-Elaty, I.; Shahawy, A.E.; Santoro, S.; Curcio, E.; Straface, S. Effects of groundwater abstraction and desalination brine deep injection on a coastal aquifer. Sci. Total. Environ. 2021, 795, 148928. [Google Scholar] [CrossRef]
- Sherif, M.M.; Singh, V.P. Effect of climate change on sea water intrusion in coastal aquifers. Hydrol. Process. 1999, 13, 1277–1287. [Google Scholar] [CrossRef]
- Molle, F.; Gaafar, I.; El-Agha, D.E.; Rap, E. Irrigation Efficiency and the Nile Delta Water Balance; Water and salt management in the Nile Delta: Report No.9; IWMI: Anand, India, 2016; p. 7. [Google Scholar]
- Abd-Elaty, I.; Javadi, A.A.; Abd-Elhamid, H. Management of saltwater intrusion in coastal aquifers using different wells systems: A case study of the Nile Delta aquifer in Egypt. Hydrogeol. J. 2021, 29, 1767–1783. [Google Scholar] [CrossRef]
- Abdel-Shafy, H.I.; Kamel, A.H. Groundwater in Egypt issue: Resources, location, amount, contamination, protection, renewal, future overview. Egypt. J. Chem. 2016, 59, 321–362. [Google Scholar]
- El-Raey, M.; Nasr, S.; Frihy, O.; Desouki, S.; Dewidar, K. Potential impacts of accelerated sea-level rise on Alexandria Governorate, Egypt. J. Coast. Res. 1995, 14, 190–204. [Google Scholar]
- IPCC; Field, C.B.B.; Barros, V.R.; Dokken, D.J.; Mach, K.J.; Mastrandrea, M.D.; Bilir, T.E.; Chatterjee, M.; Ebi, K.L.E.; Anokhin, Y.; et al. Climate Change 2014–Impacts, Adaptation and Vulnerability: Regional Aspects; Cambridge University Press: Cambridge, UK, 2014. [Google Scholar]
- Morsy, W.S. Environmental Management to Groundwater Resources for Nile Delta Region. Ph.D. Thesis, Faculty of Engineering, Cairo University, Cairo, Egypt, 2009. [Google Scholar]
- Mabrouk, M.; Jonoski, A.; Solomatine, D.; Uhlenbrook, S. A review of seawater intrusion in the Nile Delta groundwater system–the basis for assessing impacts due to climate changes and water resources development. Nile Water Sci. Eng. J. 2017, 10, 46–61. [Google Scholar]
- Chang, C.-M.; Yeh, H.-D. Spectral approach to seawater intrusion in heterogeneous coastal aquifers. Hydrol. Earth Syst. Sci. 2010, 14, 719–727. [Google Scholar] [CrossRef] [Green Version]
- Wilson, J.L.; Townley, L.R.; Da Costa, A.S. Mathematical Development and Verification of a Finite Element Aquifer Flow Model AQUIFEM-1; Technological Planning Program; Tap Report; Massachusetts Institute of Technology: Cambridge, MA, USA, 1979; p. 114. [Google Scholar]
- Amer, A.; Farid, M. About sea water intrusion phenomenon in the Nile Delta aquifer. In Proceedings of the International Workshop on Management of the Nile Delta Groundwater Aquifer, CU/Mit, Cairo, Egypt, 1981. [Google Scholar]
- Darwish, M. Effect of Probable Hydrological Changes on the Nile Delta Aquifer System. Ph.D. Thesis, Cairo University, Cairo, Egypt, 1994. [Google Scholar]
- Amer, A.; Sherif, M. An Integrated Study for Seawater Intrusion in the Nile Delta Aquifer; Working Paper for SRP; NWRC-MPWWR: Cairo, Egypt, 1996. [Google Scholar]
- Sherif, M.; Singh, V. Groundwater Development and Sustainability in the Nile Delta Aquifer; Final Report; Binational Fulbright Commission: Giza Governorate, Egypt, 1997. [Google Scholar]
- Mahlknecht, J.; Merchán, D.; Rosner, M.; Meixner, A.; Ledesma-Ruiz, R. Assessing seawater intrusion in an arid coastal aquifer under high anthropogenic influence using major constituents, Sr and B isotopes in groundwater. Sci. Total Environ. 2017, 587, 282–295. [Google Scholar] [CrossRef] [PubMed]
- Howard, K.W. Beneficial aspects of sea—Water intrusion. Groundwater 1987, 25, 398–406. [Google Scholar] [CrossRef]
- Hussain, M.S.; Javadi, A.A.; Sherif, M.M. Three dimensional simulation of seawater intrusion in a regional coastal aquifer in UAE. Procedia Eng. 2015, 119, 1153–1160. [Google Scholar] [CrossRef] [Green Version]
- Patel, A.S.; Shah, D.L. Water Management: Conservation, Harvesting and Artificial Recharge; New Age International (P) Limited, Publishers: Hyderabad, India, 2008. [Google Scholar]
- Abarca, E.; Vázquez-Suñé, E.; Carrera, J.; Capino, B.; Gámez, D.; Batlle, F. Optimal design of measures to correct seawater intrusion. Water Resour. Res. 2006, 42. [Google Scholar] [CrossRef] [Green Version]
- Tsanis, I.K.; Song, L.F. Remediation of sea water intrusion: A case study. Groundw. Monit. Remediat. 2001, 21, 152–161. [Google Scholar] [CrossRef]
- Essink, G.H.O. Improving fresh groundwater supply—problems and solutions. Ocean Coast. Manag. 2001, 44, 429–449. [Google Scholar] [CrossRef]
- Shamir, U.; Bear, J.; Gamliel, A. Optimal annual operation of a coastal aquifer. Water Resour. Res. 1984, 20, 435–444. [Google Scholar] [CrossRef]
- Das, A.; Datta, B. Development of multiobjective management models for coastal aquifers. J. Water Resour. Plan. Manag. 1999, 125, 76–87. [Google Scholar] [CrossRef]
- Emch, P.G.; Yeh, W.W. Management model for conjunctive use of coastal surface water and ground water. J. Water Resour. Plan. Manag. 1998, 124, 129–139. [Google Scholar] [CrossRef]
- Narayan, K.; Schleeberger, C.; Charlesworth, P.; Bistrow, K. Effects of roundwater pumping on saltwater intrusion in the lower Burdekin Delta, North Queensland. In Proceedings of the MODSIM 2003 International Congress on Modelling and Simulation, Townsville, Australia, 14–17 July 2003; pp. 212–217. [Google Scholar]
- Trichakis, Y. Modeling the saltwater intrusion phenomenon in coastal aquifers-a case study in the industrial zone of herakleio in crete. Glob. NEST J. 2005, 7, 197–203. [Google Scholar]
- Kashef, A.-A.I. Control of salt-water intrusion by recharge wells. J. Irrig. Drain. Div. 1976, 102, 445–457. [Google Scholar] [CrossRef]
- Mahesha, A. Transient effect of battery of injection wells on seawater intrusion. J. Hydraul. Eng. 1996, 122, 266–271. [Google Scholar] [CrossRef]
- Maimone, M.; Fitzgerald, R. Effective modeling of coastal aquifer systems. In Proceedings of the First International Conference on Saltwater Intrusion and Coastal Aquifers-Monitoring, Modeling, and Management, Essaouira, Morocco, 23–25 April 2001; pp. 23–25. [Google Scholar]
- Kacimov, A.; Sherif, M.; Perret, J.; Al-Mushikhi, A. Control of sea-water intrusion by salt-water pumping: Coast of Oman. Hydrogeol. J. 2009, 17, 541–558. [Google Scholar] [CrossRef]
- Farid, M.S. Nile Delta Groundwater Study. Master’s Thesis, Faculty of Engineering, Cairo University, Cairo, Egypt, 1980. [Google Scholar]
- Farid, M.S. Management of Groundwater System in the Nile Delta. Ph.D. Thesis, Faculty of Engineering, Cairo University, Cairo, Egypt, 1985. [Google Scholar]
- Mohsen, M.S.; Singh, V.P.; Amer, A.M. A note on saltwater intrusion in coastal aquifers. Water Resour. Manag. 1990, 4, 123–134. [Google Scholar] [CrossRef]
- Sherif, M.; Sefelnasr, A.; Javadi, A. Incorporating the concept of equivalent freshwater head in successive horizontal simulations of seawater intrusion in the Nile Delta aquifer, Egypt. J. Hydrol. 2012, 464, 186–198. [Google Scholar] [CrossRef]
- Abu-Bakr, H.A.e.-A.; Elkhedr, M.; Hassan, T.M. Optimization of abstraction wells near coastal zone. J. Earth Sci. Res. 2016, 4, 30–42. [Google Scholar] [CrossRef]
- Abd-Elaty, I.; Zeleňáková, M.; Krajníková, K.; Abd-Elhamid, H.F. Analytical solution of saltwater intrusion in costal aquifers considering climate changes and different boundary conditions. Water 2021, 13, 995. [Google Scholar] [CrossRef]
- Mastrocicco, M.; Busico, G.; Colombani, N.; Vigliotti, M.; Ruberti, D. Modelling actual and future seawater intrusion in the Variconi Coastal Wetland (Italy) due to climate and landscape changes. Water 2019, 11, 1502. [Google Scholar] [CrossRef] [Green Version]
- Abdelhalim, A.; Sefelnasr, A.; Ismail, E. Numerical modeling technique for groundwater management in Samalut city, Minia Governorate, Egypt. Arab. J. Geosci. 2019, 12, 124. [Google Scholar] [CrossRef]
- Hagagg, K.H. Numerical modeling of seawater intrusion in karstic aquifer, Northwestern Coast of Egypt. Modeling Earth Syst. Environ. 2019, 5, 431–441. [Google Scholar] [CrossRef]
- Mabrouk, M.; Jonoski, A.; Oude Essink, G.H.; Uhlenbrook, S. Assessing the fresh–saline groundwater distribution in the Nile delta aquifer using a 3D variable-density groundwater flow model. Water 2019, 11, 1946. [Google Scholar] [CrossRef] [Green Version]
- Mabrouk, M.; Jonoski, A.; HP Oude Essink, G.; Uhlenbrook, S. Impacts of sea level rise and groundwater extraction scenarios on fresh groundwater resources in the Nile Delta governorates, Egypt. Water 2018, 10, 1690. [Google Scholar] [CrossRef] [Green Version]
- Abd-Elaty, I.; Abd-elhamid, H.; Fahmy, M.; Abd-Elaal, G. Study of Impact of some changes on groundwater system in Nile delta aquifer. Egypt. J. Eng. Sci. Technol. 2014, 17, 10–11. [Google Scholar] [CrossRef]
- Abd-Elaty, I.; Abd-Elhamid, H.F.; Nezhad, M.M. Numerical analysis of physical barriers systems efficiency in controlling saltwater intrusion in coastal aquifers. Environ. Sci. Pollut. Res. 2019, 26, 35882–35899. [Google Scholar] [CrossRef]
- Abd-Elaty, I.; Abd-Elhamid, H.F.; Qahman, K. Coastal aquifer protection from saltwater intrusion using abstraction of brackish water and recharge of treated wastewater: Case study of the gaza aquifer. J. Hydrol. Eng. 2020, 25, 05020012. [Google Scholar] [CrossRef]
- Langevin, C.D.; Shoemaker, W.B.; Guo, W. Modflow-2000, the US Geological Survey Modular Ground-Water Model–Documentation of the SEAWAT-2000 Version with the Variable-Density Flow Process (VDF) and the Integrated MT3DMS Transport Process (IMT); US Geological Survey: Tallahassee, FL, USA, 2003; ISSN 2331-1258.
- Bear, J. Seawater intrusion into coastal aquifers. In Encyclopedia of Hydrological Sciences; Anderson, M.G., Ed.; Wiley: Devon, UK, 2005. [Google Scholar]
- McDonald, M.G.; Harbaugh, A.W. A Modular Three-Dimensional Finite-Difference Ground-Water Flow Model; US Geological Survey: Reston, VA, USA, 1988.
- Zheng, C.; Wang, P.P. MT3DMS: A Modular Three-Dimensional Multispecies Transport Model for Simulation of Advection, Dispersion, and Chemical Reactions of Contaminants in Groundwater Systems; Documentation and User’s Guide; Aquaveo Reseller Network: Provo, UT, USA, 1999. [Google Scholar]
- Abd-Elaty, I.; Said, A.M.; Abdelaal, G.M.; Zeleňáková, M.; Jandora, J.; Abd-Elhamid, H.F. Assessing the impact of lining polluted streams on groundwater quality: A case study of the eastern Nile delta aquifer, Egypt. Water 2021, 13, 1705. [Google Scholar] [CrossRef]
- Abdelfattah, M.; Gaber, A.; Geriesh, M.H.; Hassan, T.M. Investigating the less ambiguous hydrogeophysical method in exploring the shallow coastal stratified-saline aquifer: A case study at West Port Said Coast, Egypt. Environ. Earth Sci. 2021, 80, 1–14. [Google Scholar] [CrossRef]
- EEAA. Egypt Second National Communication under the United Nations Framework Convention on Climate Change (UNFCCC); Egyptian Environmental Affairs Agency, Ministry of State for Environmental Affairs: Cairo, Egypt, 2010.
- El Haddad, I. Hydrogeological Studies and Their Environmental Impact on Future Management and Sustainable Development of the New Communities and Their Surroundings, East of the Nile Delta, Egypt. Ph.D. Thesis, Mansoura University, Mansoura, Egypt, 2002. Unpublished. [Google Scholar]
- Available online: https://www.worldweatheronline.com/port-said-weather-averages/bur-said/eg.aspx (accessed on 8 November 2021).
- Sestini, G. Nile Delta: A review of depositional environments and geological history. Geol. Soc. Lond. Spec. Publ. 1989, 41, 99–127. [Google Scholar] [CrossRef]
- Zaghloul, Z.; Taha, A.; Hegab, O.; El Fawal, F. The neogene-quaternary sedimentary basins of the Nile delta. Egypt. J. Geol. 1977, 21, 1–19. [Google Scholar]
- El-Fayoumy, I.F. Geology of Groundwater Supplies in the Eastern Region of the Nile Delta and its Extension in North Sinai. Ph.D. Thesis, Faculty of Science, Cairo University, Cairo, Egypt, 1968. [Google Scholar]
- Dahab, K. Hydrogeological Evolution of the Nile Delta after the High Dam Construction. Ph.D. Thesis, Menoufia University, Al Minufiyah, Egypt, 1993. [Google Scholar]
- Boulton, N. Analysis of data from non-equilibrium pumping tests allowing for delayed yield from storage. Proc. Inst. Civ. Eng. 1963, 26, 469–482. [Google Scholar] [CrossRef]
- Theis, C.V. The relation between the lowering of the piezometric surface and the rate and duration of discharge of a well using ground—water storage. Eos Trans. Am. Geophys. Union 1935, 16, 519–524. [Google Scholar] [CrossRef]
- Hantush, M.S. Modification of the theory of leaky aquifers. J. Geophys. Res. 1960, 65, 3713–3725. [Google Scholar] [CrossRef]
- Bear, J. Hydraulics of Groundwater; Dover Publications: Mineola, NY, USA, 2007. [Google Scholar]
- Pasquier, P.; Marcotte, D. Steady-and transient-state inversion in hydrogeology by successive flux estimation. Adv. Water Resour. 2006, 29, 1934–1952. [Google Scholar] [CrossRef]


| Well | Step Pumping Tests | Continuous Pumping Test | Aquifer | Hydraulic Conductivity (m/day) | |||
|---|---|---|---|---|---|---|---|
| Discharge Rate (m3/hr) | Drawdown (m) | Discharge Rate (m3/hr) | Drawdown (m) | Time (Hour) | |||
| GW 01 | 150 | 7.39 | 250 | 13.38 | 72 | Sandstone (Unconfined) | 13–28 |
| 183 | 9.32 | ||||||
| 215 | 11.12 | ||||||
| 250 | 13.28 | ||||||
| GW 05 | 182 | 13.8 | 300 | 24.34 | 24 | ||
| 215 | 16.44 | ||||||
| 265 | 21.37 | ||||||
| 280 | 23.48 | ||||||
| GW 02 | 150 | 13.59 | 300 | 31.33 | 72 | Sandstone (Leaky Confined) | 4–11 |
| 200 | 18.39 | ||||||
| 257 | 24.04 | ||||||
| 300 | 28.35 | ||||||
| GW 03 | 65 | 0.95 | 120 | 4.9 | 48 | ||
| 85 | 1.83 | ||||||
| 105 | 3.2 | ||||||
| 120 | 4.25 | ||||||
| GW 04 | 180 | 9.82 | 300 | 16.87 | 24,72 | Sandstone (Deeper confined) | 3–5.5 |
| 220 | 12.14 | ||||||
| 260 | 14.6 | ||||||
| 300 | 17.04 | ||||||
| Component | Recharge (m3/day) | Discharge (m3/day) |
|---|---|---|
| Subsurface drainage | 0 | - |
| Seepage from the Nile and main canals | 0 | - |
| Inflow across boundaries | 89,910.4297 | - |
| Discharge by tile drains | 0 | |
| Inflow to Damietta | 0 | |
| Discharge into drains | 0 | |
| Groundwater withdrawals | 0 | |
| Evaporation | 0 | |
| Outflow across boundaries | 89,919.2109 | |
| Balance | 89,910.4297 | 89,919.2109 |
| Scenario | Wells Arrangement | Screen Depth | Discharge (m3/d) | Drawdown after 50 Years (m) |
|---|---|---|---|---|
| Sc a.1 | a | Aquifer A | 50,000 | 2.5 |
| Sc a.2 | 100,000 | 4.6 | ||
| Sc a.3 | 150,000 | 6.7 | ||
| Sc a.4 | Aquifer B | 50,000 | 9.7 | |
| Sc a.5 | 100,000 | 19.5 | ||
| Sc a.6 | 150,000 | 29.3 | ||
| Sc b.1 | b | Aquifer B | 50,000 | 7.5 |
| Sc b.2 | 100,000 | 15.1 | ||
| Sc b.3 | 150,000 | 22.6 | ||
| Sc c.1 | c | Aquifer B | 50,000 | 9.2 |
| Sc c.2 | 100,000 | 18.4 | ||
| Sc c.3 | 150,000 | 27.7 | ||
| Sc d.1 | d | Aquifer B | 50,000 | 7.2 |
| Sc d.2 | 100,000 | 14.4 | ||
| Sc d.3 | 150,000 | 21.6 | ||
| Sc e.1 | e | Aquifer B | 50,000 | 3.5 |
| Sc e.2 | 100,000 | 7 | ||
| Sc e.3 | 150,000 | 10.5 |
Publisher’s Note: MDPI stays neutral with regard to jurisdictional claims in published maps and institutional affiliations. |
© 2021 by the authors. Licensee MDPI, Basel, Switzerland. This article is an open access article distributed under the terms and conditions of the Creative Commons Attribution (CC BY) license (https://creativecommons.org/licenses/by/4.0/).
Share and Cite
Abdelfattah, M.; Abu-Bakr, H.A.-A.; Gaber, A.; Geriesh, M.H.; Elnaggar, A.Y.; Nahhas, N.E.; Hassan, T.M. Proposing the Optimum Withdrawing Scenarios to Provide the Western Coastal Area of Port Said, Egypt, with Sufficient Groundwater with Less Salinity. Water 2021, 13, 3359. https://doi.org/10.3390/w13233359
Abdelfattah M, Abu-Bakr HA-A, Gaber A, Geriesh MH, Elnaggar AY, Nahhas NE, Hassan TM. Proposing the Optimum Withdrawing Scenarios to Provide the Western Coastal Area of Port Said, Egypt, with Sufficient Groundwater with Less Salinity. Water. 2021; 13(23):3359. https://doi.org/10.3390/w13233359
Chicago/Turabian StyleAbdelfattah, Mohamed, Heba Abdel-Aziz Abu-Bakr, Ahmed Gaber, Mohamed H. Geriesh, Ashraf Y. Elnaggar, Nihal El Nahhas, and Taher Mohammed Hassan. 2021. "Proposing the Optimum Withdrawing Scenarios to Provide the Western Coastal Area of Port Said, Egypt, with Sufficient Groundwater with Less Salinity" Water 13, no. 23: 3359. https://doi.org/10.3390/w13233359