Article

A Hydrological Modeling Approach for Assessing the Impacts of Climate Change on Runoff Regimes in Slovakia

1
Institute of Hydrology, Slovak Academy of Sciences, Dúbravská Cesta 9, 84104 Bratislava, Slovakia
2
Department of Land and Water Resources Management, Slovak University of Technology, 81005 Bratislava, Slovakia
*
Author to whom correspondence should be addressed.
Water 2021, 13(23), 3358; https://doi.org/10.3390/w13233358
Submission received: 25 October 2021 / Revised: 19 November 2021 / Accepted: 23 November 2021 / Published: 26 November 2021
(This article belongs to the Section Hydrology)

Abstract

:
The changing climate is a concern with regard to sustainable water resources. Projections of the runoff in future climate conditions are needed for long-term planning of water resources and flood protection. In this study, we evaluate the possible climate change impacts on the runoff regime in eight selected basins located in the whole territory of Slovakia. The projected runoff in the basins studied for the reference period (1981–2010) and three future time horizons (2011–2040, 2041–2070, and 2071–2100) was simulated using the HBV (Hydrologiska Byråns Vattenbalansavdelning) bucket-type model (the TUW (Technische Universität Wien) model). A calibration strategy based on the selection of the most suitable decade in the observation period for the parameterization of the model was applied. The model was first calibrated using observations, and then was driven by the precipitation and air temperatures projected by the KNMI (Koninklijk Nederlands Meteorologisch Instituut) and MPI (Max Planck Institute) regional climate models (RCM) under the A1B emission scenario. The model’s performance metrics and a visual inspection showed that the simulated runoff using downscaled inputs from both RCM models for the reference period represents the simulated hydrological regimes well. An evaluation of the future, which was performed by considering the representative climate change scenarios, indicated that changes in the long-term runoff’s seasonality and extremality could be expected in the future. In the winter months, the runoff should increase, and decrease in the summer months compared to the reference period. The maximum annual daily runoff could be more extreme for the later time horizons (according to the KNMI scenario for 2071–2100). The results from this study could be useful for policymakers and river basin authorities for the optimum planning and management of water resources under a changing climate.

1. Introduction

Understanding the impact of climate change on the water balance is one of the main scientific interests in hydrology. Possible changes in runoff conditions caused by changing climatic conditions are one of the significant sources of uncertainty in water resources management and flood protection. Climate change can cause a decrease in water resources, changes in the regimes of runoff and snow accumulation, and increases in the extremes of floods and droughts (e.g., [1,2,3,4,5]). Changes in hydrological time series in the observation period in Slovakia were detected by Ďurigová, et al. [6,7], and changes in the water balance and the soil moisture regime due a changing climate were analyzed by Rončák et al. [8,9]. Therefore, it is important to estimate the possible impacts of future climate change on water resources.
Rainfall-runoff (r-r) models, especially conceptual r-r models, are widely used for climate impact assessments (e.g., [10,11,12]). There are numerous regional [3,5,13,14,15,16] and national (e.g., [17,18,19,20,21,22,23,24,25]) studies that have evaluated the impact of climate change on water resources using r-r models, which are forced with different global or regional climate circulation models, and which consider various emission scenarios. Most of them have shown that climate change will play an important role in future runoff conditions. For example, Vyshnevskyi et al. [25] assessed the possible climate change impact on the runoff regime at 11 meteorological stations in the Ukrainian Carpathians. Their results showed a tendency for runoff to increase in a winter period. Wang et al. [18] showed that increases in precipitation lead to greater changes in runoff. Their research was performed in the Liao River basin in China. Wu et al. [22] showed a reduction (11.6%) in annual runoff in the Chinese Yellow River basin according to their hydrological model’s projection. This is in line with Huntington [17], who showed that climate warming could reduce runoff in 38 forested watersheds in New England (the United States). According to their results, the largest reductions in runoff were observed during April and May. Shahvari et al. [24] evaluated the impact of climate change on water resources through the use of a SWAT hydrological model under three scenarios (RCP 2.6, RCP 6, RCP 8.5). The study was performed for three basins (the Lavasanat, Damavand, and Varamin) in Iran. Their results showed that runoff will increase in the fall/spring and decrease in the winter/summer under future time horizons. Aich et al. [20] assessed the possible impact of climate change on the runoff regime in three African river basins (the Niger, the Upper Blue Nile, the Ouban). Their results indicated the impact of climate change on runoff, especially on high/low flows and mean discharges. The impact of future climate changes on runoff was also presented by Vano et al. [21], who used the variable infiltration capacity (VIC) hydrological model in the Pacific Northwest (USGS Hydrologic Region 17 plus the Canadian portion of the Columbia). Their results indicated seasonal shifts in runoff in response to warming during the cold season.
Most of these results are comparable with the results of previous studies performed in various Slovak regions (e.g., [5,8,13,14,15,16]). For example, Kohnová et al. [5] evaluated the impact of climate change on extreme runoff regimes in two Slovak basins (the Váh and Laborec basins). They predicted a general increase in mean monthly runoff, especially during the winter period. These results are supported by the results of Rončák et al. [3] and Rončák et al. [16], who indicated that overall monthly runoff will increase (mainly during the winter period) with changes in climate as a result of increases in the precipitation/air temperature.
Despite the fact that quantifying the impact of climate change on runoff processes has been extensively investigated over recent decades, this topic is still challenging (because of complex runoff mechanisms, etc.) for hydrologists. The scientific objective of this study was to develop a calibration strategy based on the selection of the most suitable decade in the observation period for the parameterization of a rainfall-runoff model for modelling runoff in future climate conditions. The parameterized model was then applied to estimate the possible effect of climate change on the runoff regime in the eight selected basins in Slovakia, which were divided into two groups according to their mean basin elevation. In extending previous studies performed in these Slovak regions, this paper concentrates on an approach for studying the effects of climate change on the whole territory of Slovakia. Due to a strong climate signal in the recent decades (e.g., [26]), this region is well suited for such analyses. We applied a lumped hydrological model based on the HBV (Hydrologiska Byråns Vattenbalansavdelning) concept, which is widely used for climate impact assessments. The climate projections were represented by the model runs forced by the KNMI (Koninklijk Nederlands Meteorologisch Instituut) and MPI (Max Planck Institute) regional circulation models with the A1B emission scenario.
The paper is structured as follows. The study basins, data, and climatic scenarios are presented in Section 2. Section 3 describes the rainfall-runoff model. Section 4 contains the final results of the study, and Section 5 contains the discussion, followed by the conclusions in Section 6.

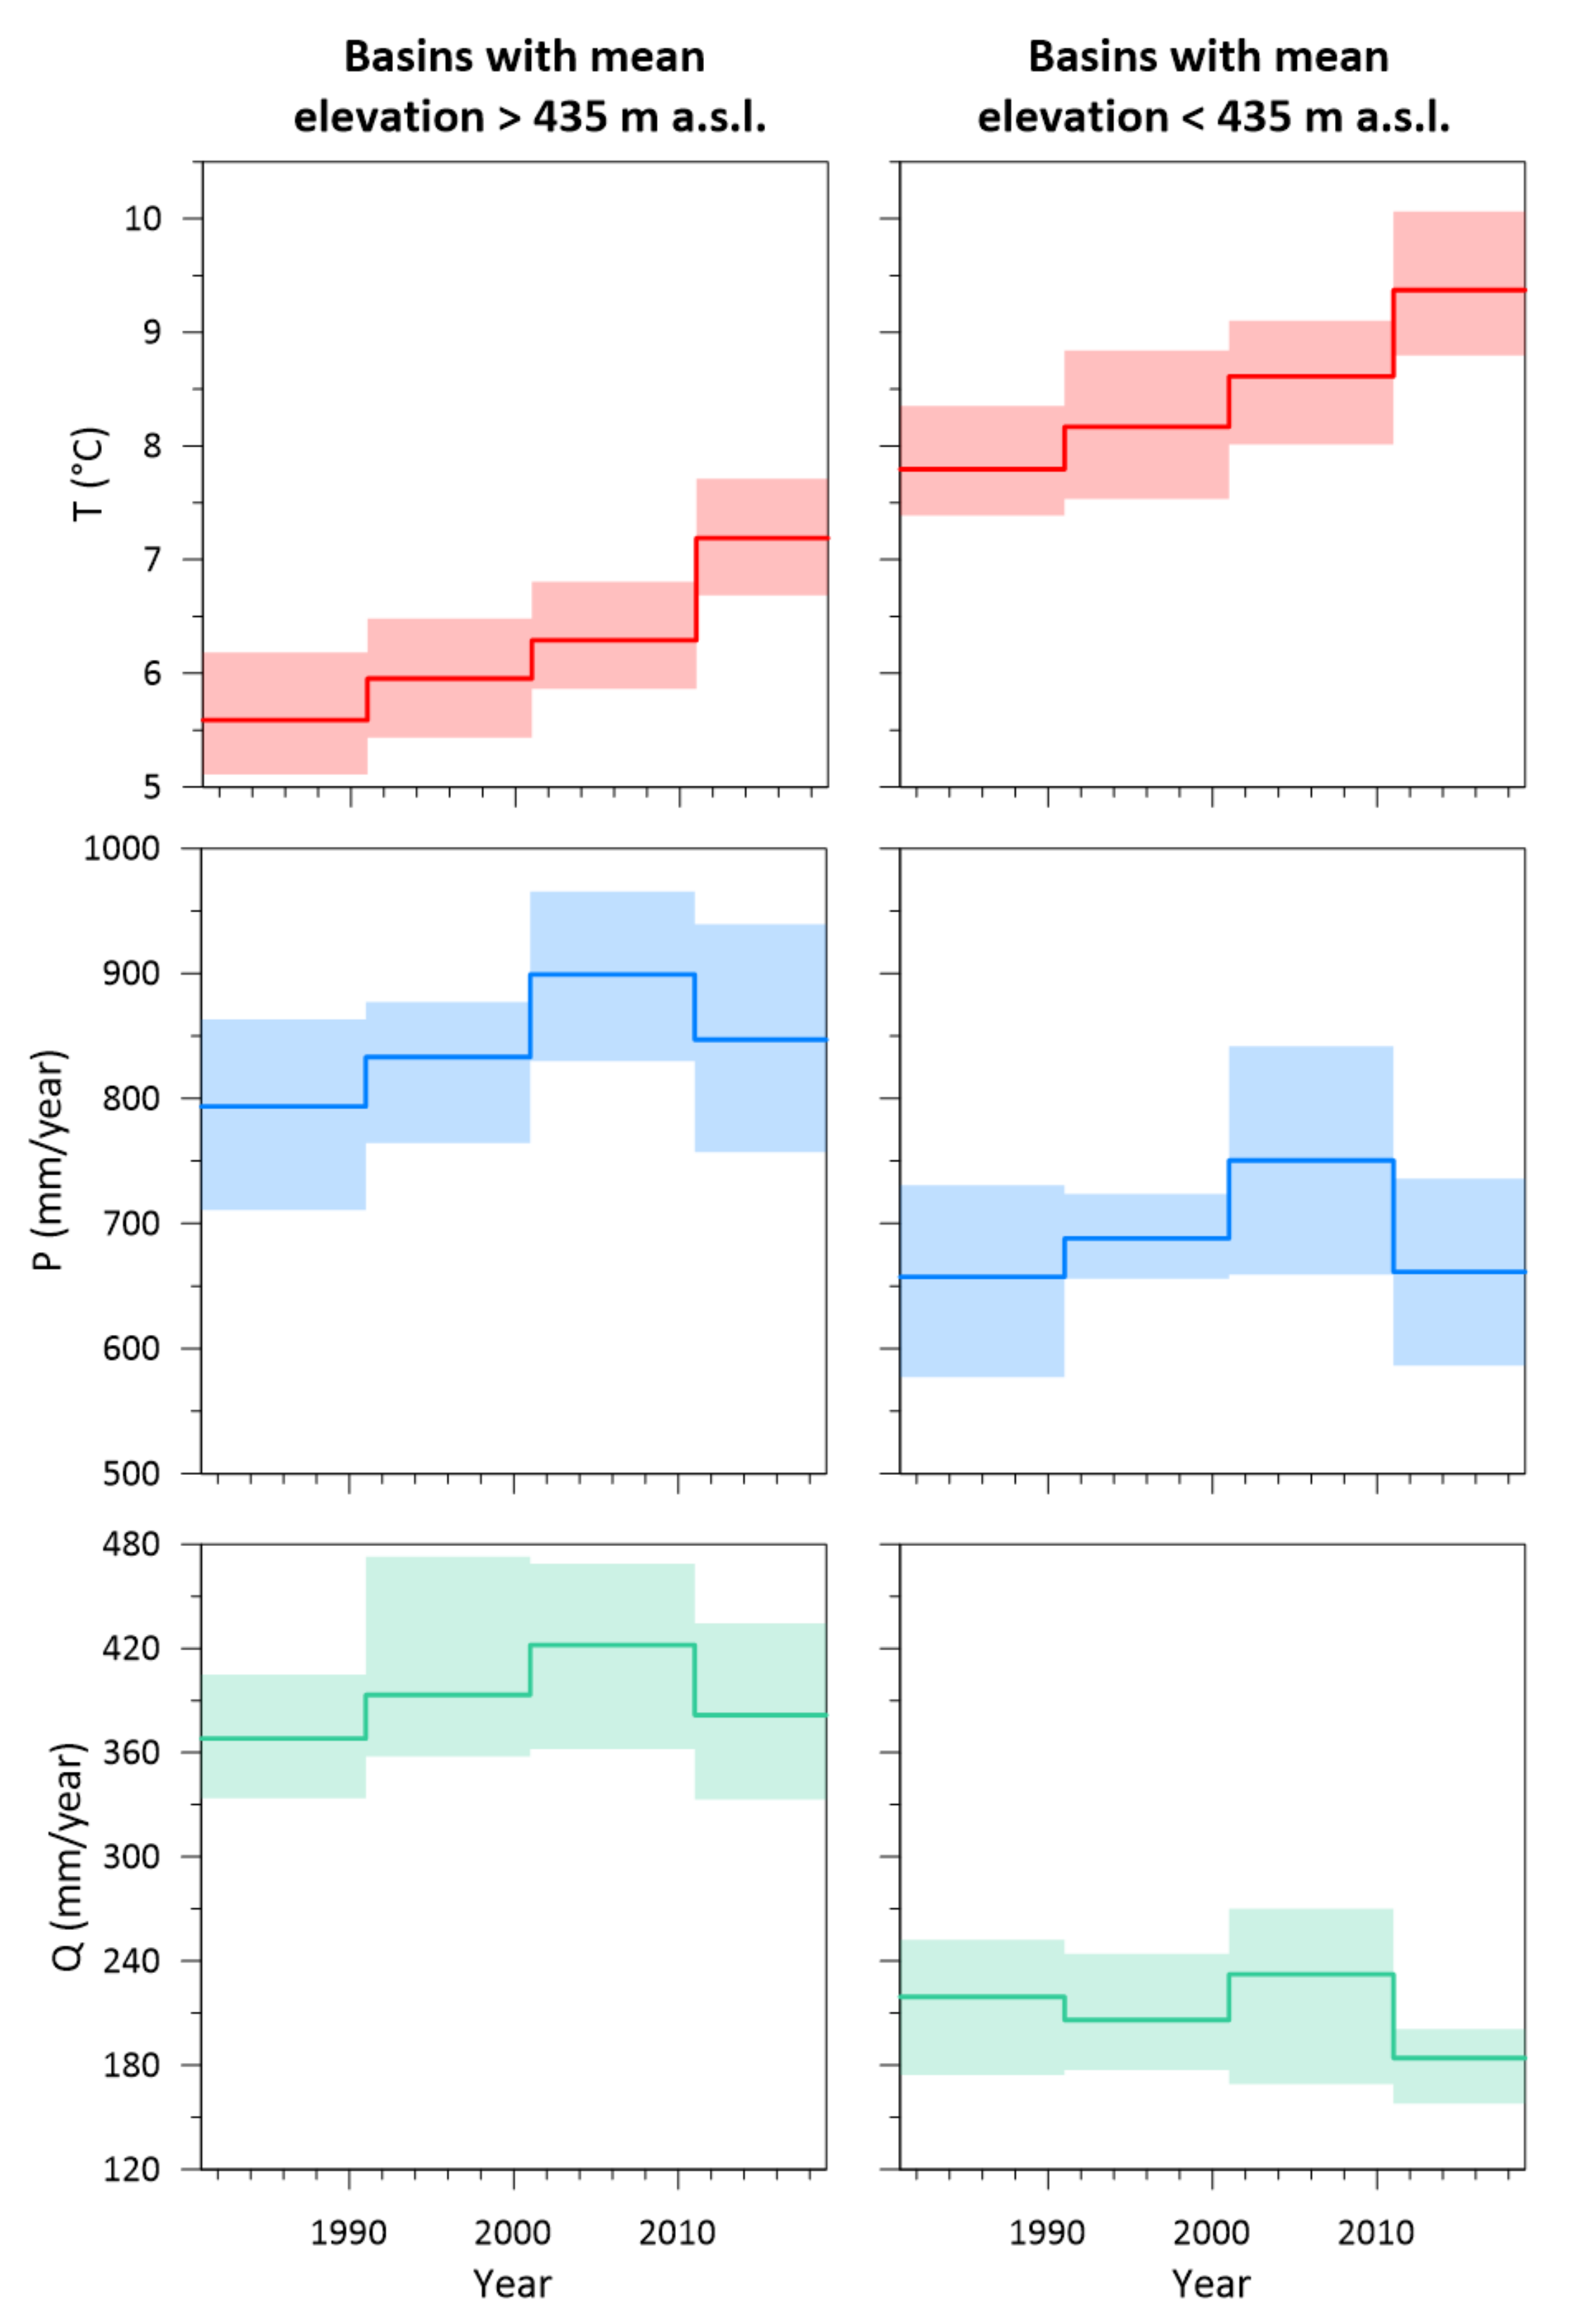
2. Study Basins and Data
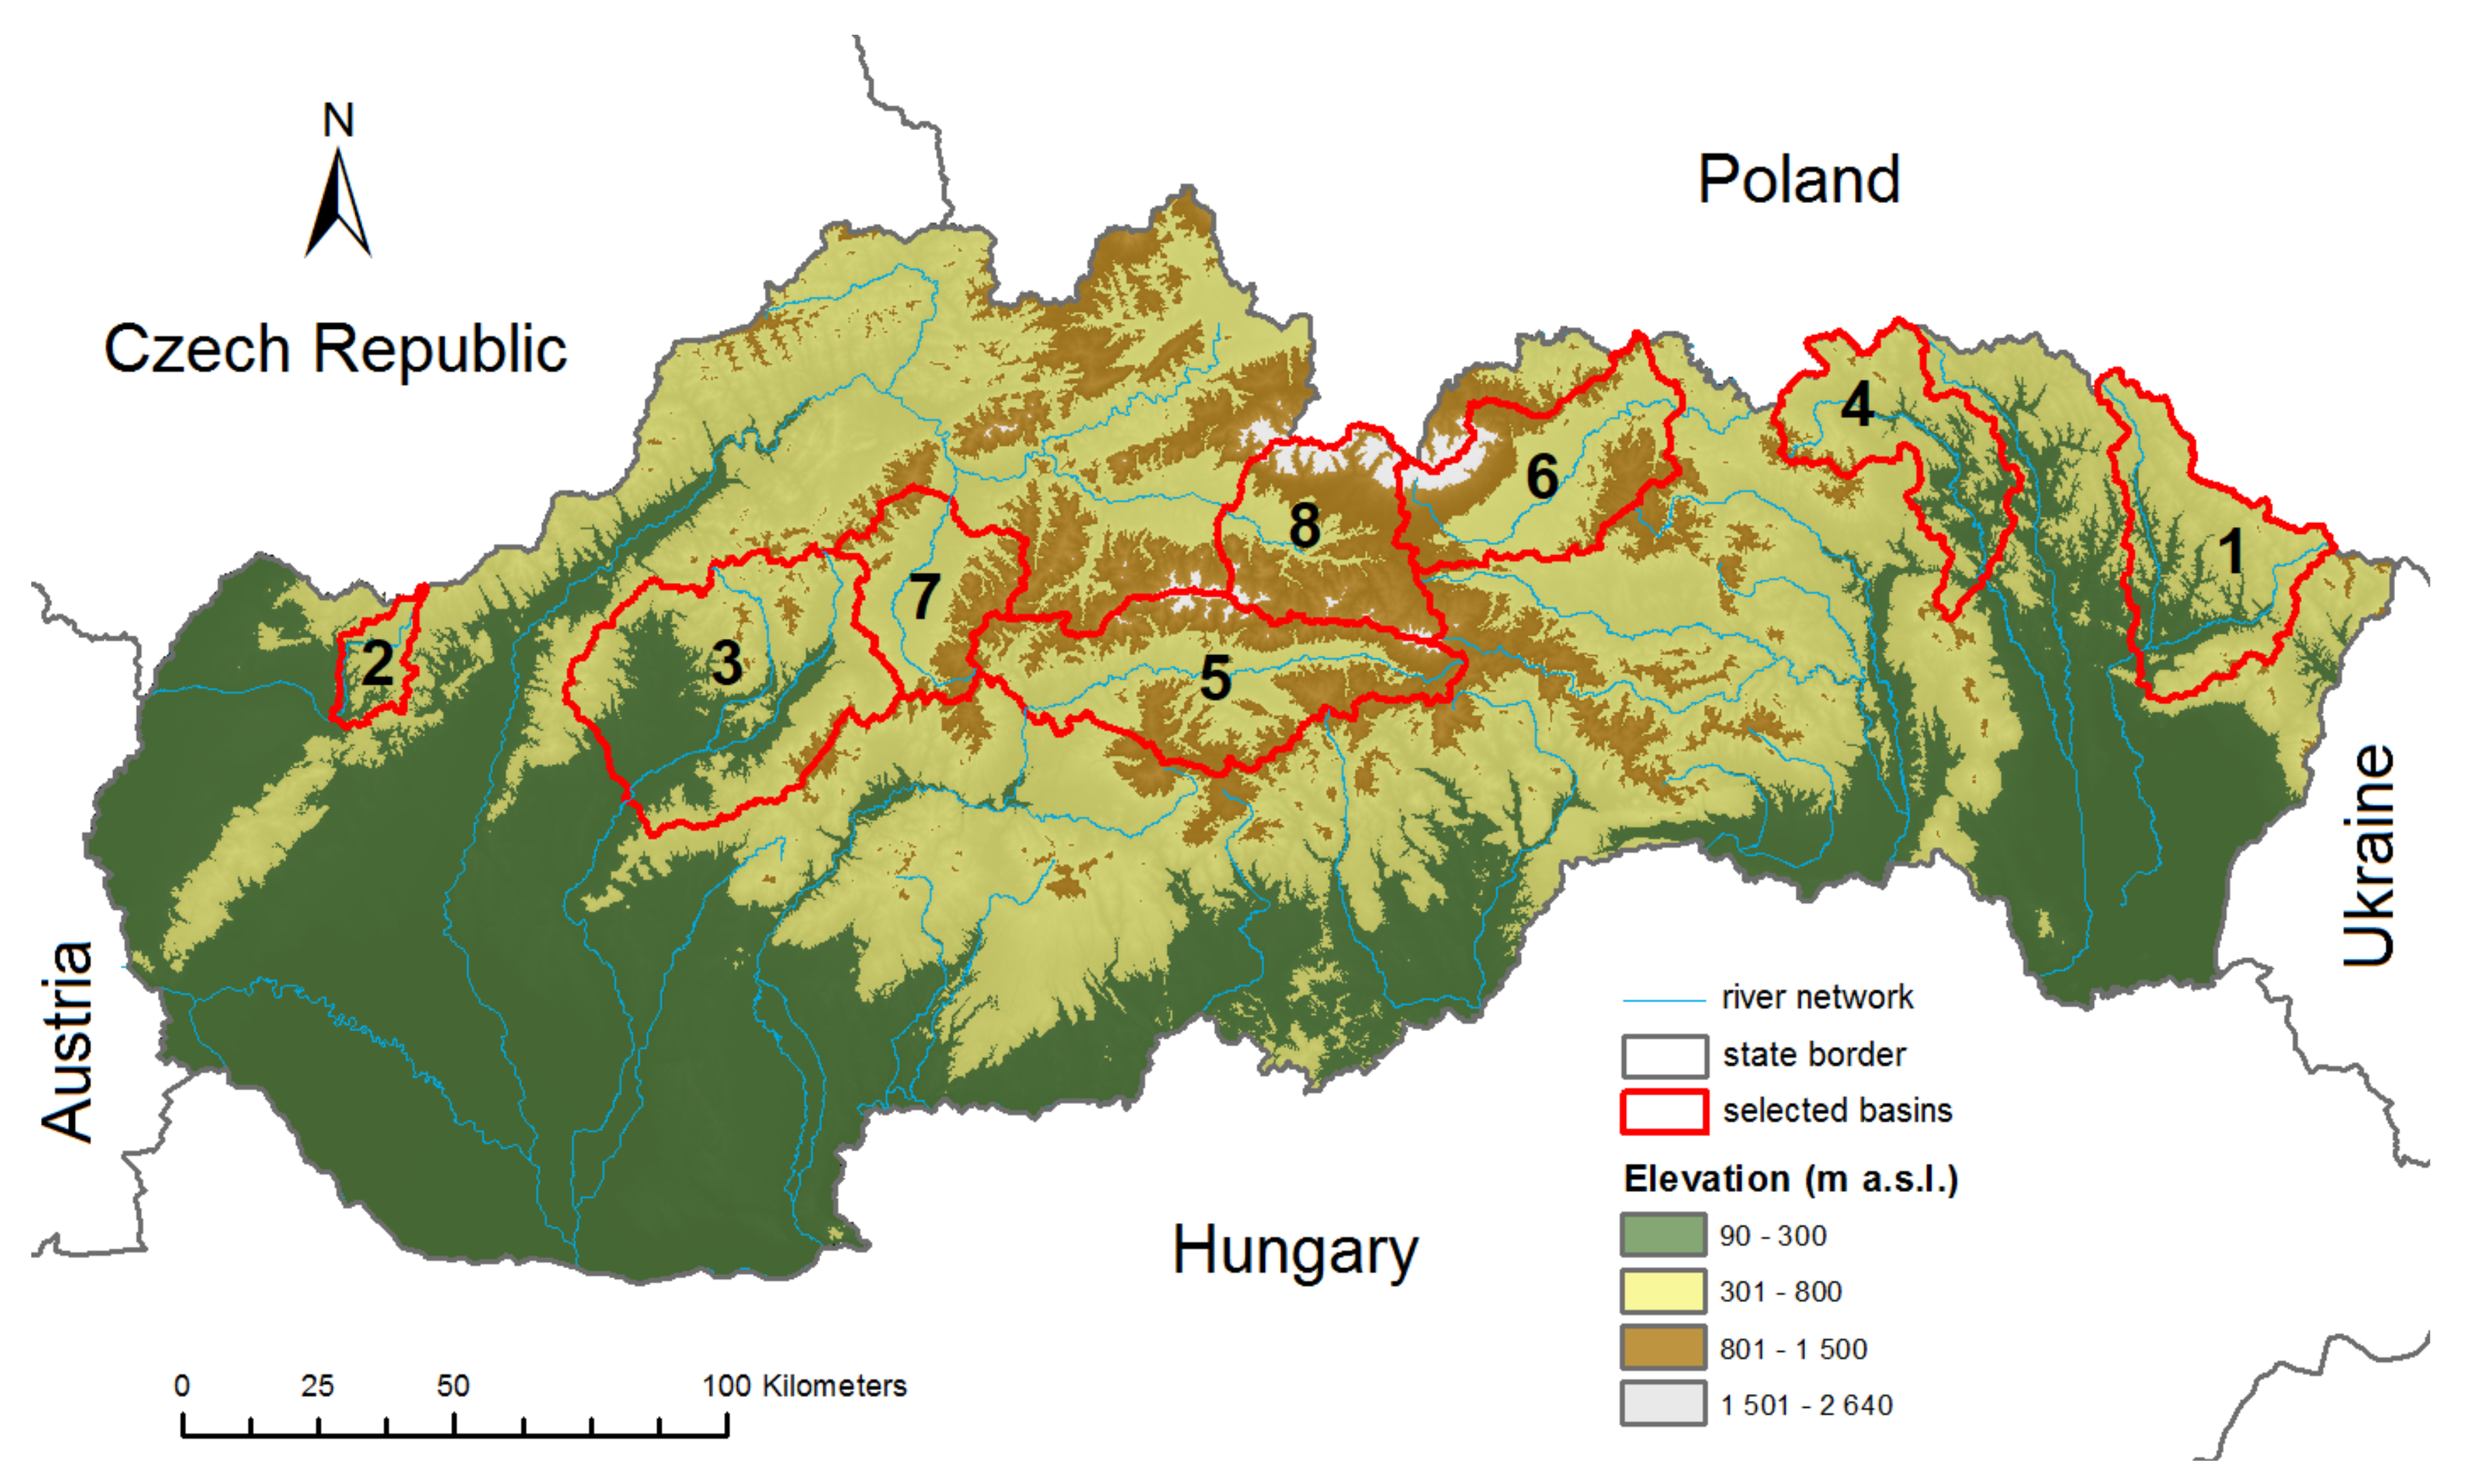
2.1. Study Basins

For modelling the runoff at issue, eight pilot river basins spread throughout the whole territory of Slovakia were selected (Figure 1) and divided into two groups according to their mean basin elevations. The mean basin elevations in the first group range from 360 to 435 m a.s.l., i.e., the Laborec—Humenné (1), Myjava—Jablonica (2), Nitra—Nitrianska Streda (3), Topľa—Hanušovce nad Topľou (4); the mean basin elevations in the second group range from 716 to 1090 m a.s.l., i.e., Hron—Banská Bystrica (5), Poprad—Chmelnica (6), Turiec—Martin (7), and Váh—Liptovský Mikuláš river basins (8). All the basins selected represent rivers lacking anthropogenic influences. Table 1 summarizes the main basin characteristics. The sizes of the basins range from 238 km2 (Myjava—Jablonica) to 2094 km2 (Nitra—Nitrianska Streda); the mean elevations vary from 362 m a.s.l. (Myjava—Jablonica) to 1090 m a.s.l. (Váh—Liptovský Mikuláš).

2.2. Data

We used the daily basin data (mean daily runoff, daily precipitation totals, mean daily air temperature) from the period 1981–2019. This data set was provided by the Slovak Hydrometeorological Institute (SHMI). Visual inspection showed that the data from all the river basins selected do not have any observation gaps. Point precipitation data measurements were used to interpolate the basins’ mean areal precipitation using the inverse distance weighting (IDW) method [27], and the point air temperatures were processed to the basins’ mean areal values by the altitude gradient method. The daily potential evapotranspiration was calculated by a modified Blaney–Criddle method [28].
Figure 2 and Table 2 show the changes in the climatic characteristics over four decades for all the basins studied, which are divided in two groups according to their mean basin elevations. We can see that the medians of the long-term mean annual air temperatures (T) show an increasing trend over the four decades. In the basins with a lower mean elevation, the median of T increased from 7.8 °C to 9.4 °C between the periods 1981–1990 and 2011–2019, i.e., by +1.6 °C; in the basins with a higher mean elevation, the median of T increased from 5.6 °C to 7.2 °C between the periods 1981–1990 and 2011–2019, i.e., by +1.6 °C.
The long-term mean annual precipitation (P) median values in the basins with a lower mean elevation increased from 657 to 750 mm/year between the periods 1981–1990 and 2001–2010, and from 657 to 661 mm/year between the periods 1981–1990 and 2011–2019, i.e., by +4 mm/year. In the basins with a higher mean basin elevation, the median values of the long-term mean annual precipitation (P) increased from 794 to 899 mm/year between the periods 1981–1990 and 2001–2010, and from 794 to 847 mm/year between the periods 1981–1990 and 2011–2019, i.e., by +53 mm/year.
The medians of the long-term mean annual runoff (Q) in the basins with a lower mean elevation show slightly increasing or decreasing trends over the decades and an overall decrease from 219 to 184 mm/year between the periods 1981–1990 and 2011–2019, i.e., by −35 mm/year. In the basins with a higher mean elevation over the four decades, a slight increase in the runoff median from 368 to 382 mm/year between the periods 1981–1990 and 2011–2019, i.e., +14 mm/year, was observed.

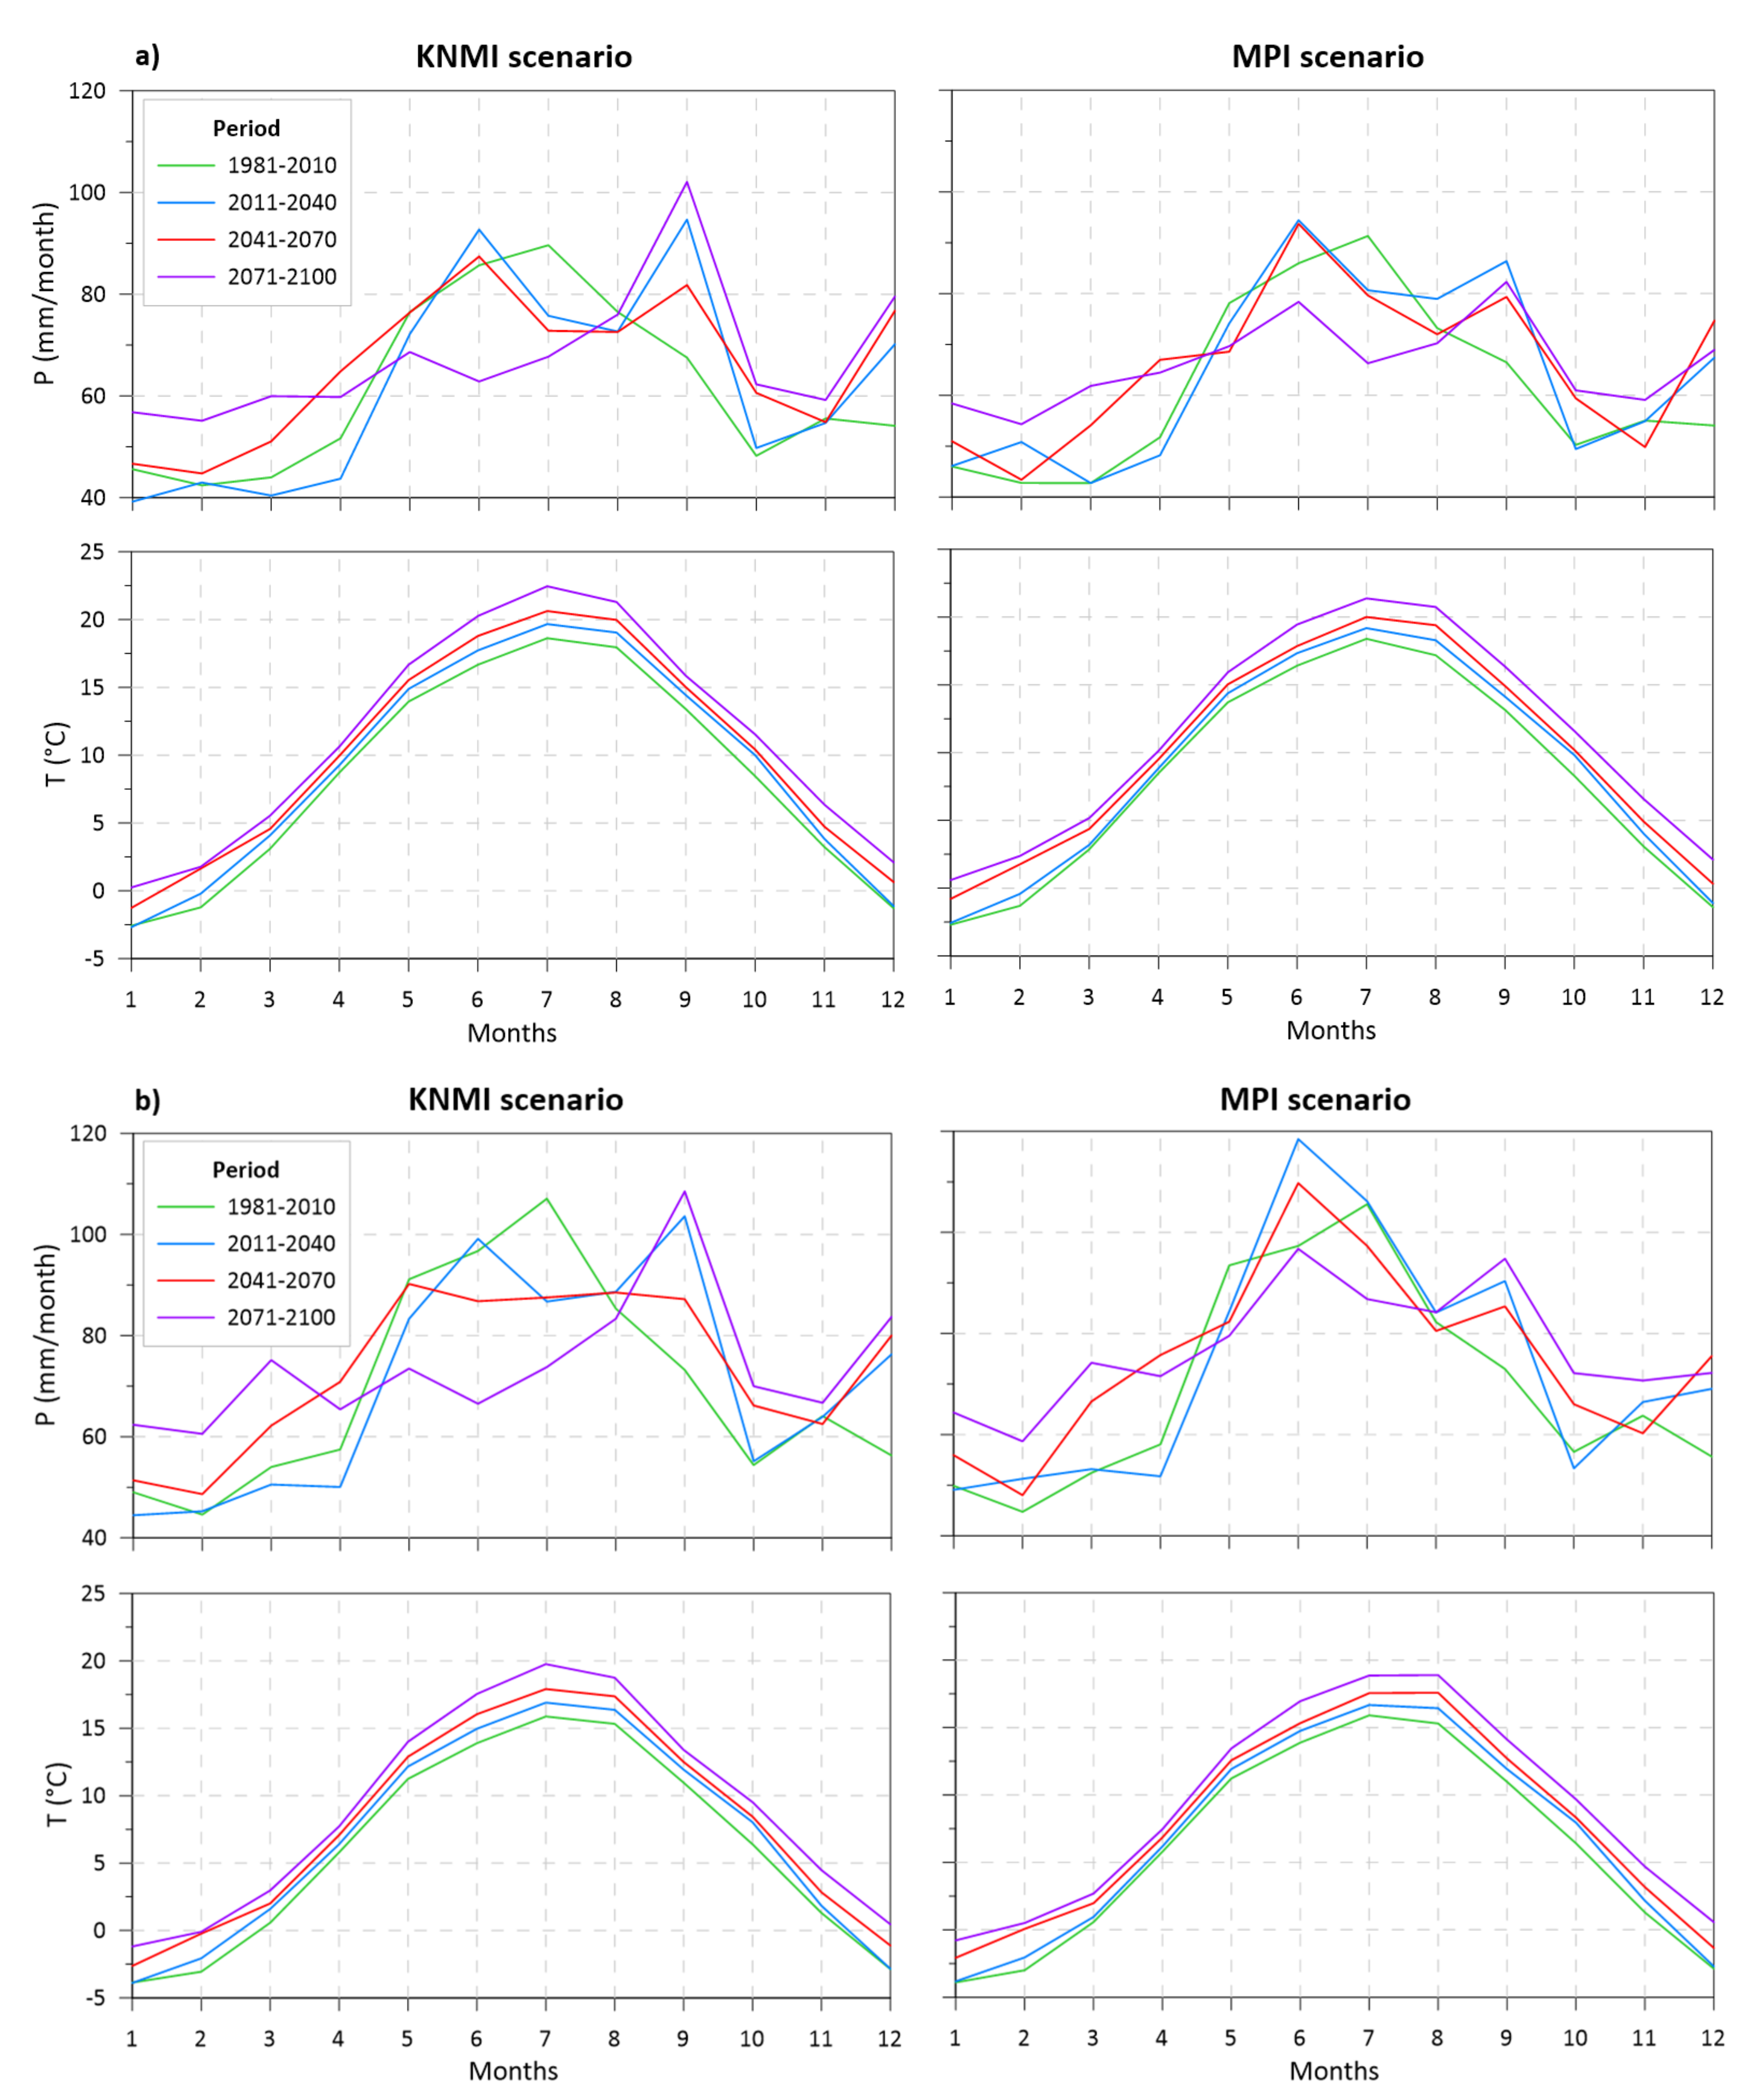
2.3. Climate Change Scenarios

The data (i.e., the mean daily air temperatures and daily precipitation totals) generated from the regional circulation models (RCMs), i.e., KNMI (Koninklijk Nederlands Meteorologisch Instituut) and MPI (Max Planck Institute), under the A1B (moderate) scenario were applied in the hydrological model to project the future runoff conditions. Both RCMs (i.e., the KNMI and MPI) are based on the German ECHAM5 general circulation model (GCM) boundary conditions [26], and represent a detailed integration of the atmospheric and oceanic dynamic equations with a grid point resolution of about 25 × 25 km. The outputs from both climate models for the region studied were downscaled to the climatic stations and interpolated using the IDW (Inverse Distance Weighted) and altitude gradient methods on the basin’s data. The values of the mean daily air temperatures and daily precipitation totals were used as the daily basin data for the period between 2011 and 2100.
Figure 3 and Table 3 show the long-term mean monthly values of the precipitation (P) and air temperature (T) for the reference period (1981–2010) and three future time horizons (2011–2040, 2041–2070, and 2071–2100) according to the KNMI and MPI climate scenarios, separately for the river basins with lower and higher mean elevations. The lines in the graphs indicate the averages for the basins.
We can see that the changes in the long-term mean monthly climatic characteristics (T and P) according to both climate models used are expected to be more or less the same for both groups of the river basins. During the spring, autumn, and winter periods, an increase in precipitation can be expected. Conversely, a decrease in precipitation can be observed in the summer periods. Based on the KNMI model, the largest increase in precipitation is expected to be in September (period 2071–2100). This may also be caused due to the changes in seasonality when the maximum of the long-term mean monthly precipitation shifted from July to September in all future time periods. The MPI model predicts the largest increase to be in March (period 2071–2100). The long-term mean monthly air temperatures will rise with the future time horizons. The KNMI climate model predicts an increase in the air temperature during the winter months by 3 °C, and in the summer seasons by 4 °C in the future time horizons. In the spring and autumn seasons, the air temperature is expected to increase by about 3 °C by 2100. According to the KNMI scenario, the largest increase in air temperature will be observed in July. The highest increase in air temperatures according to the MPI scenario is assumed to occur in July/August.

3. Methods

Hydrological Model

To study the possible effects of climate change on the hydrological regime in the selected Slovak basins, a conceptual rainfall-runoff (r-r) model (the TUW model, [29]) has been chosen. The TUW model is a lumped model which follows the structure of the widely used Swedish Hydrologiska Byråns Vattenbalansavdelning (HBV) model [30,31]. The model has proven to be suitable for the analysis of the impact of climate change on water resources (e.g., [10,11,12]). The model uses the basin values of mean daily air temperatures, daily precipitation totals, and potential evapotranspiration as the inputs.
The model consists of three routines, namely: (1) the snow routine, which uses a simple degree-day method for calculating snow accumulation and snow melt processes in the river basin; (2) the soil moisture routine, which simulates the processes in the soil profile (e.g., the evapotranspiration of water from a soil profile, the infiltration of water from melted snow into the soil, the distribution and accumulation of water in soil, and the formation of surface, subsurface/groundwater runoff); and (3) the runoff generation routine, which is used to transform the total runoff (surface runoff, subsurface runoff and baseflow) through a river basin. The stream routing uses a triangular weighting function for the runoff propagation to the basin outlet.
The model has 15 parameters that need to be calibrated. According to the three routines and their calibration ranges, the model parameters are listed in Table 4. The calibration ranges were specified based on the existing studies (e.g., [32,33]).
More details about the model’s structure and the routines/parameters used to calculate the individual runoff components are given, e.g., by Parajka et al. [29], Sleziak et al. [11,34], and Széles et al. [35].
In this study, the TUW model is calibrated by using the differential evolution algorithm (Deoptim) automatic calibration procedure [36,37]. The selected algorithm uses biologically inspired processes (i.e., crossover, mutation, and selection on a population) in searching for the best results. The optimization process used in the Deoptim algorithm is based on the repeated evaluation of the objective function in order to move the initial population toward a global minimum. For further information about the Deoptim algorithm, see, e.g., Ardia et al. [36] and Mullen et al. [37]. As the objective function (OF), we apply a combination of the Nash–Sutcliffe coefficient (NSE) and the logarithmic Nash–Sutcliffe coefficient (logNSE). Whereas the NSE accentuates the high flows, the logNSE emphasize the low flows more. The OF is mathematically defined as:
O F = 1 N S E 2 + 1 log N S E 2
where the NSE and logNSE criteria are estimated as:
N S E = 1 i = 1 n Q s i m , i Q o b s , i 2 i = 1 n Q o b s , i Q ¯ o b s 2
log N S E = 1 i = 1 n log ( Q s i m , i ) log ( Q o b s , i ) 2 i = 1 n log ( Q o b s , i ) log ( Q ¯ o b s ) 2
Q s i m , i are the simulated mean daily runoffs on day i; Q o b s , i are the observed mean daily runoffs; and Q ¯ o b s is the average of the observed runoffs over the calibration/validation period of n days. The NSE and logNSE coefficients vary between −∞ (a poor match between the observed and simulated values) and 1 (a perfect match).
The performance of the model is judged by comparing the observed and simulated runoff in terms of the above-defined model performance metrics (OF, NSE, logNSE) for the calibration/validation periods. The second measure of the model’s performance used in this study is the volume error (VE), which is the measure of the bias between the simulated and observed runoff [22]. VE = 0 indicates no bias; VE < 0 implies an underestimation of the total runoff volume; and VE > 0 represents an overestimation of the total runoff volume. The VE is estimated as follows:
V E = i = 1 n Q s i m , i i = 1 n Q o b s , i i = 1 n Q o b s , i
We used the differential split-sample test (DSST) proposed by Klemeš [38] for the testing of the model’s performance. The model was calibrated/validated consecutively for four 10-year periods between 1981–2019. For further analysis, i.e., for simulating the future runoff conditions, we choose parameters from the recent calibration period (i.e., 2011–2019; Table 5) because we assume that this period should be similar (mainly in terms of the mean daily air temperatures) to a recent/warmer climate.

4. Results

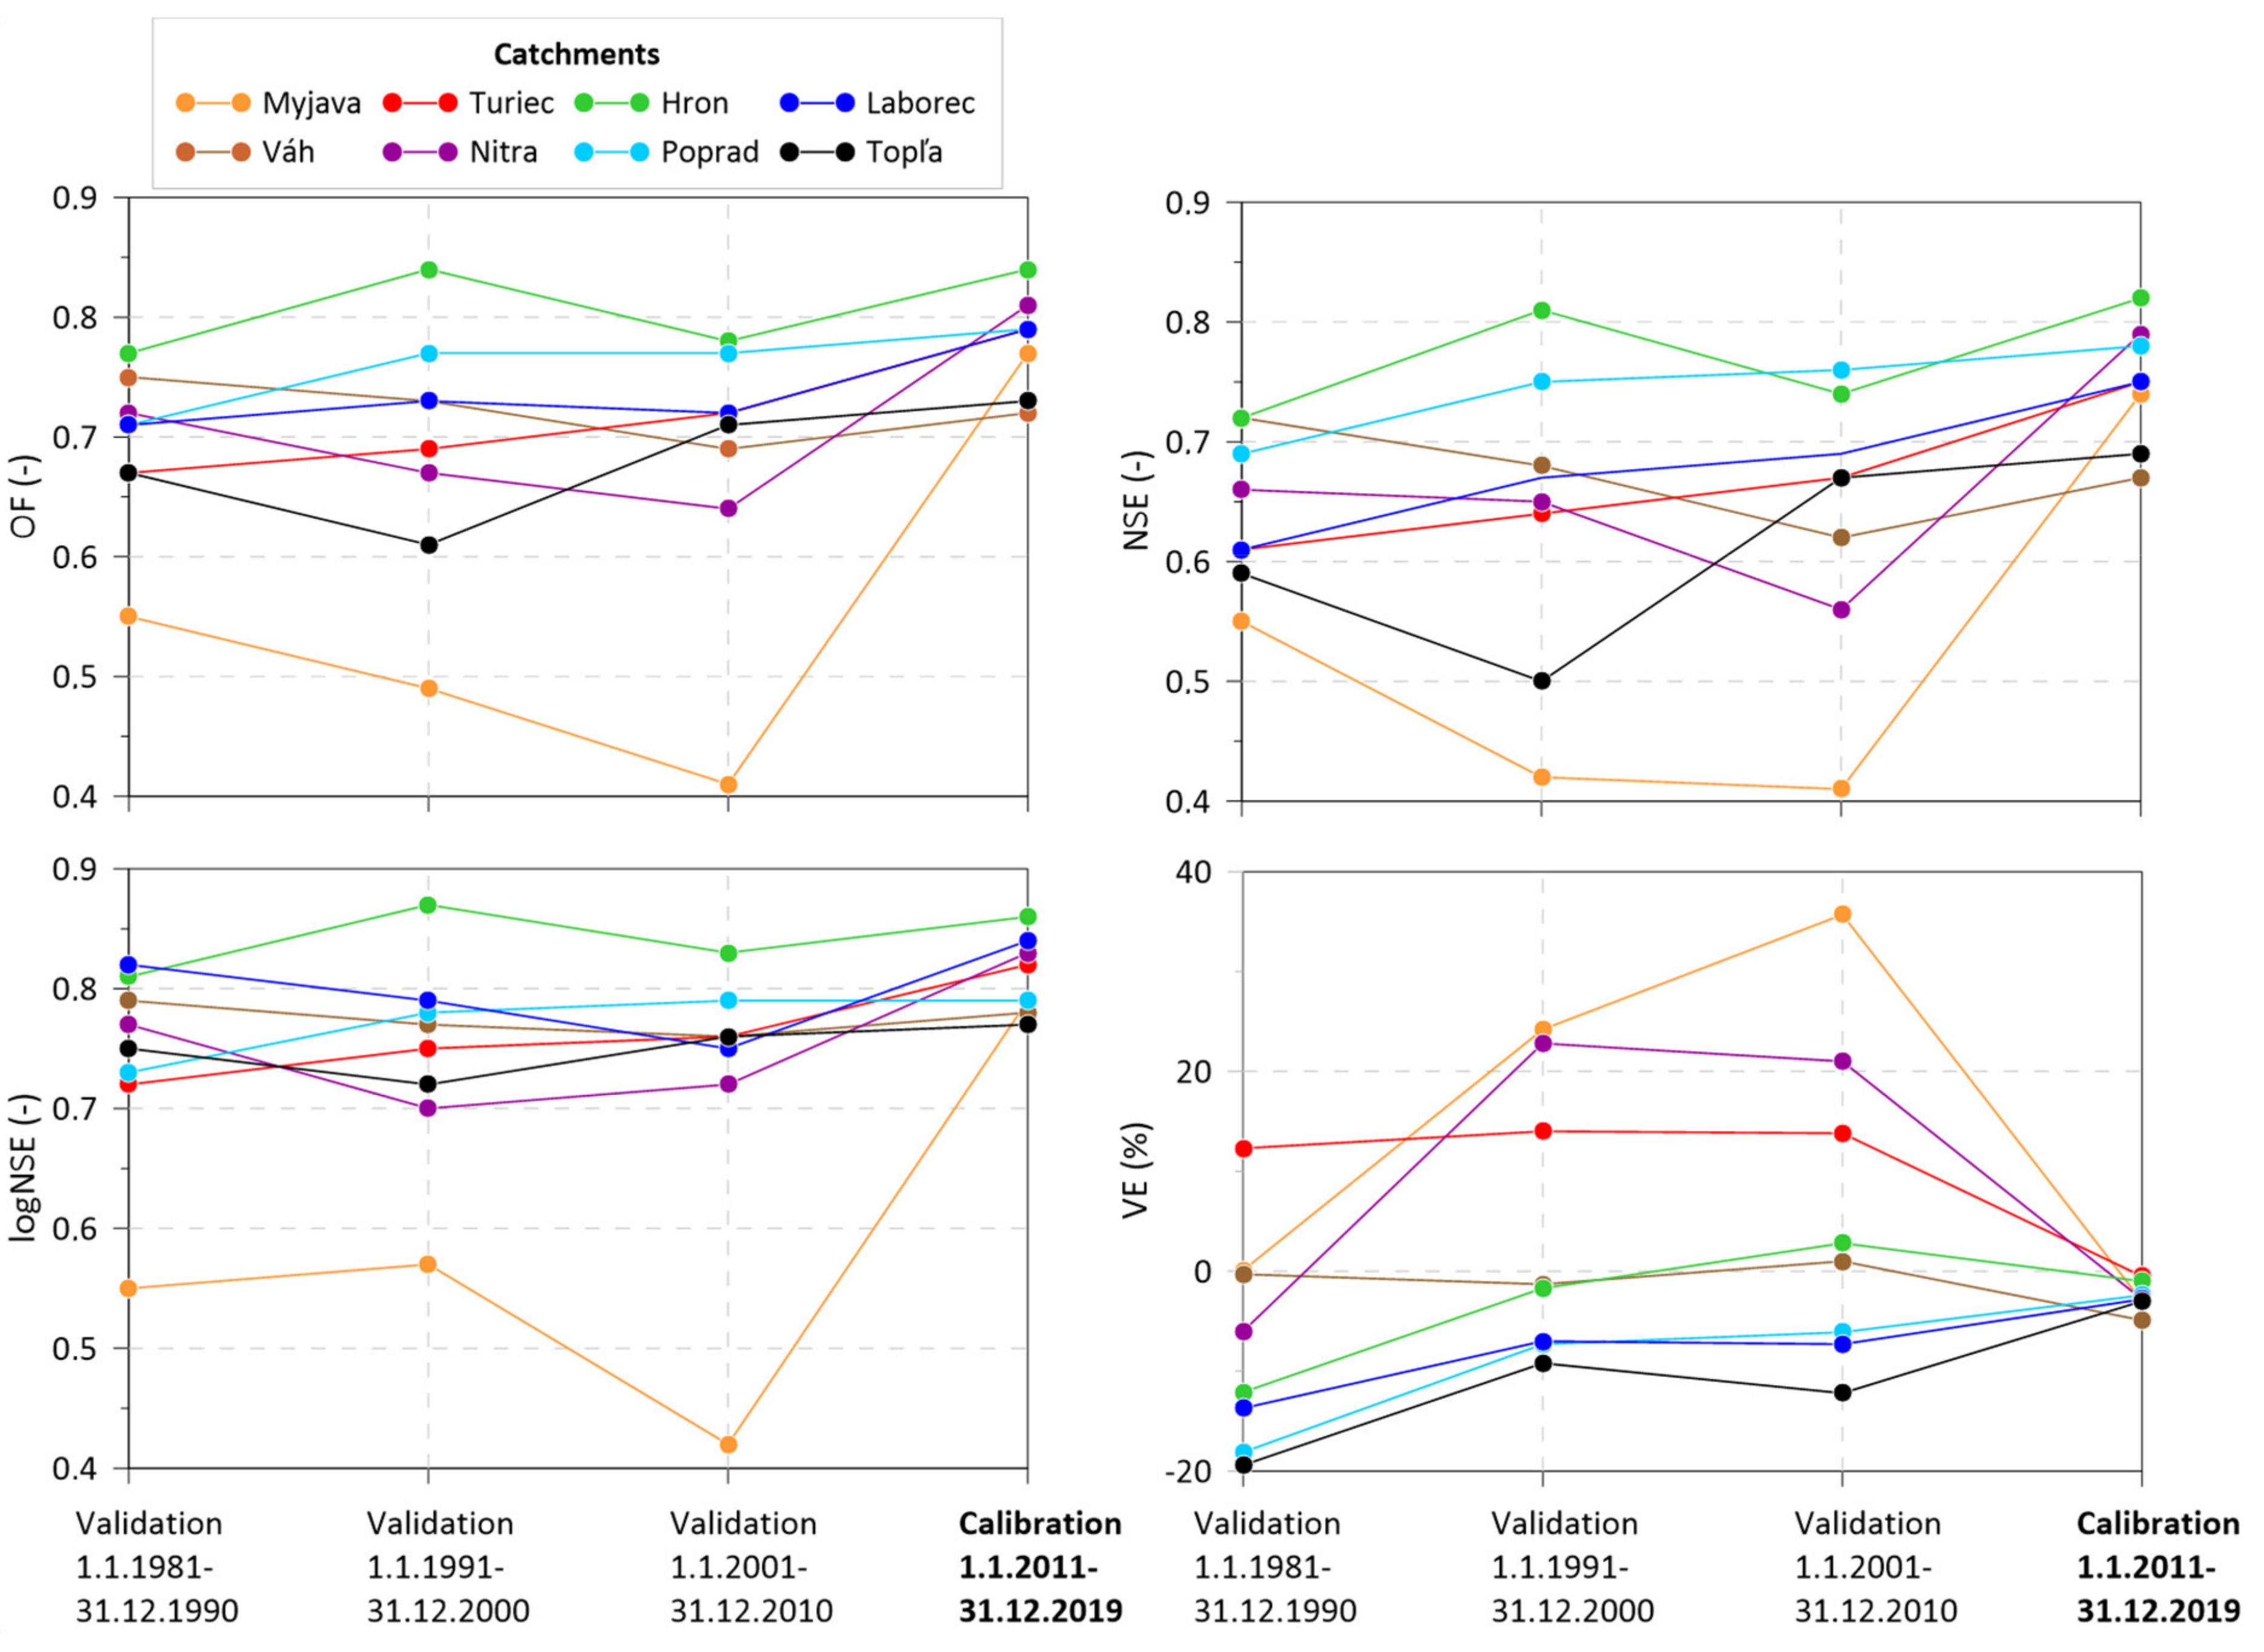
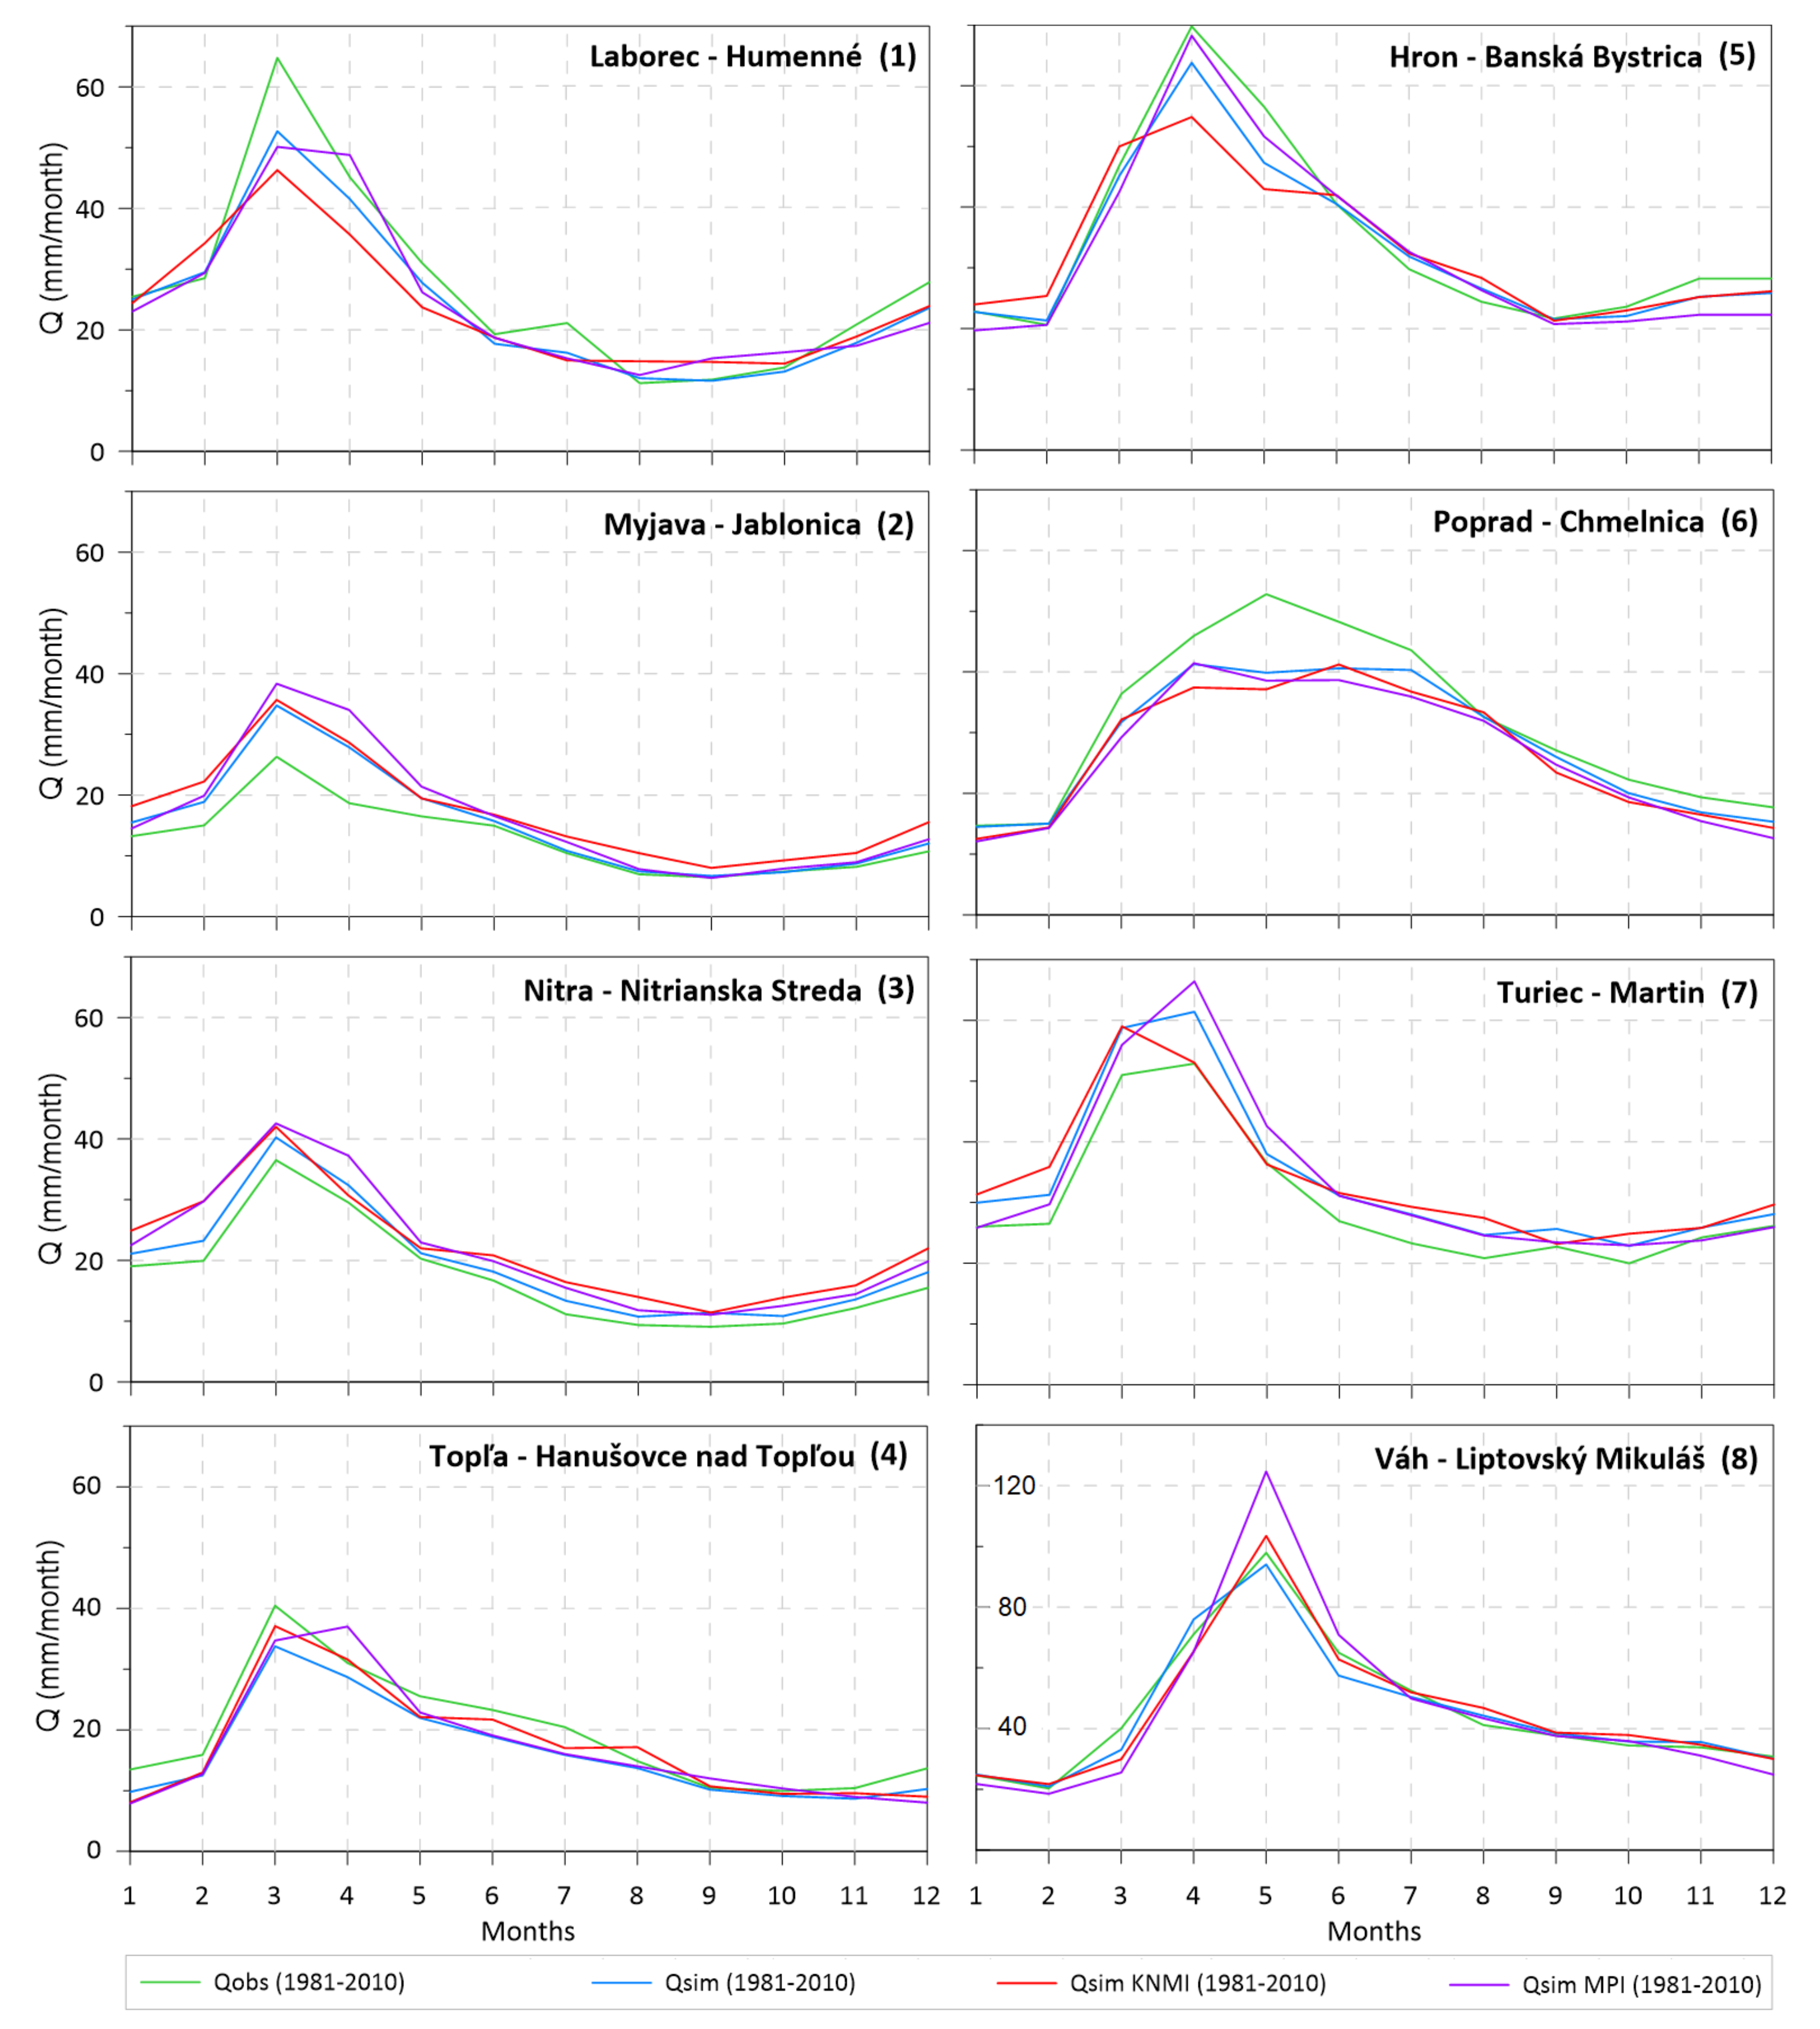
4.1. Assessment of the Model’s Performance

The results of the model’s calibration and validation in terms of the four different model performance metrics (the objective function (OF), the logarithmic Nash–Sutcliffe efficiency (logNSE), the Nash–Sutcliffe efficiency (NSE), and the volume error (VE)) for all the basins studied are shown in Figure 4. Generally, in terms of adequate model performance, the OF, NSE, and logNSE should be close to 1, and the VE should be close to 0.
The results indicate that the model performed better in the calibrations compared to the validations. These expected findings were caused mainly by the differences among climatic and hydrological characteristics in the four decades in the observation period 1981–2019. During the calibration period (2011–2019), the OF values for all the basins ranged from 0.72 (the Váh River basin) to 0.84 (the Hron River basin). The volume errors from −0.5 % (the Turiec River basin) to 4.9 % (the Váh River basin) show a trend to slightly overestimate the runoff volume in the calibrations. The OF values in the validations are as follows: in the validation period of 1981–1990, the OF values were between 0.55 (the Myjava River basin) to 0.77 (the Hron River basin). In the validation period of 1991–2000, the OF values varied from 0.49 (the Myjava River basin) to 0.84 (the Hron River basin). In the validation period of 2001–2010, the OF values ranged from 0.41 (the Myjava River basin) to 0.78 (the Hron River basin). Concerning all of the model performance metrics (the OF/NSE/VE values), the best model fit was found for the Hron River basin. Conversely, poorer simulations were obtained for the Myjava River basin. For this small basin, the VE indicated a more than 20% overestimation of the runoff volumes in the validation period of 1991–2000, and a more than 30% overestimation in the validation period of 2001–2010.
Due to the differences in OF in the calibration and validation periods, for simulating the future runoff, we chose parameters from a recent calibration period (i.e., 2011–2019) because we assume that this period should be similar (mainly in terms of the mean daily air temperatures) to a future/warmer climate.
The simulated discharges of the hydrological model driven with the two climate models were compared with the observed discharges to visually check the model’s performance for the reference period (Figure 5). The visual comparison indicates that the model provided a reasonable simulation of the runoff. We can see that the seasonal pattern of the runoff dynamics observed was well captured. However, there are some differences in representing high flows, which can especially be seen in the months of March, April, and May. For example, the largest increase in runoff for the Hron River basin is observed in April (Qobs = 70 mm/month). Simulations (Qsim) obtained for this month are 64 mm/month (Qsim), 55 mm/month (Qsim considering the KNMI scenario), and 68 mm/month (Qsim considering the MPI scenario). A similar pattern (i.e., differences in representing high flows) has been observed for most of the river basins studied.
A comparison of the different scenarios points that they are similar in terms of simulating an increase of high and low runoff. Overall, it is obvious that the simulated runoff using downscaled inputs from both RCM models for the reference period represents the simulated hydrological regime from the measured data well, and, at the same time, the model parameters from the measured inputs are usable for an acceptable reproduction of the hydrological regime of the reference period. Therefore, we were able to use these data as a basis for comparing the changes in runoff according to the scenarios.

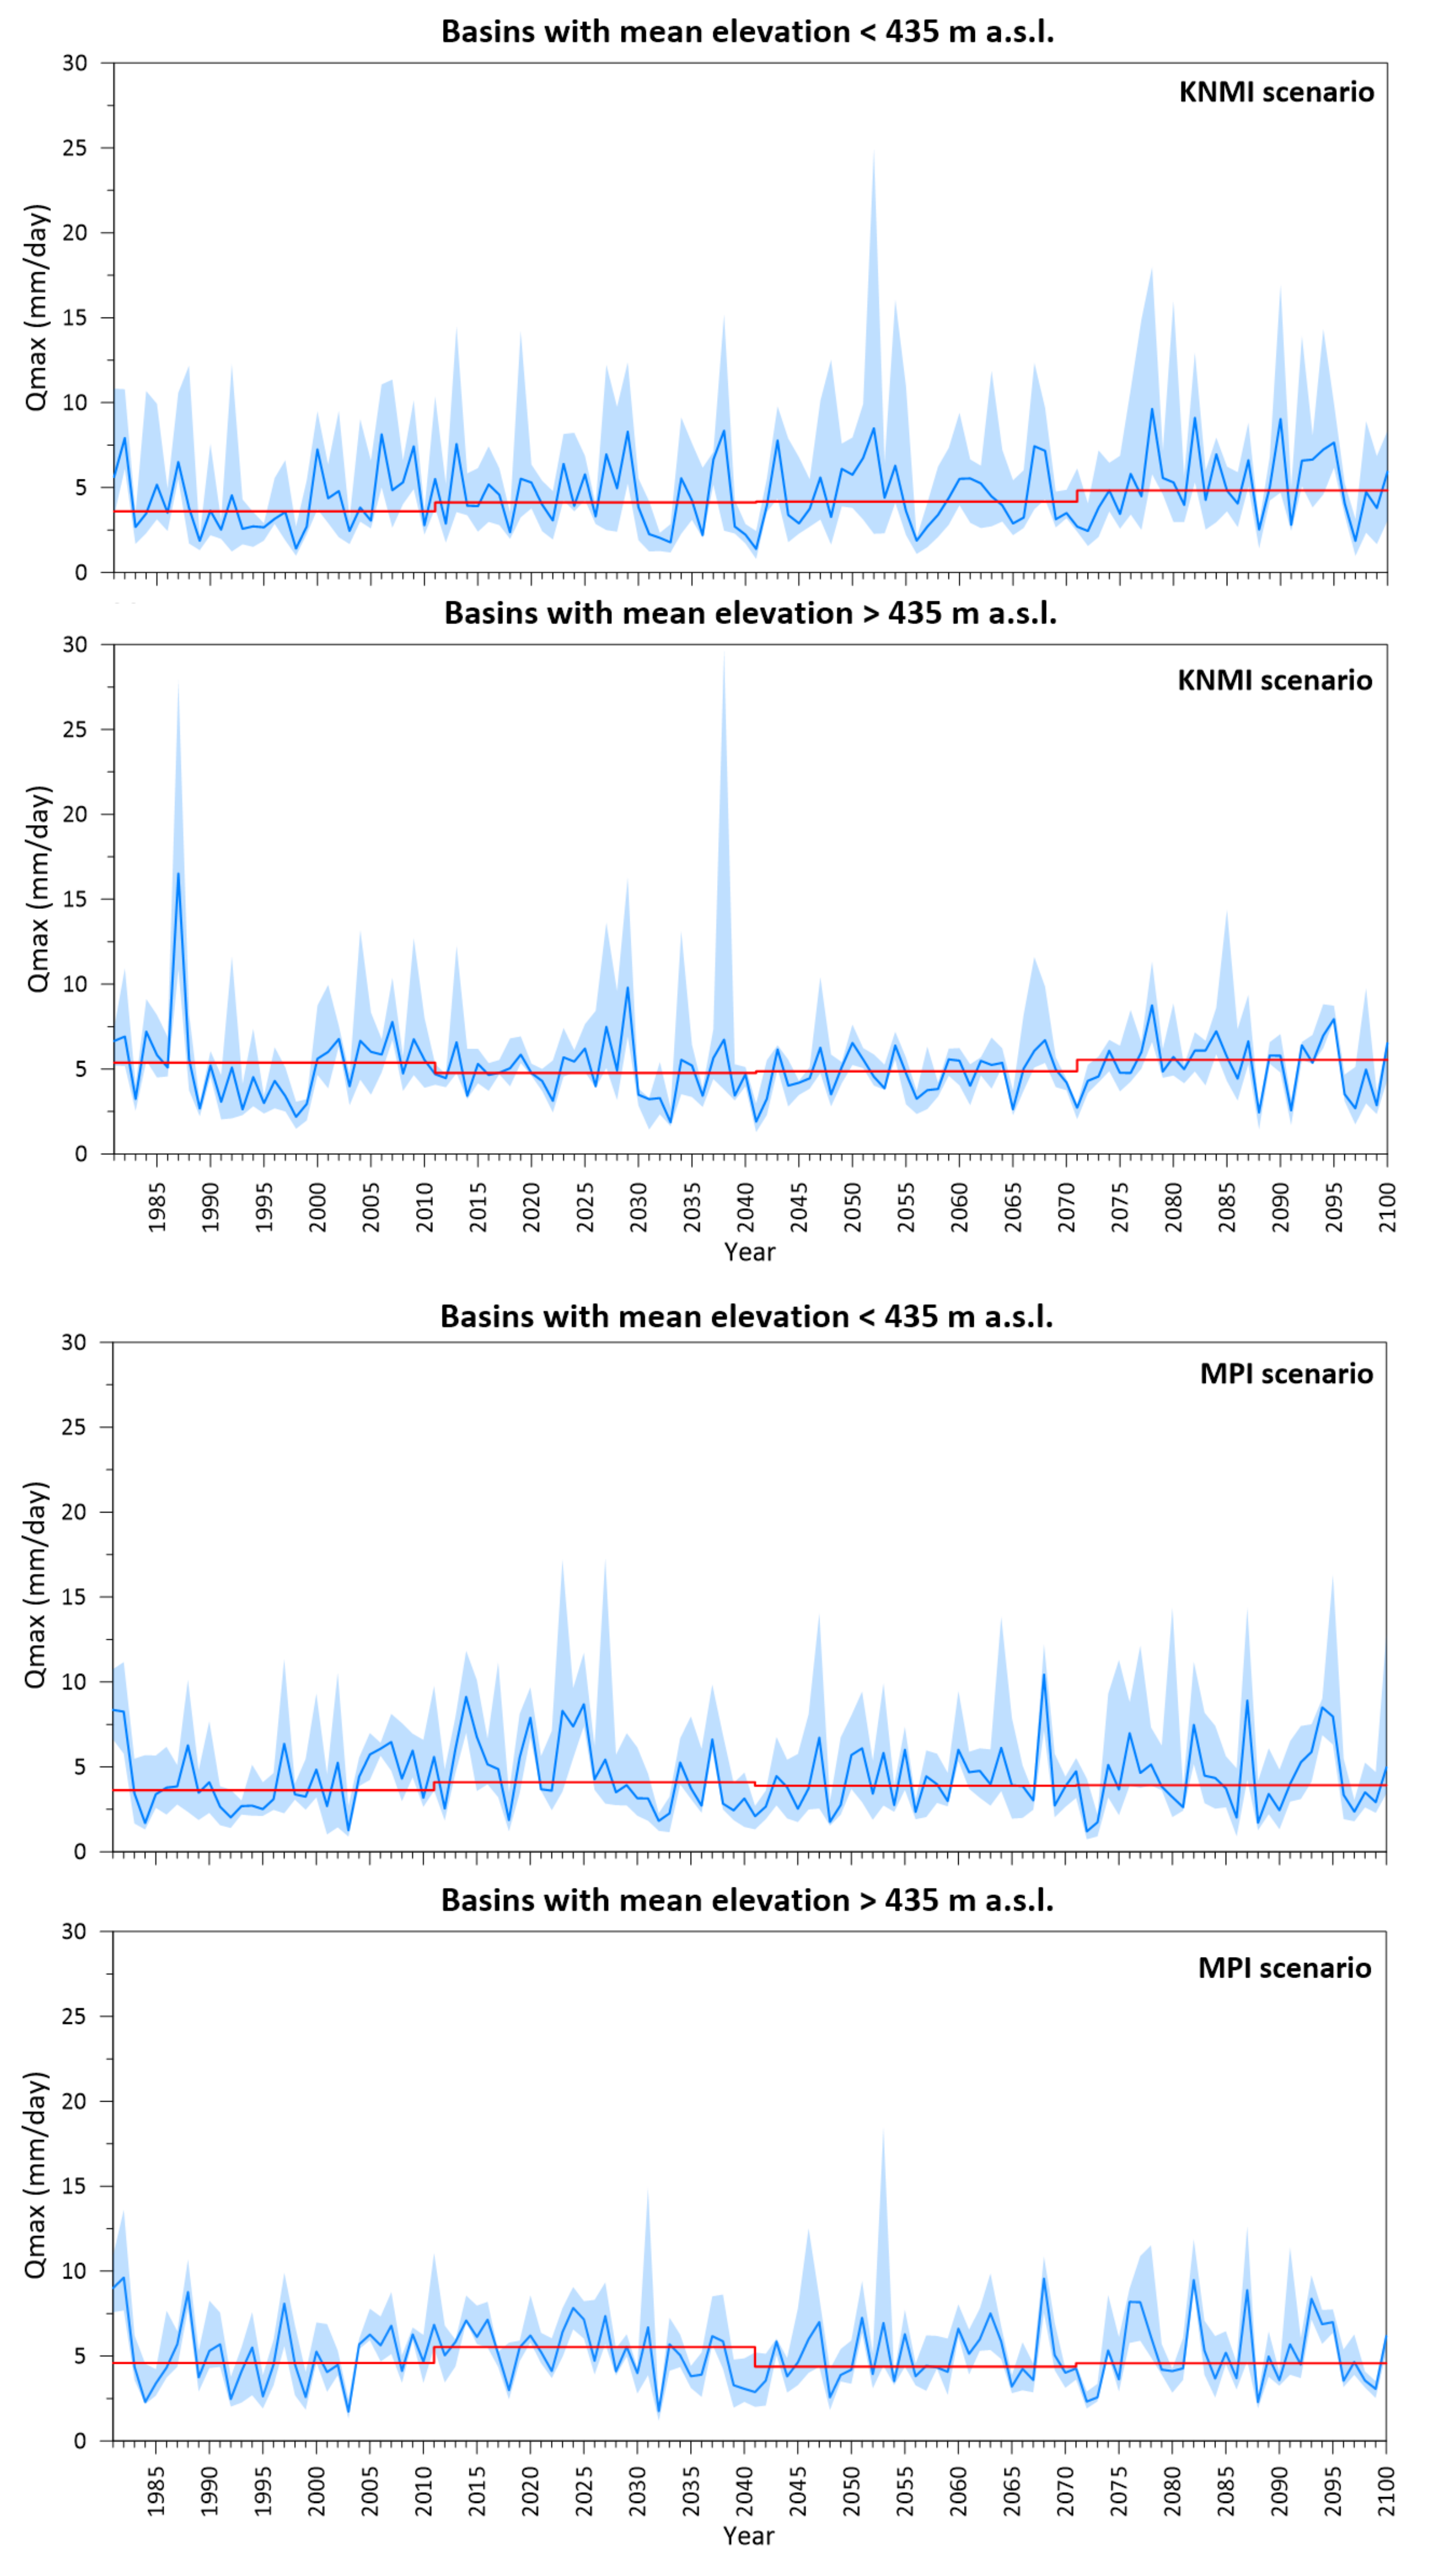
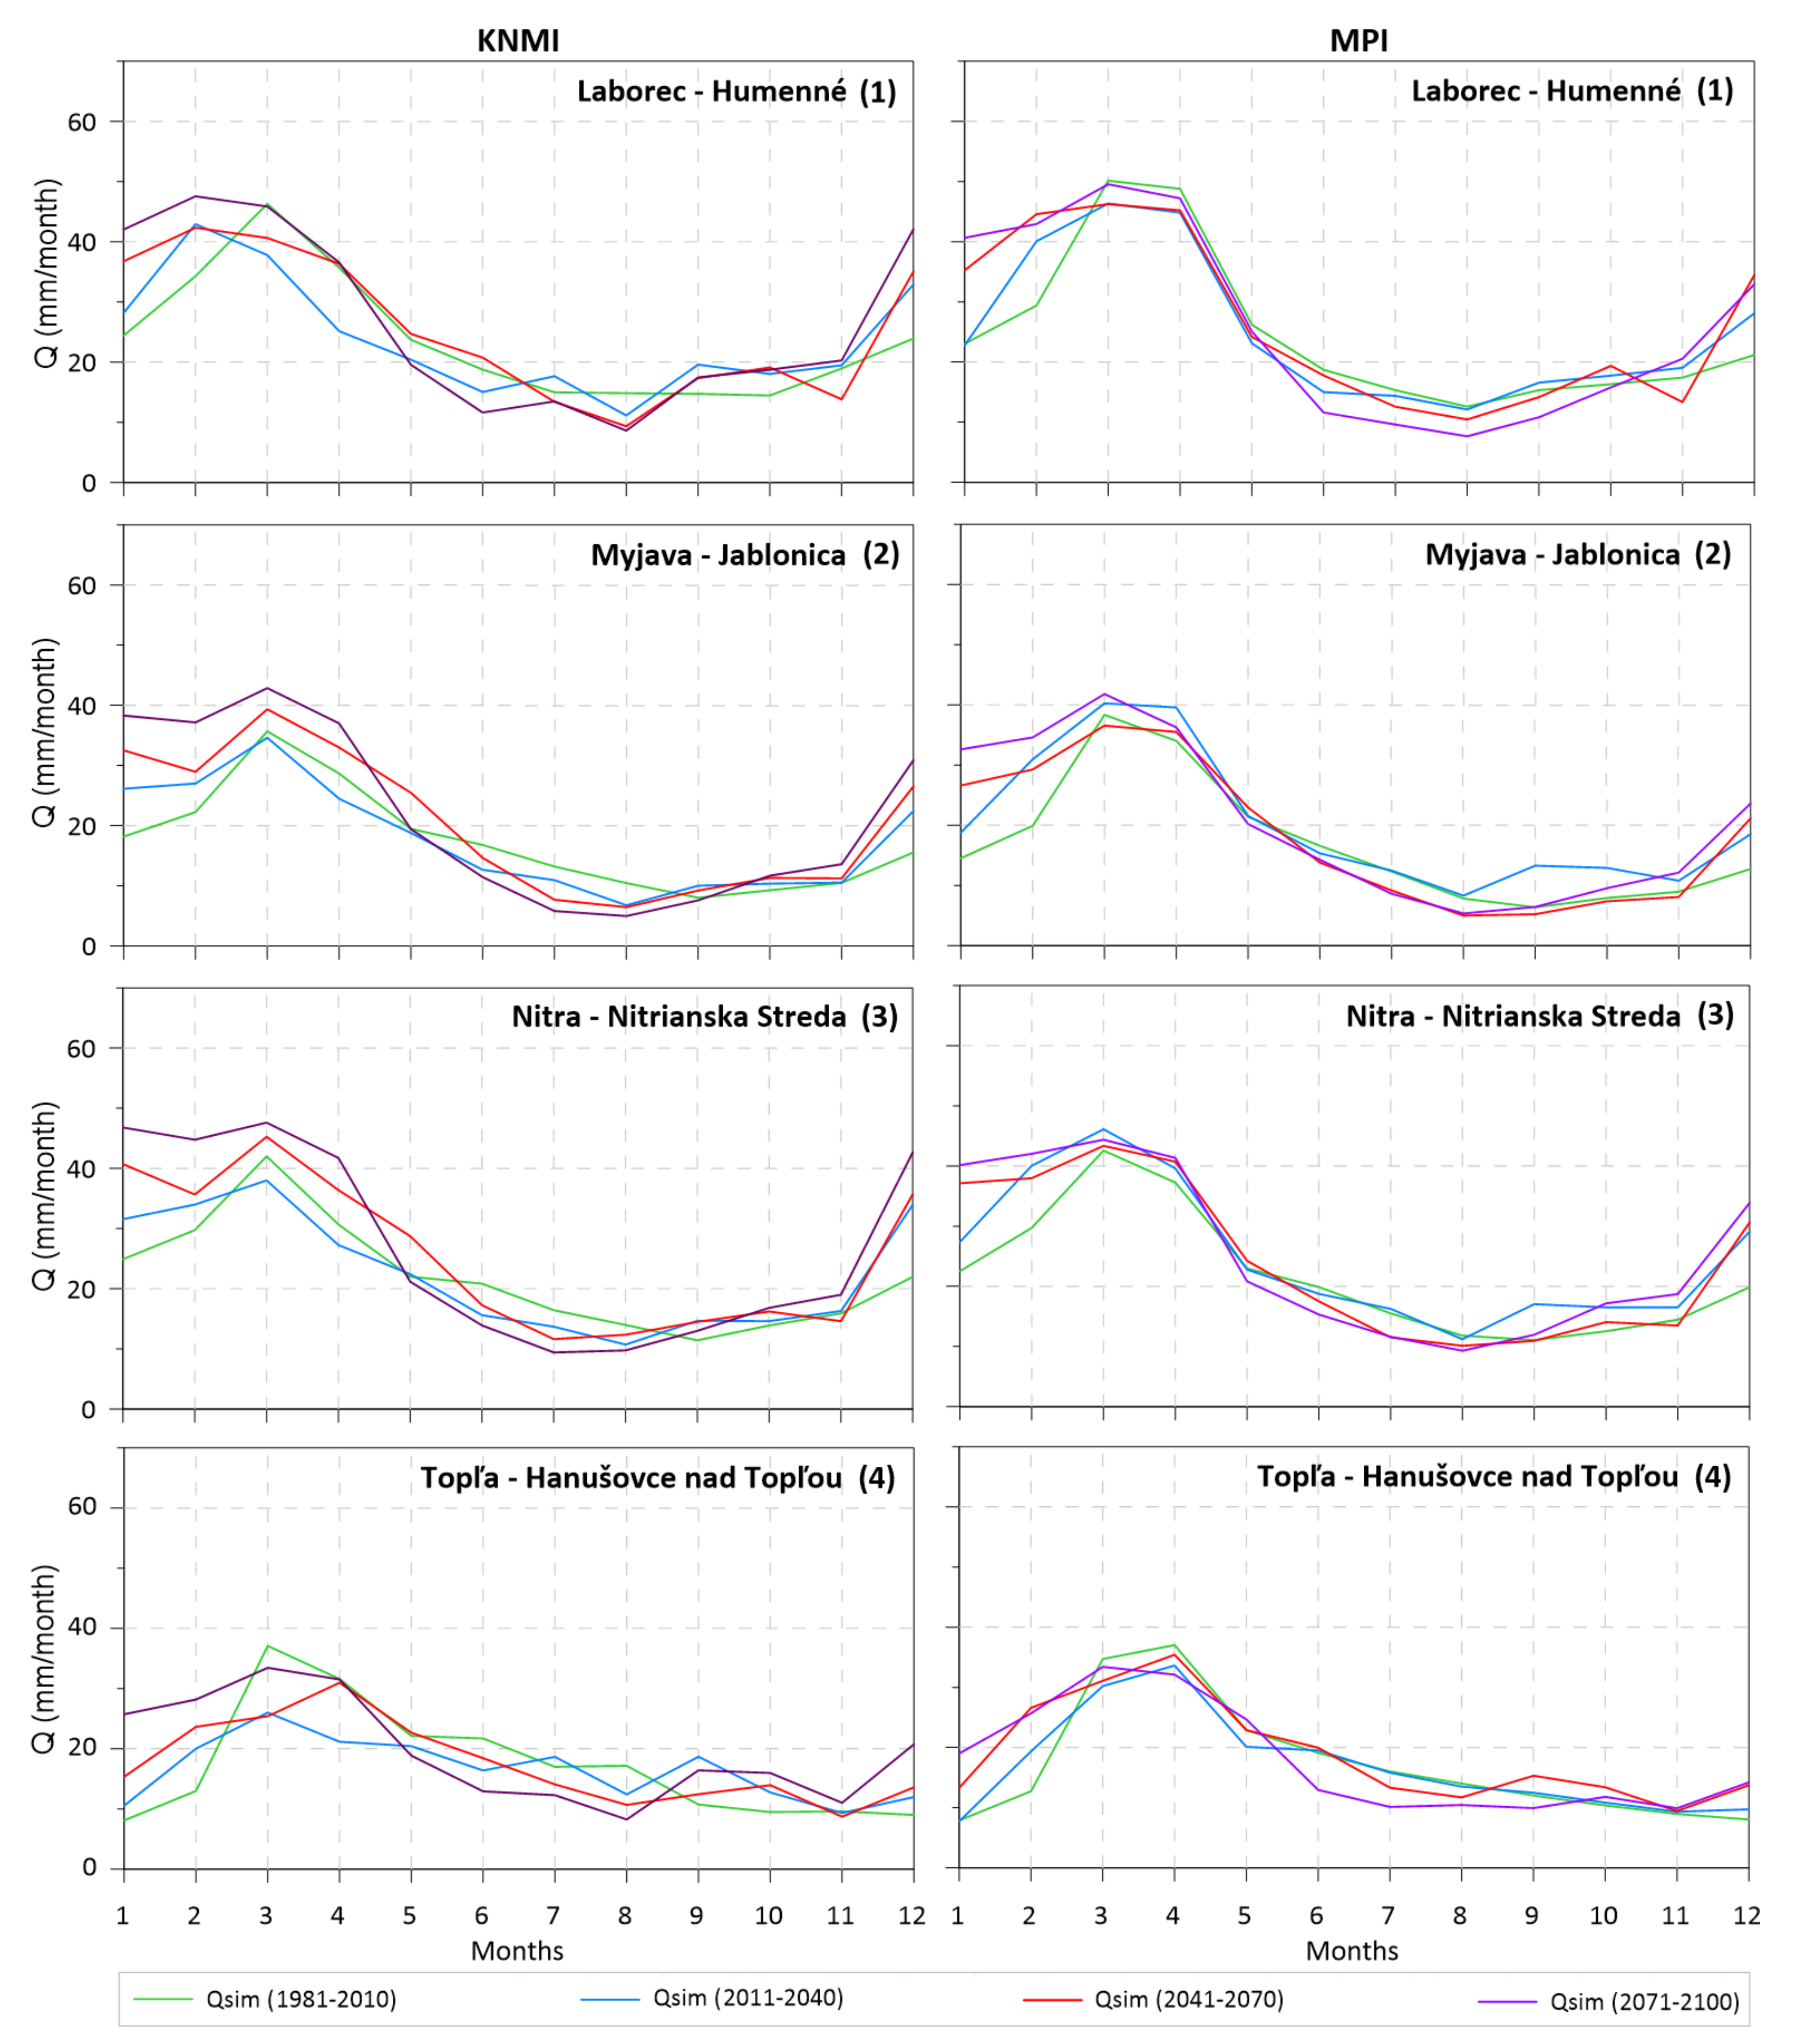
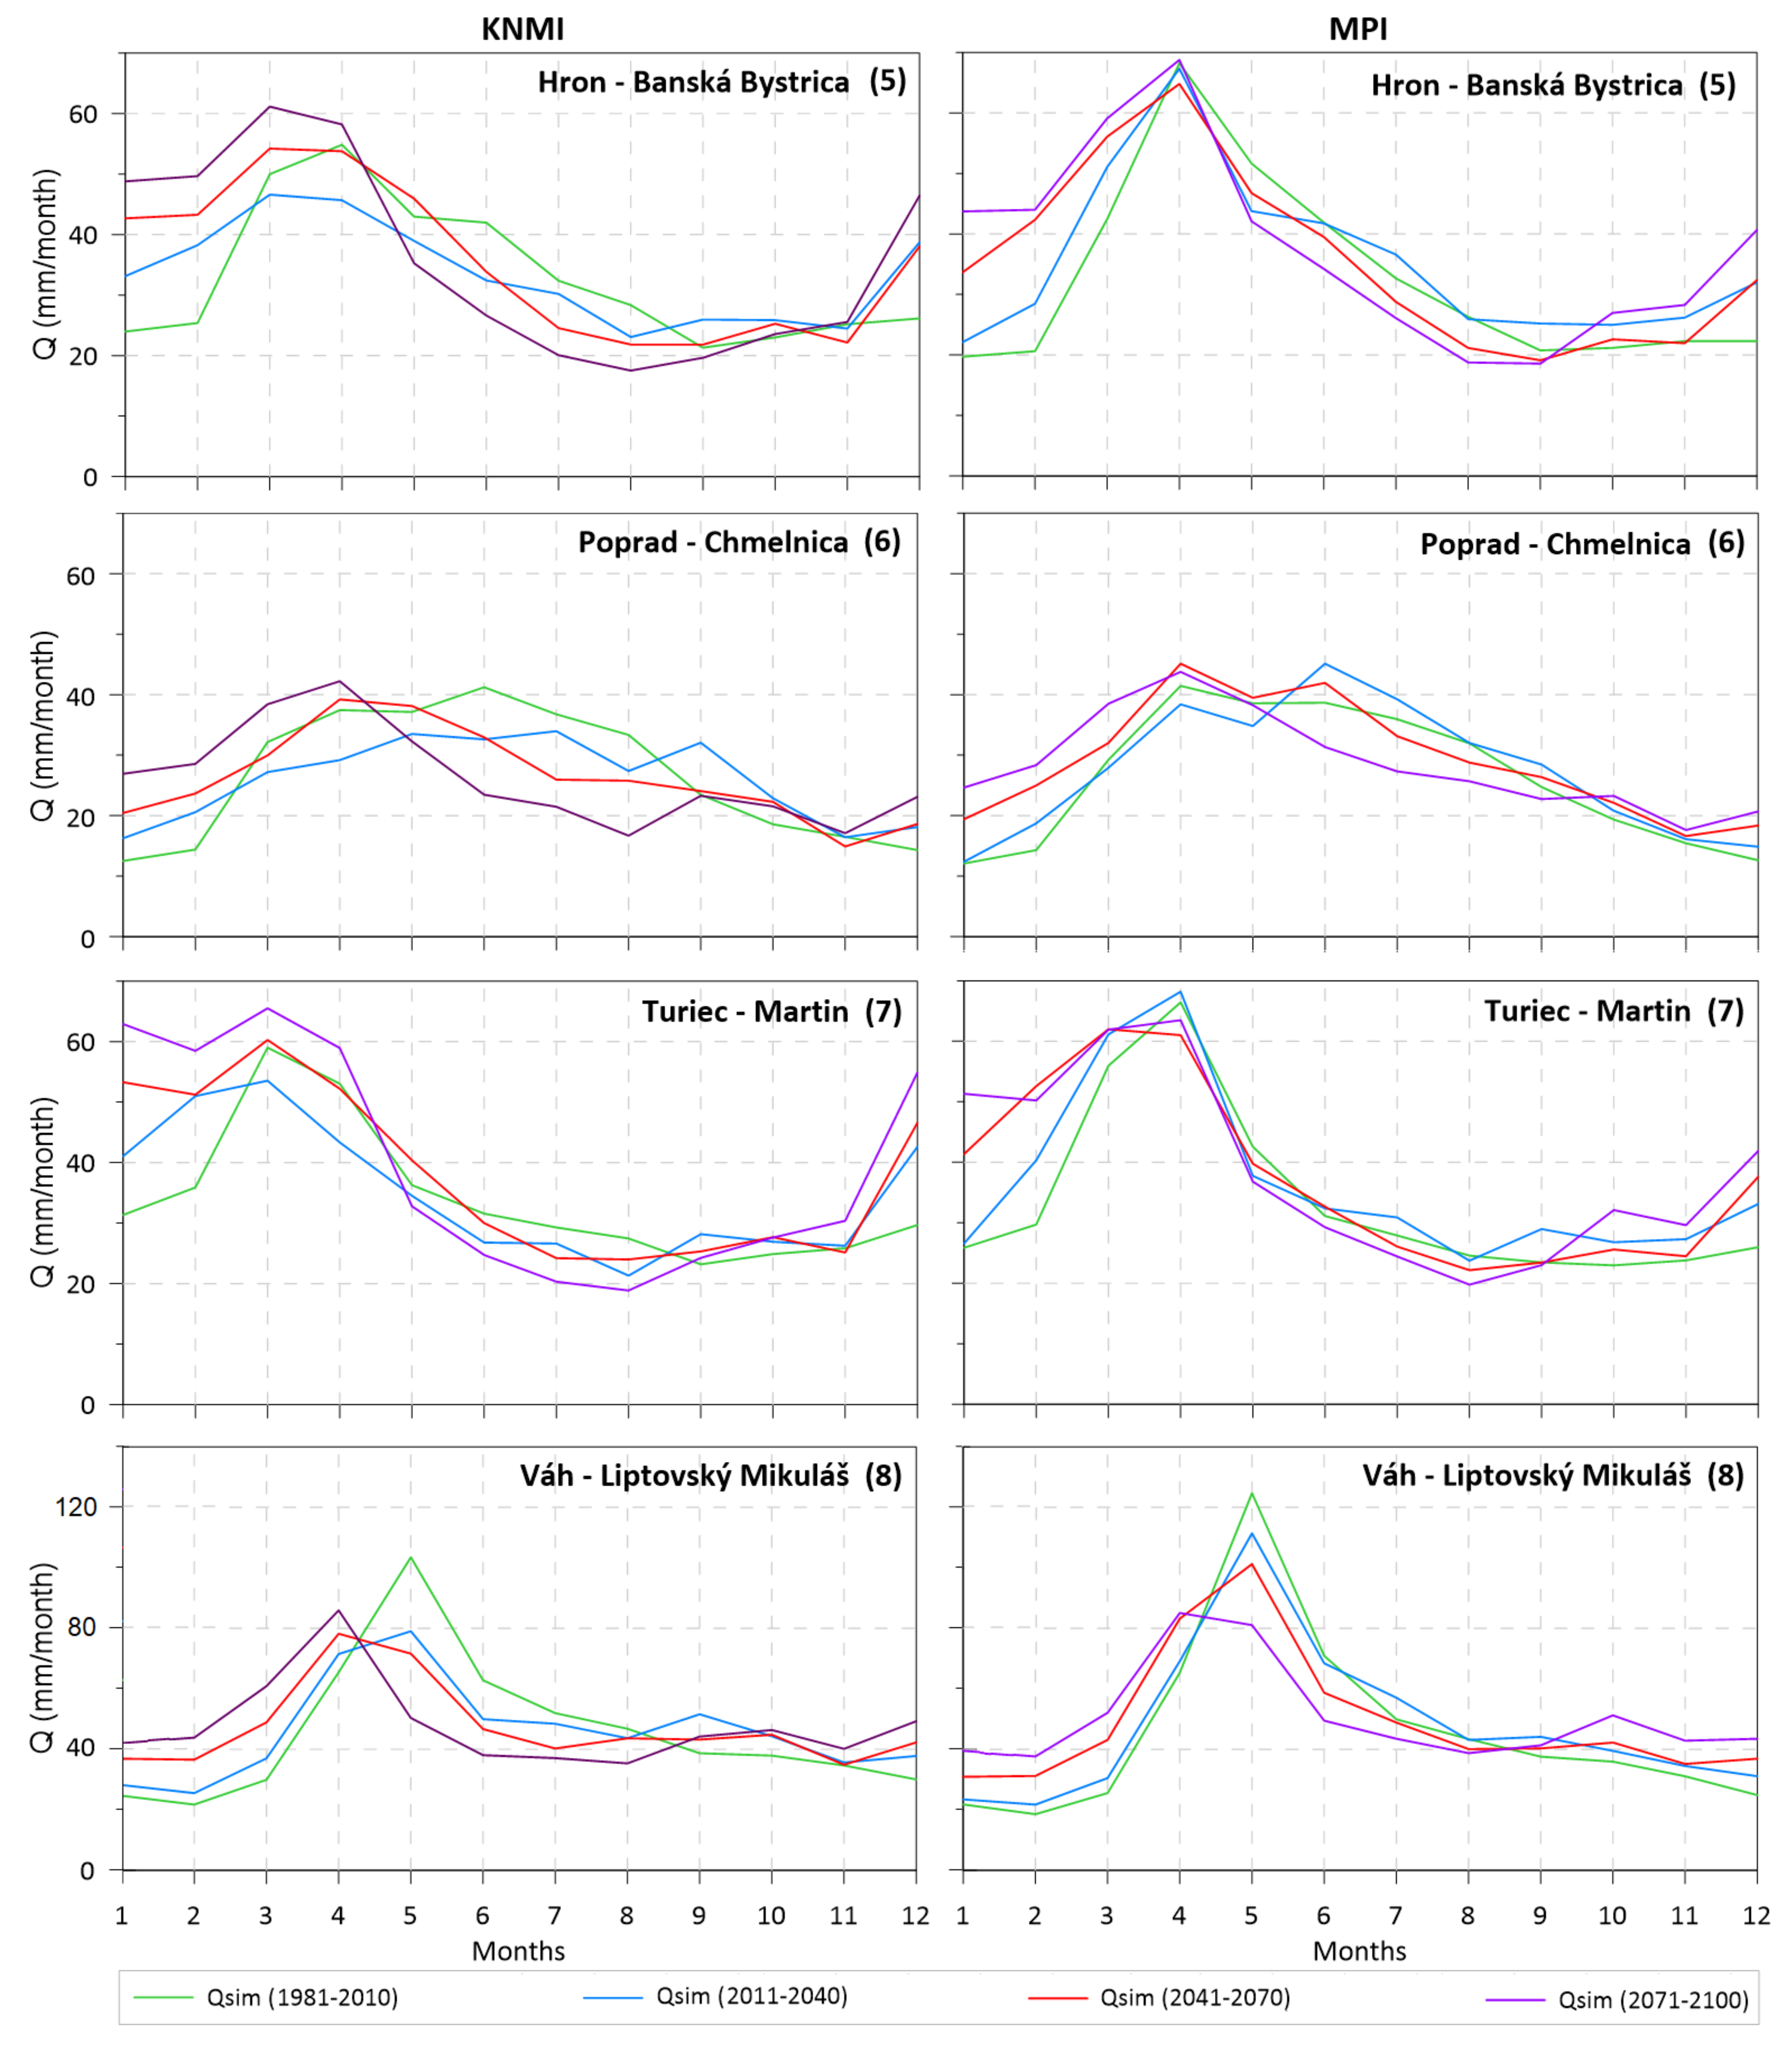
4.2. Impact of Climate Change on Runoff

The predicted future changes in runoff due to climate change were evaluated by comparing the simulated long-term mean monthly runoff for the reference period (1981–2010) and the modelled scenarios in three time periods (2011–2040, 2041–2070, and 2071–2100) (Figure 6 and Figure 7). A comparison of the simulated long-term mean monthly runoff between the reference period and projected scenarios is presented in percentages (Table 6). The values that decreased by 10% or more than 10% are marked in gray.
The results indicate that changes in the runoff regime in all the basins analyzed could be expected in the future, and are assumed to be more or less the same according to both climate scenarios used. Both climate scenarios foresee an increase in the winter runoff (December–February) with a maximum increase in the period 2071–2100. The highest increase in runoff is expected for the Topľa River basin in January (219% for the KNMI scenario and 141% for the MPI scenario). This could be caused by increases in the air temperature (snowfalls will change into rain). On the other hand, the runoff will react in the reverse in the summer season (June–August). According to the KNMI scenario, the runoff will decrease by 28% up to 52%.
The highest percentage decrease in the summer runoff (56% in July) according to the KNMI scenario is assumed for the Myjava River basin.
For the Nitra River basin, we can expect a maximum increase in runoff in the winter months of December and January (according to the KNMI scenario, up to 94%; and according to the MPI scenario, up to 78%). Decreasing runoff (up to 43% for the KNMI scenario) in this basin mainly will occur from June to August. For the Laborec River basin, the most significant decrease (up to 43%) under the scenarios is shown in the spring and summer months. According to both scenarios, the runoff is expected to increase from December to February.
A similar pattern (i.e., a decrease in runoff in the summer months and an increase in the winter months) is observed for the other basins. For example, according to the MPI scenario, the runoff in the Hron River basin may amount to a more than 100% increase in January/February in the last time horizon (2017–2100). According to the KNMI scenario, the runoff will increase by 96–104% in the months of January to February. Conversely, the runoff will decrease by 18% up to 38% in the months of May to August.
A decrease in the summer runoff (50% in August for the KNMI scenario) is projected for the Poprad River basin. The MPI scenario also presents a decrease, but a little bit lower (from 19–24%).
For the Váh River basin, an increase in runoff is projected from December to March (this is true for the climatic data from both climatic models). This is a high-altitude basin, and an increasing air temperature here could result in less snow accumulation and more intensive runoff from snow melt.
Similar to the other basins, an increase in winter runoff (from December to March) can be seen in the Turiec River basin. For this river basin, the highest increases in the runoff are observed in January (according to the KNMI scenario, 101% for the 2071–2100 horizon; and according to the MPI scenario, 98% for the period 2071–2100). Decreasing runoff is mainly observed during the summer months.
According to the results presented, we can conclude that for the entire territory of Slovakia, both climate change scenarios (the KNMI and MPI) predict similar seasonality changes. They foresee an increase in runoff in the winter/spring and a decrease in the summer due to changes in the precipitation regime and an increase in the air temperature, with the intensity of the changes increasing towards the future horizons.
Figure 8 compares the maximum annual daily runoff for the reference period (1981–2010) and three future time horizons (2011–2040, 2041–2070, and 2071–2100). The results indicate that the medians of the maximum annual daily runoff tend to be higher in 2071–2100 for the climatic data from the KNMI model and the river basins with lower mean basin elevations. According to the MPI scenario, the medians of the maximum annual daily runoff show a slightly increasing trend until the year 2040, with an increase of about 0.68 mm/day between the periods 1981–2010 and 2011–2040. The maximum annual daily runoff does not change much during the four periods.
From the analysis, it is also evident that in the basins with lower mean basin elevations, the values of maximum annual daily runoff are higher in size and frequency compared to the basins with higher mean basin elevations. On the other hand, a few very extreme values of maximum annual daily runoff were simulated in the basins with higher mean basin elevations. These extremes may be caused by an increase in the air temperature in the future and extreme runoff from the intensive melting of snow here.

5. Discussion

This study evaluates the potential impacts of climate change on the runoff regime in eight selected basins located in the whole territory of Slovakia, divided into two groups according to their mean basin elevations. The comparison of changes in the climatic and hydrological characteristics over four decades in the observation period showed differences in these river basins. We analyzed the same increase in the medians of the long-term mean annual air temperatures in the latest decade, 2011–2019, compared to the first decade, 1981–1990, for both groups of the basins. In the river basins with a lower mean elevation, we can see only a very slight increase in the long-term mean annual precipitation and a slight decrease in the long-term mean annual runoff in the latest period, 2011–2019, compared to the first period, 1981–1990. On the contrary, in the river basins with a higher mean basin elevation, an increase in both the long-term mean precipitation and in the long-term mean annual runoff in the latest period compared to the first period is evident.
The climate projections were represented by the TUW rainfall-runoff model runs forced by the KNMI and MPI climate models with the A1B emission scenario. Because we cannot calibrate the rainfall-runoff model parameters for the future time horizons, the model was calibrated and validated for four decades in the observation period 1981–2019. The differences in objective functions in the calibration and validation periods confirmed that the model parameters highly depend on input climate data which changed over the four decades. Therefore, for simulating the future runoff, we chose parameters from a recent calibration period 2011–2019, which should be the most similar, mainly in terms of the mean daily air temperatures to a future warmer climate.
According to the KNMI and MPI models evaluated in the reference period (1981–2010) and three future time horizons (2011–2040, 2041–2070, 2071–2100) for all the river basins, the simulated long-term mean monthly runoff shows the known river basin response to climate change from previous works (e.g., [3,5,13,14,15,16,25]). The runoff will rise in the winter/spring, but drop in the summer, throughout the future time horizons. The variability of the runoff can be attributed to the variability of the rainfall and increasing air temperatures towards the future horizons (e.g., [3,16]). Higher air temperatures could increase winter snow-melt runoff due to less snow accumulation. The monthly precipitation totals may not change significantly, but the extremes may increase (alternating low-precipitation periods with periods featuring more extreme precipitation).
Several studies on climate change impacts on the runoff regime have been conducted in recent years (e.g., [23,24,25,39]). Some of these studies (e.g., [23,24,39]) observed an increase in future runoff, whereas others (e.g., [17,40,41,42]) observed a decrease in runoff. For instance, Worqlul et al. [23], in their study, showed that the runoff will rise by up to 64% in dry periods and decrease by 19% in wet periods. Their research was performed in two subcatchments in the upper Blue Nile catchment (Ethiopia). This is in line with Liersch et al. [39], who, for the same study area (upper Blue Nile catchment), presented the increasing pattern in average annual discharges. The authors also observed a shift in seasonal discharge patterns (increase from August to November, and decrease in June and July). In another study, Shahvari et al. [24] showed that runoff will increase in the fall/spring and decrease in the winter/summer according to their hydrological model’s projection. Results from these as well as many other studies suggest that climate change will play an important role in future runoff conditions.
Our results indicate that for most of the basins, studied increases in runoff could occur in the December to February period. On the other hand, decreases in runoff could occur from March/April to September. Such results have also been documented, e.g., Štefunková et al. [14] and Rončák et al. [3]. Those studies were conducted for three and five Slovak basins, respectively. Another study on the impact of climate change on discharge seasonality for selected Slovak basins can be found, e.g., in Hlavčová et al. [13], Kohnová et al. [5], and Rončák et al. [16]. We used a larger sample of basins (eight basins) in our investigation; therefore, the results can be generalized for the whole territory of Slovakia. In contrast to previous studies undertaken in Slovak basins, we also evaluated the maximum annual daily runoff for the reference period and future horizons. Our evaluation showed that in the reference period and future time horizons, in the basins with lower mean basin elevations, the values of maximum annual daily runoff are higher in size and frequency compared to the basins with higher mean basin elevations. On the other hand, a few very extreme values of maximum annual daily runoff were simulated in the basins with higher mean basin elevations. Generally, the maximum annual daily runoff could be more extreme for later time horizons (according to the KNMI scenario for 2071–2100).
The results of our study show how the hydrological regime might change in the basins studied in the future. This analysis could help develop optimal strategies for better management of available water resources in the territory of Slovakia.

6. Conclusions

For estimating the impact of climate change on the runoff regime in Slovakia, eight pilot river basins spread throughout the whole territory of Slovakia were selected and divided into two groups according to their mean basin elevations. Analyzing the climatic characteristics over four decades in the observation period, we can see that the medians of the long-term mean annual air temperatures show an increasing trend. The median values of the long-term mean annual precipitation in the river basins with a lower mean elevation increased between the first and the last decade by 4 mm/year, and in the basins with a higher mean basin elevation by 53 mm/year. The long-term mean annual runoff medians in the river basins with a lower mean elevation show an overall decrease over the four decades by 35 mm/year and a slight increase by 14 mm/year in the basins with a higher mean elevation.
A lumped hydrological model based on the HBV concept was applied for modelling runoff in new climate conditions. For the parameterization of the model for future climate, we used a calibration strategy based on selecting the most suitable decade in the observation period. The differences in objective functions in the calibration and validation periods in four decades in the observation periods confirmed differences in the model parameters due to different climate characteristics in these decades. Therefore, for simulating the future runoff, we chose parameters from a recent calibration period (i.e., 2011–2019) because we assume that this period should be similar (mainly in terms of the mean daily air temperatures) to a future/warmer climate.
The climate projections were represented by the model runs forced by the KNMI and MPI regional circulation models with the A1B emission scenario. The model’s performance metrics and a visual inspection showed that the simulated runoff using downscaled inputs from both RCM models for the reference period represents the simulated hydrological regimes well.
The outcomes of the runoffs simulated under changing climate conditions show that changes in the seasonal distribution of the long-term monthly runoff can be expected. The monthly runoff is predicted to increase during winter periods and decrease during summer seasons. These changes are expected to be more extreme for the later time horizons. The maximum annual daily runoff also could be more extreme for the last time horizon.
Our results have shown that climate change will impact the runoff regimes of the eight basins studied, with consequences for water resource planning/management. The results from this study can be used to support decision-making processes, for example, in developing optimal strategies for adapting to the changing climate predicted.

Author Contributions

Conceptualization, P.S., K.H. and R.V.; methodology, P.S., K.H. and R.V.; software, P.S.; validation, P.S. and R.V; formal analysis, P.S., K.H., R.V. and M.A.; investigation, P.S., K.H., R.V., M.D., M.A., J.S. and S.K.; writing—original draft preparation, P.S., K.H. and R.V.; writing—review and editing, K.H., P.S., R.V. and M.A.; visualization, P.S. and R.V. All authors have read and agreed to the published version of the manuscript.

Funding

This work was supported by the Slovak Research and Development Agency under Contract No. APVV-18-0347, No. APVV-19-0340 and the VEGA Grant Agency No. 1/0632/19.

Institutional Review Board Statement

Not applicable.

Informed Consent Statement

Not applicable.

Data Availability Statement

The data presented in this study are partly available on request from the corresponding author. Some of the data are only available from the Slovak Hydro-meteorological Institute in Bratislava on a commercial basis.

Acknowledgments

We would like to acknowledge the support from the Stefan Schwarz grant of the Slovak Academy of Sciences given to the first author.

Conflicts of Interest

The authors declare no conflict of interest.

References

  1. Blauhut, V.; Stahl, K.; Stagge, J.H.; Tallaksen, L.M.; De Stefano, L.; Vogt, J. Estimating drought risk across Europe from reported drought impacts, drought indices, and vulnerability factors. Hydrol. Earth Syst. Sci. 2016, 20, 2770–2800. [Google Scholar] [CrossRef] [Green Version]
  2. Freire-González, J.; Decker, C.; Hall, J.W. The economic impacts of droughts: A framework for analysis. Ecol. Econ. Manag. 2017, 132, 196–204. [Google Scholar] [CrossRef]
  3. Rončák, P.; Hlavčová, K.; Kohnová, S.; Szolgay, J. Impacts of Future Climate Change on Runoff in Selected Catchments of Slovakia. In Climate Change Adaptation in Eastern Europe; Leal Filho, W., Trbic, G., Filipovic, D., Eds.; Springer: Cham, Switzerland, 2019. [Google Scholar] [CrossRef]
  4. Hlavčová, K.; Lapin, M.; Valent, P.; Szolgay, J.; Kohnová, S.; Rončák, P. Estimation of the impact of climate change-induced extreme precipitation events on floods. Contrib. Geophys. Geod. 2015, 45, 173–192. [Google Scholar] [CrossRef] [Green Version]
  5. Kohnová, S.; Rončák, P.; Hlavčová, K.; Szolgay, J.; Rutkowska, A. Future impacts of land use and climate change on extreme runoff values in selected catchments of Slovakia. Meteorol. Hydrol. Water Manag. 2019, 7, 47–55. [Google Scholar] [CrossRef]
  6. Ďurigová, M.; Ballová, D.; Hlavčová, K. Analyses of Monthly Discharges in Slovakia Using Hydrological Exploratory Methods and Statistical Methods. Slovak J. Civ. Eng. 2019, 27, 36–43. [Google Scholar] [CrossRef] [Green Version]
  7. Ďurigová, M.; Hlavčová, K.; Poórová, J. Detection of Changes in Hydrological Time Series during Recent Decades. Slovak J. Civ. Eng. 2020, 28, 56–62. [Google Scholar] [CrossRef]
  8. Rončák, P.; Vitková, J.; Šurda, P. The components of water balance in changing climate in future horizons in Slovakia. Int. Multidiscip. Sci. Geoconf. SGEM 2019, 19, 545–552. [Google Scholar] [CrossRef]
  9. Rončák, P.; Šurda, P.; Vitková, J. Analysis of a Topsoil Moisture Regime Through an Effective Precipitation Index for the Locality of Nitra, Slovakia. Slovak J. Civ. Eng. 2021, 29, 9–14. [Google Scholar] [CrossRef]
  10. Sleziak, P.; Szolgay, J.; Hlavčová, K.; Parajka, J. The Impact of the Variability of Precipitation and Temperatures on the Efficiency of a Conceptual Rainfall-Runoff Model. Slovak J. Civ. Eng. 2016, 24, 1–7. [Google Scholar] [CrossRef] [Green Version]
  11. Sleziak, P.; Szolgay, J.; Hlavčová, K.; Duethmann, D.; Parajka, J.; Danko, M. Factors controlling alterations in the performance of a runoff model in changing climate conditions. J. Hydrol. Hydromech. 2018, 66, 381–392. [Google Scholar] [CrossRef] [Green Version]
  12. Aleksić, M.; Sleziak, P.; Hlavčová, K. Parameterization of the rainfall-runoff model in changing climate. Pollack Period. 2021, 16, 64–69. [Google Scholar] [CrossRef]
  13. Hlavčová, K.; Szolgay, J.; Kohnová, S.; Bálint, G. Hydrological scenarios of future seasonal runoff distribution in Central Slovakia. Earth Environ. Sci. 2008, 4, 012022. [Google Scholar] [CrossRef]
  14. Štefunková, Z.; Hlavčová, K.; Lapin, M. Runoff change scenarios based on regional climate change projections in mountainous basins in Slovakia. Contrib. Geophys. Geod. 2013, 43, 327–350. [Google Scholar] [CrossRef] [Green Version]
  15. Rončák, P.; Hlavčová, K.; Látková, T. Estimation of the effect of changes in forest associations on runoff processes in basins: Case study in the Hron and Topla river basins. Slovak J. Civ. Eng. 2016, 24, 1–7. [Google Scholar] [CrossRef] [Green Version]
  16. Rončák, P.; Šurda, P.; Vitková, J. The impact of climate change on the hydropower potential: A case study from Topľa river basin. Acta Hydrol. Slovaca 2021, 22, 22–29. [Google Scholar] [CrossRef]
  17. Huntington, T.G. Climate warming could reduce runoff significantly in New England, USA. Agric. For. Meteorol. 2003, 117, 193–201. [Google Scholar] [CrossRef]
  18. Wang, G.Q.; Zhang, J.Y.; Xuan, Y.Q.; Liu, J.F.; Jin, J.L.; Bao, Z.X.; He, R.M.; Liu, C.S.; Liu, Y.L.; Yan, X.L. Simulating the Impact of Climate Change on Runoff in a Typical River Catchment of the Loess Plateau, China. J. Hydrometeorol. 2013, 14, 1553–1561. [Google Scholar] [CrossRef]
  19. Ficklin, D.L.; Stewart, I.T.; Maurer, E.P. Climate Change Impacts on Streamflow and Subbasin-Scale Hydrology in the Upper Colorado River Basin. PLoS ONE 2013, 8, e71297. [Google Scholar] [CrossRef]
  20. Aich, V.; Liersch, S.; Vetter, T.; Huang, S.; Tecklenburg, J.; Hoffmann, P.; Koch, H.; Fournet, S.; Krysanova, V.; Müller, E.N.; et al. Comparing impacts of climate change on streamflow in four large African river basins. Hydrol. Earth Syst. Sci. 2014, 18, 1305–1321. [Google Scholar] [CrossRef] [Green Version]
  21. Vano, J.A.; Nijssen, B.; Lettenmaier, D.P. Seasonal hydrologic responses to climate change in the Pacific Northwest. Water Resour. Res. 2015, 51, 1959–1976. [Google Scholar] [CrossRef]
  22. Wu, Z.; Xiao, H.; Lu, G.; Chen, J. Assessment of Climate Change Effects on Water Resources in the Yellow River Basin, China. Adv. Meteorol. 2015, 2015, 816532. [Google Scholar] [CrossRef]
  23. Worqlul, A.W.; Dile, Y.T.; Ayana, E.K.; Jeong, J.; Adem, A.A.; Gerik, T. Impact of climate change on streamflow hydrology in headwater catchments of the upper Blue Nile Basin, Ethiopia. Water 2018, 10, 120. [Google Scholar] [CrossRef] [Green Version]
  24. Shahvari, N.; Khalilian, S.; Mosavi, S.H.; Mortazavi, S.A. Assessing climate change impacts on water resources and crop yield: A case study of Varamin plain basin, Iran. Environ. Monit. Assess. 2019, 191, 134. Available online: https://link.springer.com/article/10.1007/s10661-019-7266-x (accessed on 23 October 2021). [CrossRef]
  25. Vyshnevskyi, V.I.; Donich, O.A. Climate change in the Ukrainian Carpathians and its possible impact on river runoff. Acta Hydrol. Slovaca 2021, 22, 3–14. [Google Scholar] [CrossRef]
  26. Lapin, M.; Bašták, I.; Gera, M.; Hrvoľ, J.; Kremler, M.; Melo, M. New climate change scenarios for Slovakia based on global and regional general circulation models. Acta Meteorol. Univ. Comen. 2012, 37, 25–74. [Google Scholar]
  27. Valent, P.; Výleta, R. Calculating areal rainfall using a more efficient IDW interpolation algorithm. Int. J. Eng. Res. Sci. 2015, 1, 9–17. [Google Scholar]
  28. Parajka, J.; Merz, R.; Blöschl, G. A comparison of regionalisation methods for catchment model parameters. Hydrol. Earth Syst. Sci. 2005, 9, 157–171. [Google Scholar] [CrossRef] [Green Version]
  29. Parajka, J.; Merz, R.; Blöschl, G. Uncertainty and multiple objective calibration in regional water balance modelling: Case study in 320 Austrian catchments. Hydrol. Process. 2007, 21, 435–446. [Google Scholar] [CrossRef]
  30. Bergström, S. Development and Application of a Conceptual Runoff Model for Scandinavian Catchments. Bulletin Series A; Department of Water Resources Engineering, Lund Institute of Technology/University of Lund: Lund, Sweden; Swedish Meteorological and Hydrological Institute: Norrköping, Sweden, 1976; p. 52. [Google Scholar]
  31. Bergström, S.; Lindström, G. Interpretation of runoff processes in hydrological modelling—Experience from the HBV approach. Hydrol. Process. 2015, 29, 3535–3545. [Google Scholar] [CrossRef]
  32. Merz, R.; Parajka, J.; Bloschl, G. Time stability of catchment model parameters: Implications for climate impact analyses. Water Resour. Res. 2011, 47, 1–17. [Google Scholar] [CrossRef] [Green Version]
  33. Valent, P.; Daneková, J.; Riverso, C. Uncertainties in the HBV model calibration. Acta Hydrol. Slovaca 2011, 12, 360–367. [Google Scholar]
  34. Sleziak, P.; Szolgay, J.; Hlavčová, K.; Danko, M.; Parajka, J. The effect of the snow weighting on the temporal stability of hydrologic model efficiency and parameters. J. Hydrol. 2020, 583, 124639. [Google Scholar] [CrossRef]
  35. Széles, B.; Parajka, J.; Hogan, P.; Silasari, R.; Pavlin, L.; Strauss, P.; Blöschl, G. Stepwise prediction of runoff using proxy data in a small agricultural catchment. J. Hydrol. Hydromech. 2021, 69, 65–75. [Google Scholar] [CrossRef]
  36. Ardia, D.; Boudt, K.; Carl, P.; Mullen, K.M.; Peterson, B.G. Differential evolution with DEoptim: An application to non-convex portfolio optimization. R J. 2010, 3, 27–34. [Google Scholar] [CrossRef] [Green Version]
  37. Mullen, K.; Ardia, D.; Gil, D.; Windover, D.; Cline, J. DEoptim: An R Package for Global Optimization by Differential Evolution. J. Stat. Softw. 2011, 40, 1–26. [Google Scholar] [CrossRef] [Green Version]
  38. Klemeš, V. Operational testing of hydrological simulation models. Hydrol. Sci. J. 1986, 31, 13–24. [Google Scholar] [CrossRef]
  39. Liersch, S.; Tecklenburg, J.; Rust, H.; Dobler, A.; Fischer, M.; Kruschke, T.; Koch, H.; Hattermann, F.F. Are we using the right fuel to drive hydrological models? A climate impact study in the Upper Blue Nile. Hydrol. Earth Syst. Sci. 2018, 22, 2163–2185. [Google Scholar] [CrossRef] [Green Version]
  40. Siqueira, J.L., Jr.; Tomasella, J.; Rodriguez, D.A. Impacts of Future Climatic and Land Cover Changes on the Hydrological Regime of the Madeira River Basin. Clim. Chang. 2015, 129, 117–129. [Google Scholar] [CrossRef]
  41. Montenegro, S.; Ragab, R. Impact of Possible Climate and Land Use Changes in the Semiarid Regions: A Case Study from North Eastern Brazil. J. Hydrol. 2012, 434, 55–68. [Google Scholar] [CrossRef]
  42. Elshamy, M.E.; Seierstad, I.A.; Sorteberg, A. Impacts of climate change on Blue Nile flows using bias-corrected GCM scenarios. Hydrol. Earth Syst. Sci. 2009, 13, 551–565. [Google Scholar] [CrossRef] [Green Version]
Figure 1. Topography of Slovakia and locations of the eight river basins selected.
Water 13 03358 g001
Figure 2. Changes in the hydroclimatic characteristics (long-term mean annual precipitation, air temperature, and runoff) over four decades. A line represents the medians of these characteristics for each of the four periods (i.e., 1981–1990, 1991–2000, 2001–2010, and 2011–2019) and for the two groups of the basins. The scatter (i.e., the 75 and 25% percentiles) indicates the variability between the basins.
Water 13 03358 g002
Figure 3. Seasonal variability of the long-term mean monthly air temperature and precipitation totals for the KNMI and MPI climate scenarios: (a) for the river basins with a mean elevation < 435 m a.s.l.; (b) for the river basins with a mean elevation > 435 m a.s.l. The lines show the basin averages.
Water 13 03358 g003
Figure 4. Values of the objective function (OF), the logarithmic Nash–Sutcliffe efficiency (logNSE), the Nash–Sutcliffe efficiency (NSE), and the volume error (VE) in the calibration/validation periods of the eight basins studied.
Water 13 03358 g004
Figure 5. Comparison of the measured and simulated long-term mean monthly runoffs for the reference period (1981–2010) and for the two groups of river basins.
Water 13 03358 g005
Figure 6. Long-term mean monthly runoff projected for the reference period (1981–2010) and three future time horizons (2011–2040, 2041–2070, 2071–2100) according to the KNMI and MPI scenarios for the river basins with a mean elevation < 435 m a.s.l.
Water 13 03358 g006
Figure 7. Long-term mean monthly runoff projected for the reference period (1981–2010) and three future time horizons (2011–2040, 2041–2070, 2071–2100) according to the KNMI and MPI scenarios for the river basins with a mean elevation > 435 m a.s.l.
Water 13 03358 g007
Figure 8. Comparison of the simulated maximum annual daily runoff for the KNMI and MPI climate change scenarios for the reference period (1981–2010) and future horizons (2011–2040, 2041–2070, and 2071–2100). The lines show the basin averages. The blue lines represent the median of the maximum annual mean runoff. The red lines indicate the median for each of the four periods. The scatter (i.e., 75 and 25 % percentiles) indicates the variability between the basins.
Water 13 03358 g008
Table 1. Elevation (m a.s.l.) and size (km2) of the eight Slovak basins.
NumberRiverGauging StationArea (km2)Min. ElevationMax. ElevationMean Elevation
1LaborecHumenné1272.40166917421.7
2MyjavaJablonica238.45206792361.7
3NitraNitrianska Streda2093.711751179419.5
4TopľaHanušovce nad Topľou1050.051631077435.4
5HronBanská Bystrica1766.483322030844.4
6PopradChmeľnica1262.415102489878.1
7TuriecMartin827.004031456716.0
8VáhLiptovský Mikuláš1107.2156823871090.1
Table 2. The medians (50%) and percentiles (25% and 75%) of the long-term mean annual precipitation (P), air temperature (T), and runoff (Q) averaged over four decades (a) for the river basins with a mean elevation < 435 m a.s.l., (b) for the river basins with a mean elevation > 435 m a.s.l.
(a)
Climatic1981–19901991–20002001–20102011–2019
characteristics25%50%75%25%50%75%25%50%75%25%50%75%
T (°C)7.47.88.47.58.28.88.08.69.18.89.410.1
P (mm/year)577657731656688724659750842587661736
Q (mm/year)174219252177206244169232270158184201
(b)
Climatic1981–19901991–20002001–20102011–2019
characteristics25%50%75%25%50%75%25%50%75%25%50%75%
T (°C)5.15.66.25.466.55.96.36.86.77.27.7
P (mm/year)711794863764833877830899965757847939
Q (mm/year)334368405358393473362422469333382434
Table 3. The long-term mean monthly values of the precipitation (P) and air temperature (T) for the reference period (1981–2010) and three future time horizons (2011–2040, 2041–2070, 2071–2100) according to the KNMI and MPI climate scenarios: (a) for the river basins with a mean elevation < 435 m a.s.l.; (b) for the river basins with a mean elevation > 435 m a.s.l.
(a)
P (mm)IIIIIIIVVVIVIIVIIIIXXXIXII
KNMI1981–2010464244527786907768485654
2011–2040394340447293767395505570
2041–2070474551657687737382615577
2071–21005755606069636876102625980
MPI1981–2010464343527886917366505554
2011–2040465143487494817986495567
2041–2070514354676994807279595075
2071–2100585462647078667082615969
T (°C)IIIIIIIVVVIVIIVIIIIXXXIXII
KNMI1981–2010−2.6−1.23.18.714.016.718.618.013.48.53.2−1.3
2011–2040−2.7−0.24.19.314.917.719.719.014.410.03.8−1.1
2041–2070−1.31.64.610.015.518.820.620.015.010.44.70.6
2071–21000.21.85.510.616.720.322.521.315.911.56.42.1
MPI1981–2010−2.7−1.32.98.513.716.418.417.213.28.33.1−1.4
2011–2040−2.6−0.43.28.814.417.319.218.314.19.84.0−1.1
2041–2070−0.81.84.49.515.017.920.019.414.910.24.90.3
2071–21000.62.45.210.115.919.421.420.716.311.66.62.1
(b)
P (mm)IIIIIIIVVVIVIIVIIIIXXXIXII
KNMI1981–20104945545791971078573546456
2011–20404445515083998789104556476
2041–2070514962719087888987666380
2071–21006261756573677483109706784
MPI1981–20105045525893971068273576456
2011–204049515352841181068490536669
2041–20705648677682110978185666076
2071–2100645974728097878495727172
T (°C)IIIIIIIVVVIVIIVIIIIXXXIXII
KNMI1981–2010−3.9−3.10.65.811.213.915.915.311.06.41.3−2.9
2011–2040−3.9−2.11.66.412.215.016.916.411.98.01.8−2.8
2041–2070−2.6−0.22.07.112.916.017.917.412.58.42.8−1.1
2071–2100−1.2−0.13.07.714.017.519.818.813.49.54.50.5
MPI1981–2010−3.9−3.00.65.811.213.915.915.311.06.41.3−2.9
2011–2040−3.8−2.11.06.211.914.816.716.411.97.92.2−2.7
2041–2070−2.10.12.06.912.615.317.617.612.78.33.2−1.3
2071–2100−0.80.52.77.513.517.018.918.914.19.74.70.6
Table 4. 15 TUW model parameters sorted due to the routines and their calibration ranges.
Parameter NameRoutineUnitRange
Snow correction factor (SCF)Snow-0.9–1.5
Degree-day factor (DDF)Snowmm/°C day0–5
Rain threshold temperature (Tr)Snow°C1–3
Snow threshold temperature (Ts)Snow°C−3–1
Melt temperature (Tm)Snow°C−2–2
Limit of potential evapotranspiration (Lprat)Soilday0–l
Maximum soil moisture storage (FC)Soilmm0–600
Nonlinearity parameter (BETA)Soil-0–20
Very fast storage coefficient (k0)Runoffdays0–2
Fast storage coefficient (k1)Runoffdays2–30
Slow storage coefficient (k2)Runoffdays30–250
Upper storage coefficient (Lsuz)Runoffmm1–100
Percolation rate (Cperc)Runoffmm/day0–8
Maximum base parameter (Bmax)Runoffdays0–30
Free scaling parameter (Croute)Runoffday2/mm0–50
Table 5. The optimum HBV model parameters for eight studied basins.
Parameter NameLaborecMyjavaNitraTopľaHronPopradTuriecVáh
SCF (−)1.050.901.031.140.980.901.101.20
DDF (mm/°C day)0.944.120.842.631.191.081.291.07
Tr (°C)1.032.931.611.801.041.962.691.69
Ts (°C)−3.00−2.39−0.09−2.94−2.97−2.37−2.90−3.00
Tm (°C)−1.131.29−1.001.41−0.45−1.33−0.791.60
Lprat (day)0.630.830.790.580.870.860.611.00
FC (mm)241.56267.15218.28239.24317.36365.04175.40132.23
BETA (−)2.833.272.212.182.652.571.370.88
k0 (days)0.380.750.210.290.221.070.500.23
k1 (days)7.7215.1317.196.6321.666.0713.0618.03
k2 (days)83.8784.28102.7087.1597.5730.5774.67228.83
Lsuz (mm)5.3499.526.735.4428.809.7992.8542.29
Cperc (mm/day)0.250.120.300.320.551.400.980.99
Bmax (days)3.591.772.763.811.483.556.6325.41
Croute (day2/mm)0.1631.310.180.2727.310.0732.5637.12
Table 6. Simulated long-term mean monthly runoff (mm/month) and its changes (%) for the three future time horizons: (a) in the river basins with a mean elevation < 435 m a.s.l.; (b) in the river basins with a mean elevation > 435 m a.s.l.
(a)
Runoff (mm/month)IIIIIIIVVVIVIIVIIIIXXXIXII
Laborec1981–2010243446362419151515141924
KNMI2011–20401525−18−30−14−2018−253325338
2041–20705123−122411−11−371832−2747
2071–21007239−12−18−38−10−421930776
1981–2010232950492619151315161721
MPI2011–2040−136−8−8−12−20−6−489933
2041–20705236−45−45−37−13−22−39−1316−554
2071–21007646−1−3−4−38−37−39−29−31856
Myjava1981–20101822362919171310891016
KNMI2011–20404421−3−15−4−25−17−352512044
2041–20707930101531−13−42−381522771
2071–21001116720290−32−56−52−6263099
1981–201015203834211712868913
MPI2011–204029565161−816109632045
2041–20708347−547−17−26−36−18−7−1066
2071–21001257497−6−14−30−321213685
Nitra1981–2010253042312221161411141622
KNMI2011–20402714−10−112−25−17−23285254
2041–2070632081931−17−29−122717−862
2071–210088501336−4−33−43−3014212094
MPI1981–2010233043372320161211131420
2011–2040223586−1−65−554321446
2041–20706528296−12−26−14−112−754
2071–21007841411−9−23−25−218372970
Topľa1981–2010813373222221717119109
KNMI2011–20403054−30−33−8−2510−287434−333
2041–20709082−32−22−15−17−381647−951
2071–2100219117−100−15−41−28−52536915130
1981–2010813353723191614121098
MPI2011–2040−252−13−9−122−1−445421
2041–207069109−10−405−17−162729671
2071–2100141102−4−138−32−37−25−17141177
(b)
Runoff (mm/month)IIIIIIIVVVIVIIVIIIIXXXIXII
Hron1981–2010242550554342322821232526
KNMI2011–20403851−7−17−9−23−7−192212−348
2041–207078708−27−19−24−23210−1245
2071–210010496226−18−37−38−38−82178
1981–2010202142685242332621212222
MPI2011–2040123820−1−15012−221181844
2041–20707110532−5−9−6−12−20−87−245
2071–2100122113391−19−18−20−29−11272782
Poprad1981–2010131432373741373323191614
KNMI2011–20403043−15−22−10−21−8−183723027
2041–20706364−753−20−29−23320−1030
2071–2100115981913−13−43−42−50−116461
1981–2010121429413939363225191513
MPI2011–2040231−4−7−101790158418
2041–2070617510928−8−10714846
2071–210010498326−1−19−24−20−8201464
Turiec1981–2010313659533632292723252630
KNMI2011–20403142−9−18−5−15−9−22218244
2041–207070432−211−5−17−13911−357
2071–2100101631111−10−22−31−315111885
1981–2010263056664331282523232426
MPI2011–204033693−11411−324171528
2041–2070607711−8−75−7−10011345
2071–2100986911−4−14−6−12−20−2402561
Váh1981–20102522306510363524739383530
KNMI2011–20401417249−24−20−7−73317326
2041–207050686319−31−26−22−71218141
2071–21007110210331−51−39−29−2414221664
1981–20102219266512571504338363125
MPI2011–2040817196−11−314−117101125
2041–207042686927−19−17−2−87181348
2071–21008110310430−35−30−13−1110433875
Publisher’s Note: MDPI stays neutral with regard to jurisdictional claims in published maps and institutional affiliations.

