
Variation of Runoff and Runoff Components of the Upper Shule River in the Northeastern Qinghai–Tibet Plateau under Climate Change


1
Key Laboratory of Ecohydrology of Inland River Basin, Northwest Institute of Eco-Environment and Resources, Chinese Academy of Sciences, Lanzhou 730000, China
2
State Key Laboratory of Cryospheric Sciences, Northwest Institute of Eco-Environment and Resources, Chinese Academy of Sciences, Lanzhou 730000, China
3
University of Chinese Academy of Sciences, Beijing 100049, China
4
College of Geography and Environmental Engineering, Lanzhou City University, Lanzhou 730070, China
5
College of Civil Engineering, Lanzhou Jiaotong University, Lanzhou 730070, China
6
Pingliang Hydrological Station of Gansu Province, Pingliang 744000, China
*
Author to whom correspondence should be addressed.
Water 2021, 13(23), 3357; https://doi.org/10.3390/w13233357
Submission received: 2 November 2021
/
Revised: 21 November 2021
/
Accepted: 23 November 2021
/
Published: 26 November 2021
(This article belongs to the Special Issue Climate Changes and Hydrological Processes)
Abstract
:Quantifying the impact of climate change on hydrologic features is essential for the scientific planning, management and sustainable use of water resources in Northwest China. Based on hydrometeorological data and glacier inventory data, the Spatial Processes in Hydrology (SPHY) model was used to simulate the changes of hydrologic processes in the Upper Shule River (USR) from 1971 to 2020, and variations of runoff and runoff components were quantitatively analyzed using the simulations and observations. The results showed that the glacier area has decreased by 21.8% with a reduction rate of 2.06 km2/a. Significant increasing trends in rainfall runoff, glacier runoff (GR) and baseflow indicate there has been a consistent increase in total runoff due to increasing rainfall and glacier melting. The baseflow has made the largest contribution to total runoff, followed by GR, rainfall runoff and snow runoff, with mean annual contributions of 38%, 28%, 18% and 16%, respectively. The annual contribution of glacier and snow runoff to the total runoff shows a decreasing trend with decreasing glacier area and increasing temperature. Any increase of total runoff in the future will depend on an increase of rainfall, which will exacerbate the impact of drought and flood disasters.
1. Introduction
Rivers originating in the high mountains are among the most meltwater-dependent river systems in arid and semi-arid regions, where the water resources are a key restricting factor on social, economic and ecosystem development. Glaciers, snow meltwater and rainfall in the high mountains are the major contributors of freshwater to most of the main river basins in Northwest China [1,2,3,4,5]; large human populations and agricultural production activities depend on these resources downstream [6,7,8].
The areas covered by glaciers and snow are expected to be the most vulnerable to climate change and global warming [9,10,11]. Glaciers are sensitive indicators of global warming, and glacier melting is one of the major contributors to the increase of river runoff [12,13,14,15]. As a result of global warming, glaciers in the Qilian Mountains are retreating fast and may lead to serious alterations in the hydrologic processes of many inland river basins [16,17,18]. Snow cover is significantly affected by climate change. With global warming, the extent, depth of snow cover and number of snow cover days in the Qilian Mountains tend to decrease [19,20,21]. However, with the increase of precipitation, the extent, depth and days of snow cover tend to increase again [22], resulting in a complex impact of snow runoff on river runoff. Under climate change and global warming, the precipitation in Northwest China also shows an increasing trend [23,24]. The increase in precipitation is altitude-dependent: the higher the altitude, the greater the rate of increase in precipitation [25], and rapid changes in precipitation in the high mountains in Northwest China have been observed [26]. However, the precipitation pattern in Northwest China is fundamentally different from that in eastern China [27,28]. The increase of precipitation is mainly due to the increase of extreme and short-term convective rainfall [29,30,31,32]. Brief, heavy rainfall often forms flash floods, causing damage to the safety of people and property [33].
Due to the presence of glaciers, snow cover and short-term heavy rainfall, the hydrologic processes in the high mountains are very complex, and the accelerated shrinking and melting of glaciers and snow, and increasing short-duration heavy rainfall, will inevitably change the evolution of river runoff [34]. Across the high mountains in Northwest China, there is great variation in the contributions of glaciers, snow meltwater and rainfall to river runoff, which is poorly quantified [34,35]. The lack of understanding of the hydrologic processes of the alpine basins in Northwest China is one of the main sources of uncertainty in assessing the regional hydrological impacts of climate change [35].
Understanding and exploring the contribution of glacier meltwater to rivers is the premise and basis for predicting and coping with future changes in glacier and snow resources and their impacts in Northwest China [36]. The study of runoff generation in alpine regions has always been one of the hot and difficult issues in hydrology studies. Methods commonly used to quantify the proportions of runoff components in the total runoff include the isotope tracing method [37,38,39], numerical simulation method [40] and hydrological model method [34]. However, the isotope tracing method does not effectively distinguish shallow soil water from deep groundwater, and the numerical simulation method often only distinguishes the baseflow. Distributed hydrological models have an advantage in runoff segmentation because of their modular approach to hydrological processes. Common distributed hydrological models such as the VIC model [41,42,43], SWAT model [44] and SRM model [45] do not refine the segmentation of runoff components, while the spatial processes in hydrology (SPHY) model can divide the total runoff into glacier runoff (GR), snow runoff, rainfall runoff (overland flow and shallow lateral flow) and the baseflow [46,47]. The detailed segmentation of total runoff by the SPHY model is helpful to reveal the essential driving factors of long-time series runoff evolution.
The Upper Shule River (USR) is commonly considered to be a typical inland river recharged by glacier and snow meltwater. The contribution of glacier meltwater to the river has been a hot issue that researchers have tried to quantify, especially with the accelerated glacier shrinking due to global warming. To address this issue, simulations of total runoff and GR based on the HBV model [48] and VIC model [41,43] have been carried out in the Upper Shule River, but these two models only separate GR from total runoff and do not distinguish total runoff in more detail, thus failing to reveal the essential driving factors of the increase in total runoff. To explore the response of hydrological processes to climate change and reveal the essential driving factors of runoff evolution in the USR, there is an urgent requirement to quantitatively assess the impact of glaciers, snowmelt and rainfall on the evolution of river runoff under climate change. Therefore, this study combined observed hydrometeorological data and multi-period glacier inventory data to simulate the variation of runoff and runoff components in the USR using the SPHY model, with three specific objectives: (1) to explore the response of hydrologic features to climate change and the evolution of runoff, (2) to quantify the contributions of runoff components to the total runoff and the evolution trend of runoff components and (3) to reveal the essential driving factors of runoff evolution.
2. Data and Methods
In this study, anomaly analysis of temperature, precipitation and runoff in the USR was carried out based on station-observed temperature, precipitation and runoff data. Driving data including air temperature and precipitation, along with glacier thickness data based on the Glabtop2 model, were prepared and obtained according to the requirements of the SPHY model. Based on the calibration and validation of the SPHY model, using the observed runoff and multi-period inventoried glacier area, the runoff and runoff components were simulated for the period of 1971 to 2020.
2.1. Study Area
The USR is located in the western part of the Qilian Mountains on the northeast edge of the Qinghai–Tibetan Plateau. It is a runoff formation and conservation area for the Shule River, one of the three major inland rivers of the Hexi Corridor in Northwest China. The USR is located above the National Hydrological Station of Changmabao, which covers an area of 10,961 km2 (92°54′~99°14′ E, 38°36′~41°34′ N), with an altitude that ranges between 2038 and 5792 m a.s.l. (Figure 1).
Due to the special geographical location, the climate characteristics of the USR are characterized by both an alpine climate and a temperate continental climate. The mean annual temperature is approximately −1.62 °C, and the mean annual precipitation is approximately 235.2 mm. The USR reaches its highest temperature in July and lowest temperature in January, and the precipitation is extremely uneven during the year, with 91.4% of the precipitation concentrated between May and September during the warm season. The mean annual runoff of the USR from 1961 to 2020 is 10.54 × 10⁸ m3/a, and the runoff has significant seasonal characteristics, with 68.4% of runoff concentrated between June and September. The USR is a typical river fed by glaciers and snow meltwater. The glacier area of the USR is the largest in the Qilian Mountains, and the existing glaciers cover an area of 409 km2 based on the Second Chinese Glacier Inventory [49,50,51], accounting for about 3.73% of the basin area. Due to the high altitude and cold climate, the main vegetation types in the USR are alpine meadows, alpine grasslands and desert grasslands.
2.2. Data Sources
The hydrometeorological data used to analyze the variation of regional climate change and evolution of runoff in the USR, and the forcing data for the SPHY model, primarily included the temperature, precipitation and runoff. Among them, annual and monthly mean temperature, annual and monthly precipitation and annual and monthly runoff were used to analyze the inter-annual and intra-annual variation of temperature, precipitation and runoff in the USR. Daily mean, maximum and minimum temperatures and daily precipitation were the primary forcings for the SPHY model, and the monthly runoff was used to calibrate and validate the performance of the SPHY model.
Temperature and precipitation data were obtained from one national hydrological station, two national meteorological stations and six automatic meteorological stations, and runoff data were obtained from the national hydrological station data recorded in the Hydrological Yearbook of the People’s Republic of China. The details of each meteorological and hydrological station are given in Table 1 and Figure 1. Since the time series of temperature and precipitation data were not consistent among meteorological and hydrological stations, the required data were fitted and unified into the same time series based on the monthly lapse rate of temperature and the monthly gradient of precipitation in the USR in this study [41].
In addition to temperature and precipitation as the basic forcing data, the forcing data of the SPHY model also included topography data of a digital elevation model (DEM), physical parameters of soil, land use data and glacier outlines and thickness. The topography data were HydroSHEDS with a spatial resolution of 90 m based on SRTM DEM from the United States Geological Survey (USGS), including hydrological information such as river networks, basin boundaries and confluence directions [52]. Physical parameters of soil include the field capacity (mm/mm), saturated water content (mm/mm), permanent wilting point (mm/mm), wilting point (mm/mm) and saturated hydraulic conductivity (mm/d) for the rootzone layer, and field capacity (mm/mm), saturated water content (mm/mm) and saturated hydraulic conductivity (mm/d) for the subzone layer. Physical parameter maps of soil with a 500 m spatial resolution were obtained from the Chinese soil dataset based on Harmonized World Soil Database version 1.1 (HWSD v1.1), provided by the National Cryosphere Desert Data Center [53]. Land use data were derived from the Globcover dataset with various crop coefficients; this dataset is available freely and can be obtained from the ESA website in the GeoTIFF format and the World Geodetic System 1984 (WGS 84) coordinate system at 10 arc-seconds (~300 m) of spatial resolution [54].
Glacier outline data were derived from the First and Second Chinese Glacier Inventories provided by the National Cryosphere Desert Data Center [51], and a dataset of glacier outlines over the Qilian Mountain area (1980–2015) was provided by the National Tibetan Plateau Data Center [55]. The First Chinese Glacier Inventory in the USR was based on aerial photographs taken in 1956, 1957 and 1966, and the results showed that the glacier area in the USR was about 473 km2, accounting for 4.32% of the USR area. LANDSAT TM/ETM + and ASTER images in 2006, 2007 and 2009 were used in the Second Chinese Glacier Inventory in the USR, which showed that the glacier area was about 409 km2, accounting for 3.73% of the USR area. The estimation of glacier thickness will be detailed in Section 2.3.
2.3. Estimation of Glacier Thickness
The ice thickness of a glacier is a fundamental prerequisite for the SPHY model, to simulate glacier retreat, ice redistribution and GR. In this study, Glacier Bed Topography model version 2 (GlabTop2) was used to estimate the ice thickness of the glacier. The ice thickness is inferred from the surface slope by parameterizing the basal shear stress (τ) as a function of the elevation range (ΔH) of each glacier [56,57,58]. A detailed formula explanation of GlabTop2 is depicted as follows:
where h (m) is the ice thickness of randomly picked DEM cells within the glacierized area, τ (kPa) is the basal shear stress parameterized with the glacier elevation range [59], f is the shape factor, set to 0.8 for mountain glaciers [60], g (9.81 m/s2) is the gravitational acceleration and α refers to the surface slope. The calculation of ice thickness is grid-based and requires a DEM and glacier mask as the inputs, and the ice thickness distribution for all glacier cells is interpolated from the ice thickness at random cells and from the ice thickness at the glacier margins, known to be zero. For more details of the GlabTop2 model, refer to the literature [56].
2.4. Description of SPHY Model
2.4.1. Model Principle
The model used in the simulation of runoff and runoff components in the USR was the SPHY model, a fully spatially distributed, high-resolution cryospheric–hydrological leaky-bucket type of model, applied on a cell-by-cell basis on flexible spatial and temporal scales, under various physiographical and hydroclimatic conditions [46,47]. The SPHY model is based on the PCRaster dynamic modeling framework [61,62,63] and describes the main terrestrial hydrologic processes in a conceptual way so that changes in storage and flux can be assessed over time and space [47].
The structure of the SPHY model can be described from two dimensions: horizontal and vertical. For the horizontal dimension, the SPHY model divides the land surface into a glacierized area and non-glacierized area. The snow and rain falling on the glacier will be taken into glacier processes, while the snow and rain falling on the non-glacierized area will be taken into snow processes and rainfall-runoff processes, respectively. For the vertical dimension, the soil column structure is similar to the VIC model [64,65], with two upper soil storage areas and a third for groundwater storage in the non-glacierized area, while there is only one for groundwater storage in the glacierized area. The horizontal and vertical structure means that the SPHY model can simulate the formation processes of different runoff components with flexible modules.
Depending on the modules being switched on in this study, four runoff components of GR, snow runoff, rainfall runoff, and baseflow were simulated. Rainfall runoff is the sum of surface runoff and lateral flow from the first soil layer, with the groundwater module used. After simulating the four runoff components, the total runoff is eventually calculated by adding together the four runoff components:
where TR, GR, SR, RR and BF are the total runoff, GR, snow runoff, rainfall runoff and baseflow, respectively.
2.4.2. Mass Conserving of Glacier
The SPHY model adopts two schemes to simulate the glacier processes based on the degree-day factor method. In the first scheme, the glaciers are implemented as a fixed mass generating glacier melt, where the snow and rainfall on the glacier are not taken into account. In the second scheme, the glacier process is simulated based on mass conservation with glacier retreat and ice redistribution, in which the snow and rainfall on the glacier are taken into account. In this study, the second scheme considering the glacier dynamics was used to simulate the glacier process.
The mass-conserving module of the glacier divides the glacier into several rectangular grids according to the spatial resolution of the SPHY model, and divides the glacier into an accumulation area and ablation area based on the equilibrium line altitude (ELA) of the gridded glacier (Figure 2). When the glacier mass loss of any grid in the ablation area exceeds the thickness of the grid glacier, the grid glacier will disappear, i.e., the glacier will retreat, and when the total mass balance of the whole glacier for a hydrological year is negative, the accumulated mass of the accumulation area will be equally redistributed to the retreated ablation area at the end of the hydrological year.
Depending on the temperature and a critical temperature threshold, precipitation can either fall as rainfall or as snow on the glacier [47]. The rainfall falling on the glacier will participate in the melting process of the glacier in the form of melting water, and the snow storage is updated with snow accumulation and/or snowmelt. The melting of glaciers contributes to the total runoff by means of a slow and fast component, i.e., (i) percolation to the groundwater layer that eventually becomes baseflow, and (ii) direct GR, respectively.
2.4.3. Model Calibration and Validation
The data source used for the First Chinese Glacier Inventory of the USR was aerial photographs taken in the 1950s and 1960s, which reflect the distribution of glaciers in the USR before the 1970s. So, in this study, the year 1971 was used as the starting year for the simulation of runoff and runoff components, which minimized the simulation errors resulting from inaccuracy of glacier inventory data. Meanwhile, this study set 1971 to 1990 as the calibration period and calibrated the SPHY model with the monthly runoff observed at the outlet of the USR to obtain the sensitivity parameters (Table 2) for the SPHY model, using these parameters for the runoff simulation from 1991 to 2020. Some of the sensitive parameters of the SPHY model could be obtained from the relevant literature. In addition to the calibration and validation of the simulated monthly runoff using the measured monthly runoff, this study also calibrated and validated the simulated glacier area of the SPHY model using the glacier area of the USR extracted from the First and Second Chinese Glacier Inventories and the multi-period Qilian Mountains Glacier Inventory. These parameters are not interrelated and have different effects on different hydrological processes, which allows them to be calibrated one by one. These parameters were calibrated using a stepwise approximation method, i.e., we first assigned a maximum value to a parameter, then a minimum value to that parameter, and then gradually decreased the range of values assigned until the best NSE, R2 and RE were obtained.
To evaluate the performance of the SPHY model for simulating monthly runoff, the Nash-Sutcliffe Efficiency Coefficient (NSE, Equation (4)), the coefficient of determination (R2, Equation (5)) and the relative error (RE, Equation (6)) were used in this study to evaluate the efficiencies of the calibration and validation. If the monthly NSE > 0.5 and monthly R2 > 0.6, the model performance was considered to be acceptable [67].
where n is the time-step of monthly observed runoff and monthly simulated runoff; Qobs,i (m3/s) and Qsim,i (m3/s) are the monthly observed runoff and monthly simulated runoff at time step i, respectively; obs,i (m3/s) and sim,i (m3/s) are the mean monthly observed runoff and mean monthly simulated runoff, respectively.
3. Results
3.1. Regional Climate Change and Runoff Evolution
The USR is a typical alpine and cold basin, which is extremely sensitive to climate change and global warming. Under climate change and global warming, the USR has experienced significant warming, while increases of precipitation and runoff have fluctuated in the past few decades. Figure 3 shows the anomalies of annual mean temperature, annual precipitation and annual runoff in the USR from 1961 to 2020 based on the statistics of observed temperature, precipitation and runoff. The mean annual temperature in the USR from 1961 to 2020 was approximately −1.62 °C, and the temperature had a significant increasing trend with an increase rate of 0.35 °C/10a. However, there was an abrupt change in the temperature in the USR. As shown in Figure 3a, the abrupt change in temperature occurred around 1996, with a mean annual temperature of −2.12 °C from 1961 to 1996 before the abrupt change and −0.88 °C from 1997 to 2020 after the abrupt change. The abrupt change of temperature in the USR was consistent with an abrupt change of temperature in Northwest China [33]. The annual precipitation in the USR also tended to increase with the increase of temperature; the increase rate of the precipitation from 1961 to 2020 was 14.1 mm/10a. The mean annual precipitation from 1961 to 2020 was approximately 235.2 mm, with a large fluctuation of annual precipitation and a standard deviation of 46.4 mm. The abrupt change of precipitation occurred later than that of temperature, with the abrupt change point at about 2000. The mean annual precipitation was 218.4 mm from 1961 to 2000 before the abrupt change and 268.8 mm from 2001 to 2020 after the abrupt change.
The mean annual runoff of the USR from 1961 to 2020 was 10.54 × 10⁸ m3, and the increase rate was 1.27 × 10⁸ m3/10a. The abrupt change in runoff was more pronounced than that of temperature and precipitation. As shown in Figure 3c, the abrupt change point of runoff occurred around 2000. The mean annual runoff from 1961–2000 before the abrupt change was 8.90 × 10⁸ m3/10a, while the mean annual runoff from 2001–2020 after the abrupt change was 13.83 × 10⁸ m3/10a. The abrupt change characteristics of runoff were more consistent with the abrupt change of precipitation.
The monthly variation of temperature and precipitation in the USR had characteristics of an alpine climate and temperate continental climate. The seasonality of temperature and precipitation were very obvious, with the maximum temperature in July and the minimum temperature in January, while 91.4% of precipitation was mainly concentrated in the warm season from May to September. The significant seasonal characteristics of temperature and precipitation in the USR led to significant seasonal characteristics of runoff as well, as shown in Figure 4c. The maximum monthly runoff occurred in July and August, and 68.4% of the annual runoff was concentrated in June to September. The maximum monthly precipitation of the USR was in July, while the maximum monthly runoff was in July and August. This phenomenon indicates that the runoff of the USR has a hysteresis to the precipitation, which reflects the water conservation capacity of the USR.
3.2. Performance of the SPHY Model
Using the same method as that with which many hydrologic models are calibrated and validated, this study calibrated and validated the SPHY model with the observed monthly runoff [46,61]. Due to the limitation of the time series of glacier inventory data, the simulation period of runoff and runoff components in the USR was set from 1971 to 2020.
Table 3 presents statistics on the evaluation metrics of the monthly runoff simulations for the calibration period from 1971 to 1990, the validation period from 1991 to 2020 and the entire simulation period from 1971 to 2020. As can be seen from Table 3, the NSE, R2 and RE for the calibration period were 0.89, 0.90 and −3.82%, respectively, while the NSE, R2 and RE for the validation period were 0.92, 0.92 and −11.51%, respectively. The NSE and R2 of the SPHY model for the validation period were higher than those for the calibration period, which may be related to improvements in the accuracy of temperature, precipitation and glacier inventories over the validation period with advancements of observation technology. However, the RE in the validation period was larger, which was due to the low simulation of monthly runoff in the cold season (Figure 5). The comparison of the simulated and observed monthly runoff for the entire simulation period in Figure 6 demonstrates that the simulated and observed monthly runoff were basically the same, with an NSE of 0.91, R2 of 0.92 and RE of −6.44% indicating that the performance of the SPHY model was acceptable.
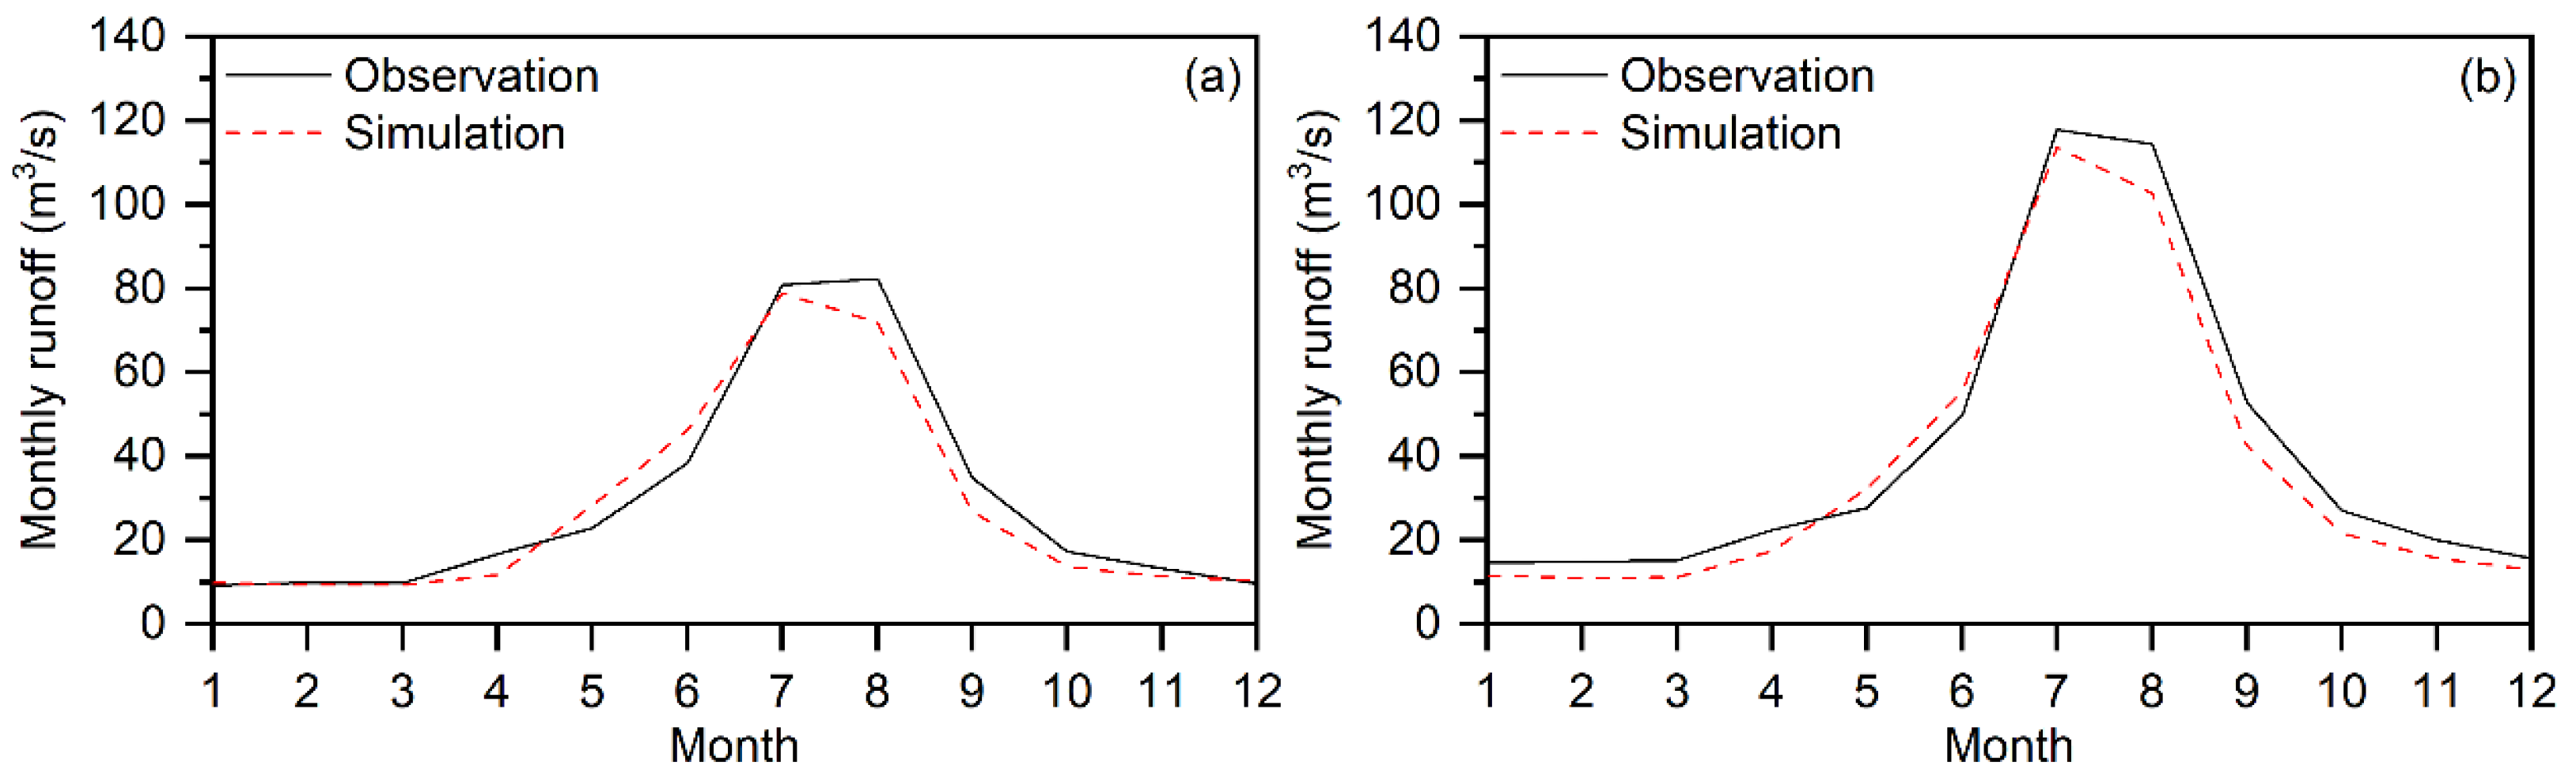
Figure 7 shows the monthly variation of the simulated and observed monthly runoff during the calibration and validation periods. It can be seen from Figure 7 that the SPHY model could simulate the monthly variation of runoff better in both the calibration and validation periods. However, the simulated runoff in August was lower than the measured runoff in both the calibration and validation periods, which may have been caused by an error of the SPHY model in simulating the recession process of the USR.
A comparison of simulated and observed annual runoff in the USR from 1971 to 2020 is shown in Figure 8. On the annual scale, the correlation between the simulated and observed annual runoff is good, with an R2 of 0.89, which is considered to be acceptable. It can be seen from Figure 8b that the variations of the simulated and observed annual runoff were basically the same. The increase rate of the simulated annual runoff was 1.3, which was slightly smaller than the increase rate of the observed annual runoff of 1.5. In general, it is acceptable to use the SPHY model to simulate runoff evolution in the USR, with the model accurately reflecting the characteristics of runoff evolution. With the help of the SPHY model, we can better understand the variation of runoff and runoff components in the USR, which can help with planning, management and utilization of water resources.
3.3. Glacier Shrinking in the USR
Glaciers are indicators of climate change and global warming. There is a significant increase in temperature in the USR under climate change and global warming, which directly leads to rapid melting and retreat of glaciers in the basin. Figure 9a compares the simulated glacier area of the SPHY model and the extracted (observed) glacier area of the USR from the First and Second Chinese Glacier Inventories and the multi-period Qilian Mountains Glacier Inventory. It can be seen that the simulated glacier area and the observed glacier area correlated well, with an R2 of 0.98, though the SPHY model more accurately simulated glacier shrinking in the USR.
Figure 9b shows the changes of glacier area in the USR from 1971 to 2020 simulated by the SPHY model. The glacier area in the USR decreased from 473 km2 in 1971 to 370 km2 in 2020, and retreated by 103 km2, with a retreat ratio of 21.8% and a retreat rate of 2.06 km2/a. With the increasing temperature in the USR, the glacier accelerated its melting and retreated, which directly led first to an increase and then a decrease of GR, weakening the recharge and regulating effect of the glaciers on river runoff. If the glaciers in the USR continue to retreat at a rate of 2.06 km2/a, the glacier area in the basin will shrink to 43% of that in the 1970s by the end of this century.
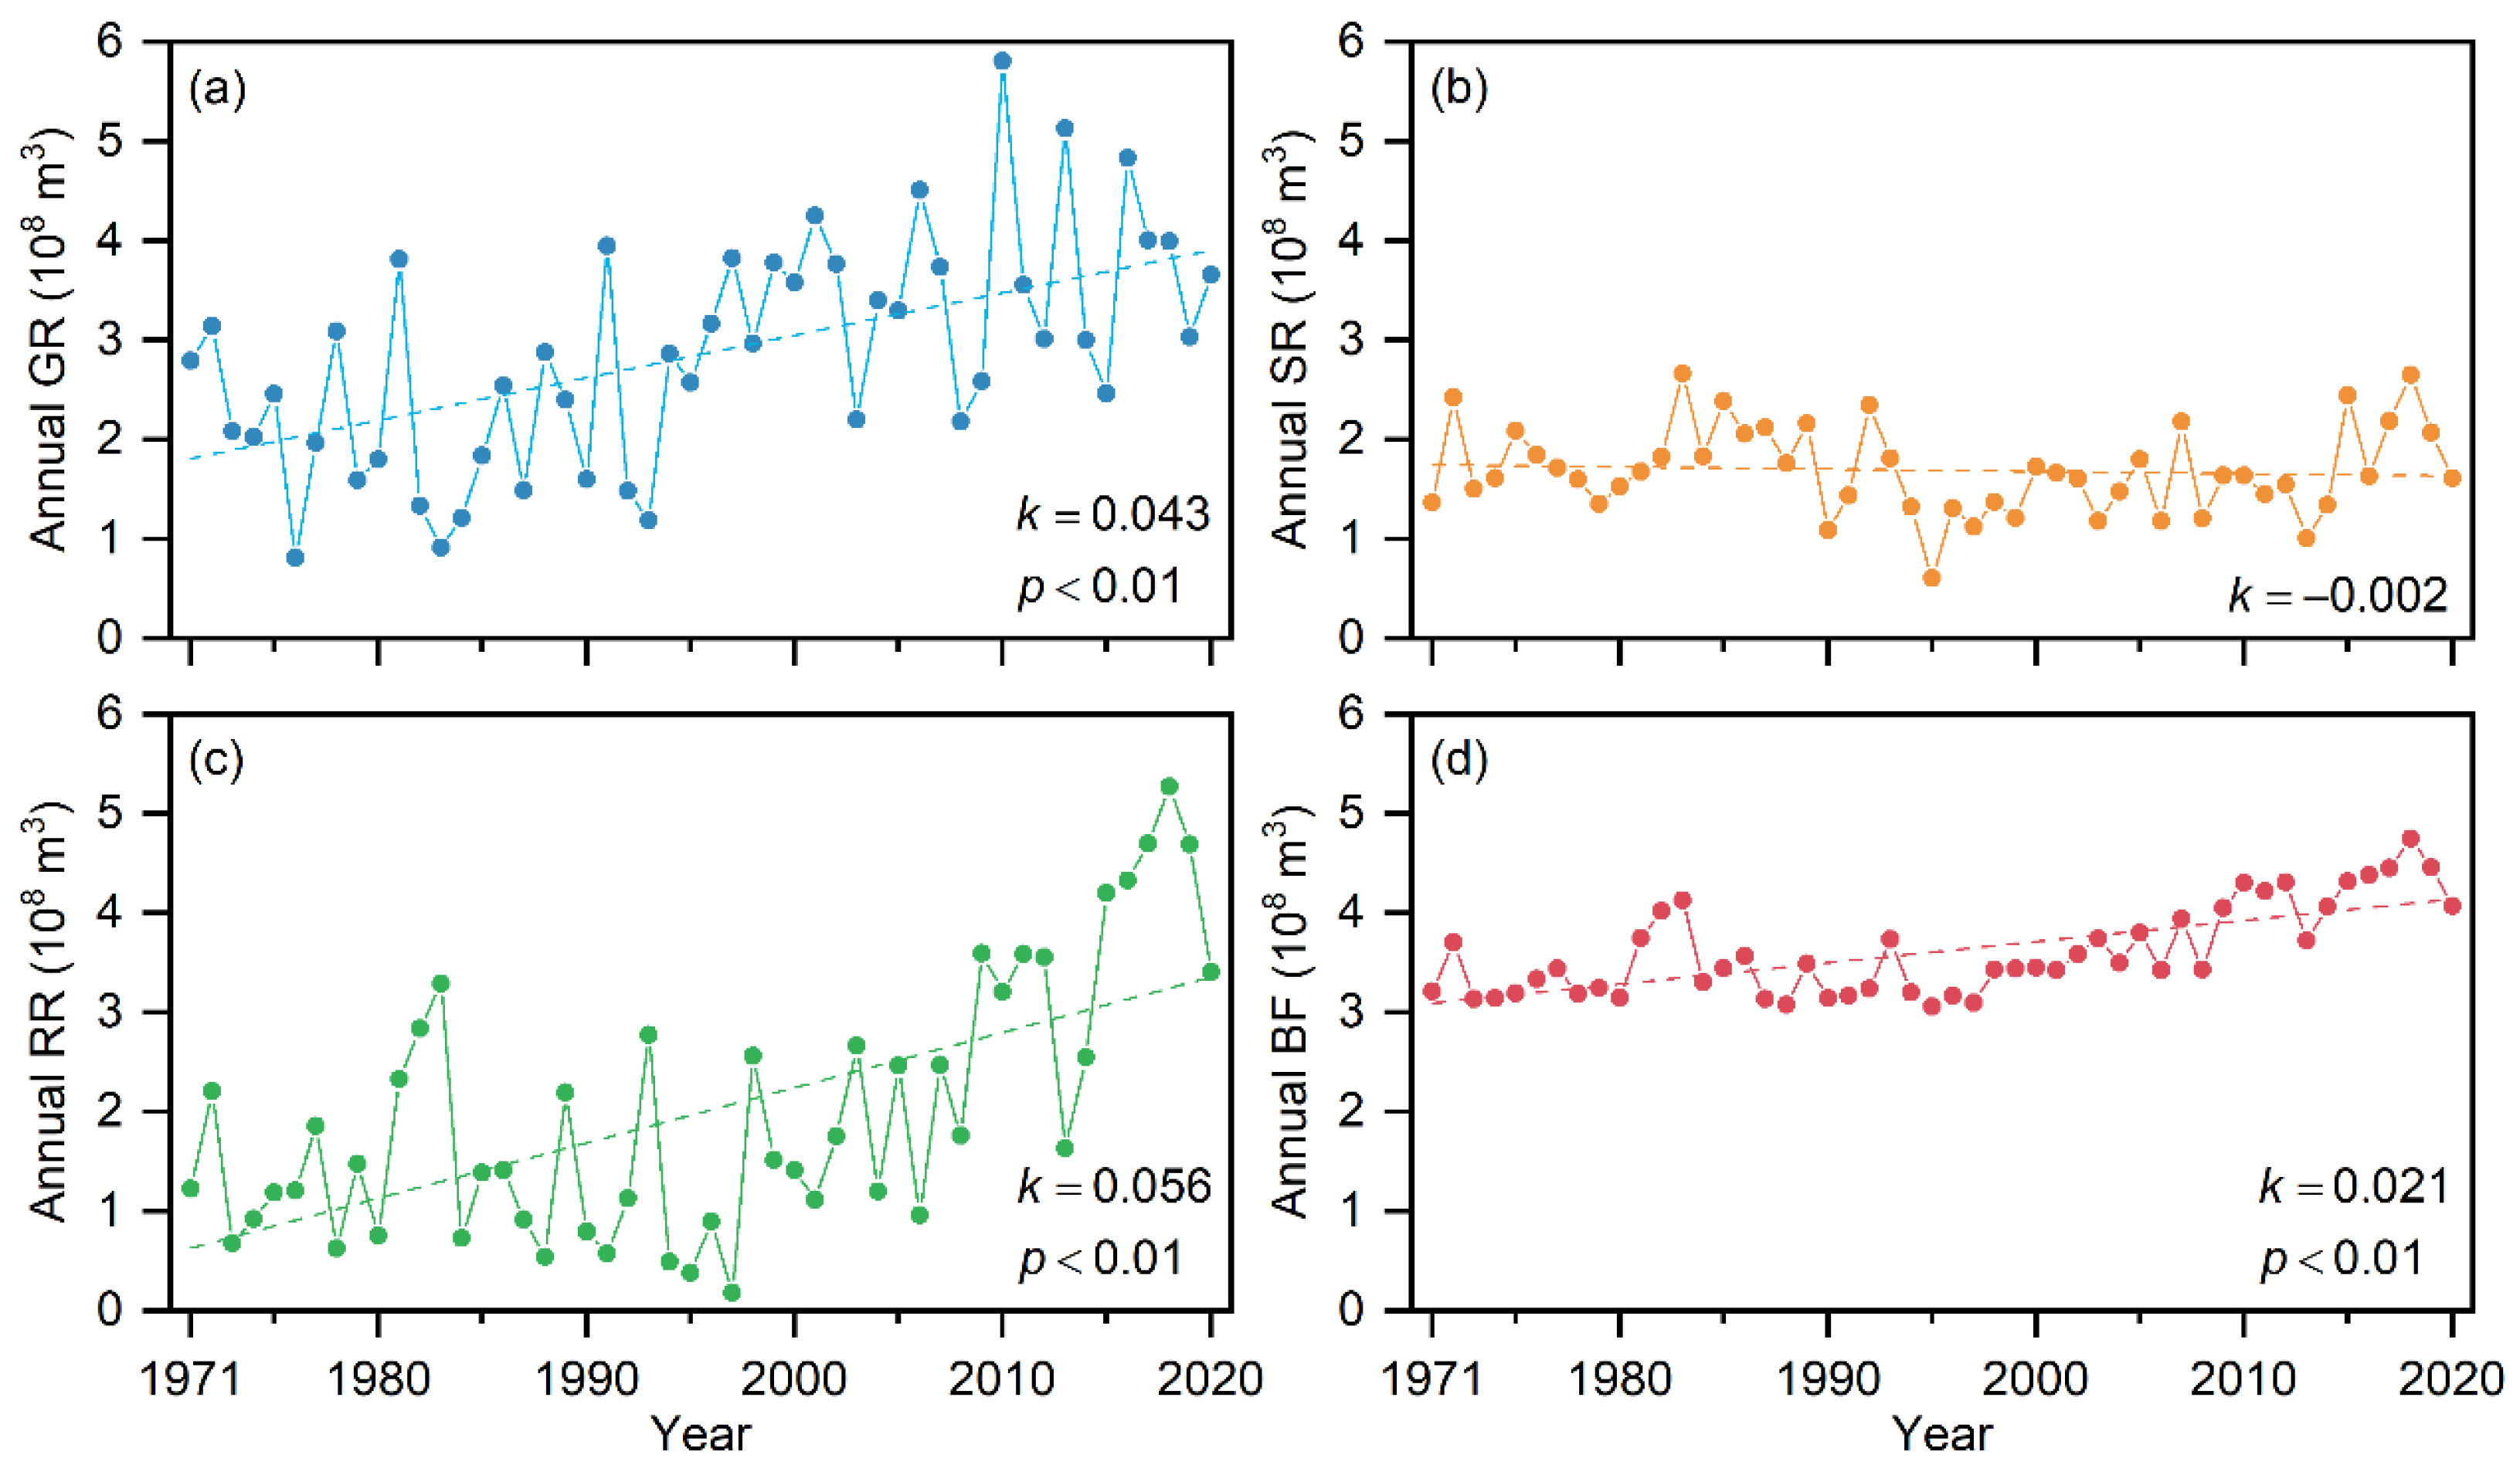
3.4. Annual Variations of Runoff Components
According to the structure of the SPHY model, the total runoff is composed of four runoff components: GR, snow runoff, rainfall runoff and baseflow. Among them, the baseflow is mainly generated by recharge of groundwater from rainfall and a small portion of glacier meltwater. The four runoff components have different responses to climate change and global warming, resulting in large interannual variation of each runoff component. The interannual variations of the four runoff components are shown in Figure 10. According to this, it can be seen that from 1971 to 2020, the GR, rainfall runoff and baseflow showed a significant increasing trend. The increase rate of rainfall runoff was the largest, followed by the GR and baseflow, with increase rates of 0.56 × 10⁸ m3/10a, 0.43 × 10⁸ m3/10a and 0.21 × 10⁸ m3/10a, respectively. The decreasing trend of snow runoff was not significant due to global warming, which led to a decrease in snowfall, resulting in a decrease in snow meltwater. In the last two decades, snowfall also increased to some extent due to the increase in precipitation. However, the trends of snow runoff, rainfall runoff and the interannual variation of precipitation in Figure 10 show that the increase in precipitation was more in the form of rainfall, and the increase in precipitation did not slow down the decrease in snowfall due to global warming.
It can also be seen from Figure 10 that there were large interannual fluctuations of GR and rainfall runoff, while the interannual fluctuations of the baseflow were very small, indicating that the baseflow was the most stable component of the total runoff. The large interannual fluctuations of GR were related to the interannual fluctuations of temperature and precipitation. In the years with more precipitation, the rainfall runoff was high and the precipitation had a certain inhibitory effect on glacier melting, while in the years with less precipitation, the high temperatures and increased glacier melting led to an increase of GR, which had a recharge and regulating effect on total runoff. Interannual fluctuations of rainfall runoff were directly related to precipitation due to large fluctuations in annual precipitation in Northwest China.
3.5. Monthly Variations of Runoff Components
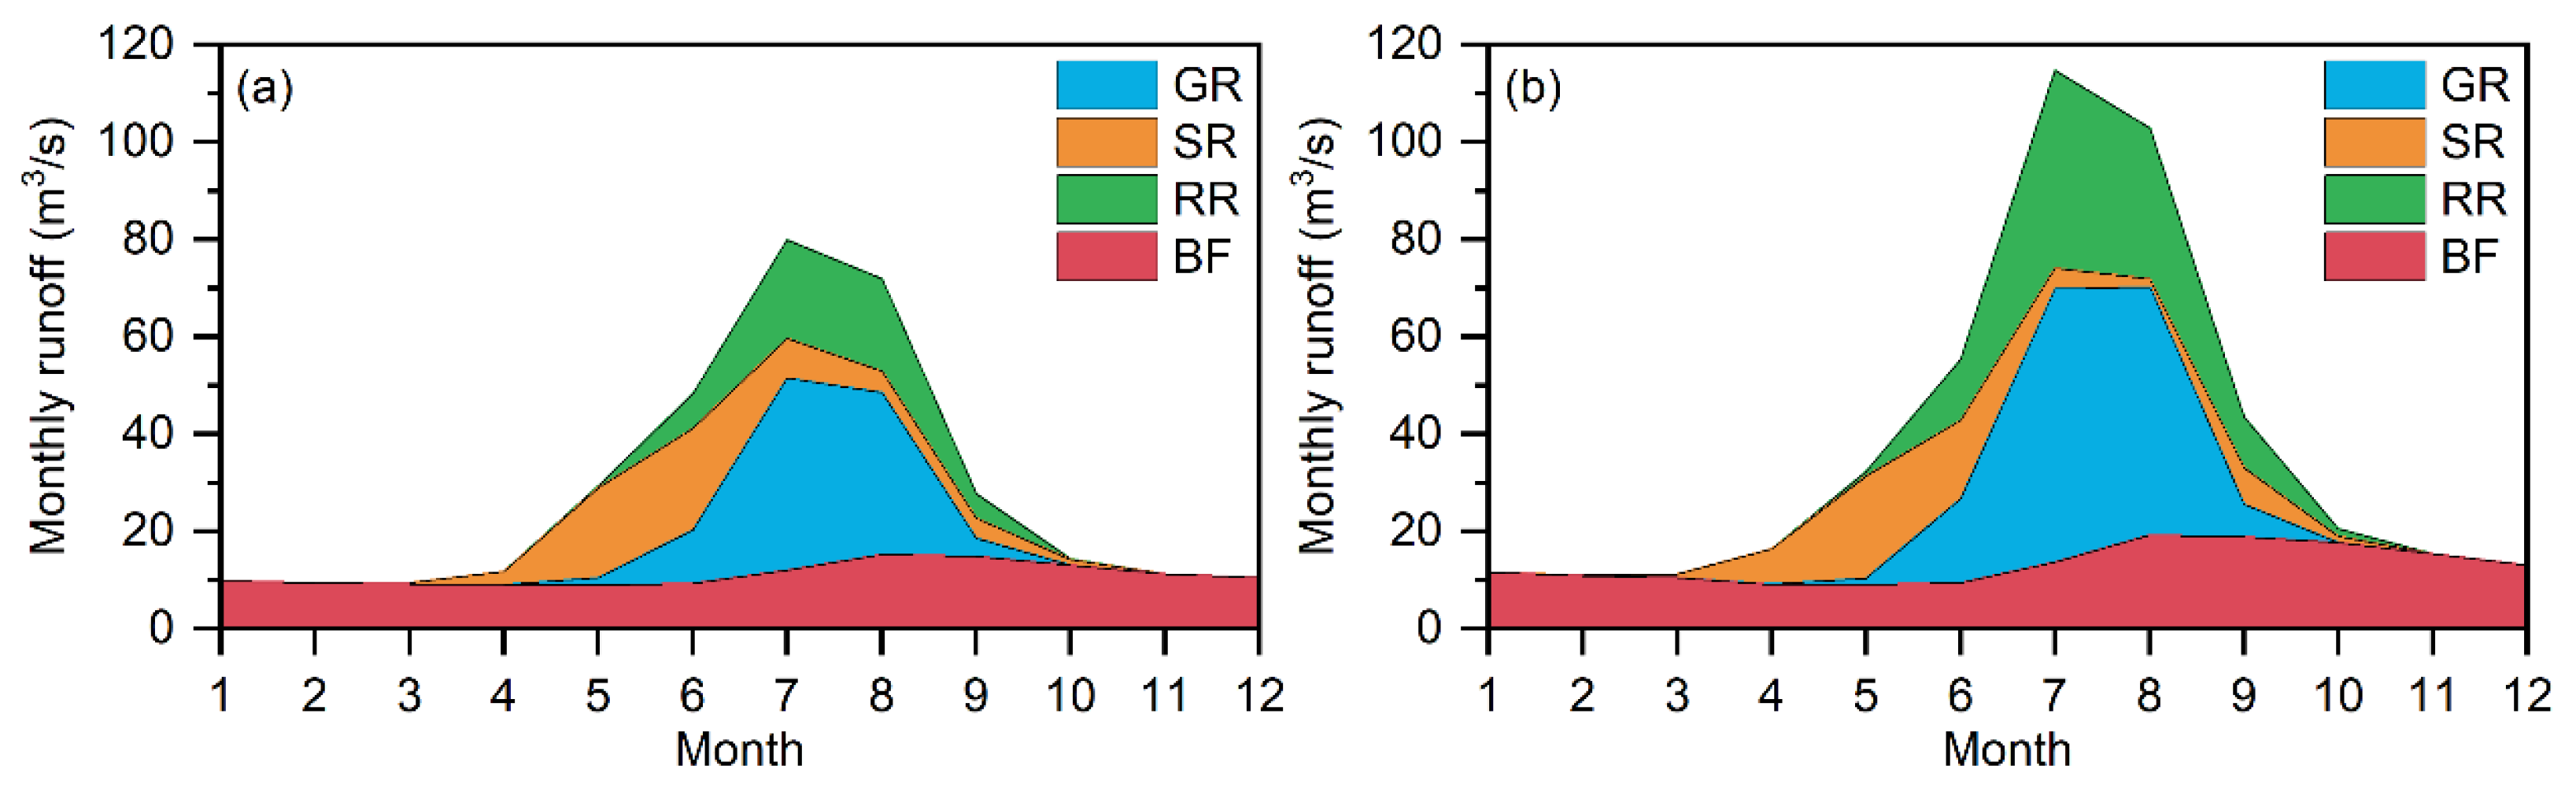
Due to significant seasonal characteristics of temperature and precipitation in the USR and different responses of the four runoff components to temperature and precipitation, the monthly variations among the four runoff components were very different. It can be seen from Figure 11 that GR mainly occurred from June to September, with peaks in July and August, which were consistent with the highest temperatures and amounts of precipitation in July and August. Snow runoff mainly occurred from April to June, with May being the largest month for snow runoff. This seasonal characteristic of snow runoff was strongly influenced by temperature changes during the year, with April being the time when the temperature gradually rose from below 0 °C in the USR, resulting in snow cover starting to melt during this time. Snow runoff could occur between March and October, which was related to the topography of the USR. The average elevation of the USR is close to 4000 m, and the absolute height difference between the mountains on both sides of the basin is large, so even in the highest temperature season, snowfall can still occur at high elevations, which is why snow runoff can occur from March to October. The seasonal characteristics of rainfall runoff were clearly consistent with the seasonal characteristics of precipitation, and the months with the highest precipitation were also the months with the highest rainfall runoff. The monthly variations of the baseflow were very smooth, and the baseflow only increased somewhat in the month of maximum rainfall runoff, which gives a good indication that the baseflow was the most basic and stable component of the inland rivers in Northwest China.
Figure 11a shows the monthly variations of the four runoff components before the abrupt change of total runoff from 1971 to 2000, and Figure 11b shows the monthly variations of the four runoff components after the abrupt change of total runoff from 2001 to 2020. It can be seen from these two figures that the monthly mean runoff in the warm season increased significantly after the abrupt change of total runoff, and the increase of the monthly mean runoff in the warm season was mainly caused by the increase of GR and rainfall runoff, which indicates that the increase of total runoff was mainly due to the increase of GR and rainfall runoff. It can also be seen from these two figures that the occurrence of snow runoff had a certain timing advance, indicating the objective fact of increasing temperature. That advance may have caused snowmelt floods, which can lead to flood disasters and personal and property damage.
4. Discussion
4.1. Contributions of Runoff Components to Total Runoff
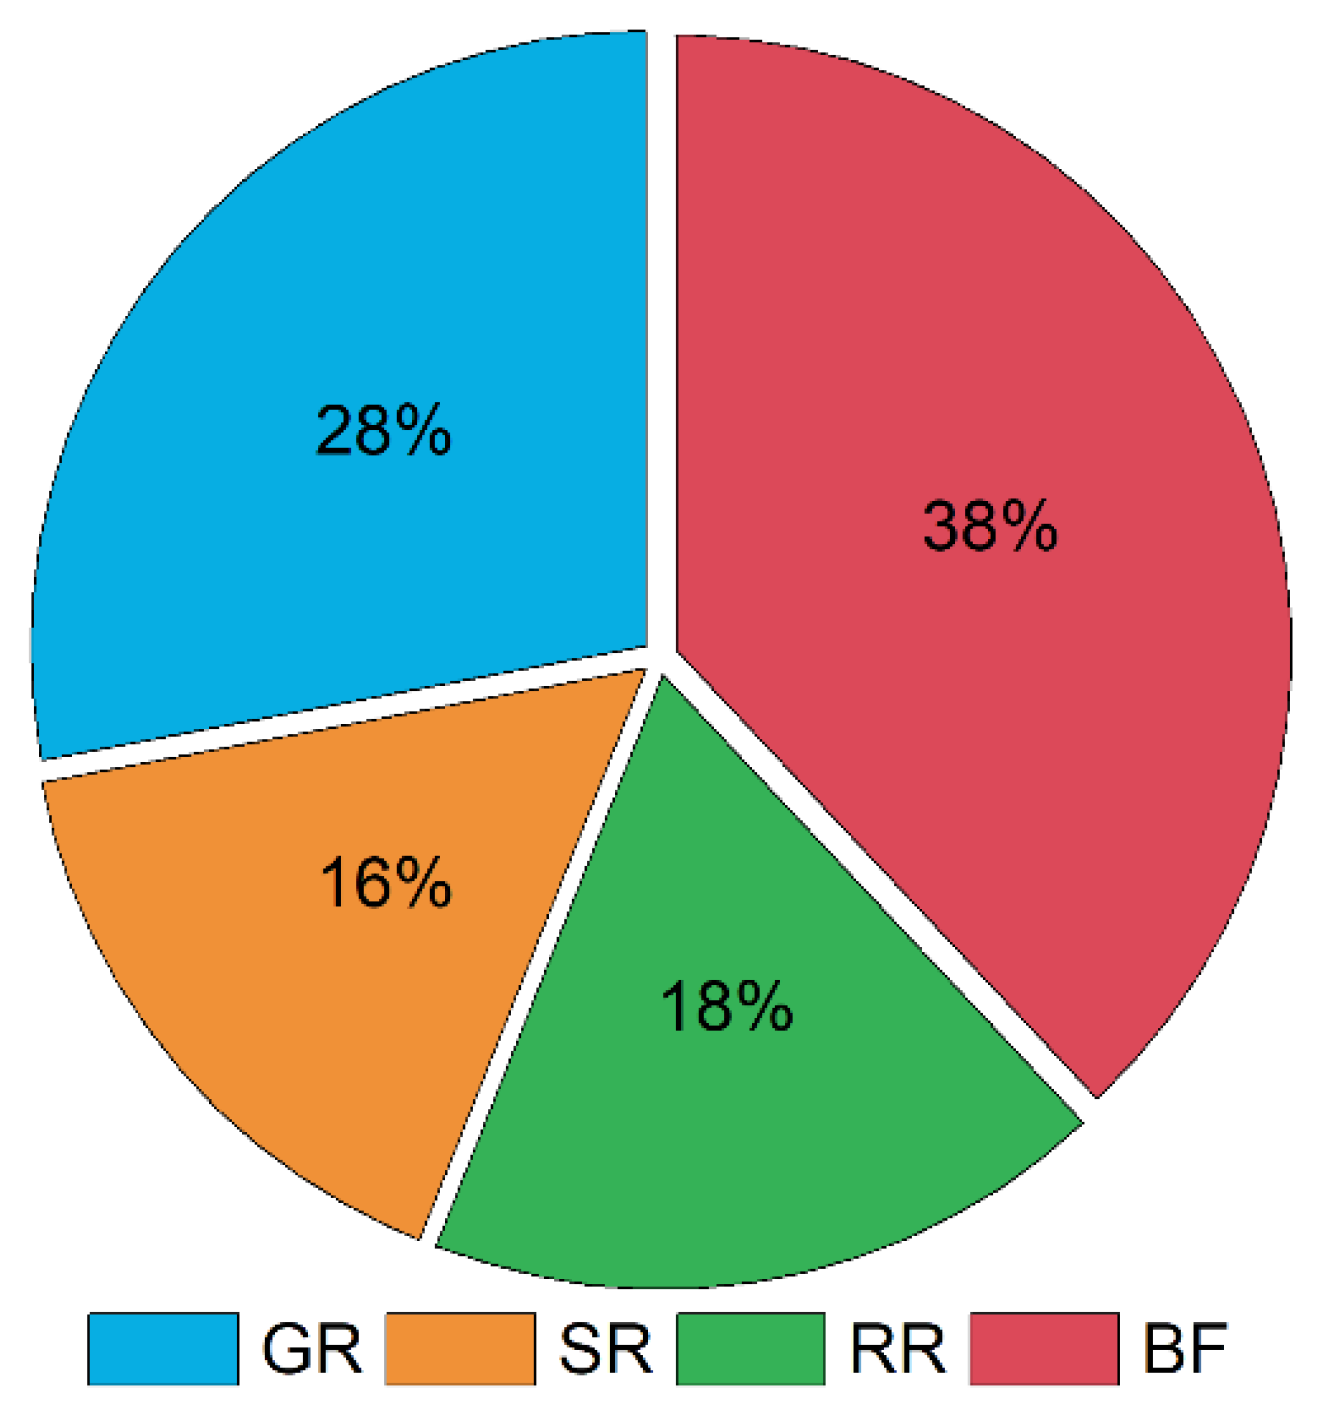
Figure 12 shows the mean annual contributions of the four runoff components to the total runoff from 1971 to 2020. It can be seen from Figure 12 that the GR, snow runoff, rainfall runoff and baseflow contributed 28%, 16%, 18% and 38% to the total runoff, respectively. Baseflow was the runoff component that contributed the most to total runoff, followed by GR, rainfall runoff and snow runoff.
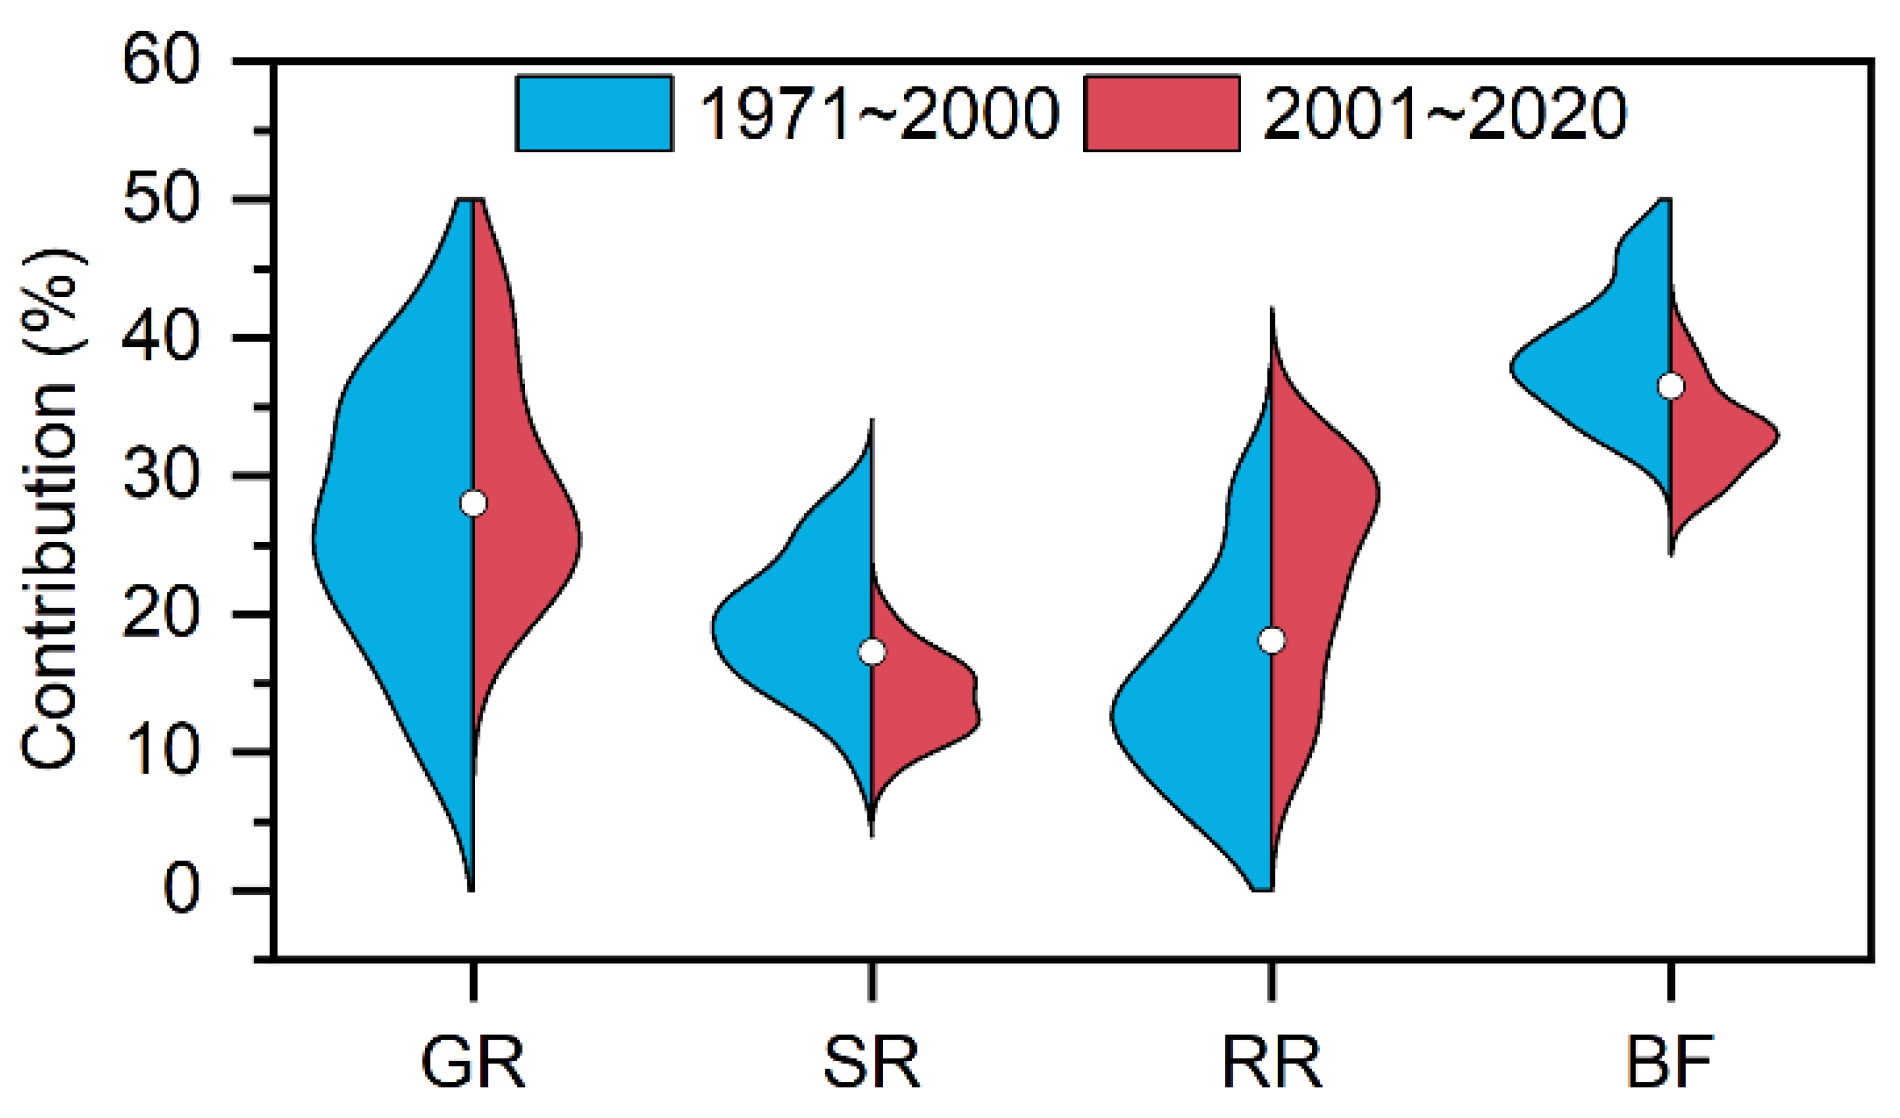
According to Figure 3c, a significant abrupt change in the runoff of the USR occurred at the end of the 20th century. Figure 13 compares the contributions of each runoff component to the total runoff in the two periods, i.e., before and after the abrupt change of runoff in the USR. As can be seen from Figure 13 that the contributions of snow runoff and the baseflow to the total runoff decreased significantly, while the contribution of rainfall runoff to the total runoff increased significantly. Meanwhile, the contribution of GR to the total runoff did not decrease significantly, but the contribution range of GR to the total runoff decreased significantly in the period after the abrupt change of runoff from 2001 to 2020. The total mean annual contribution of GR and snow runoff to the total runoff was 44%, indicating that the recharge of river runoff in the USR was not dominated by glaciers and snow cover meltwater, but the role of glaciers and snow cover meltwater in recharging and regulating river runoff was very important. In the years with less precipitation, the recharge and regulation of river runoff by glacier meltwater was prominent. Yet, with climate change and global warming leading to rapid melting and retreat of glaciers and reduction of snow cover, the recharge and regulation effect of river runoff by glaciers and snow cover meltwater is weakening.
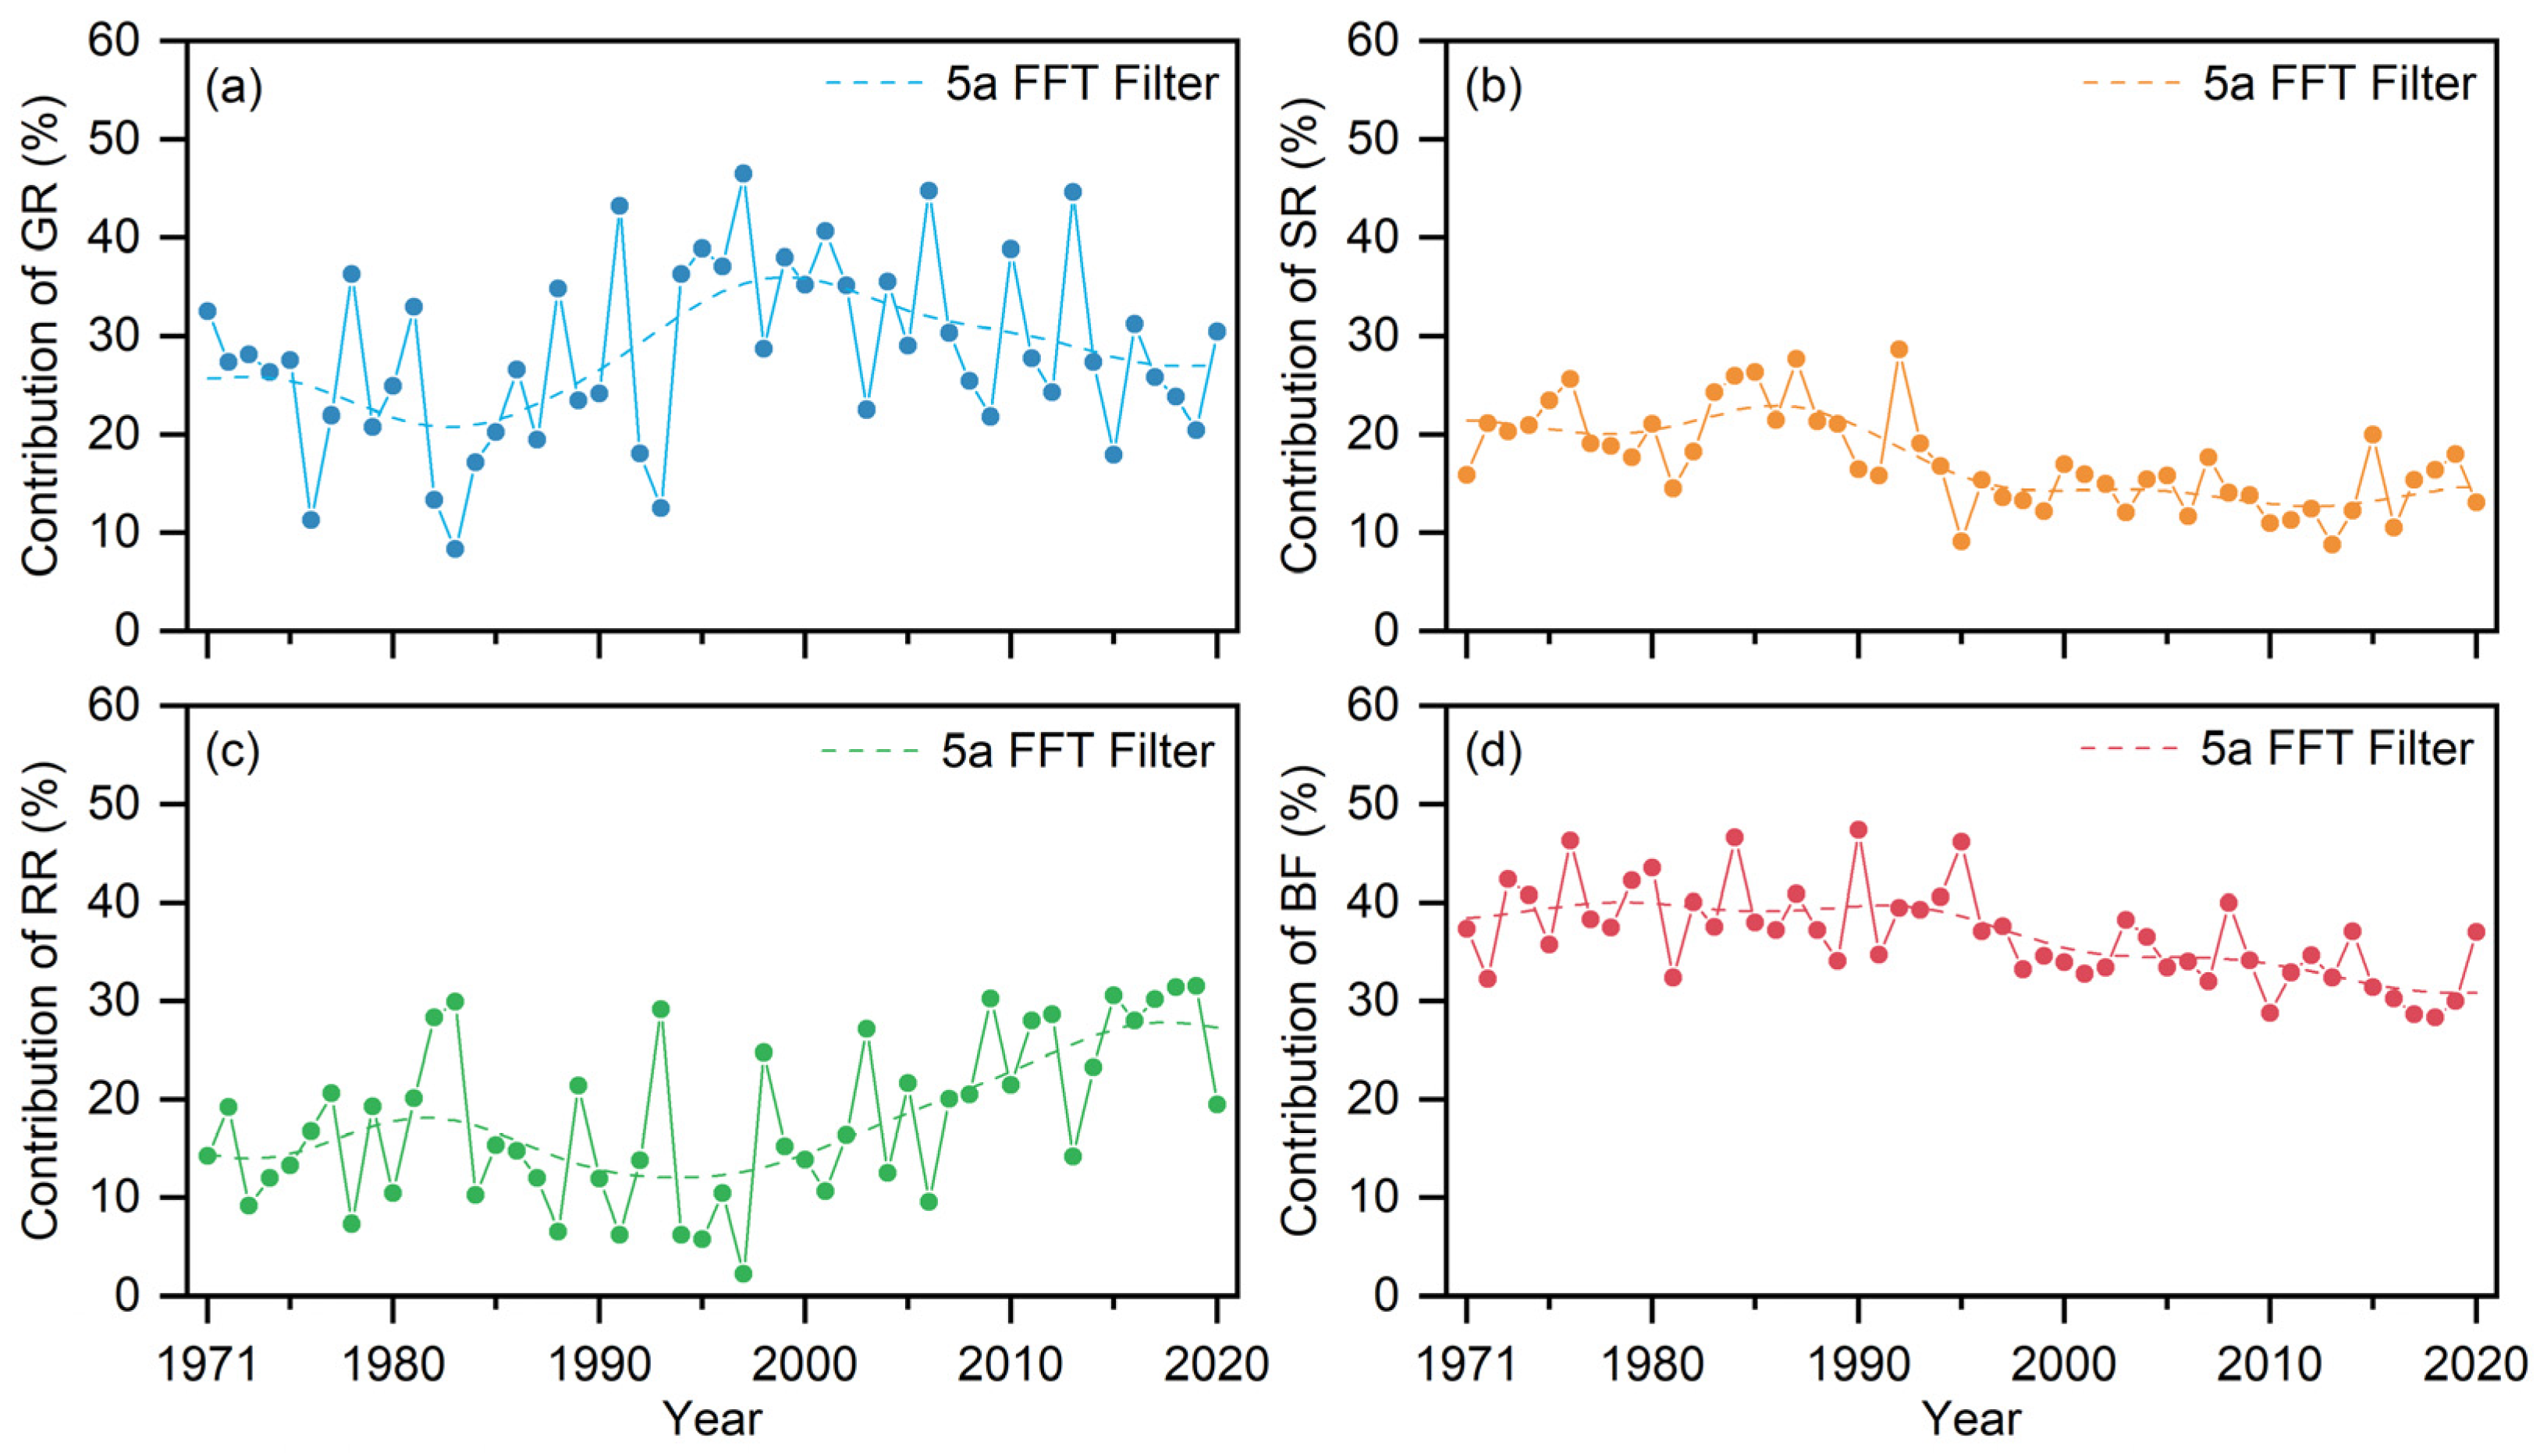
4.2. Increasing Total Runoff Dominated by Increasing Rainfall
Figure 14 shows the interannual variation of the contributions of the four runoff components to the total runoff and the five-year fast Fourier filter of the contributions. As can be seen from the figure, the contribution of GR to the total runoff showed a trend of first increasing and then decreasing. Although the interannual variation of snow runoff did not show a significant decreasing trend, the contribution of snow runoff to the total runoff did. The decreasing trend of the contribution of GR and snow runoff to the total runoff indicates that the alimentation of the glaciers and snow cover to the river runoff was decreasing. The five-year fast Fourier filter of the contribution of rainfall runoff indicates that the contribution of rainfall runoff to the total runoff showed a significant increasing trend, consistent with the increasing trend of rainfall runoff. Although it can be seen from Figure 10d that the baseflow had a significant increasing trend, the contribution of the baseflow to the total runoff showed a significant decreasing trend, meaning the trends of the baseflow and contribution of the baseflow were the opposite. Moreover, according to the structure of the SPHY model, the water source of the baseflow is mainly the percolation of rainfall and a small part made up by glacier meltwater, meaning an increase of the baseflow actually depends on an increase of rainfall. The decreasing trends of the contributions of GR, snow runoff and the baseflow to the total runoff, and the increasing trend of rainfall runoff in contributing to the total runoff fully indicate that with climate change and global warming, the rapid melting of glaciers in the past decades was an important reason for the increase in runoff. However, with the rapid retreat of glaciers, the contribution of GR to the increase in the total runoff peaked and gradually decreased, and the contribution of increased rainfall to the increase in the total runoff exceeded the contribution of GR to the increase in runoff. This means that a future increase in the total runoff will depend on an increase in rainfall in the USR.
However, increases in the rainfall in Northwest China are mainly dominated by short-duration heavy rainfall episodes, such as extreme rainfall and short-term convective rainfall, which may lead to disasters such as flooding and cause serious damage to flood control facilities. In addition, the rainfall in Northwest China occurs mostly in the form of pulses and can be extremely irregular. Years with less rainfall can lead to droughts, which in turn, can have important impacts on the lives of residents and industrial and agricultural production. In conclusion, under climate change and global warming, the role of glaciers and snow cover in recharging and regulating the runoff of the USR is weakening, and the influence of rainfall on the evolution of runoff is becoming increasingly prominent. However, due to the significant pulsating characteristics of regional rainfall, uncertainty around future changes in runoff is increasing, along with the impact of disasters such as floods and droughts. This creates new requirements for scientific planning, management and sustainable use of the limited water resources in Northwest China.
4.3. Uncertainty in the Simulation of Runoff and Runoff Components
Uncertainty in the simulation of runoff and runoff components in the USR using the SPHY model surrounds the accuracy of the forcing data obtained and the rationality of its reprocessing, along with the setting of the sensitivity parameters of the SPHY model.
The SPHY model is a spatially distributed model, and the temperature and precipitation data required to drive it are also distributed [47], whereas the observed temperature and precipitation are point-based, so the temperature and precipitation need to be interpolated across the basin. The interpolation method for temperature and precipitation is based on bilinear interpolation, which relies on the altitude gradient of temperature and precipitation, thus inevitably increasing the uncertainty in the simulation of runoff and runoff components. Improving the accuracy of the interpolation of temperature and precipitation presents a major difficulty in hydrological modeling, which should be pursued in future work to find more accurate methods for the interpolation of temperature and precipitation. However, studies based on temperature and precipitation observations show that the temperature and precipitation in the Qilian Mountains are altitude-dependent [71,72], with a linear increase in temperature and precipitation with increasing altitude [73], and the altitude-dependency of precipitation reduces the uncertainty of precipitation interpolation. Other data such as DEM and land use are widely used and recognized data with a high level of accuracy. The simulation of glacier thickness in this study was carried out using the Glabtop2 method, which is based on DEM and glacier outlines and has been used with a high accuracy in the simulation of glacier thickness in other regions [56,57,58]. The applicability of the Glabtop2 method in the Upper Shule River basin needs to be validated due to the lack of glacier thickness data, which is dependent on the detection of glacier thicknesses in this basin.
The parameters of the SPHY model are also one of the reasons for uncertainty. Some of the sensitive parameters can be obtained from the relevant literature, while others need to be calibrated. The sensitive parameters of the SPHY model listed in Table 2 actually have a large spatial variation, and the use of averages is a common way of setting parameters in hydrological simulations when a significant number of targeted parameters are not investigated. Previous studies have shown that there is a large spatial variability in the critical temperature of rain and snow separation in the Qilian Mountains [12]. The critical temperature of rain and snow separation fluctuates widely, and there is no relatively fixed value of the critical temperature. Similarly, the degree-day factor of glaciers and snow cover also has large spatial variability [74], and the spatial variability of parameters is difficult to obtain in the high mountainous basin, which increases the uncertainty of the simulation to a certain extent. Admittedly, the method of setting parameters involves great uncertainty, which should be investigated in future work with a large number of sensitive parameters to improve the accuracy of runoff and runoff component simulations.
In addition, monthly mean runoff data and multi-period glacier inventory data with measurement errors were used to validate the performance of the SPHY model, which may have increased the uncertainty surrounding the simulation. The runoff was measured at the National Hydrological Station of Changmabao and the measurement errors in runoff were within specified error limits. Although the construction of reservoirs near the outlet of the USR in recent years has affected the natural runoff involution, the impact on the total water resources is not significant, and the errors in measured runoff are considered acceptable. There is a slight difference in albedo between glaciers and snow cover, and the presence of snow inevitably affects glacier inventorying [17]. Therefore, this study corrected the glacier inventory data based on remote-sensing images without snow cover in non-glacierized areas in the ablation season, which ensured the accuracy of the validation data.
5. Conclusions
Based on the observed hydrometeorological data and multi-period glacier inventory data, the contributions of runoff components to the total runoff, along with the essential driving factors of runoff evolution, were quantified in the Upper Shule River. To do so, we used a distributed cryospheric-hydrological SPHY model coupled with a mass-conserving glacier module. Comparisons between the monthly observed and simulated runoff and between changes in the observed and simulated areas of glacier show indicated that the performance of the SPHY model was reasonable.
The glaciers continually retreated with the increasing of temperature, and the area of glacier coverage decreased from 473 km2 to 370 km2 between 1971 and 2020, a decrease of approximately 21.8%, with a reduction rate of 2.06 km2/a. The accelerated melting of glaciers led to an increasing trend of glacier runoff, and the increasing precipitation led to an increasing trend of rainfall runoff and baseflow. Meanwhile, the decreasing trend of snow runoff was not significant, indicating that the consistent increase in the total runoff was due to increasing rainfall and glacier melt over the past few decades.
The baseflow is the most stable and greatest contributing component to the total runoff, with a mean annual contribution of 38%, while the glacier runoff, rainfall runoff and snow runoff have greater interannual fluctuations, with mean annual contributions of 28%, 18% and 16% to total runoff, respectively. With decreasing glacier area and increasing temperature, the annual contribution of glacier runoff and snow runoff to the total runoff showed a decreasing trend.
Although the baseflow was increasing, the contribution of the baseflow to the total runoff was not increasing, indicating that the increases in the total runoff depended more on increases in rainfall runoff dominated by surface runoff and lateral flow in shallow soil. The role of glaciers in regulating and recharging runoff was diminishing, which indicates that the future evolution of runoff in the Upper Shule River will depend on rainfall with pulsating characteristics. This places new demands on the construction of flood- and drought-control facilities in the basin.
Author Contributions
J.W. set up the SPHY model, simulated the runoff, analyzed the data and wrote the manuscript; H.L. prepared the driven data and reviewed the manuscript; J.Z., S.T. and X.W. conducted data collection. All authors have read and agreed to the published version of the manuscript.
Funding
This study was supported by the National Natural Science Foundation of China (NSFC) (41771084, 41730751).
Institutional Review Board Statement
Not applicable.
Informed Consent Statement
Not applicable.
Data Availability Statement
Data sharing not applicable.
Acknowledgments
The authors would like to thank Qiudong Zhao and Jia Qin from the Key Laboratory of Ecohydrology of the Inland River Basin, Northwest Institute of Eco-Environment and Resources, Chinese Academy of Sciences, Lanzhou, China for their help with setting up the SPHY model and collecting data.
Conflicts of Interest
The authors declare no conflict of interest.
References
- Li, K.; Chen, R.; Liu, G. Cryosphere water resources simulation and service function evaluation in the Shiyang River Basin of Northwest China. Water 2021, 13, 114. [Google Scholar] [CrossRef]
- Ding, Y.; Ye, B.; Han, T.; Shen, Y.; Liu, S. Regional difference of annual precipitation and discharge variation over west China during the last 50 years. Sci. China Ser. D Earth Sci. 2007, 50, 936–945. [Google Scholar] [CrossRef]
- Yang, Z. Glacier meltwater runoff in China and its nourishment to river. Chin. Geogr. Sci. 1995, 5, 66–76. [Google Scholar] [CrossRef]
- Yang, Z. Mountain stream types in Northwest China. J. Glaciol. Geocryol. 1981, 3, 24–31. [Google Scholar]
- Yang, Z. Glacier water resources of Qilian Mountains. J. Glaciol. Geocryol. 1988, 10, 36–46. [Google Scholar]
- Chen, Y.; Yang, Q.; Luo, Y.; Shen, Y.; Pan, X.; Li, L.; Li, Z. Ponder on the issues of water resources in the arid region of northwest China. Arid. Land Geogr. 2012, 35, 1–9. [Google Scholar]
- Zhang, S.; Ye, B.; Liu, S.; Zhang, X.; Hagemann, S. A modified monthly degree-day model for evaluating glacier runoff changes in China. Part I: Model development. Hydrol. Process. 2012, 26, 1686–1696. [Google Scholar] [CrossRef]
- Piao, S.; Ciais, P.; Huang, Y.; Shen, Z.; Peng, S.; Li, J.; Zhou, L.; Liu, H.; Ma, Y.; Ding, Y.; et al. The impacts of climate change on water resources and agriculture in China. Nature 2010, 467, 43–51. [Google Scholar] [CrossRef] [PubMed]
- Liu, S.; Ding, Y.; Li, J.; Shangguan, D.; Zhang, Y. Glaciers in response to recent climate warming in western China. Quat. Sci. 2006, 26, 762–771. [Google Scholar]
- Cai, X.; Li, Z.; Zhang, H.; Xu, C. Vulnerability of glacier change in the Tianshan Mountains region of China. J. Geogr. Sci. 2021, 31, 1469–1489. [Google Scholar] [CrossRef]
- Duan, J.; Wang, L.; Ren, J.; Li, L. Progress in glacier variations in China and its sensitivity to climatic change during the past century. Prog. Geogr. 2009, 28, 231–237. [Google Scholar]
- Liu, G.; Chen, K.; Li, K. Glacial change and its hydrological response in three inland river basins in the Qilian Mountains, Western China. Water 2021, 13, 2213. [Google Scholar]
- Ding, Y.; Liu, S.; Li, J.; Shangguan, D. The retreat of glaciers in response to recent climate warming in western China. Ann. Glaciol. 2006, 43, 97–105. [Google Scholar] [CrossRef] [Green Version]
- Zhang, X.; Chen, R.; Liu, G.; Yang, Y.; Feng, T. Economic value of freshwater provisioning services of the cryosphere in the Urumqi River, Northwest China. Adv. Clim. Chang. Res. 2021, in press. Available online: https://www.sciencedirect.com/science/article/pii/S1674927821001295 (accessed on 20 November 2021). [CrossRef]
- Ding, Y.; Zhao, Q.; Wu, J.; Zhang, S. The future changes of Chinese cryospheric hydrology and their impacts on water security in arid areas. J. Glaciol. Geocryol. 2020, 42, 23–32. [Google Scholar]
- Sun, M.; Liu, S.; Yao, X.; Guo, W.; Xu, J. Glacier changes in the Qilian Mountains in the past half-century: Based on the revised first and second Chinese glacier inventory. J. Geogr. Sci. 2018, 28, 206–220. [Google Scholar] [CrossRef] [Green Version]
- Wang, H.; Jia, B.; Wang, Y.; Hou, S. Glacier changes in Shulenan Mountain from 1973 to 2018. J. Arid. Land Resour. Environ. 2021, 35, 60–65. [Google Scholar]
- Wang, Y.; Li, J.; Wu, L.; Guo, L.; Li, J. Using remote sensing images to monitor the glacier changes in Qilian Mountains during 1987–2018 and analyzing the impact factors. J. Glaciol. Geocryol. 2020, 42, 344–356. [Google Scholar]
- Shi, Y.; Cao, X.; Wu, J.; Filippo, G.; Dong, W. Simulation of the changes in snow cover over China under global warming by a high resolution RCM. J. Glaciol. Geocryol. 2010, 32, 215–222. [Google Scholar]
- Che, T.; Hao, X.; Dai, L.; Li, H.; Huang, X.; Xiao, L. Snow cover variation and its impacts over the Qinghai-Tibet Plateau. Bull. Chin. Acad. Sci. 2019, 34, 1247–1253. [Google Scholar]
- Liu, X.; Chen, R.; Liu, J.; Wang, X.; Wang, L. Effects of snow-depth change on spring runoff in cryosphere areas of China. Hydrol. Sci. J. 2019, 64, 789–797. [Google Scholar] [CrossRef]
- Ma, R. Characteristics and Causes of Snow Change in Arid Northwest China from 1979 to 2016; Northwest Normal University: Xi’an, China, 2018. [Google Scholar]
- Wang, C.; Zhang, S.; Li, K.; Zhang, F.; Yang, K. Change characteristics of precipitation in Northwest China from 1961 to 2018. Chin. J. Atmos. Sci. 2021, 45, 713–724. [Google Scholar]
- Li, M.; Sun, H.; Su, Z. Research progress in dry/wet climate variation in Northwest China. Geogr. Res. 2021, 40, 1180–1194. [Google Scholar]
- Wang, L.; Chen, R.; Han, C.; Wang, X.; Liu, G.; Song, Y.; Yang, Y.; Liu, J.; Liu, Z.; Liu, X.; et al. Change characteristics of precipitation and temperature in the Qilian Mountains and Hexi Oasis, Northwestern China. Environ. Earth Sci. 2019, 78, 284. [Google Scholar] [CrossRef]
- Li, B.; Chen, Y.; Shi, X.; Chen, Z.; Li, W. Temperature and precipitation changes in different environments in the arid region of northwest China. Theor. Appl. Climatol. 2012, 112, 589–596. [Google Scholar] [CrossRef]
- Wang, C.; Zhang, S.; Zhang, F.; Li, K.; Yang, K. On the increase of precipitation in the Northwestern China under the global warming. Adv. Earth Sci. 2021, 36, 980–989. [Google Scholar]
- Zhang, Q.; Zhu, B.; Yang, J.; Ma, P.; Liu, X.; Lu, G.; Wang, Y.; Yu, H.; Liu, W.; Wang, D. New characteristics about the climate humidification trendin Northwest China. Chin. Sci. Bull. 2021, 66, 3757–3771. [Google Scholar] [CrossRef]
- Ma, S.; Zhou, T.; Dai, A.; Han, Z. Observed changes in the distributions of daily precipitation frequency and amount over China from 1960 to 2013. J. Clim. 2015, 28, 6960–6978. [Google Scholar] [CrossRef]
- Chang, M.; Liu, B.; Martinez-Villalobos, C.; Ren, G.; Li, S.; Zhou, T. Changes in extreme precipitation accumulations during the warm season over Continental China. J. Clim. 2020, 33, 10799–10811. [Google Scholar] [CrossRef]
- Zhang, W.; Zhou, T. Significant increases in extreme precipitation and the associations with global warming over the global land Monsoon regions. J. Clim. 2019, 32, 8465–8488. [Google Scholar] [CrossRef]
- Zhou, B.; Xu, Y.; Wu, J.; Dong, S.; Shi, Y. Changes in temperature and precipitation extreme indices over China: Analysis of a high-resolution grid dataset. Int. J. Climatol. 2016, 36, 1051–1066. [Google Scholar] [CrossRef]
- Chen, R.; Shen, Y.; Mao, W.; Zhang, S.; Lv, H.; Liu, Y.; Liu, Z.; Fang, S.; Zhang, W.; Chen, C.; et al. Progress and issues on key technologies in forecasting of snowmelt flood disaster in arid areas Northwest China. Adv. Earth Sci. 2021, 36, 233–244. [Google Scholar]
- Li, H.; Zhao, Q.; Wu, J.; Ding, Y. Quantitative simulation of the runoff components and its variation characteristics in the upstream of the Shule River. J. Glaciol. Geocryol. 2019, 41, 907–917. [Google Scholar]
- Li, H. Study on the Change of Runoff and Its Components in an Alpine Watershed Based on SPHY Model; University of Chinese Academy of Sciences: Beijing, China, 2019. [Google Scholar]
- Zhou, J. Multi-Methods Study on Runoff Components in Alpine Regions: A Case Study of the Upper Reaches of Shule River Basin; University of Chinese Academy of Sciences: Beijing, China, 2019. [Google Scholar]
- Zhou, J.; Ding, Y.; Wu, J.; Liu, F.; Wang, S. Streamflow generation in semi-arid, glacier-covered, montane catchments in the upper shule river, Qilian Mountains, Northeastern Tibetan Plateau. Hydrol. Process. 2021, 35, e14276. [Google Scholar]
- Wu, J.-K.; Wu, X.-P.; Hou, D.-J.; Liu, S.-W.; Zhang, X.-Y.; Qin, X. Streamwater hydrograph separation in an alpine glacier area in the Qilian Mountains, northwestern China. Int. Assoc. Sci. Hydrol. Bull. 2016, 61, 2399–2410. [Google Scholar] [CrossRef] [Green Version]
- Zhou, J.; Wu, J.; Liu, S.; Zeng, G.; Qin, J.; Wang, X.; Zhao, Q. Hydrograph separation in the headwaters of the Shule river basin: Combining water chemistry and stable isotopes. Adv. Meteorol. 2015, 2015, 830306. [Google Scholar]
- Zhou, J.; Ding, Y.; Wu, J.; Wang, J. Applied comparison analysis of base-flow separation methods in upper Shule River basin. J. Glaciol. Geocryol. 2019, 41, 1456–1466. [Google Scholar]
- Zhang, Z.; Deng, S.; Zhao, Q.; Zhang, S.; Zhang, X. Projected glacier meltwater and river run-off changes in the Upper Reach of the Shule River Basin, north-eastern edge of the Tibetan Plateau. Hydrol. Process. 2019, 33, 1059–1074. [Google Scholar] [CrossRef]
- Zhao, Q.; Ding, Y.; Wang, J.; Gao, H.; Zhang, S.; Zhao, C.; Xu, J.; Han, H.; Shangguan, D. Projecting climate change impacts on hydrological processes on the Tibetan Plateau with model calibration against the glacier inventory data and observed streamflow. J. Hydrol. 2019, 573, 60–81. [Google Scholar] [CrossRef]
- Jin, Z.; Zhao, Q.; Qin, X.; Zhang, J.; Zhang, H.; Qin, J.; Qin, Y.; Li, H.; Chen, J.; Liu, Y.; et al. Quantifying the impact of landscape changes on hydrological variables in the alpine and cold region using hydrological model and remote sensing data. Hydrol. Process. 2021, 35, e14392. [Google Scholar] [CrossRef]
- He, X. Runoff Simulation and Response to Climate Change in the Upper Reaches of the HeiHe River Basin Based on SWAT Model; Northwest Normal University: Lanzhou, China, 2013. [Google Scholar]
- Zhang, G.; Xie, H.; Yao, T.; Li, H.; Duan, S. Quantitative water resources assessment of Qinghai Lake basin using Snowmelt Runoff Model (SRM). J. Hydrol. 2014, 519, 976–987. [Google Scholar] [CrossRef]
- Lutz, A.F.; Immerzeel, W.W.; Shrestha, A.B.; Bierkens, M.F.P. Consistent increase in High Asia’s runoff due to increasing glacier melt and precipitation. Nat. Clim. Chang. 2014, 4, 587–592. [Google Scholar] [CrossRef] [Green Version]
- Terink, W.; Lutz, A.F.; Simons, G.W.H.; Immerzeel, W.W.; Droogers, P. SPHY v2.0: Spatial processes in hydrology. Geosci. Model Dev. 2015, 8, 2009–2034. [Google Scholar] [CrossRef] [Green Version]
- Gao, M. The Analyzing and Simulating of Hydrologic Processes in the Upstream of the Shule River Basin; University of Chinese Academy of Sciences: Beijing, China, 2012. [Google Scholar]
- Liu, S.; Guo, W.; Xu, J. The Second Glacier Inventory Dataset of China (Version 1.0). National Cryosphere Desert Data Center. 2012. Available online: https://data.tpdc.ac.cn/en/data/f92a4346-a33f-497d-9470-2b357ccb4246/ (accessed on 20 November 2021).
- Liu, S.; Yao, X.; Wan, W.; Xu, J.; Shangguan, D.; Wei, J.; Bao, W.; Wu, L. The contemporary glaciers in China based on the Second Chinese Glacier Inventory. Acta Geogr. Sin. 2015, 70, 3–16. [Google Scholar]
- Guo, W.; Liu, S.; Xu, J.; Wu, L.; Shangguan, D.; Yao, X.; Wei, J.; Bao, W.; Yu, P.; Liu, Q.; et al. The second Chinese glacier inventory: Data, methods and results. J. Glaciol. 2017, 61, 357–372. [Google Scholar] [CrossRef] [Green Version]
- Ling, L.; Chao, L. The Chinese Soil Dataset Based on Harmonized World Soil Database Version (HWSD) (v1.1). National Cryosphere Desert Data Center. 2019. Available online: https://data.tpdc.ac.cn/zh-hans/data/611f7d50-b419-4d14-b4dd-4a944b141175/ (accessed on 20 November 2021).
- Radoux, J.; Bontemps, S.; Defourny, P.; Eric, V.; Lamarche, C.; Frédéric, A.; Mayaux, P.; Martin, B.; Brockmann, C.; Kirches, G.; et al. Consistent Global Land Cover Maps for Climate Modeling Communities: Current Achievements of the ESA’s Land Cover CCI. In Proceedings of the ESA Living Planet Symposium, Edinburgh, UK, 9–13 September 2013. [Google Scholar]
- Ouellet Dallaire, C.; Lehner, B.; Sayre, R.; Thieme, M. A multidisciplinary framework to derive global river reach classifications at high spatial resolution. Environ. Res. Lett. 2018, 14, 024003. [Google Scholar] [CrossRef]
- Li, J.; Wang, Y.; Li, J. Glacier Outlines over the Qilian Mountain Area (1980-2015). National Tibetan Plateau Data Center. 2019. Available online: https://data.tpdc.ac.cn/en/data/890e5ad3-56e4-427b-b4b4-f1b4cfc21b2c/ (accessed on 20 November 2021).
- Frey, H.; Machguth, H.; Huss, M.; Huggel, C.; Bajracharya, S.; Bolch, T.; Kulkarni, A.; Linsbauer, A.; Salzmann, N.; Stoffel, M. Estimating the volume of glaciers in the Himalayan–Karakoram region using different methods. Cryosphere 2014, 8, 2313–2333. [Google Scholar] [CrossRef] [Green Version]
- Zou, X.; Gao, H.; Zhang, Y.; Ma, N.; Wu, J.; Farhan, S.B. Quantifying ice storage in upper Indus river basin using ground-penetrating radar measurements and glacier bed topography model version 2. Hydrol. Process. 2021, 35, e14145. [Google Scholar] [CrossRef]
- Linsbauer, A.; Frey, H.; Haeberli, W.; Machguth, H.; Azam, M.F.; Allen, S. Modelling glacier-bed overdeepenings and possible future lakes for the glaciers in the Himalaya—Karakoram region. Ann. Glaciol. 2016, 57, 119–130. [Google Scholar] [CrossRef] [Green Version]
- Haeberli, W.; Hoelzle, M. Application of inventory data for estimating characteristics of and regional climate-change effects on mountain glaciers: A pilot study with the European Alps. Ann. Glaciol. 1995, 21, 206–212. [Google Scholar] [CrossRef] [Green Version]
- Paterson, W. The Physics of Glaciers, 3rd ed.; Pergamon Press: Oxford, UK, 1994. [Google Scholar]
- Karssenberg, D. The value of environmental modeling languages for building distributed hydrological models. Hydrol. Process. 2002, 16, 2751–2766. [Google Scholar] [CrossRef] [Green Version]
- Karssenberg, D.; Schmitz, O.; Salamon, P.; de Jong, K.; Bierkens, M.F.P. A software framework for construction of process-based stochastic spatio-temporal models nd data assimilation. Environ. Model. Softw. 2010, 25, 489–502. [Google Scholar] [CrossRef] [Green Version]
- Schmitz, O.; Karssenberg, D.; de Jong, K.; Kok, J.-L.; de Jong, S. Map algebra and model algebra for integrated model building. Environ. Model. Softw. 2013, 48, 113–128. [Google Scholar] [CrossRef] [Green Version]
- Liang, X.; Wood, E.F.; Lettenmaier, D.P. Surface soil moisture parameterization of the VIC-2L model: Evaluation and modification. Glob. Planet. Chang. 1996, 13, 195–206. [Google Scholar] [CrossRef]
- Liang, X.; Lettenmaier, D.P.; Wood, E.; Burges, S.J. A simple hydrologically based model of land surface water and energy fluxes for general circulation models. J. Geophys. Res. Atmos. 1994, 99, 14415–14428. [Google Scholar] [CrossRef]
- Terink, W.; Lutz, A.F.; Immerzeel, W.; Nepal, S.; Khanal, S.; Shrestha, A.B. Improvement of the SPHY model glacier module and its application in the Tamakoshi River Basin, Nepal. In Proceedings of the Agu Fall Meeting, San Francisco, CA, USA, 12–16 December 2016. [Google Scholar]
- Santhi, C.; Arnold, J.; Williams, J.R.; Dugas, W.A.; Srinivasan, R.; Hauck, L.M. Validation of the SWAT model on a large river basin with point and nonpoint sources. JAWRA J. Am. Water Resour. Assoc. 2001, 37, 1169–1188. [Google Scholar] [CrossRef]
- Chen, R.; Kang, E.; Ding, Y. Some knowledge on and parameters of China’s alpine hydrology. Adv. Water Sci. 2014, 25, 307–317. [Google Scholar]
- Zhang, Y.; Liu, S.; Ding, Y. Spatial variation of degree-day factors on the observed glaciers in Western China. Acta Geogr. Sin. 2006, 61, 89–98. [Google Scholar] [CrossRef] [Green Version]
- Seibert, J. Estimation of parameter uncertainty in the HBV model. Hydrol. Res. 1997, 28, 247–262. [Google Scholar] [CrossRef]
- Chen, R.; Liu, J.; Kang, E.; Yang, Y.; Han, C.; Liu, Z.; Song, Y.; Qing, W.; Zhu, P. Precipitation measurement intercomparison in the Qilian Mountains, north-eastern Tibetan Plateau. Cryosphere 2015, 9, 1995–2008. [Google Scholar] [CrossRef] [Green Version]
- Wang, L.; Chen, R.; Song, Y.; Yang, Y.; Liu, J.; Han, C.; Liu, Z. Precipitation–altitude relationships on different timescales and at different precipitation magnitudes in the Qilian Mountains. Theor. Appl. Climatol. 2017, 134, 875–884. [Google Scholar] [CrossRef]
- Wang, L. Observation and Experimental Study on the Spatial-Temporal Variation of Precipitation in the Qilian Mountains; University of Chinese Academy of Sciences: Beijing, China, 2020. [Google Scholar]
- Zhang, Y.; Liu, S.; Ding, Y. Observed degree-day factors and their spatial variation on glaciers in western China. Ann. Glaciol. 2017, 43, 301–306. [Google Scholar] [CrossRef] [Green Version]
Figure 1.
Overview of the Upper Shule River (USR) and the locations of hydrological and meteorological stations.
Figure 1.
Overview of the Upper Shule River (USR) and the locations of hydrological and meteorological stations.
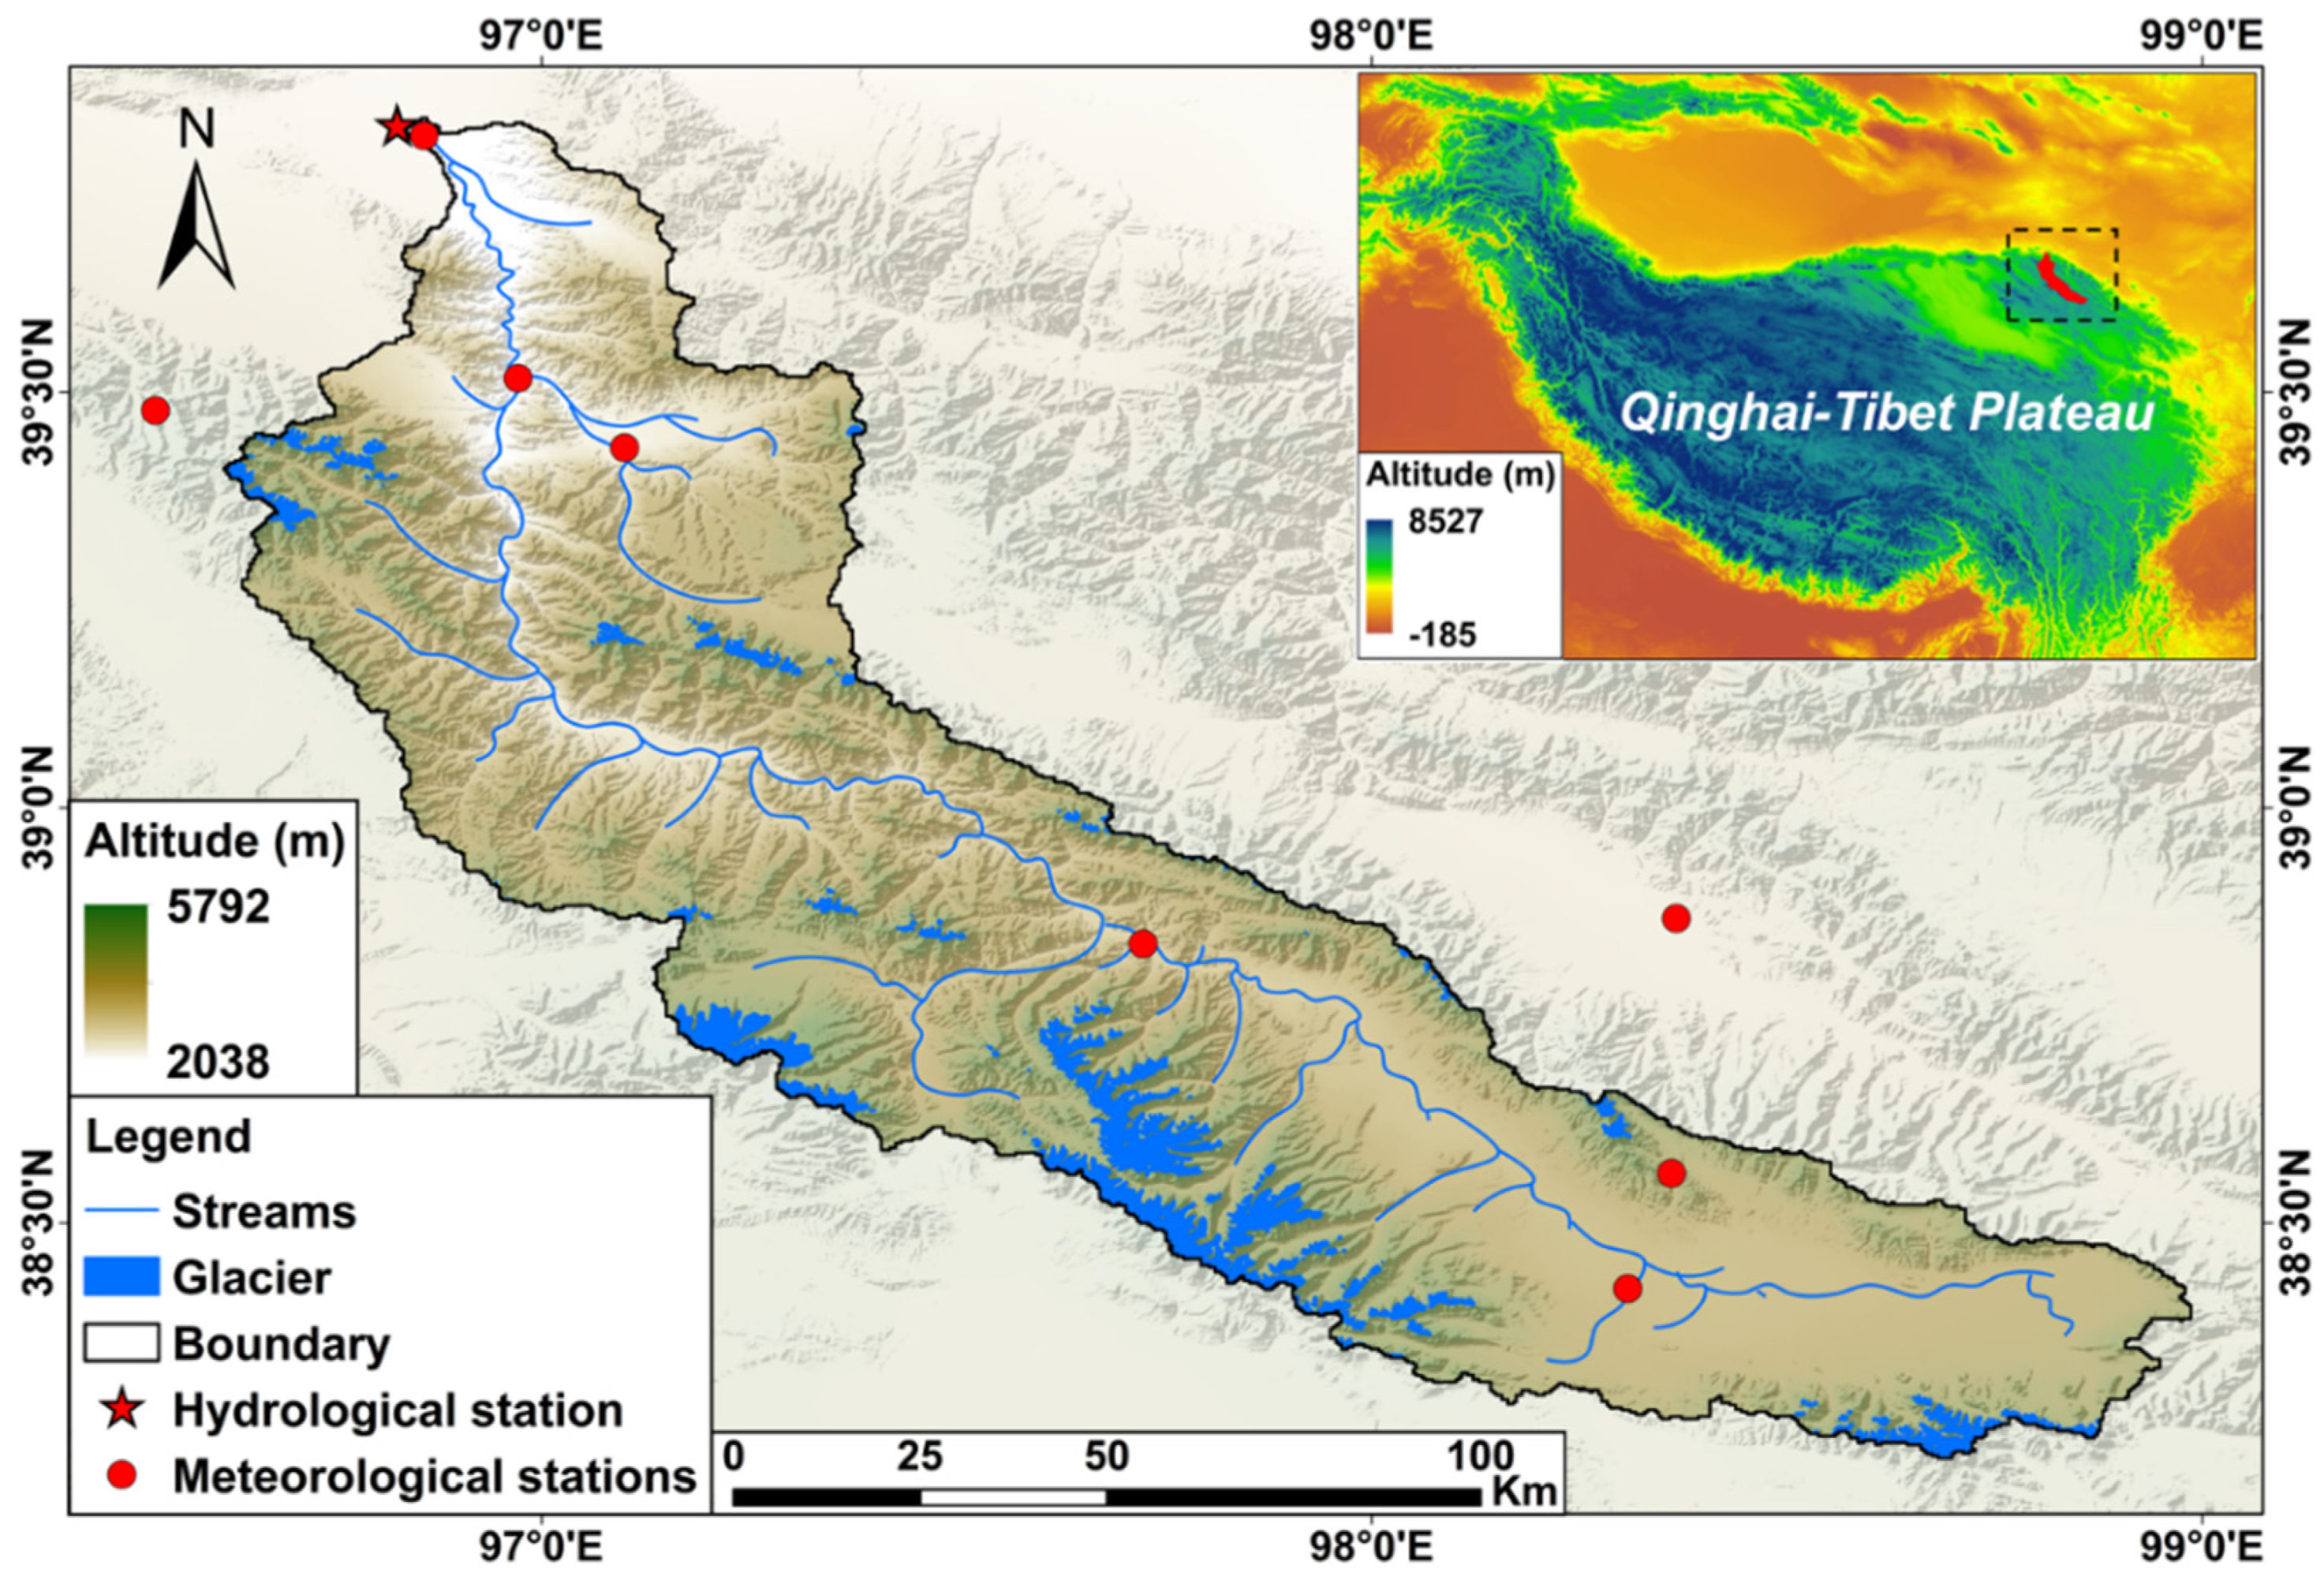
Figure 2.
Division of accumulation area and ablation area of glacier. Figure cited from [66].
Figure 2.
Division of accumulation area and ablation area of glacier. Figure cited from [66].
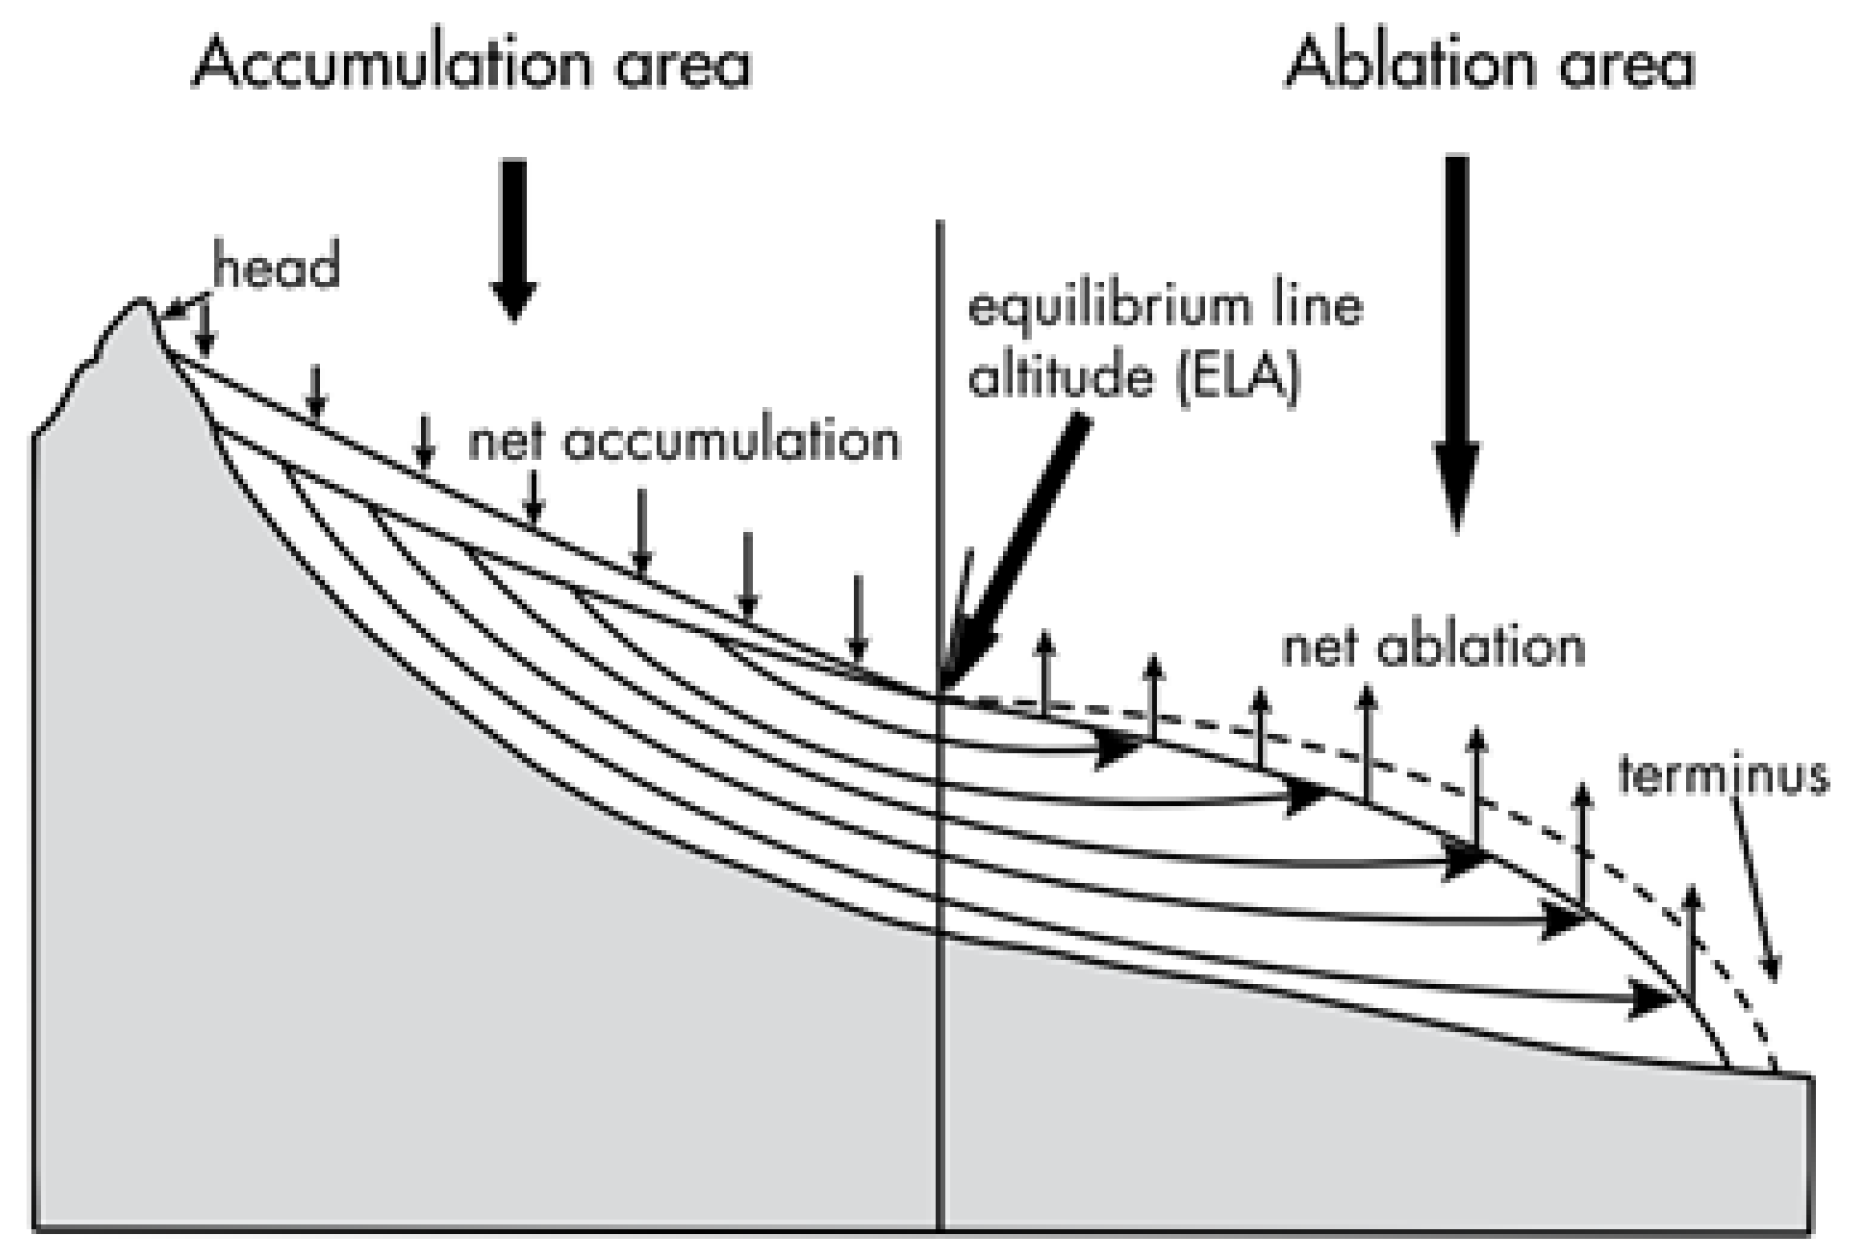
Figure 3.
Interannual variation of annual mean temperature, annual precipitation and annual runoff in the USR from 1961 to 2020. (a) Temperature anomaly; (b) Percentage of precipitation anomaly; (c) Percentage of runoff anomaly.
Figure 3.
Interannual variation of annual mean temperature, annual precipitation and annual runoff in the USR from 1961 to 2020. (a) Temperature anomaly; (b) Percentage of precipitation anomaly; (c) Percentage of runoff anomaly.
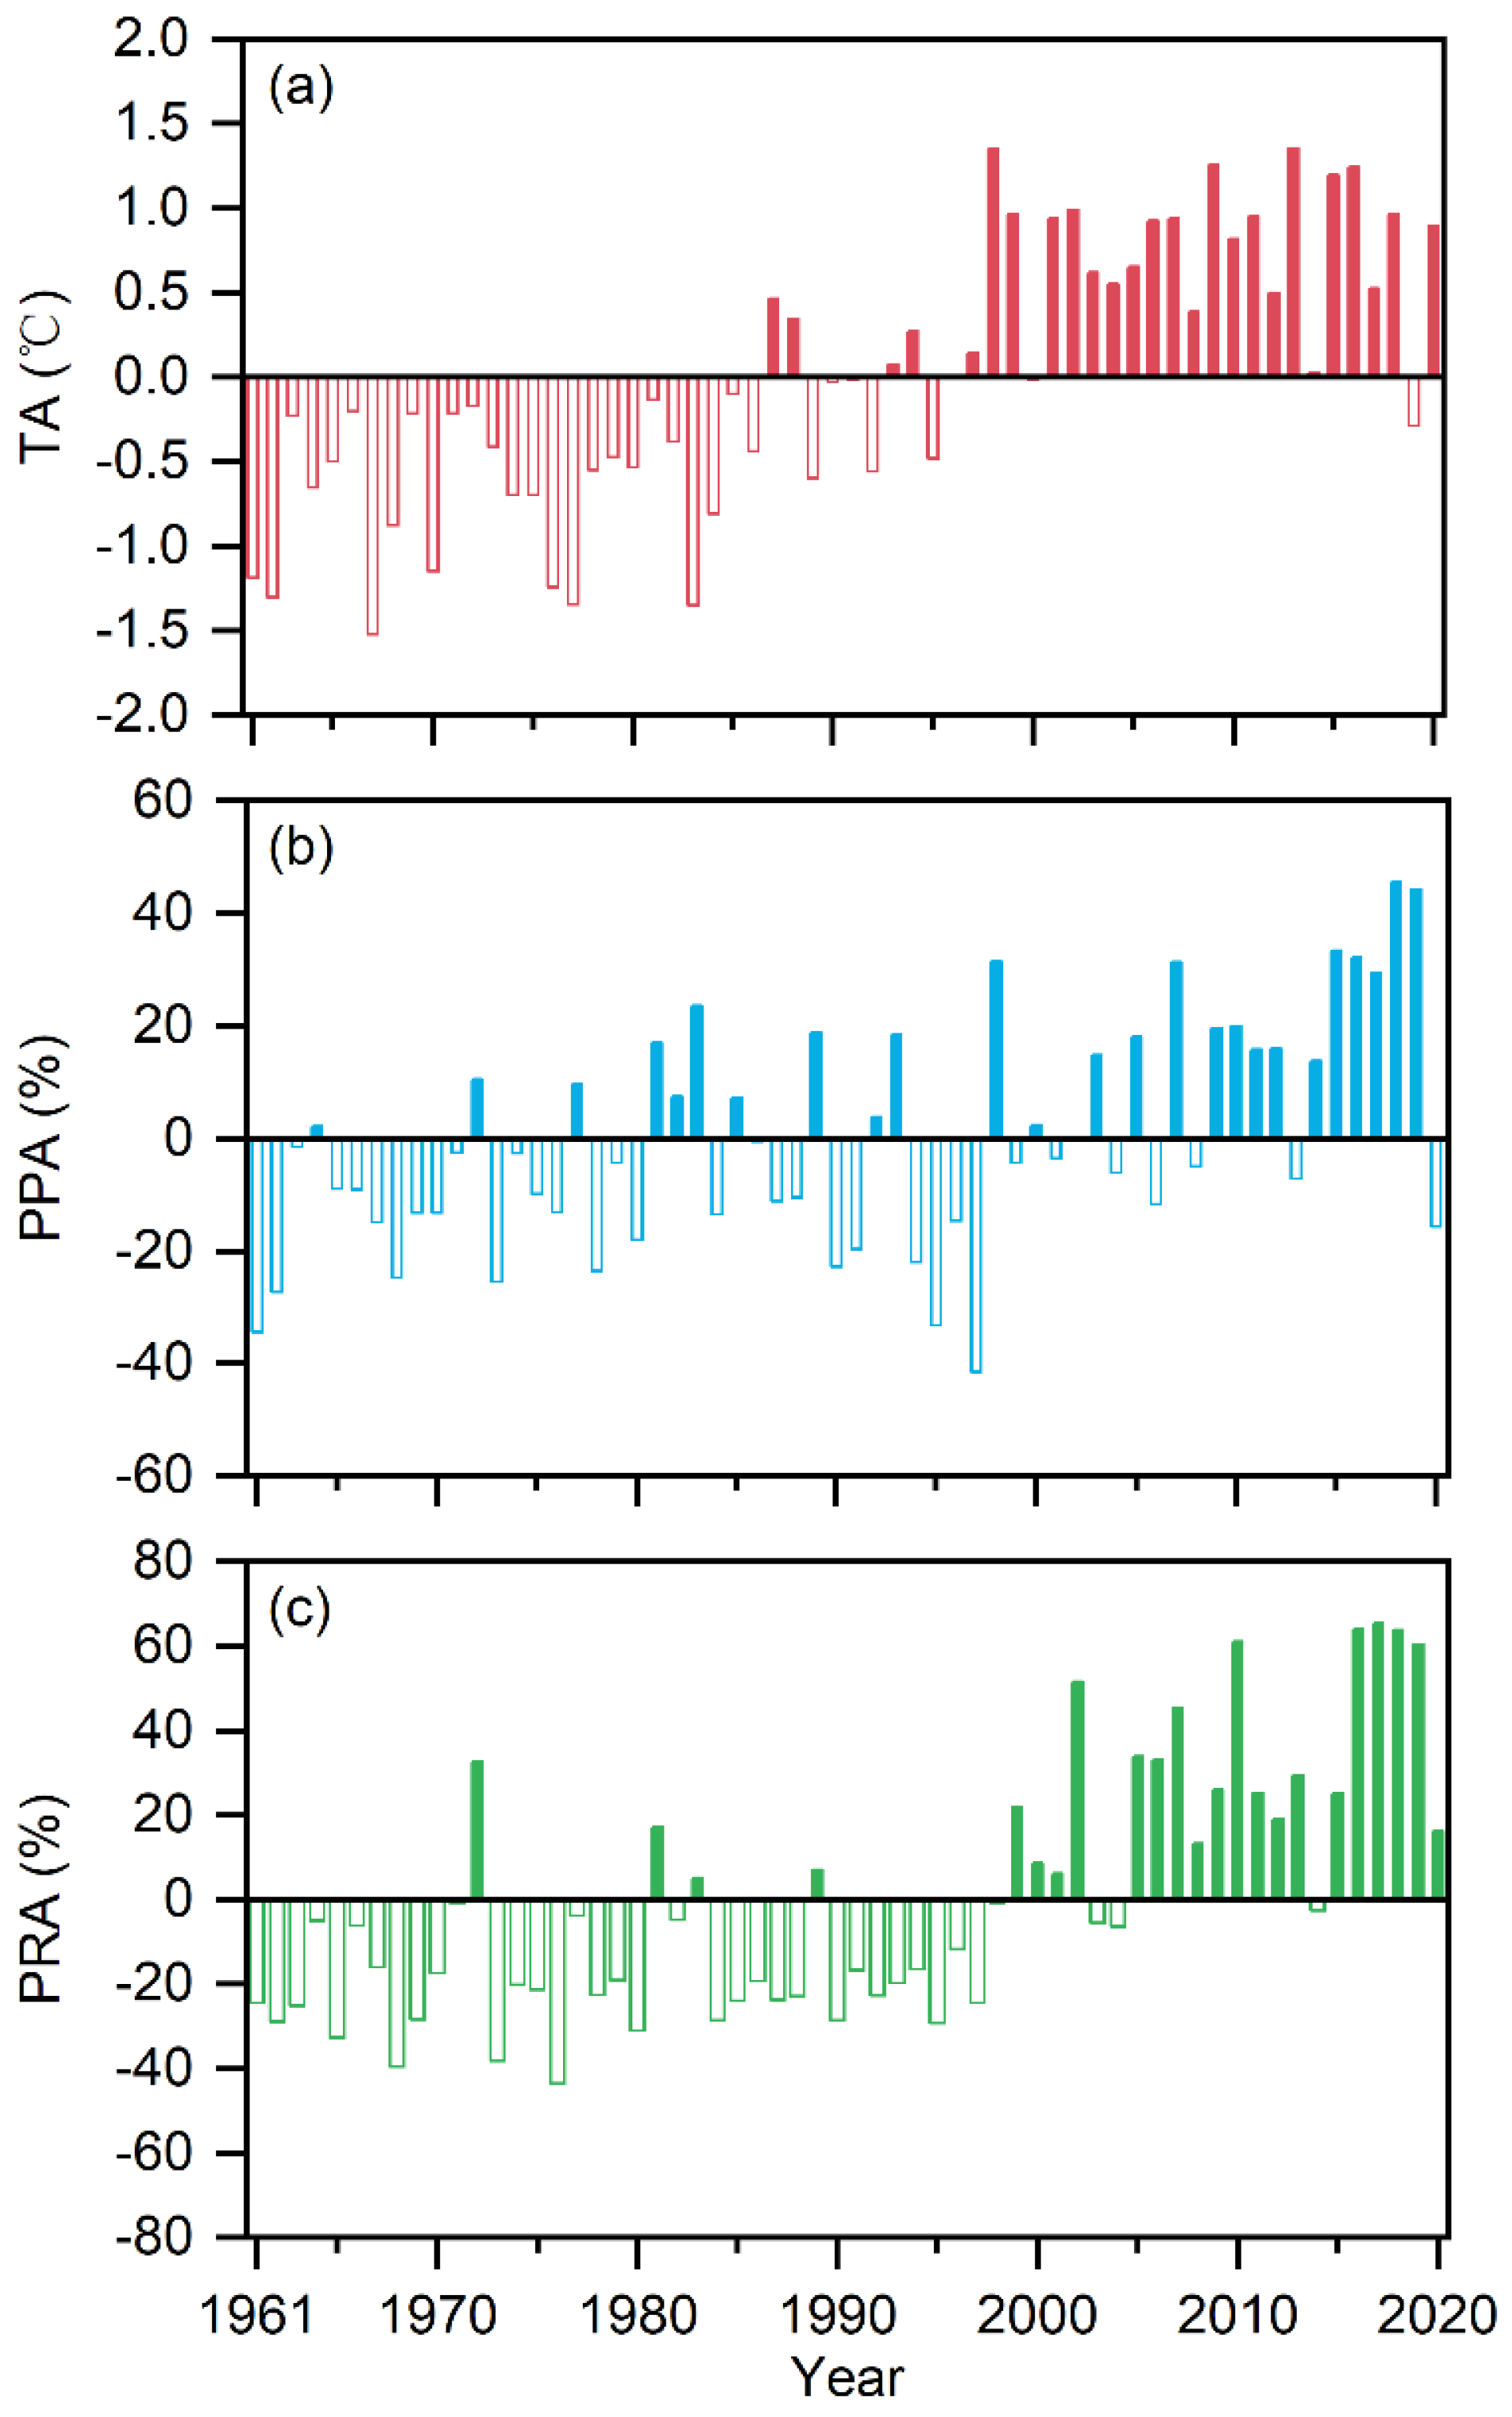
Figure 4.
Seasonal characteristics of multi-year monthly mean temperature, precipitation and mean runoff in the USR. (a) Monthly mean temperature; (b) Monthly precipitation; (c) Monthly mean runoff.
Figure 4.
Seasonal characteristics of multi-year monthly mean temperature, precipitation and mean runoff in the USR. (a) Monthly mean temperature; (b) Monthly precipitation; (c) Monthly mean runoff.
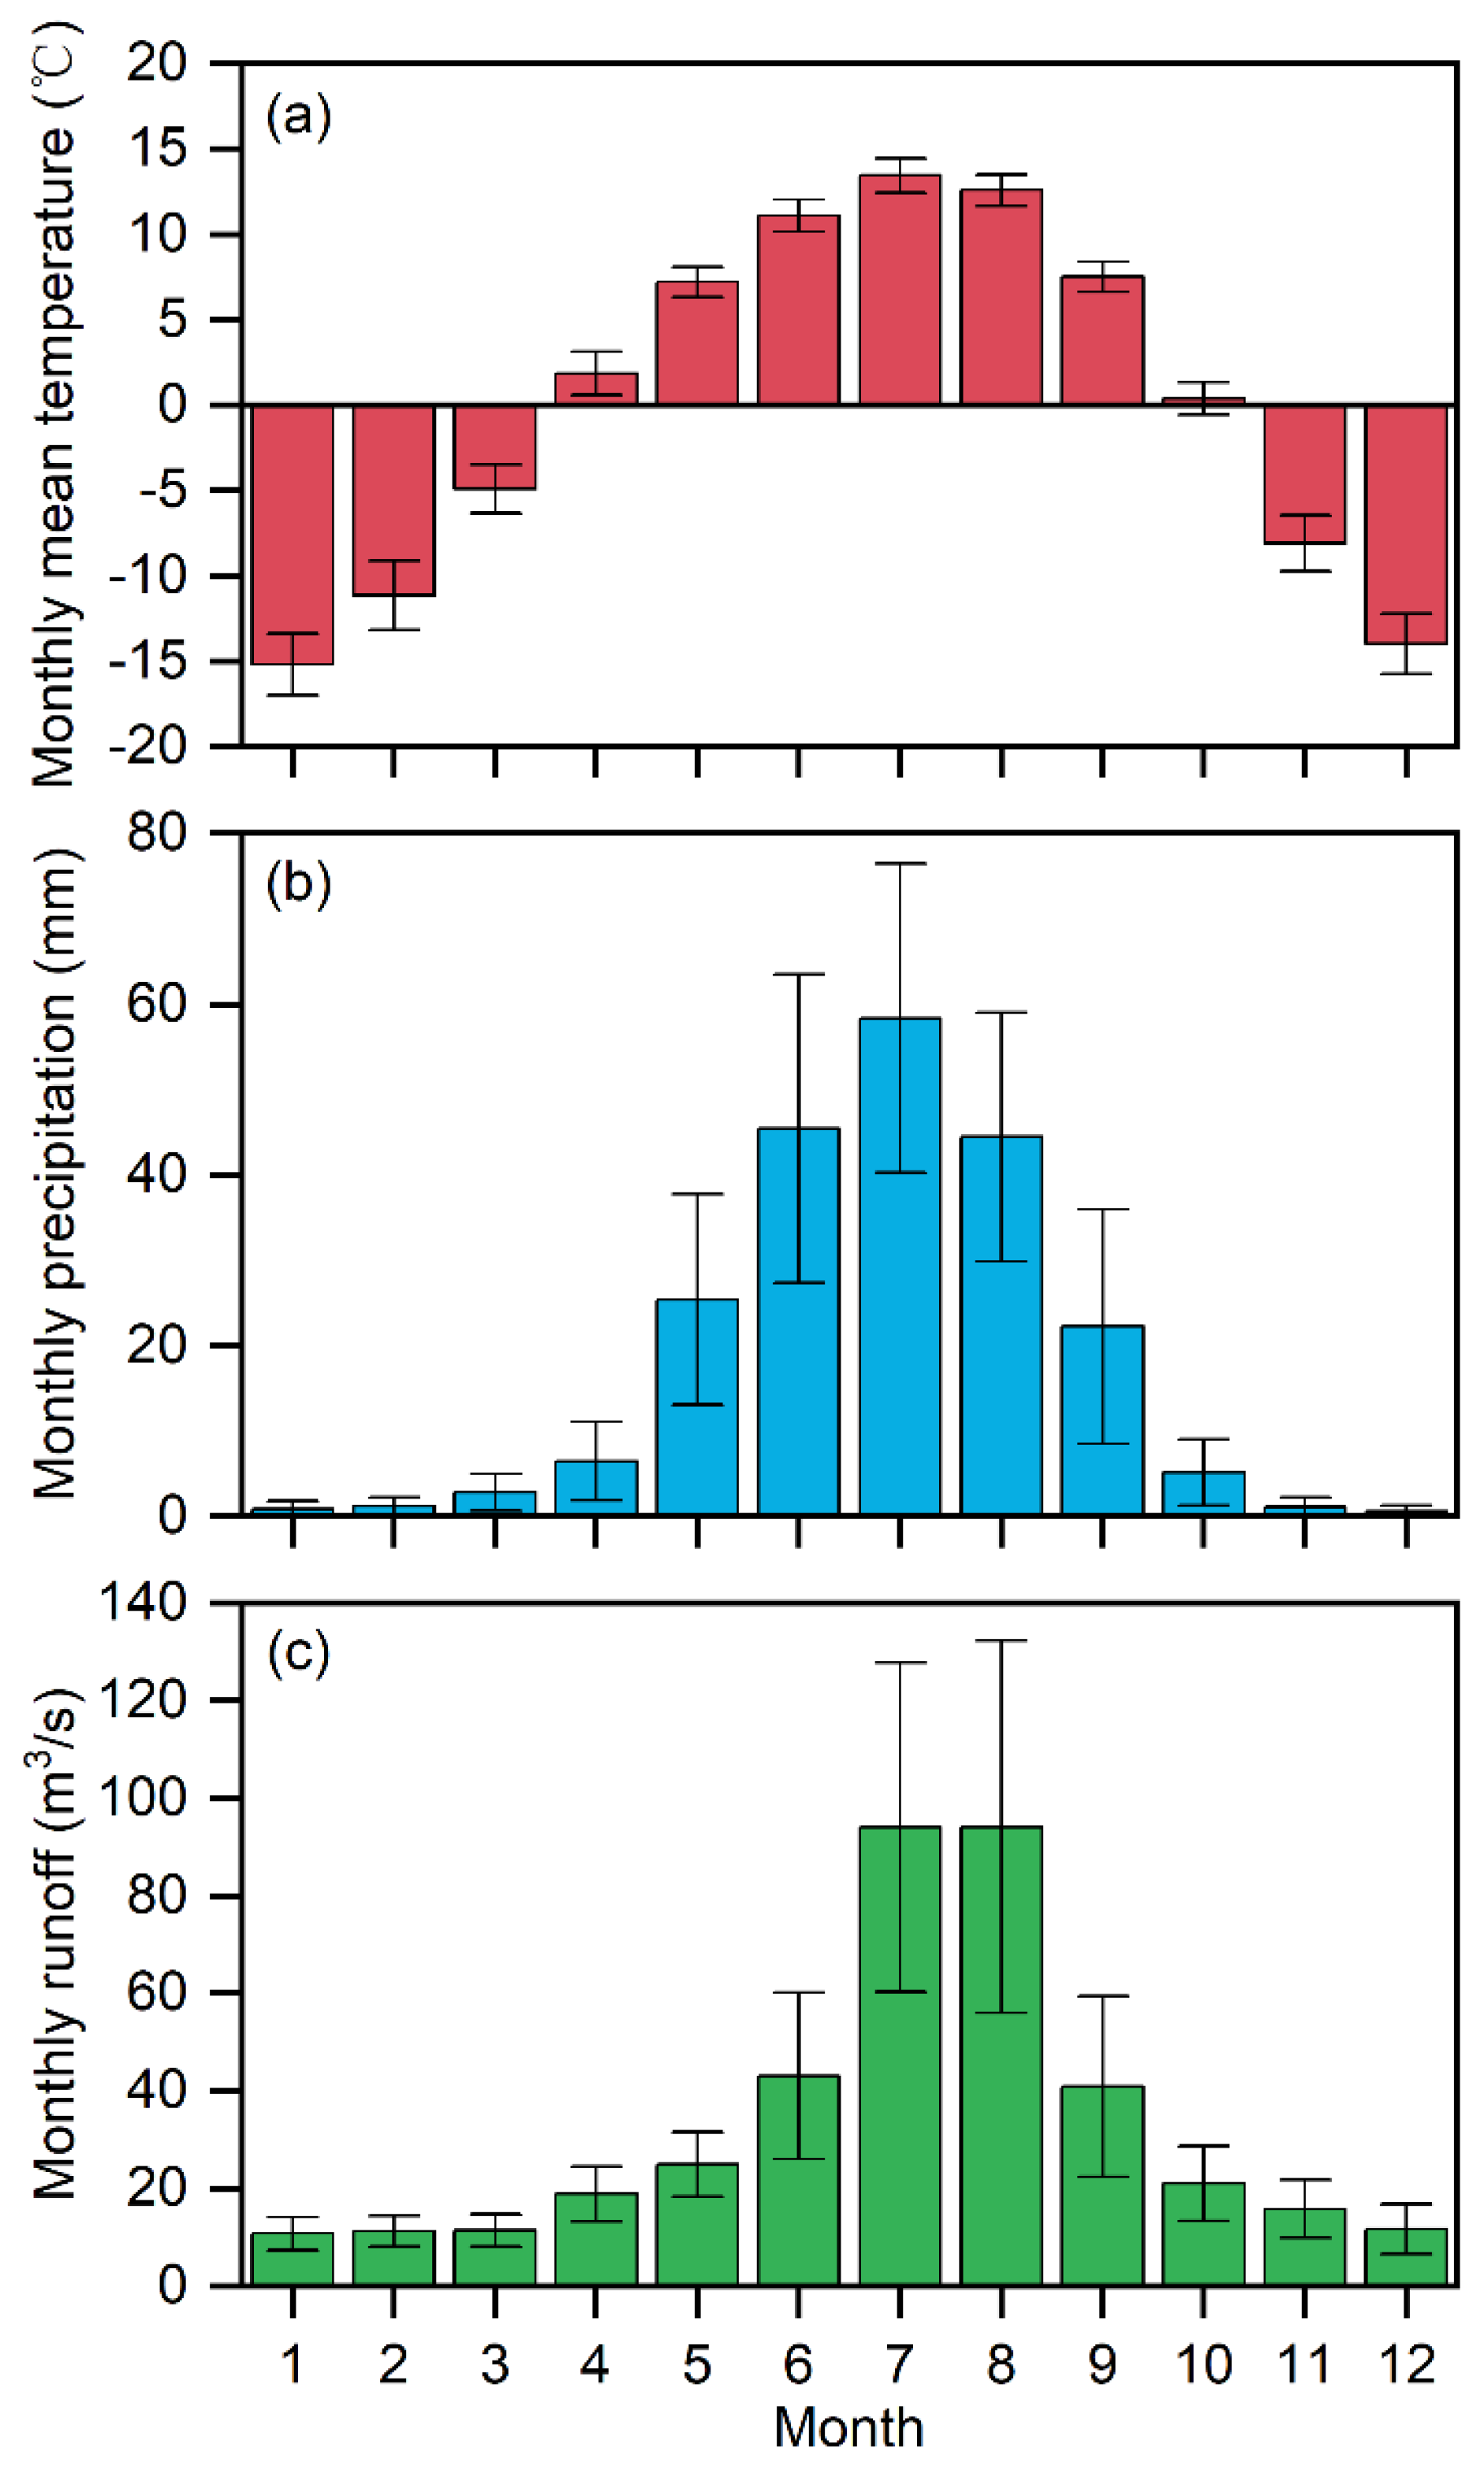
Figure 5.
Simulated and observed monthly runoff for the calibration period from 1971 to 1990 and the validation period from 1991 to 2020.
Figure 5.
Simulated and observed monthly runoff for the calibration period from 1971 to 1990 and the validation period from 1991 to 2020.

Figure 6.
Comparison of the simulated and observed monthly amounts of runoff for the entire simulation period from 1971 to 2020.
Figure 6.
Comparison of the simulated and observed monthly amounts of runoff for the entire simulation period from 1971 to 2020.
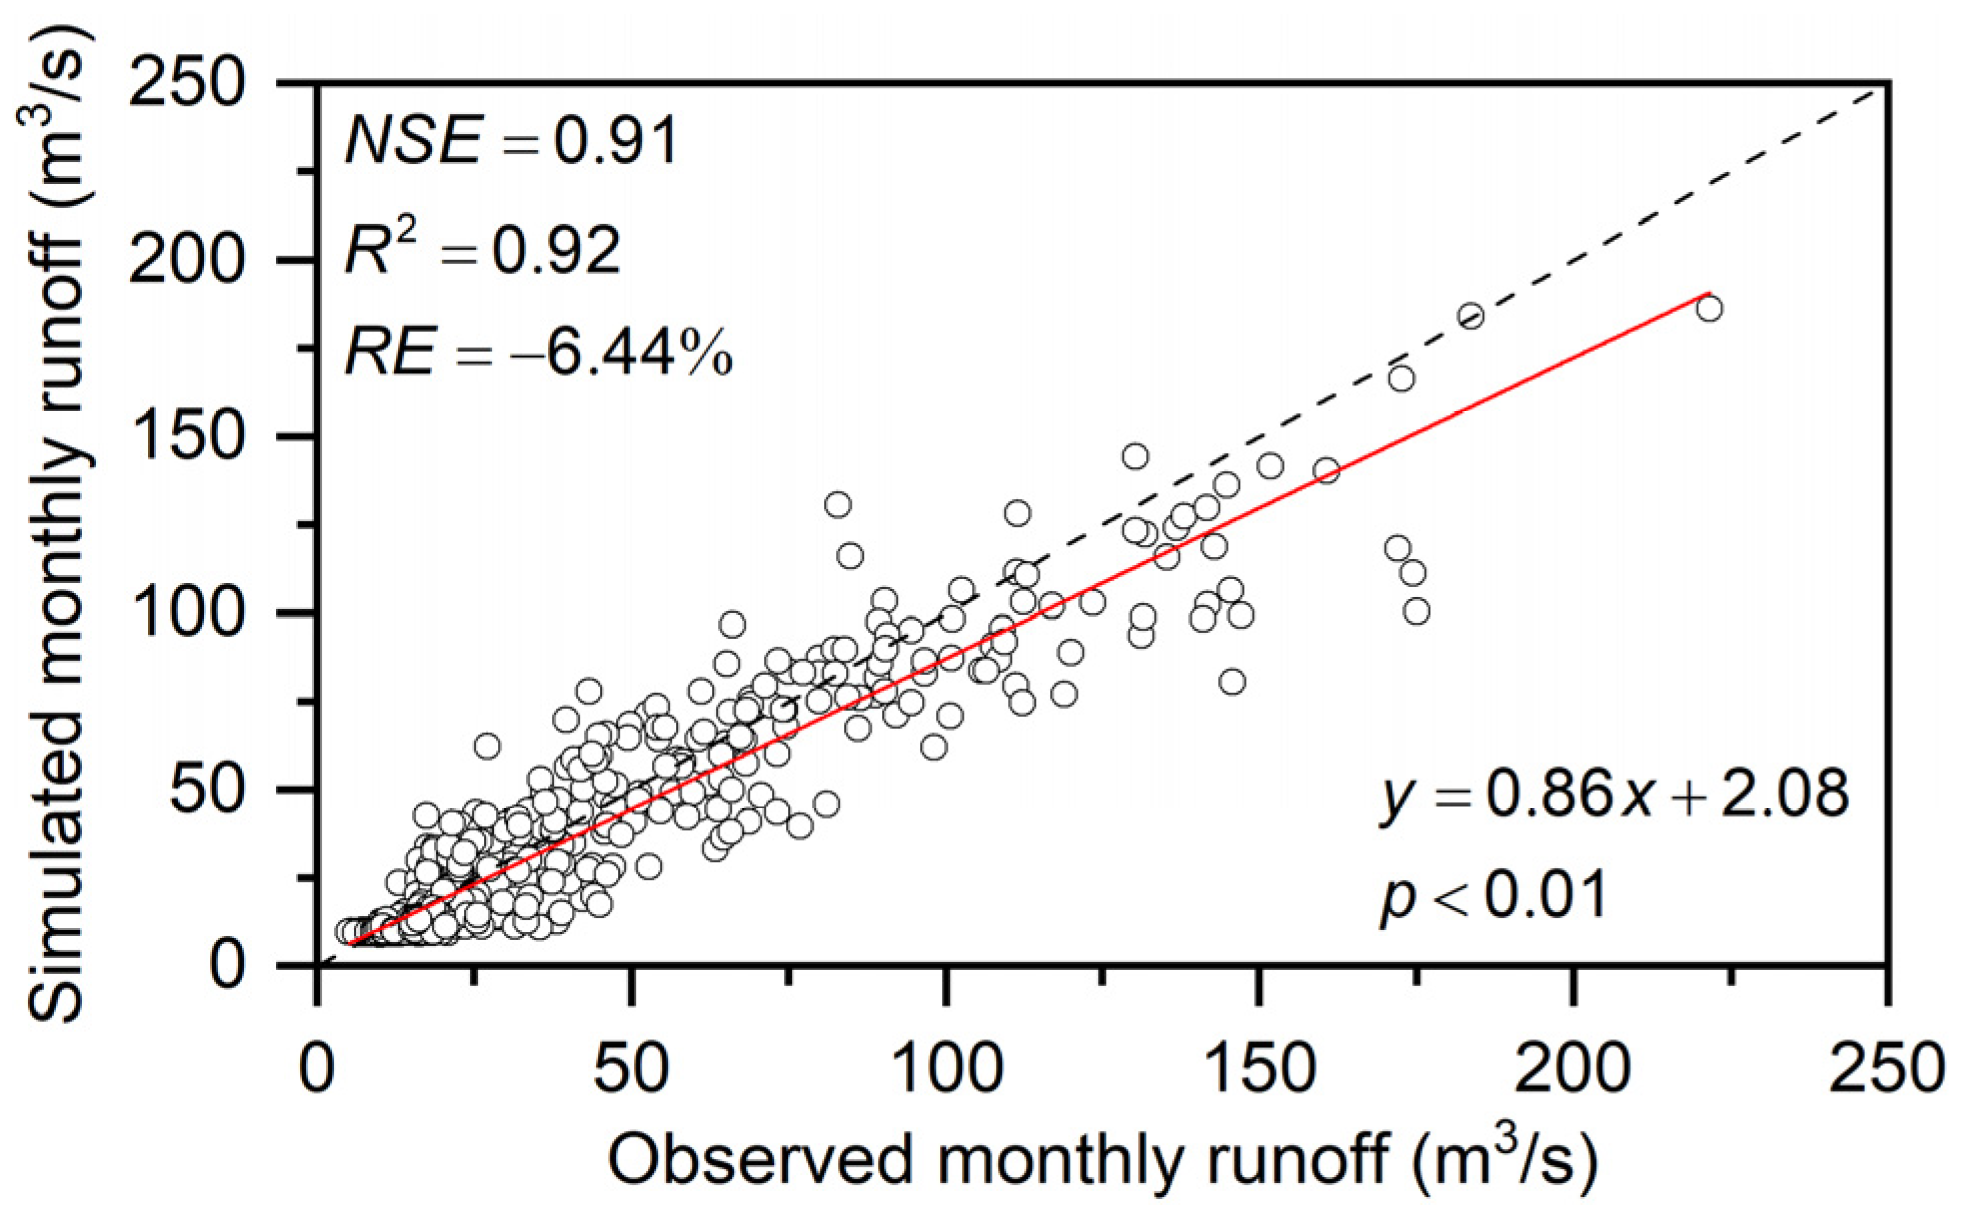
Figure 7.
Comparison of the simulated and observed monthly mean amounts of runoff for the calibration period from 1971 to 1990 and validation period from 1991 to 2020. (a) Calibration period; (b) Validation period.
Figure 7.
Comparison of the simulated and observed monthly mean amounts of runoff for the calibration period from 1971 to 1990 and validation period from 1991 to 2020. (a) Calibration period; (b) Validation period.

Figure 8.
Comparison of the simulated and observed annual runoff from 1971 to 2020. (a) Simulated annual runoff versus Observed annual runoff; (b) Interannual variation of observed runoff and simulated runoff.
Figure 8.
Comparison of the simulated and observed annual runoff from 1971 to 2020. (a) Simulated annual runoff versus Observed annual runoff; (b) Interannual variation of observed runoff and simulated runoff.

Figure 9.
Comparison of the simulated glacier area and the extracted (observed) glacier area from a multi-period glacier inventory, and the change of the simulated glacier area in the USR in the past 50 years. (a) Simulated glacier area versus Observed glacier area; (b) Simulated glacier area from 1971 to 2020.
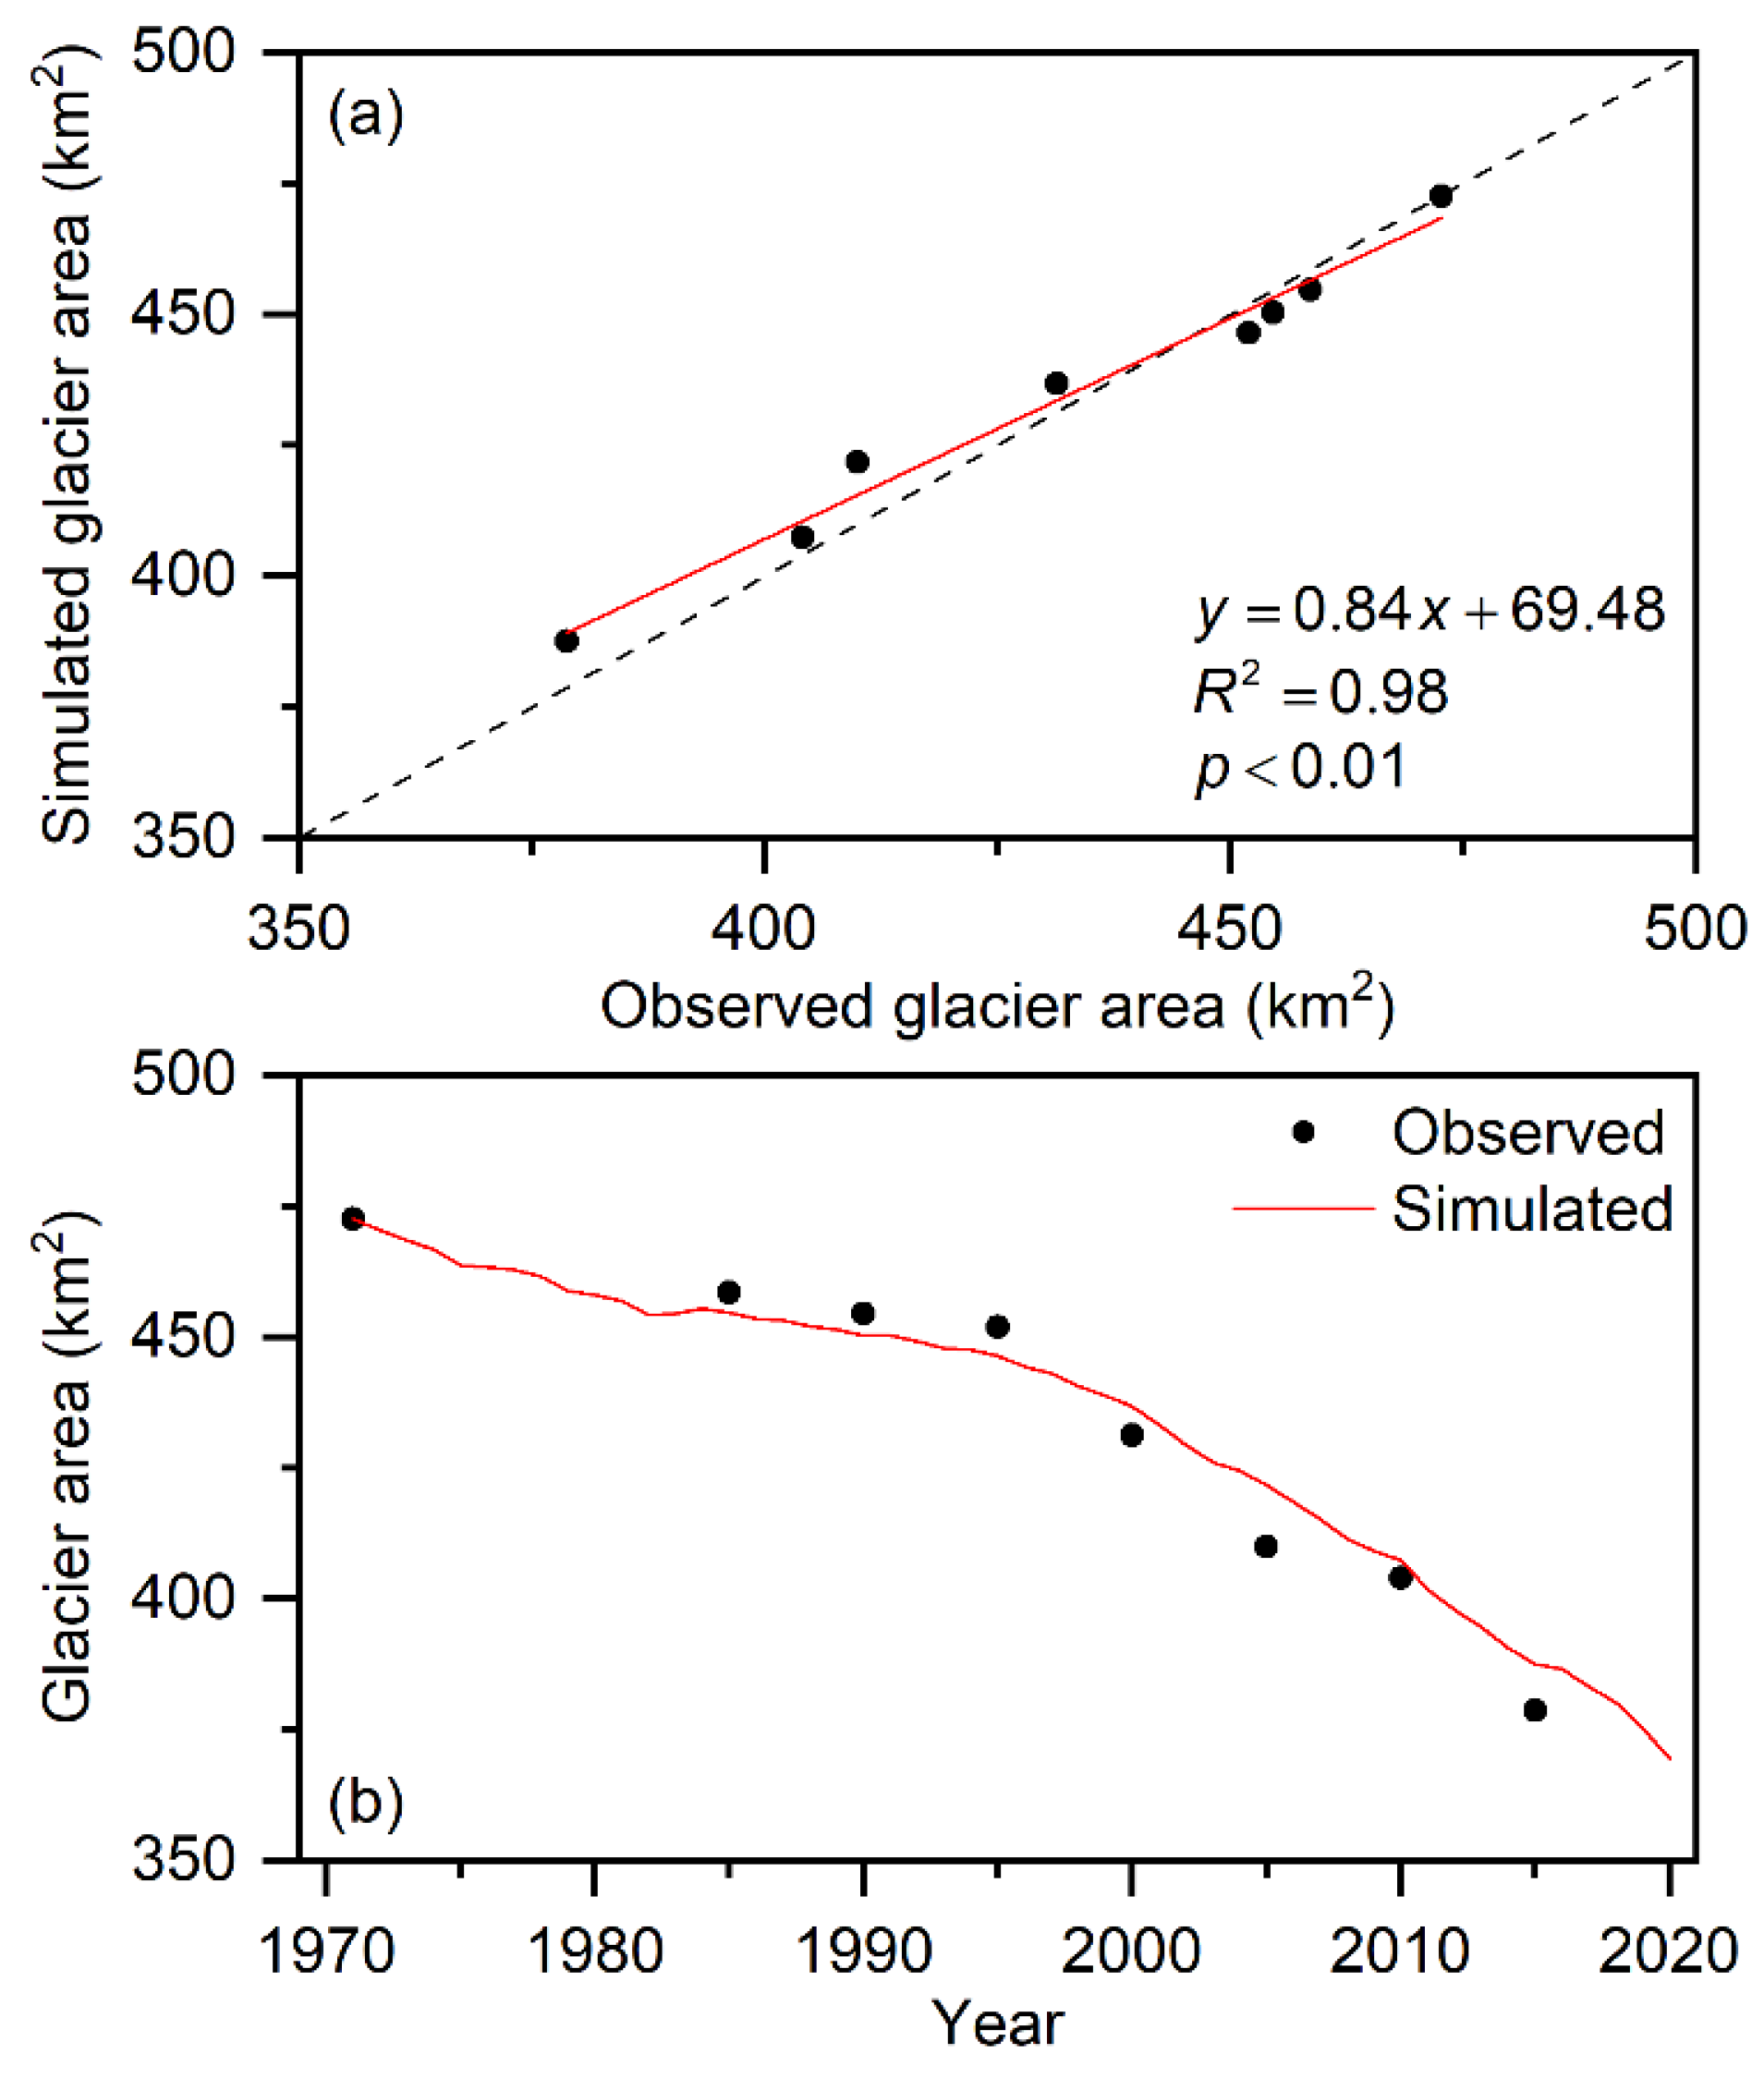
Figure 10.
Interannual variation of simulated runoff components. (a) Glacier runoff (GR); (b) Snow runoff; (c) Rainfall runoff; (d) Baseflow.
Figure 10.
Interannual variation of simulated runoff components. (a) Glacier runoff (GR); (b) Snow runoff; (c) Rainfall runoff; (d) Baseflow.

Figure 11.
Monthly variation of simulated runoff components. (a) 1971~2000; (b) 2001~2020.

Figure 12.
Mean annual contributions of runoff components to the total runoff.

Figure 13.
Comparison of contributions of runoff components to total runoff before and after the abrupt change of the total runoff.
Figure 13.
Comparison of contributions of runoff components to total runoff before and after the abrupt change of the total runoff.

Figure 14.
Interannual variation of contributions of runoff components to total runoff. (a) Contribution of GR; (b) Contribution of snow runoff; (c) Contribution of rainfall runoff; (d) Contribution of baseflow.
Figure 14.
Interannual variation of contributions of runoff components to total runoff. (a) Contribution of GR; (b) Contribution of snow runoff; (c) Contribution of rainfall runoff; (d) Contribution of baseflow.

Table 1.
Information on meteorological and hydrological stations in the USR and adjacent areas.
| Station Name | Lat/N | Lon/E | Elevation/m | Data Type | Station Type | Period |
|---|---|---|---|---|---|---|
| CMB | 39°49′ | 96°51′ | 2080 | DR/Prec/Temp | NHS | 2000~2020 |
| YM | 40°16′ | 97°02′ | 1526 | Prec/Temp | NMS | 1961~2020 |
| TL | 38°52′ | 98°22′ | 3360 | Prec/Temp | NMS | 1961~2015 |
| LHG | 39°30′ | 96°30′ | 4180 | Prec/Temp | AWS | 2009~2020 |
| LQZ | 39°31′ | 96°58′ | 2433 | Prec/Temp | AWS | 2009~2020 |
| YEH | 39°26′ | 97°06′ | 2868 | Prec | AWS | 2006~2020 |
| GH | 38°50′ | 97°43′ | 3443 | Prec/Temp | AWS | 2009~2020 |
| SMT | 38°25′ | 98°18′ | 3885 | Prec/Temp | AWS | 2009~2020 |
| MK | 38°34′ | 98°22′ | 4156 | Prec | AWS | 2009~2020 |
Abbreviations: DR, daily runoff; Prec, precipitation; Temp, temperature; NHS, national hydrological station; NMS, national meteorological station; AWS, automatic weather station.
Table 2.
Sensitive parameters of the SPHY model used for the simulation during the calibration period and validation period.
Table 2.
Sensitive parameters of the SPHY model used for the simulation during the calibration period and validation period.
| Parameters | Description | Unit | Value | Literatures |
|---|---|---|---|---|
| Root depth | Rootzone soil thickness | mm | 300 | |
| Sub depth | Subzone soil thickness | mm | 1200 | |
| Tcrit | Temperature threshold for precipitation to fall as snow | °C | 0 | [68] |
| DDFS | Degree-day factor for snow | mm/°C/d | 3 | [69] |
| DDFCI | Degree-day factor for debris-free glaciers | mm/°C/d | 6 | [69] |
| δgw | Groundwater recharge delay time | d | 3 | |
| αgw | Baseflow recession factor | - | 0.01 | [70] |
| BFtresh | Threshold for baseflow to occur | mm | 0 | |
| kx | Flow recession coefficient | - | 0.7 |
Table 3.
Monthly efficiencies for calibration period from 1971 to 1990, validation period from 1991 to 2020 and entire simulation period from 1971 to 2020.
Table 3.
Monthly efficiencies for calibration period from 1971 to 1990, validation period from 1991 to 2020 and entire simulation period from 1971 to 2020.
| Evaluation Indicators | Calibration Period | Validation Period | Simulation Period |
|---|---|---|---|
| NSE | 0.89 | 0.92 | 0.91 |
| R2 | 0.90 | 0.92 | 0.92 |
| RE | −3.82% | −11.51% | −6.44% |
Publisher’s Note: MDPI stays neutral with regard to jurisdictional claims in published maps and institutional affiliations. |
© 2021 by the authors. Licensee MDPI, Basel, Switzerland. This article is an open access article distributed under the terms and conditions of the Creative Commons Attribution (CC BY) license (https://creativecommons.org/licenses/by/4.0/).
Share and Cite
MDPI and ACS Style
Wu, J.; Li, H.; Zhou, J.; Tai, S.; Wang, X. Variation of Runoff and Runoff Components of the Upper Shule River in the Northeastern Qinghai–Tibet Plateau under Climate Change. Water 2021, 13, 3357. https://doi.org/10.3390/w13233357
AMA Style
Wu J, Li H, Zhou J, Tai S, Wang X. Variation of Runoff and Runoff Components of the Upper Shule River in the Northeastern Qinghai–Tibet Plateau under Climate Change. Water. 2021; 13(23):3357. https://doi.org/10.3390/w13233357
Chicago/Turabian StyleWu, Jinkui, Hongyuan Li, Jiaxin Zhou, Shuya Tai, and Xueliang Wang. 2021. "Variation of Runoff and Runoff Components of the Upper Shule River in the Northeastern Qinghai–Tibet Plateau under Climate Change" Water 13, no. 23: 3357. https://doi.org/10.3390/w13233357
Note that from the first issue of 2016, this journal uses article numbers instead of page numbers. See further details here.