
Water Extraction from Fully Polarized SAR Based on Combined Polarization and Texture Features


1
College of Computer and Information, Hohai University, Nanjing 211100, China
2
Yellow River Institute of Hydraulic Research, Zhengzhou 450003, China
*
Author to whom correspondence should be addressed.
Water 2021, 13(23), 3332; https://doi.org/10.3390/w13233332
Submission received: 19 October 2021
/
Revised: 16 November 2021
/
Accepted: 19 November 2021
/
Published: 24 November 2021
(This article belongs to the Special Issue Advances in Hydroinformatics for Water Data Management and Analysis)
Abstract
:Given the limited features (for example, the backscattering coefficient threshold range) of single-channel Synthetic Aperture Radar (SAR) images, it is difficult to distinguish ground objects similar to the backscattering coefficients of water bodies. In this paper, two representative research areas are selected (Yancheng Coastal wetland and Shijiu Lake), and the fully polarized SAR data based on Gaofen-3 are used to extract water bodies using the method of polarization decomposition and gray level co-occurrence matrix. Firstly, the multi-dimensional features of ground objects are extracted, and then the redundancy processing of multi-dimensional features is carried out by the separability index, which effectively solves the misclassification of non-water bodies and water bodies and improves the accuracy of water body extraction. The comparison between the results of full-polarization extraction and single-polarization extraction shows that both full-polarization and single-polarization extraction can extract water information, but the extraction accuracy of the full-polarization method can reach 94.74% in the area with complex wetland features, which can effectively compensate for the lack of precision of the single-polarization method. Although multi-dimensional features can be extracted from fully polarimetric SAR data, data redundancy may exist. Therefore, using the Separability index (SI) to process multi-dimensional features can effectively solve the problem of feature redundancy and improve classification accuracy.
1. Introduction
The rapid and accurate acquisition of water body information is of great significance to research of water resources [1,2,3,4], flood disaster monitoring [4], ecological environmental protection [3,5], and other fields. Optical remote sensing technology has become an important technical means to obtain water information due to its spatial and temporal availability and data processing advantages. However, optical remote sensing is often susceptible to bad weather, and it is difficult to obtain high-quality images under cloudy conditions. A Synthetic Aperture Radar (SAR) can make full use of its advantages, featuring high resolution, all-weather observation, and strong penetration, etc., and has become an important data source for water information extraction in recent years [5,6]. In 2016, China successfully launched Gaofen-3 (GF-3), a synthetic aperture radar imaging satellite, which has greatly alleviated the shortage of data from civilian SAR satellites.
Water extraction by SAR images can be divided into the single polarization mode and the full polarization mode. Single polarization is differentiated according to the intensity difference of electromagnetic waves reflected by different surface roughness of different ground objects. The main methods include threshold segmentation, curve evolution, and machine learning. Lee et al. [7] studied the adaptability of the Otsu threshold segmentation method and found that when the target area accounted for more than 30% of the whole image, the OTSU threshold approached the optimal segmentation value; when the target area ratio was reduced to 10%, the segmentation performance of OTSU declined rapidly. The curve evolution method is mainly the curve changes with the movement of time, mainly affected by geometric parameters on the curve, such as the curvature, normal vector, etc. Cohen [8] et al. proposed a deformation model, which makes the curve behave similar to a balloon inflated by extra force. The initial curve converges only when it is no longer close to the solution, and the curve does not stop until it passes through the weak edge, but only when it is strong, to avoid falling into the problem of local minimum. Klemenjak et al. [9] proposed an automatic water body extraction method by using a support vector machine and other algorithms to extract river regions in Terra SAR-X data as the research object. The experimental results show that the extraction accuracy of the river can reach 0.7 by Kappa. However, in the extraction process of single-polarization SAR water information, it is difficult to determine the segmentation threshold of a large-range SAR image, difficult to accurately extract the water boundary, both mixed water and plain, and difficult to distinguish different types of water. Compared with single-polarization SAR, Polarimetric SAR (Pol SAR) can make good use of the electromagnetic wave characteristics of the radar antenna, obtain the scattering information of different ground objects on the ground by combining the different polarization modes of the electric field vector transmitted and received by radar antenna, and obtain the multidimensional decomposition characteristics through the polarization decomposition algorithm. It is beneficial to analyze the scattering characteristics of different ground objects [10]. Deng et al. [11] combined pixel feature extraction with object-oriented polarization SAR segmentation, fused multiple features and obtained a water distribution map by the voting method. The results show that this method can effectively extract water information, and the detection accuracy can reach 98.9%. Song [12] used Cloude target decomposition method to extract water body information and found that water bodies have different scattering types on different rough surfaces, and the Cloude scattering entropy of different scattering types has great difference. Multidimensional features can be extracted from fully polarized SAR data [13]. However, due to similar scattering characteristics among these features, there may be correlation and redundancy, and even some features are full of “noise”, which is not conducive to the smooth progress of follow-up work.
In this paper, water information extraction from GF-3 full-polarization SAR images with comprehensive polarization and texture features is compared with the extraction results of single-polarization SAR images. Combined with the characteristics of the study area, a kind based on the characteristics of the whole polarization SAR image information extraction method is built. The problems to be solved for HH/HV polarization data are as follows: (1) water extraction from a wide range of SAR images and (2) the optimization of the water boundary. The problems to be solved for the HH/HV/VH/VV polarization data are as follows: (3) to distinguish tidal flat from water area and (4) to distinguish between ponds and lakes.
2. Study area and Data
2.1. Study Area
Aiming at the problems encountered in SAR image water information extraction, this paper selected representative research areas to explore the SAR image water information extraction methods suitable for different polarization modes, different water objects, and different environments. The specific schematic diagram of the typical study area is shown in Figure 1, which is divided into two parts: Yancheng Coastal wetland and Shijiu Lake. Yancheng coastal wetland is in Jiangsu province near the coastal areas, and Shijiu Lake is in Jiangsu and Anhui provinces at the junction. The data imaging mode, polarization mode, imaging time, and problems to be solved in the study area are shown in Table 1.
2.2. Data Preprocessing
The GF-3 satellite ground system produces 1–2 standard products, which are mainly divided into L1A, L1B, and L2 (http://www.sastind.gov.cn/n25770/index.html, accessed on 3 November 2021). LIA level products are mainly in the form of single look complex (SLC), which are slant-distance complex data products obtained after a series of processing. The main product forms of L1B products are single-look products (SLP) and multi-look products (MLP), which are processed in different ways according to the satellite parameters. The data used in this paper are all SLC, and the pre-processing mainly includes radiometric calibration, data conversion, multi-view processing, filtering, geocoding, power conversion, etc.
3. Method
For fully polarized SAR images, polarization decomposition and gray level co-occurrence matrix are used to extract polarization features and texture features, and then multi-dimensional features are processed by the separability index, which can effectively solve the feature redundancy problem. The specific process is as follows: (1) Polarization with decomposition. Krogager decomposition [14], Huynen decomposition [15,16,17,18], and Van Zyl decomposition [19,20] were performed on the preprocessed GF-3 image to extract the polarization features, and the polarization features were combined to form the feature set ‘All’. (2) According to different features, the separability index of different land features is calculated. The effective features conforming to certain conditions were selected to form the optimal polarization feature ‘SI’. (3) According to the calculation results of (2), the polarization feature with the maximum divisibility index is found. Based on this feature, the gray level co-occurrence matrix (GLDM) is used to construct the statistic as the texture classification feature, to synthesize the comprehensive feature set ‘SI+GLCM’ with the feature collection group of (3). (4) According to different texture features, the separability index of different ground objects is calculated, and the effective texture features that meet certain conditions are screened out, and the optimized comprehensive feature set SI+SI_GLCM is combined with the feature set of (2). (5) SVM classifier [21] was used to classify the feature sets of (1), (2), (3), and (4), extract water information, and verify and analyze the accuracy. The technical research route of this paper is shown in Figure 2.
3.1. Coherent Target Polarization Decomposition
3.1.1. Pauli Decomposition
Pauli decomposition is the most basic polarization decomposition method. Table 2 lists the physical interpretation of Pauli. Given a target region, the scattering matrix of the target region is obtained as ‘S’, which can be obtained by mapping it to Pauli basis:
The calculation formulae of a, b, c, and d are as follows:
3.1.2. Krogager Decomposition
Krogager decomposition, also known as SDH decomposition, is expressed as follows:
where is the proportion of the ball scattering in the decomposition, is the proportion of the dihedral Angle scattering in the decomposition, is the proportion of the helix scattering in the decomposition, refers to the Angle of the absolute phase, and is the offset Angle of the ball scattering to the other two kinds of scattering, where the expressions of , , are as follows:
where is the azimuth of the latter two components. Parameters decomposed by Krogager are as follows:
3.1.3. Huynen Decomposition
The purpose of Huynen target decomposition theory [14,15,16,17,18] is to distinguish the desired target from the clutter environment, also known as “N-target”. The average distributed target is generally expressed by the expected value of coherence matrix of Kennaugh matrix:
Among them, only 5 free parameters are required to represent a single target, and the average target can be decomposed into a single scattering target and a residual term. The residual term contains 4 degrees of freedom, a total of 9 parameters, and there are 4 dependencies between the parameters. Then, the relational Equation (11) is as follows:
The formula of partially polarized wave is Equation (12):
In Huynen decomposition, the vector is decomposed into two parts, which are represented by subscripts T and N in Equation (13):
where subscript T represents the equivalent single scatterer target, and subscript N represents the residual target.
The parameters are determined, and the single scattering target parameters have unique solutions:
3.1.4. Cloude–Pottier Decomposition
Cloude and Pottier proposed Cloude–Pottier decomposition [22,23,24,25]. Given the coherence matrix T, the decomposition is to obtain the eigenvalues of T. The specific decomposition is described in Equation (19):
where , and are the eigenvalues of the matrix, and the expression of is as follows:
The specific parameters in the formula are as follows: a represents the target scattering type; b is the azimuth Angle between target and radar; are the scattered phase angles of the target.
3.1.5. Van Zyl Decomposition
Van Zyl decomposition [24,25] is special, mainly applied to the decomposition of some natural features, and the applied natural features are independent of each other on the cross-polarization channel and co-polarization channel, so its covariance matrix can be expressed as follows:
the parameters are:
3.1.6. Freeman–Durden Decomposition
Freeman–Durden decomposition is the most commonly used polarization decomposition method. By data transformation of scattering matrix S, polarization covariance matrix C can be obtained. Freeman–Durden decomposition [26,27] decomposed matrix C into the following form:
where , and correspond to surface scattering, even scattering, and even scattering, respectively. , and correspond to the intensity of the corresponding scattering components, respectively. is the polarization coefficient of even scattering; is the polarization coefficient of surface scattering.
3.1.7. Yamaguchi Decomposition
Freeman decomposition results in three scattering components. Yamaguchi decomposition [28,29,30,31] analyzes and studies the Freeman decomposition method, expands Freeman decomposition, makes up for the shortcomings of the Freeman decomposition method itself, and adds spiral scattering on the basis of Freeman decomposition. The polarization scattering matrix is expressed in the form of four scattering mechanisms:
where is the polarization covariance matrix of the scatterer, and the coefficients , , are complex numbers, which are used to describe the proportion of each scattering component. , , , and are the polarization covariance matrices of the above four kinds of scattering, respectively.
3.2. Feature Extraction of Texture
In remote sensing images, spectral features describe the average tonal changes of various bands in the visible or infrared part of the electromagnetic spectrum, while texture features contain information about the spatial distribution of tonal changes within a band [32]. Gray co-occurrence matrix is mainly affected by distance d, direction θ, quantization level, window size, and other parameters. The statistics calculated based on the gray level co-occurrence matrix include mean value, variance, homogeneity, contrast, heterogeneity, information entropy, second moment, correlation, and so on. Water usually has less texture and relatively uniform gray value, so it usually has low contrast, high information entropy, high correlation, and high coordination.
3.3. Separability Index
When two or more classes are considered, a feature is considered to be well separable if the distance between the means of the feature is greater than the standard deviation of the feature [32]. The calculation is Equation (26):
where a and b represent two different categories under j characteristics. Under characteristics, the mean value of class a is represented by ; under j characteristics, the mean value of class b is represented by ; under j characteristics, the standard deviation of class a is represented by ; under j characteristics, the standard deviation of class b is represented by . The higher the value of , the better the separability between a and b. Through target decomposition, 38 polarization features are extracted. The specific decomposition method and corresponding characteristic parameters are shown in Table 3.
4. Results
4.1. Analysis of Feature Selection Results
Taking Yancheng coastal wetland as an example, the SAR images of Yancheng coastal wetland are divided into seven types of land features, including water, paddy field, dry land, intertidal zone, ridge, spartina alterniflora (A grass of the family Gramineae), and reed. By calculating the separability index of the different features in 38 dimensions, the distinguishing ability of different features is judged and analyzed. The separability index results are shown in Figure 3, and the separability index of different features on water areas is shown in Figure 4. The characteristic number and precision corresponding to different SI thresholds are shown in Figure 5.
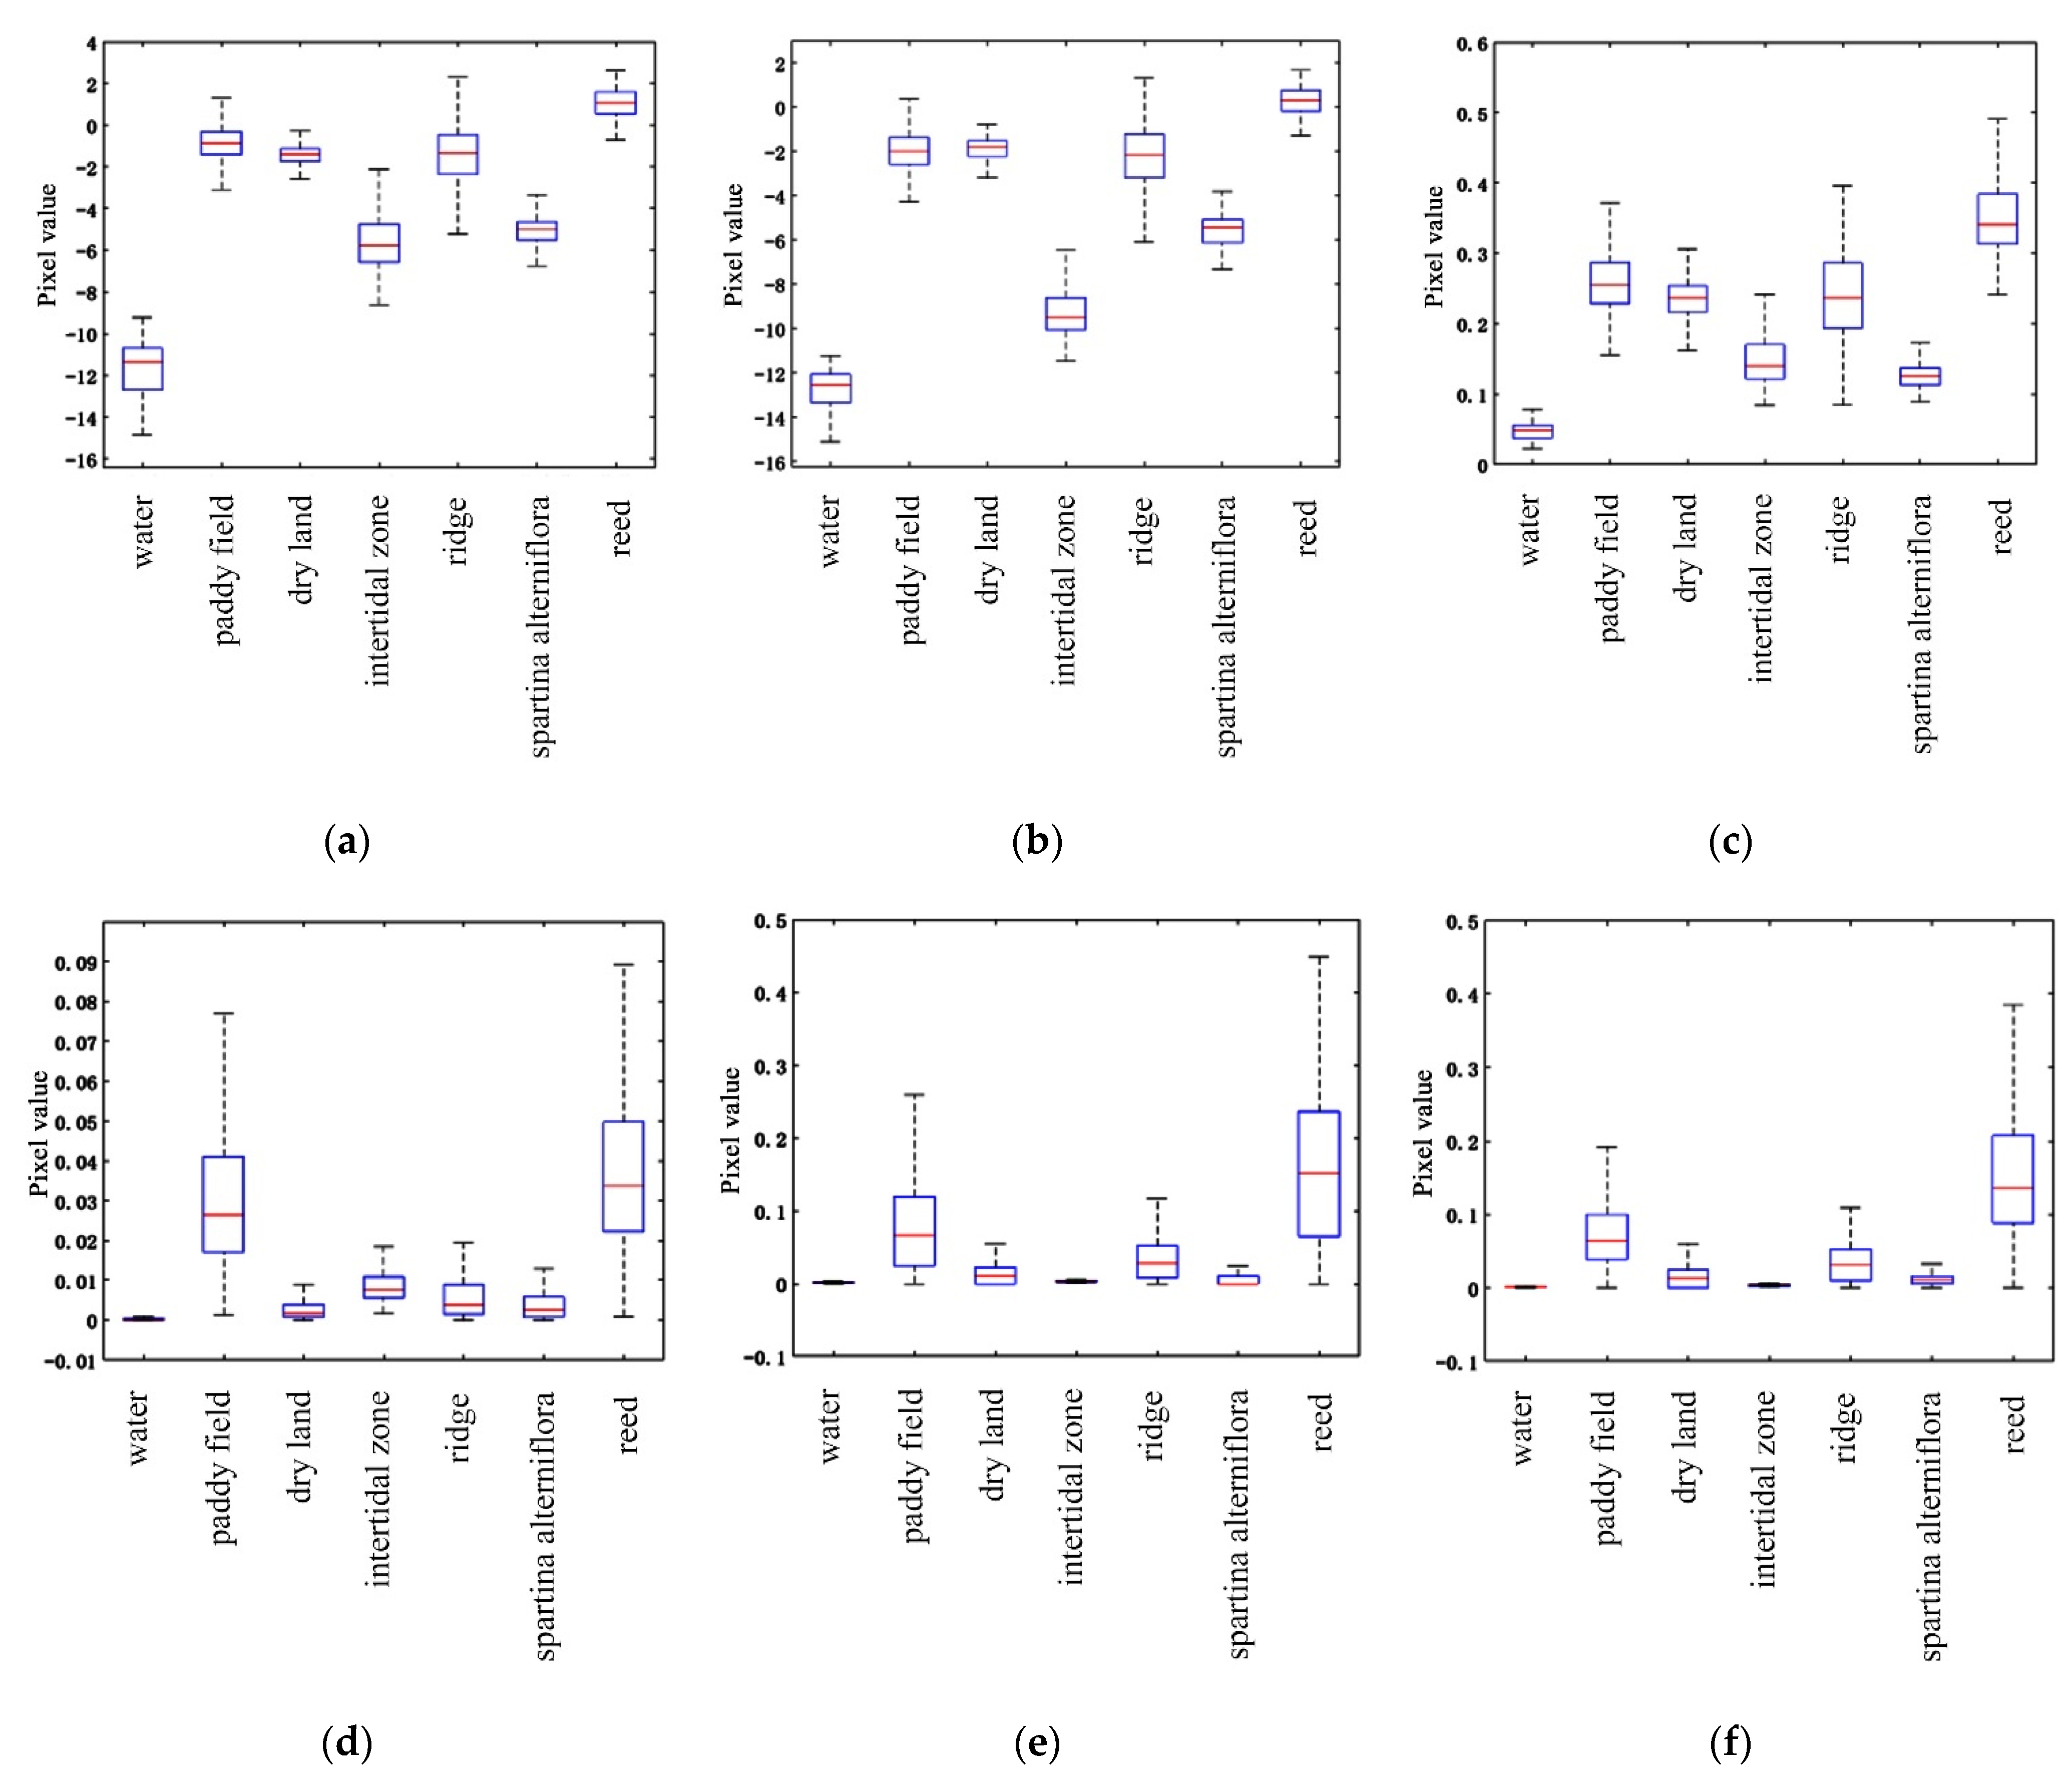
It can be seen that when the SI threshold is 0.6, the overall accuracy can reach 94.78%. Therefore, with 0.6 as the limiting condition, when SI > 0.6, it indicates that the ground objects have good separability. The 15-dimensional features are screened out through the separability index, which is as follows: Krogager’s Ks, Kd, and Kh components; Huyen’s JRH_T11 components; Van Zyl’s VZ_Vol and VZ_Odd components; Freeman’s F_Vol and F_Odd components; Yamaguchi’s decomposition of Y_Vol, Y_Odd, and Y_Hlx components; and the H/A/Alpha decomposition of L2, L3, SE, and SE_I components. The first three features with large SI values and the last three features with small SI values are selected to further show the separability of different ground objects through box plots, as shown in Figure 6a–c. It can be seen that the pixel value of the water area is relatively low, which can be distinguished from other ground objects. The main reason is that the smooth surface of the calm water area has uniform gray distribution, mainly speckle scattering, low scattering intensity, basically no volume scattering and dihedral Angle scattering, and low SE, SE_I, and Ks values.
4.2. Water Classification and Accuracy Analysis
To verify the effectiveness of water area classification, the accuracy of single-polarization SAR data of different channels and full-polarization SAR data of different feature sets is evaluated. With the standard support vector machine (SVM) as a classifier, the polarization SAR will feature the extraction of 38 victors, said ALL the requisition will be deleted according to the separability index to distinguish the worst of the characteristics of the optimization of the preserved after polarization feature set marked as SI, and keep the separability index of the polarization characteristics to ALL the feature set of texture feature combination of SI + GLCM. The polarization feature retained by the separability index and texture feature retained by the separability index are denoised as SI+SI_GLCM. The experimental results are shown in Figure 7 and Figure 8.
Combined with the statistical results of surface object classification in Table 4 and the HH polarization images in Figure 7a–c, the differentiation effect of the tidal flat and water areas is good in marine coastal areas, but on land, rivers are wrongly divided into smooth flats, and the extraction effect of water areas is poor. In the HV polarization image, the misrepresentation of the water area as the tidal flat is quite serious, and the overall accuracy of the ground object is only 58.60%. In the VV polarization image, the mixed phenomenon mudflats and other ground objects is serious. The multi-feature advantage of full polarization can effectively solve the deficiency of a single polarization image and distinguish water area, plain beach, and other ground objects. In addition, feature optimization through separability index can reduce the slow operation speed and invalid data interference caused by too much data, thus effectively improving the operation efficiency and classification accuracy. The classification accuracy of optimal feature collection obtained by the separability index can reach 94.74%, which is nearly 7.7% higher than that of feature set with all features.
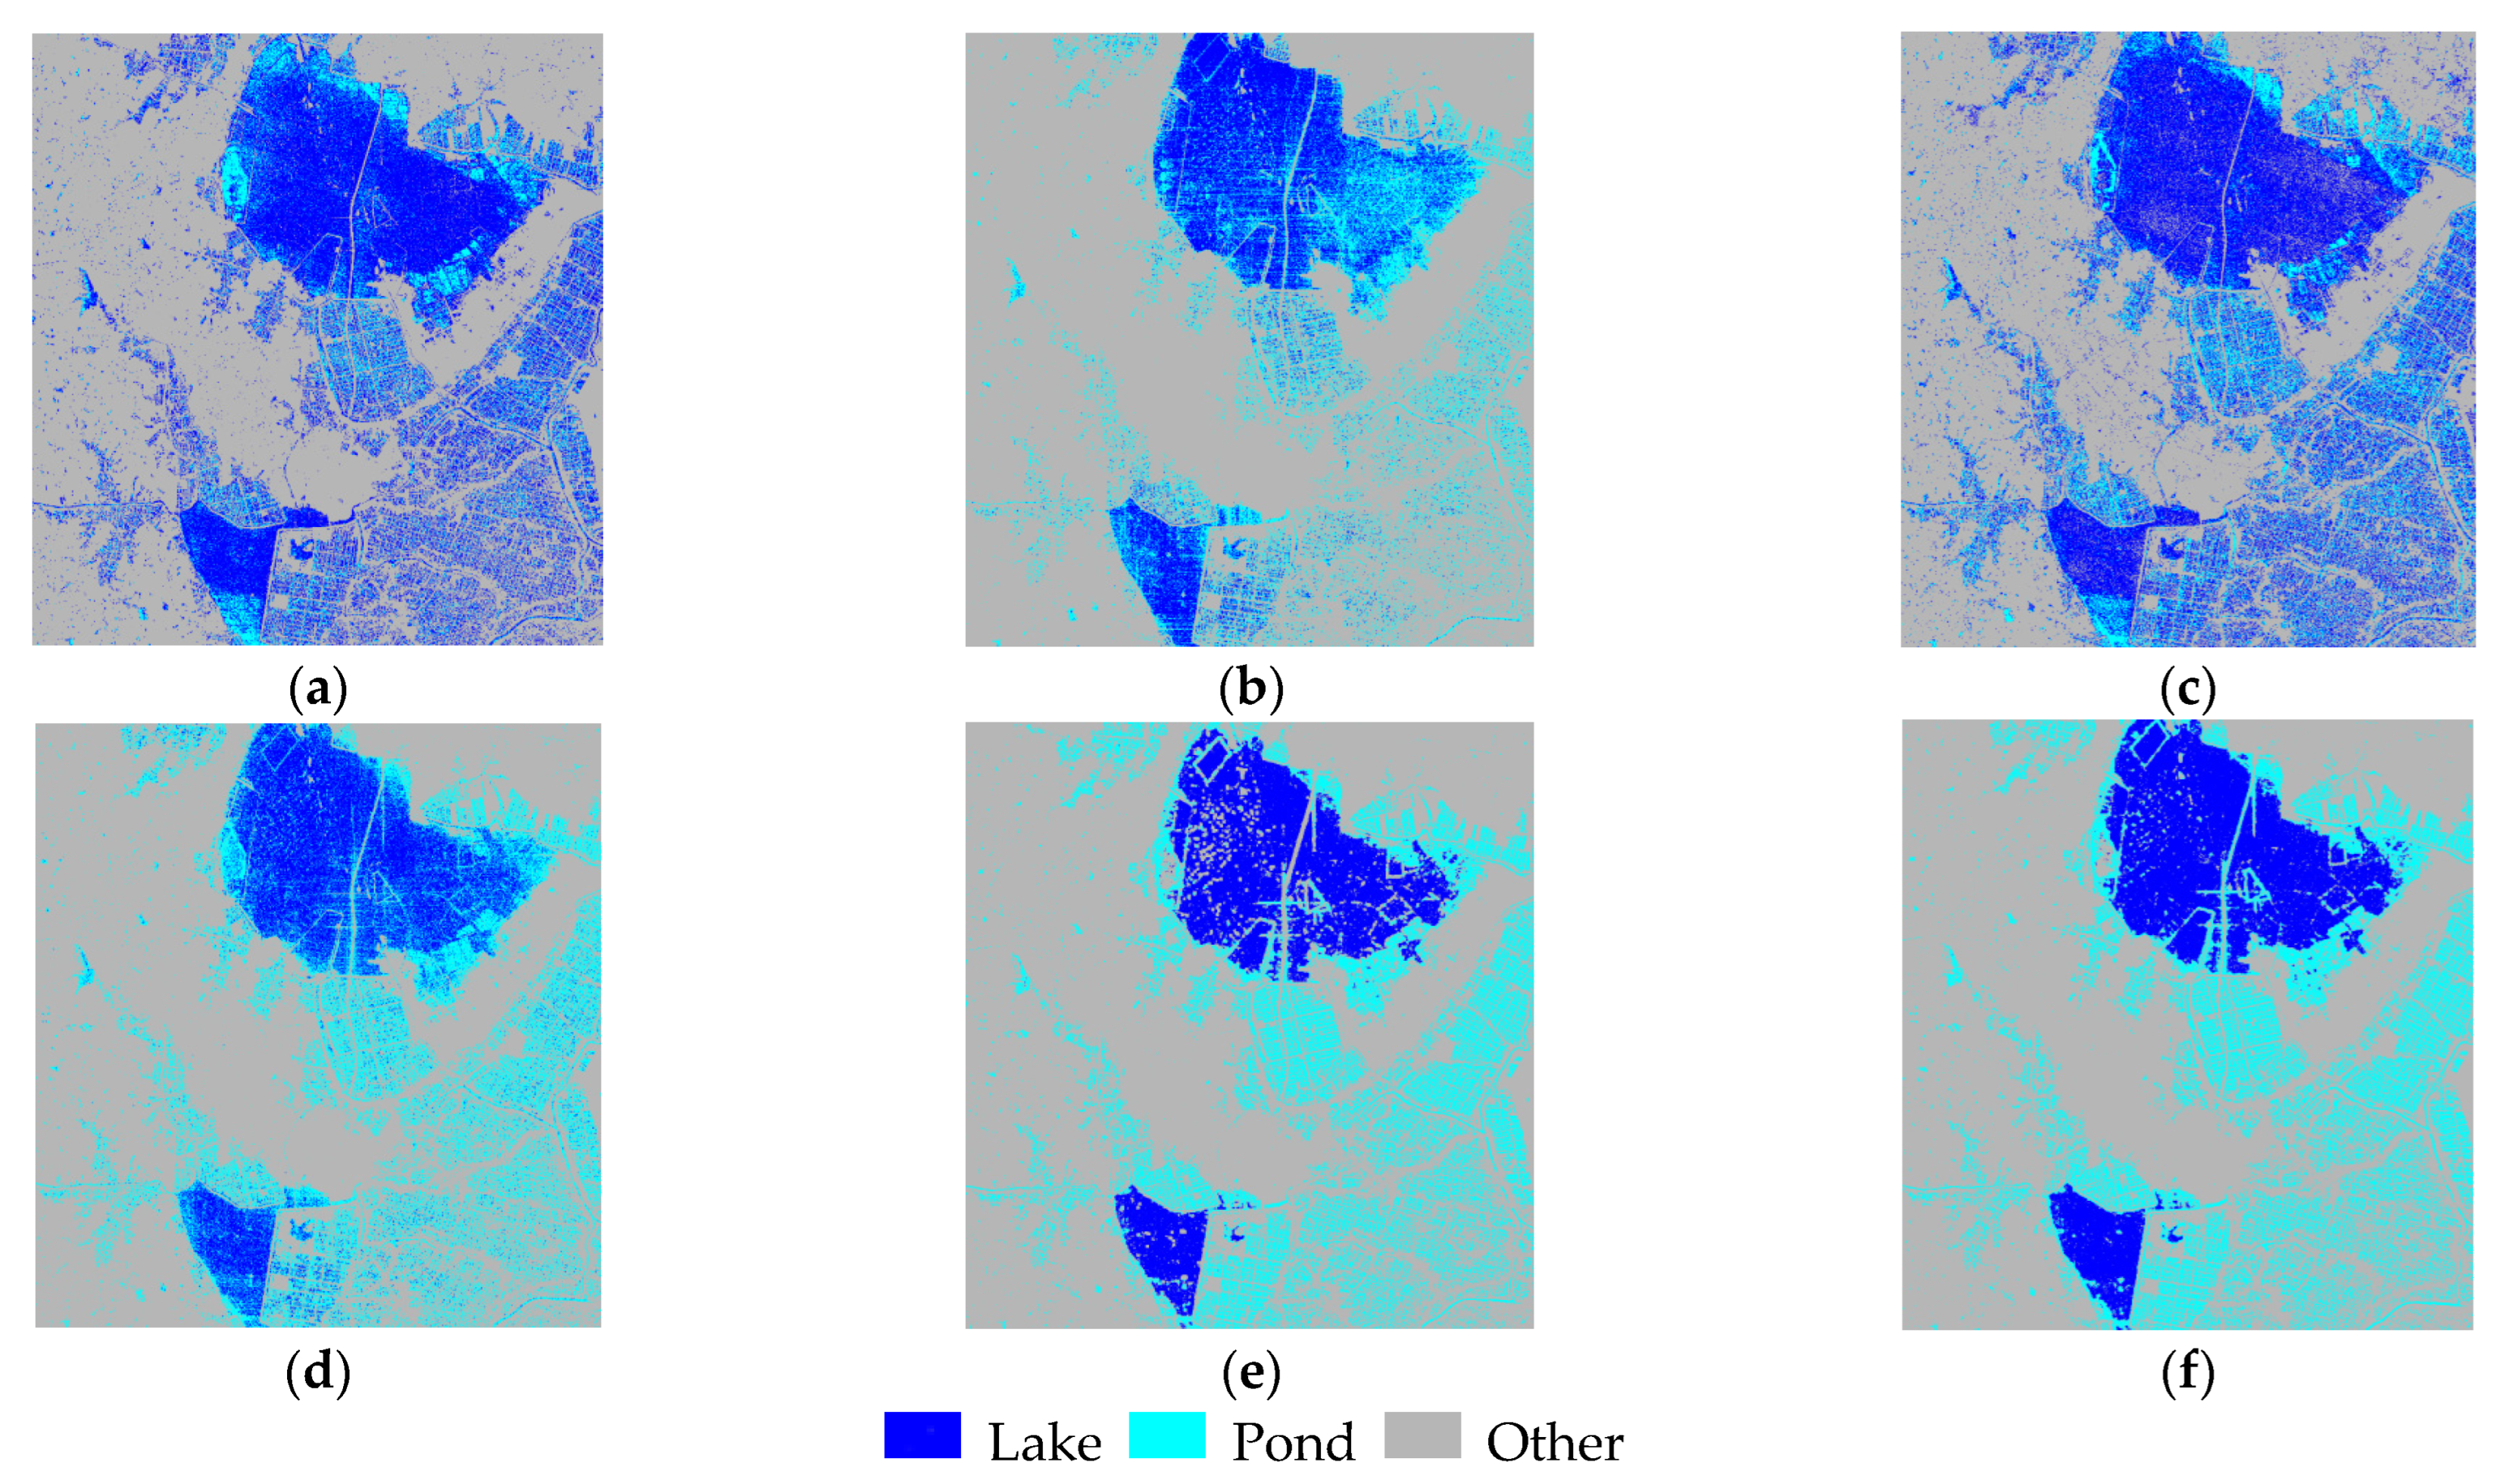
Combined with the statistical results of ground object classification in Table 5 and Figure 8, the overall classification accuracy of single-polarization images for the Shijiu Lake study area is low, but the classification accuracy can be effectively improved by integrating multiple polarization characteristics. The multi-dimensional features do not necessarily improve the classification accuracy because some features may have correlation and redundancy due to similar scattering characteristics. Some features are even full of “noise”, which is not conducive to the smooth follow-up work. The separability index can reduce the dimension of feature and improve the accuracy of classification. Compared with feature set SI, the classification accuracy of feature set with the texture feature is improved by 10%. Because the texture characteristic values obtained by GLCM are not completely applicable to the classification of the Shijiu Lake study area, therefore, the polarization features and texture features after re-screening by the separability index can be recombined to obtain a new feature set, which can effectively distinguish lakes and aquaculture ponds. The overall accuracy of reclassification reached 94.56%.
5. Discussion and Conclusions
Aiming at the problem that it is difficult to accurately extract water and distinguish different water types in the complex terrain area with GF-3 single-polarization data, the coastal area and urban lake area are studied and analyzed with GF-3 full polarization data. In coastal areas, because of the complexity of wetland features, it is difficult to classify them [6,7,8]. Moreover, if only unipolar images are used, there will be misclassification of the beach and water area [9,10,11,12]. Therefore, the overall classification accuracy of Yancheng coastal wetland can reach 94.74% by using fully polarized data, effectively making up for the difficulty in distinguishing beach and water areas faced by unipolar data. The literal images can effectively extract water body information, but it is more difficult to distinguish between different types of water and lake area in cities, so the whole polarization data classifying the stone mortar lake area can reach an overall accuracy 94.56%, which will be similar to the scattering coefficient of aquaculture ponds and lakes to effectively distinguish them. Multi-dimensional features can be extracted from fully polarized SAR data [25,26,27,28,29]. However, due to similar scattering characteristics among these features, there may be correlation and redundancy, and some features are even full of “noise”, which is not conducive to the smooth progress of follow-up work. Multidimensional features are processed by the separability index to solve the problem of feature redundancy and improve classification accuracy.
Using the fully polarized SAR data of GF-3 to extract texture features from polarization decomposition and gray co-occurrence matrix, the multi-dimensional features of ground objects were obtained, and the multi-dimensional features were redundancy processed by the separability index, which effectively solved the phenomenon of misclassification between non-water bodies and water bodies and improved the water body extraction accuracy. The comparison between the results of full polarization extraction and single polarization extraction shows that both of them can extract water information, but the extraction accuracy of the full polarization method can reach 94.74% in the area with complex wetland features, which can effectively compensate for the lack of precision of single-polarization method in water extraction.
Author Contributions
J.W. (Jikang Wan) came up with the original idea for the study, and J.W. (Jikang Wan) carried out the design. J.W. (Jikang Wan) was responsible for programming and data processing. M.Z. conceived the experiments and carried out the analysis with assistance from J.W. (Jiayi Wang) and J.W. (Jikang Wan) structured and drafted the manuscript. All authors have read and agreed to the published version of the manuscript.
Funding
The program underpinning this work is the National Key Research and Development Program of China (No. 2018YFC040720203).
Institutional Review Board Statement
Studies not involving humans or animals.
Informed Consent Statement
Studies not involving humans or animals.
Data Availability Statement
All data and codes can be obtained by contacting the corresponding author within reasonable limits.
Acknowledgments
Thanks to the National Key Research and Development Project of China (no. 2018YFC040720203).
Conflicts of Interest
The authors declare no conflict of interest.
References
- Allen, M.R.; Ingram, W.J. Constraints on future changes in climate and the hydrologic cycle. Nature 2002, 419, 224–232. [Google Scholar] [CrossRef] [PubMed]
- Wang, Y.; Ruan, R.; She, Y. Extraction of water information based on RADARSAT SAR and Landsat ETM+. Procedia Environ. Sci. 2011, 10 Pt C, 2301–2306. [Google Scholar] [CrossRef] [Green Version]
- Chen, Y.; Fan, R.S.; Yang, X.C.; Wang, J.; Latif, A. Extraction of urban water bodies from high-resolution remote-sensing imagery using deep learning. Water 2018, 10, 585. [Google Scholar] [CrossRef] [Green Version]
- Chini, M.; Hostache, R.; Giustarini, L.; Matgen, P. A Hierarchical Split-Based Approach for Parametric Thresholding of SAR Images: Flood Inundation as a Test Case. IEEE Trans. Geosci. Remote Sens. 2017, 55, 6975–6988. [Google Scholar] [CrossRef]
- Immerzeel, W.W.; Van Beek, L.P.H.; Bierkens, M.F.P. Climate Change Will Affect the Asian Water Towers. Science 2010, 328, 1382–1385. [Google Scholar] [CrossRef] [PubMed]
- Canaz, S.; Karsli, F.; Guneroglu, A.; Dihkan, M. Automatic boundary extraction of inland water bodies using LiDAR data. Ocean. Coast. Manag. 2015, 118, 158–166. [Google Scholar] [CrossRef]
- Lee, S.U.; Chung, S.Y.; Park, R.H. A comparative performance study of several global thresholding techniques for segmentation. Comput. Vis. Graph. Image Process. 1990, 52, 171–190. [Google Scholar] [CrossRef]
- Cohen, L.D. On active contour models and balloons. CVGIP Image Underst. 1991, 53, 211–218. [Google Scholar] [CrossRef]
- Klemenjak, S.; Waske, B.; Valero, S.; Chanussot, J. Automatic detection of rivers in high resolution SAR data. IEEE J. Sel. Top. Appl. Earth Obs. Remote Sens. 2012, 5, 1364–1372. [Google Scholar] [CrossRef] [Green Version]
- Zhang, K.; Song, H.; Zhang, L. Active contours driven by local image fitting energy. Pattern Recognit. 2010, 43, 1199–1206. [Google Scholar] [CrossRef]
- Deng, Y.; Zhang, H.; Wang, C.; Liu, M. An object-oriented polarimetric SAR water body extraction method combining texture and polarimetric decomposition. Remote Sens. Technol. Appl. 2016, 31, 714–723. (In Chinese) [Google Scholar]
- Song, H.P. Study on Polarimetric SAR Typical Feature Extraction Technology; The PLA Information Engineering University: Zhengzhou, China, 2012. (In Chinese) [Google Scholar]
- Hou, A.Y.; Kakar, R.K.; Neeck, S.; Azarbarzin, A.A.; Kummerow, C.D.; Kojima, M.; Oki, R.; Nakamura, K.; Iguchi, T. The global precipitation measurement mission. Bull. Am. Meteorol. Soc. 2014, 95, 701–722. [Google Scholar] [CrossRef]
- Gaglione, D.; Clemente, C.; Pallotta, L.; Proudler, I.; De Maio, A.; Soraghan, J.J. Krogager decomposition and Pseudo-Zernike moments for polarimetric distributed ATR. In Proceedings of the 2014 Sensor Signal Processing for Defence (SSPD), Edinburgh, UK, 8–9 September 201.
- Kidd, C.; Huffman, G. Global precipitation measurement. Meteorol. Appl. 2011, 18, 334–353. [Google Scholar] [CrossRef]
- Goodrich, D.C.; Faurès, J.-M.; Woolhiser, D.A.; Lane, L.J.; Sorooshian, S. Measurement and analysis of small-scale convective storm rainfall variability. J. Hydrol. 1995, 173, 283–308. [Google Scholar] [CrossRef]
- Lin, A.; Wang, X.L. An algorithm for blending multiple satellite precipitation estimates with in situ precipitation measurements in Canada. J. Geophys. Res. Atmos. 2011, 116, D21. [Google Scholar] [CrossRef] [Green Version]
- Yilmaz, K.K.; Hogue, T.S.; Hsu, K.L.; Sorooshian, S.; Gupta, H.V.; Wagener, T. Intercomparison of Rain Gauge, Radar, and Satellite-Based Precipitation Estimates with Emphasis on Hydrologic Forecasting. J. Hydrometeorol. 2005, 6, 497–517. [Google Scholar] [CrossRef]
- Van Zyl, J.J. Application of Cloude’s target decomposition theorem to polarimetric imaging radar data. Int. Soc. Opt. Photonics 1992, 1784, 184–191. [Google Scholar]
- Van Zyl, J.J.; Kim, Y.; Arii, M. Requirements for Model-based Polarimetric Decompositions. In Proceedings of the 7th European Conference on Synthetic Aperture Radar, Friedrichshafen, Germany, 2–5 June 2008. [Google Scholar]
- Li, P.; Xu, X.; Dong, H. Polarimetric SAR image feature selection and multi-layer SVM classification using separability index. Computer application. J. Comput. Appl. 2018, 38, 132–136. [Google Scholar]
- Cloude, S.R.; Pottier, E. An entropy based classification scheme for land applications of polarimetric SAR. IEEE Trans. Geosci. Remote Sens. 1997, 35, 68–78. [Google Scholar] [CrossRef]
- Cloude, S.R.; Papathanassiou, K.; Hajnsek, I. An Eigenvector Method for the Extraction of Surface Parameters in Polarmetric SAR. SAR Workshop CEOS Comm. Earth Obs. Satell. 2000, 450, 693–698. [Google Scholar]
- Ebert, E.E.; Janowiak, J.E.; Kidd, C. Comparison of Near-Real-Time Precipitation Estimates from Satellite Observations and Numerical Models. Bull. Am. Meteorol. Soc. 2010, 88, 47–64. [Google Scholar] [CrossRef] [Green Version]
- Cloude, S.R.; Pottier, E. Concept of polarization entropy in optical scattering. Opt. Eng. 1995, 34, 1599–1610. [Google Scholar] [CrossRef]
- Freeman, A.; Durden, S.L. Three-component scattering model to describe polarimetric SAR data. Int. Soc. Opt. Photonics 1992, 1784, 213–224. [Google Scholar]
- Freeman, A.; Durden, S.L. A three-component scattering model for polarimetric SAR data. IEEE Trans. Geosci. Remote Sens. 1998, 36, 963–973. [Google Scholar] [CrossRef] [Green Version]
- Yamaguchi, Y.; Moriyama, T.; Ishido, M.; Yamada, H. Four-component scattering model for polarimetric SAR image decomposition. IEEE Trans. Geosci. Remote Sens. 2005, 43, 1699–1706. [Google Scholar] [CrossRef]
- Yamaguchi, Y.; Sato, A.; Boerner, W.M.; Sato, R.; Yamada, H. Four-component scattering power decomposition with rotation of coherency matrix. IEEE Trans. Geosci. Remote Sens. 2011, 49, 2251–2258. [Google Scholar] [CrossRef]
- Yamaguchi, Y.; Singh, G.; Park, S.-E.; Yamada, H. Scattering power decomposition using fully polarimetric information. In Proceedings of the 2012 IEEE International Geoscience and Remote Sensing Symposium, Munich, Germany, 22–27 July 2012. [Google Scholar]
- Yamaguchi, Y.; Singh, G.; Cui, Y.; Park, S.E.; Yamada, H.; Sato, R. Comparison of model-based four-component scattering power decompositions. In Proceedings of the 2013 Asia-Pacific Conference on Synthetic Aperture Radar (APSAR), Tsukuba, Japan, 23–27 September 2013. [Google Scholar]
- Haralick, R.M.; Shanmugam, K.; Dinstein, I. Textural Feasures for Image Classification. IEEE Trans. Syst. Man Cybern. 1973, 3, 610–621. [Google Scholar] [CrossRef] [Green Version]
Figure 1.
Research area: (A) Yancheng coastal wetland on the upper right; (B) Shijiu Lake on the lower right.
Figure 1.
Research area: (A) Yancheng coastal wetland on the upper right; (B) Shijiu Lake on the lower right.
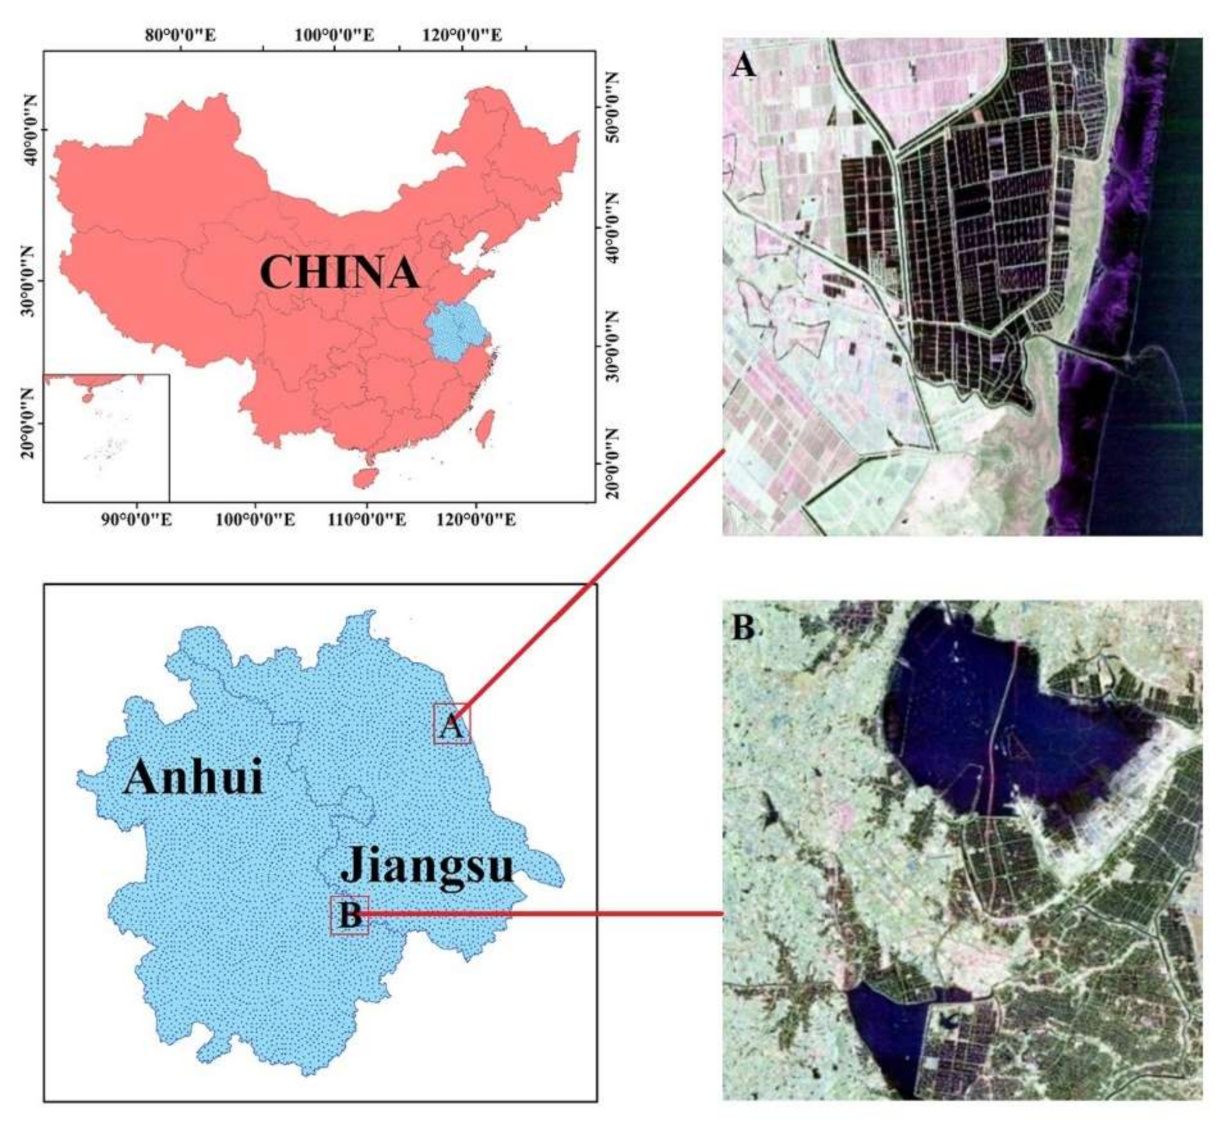
Figure 2.
Technology roadmap.
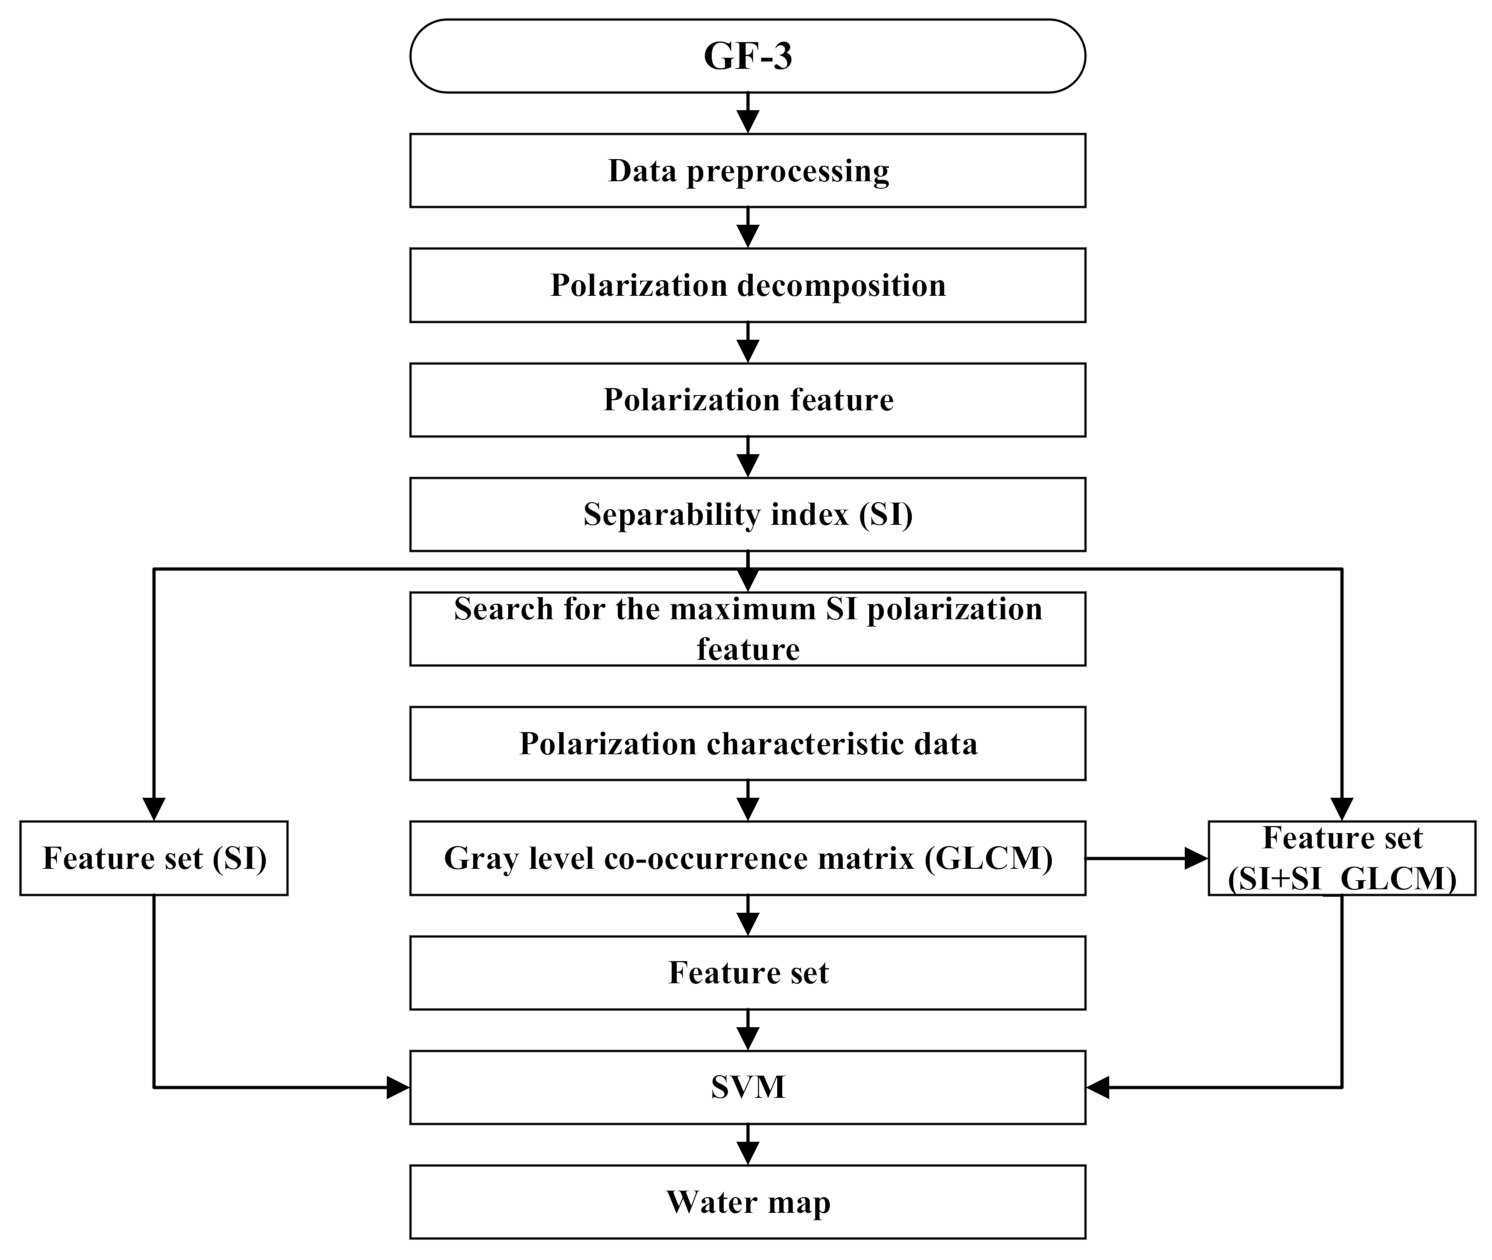
Figure 3.
Bar chart between SI value and characteristics of Yancheng coastal wetland.
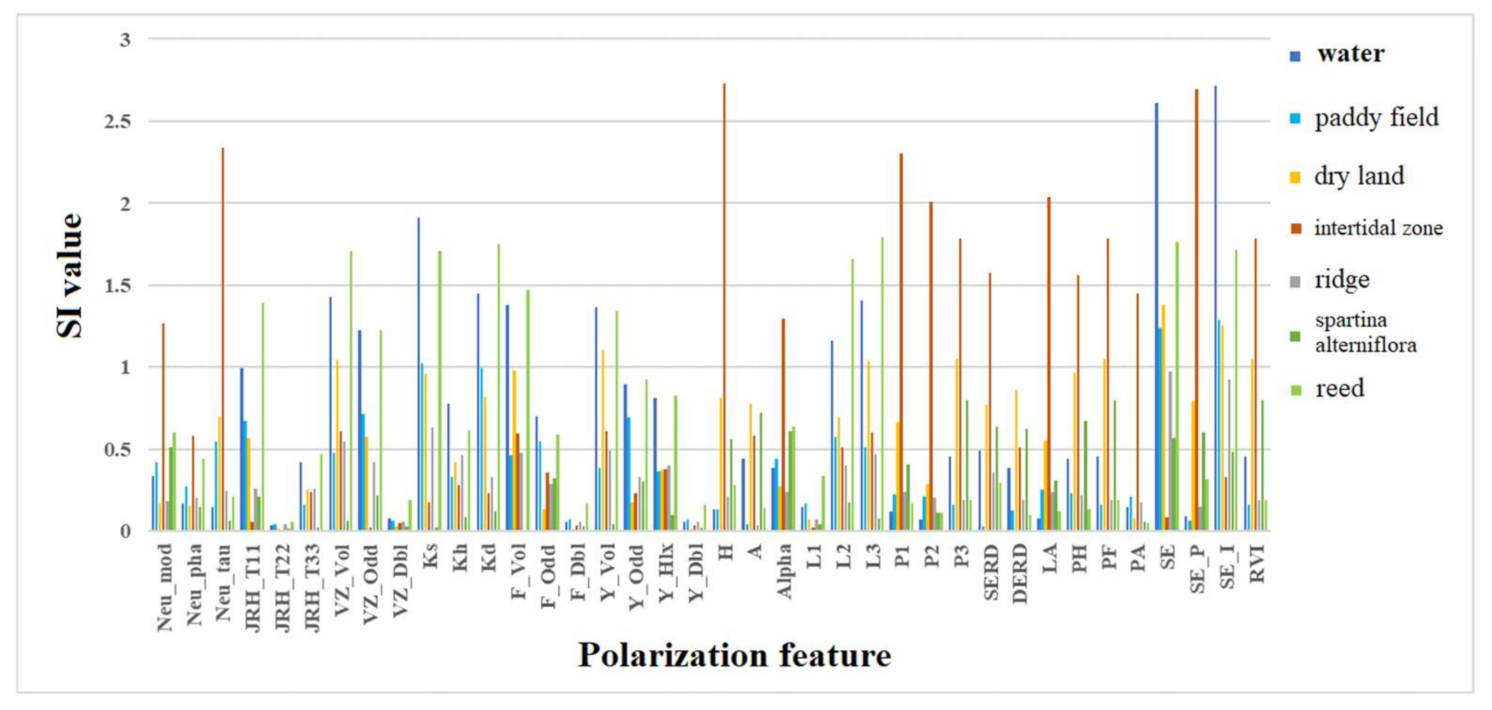
Figure 4.
The separability index of different features to lakes.
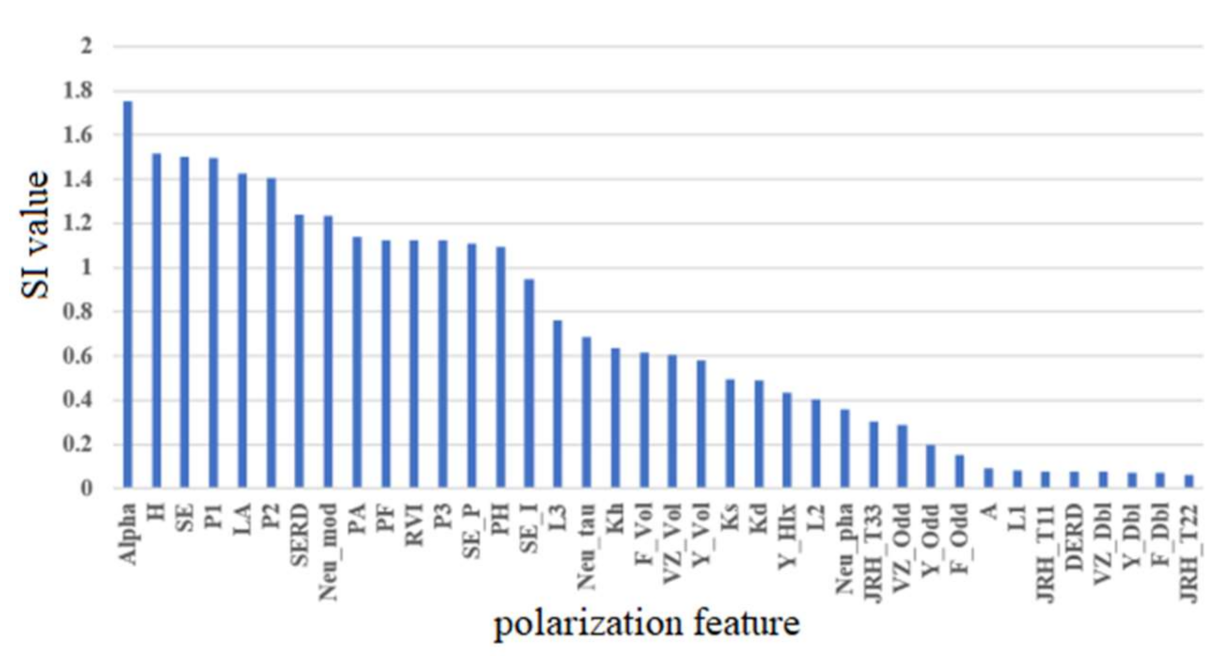
Figure 5.
Characteristic number and precision corresponding to different SI thresholds.
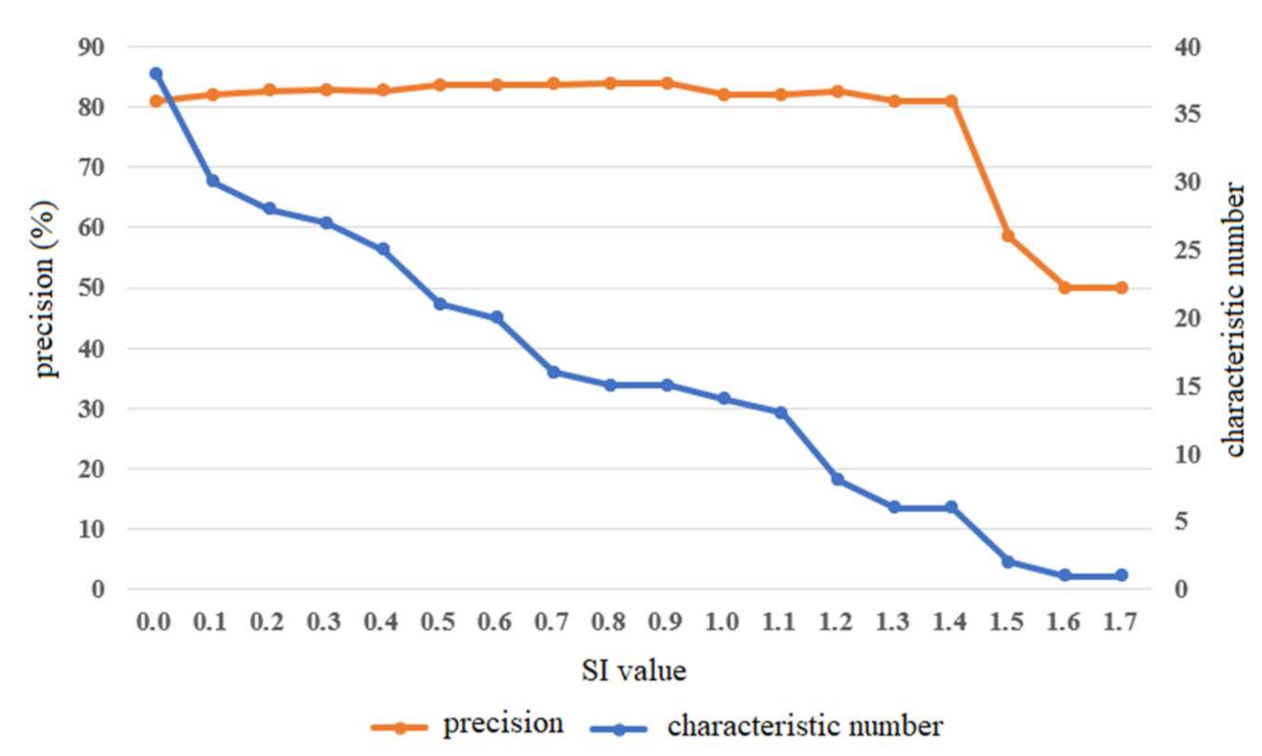
Figure 6.
Typical characteristics of different features. (a) SE_I feature; (b) SE feature; (c) Ks feature; (d) JRH_T22 feature; (e) F_Dbl feature; (f) Y_Dbl feature.
Figure 6.
Typical characteristics of different features. (a) SE_I feature; (b) SE feature; (c) Ks feature; (d) JRH_T22 feature; (e) F_Dbl feature; (f) Y_Dbl feature.

Figure 7.
Feature classification map of Yancheng coastal wetland. (a) HH—Extraction results; (b) HV—Extraction results; (c) VV—Extraction results; (d) ALL—Extraction results; (e) SI—Extraction results.
Figure 7.
Feature classification map of Yancheng coastal wetland. (a) HH—Extraction results; (b) HV—Extraction results; (c) VV—Extraction results; (d) ALL—Extraction results; (e) SI—Extraction results.
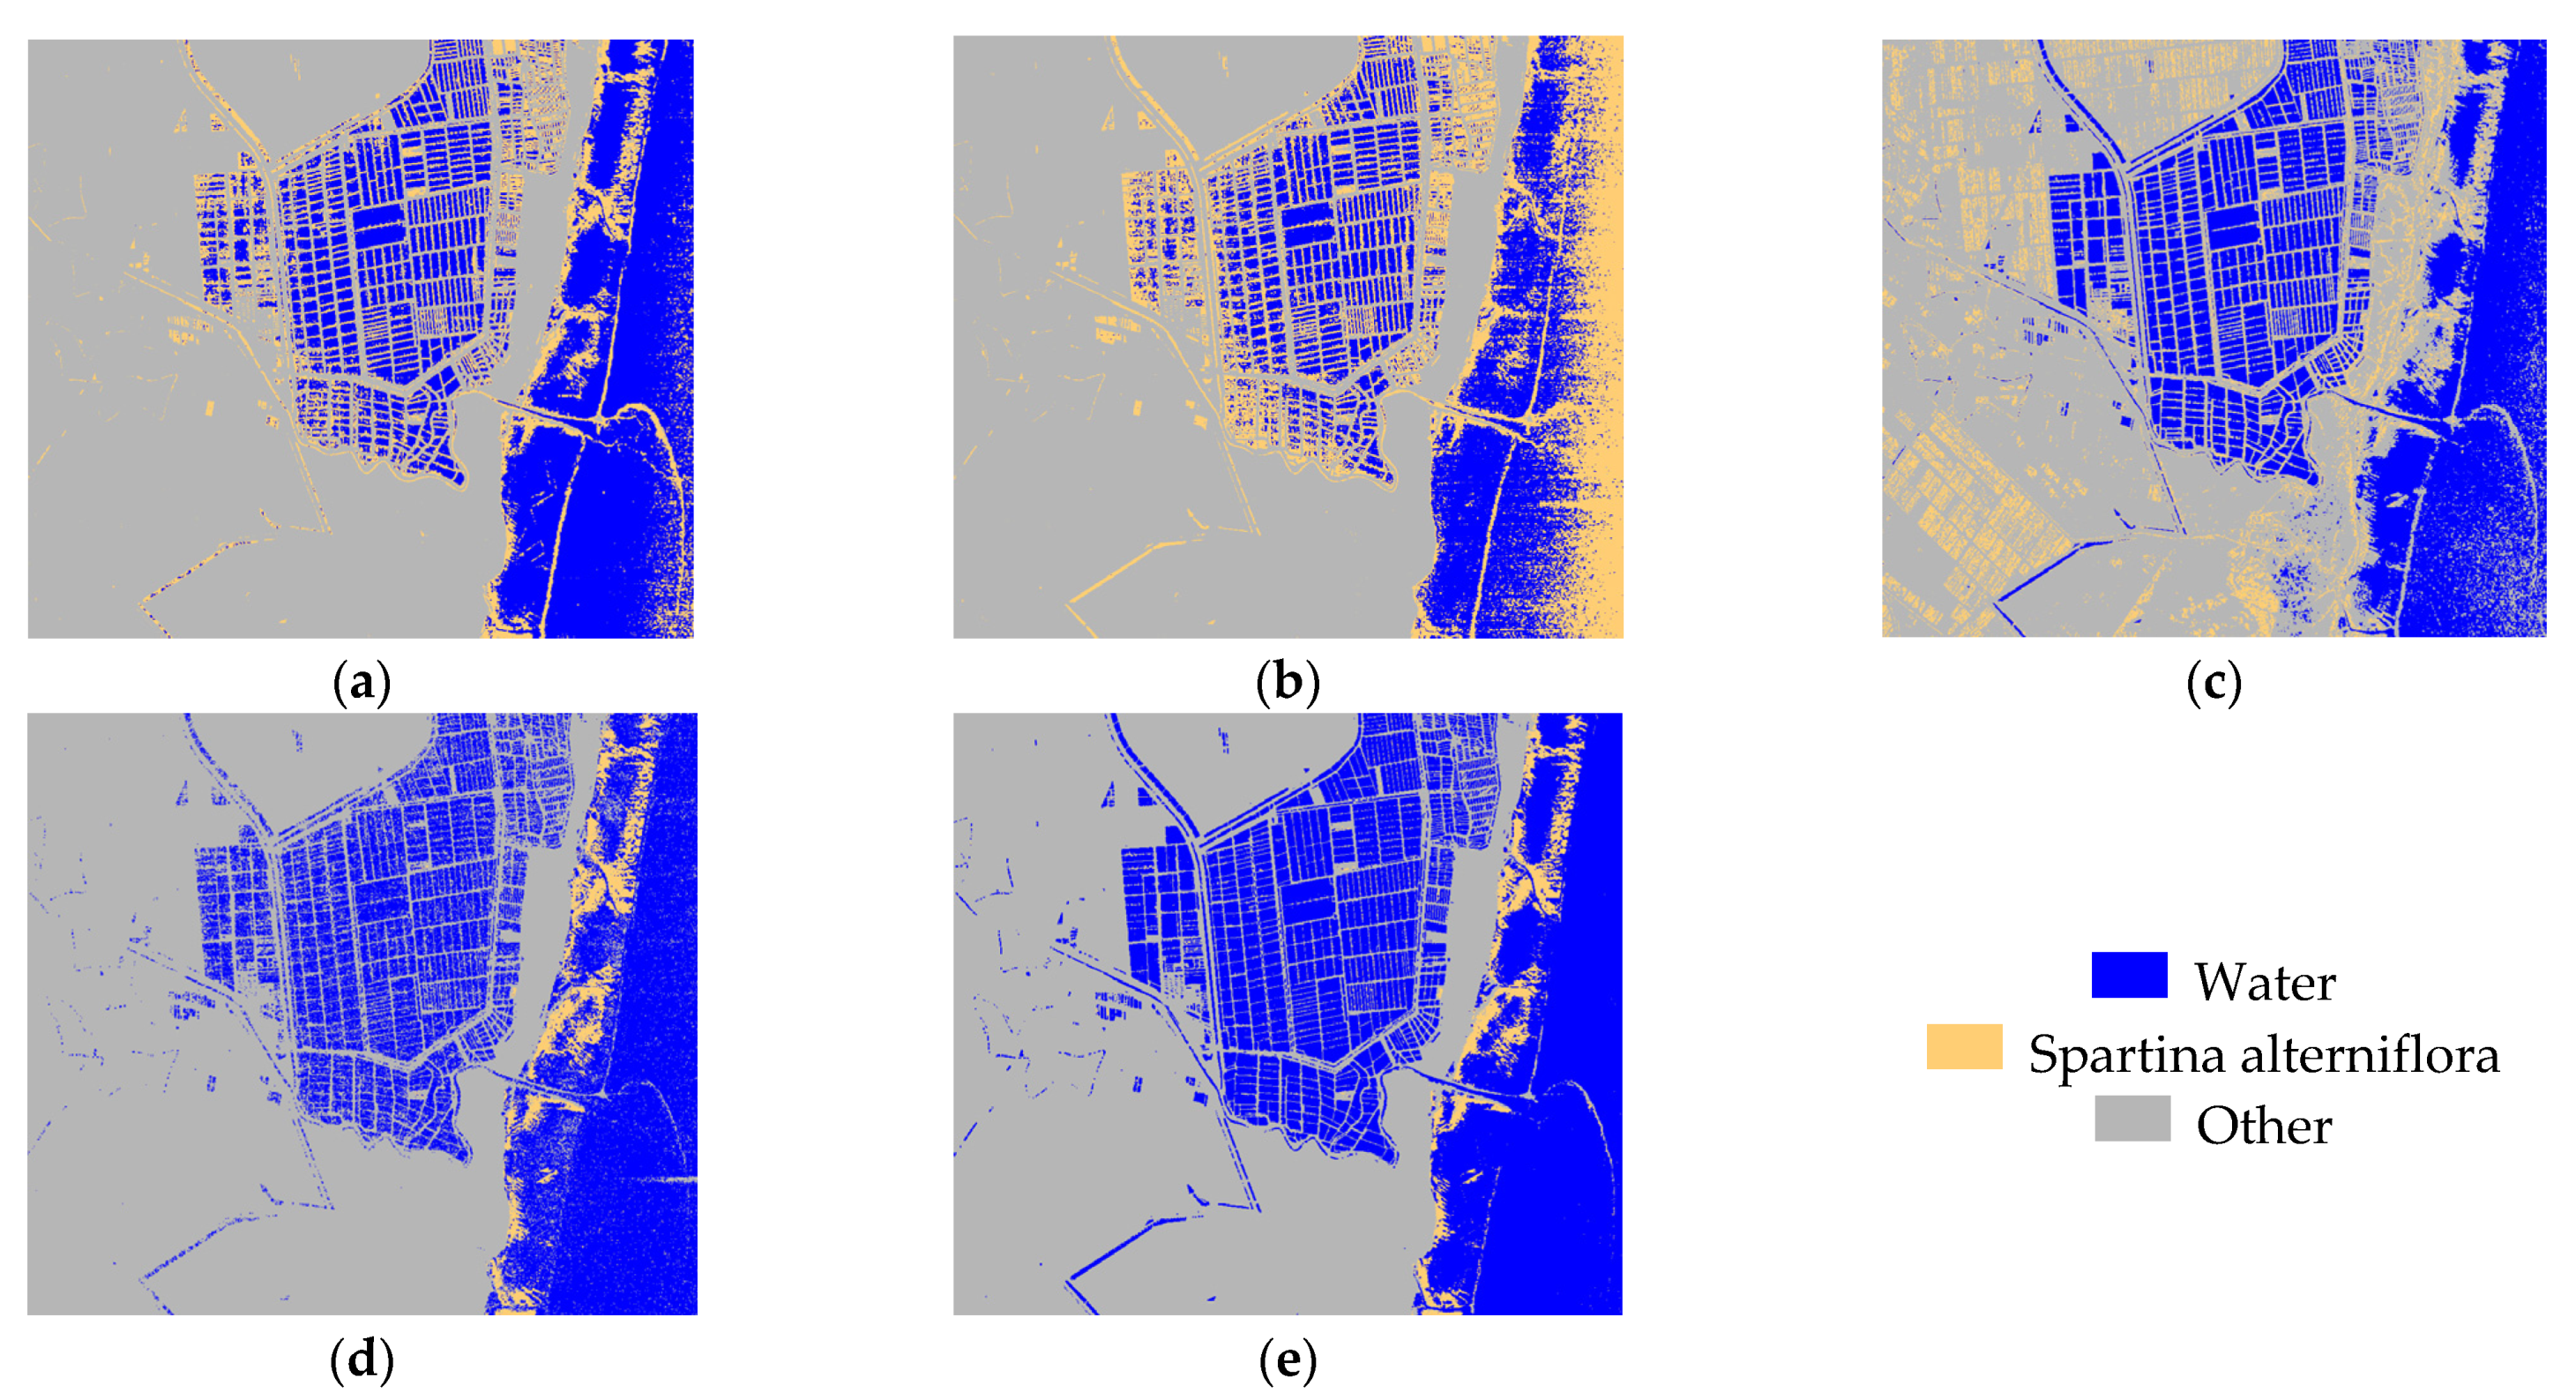
Figure 8.
Feature classification map of Shijiu Lake. (a) HH polarization image water area extraction results; (b) HV polarization image water area extraction results; (c) VV polarization image water area extraction results; (d) SI water extraction results; (e) SI+GLCM water extraction results; (f) SI+SI_GLCM water extraction results.

Table 1.
Data information and problems to be solved.
| Area | Imaging Mode | Polarization Mode | Time | Problems to Be Solved |
|---|---|---|---|---|
| Yancheng Coastal wetland | QPSI | HH/HV/VH/VV | 20 September 2017 | Mudflats are mixed with water bodies |
| Shijiu Lake | QPSI | HH/HV/VH/VV | 12 October 2018 | Distinguish between ponds and lakes |
Table 2.
The physical explanation of Pauli decomposition.
| Pauli Matrix | Pauli Coefficient | Scattering Type | Physical Interpretation |
|---|---|---|---|
| a | Single scattering | A sphere, a plane, or a three-sided Angle | |
| b | Even order scattering | Dihedral angle | |
| c | 45° even order scattering | Dihedral Angle at 45° tilt | |
| d | Cross polarization | No corresponding scattering mechanism |
Table 3.
Feature parameters extracted by different methods.
| Decomposition Method | Polarization Parameter | ||
|---|---|---|---|
| Neumann | Neu_mod | Neu_pha | Neu_tau |
| Huynen | JRH_T11 | JRH_T22 | JRH_T33 |
| Van Zyl | Van Zyl_Vol | Van Zyl_Odd | Van Zyl_Dbl |
| Krogager | Krogager_Ks | Krogager_Kh | Krogager_Kd |
| Freeman3 | Freeman_Vol | Freeman_Odd | Freeman_Dbl |
| Yamaguchi4 | Yamaguchi4_Vol | Yamaguchi4_Odd | Yamaguchi4_Hlx |
| Yamaguchi4_Dbl | |||
| H/A/Alpha | Entropy | Anisotropy | Alpha |
| L1 | L2 | L3 | |
| P1 | P2 | P3 | |
| SERD | DERD | ||
| Luneburg | Pedestal Height | ||
| Polarization Fraction | Polarization Asymmetry | ||
| Shannon Entropy | Shannon Entropy P | ||
| Shannon Entropy I | Radar Vegetation Index | ||
Table 4.
Accuracy results of feature classification in Yancheng coastal wetland.
| Feature Set | HH | HV | VV | ALL | SI |
|---|---|---|---|---|---|
| Feature dimension | 1 | 1 | 1 | 38 | 15 |
| overall accuracy | 88.50% | 58.60% | 79.41% | 87.05% | 94.74% |
Table 5.
Accuracy results of feature classification in Shijiu Lake.
| Feature Set | HH | HV | VV | SI | SI + GLCM | SI + SI_GLCM |
|---|---|---|---|---|---|---|
| Feature dimension | 1 | 1 | 1 | 15 | 23 | 20 |
| overall accuracy | 73.73% | 55.33% | 64.30% | 83.89% | 94.34% | 94.56% |
Publisher’s Note: MDPI stays neutral with regard to jurisdictional claims in published maps and institutional affiliations. |
© 2021 by the authors. Licensee MDPI, Basel, Switzerland. This article is an open access article distributed under the terms and conditions of the Creative Commons Attribution (CC BY) license (https://creativecommons.org/licenses/by/4.0/).
Share and Cite
MDPI and ACS Style
Wan, J.; Wang, J.; Zhu, M. Water Extraction from Fully Polarized SAR Based on Combined Polarization and Texture Features. Water 2021, 13, 3332. https://doi.org/10.3390/w13233332
AMA Style
Wan J, Wang J, Zhu M. Water Extraction from Fully Polarized SAR Based on Combined Polarization and Texture Features. Water. 2021; 13(23):3332. https://doi.org/10.3390/w13233332
Chicago/Turabian StyleWan, Jikang, Jiayi Wang, and Min Zhu. 2021. "Water Extraction from Fully Polarized SAR Based on Combined Polarization and Texture Features" Water 13, no. 23: 3332. https://doi.org/10.3390/w13233332
Note that from the first issue of 2016, this journal uses article numbers instead of page numbers. See further details here.