Article

On the Degradation of Glyphosate by Photocatalysis Using TiO2/Biochar Composite Obtained from the Pyrolysis of Rice Husk

1
Vietnam Academy of Science and Technology, University of Science and Technology of Hanoi, 18 Hoang Quoc Viet, Cau Giay, Hanoi 11307, Vietnam
2
Institute of Environmental Technology, Vietnam Academy of Science and Technology, 18 Hoang Quoc Viet, Cau Giay, Hanoi 11307, Vietnam
3
Institute for Tropical Technology, Vietnam Academy of Science and Technology, 18 Hoang Quoc Viet, Cau Giay, Hanoi 11307, Vietnam
4
National Institute for Food Control, 65 Pham Than Duat, Mai Dich, Cau Giay, Hanoi 11309, Vietnam
5
UMR 5566 LEGOS, Université de Toulouse, IRD, CNES, CNRS, UPS, 14 Avenue Edouard Belin, 31400 Toulouse, France
6
Institute of Natural Products Chemistry, Vietnam Academy of Science and Technology, 18 Hoang Quoc Viet, Cau Giay, Hanoi 11307, Vietnam
*
Author to whom correspondence should be addressed.
Water 2021, 13(23), 3326; https://doi.org/10.3390/w13233326
Submission received: 14 October 2021 / Revised: 11 November 2021 / Accepted: 18 November 2021 / Published: 24 November 2021
(This article belongs to the Section Wastewater Treatment and Reuse)

Abstract

:
In this study, titanium dioxide (TiO2) nanoparticles are immobilized onto rice husk biochar (RHB), as a porous support, for the photodegradation of glyphosate under UV light irradiation. The TiO2/RHB composites are prepared by pyrolysis and the sol-gel method. The SEM, XRD, EDX, and FT-IR results confirm the graphene structure of RHB and the formation of 10.61 nm TiO2 nanoparticles on the catalyst support. The effects of operating conditions, including catalyst dosage (3 g L−1, 5 g L−1, 10 g L−1, and 20 g L−1) and different illumination conditions (9 W lamp, 2 × 9 W lamps), on the removal of glyphosate from aqueous solutions were investigated. The photodegradation efficiency of 15 mg L−1 of commercial glyphosate was up to 99% after 5 h of irradiation at pH 3.0, with a TiO2/RHB dosage of 10 g L−1. However, the mineralization efficiency under this condition was lower than the decomposition efficiency of glyphosate, proving the partial degradation of glyphosate into AMPA and other metabolites after 5 h of reaction.

1. Introduction

Glyphosate (N-(phosphonomethyl) glycine, also known by the trade name Roundup and Rodeo) has been a dominant herbicide worldwide for many years, since its first commercial introduction in 1974 [1]. This herbicide is non-selective, systemic, and post-emergent, which is decisive for removing a wide range of weeds. On the other hand, the residue glyphosate from various sources, such as industrial effluents, agricultural runoff, and spilt chemicals [1], was considered as a pollutant, which contaminates the environment. In areas in the USA where genetically modified glyphosate-resistant crops are grown, glyphosate and its main metabolite aminomethylphosphonic acid (AMPA) were found in soil, surface water, and groundwater at levels from 2 to 430 μg L−1 [2,3,4,5].
Photocatalysis based on TiO2 particularly emerges for glyphosate treatment because it could completely degrade pollutants into harmless chemicals, such as CO2 and H2O, under normal temperature and air pressure; for example, Chen and Liu [6] initially achieved 92% degradation of glyphosate at 0.25 mmol L−1 with a TiO2 dosage of 6.0 g L−1 after 3.5 h of irradiation. Similarly, Xue et al. [7] obtained a removal efficiency of 76% for 0.1 mmol L−1 of glyphosate in 1 h by cerium-doped TiO2 nanotubes. However, TiO2 particles are used as suspended nanoparticles, which leads to difficulty in separating TiO2 from the treated solution [8]. Therefore, the idea of the immobilization of TiO2 on a support material, which has a high specific area and low density, such as activated carbon (AC), has been proposed to overcome this problem and enhance photocatalysis efficiency [8,9]. These main features not only increase the amount of catalyst immobilized, but also collect the target molecules together around TiO2 by adsorption. Nevertheless, the main disadvantage of activated carbon lies in its high manufacturing energy requirements and relatively high cost. In comparison, biochar (BC) is an alternative solution with simple production and low cost, while keeping similar adsorption characteristics [10]. Therefore, in recent years, the research direction has gradually been shifted to focus on biochar, due to its advantages in price and production of abundant raw materials from agricultural by-products. The study of Herath et al. [10] indicated that the adsorption capacity is the highest, 82%, at a pH of 4.0, but reduces significantly if the pH increases. A similar observation was reported by Dissanayake Herath et al. [11], who showed that the adsorption capacity could be enhanced to 100% using wood biochar at a pH of 5. The glyphosate removal efficiency was enhanced thanks to a decrease in the pH of the solution to acidic [12], especially for the case of biochars derived from agricultural by-products, such as rice husk or wood. At the experimental pH (pH 3), which is less than the pH of the point zero charge (pzc), the surface charge of biochars exhibits a positive charge, due to the protonation of the pyridinic group, oxonium groups, and protonated aromatic rings, therefore favoring the adsorption of anionic compounds [13]. Additionally, according to the study of Speth [14], glyphosate performs its amphoteric properties with phosphonic, carboxylic, and amino groups. It was proven that at a pH between 2.6 and 5.6, glyphosate is a negatively charged compound and is strongly adsorbed by biochars [14]. Hence, activated biochar with a high adsorption capacity and pzc suitable for removing glyphosate at acidic pH [12] has been suggested to be a good supported catalyst.
Although research on glyphosate treatment using TiO2/BC composites is still lacking, this composite showed excellent performance for removing organic pollutants through both adsorption and photocatalysis processes. The TiO2/BC composites were reported to exhibit higher catalytic activity compared to pure TiO2 in the decolorization and mineralization of methyl orange, which was 96.88% and 83.23%, respectively [15]. In 1999, Lu et al. [16] conducted a degradation study of the insecticide propoxur degradation of TiO2 coated onto five different substrates (an uncharacterized granular activated carbon (GAC), zeolite, brick, quartz, and glass beads). The results showed that the removal efficiency of GAC–TiO2 was 95%, about 20% higher compared to the maximum efficiency of other combinations. These previous studies suggest the feasibility of producing photocatalyst composites based on activated biochar, with nano-sized TiO2 attached to the surface. This strategy is expected to effectively remove glyphosate residue due to the stabilization enhancement of nano-sized particles, while retaining the properties of both biochar and TiO2 components.
This study focuses on investigating glyphosate treatment at acidic pH by photocatalysis in the presence of supported TiO2 on rice husk-derived biochar (TiO2/RHB). The nanocomposite catalysts TiO2/RHB were prepared by coating the biochar surface with TiO2, following the sol-gel method, and characterized by SEM, EDX, XRD, and FT-IR. The photocatalytic performance of the composites was evaluated in terms of glyphosate degradation under UV light irradiation (λ = 365 nm) at different operating conditions, involving the removal and mineralization efficiency. The results obtained could contribute to more profound research in the future about the treatment of organic pollutants by photocatalysis, with materials produced from agricultural by-products as environmentally friendly materials.

2. Materials and Methods

2.1. Chemical Reagents

Glyphosate (N-(phosphonomethyl) glycine, C3H8NO5P, 98%) was supplied by Sigma Aldrich (Singapore). Commercial glyphosate 30% (or glyphosate isopropylamine 41%), purchased from Dah Chen Chemical & Industry Corp., was used for the photocatalysis experiments. The commercial glyphosate comprises sodium lauryl ether sulfate 15%, polyethylene glycol 10%, polydimethylsiloxane 0.5%, and water 44.5%.
The chemicals for TiO2 synthesis include titanium tetraisopropoxide (Ti[OCH(CH3)2]4, 97%) and diethanolamine (HN[CH2CH2OH]2, 99%) from Wako (Osaka, Japan), and ethanol (C2H5OH, ≥99%) from Merck (Darmstadt, Germany).
Sodium molybdate (Na2MoO4, ≥98%), ninhydrin (C9H6O4, 97%), L-ascorbic acid (C6H8O6, ≥99%), and antimony potassium tartrate (K2Sb2C8H4O12·3H2O, ≥99%) for analysis were purchased from Sigma Aldrich. Hydrochloric acid (HCl, 35–37%) and sodium hydroxide (NaOH, ≥99.5%) are all pure chemicals. Analysis standard chemicals, including glyphosate standard solution, were prepared in Milli-Q water.

2.2. TiO2 Coated Biochar Preparation

The RHB was produced from rice husk in a rural area of Bac Ninh Province, Vietnam. Rice husk was grounded and sieved several times to select the 3–5 mm diameter particles. It was covered by commercial char on the top and pyrolyzed with a heating rate of 5 °C min−1 and calcination under limited oxygen condition to 600 °C following TG/DTG process in a Nabertherm furnace (Lilienthal, Germany). The RHB was then cooled to room temperature in a desiccator, then washed with distilled water until the pH of the filtrate reached 6–7. Finally, it was dried in a stove for 150 °C until the weight became constant and stored in vacuum desiccators for use.
The TiO2/RHB composites were synthesized using a modified sol-gel method [17,18]. The proportions of titanium tetraisopropoxide (Ti[OCH(CH3)2]4, TTIP), diethanolamine (DEA) and ethanol (EtOH) by molar ratio are 1, 1 and 30, respectively. First, TTIP was dissolved in EtOH and stirred until a transparent solution was obtained. Subsequently, DEA was slowly added into the TTIP solution, which was then gently stirred for 5 h. Finally, the RHB was dipped into the mixture for 1 h. Air drying at room temperature for 10 h was then applied to polymerize the gel on the surface of the RHB. Then, the sample was calcined at 450 °C for 1 h with a heating rate of 2 °C min−1 to obtain anatase phase of TiO2.

2.3. Research Methods

2.3.1. Characterization Methods

Surface morphology and porosity of raw RHB and synthesized catalysts TiO2/RHB were observed by scanning electron microscopy—SEM (Jeol JMS-6510LV). SEM was connected with energy dispersive X-ray spectroscopy (EDXS) for chemical element composition analysis. X-ray diffraction (Thermal Scientific XRD Equinox 5000) results provide and confirm the information of the crystallographic structure of the prepared activated carbon samples. The characteristics of and changes in functional groups present before and after treatment were investigated by measuring the spectrum in the range of 4000–400 cm−1 by FT-IR spectrometer (Thermal science iS50-Thermo Scientific, Waltham, MA, USA).

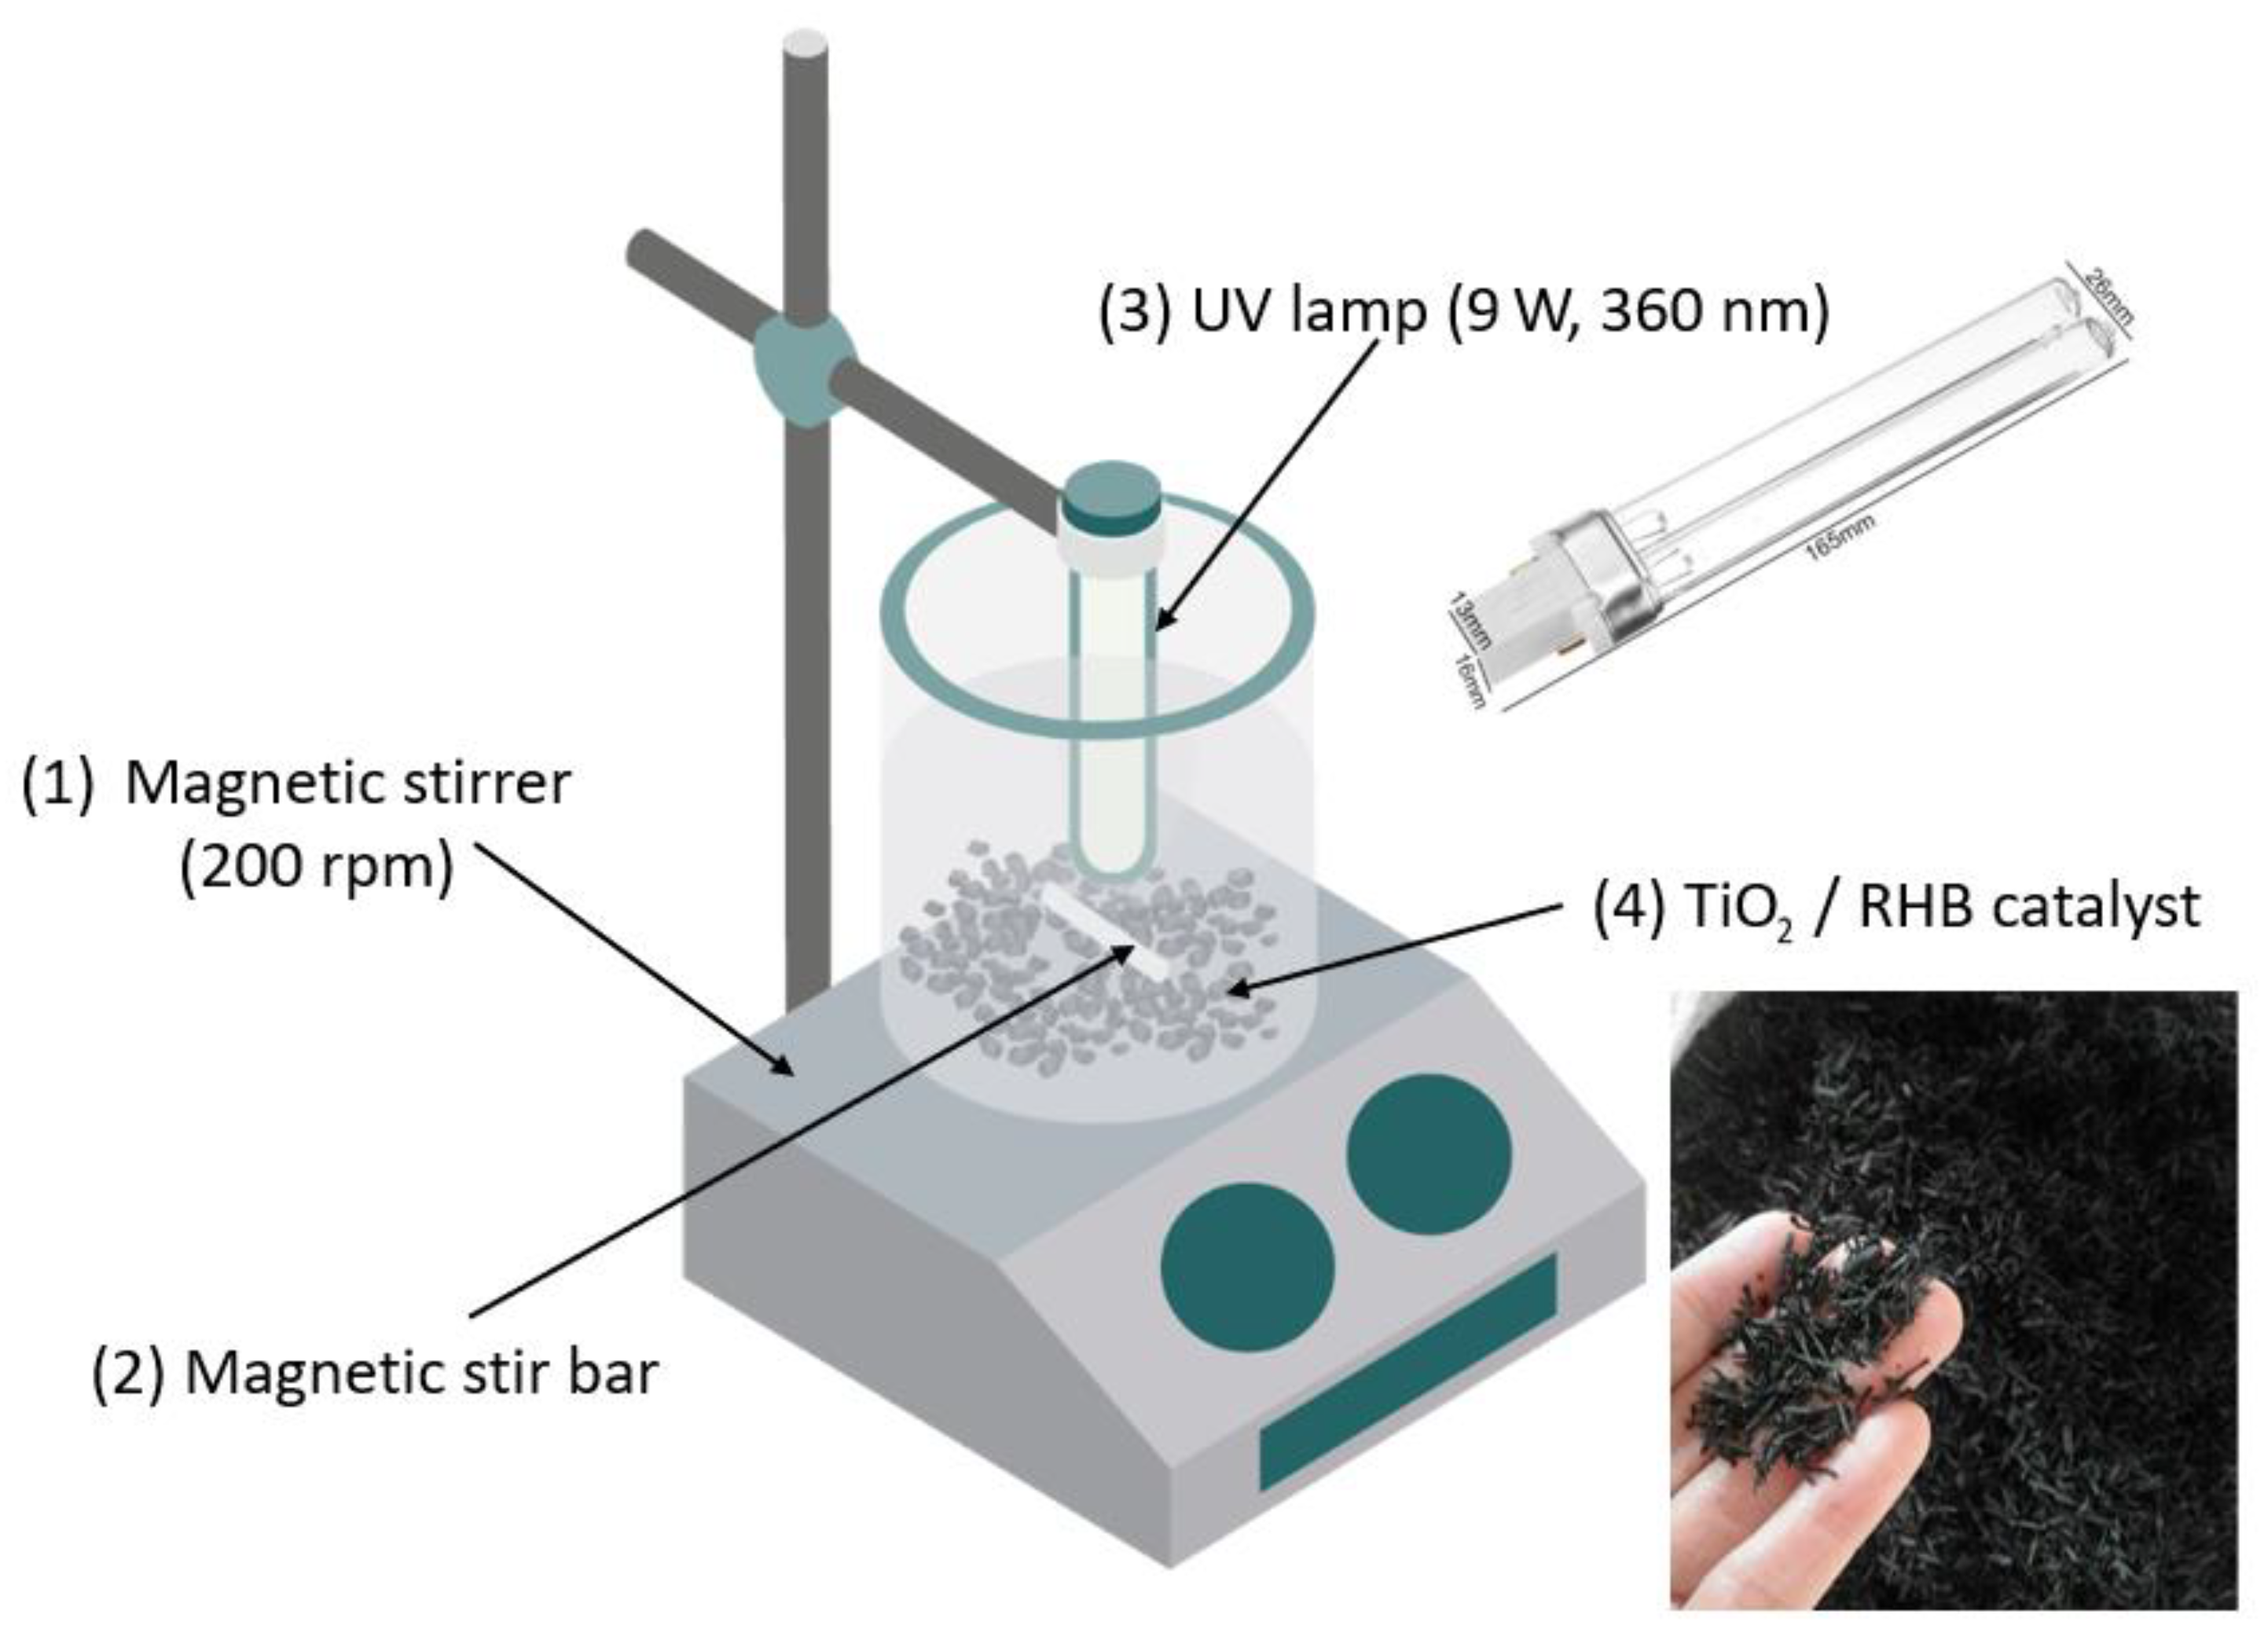
2.3.2. Experimental Setup

The photoactivity of TiO2/RHB to remove contaminants from a solution in acidic pH was evaluated based on the decomposition of glyphosate solution (15 mg L−1) under UV light irradiation (365 nm, Appendix A) and at room temperature (28–30 °C) (Figure 1). In each experiment, 400 mL aqueous solutions of 15 mg L−1 commercial glyphosate solutions (30%) were treated at various conditions, including TiO2/RHB dosage (at 3 g L−1, 5 g L−1, 10 g L−1 and 20 g L−1) [6] and irradiation (9 W and 2 × 9 W lamps), adjusted to pH 3 by HCl 1M. At a pH of 3.0, the adsorbent surface was positively charged (see Appendix B) while glyphosate was anionic [11]. The beaker containing the mixture was placed on a magnetic stirrer and stirred during the treatment at 200 rpm for 5 h. This stirring speed allows the mass transfer to occur while avoiding mechanically breaking the TiO2/RHB structure.
Prior to the irradiation step, the mixture was stirred in the dark for 60 min to achieve adsorption/desorption equilibrium on the material surface. The experimental system was then set up with one 9 W lamp emitting at 365 nm. In order to explore the effects of the irradiation intensity on the glyphosate removal efficiency, the experiments were also carried out with 2 parallel UV lamps (at 365 nm, 9 W each), which doubled the irradiation intensity. The irradiation tests were conducted with constant stirring (200 rpm) during the reaction. Ten milliliters of the solution was collected after each hour of illumination. The samples were taken, centrifuged at 5000 rpm for 15 min, filtered through a 0.45 μm membrane filter, and then analyzed by UV–Visible spectrophotometer (UV-1800 Shimadzu, Japan). Glyphosate and AMPA in the samples were analyzed by liquid chromatography–mass spectrometry (LC–MS/MS, Exion AC, 6500 Triple Quad, Ab Sciex).

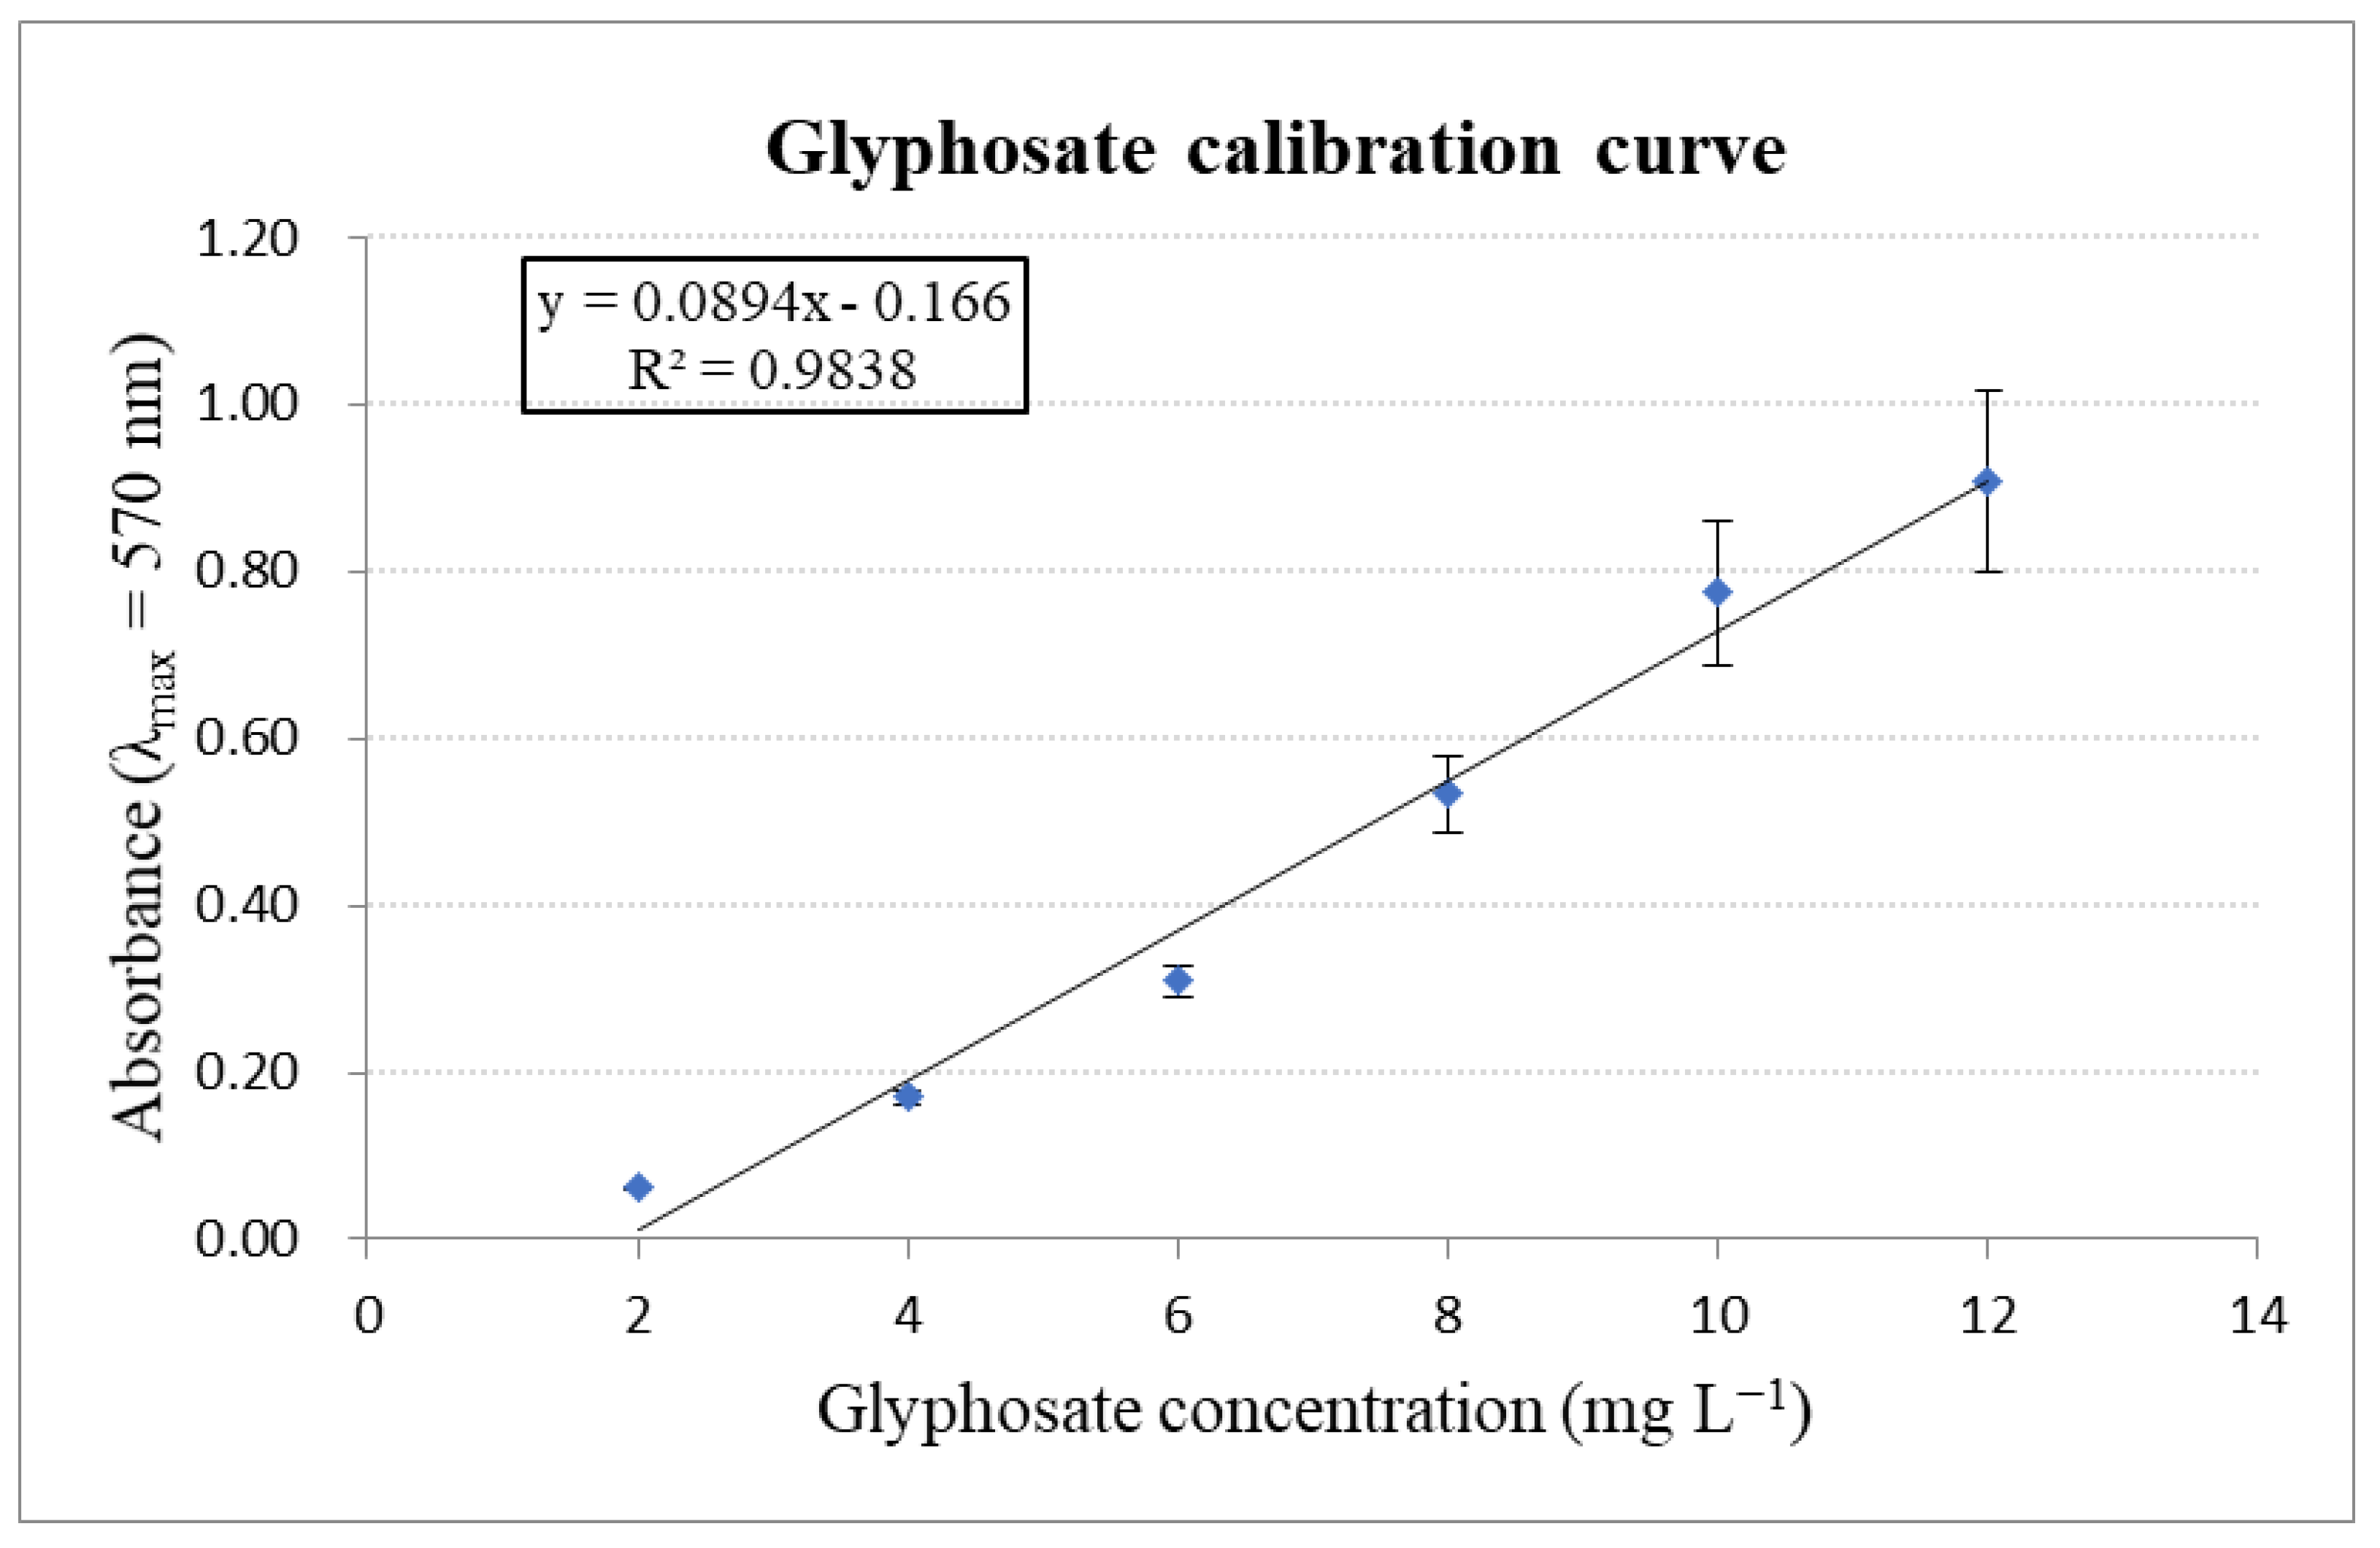
2.3.3. Evaluation of Photocatalysis Activity

The photocatalytic activity of the material was evaluated in terms of glyphosate photodegradation and mineralization into ion orthophosphate PO43−. The residues of glyphosate and orthophosphate produced were measured by the spectrometric method with UV-1800 (Shimadzu, Japan).
The concentration of glyphosate was analyzed by producing Ruhemann’s purple and the absorbance was measured at maximum wavelength λmax = 570 nm [19]. The glyphosate concentration was determined based on the calibration curve (Appendix C). This analytical method is efficient for glyphosate determination in water samples, with LOD of 0.04 μg mL−1 and LOQ of 0.11 μg mL−1 [19]. The glyphosate values are reported with a precision of 5%.
The degraded glyphosate was determined using the following equation:
[ G L Y P ] A , t = [ G L Y P ] 0 [ G L Y P ] t
The removal efficiency was calculated according to the following equation:
R e m o v a l   e f f i c i e n c y   ( % ) = [ G L Y P ] 0 [ G L Y P ] t [ G L Y P ] 0 × 100
where [GLYP]0 and [GLYP]t denote the initial concentration of glyphosate (mg L−1) at t = 0, and at t hour, respectively. t = 0 is the time when the adsorption equilibrium is reached and the lamp is switched on at the same time.
Orthophosphate PO43− concentration was determined according to the standard method of ISO 6878:2004. The reaction between orthophosphate ion, molybdate and antimony ions forms an intensely colored antimony-phospho-molybdate complex. This complex is reduced to a blue-colored complex by ascorbic acid [20]. The absorbance of this complex was measured at the maximum wavelength λmax = 880 nm and determined based on the calibration curve (Appendix D). The phosphate concentration values are reported with an absolute precision of 5%. Based on the equivalence of 169.07 g mol−1 of glyphosate with 94.97 g mol−1 of orthophosphate produced, the corresponding concentration of glyphosate that degraded into orthophosphate is calculated according to the following equation:
[ G L Y P ] C , t = [ P ] t 0.5617
where [GLYP]C,t, and [P]t are the concentration of degraded glyphosate (mg L−1) and the concentration of orthophosphate at t hour (mg L−1), respectively.
LC–MS/MS was used for further investigation of glyphosate degradation. Analytical ExionLC HPLC, designed for seamless integration with SCIEX mass spectrometers, was performed on Thermo Fisher’s Hypercarb column (2.5 µm × 100 mm × 4.6 mm). The mobile phases were phase A (0.1% formic acid + 10 mM ammonium formate in water) and phase B (0.1% formic acid + 10 mM ammonium formate in methanol). The volume injected into the LC–MS/MS system for analysis was 10 µL and the flow rate was 0.5 mL min−1. The gradient elution profile and the compound information are given in Appendix E. The European Union (EU) QuPPe method with a limit of detection (LOD) of 3 µg L−1 and limit of quantification (LOQ) of 10 µg L−1, which are sensitive enough, was used in this study to achieve good accuracy and precision.

3. Results

3.1. Characterization of TiO2/RHB Composites

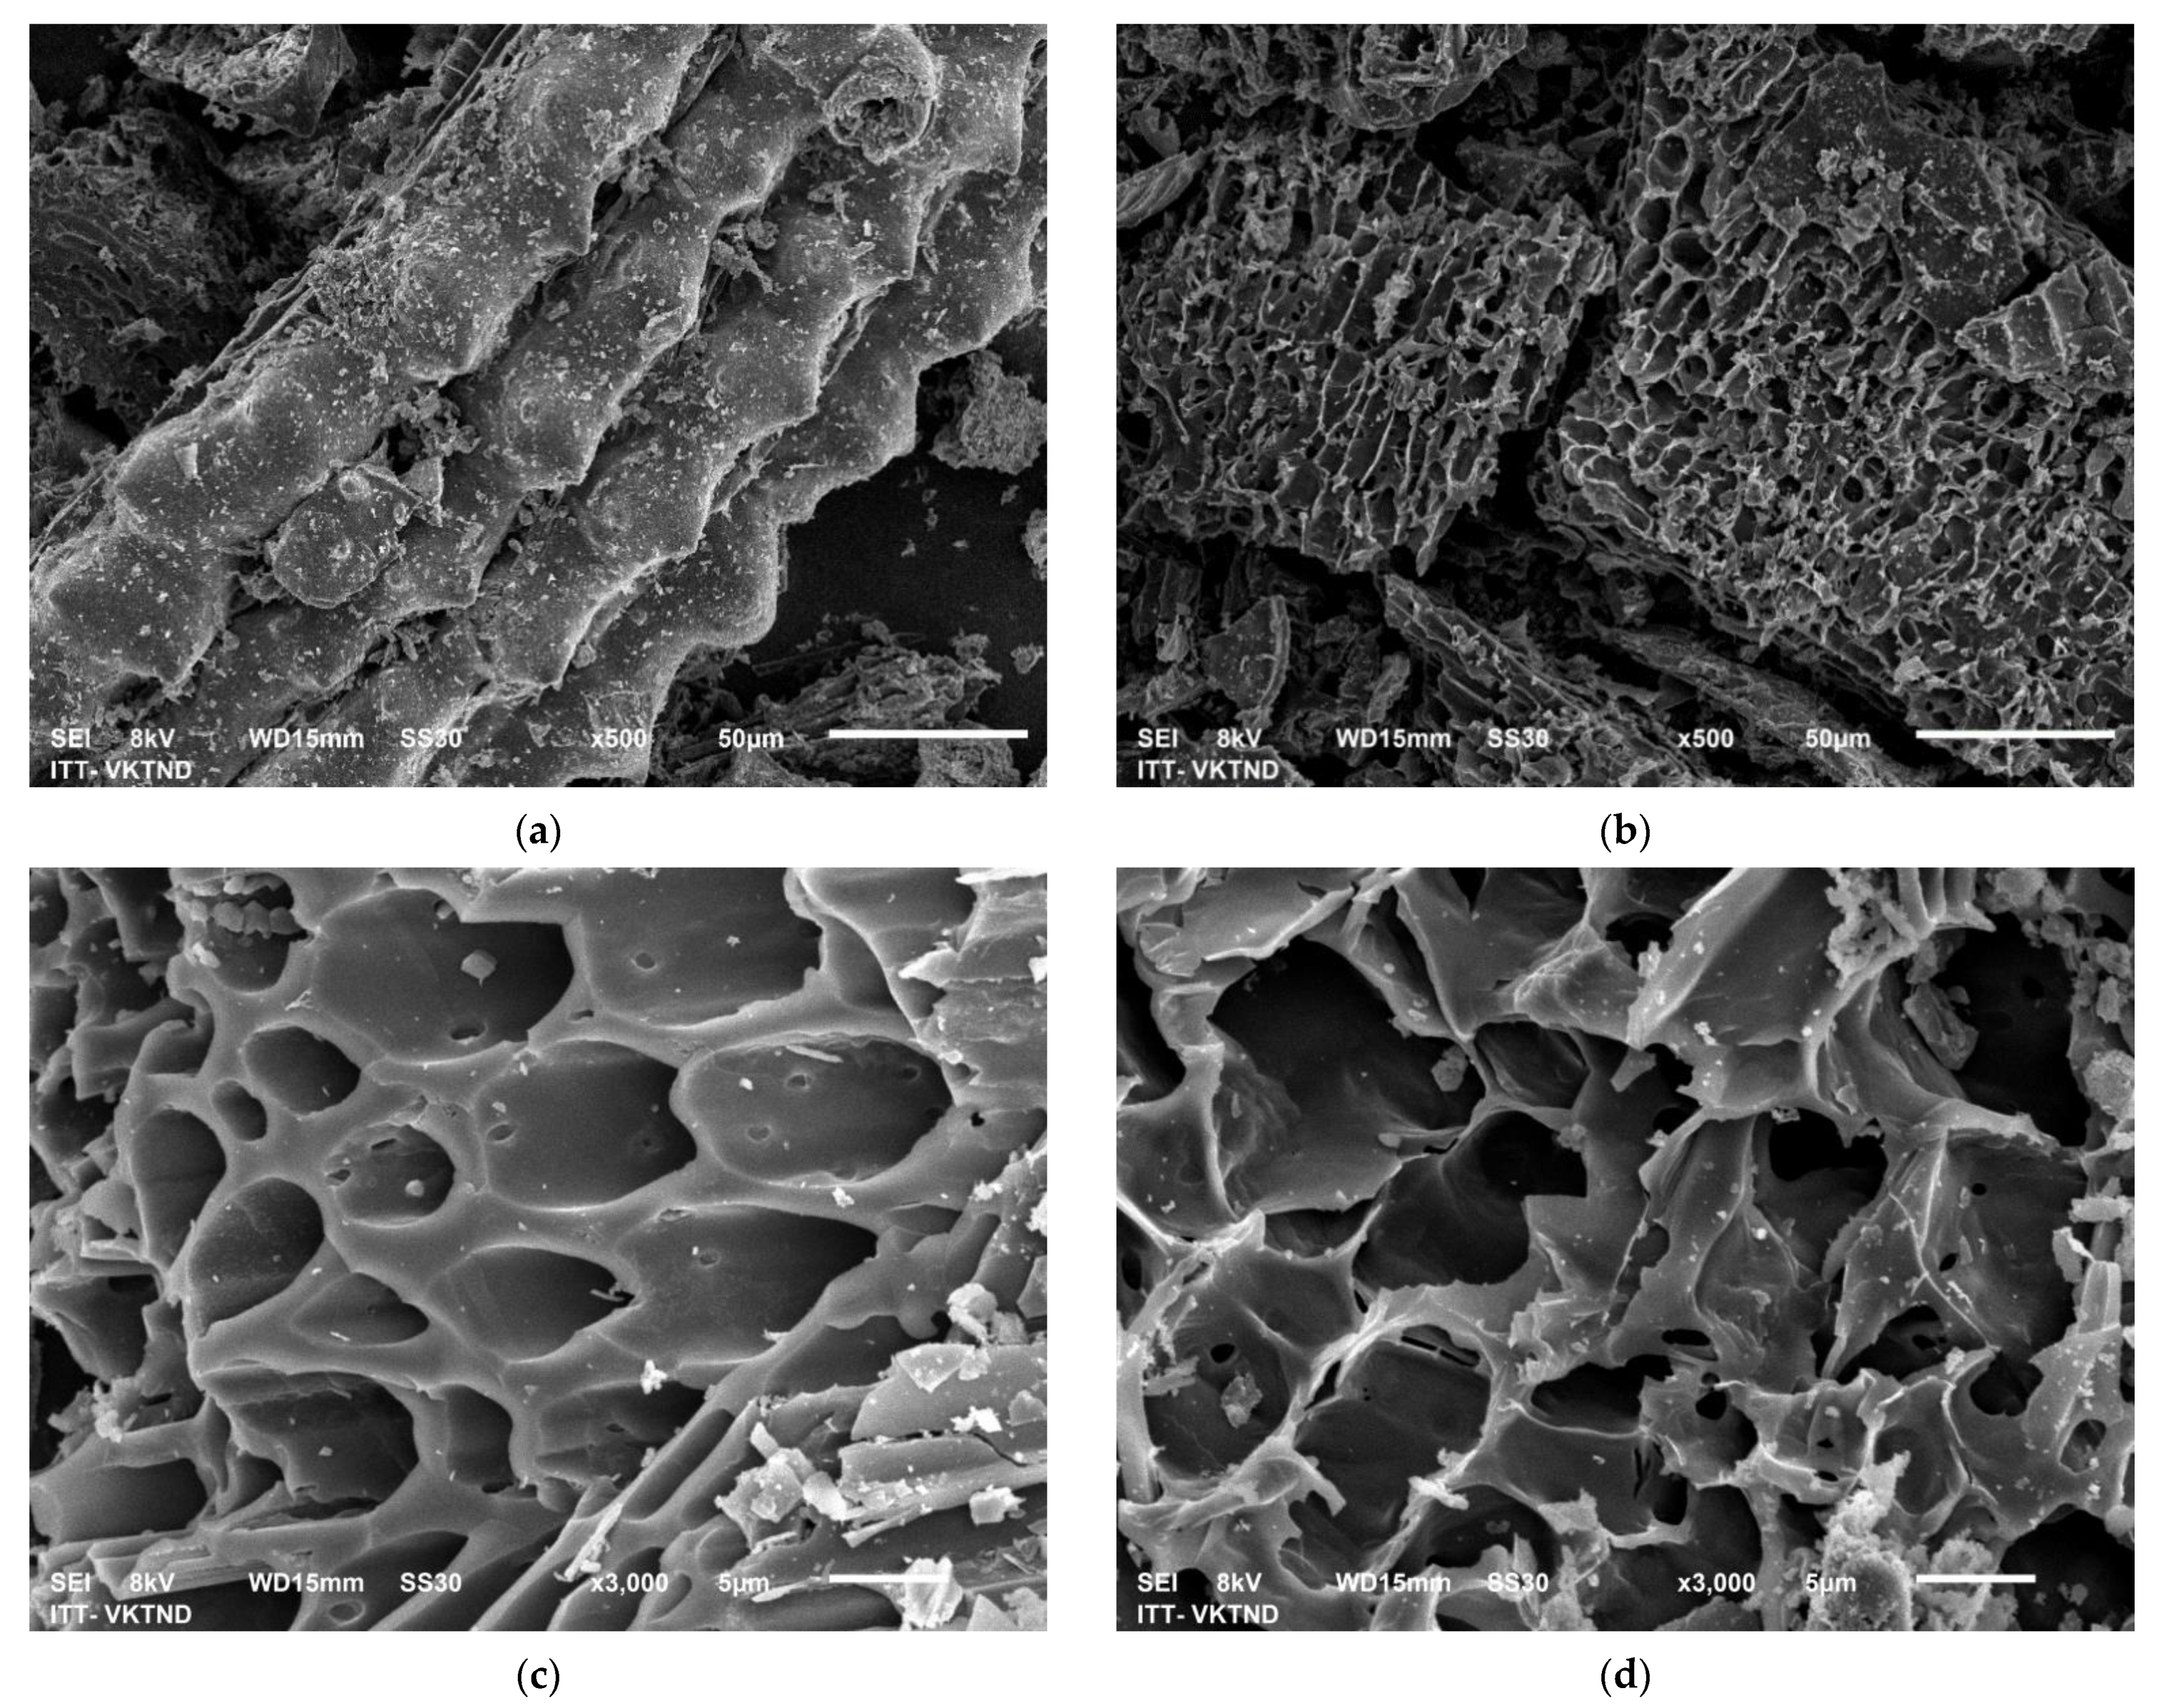
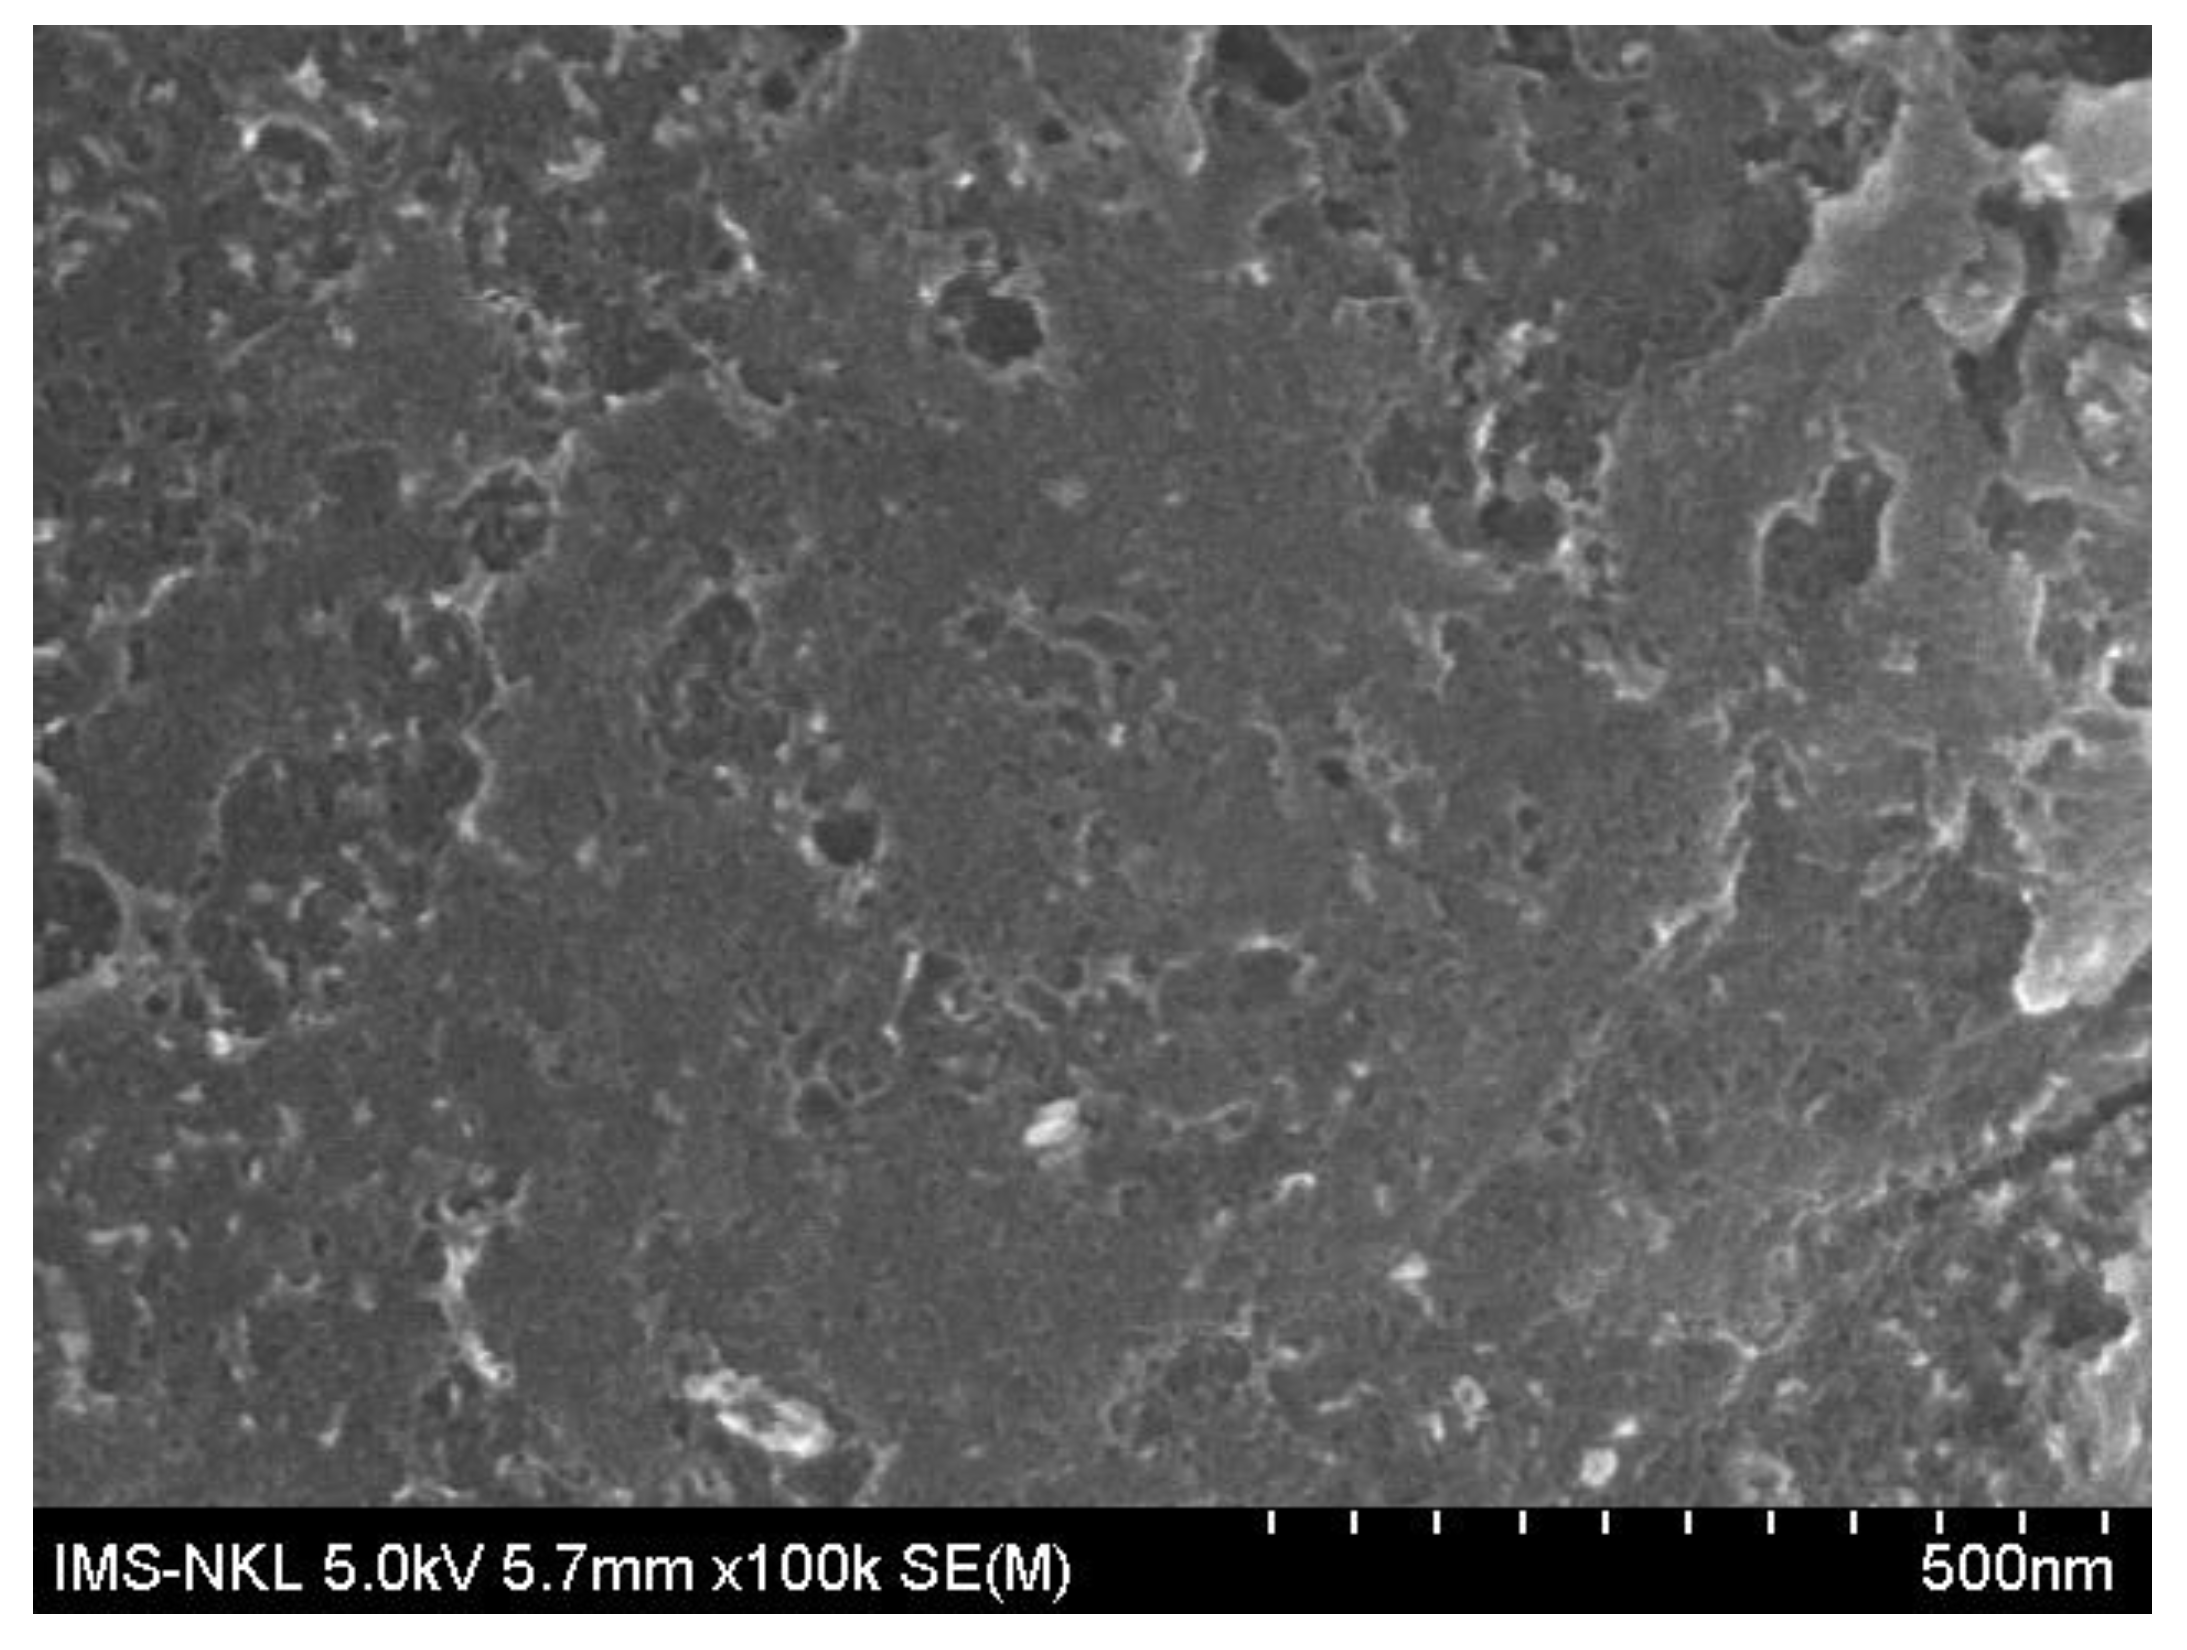
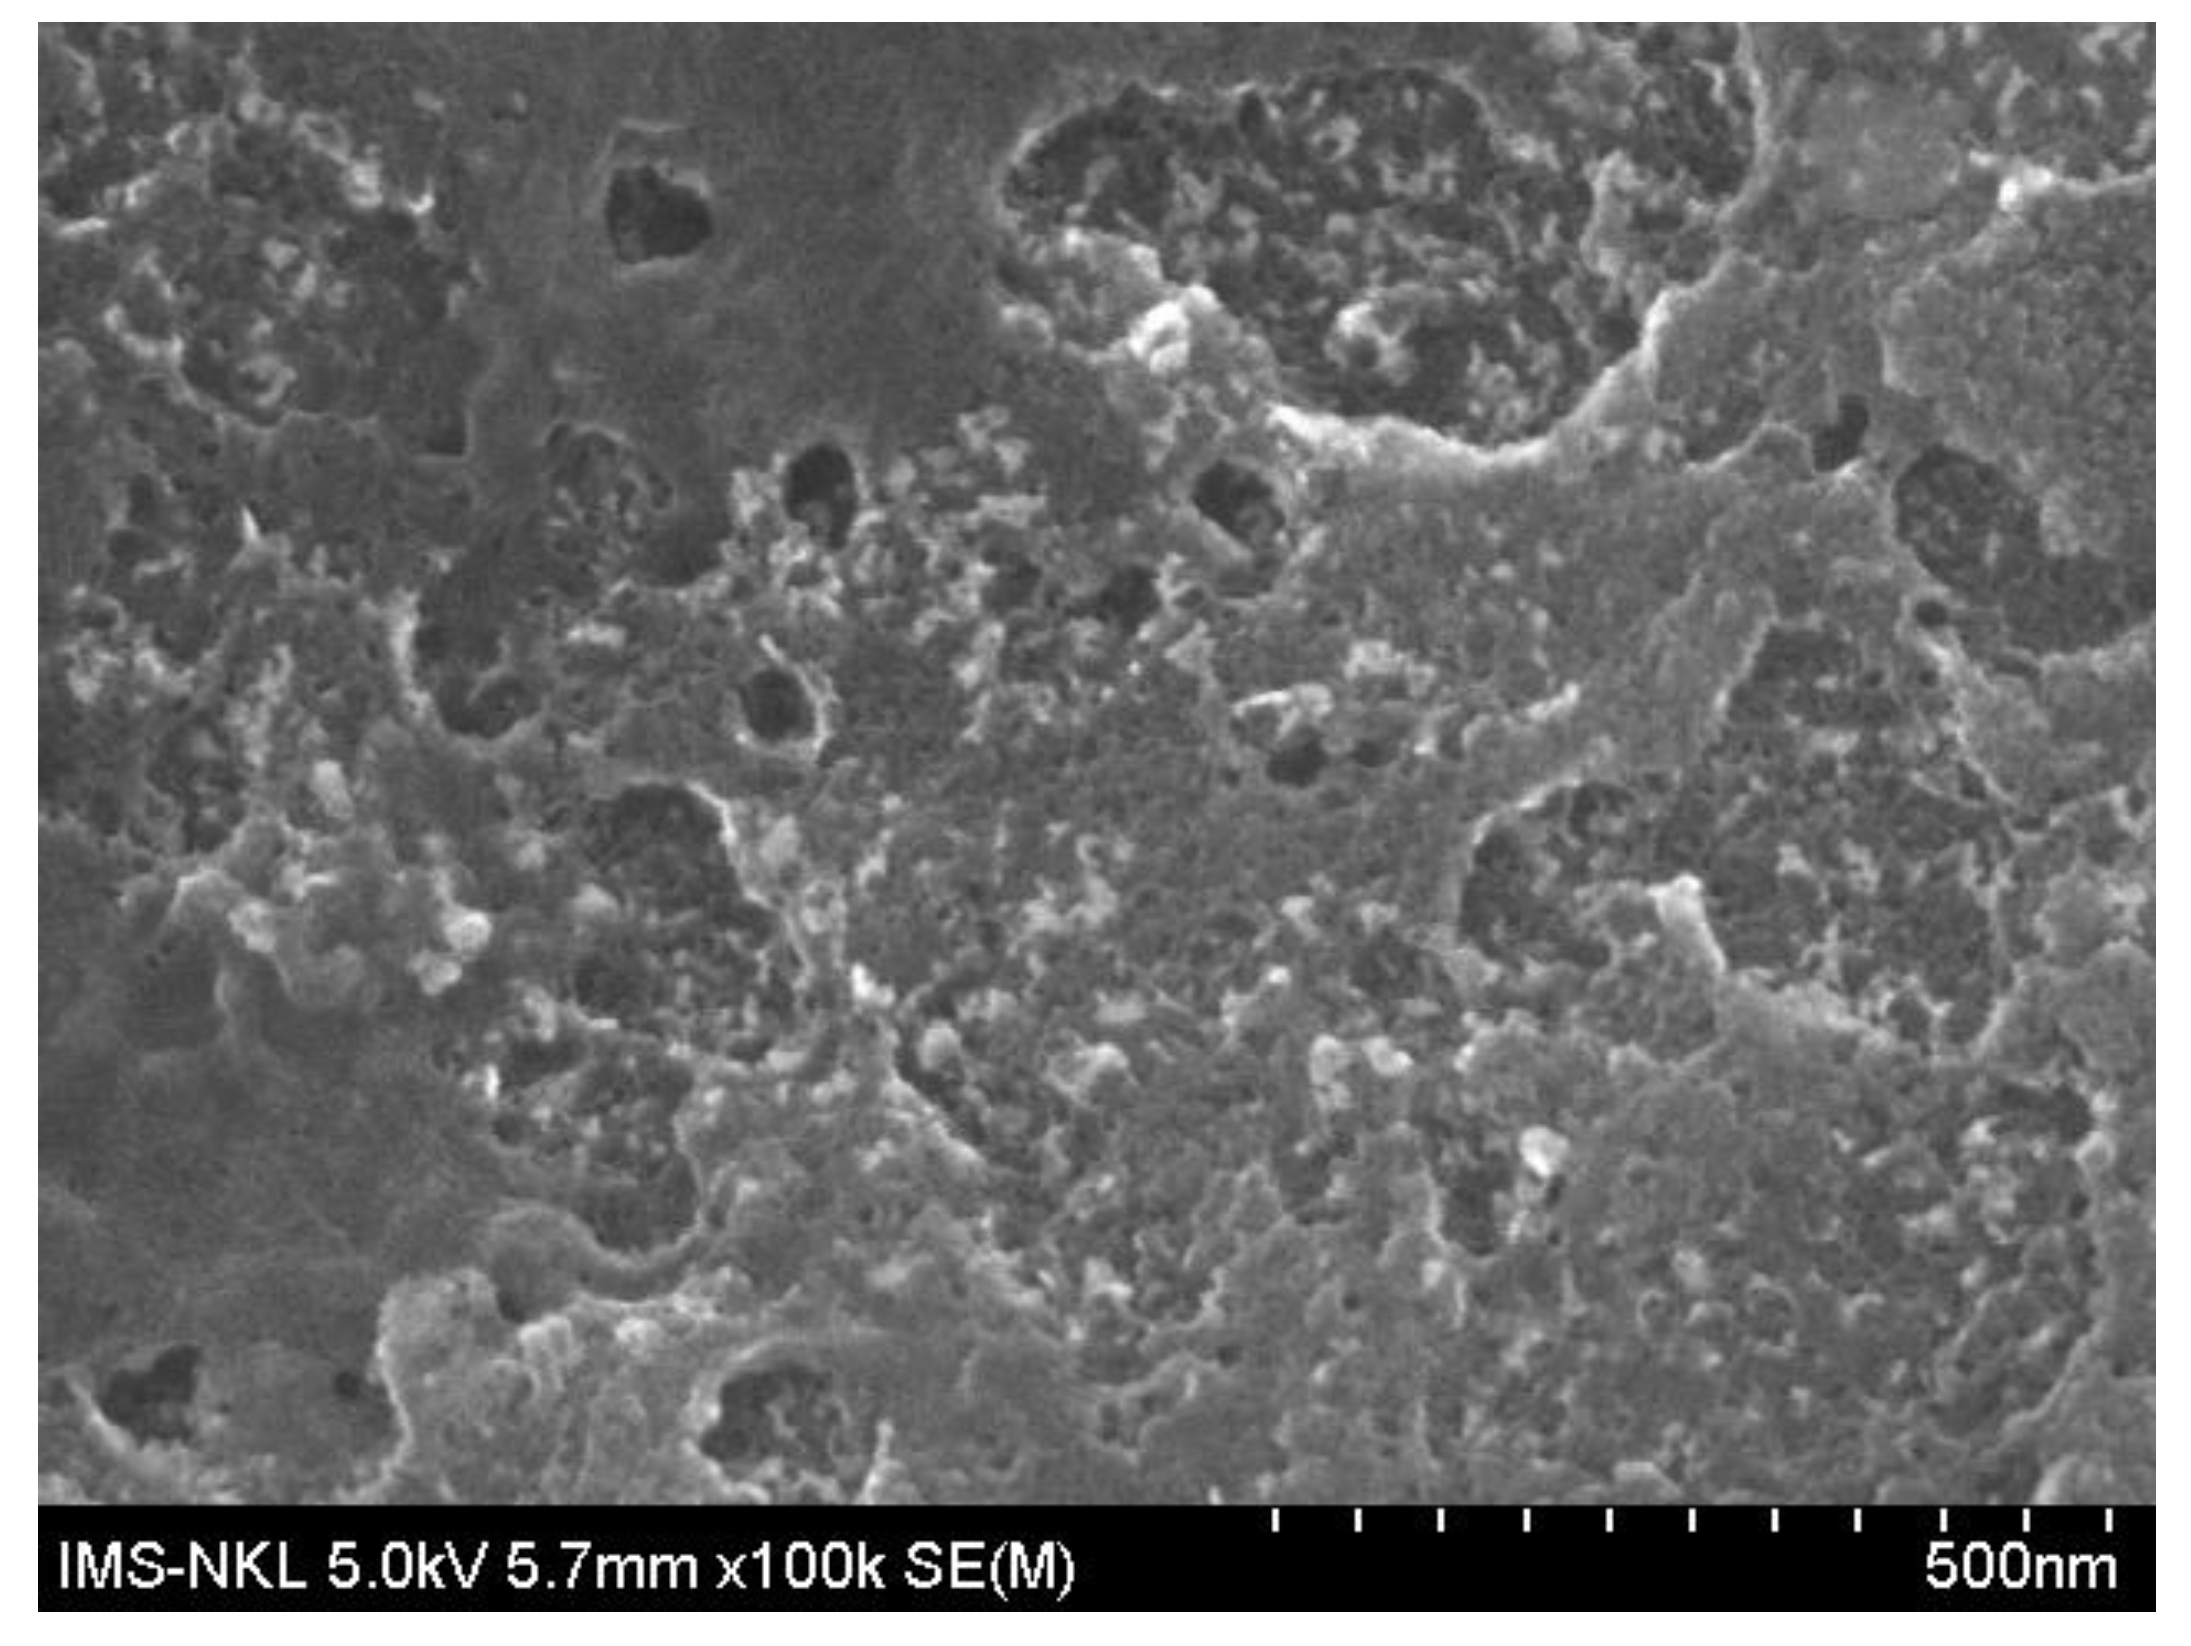
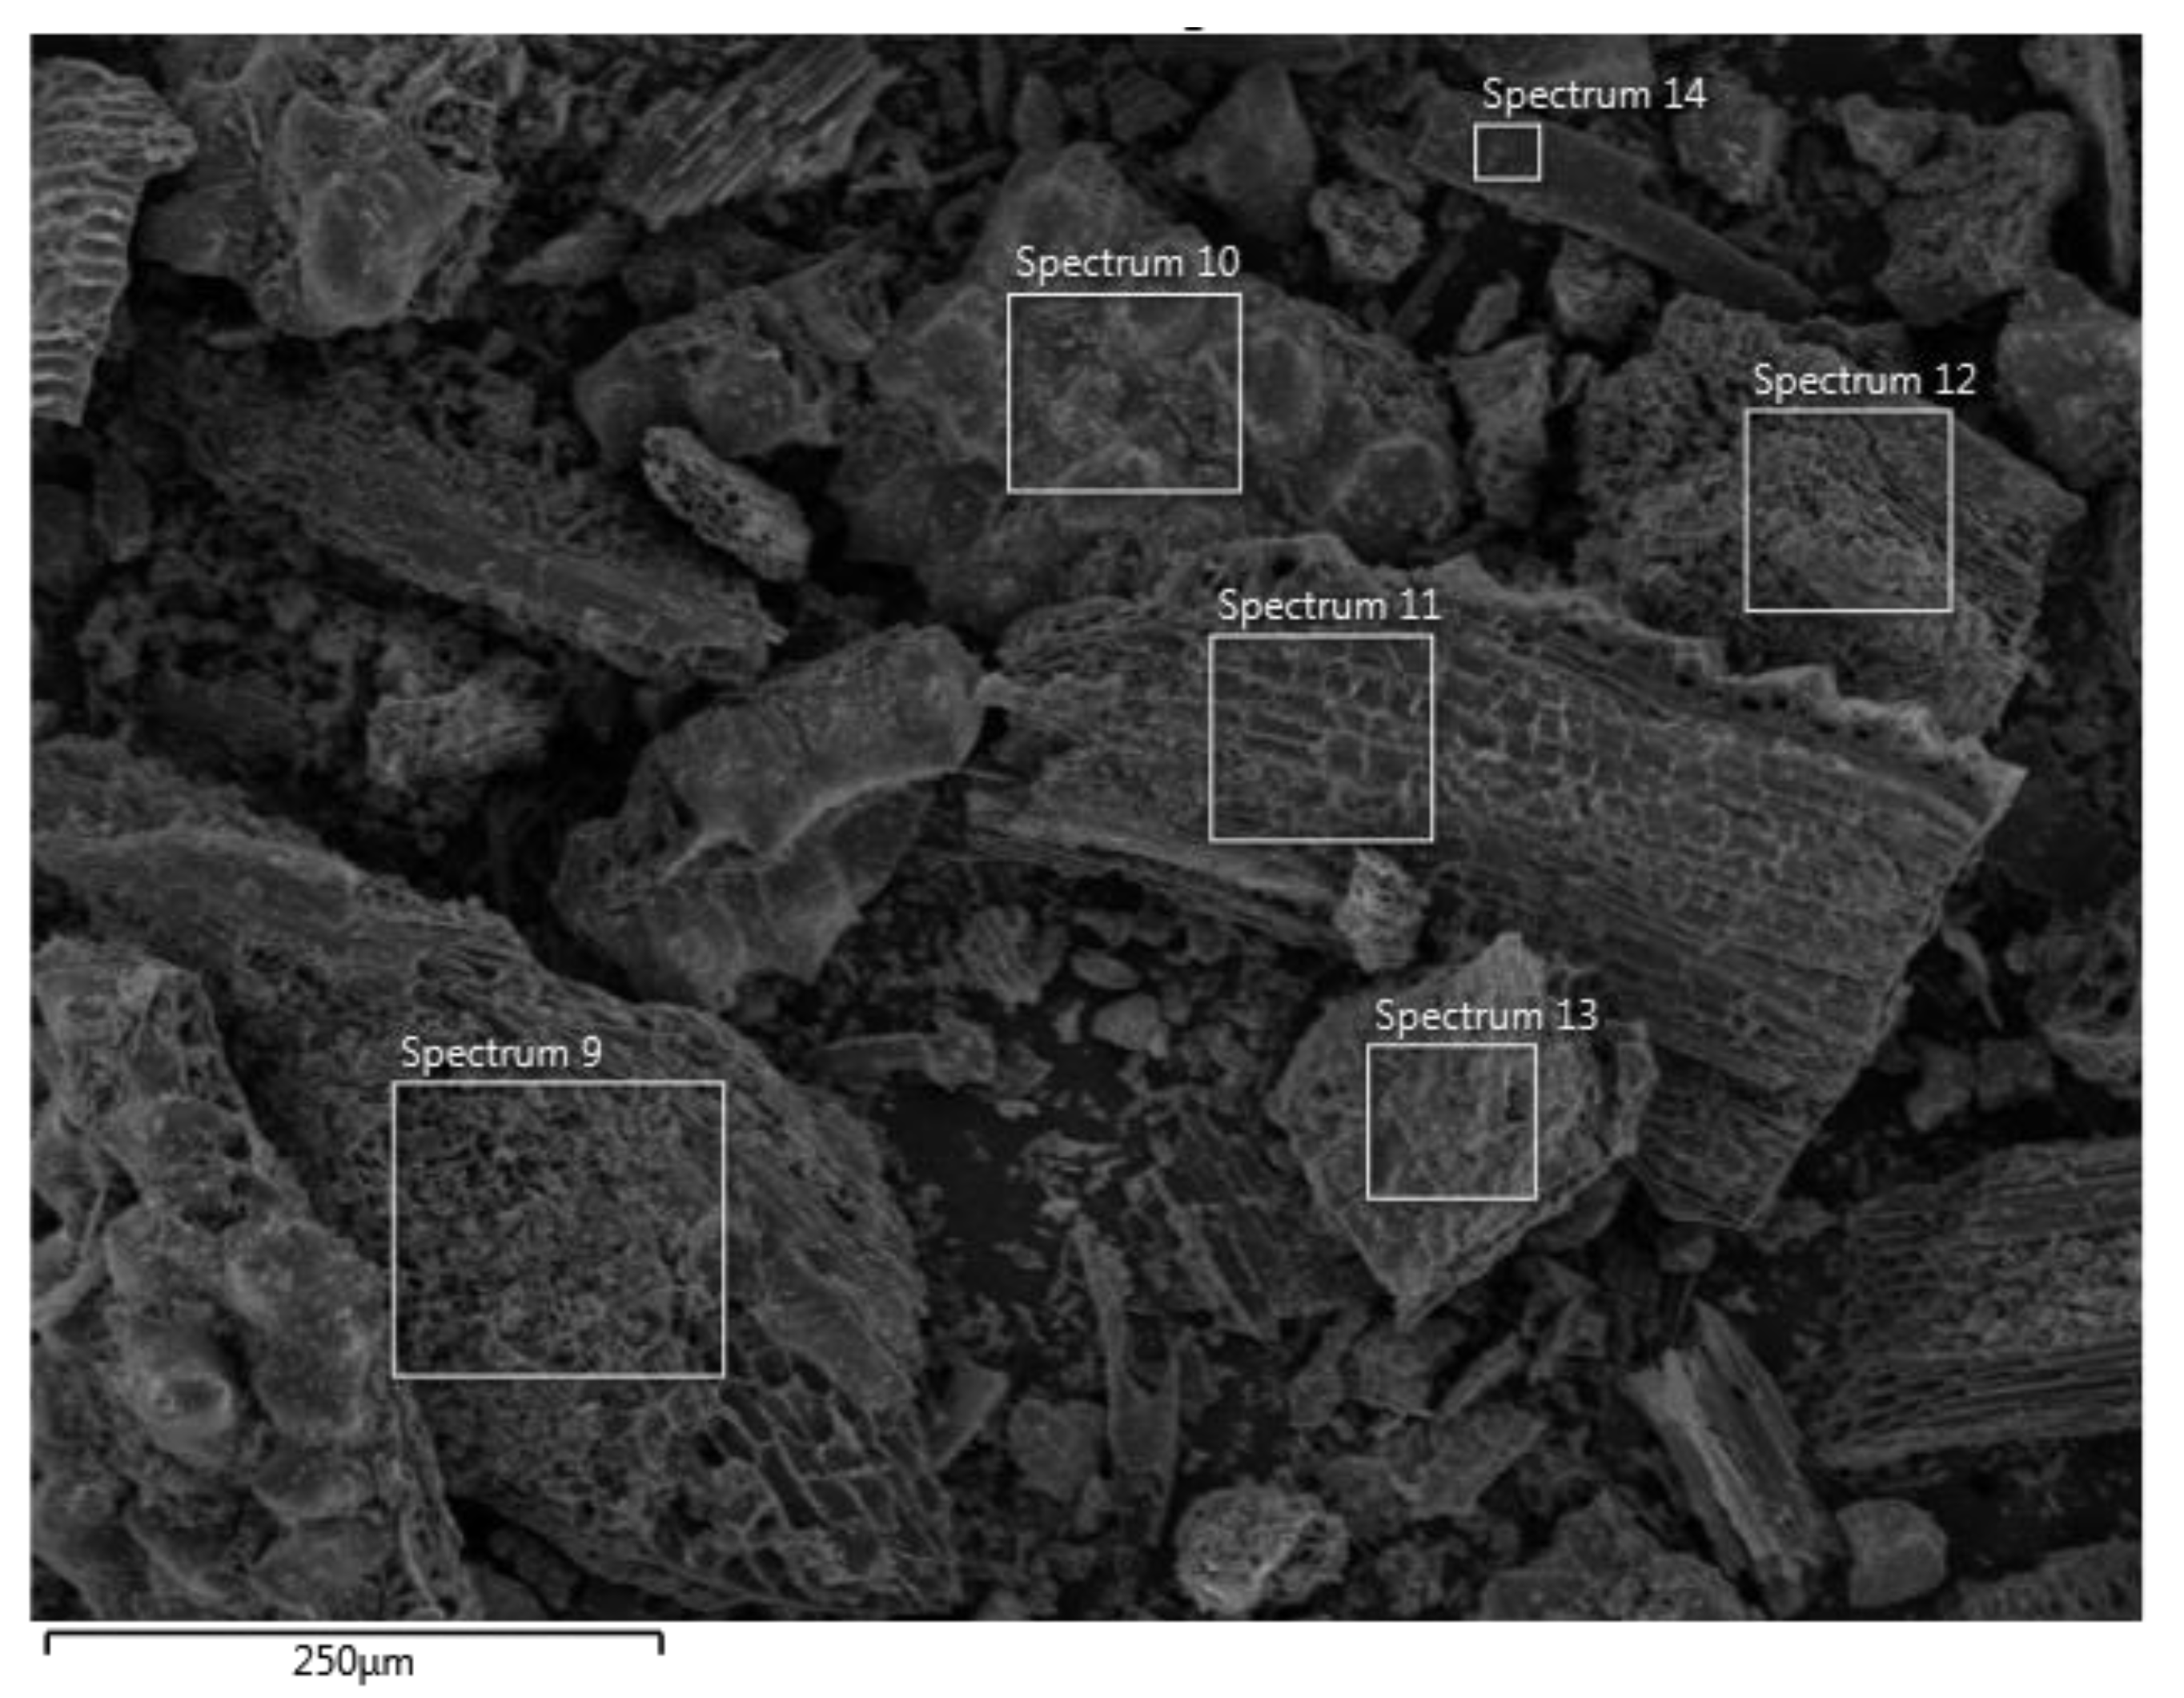
3.1.1. Surface Morphology and Porous Structure of the Composite Catalysts

Surface morphology and porosity are some of the important physicochemical characteristics for the adsorbent, as well as for the carrier. Biochar is obtained from the pyrolysis of rice husks in an anaerobic environment (lack of oxygen and high pressure). The surface morphology and structure of raw RHB (Appendix F) and the synthesized catalysts TiO2/RHB, characterized by SEM (Jeol JMS-6510LV), are shown in Figure 2.
As shown in Figure 2, the fibrous structure of rice husk persists after high-temperature calcination. The cross-sectional image of the RHB illustrates the appearance of mesopores with an average diameter of about 28 μm. At higher magnification, the SEM image shows an uneven mesoporous structure. However, the micro-sized pore structure is relatively regular, with an average diameter of about 50 nm (Appendix F).
Comparison of the SEM images of TiO2/RHB indicates that some small TiO2 particles exist on the surface of the RHB, which confirms the successful coating of the TiO2 particles onto the substrate. This will be demonstrated by EDX analysis of the elemental composition.

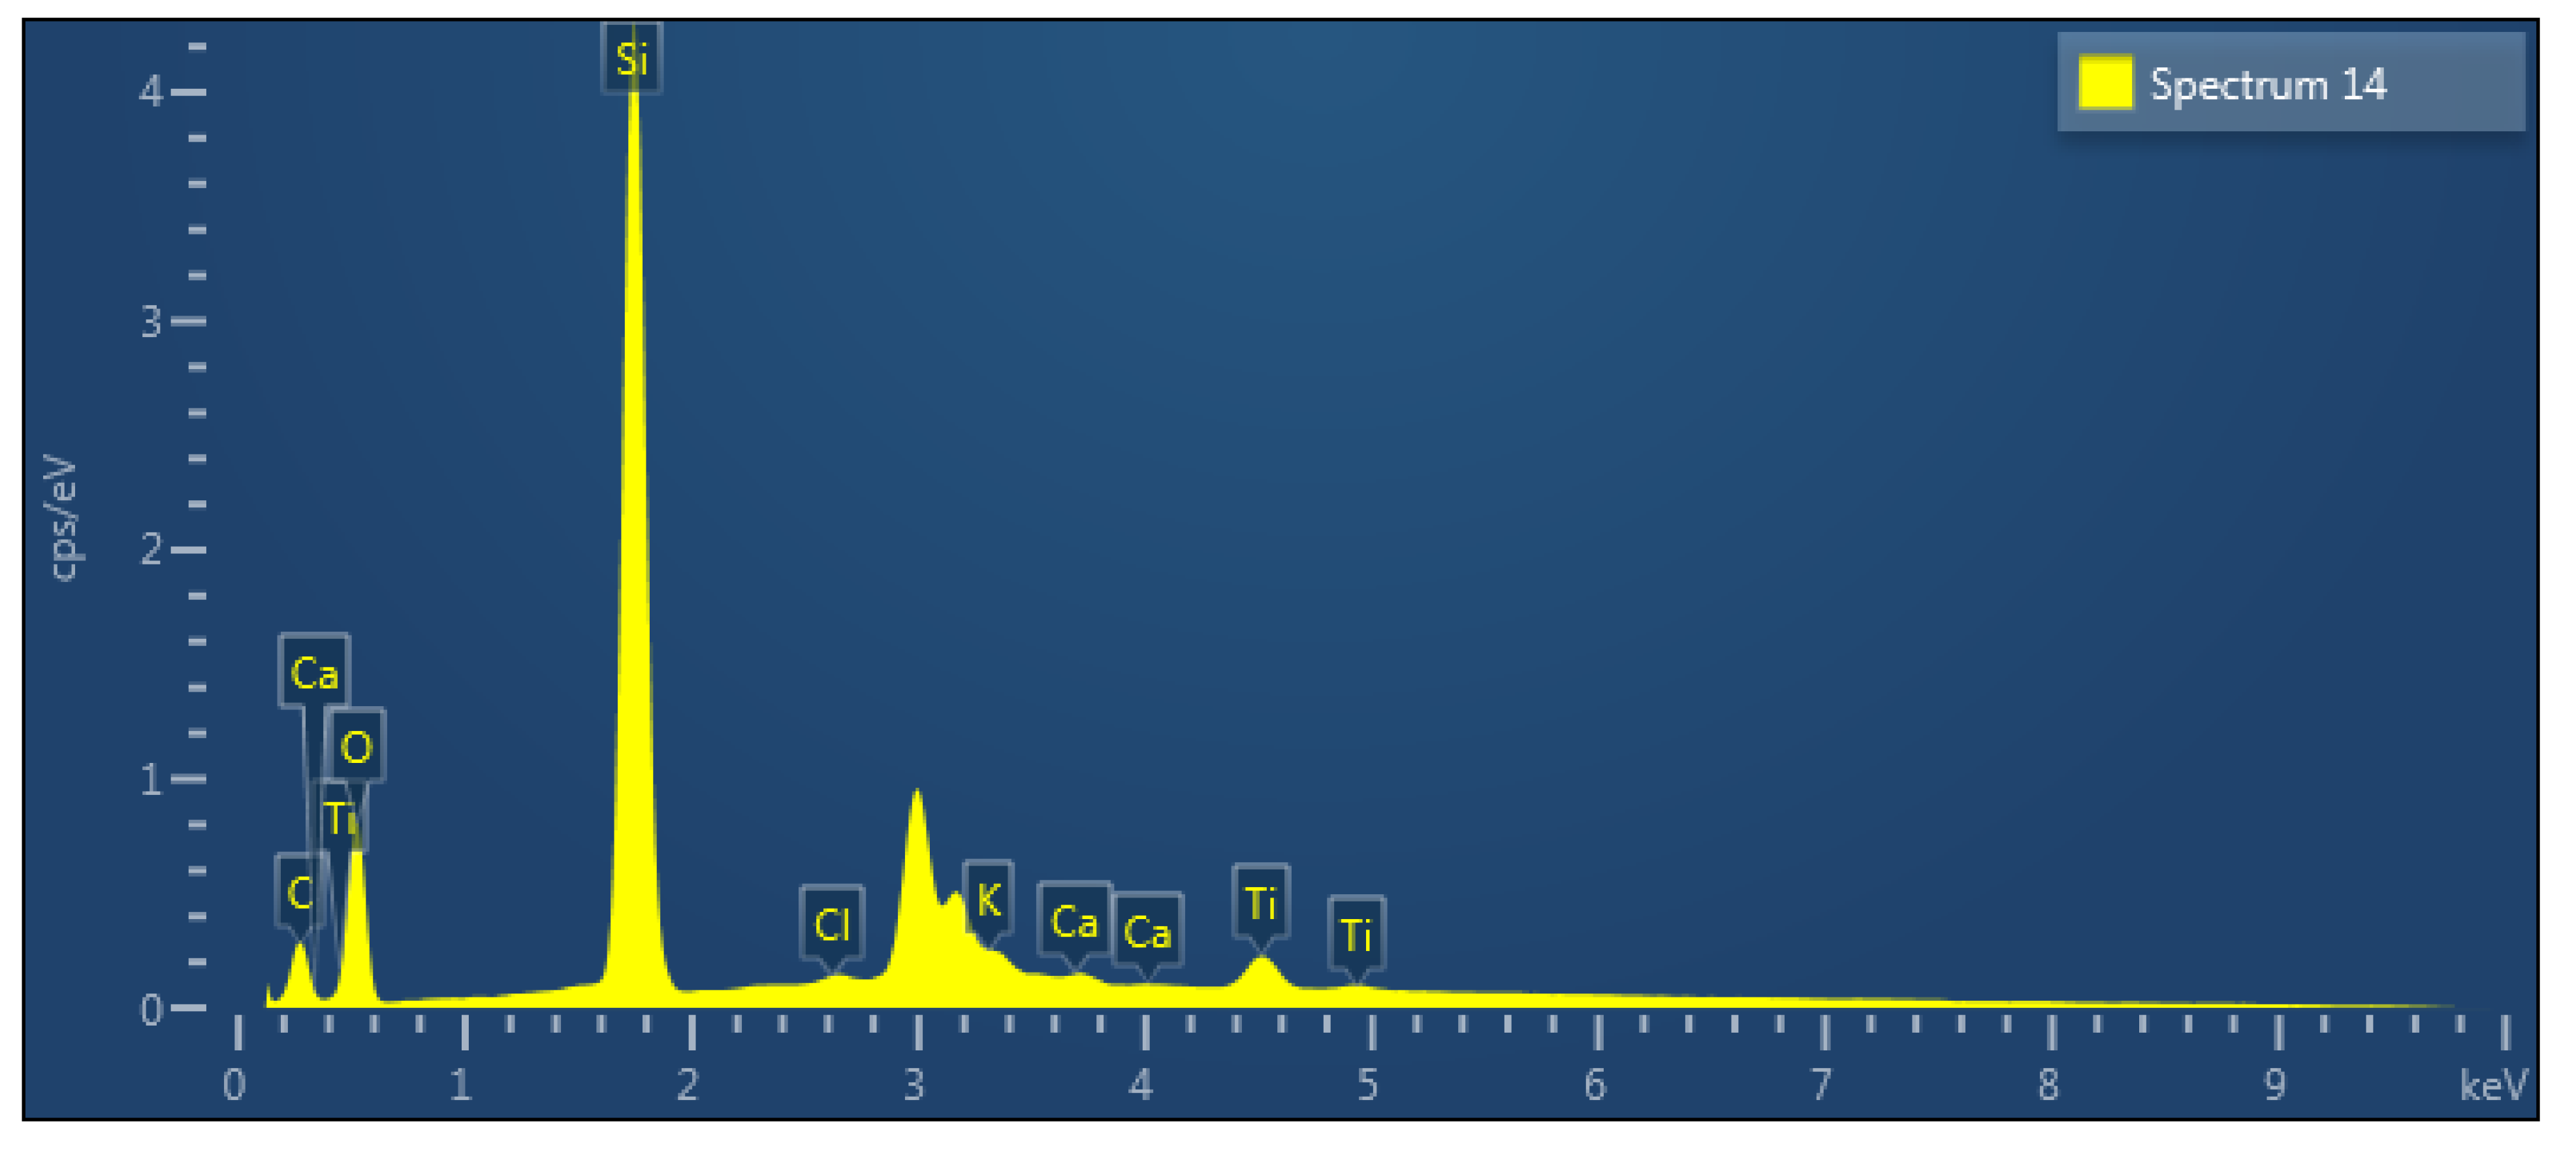
3.1.2. Elemental Compositions of TiO2/RHB Composites

The X-ray energy dispersion (EDX) technique is used to determine the composition and content of the components that comprise the materials. The elemental composition of the TiO2/RHB composites was analyzed at 14 different locations on the SEM image (given in Appendix G), and the average value is reported in Table 1.
The results showed that the main ingredient of rice husk is carbon, which confirms the decomposition of the cellulose, lignin or organic components present in agricultural by-products at high temperatures of 500–600 °C. Additionally, for supported catalysts produced from rice husk, the Si component exists in the structure with an average content of up to 11.14%. After coating, the titanium is not evenly distributed in different locations, with the weight percentage ranging between 10.2 and 20.4%.

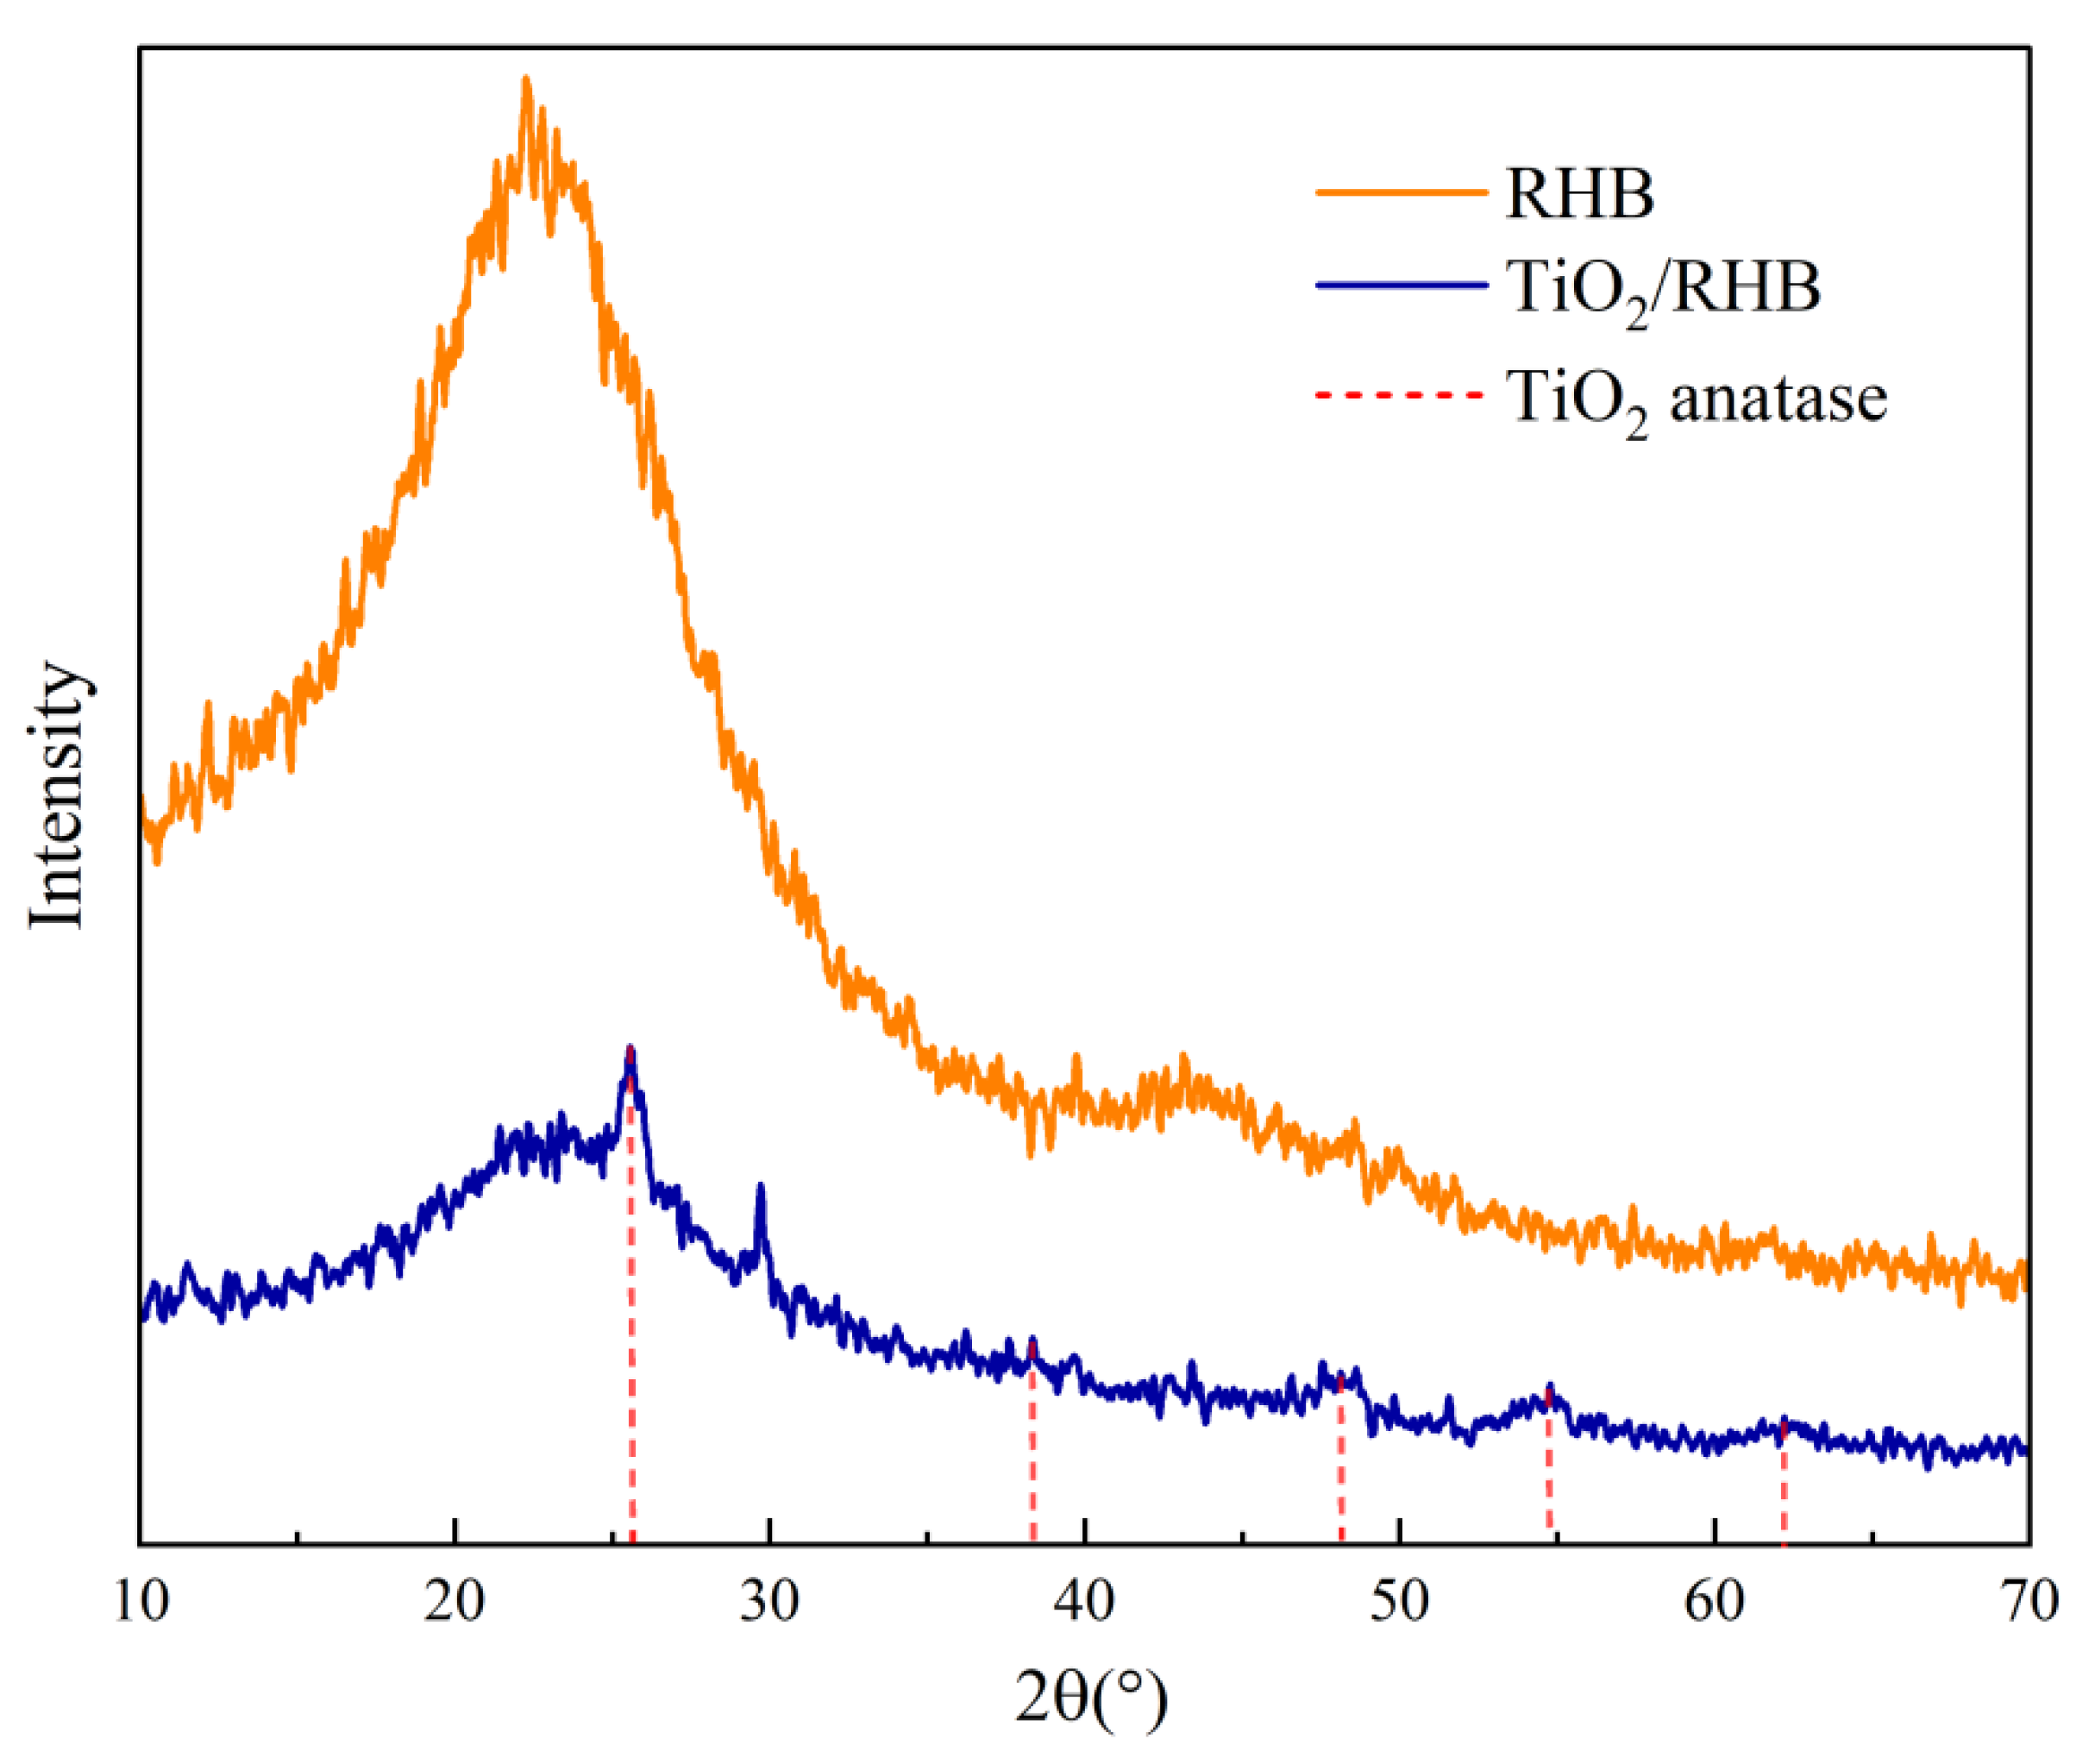
3.1.3. The Crystalline Structure of TiO2/RHB

The structural properties of the composite catalysts, characterized using XRD Equinox 5000 with Cu Kα radiation (λ = 1.5405 Å), are presented in Figure 3.
The XRD analysis of the RHB obtains a diffuse baseline with no predominant peaks. This indicates that a large number of amorphous structures with disordered carbons exist [21]. No peak corresponding to the crystalline phase was observed at 2θ = 40° and 2θ = 50°. Besides, the XRD spectrum of the RHB also shows the presence of a graphene structure, which was formed due to the thermal decomposition of the materials derived from agricultural by-products. This result is consistent with the surface morphology in the SEM images (Figure 2) and the study results of Zhang et al., 2017 [22]. As they explained, the amorphous carbon was formed as a result of the degradation of cellulose at high temperatures, above 300 °C [23].
In the TiO2/RHB sample, the specific peaks observed at 25.35°, 37.78°, 48.05°, 53.89°, and 62.85° are the diffraction values of the (101), (004), (200), (105), (211), and (204) crystalline planes, respectively. These peaks are consistent with the standard peak of anatase TiO2, without a peak corresponding to rutile, affirming that TiO2 only exists in the anatase phase (JCPDS card no. 21-1272). Based on the XRD data, the crystal size of the nanoparticles was estimated using the Scherrer equation [23], with the full width at half-maximum height at 2θ = 23.35°, which is 10.61 nm.

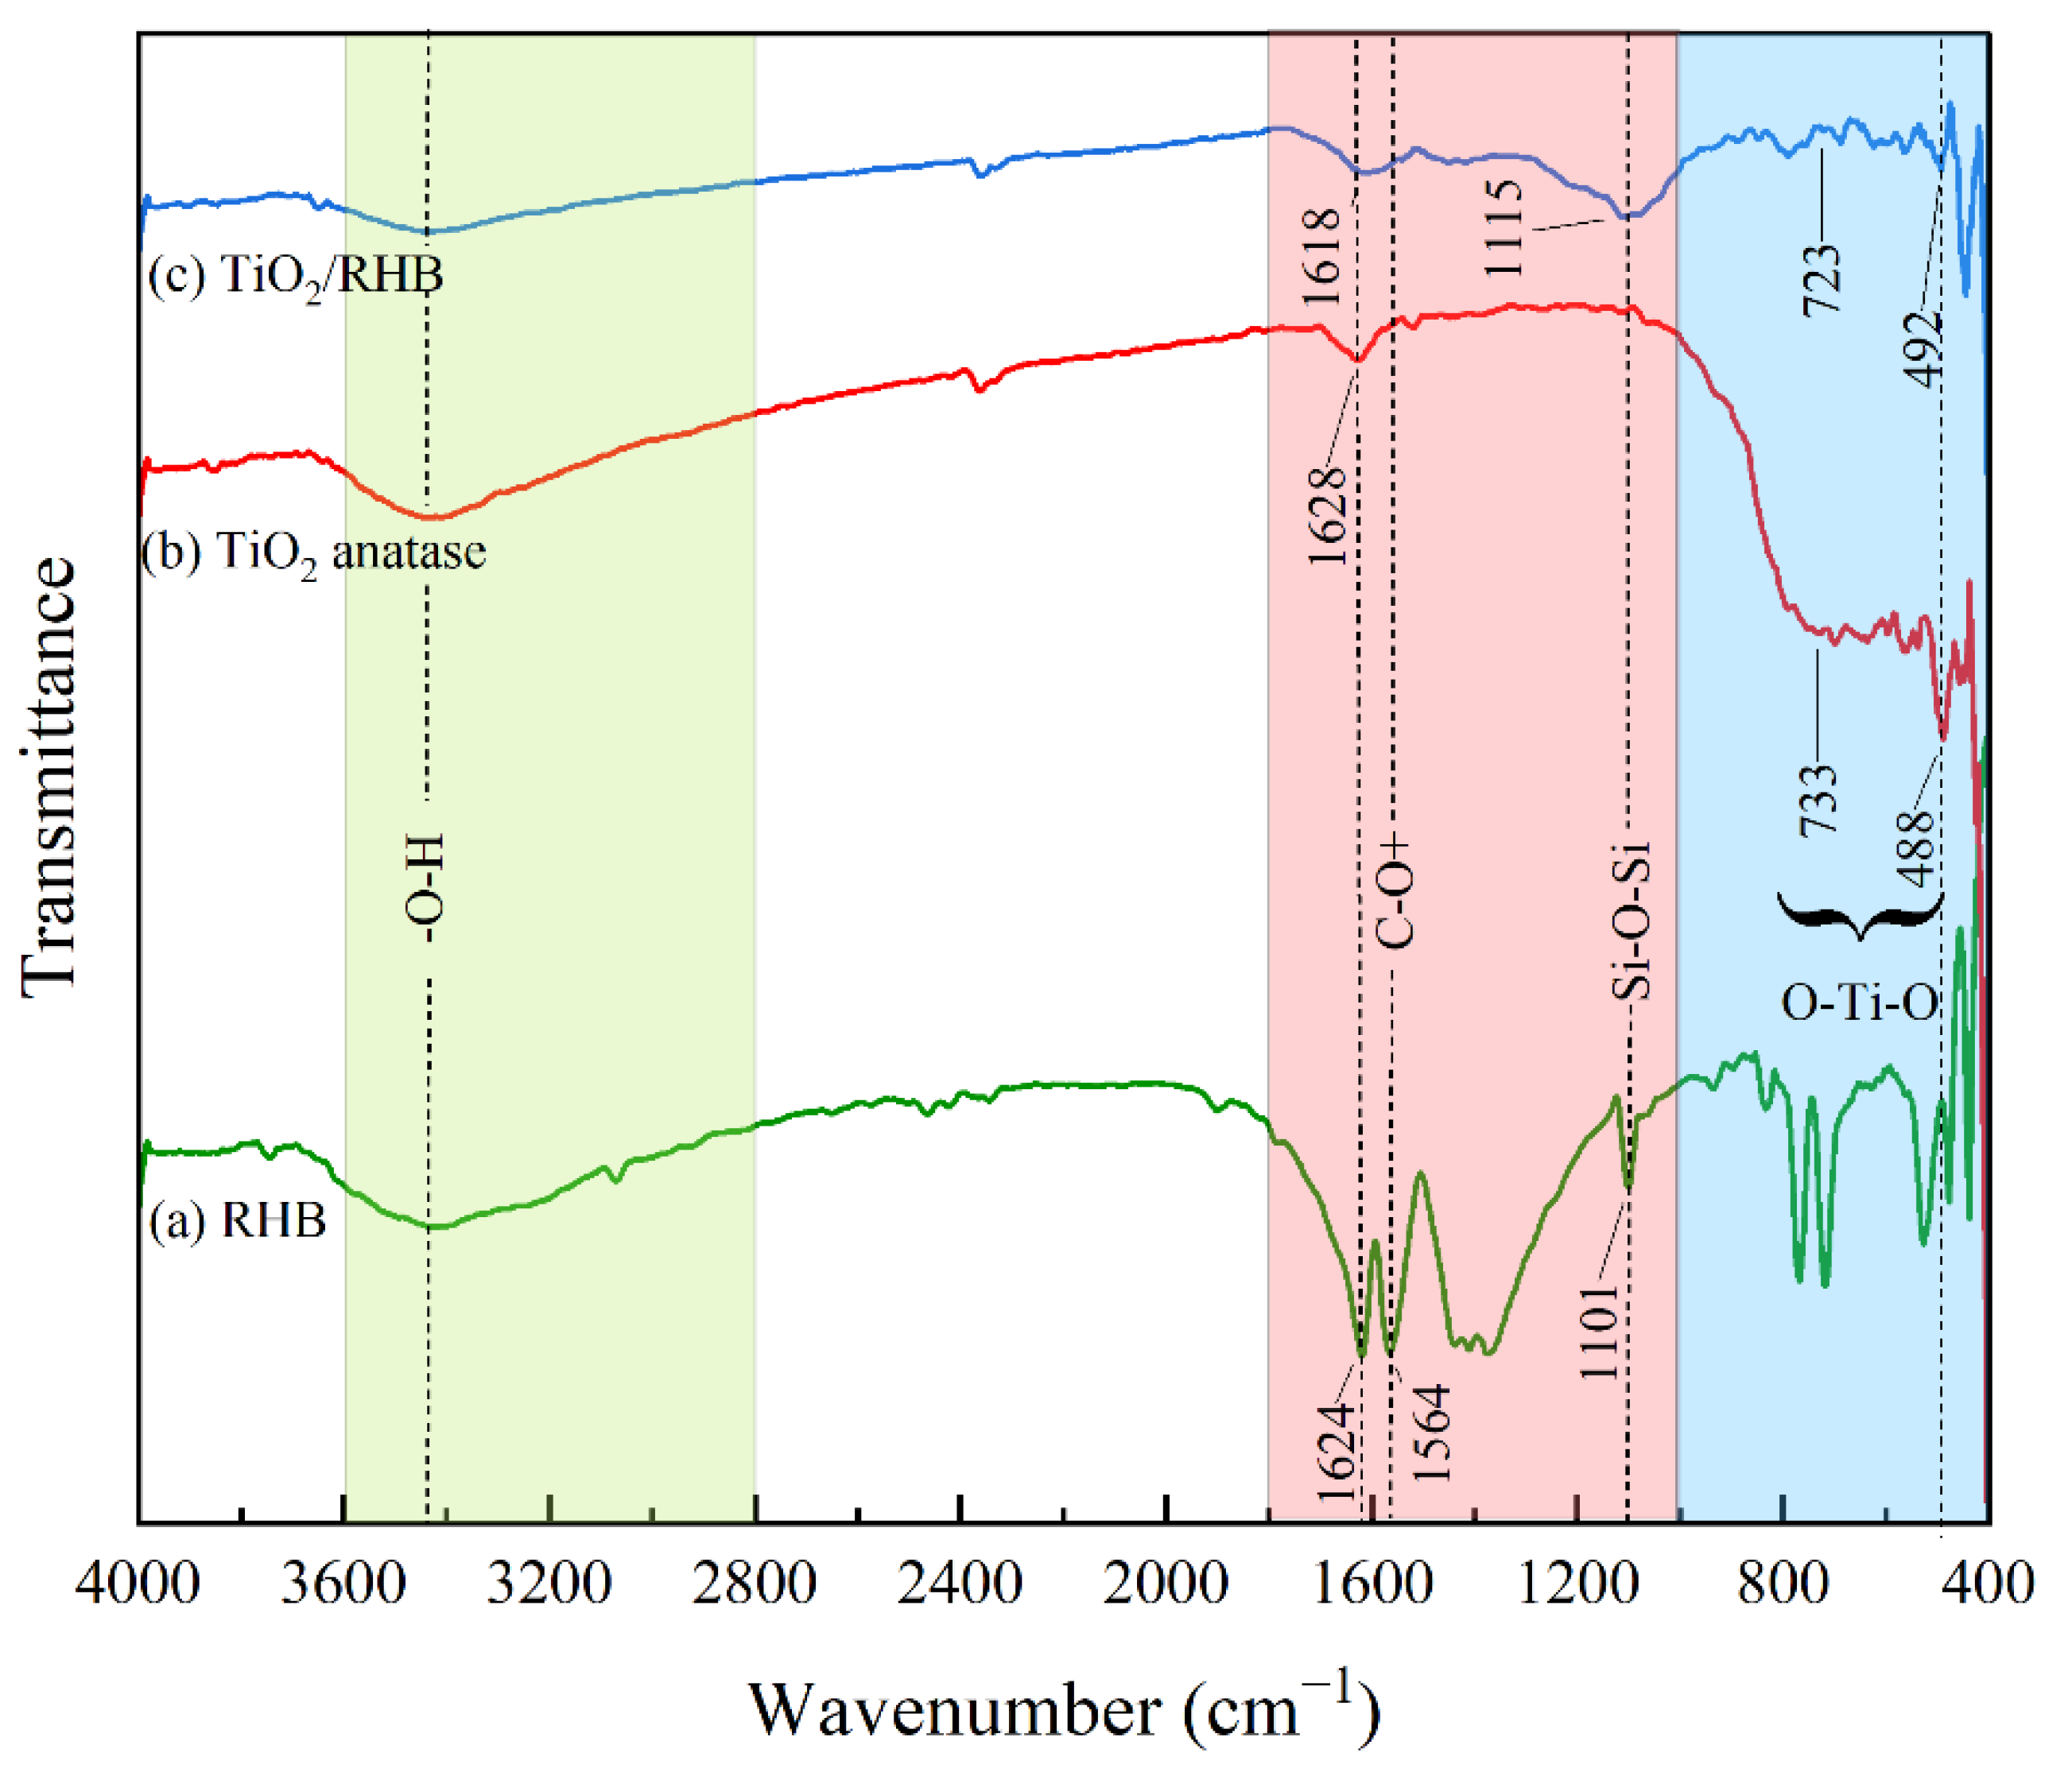
3.1.4. Functional Groups of TiO2/RHB Composites

The functional groups in the TiO2/RHB composites were analyzed using the FTIR spectrophotometer in the mid-infrared region, from 4000 cm−1 to 400 cm−1. The results of the FTIR spectra are shown in Figure 4.
Overall, the spectra of the three materials show a broad peak at 3430 cm−1. According to Lawrinenko and Laird [13], this peak is assigned to O–H and N–H stretching vibrations of the surface hydroxyl and heterocyclic nitrogen groups. However, the EDX analysis results showed no presence of nitrogen in the nanocomposite materials or in the RHB. Therefore, the peak at the wavelength of 3430 cm−1 only indicates a O–H stretching vibration. The peaks at 1618–1629 cm−1 could represent the ketonic C=O group. For RHB, the peak at 1564 cm−1, attributed to the C–O+ stretching vibrations of the oxonium groups, contributes to the protonation on the surface of the material [13]. The peak at 1400 cm−1 could be ascribed to aromatic C–H symmetric stretching vibrations, while the two peaks in the 700–800 cm−1 region could be ascribed to aromatic C–H out-of-plane bending vibrations [13]. The peak at 1101 cm−1 indicates the Si–O–Si bond, which is a specific characteristic of biochar from husks. Due to the high-temperature calcination, the silicon in the husks was oxidized and transformed into SiO2. In particular, the two peaks in the range 478–738 cm−1 correspond to O–Ti–O stretching vibrations, affirming the successful coating of TiO2 onto the RHB surface with oxygen functionalities [24]. This is fully consistent with the results of the XRD and EDX analyses above.

3.2. Photodegradation of Glyphosate in the Presence of TiO2/RHB Catalysts

The decomposition of glyphosate by TiO2/RHB under UV light irradiation was examined under different conditions, including catalyst dosage and irradiation intensity, in an acidic solution (pH = 3.0). The results are presented in Figure 5.

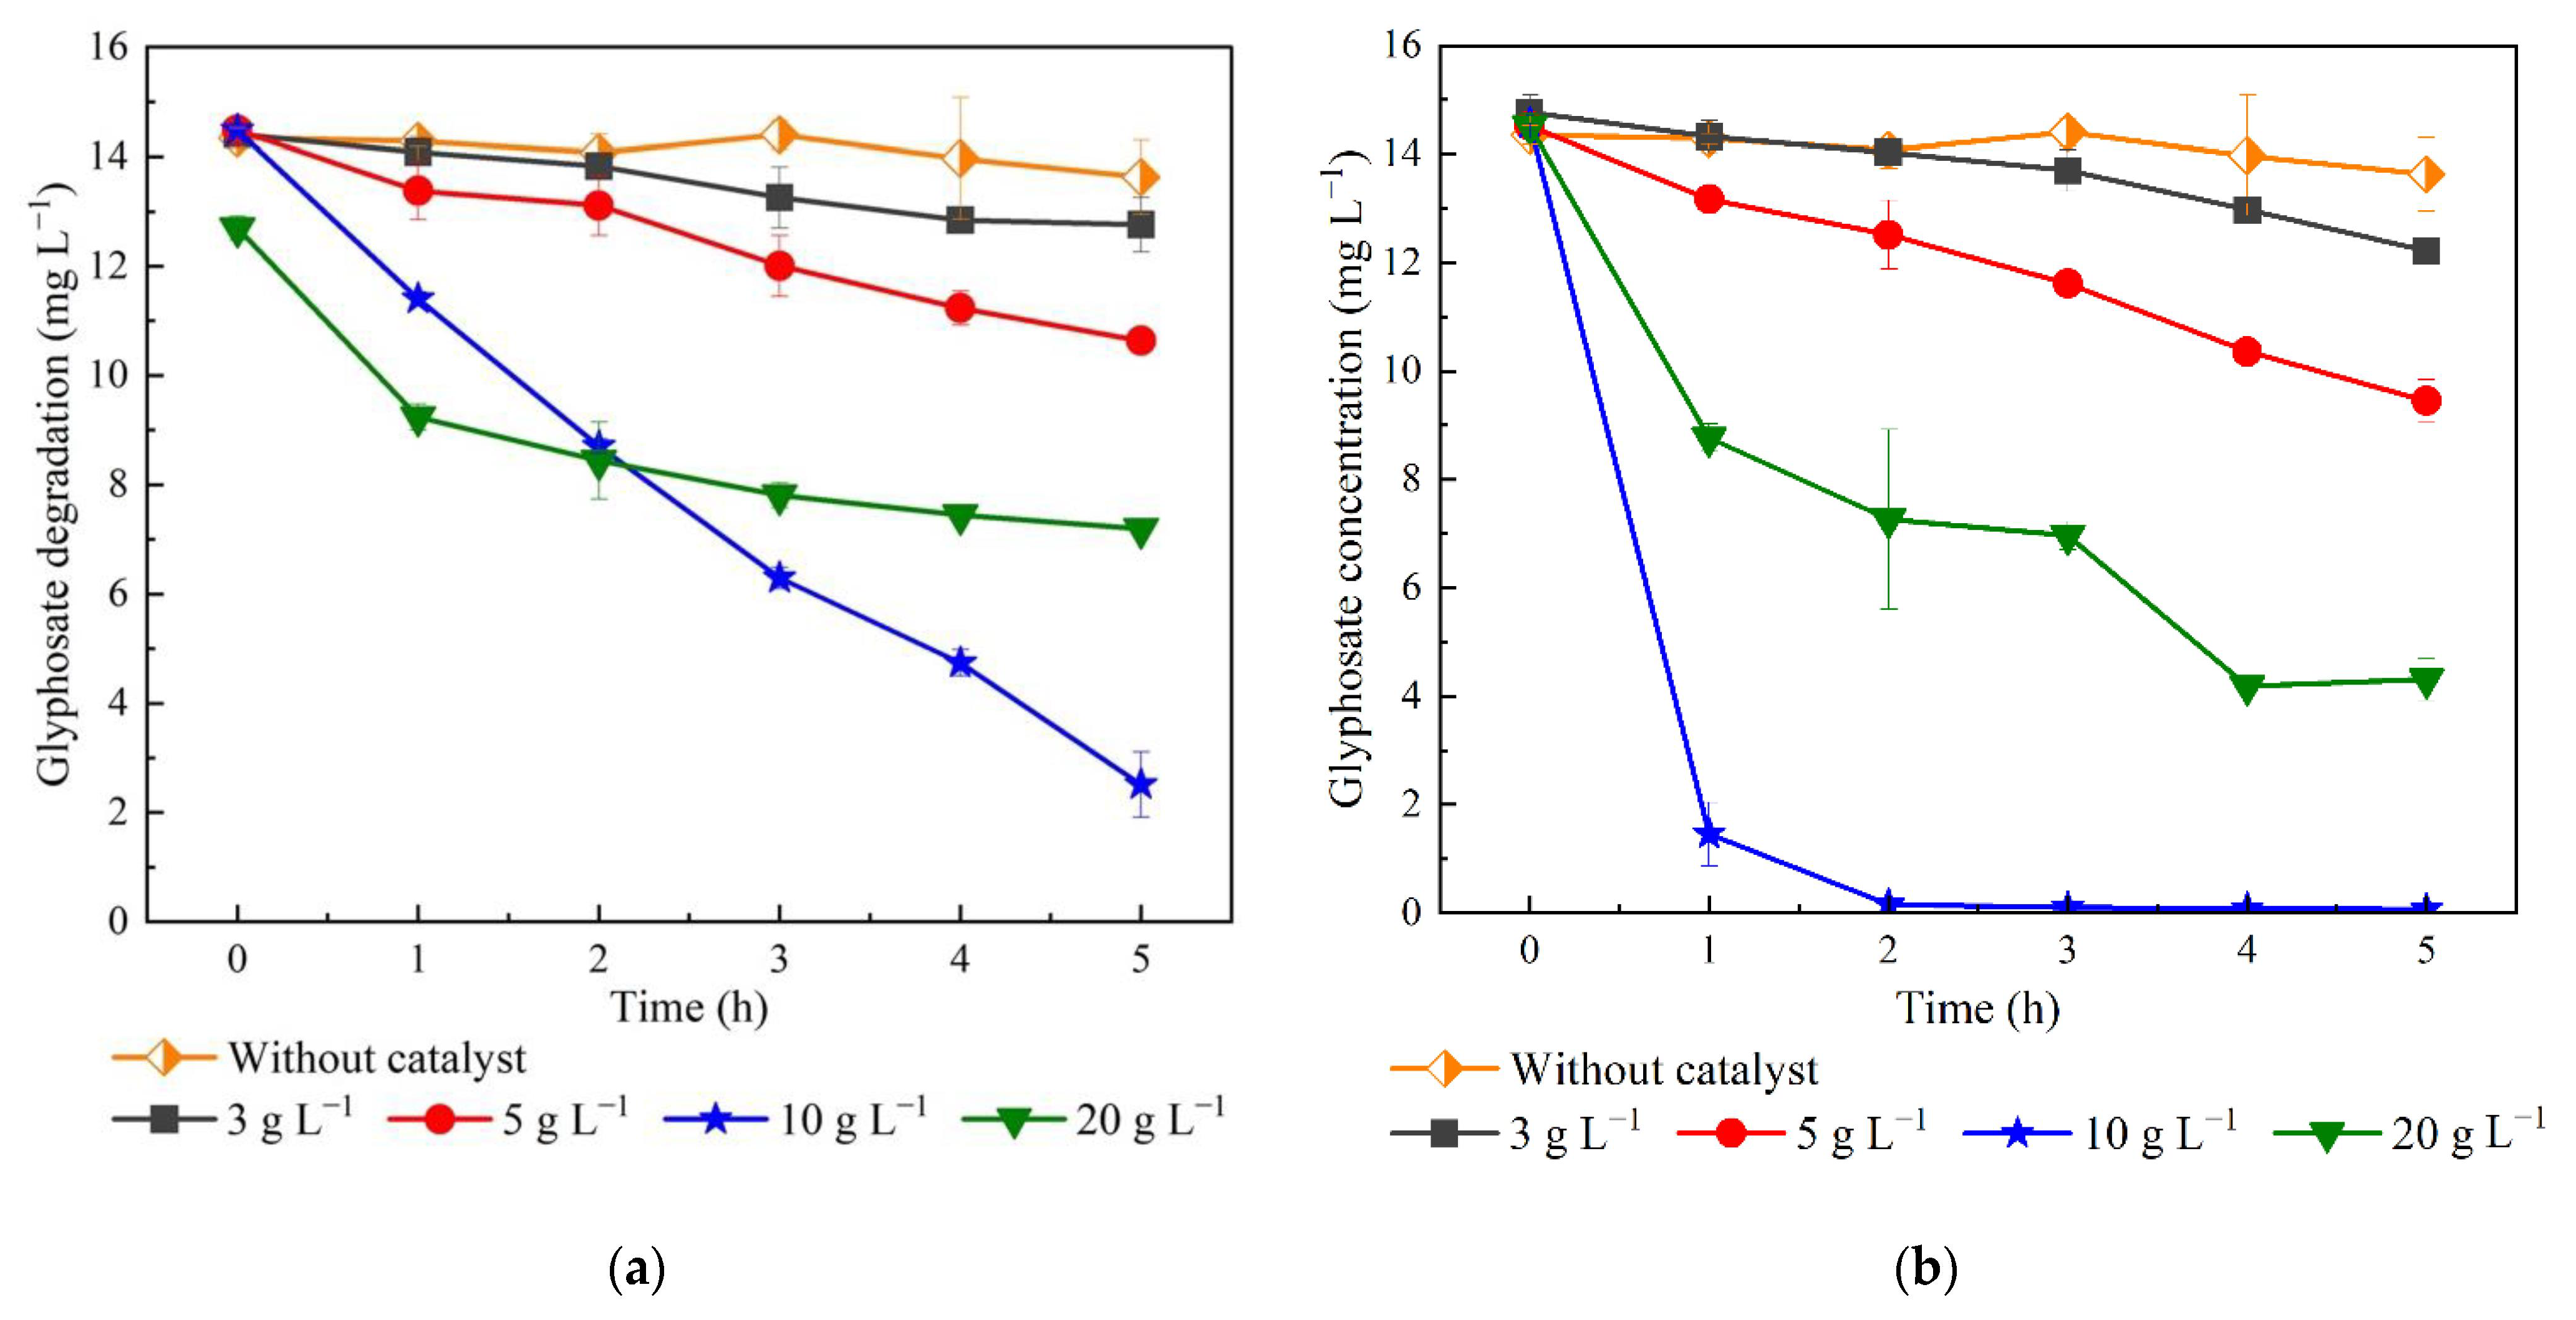
3.2.1. Effects of TiO2/RHB Catalyst Dosage

Four levels of catalyst dosage (3 g L−1, 5 g L−1, 10 g L−1, and 20 g L−1) were applied to investigate the effect of the glyphosate treatment on TiO2/RHB using a 9 W UV lamp. The decrease in glyphosate concentration when using the different catalyst dosages is described in Figure 5a.
Since the mixture was stirred in the dark for 1 h to achieve adsorption/desorption equilibrium on the material surface before irradiation, the process could account for 2–3% of the glyphosate removal efficiency in all the different conditions.
As shown in Figure 5a, the increase in catalyst dosage is in agreement with the increase in photodegradation efficiency. In particular, only a small amount of glyphosate was degraded in the absence of UV light, confirming the critical role of the excited energy in TiO2/RHB. After 5 h of irradiation, the efficiency achieved was 11%, 31%, and 83%, corresponding to 3 g L−1, 5 g L−1, and 10 g L−1 of catalyst, respectively. The higher the dosage of the applied catalysts, the higher the number of active sites there are, which leads to the increase in OH radicals produced from the UV light energy, and, thus, to the promotion of the reaction rate. However, with 20 g L−1 of TiO2/RHB, the degradation efficiency of glyphosate is lower, reaching 43%, compared to 83% for the case of 10 g L−1. This phenomenon could be explained by the turbidity that resulted from the broken rice husk, reducing light transmission through the suspension.

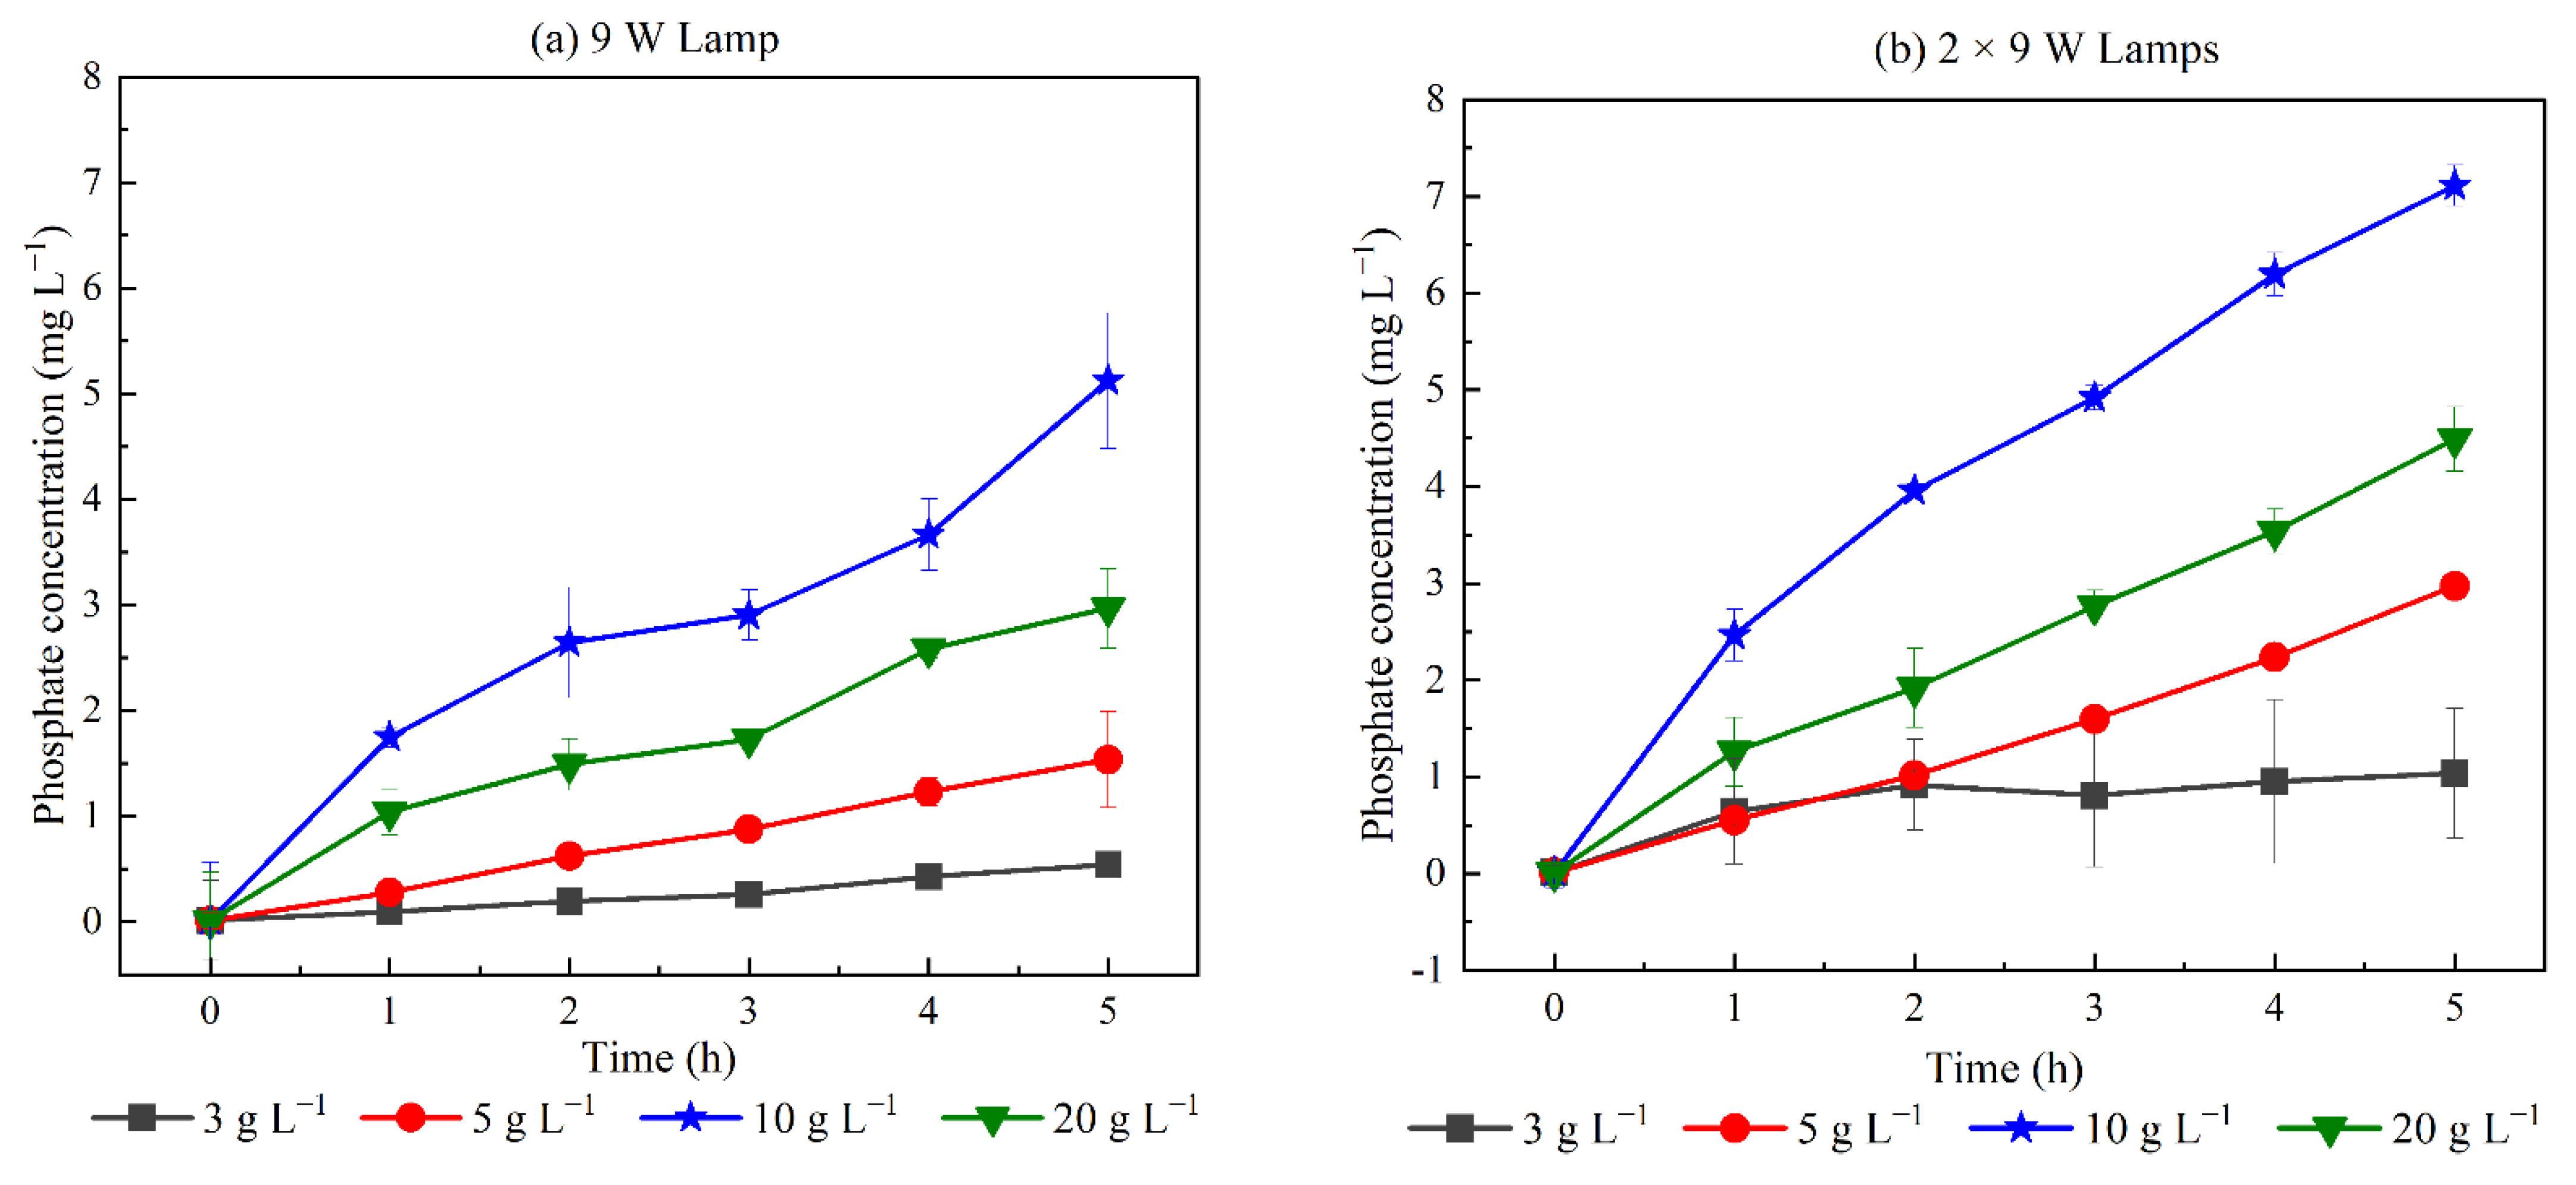
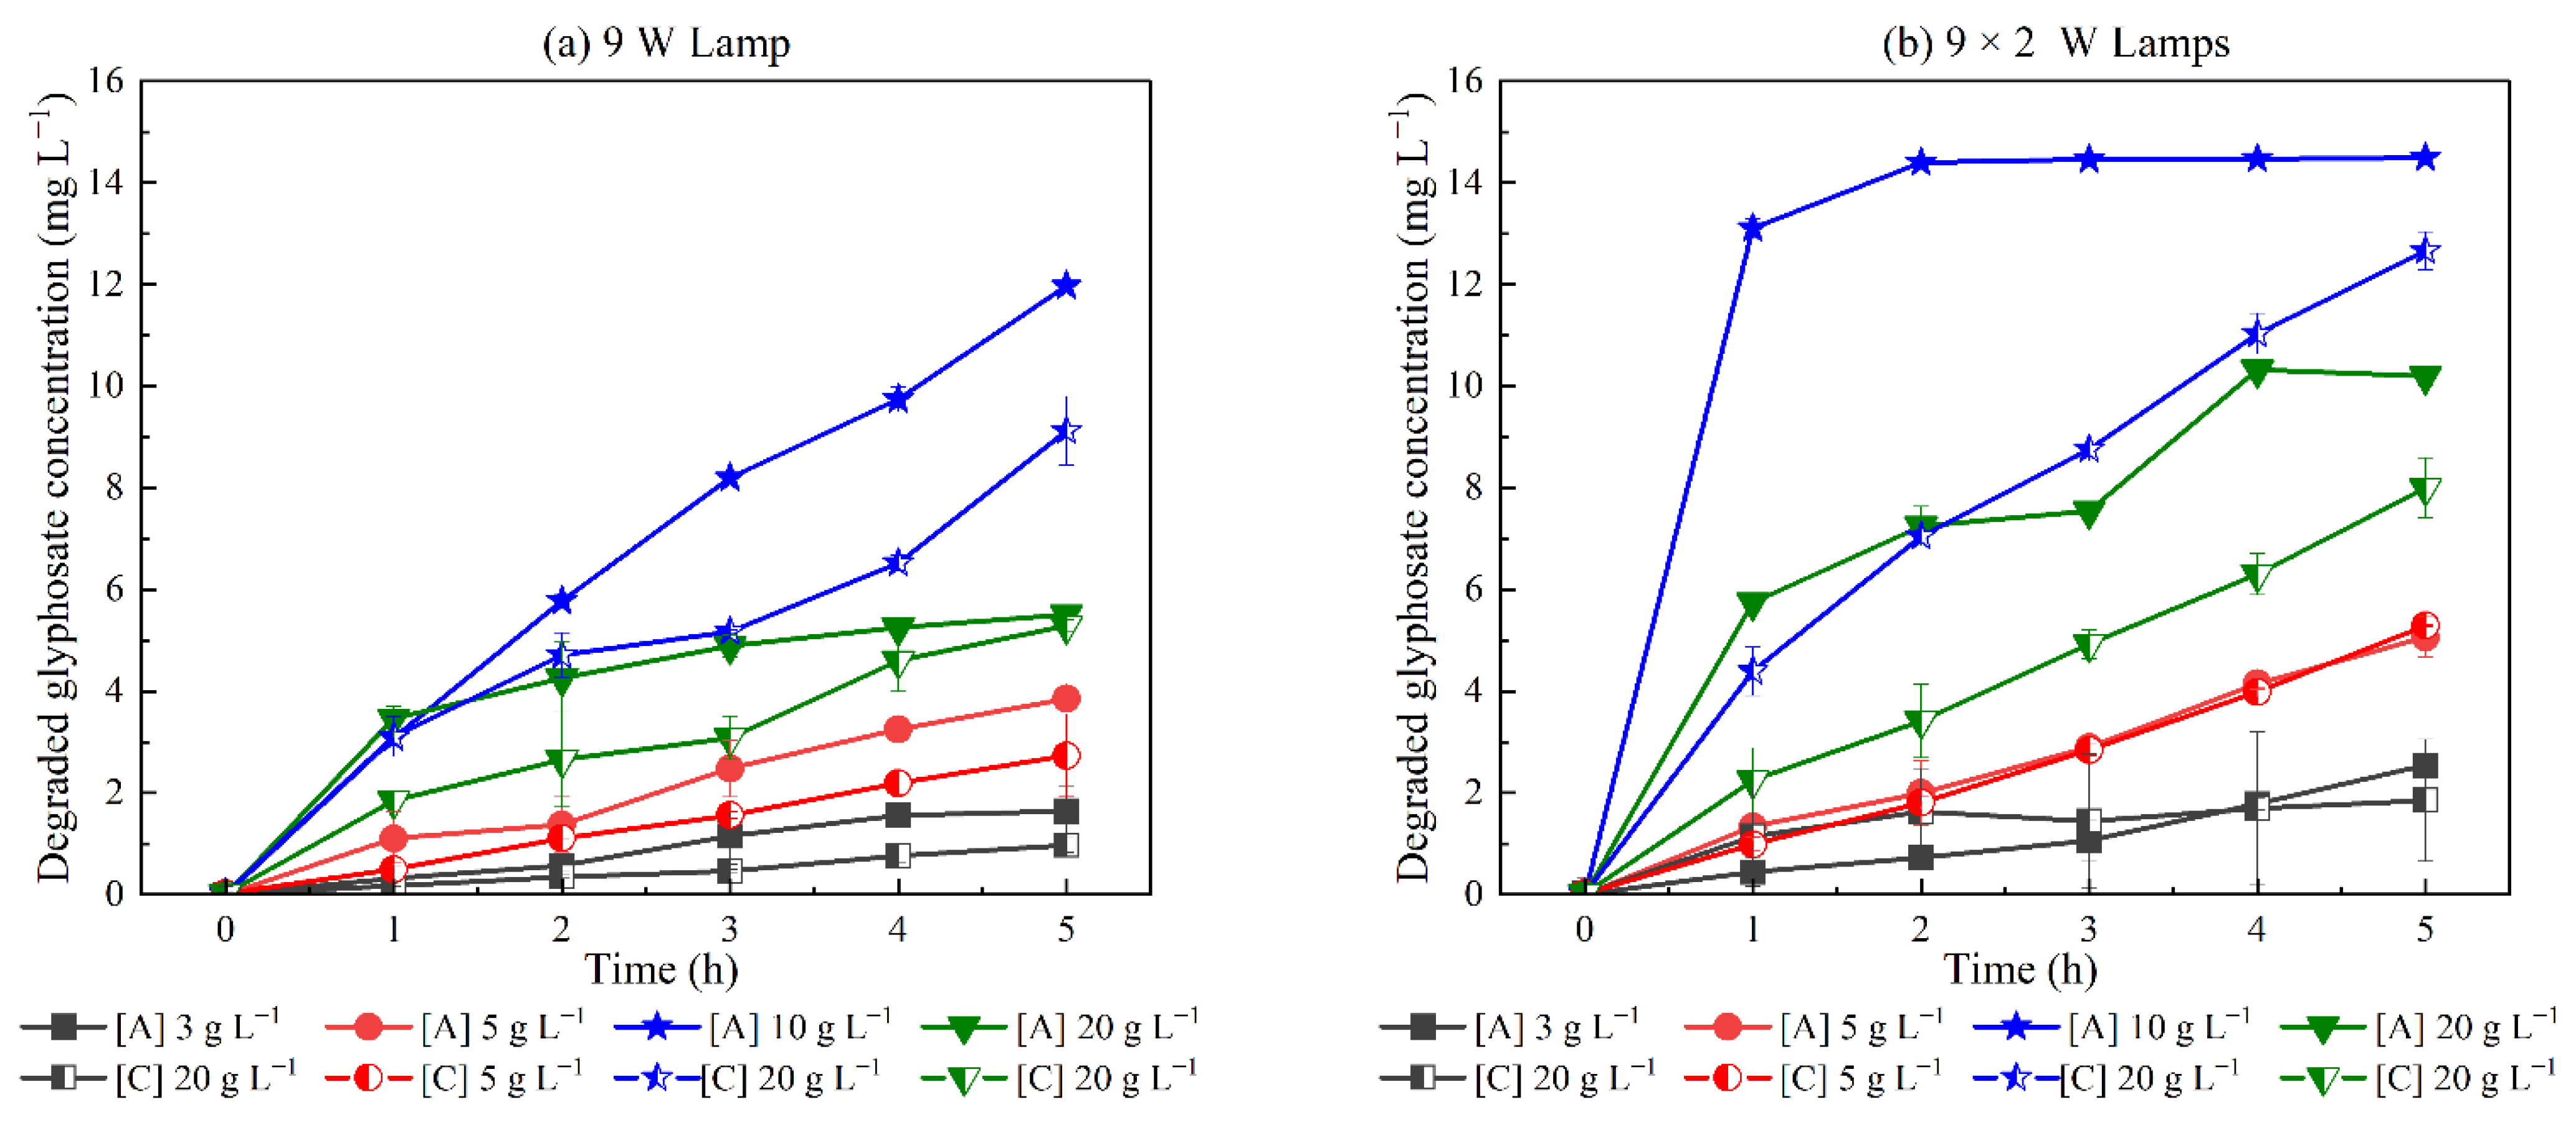
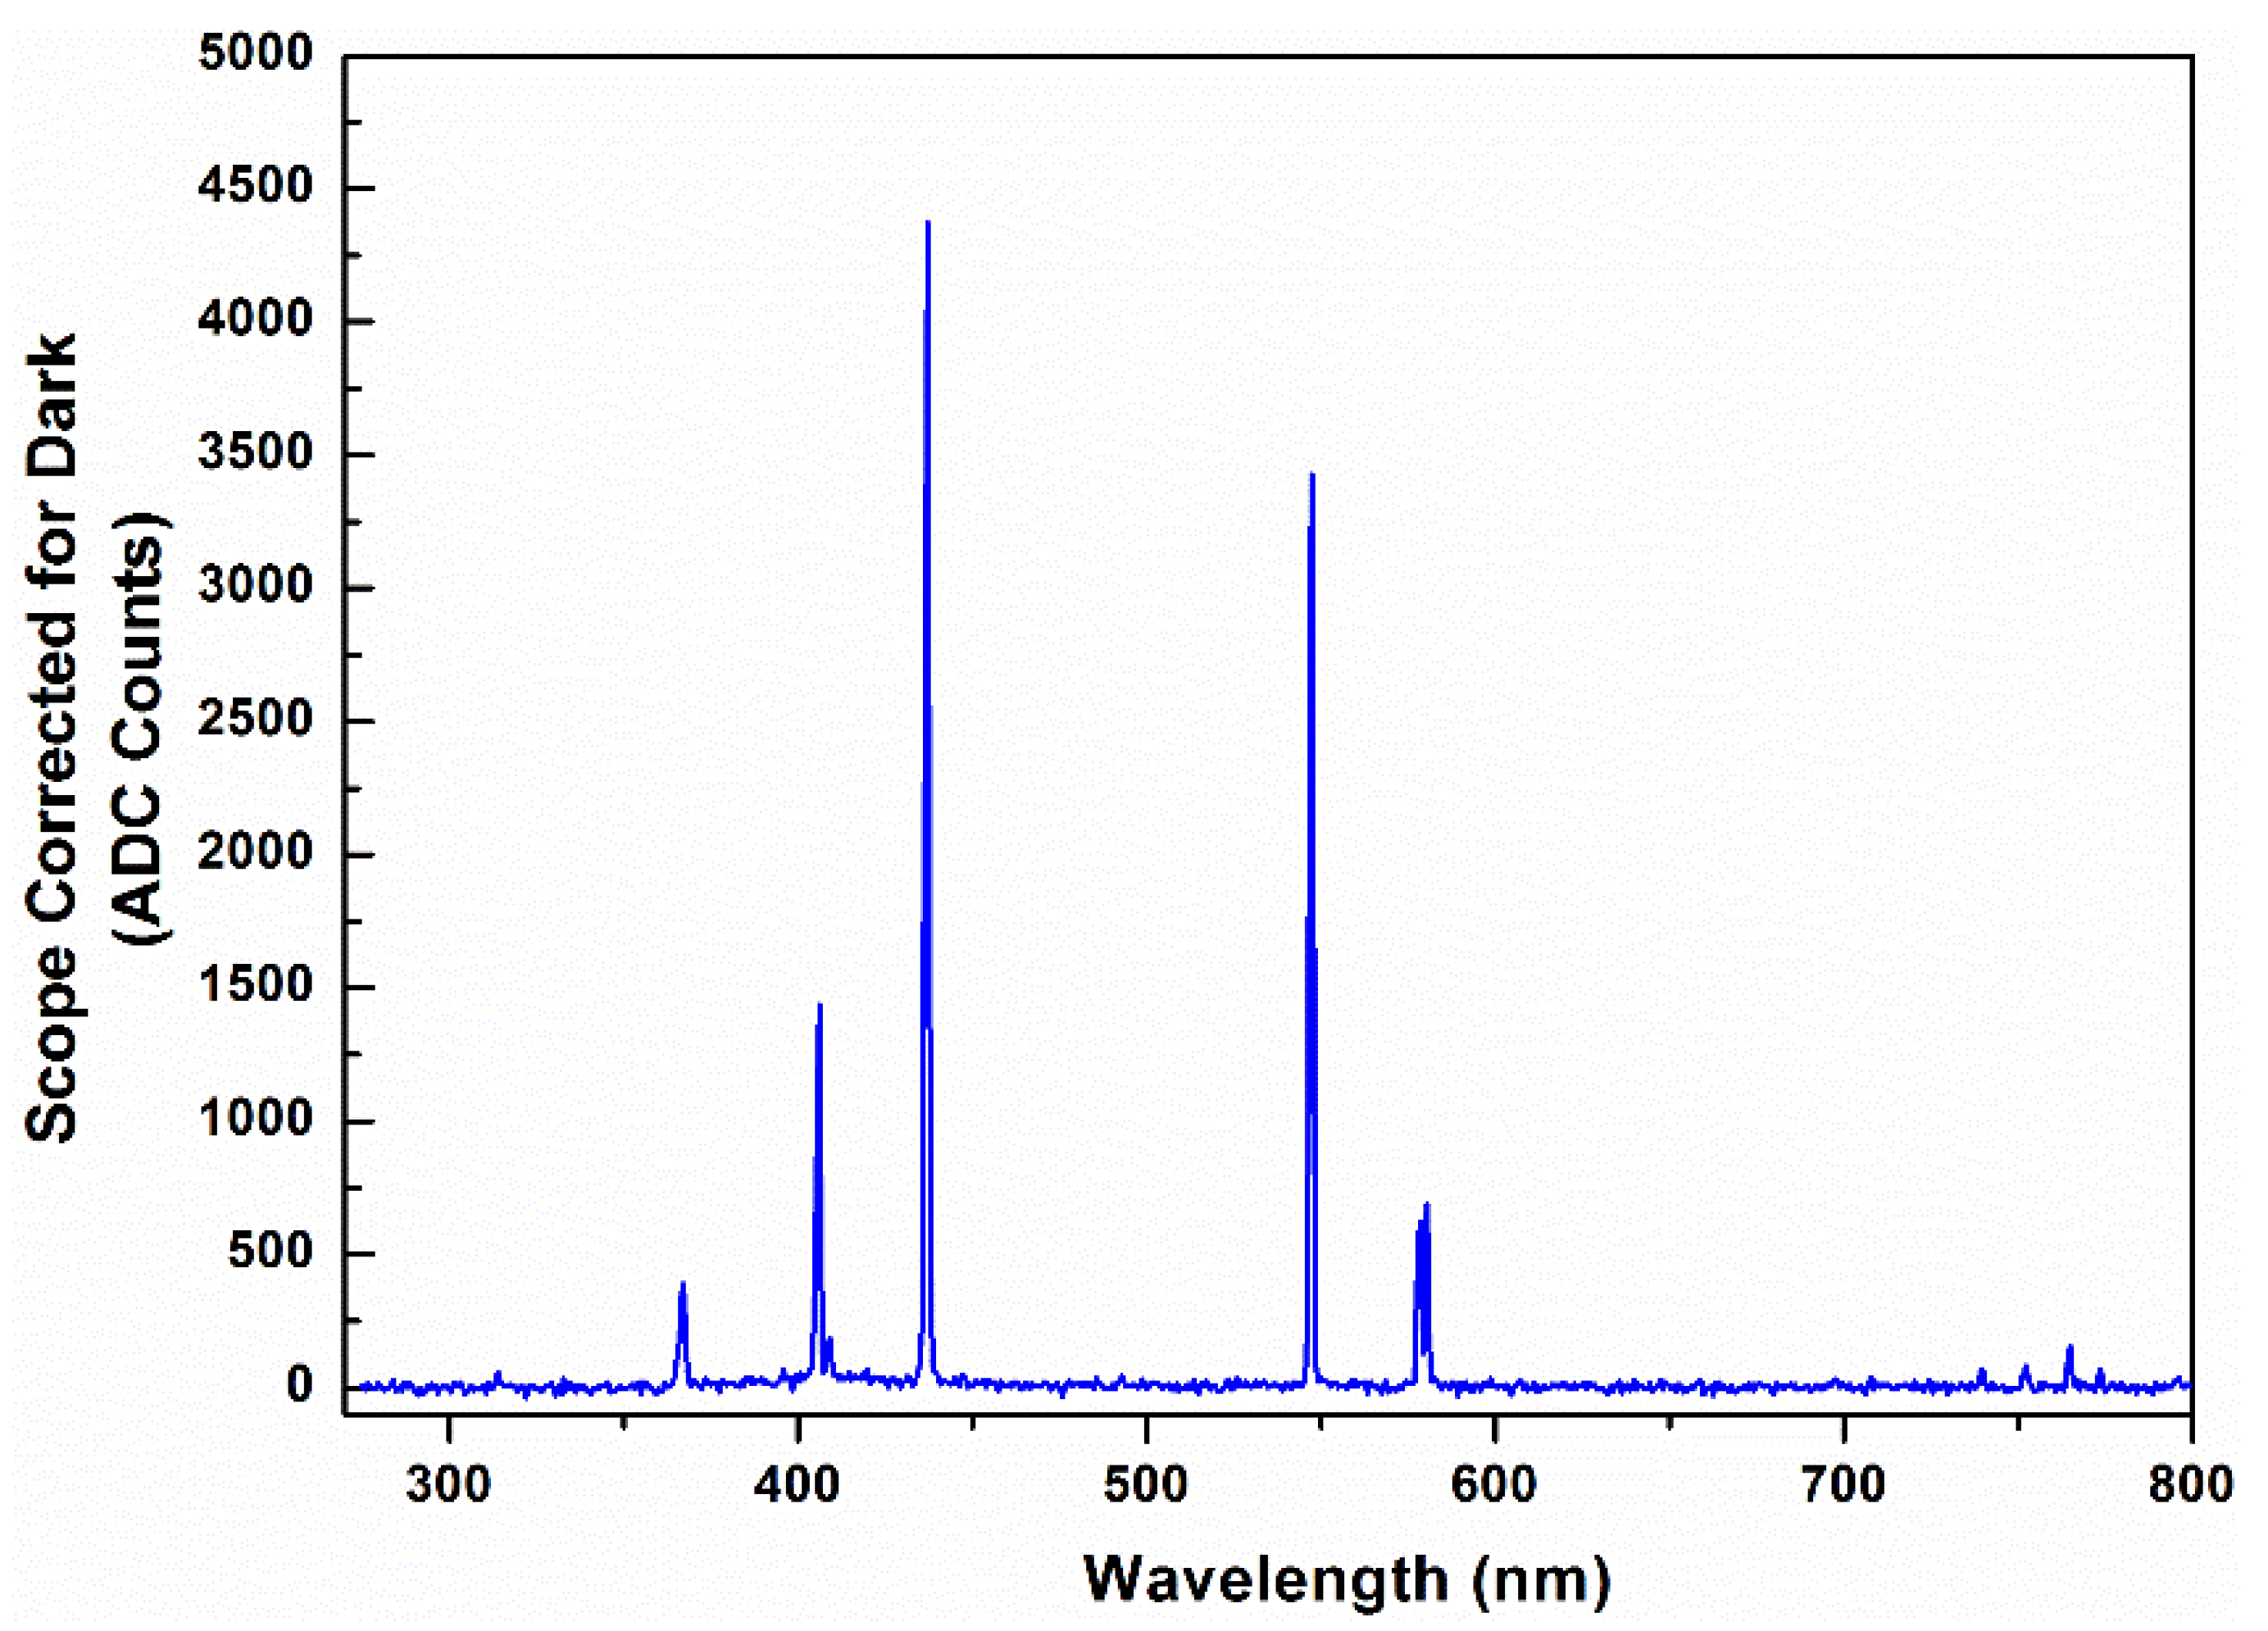
3.2.2. Effects of Irradiation Intensity

The performance of TiO2/RHB in glyphosate degradation using 2 × 9 W lamp irradiation is shown in Figure 5b.
The results were similar to experiments performed under irradiation with a 9 W lamp; the efficiency increased from 17% to 99% with increasing catalyst dosage from 3 g L−1 to 10 g L−1. While excellent performance, with 99% glyphosate degradation, was achieved for the TiO2/RHB with a catalyst dosage of 10 g L−1, the glyphosate degradation was only 72% for the TiO2/RHB with a catalyst dosage of 20 g L−1. These results confirm that beyond a certain limit of catalyst dosage, the suspension blocks UV radiation, which reduces the efficiency of photodegradation [25].
The results illustrated in Figure 5a,b show that photodegradation under a higher irradiation intensity has better performance than under a lower irradiation intensity, under the same conditions of catalyst dosage. Irradiation intensity is considered to be a critical factor that directly affects the reaction of pollutant decomposition by TiO2, due to the energy provided to create photocarriers. A higher intensity allows the formation of more electron–hole pairs, which increases the amount of radical OH produced, which is the strong oxidizing agent that degrades glyphosate [26,27].

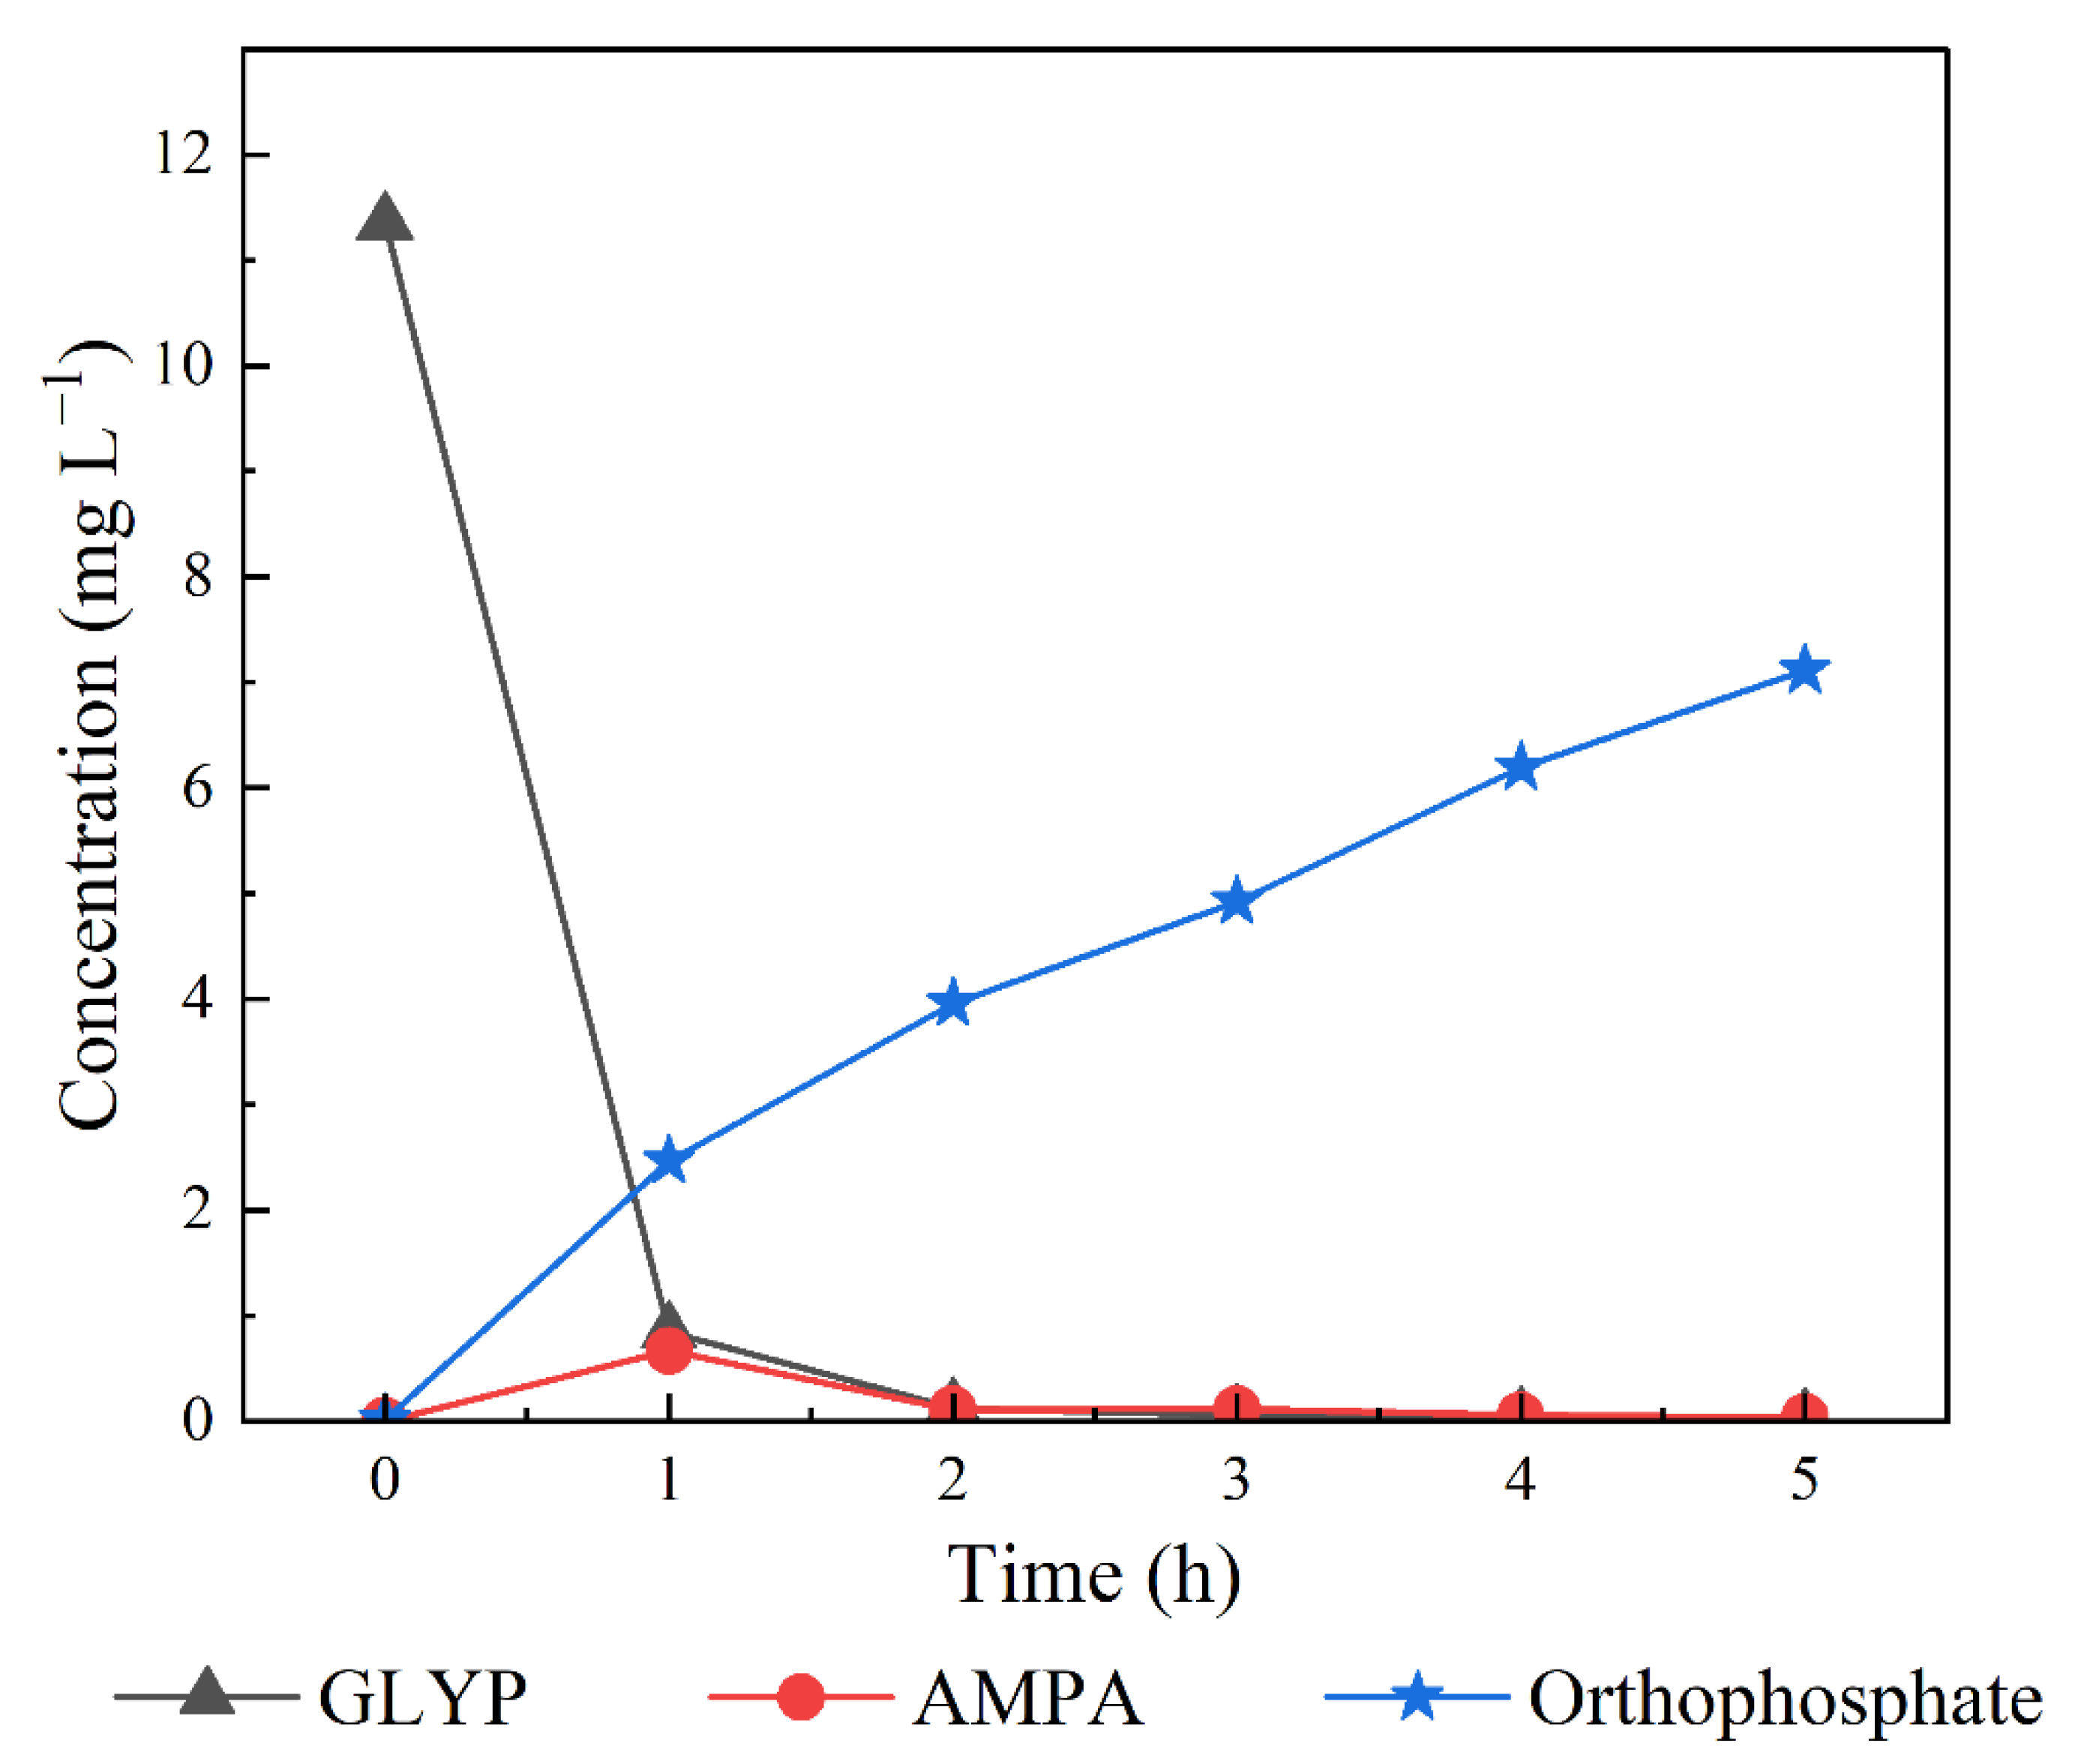
3.2.3. Mineralization Ability of Glyphosate

Orthophosphate analysis was conducted to study mineralization. The strong oxidizing agents created during the photocatalysis process could break down any complex organic matter into simpler compounds. Thus, one glyphosate molecule could be mineralized into one orthophosphate PO4 ion. The mineralization efficiency was used as a factor to assess the photocatalytic degradation of glyphosate under UV light irradiation. The formation of orthophosphate ions, as a function of concentration, is shown in Figure 6.
Overall, TiO2/RHB showed an excellent ability to mineralize glyphosate. The formation of orthophosphate ions in the solution increases with increasing catalyst dosage over time, as was observed when examining the effects of dosage and irradiation intensity.
To further assess the mineralization of glyphosate after 5 h of reaction, the degraded concentration of glyphosate ([GLYP]C), corresponding to the formed orthophosphate, was calculated according to Equation (3). [GLYP]C was then compared with [GLYP]A, which stands for the degraded concentration of glyphosate analyzed from the residues by UV–Vis. The difference between the calculated glyphosate ([GLYP]C) and the analyzed glyphosate ([GLYP]A) is shown in Figure 7.
In general, the results showed that there was a difference between the concentration of glyphosate ([GLYP]C) calculated from Equation (3) and the concentration of glyphosate ([GLYP]A) analyzed directly from UV–Vis spectroscopy under all the conditions, during 5 h of irradiation; for example, with 10 g L−1 of TiO2/RHB catalyst, and using 2 × 9 W lamps, the initial glyphosate concentration (15 mg L−1) was degraded to 0.067−1. [GLYP]A,t=5 is, therefore, equal to the initial concentration minus the residue concentration (0.06 mg L−1). After 5 h, glyphosate also converted to 7 mg L−1 orthophosphate, corresponding to 12.7 mg L−1 of [GLYP]C,t=5, which means that 2.3 mg L−1 of glyphosate was still not degraded to orthophosphate.
The difference between [GLYP]C and [GLYP]A suggests that glyphosate could not be completely degraded during the 5 h of reaction. Therefore, samples from the best-performing conditions (10 g L−1 TiO2/RHB, two UV lamps emitted at 365 nm) were analyzed by LC–MS/MS to determine the glyphosate concentration again, and confirm the hypothesis of the existence of its dominant intermediate—AMPA. The results are shown in Figure 8.
The results in Figure 8 confirm the great ability of TiO2/RHB to degrade glyphosate. In particular, after 1 h of irradiation, the residual concentration of glyphosate was lowered to less than 1 mg L−1, corresponding to a 93% removal efficiency. On the other hand, AMPA was present at a lower concentration, indicating the formation of other intermediates. It should be noted that the AMPA concentrations do not increase, but decrease with time, proving that, during photodegradation, AMPA is broken down simultaneously with glyphosate into other intermediates.

4. Discussion and Conclusions

TiO2 was successfully coated onto an RHB substrate using a sol-gel method. The TiO2/RHB substrate exhibited excellent photocatalytic properties and effectively removed glyphosate from the aqueous solution. The XRD analysis results indicate the formation of amorphous and some graphene structures of the RHB, and the formation of 10.61 nm TiO2 nanoparticles on the catalyst support. The SEM results reveal that the pore size is concentrated at the average levels of 28 μm and 50 nm. In combination with the EDX results, this also represents the inhomogenous distribution of TiO2 on the surface and in the pores of the support, with the weight percentage of Ti being about 10.2–20.4%. The FT-IR results also confirm the presence of TiO2, and hydroxyl groups and oxonium groups, which are beneficial for the adsorption and photocatalytic degradation of glyphosate.
The photodegradation efficiency of glyphosate is proportional to the increase in illumination time and catalyst dosage, until a threshold. Indeed, at levels above 10 g L−1, the efficiency decreased, due to turbidity effects, which prevent light being absorbed by the suspension. In this study, the catalyst dosage of 10 g L−1, using 2 × 9 W lamps, was found to be the best condition for glyphosate degradation, with a removal efficiency of 99% after 5 h. These results are completely consistent with the study of Chen and Liu [6], which showed that the optimal condition for the photodegradation of 2.5 × 10⁻⁴ M glyphosate is 6.0 g L−1 of TiO2 catalyst for 1 h during irradiation. They explained that the number of absorbed photons and glyphosate molecules increase with an increasing number of TiO2 particles. However, when the catalyst concentration exceeds 6.0 g L−1, the photodegradation of glyphosate can be affected by the light dispersion and screening, which reduce the activity of the catalyst [25]. This experimental setup was constructed with two parallel UV lamps in the same reactor to improve this phenomenon. The results reveal that the performance of glyphosate’s photodegradation effectiveness was considerably enhanced with two lamps.
Garcia and Takashima [27] also showed that TiO2 particle aggregation at high concentrations of photocatalysts can reduce the catalytic activity. However, in the present study, although the amount of TiO2/RHB catalyst used was quite high (10 g L−1), the real TiO2 dosage in the catalyst was only about 1–2 g L−1, according to the EDX analysis results. Therefore, the TiO2/RHB composite also limits the agglomeration of TiO2 nanoparticles in the medium. In addition, another benefit of the present study is that it is much easier to remove and reuse the catalyst after the reaction, compared to using TiO2 nanoparticles.
The acidic pH medium is also confirmed to have a significant effect on the adsorption capacity and metabolism of glyphosate. According to research by Muneer and Boxall [28], in acidic medium, electron attacks, through phosphate-adsorbed glyphosate, lead to the formation of a carbon-centered radical, which then reacts to form nonadsorbed sarcosine. Muneer and Boxall also explained that at pH 3, sarcosine was not adsorbed onto the TiO2 surface, due to the loss of the phosphate group in the molecule, so the wastewater treatment efficiency decreased. This supports our results, which indicated that many intermediate compounds are formed during the degradation of glyphosate. AMPA, which is also an intermediate compound, is destroyed after the photochemical decomposition reaction [29]. At the same time, the results of this study also suggest that phosphate is one of the end products of the photocatalysis process [6]. Trinelli et al. [30] also reported that phosphate is a stable by-product, due to its high oxidation state during photodegradation. Similarly, Lesueur et al. [31] also observed that AMPA was found to be a by-product, and degraded to phosphate under irradiation conditions in the presence of an Fe(III) catalyst. Furthermore, formic acid, formaldehyde, phosphate, and methyl phosphonic acid (MPA) are formed by the photocatalytic degradation of dimethyl-methyl-phosphate [32]. According to the results of Manassero et al. [33], the products of the photodegradation of glyphosate by UV-C and H2O2 were nitrate, phosphate, and formic acid.
In conclusion, this is the first investigation on TiO2 synthesis supported on biochar derived from agricultural by-products. Owing to the synergetic relationship between TiO2 and biochar, TiO2/RHB could be a potential catalyst for use in the photodegradation of glyphosate and organic pollutants.
In further studies, it is necessary to focus on (1) investigating other operating conditions, to determine the optimal conditions for glyphosate degradation; (2) determining the intermediates, to propose the mechanism and pathways of glyphosate degradation; (3) examining the applicability of the process in real wastewater treatment.

Author Contributions

Conceptualization, P.T.L.; methodology, P.T.L., H.T.B., L.A.P., T.T.D., T.P.Q.L.; investigation, D.N.L., T.H.N., H.T.B., L.A.P., T.T.D., T.P.Q.L.; resources, L.L.N., Q.S.N., T.P.N.; analysis and data curation, T.H.D., T.H.N., H.T.B., L.A.P., T.T.D., T.P.Q.L., D.L.V.; writing—original draft preparation, P.T.L., D.N.L., T.H.N.; writing—review and editing, P.T.L., M.H., S.O.; supervision, P.T.L.; project administration, H.M., L.A.P., Q.S.N., T.M.T.D.; funding acquisition, P.T.L., T.M.T.D., M.H., S.O. All authors have read and agreed to the published version of the manuscript.

Funding

This research was funded by the Vietnam Academy of Science and Technology (VAST), grant number: VAST07.04/20-21. The authors wish to acknowledge the support of the International Joint Laboratory LOTUS (land–ocean atmosphere regional coupled system) as well as the French Research Institute for Sustainable Development (IRD).

Institutional Review Board Statement

Not applicable.

Informed Consent Statement

Not applicable.

Data Availability Statement

Data is contained within the article.

Conflicts of Interest

The authors declare no conflict of interest.

Appendix A

The UV lamp CUH9L was provided by TEPRO (China) with a power of 9 W. The irradiation spectrum of the used lamp was characterized by AVANTES AvaSpec ULS 2048-RS. The wavelengths were scanned from 275 nm to 800 nm; this spectrum is shown in Figure A1 below.
Figure A1. Irradiation spectrum of the UV lamp.
Water 13 03326 g0a1
The output power of the lamp, measured by a LabMax energy meter, is 50 mW·cm−2 on the surface of the lamp in the air.
From the total output power of the lamp, the total number of irradiated photons is calculated by the following equation:
E = n × h × υ
where E is the calculated energy, n is the number of photons, h is the Planck’s constant (6.63 × 10⁻³⁴ J s−1), υ is the frequency, and c is the speed of light (3 × 10⁸ m s−1).
The photons per second per cm2 is calculated by the following equations:
n × υ = E h
n = E h × c λ
The calculated photon flux of the lamp used in the experiments is 9.17 × 1032 s−1 cm−2.

Appendix B

Figure A2. Point of zero charge of rice husk biochar (RHB). The pzc of rice husk biochar is pH 8.0.
Water 13 03326 g0a2

Appendix C

Figure A3. Calibration curve of glyphosate in range of concentration from 2 to 12 mg L−1 for correction of UV–Vis spectroscopy intensity.
Water 13 03326 g0a3

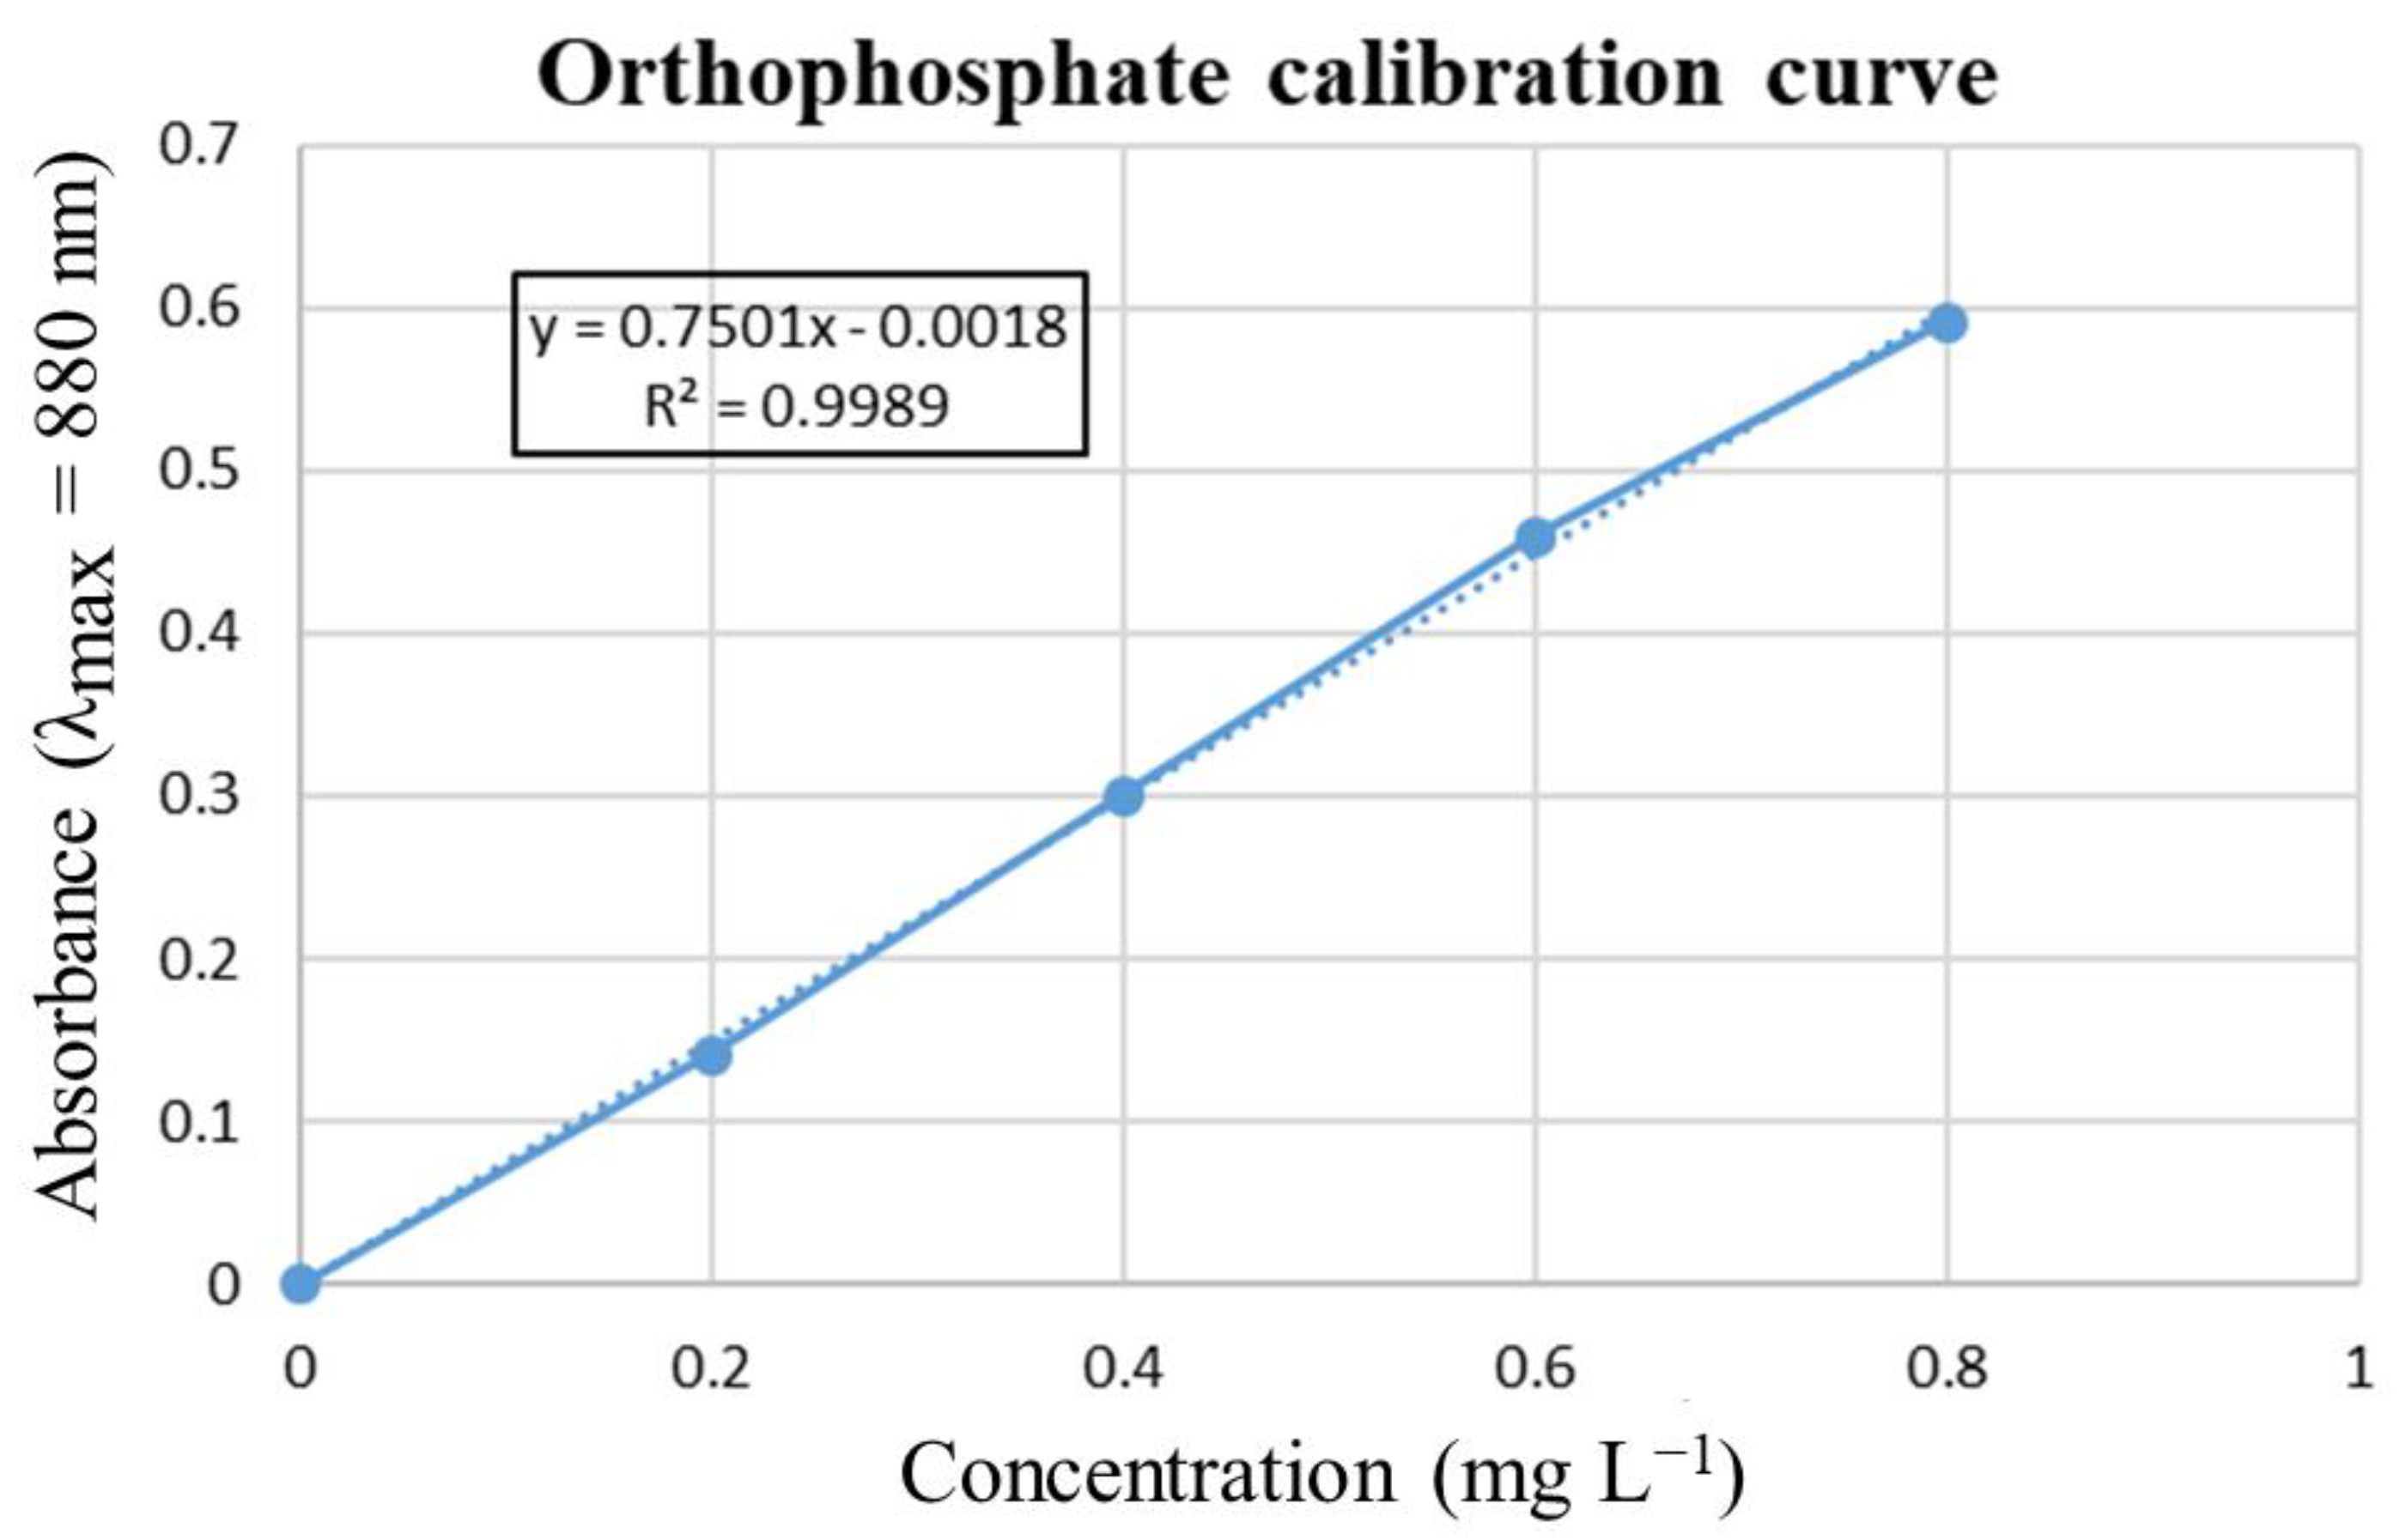
Appendix D. Calibration Curve of Orthophosphate

Figure A4. Calibration curve of orthophosphate in range of concentration from 0 to 0.8 mg L−1 for correction of UV–Vis spectroscopy intensity.
Water 13 03326 g0a4

Appendix E. The Gradient Elution Profile and the Compounds Information

Table A1. Gradient elution profile in LS–MS/MS.
Time (mn)% A% B
0.01
2.00
3.00
7.00
7.01
100
100
50
50
100
0
0
50
50
0
10.001000
Table A2. Compounds summary in HPLC-MS/MS.
Compoundm/zE (V)RT (mn)
Glyphosate168 > 63−304.07
AMPA110 > 60−262.87

Appendix F. SEM Images of Raw RHB

Figure A5. SEM image of raw RHB.
Water 13 03326 g0a5
Figure A6. SEM image of raw RHB.
Water 13 03326 g0a6

Appendix G. EDX Analyzed Position

Figure A7. SEM image with EDX detector of TiO2/RHB.
Water 13 03326 g0a7
Figure A8. EDX spectra of position 14.
Water 13 03326 g0a8

References

  1. Baylis, A.D. Why glyphosate is a global herbicide: Strengths, weakness and prospects. Pest Manag. Sci. 2000, 56, 299–308. [Google Scholar] [CrossRef]
  2. Battaglin, W.A.; Kolpin, D.W.; Scribner, E.A.; Kuivila, K.M.; Sandstrom, M.W. Glyphosate, Other Herbicides, and Transformation Products in Midwestern Streams, 20021. JAWRA J. Am. Water Resour. Assoc. 2005, 41, 323–332. [Google Scholar] [CrossRef] [Green Version]
  3. Battaglin, W.A.; Rice, K.C.; Focazio, M.J.; Salmons, S.; Barry, R.X. The occurrence of glyphosate, atrazine, and other pesticides in vernal pools and adjacent streams in Washington, DC, Maryland, Iowa, and Wyoming, 2005–2006. Environ. Monit. Assess. 2009, 155, 281–307. [Google Scholar] [CrossRef] [PubMed]
  4. Coupe, R.H.; Kalkhoff, S.J.; Capel, P.D.; Gregoire, C. Fate and transport of glyphosate and aminomethylphosphonic acid in surface waters of agricultural basins. Pest Manag. Sci. 2012, 68, 16–30. [Google Scholar] [CrossRef]
  5. Mahler, B.J.; Van Metre, P.C.; Burley, T.E.; Loftin, K.A.; Meyer, M.T.; Nowell, L.H. Similarities and differences in occurrence and temporal fluctuations in glyphosate and atrazine in small Midwestern streams (USA) during the 2013 growing season. Sci. Total. Environ. 2017, 579, 149–158. [Google Scholar] [CrossRef] [Green Version]
  6. Chen, S.; Liu, Y. Study on the photocatalytic degradation of glyphosate by TiO2 photocatalyst. Chemosphere 2007, 67, 1010–1017. [Google Scholar] [CrossRef] [PubMed]
  7. Xu, M.-L.; Gao, Y.; Li, Y.; Li, X.; Zhang, H.; Han, X.X.; Zhao, B.; Su, L. Indirect glyphosate detection based on ninhydrin reaction and surface-enhanced Raman scattering spectroscopy. Spectrochim. Acta Part A Mol. Biomol. Spectrosc. 2018, 197, 78–82. [Google Scholar] [CrossRef] [PubMed]
  8. Ghasemi, B.; Anvaripour, B.; Jorfi, S.; Jaafarzadeh, N. Enhanced Photocatalytic Degradation and Mineralization of Furfural Using UVC/TiO2/GAC Composite in Aqueous Solution. Int. J. Photoenergy 2016, 2016, 2782607. [Google Scholar] [CrossRef]
  9. Jonsson, J.; Camm, R.; Hall, T. Removal and degradation of glyphosate in water treatment: A review. J. Water Supply Res. Technol. 2013, 62, 395–408. [Google Scholar] [CrossRef]
  10. Herath, I.; Kumarathilaka, P.; Jayawardhana, O.; Mayakaduwage, S.; Bandara, T.; Wickramasinghe, S.; Vithanage, M. Rice husk derived engineered biochar for glyphosate removal in aqueous media; engineered biochar for pesticides removal. In Proceedings of the International Conference Environmental Conservation, Clean Water, Air & Soil (CleanWAS), Beijing, China, 26–28 August 2016; Ashraf, M.A., Aqma, W.S., Eds.; IWA Publishing: London, UK, 2017; p. 164. [Google Scholar]
  11. Herath, G.A.D.; Poh, L.S.; Ng, W.J. Statistical optimization of glyphosate adsorption by biochar and activated carbon with response surface methodology. Chemosphere 2019, 227, 533–540. [Google Scholar] [CrossRef] [PubMed]
  12. Espinoza-Montero, P.J.; Vega-Verduga, C.; Alulema-Pullupaxi, P.; Fernández, L.; Paz, J.L. Technologies Employed in the Treatment of Water Contaminated with Glyphosate: A Review. Molecules 2020, 25, 5550. [Google Scholar] [CrossRef] [PubMed]
  13. Lawrinenko, M.; Laird, D.A. Anion exchange capacity of biochar. Green Chem. 2015, 17, 4628–4636. [Google Scholar] [CrossRef] [Green Version]
  14. Speth, T.F. Glyphosate Removal from Drinking Water. J. Environ. Eng. 1993, 119, 1139–1157. [Google Scholar] [CrossRef]
  15. Lu, L.; Shan, R.; Shi, Y.; Wang, S.; Yuan, H. A novel TiO2/biochar composite catalysts for photocatalytic degradation of methyl orange. Chemosphere 2019, 222, 391–398. [Google Scholar] [CrossRef] [PubMed]
  16. Lu, M.-C.; Chen, J.-N.; Chang, K.-T. Effect of adsorbents coated with titanium dioxide on the photocatalytic degradation of propoxur. Chemosphere 1999, 38, 617–627. [Google Scholar] [CrossRef]
  17. Nghia, N.M.; Negishi, N.; Hue, N.T. Enhanced Adsorption and Photocatalytic Activities of Co-Doped TiO2 Immobilized on Silica for Paraquat. J. Electron. Mater. 2017, 47, 692–700. [Google Scholar] [CrossRef]
  18. Marien, C.B.D.; Marchal, C.; Koch, A.; Robert, D.; Drogui, P. Sol-gel synthesis of TiO2 nanoparticles: Effect of Pluronic P123 on particle’s morphology and photocatalytic degradation of paraquat. Environ. Sci. Pollut. Res. 2016, 24, 12582–12588. [Google Scholar] [CrossRef] [PubMed]
  19. Bhaskara, B.L.; Nagaraja, P. Direct Sensitive Spectrophotometric Determination of Glyphosate by Using Ninhydrin as a Chromogenic Reagent in Formulations and Environmental Water Samples. Helv. Chim. Acta 2006, 89, 2686–2693. [Google Scholar] [CrossRef]
  20. Murphy, J.; Riley, J.P. A modified single solution method for the determination of phosphate in natural waters. Anal. Chim. Acta 1962, 27, 31–36. [Google Scholar] [CrossRef]
  21. Severo, F.F.; Da Silva, L.S.; Moscôso, J.S.C.; Sarfaraz, Q.; Júnior, L.F.R.; Lopes, A.F.; Marzari, L.B.; Molin, G.D. Chemical and physical characterization of rice husk biochar and ashes and their iron adsorption capacity. SN Appl. Sci. 2020, 2, 1286. [Google Scholar] [CrossRef]
  22. Zhang, Y.; Ma, Z.; Wang, J.; Yang, Y.; Luo, X. Comparison of the Physicochemical Characteristics of Bio-char Pyrolyzed from Moso Bamboo and Rice Husk with Different Pyrolysis Temperatures. BioResources 2017, 12, 4652–4669. [Google Scholar] [CrossRef] [Green Version]
  23. Cai, X.; Li, J.; Liu, Y.; Yan, Z.; Tan, X.; Liu, S.; Zeng, G.; Gu, Y.; Hu, X.; Jiang, L. Titanium dioxide-coated biochar composites as adsorptive and photocatalytic degradation materials for the removal of aqueous organic pollutants. J. Chem. Technol. Biotechnol. 2018, 93, 783–791. [Google Scholar] [CrossRef]
  24. Coleman, H.; Vimonses, V.; Leslie, G.; Amal, R. Degradation of 1,4-dioxane in water using TiO2 based photocatalytic and H2O2/UV processes. J. Hazard. Mater. 2007, 146, 496–501. [Google Scholar] [CrossRef] [PubMed]
  25. Lea, J.; Adesina, A.A. The photo-oxidative degradation of sodium dodecyl sulphate in aerated aqueous TiO2 suspension. J. Photochem. Photobiol. A Chem. 1998, 118, 111–122. [Google Scholar] [CrossRef]
  26. Moma, J.; Baloyi, J. Modified Titanium Dioxide for Photocatalytic Applications. In Photocatalysts-Applications and Attributes; IntechOpen: London, UK, 2019; Volume 18. [Google Scholar]
  27. Garcia, J.C.; Takashima, K. Photocatalytic degradation of imazaquin in an aqueous suspension of titanium dioxide. J. Photochem. Photobiol. A Chem. 2003, 155, 215–222. [Google Scholar] [CrossRef]
  28. Muneer, M.; Boxall, C. Photocatalyzed Degradation of a Pesticide Derivative Glyphosate in Aqueous Suspensions of Titanium Dioxide. Int. J. Photoenergy 2008, 2008, 197346. [Google Scholar] [CrossRef] [Green Version]
  29. Lund-Høie, K.; Friestad, H.O. Photodegradation of the herbicide glyphosate in water. Bull. Environ. Contam. Toxicol. 1986, 36, 723–729. [Google Scholar] [CrossRef] [PubMed]
  30. Trinelli, M.A.; Cantera, C.G.; Areco, M.M.; Afonso, M.D.S. Glyphosate photodegradation: Stoichiometry, kinetic and catalytic effects. Int. J. Environ. Health 2019, 9, 306. [Google Scholar] [CrossRef]
  31. Lesueur, C.; Pfeffer, M.; Fuerhacker, M. Photodegradation of phosphonates in water. Chemosphere 2005, 59, 685–691. [Google Scholar] [CrossRef]
  32. O’Shea, K.E.; Beightol, S.; Garcia, I.; Aguilar, M.; Kalen, D.V.; Cooper, W.J. Photocatalytic decomposition of organophosphonates in irradiated TiO2 suspensions. J. Photochem. Photobiol. A Chem. 1997, 107, 221–226. [Google Scholar] [CrossRef]
  33. Manassero, A.; Passalia, C.; Negro, A.; Cassano, A.; Zalazar, C. Glyphosate degradation in water employing the H2O2/UVC process. Water Res. 2010, 44, 3875–3882. [Google Scholar] [CrossRef] [PubMed]
Figure 1. Schematic diagram of batch photoreactor.
Water 13 03326 g001
Figure 2. SEM images TiO2/RHB composites with different magnification at 50 μm (a,b) and at 5 μm (c,d).
Water 13 03326 g002
Figure 3. XRD patterns of RHB (orange line) and TiO2/RHB (blue line) and TiO2 (JCPDS card no. 21-1272 of anatase).
Water 13 03326 g003
Figure 4. FTIR spectra of (a) RHB; (b) TiO2 anatase; (c) TiO2/RHB.
Water 13 03326 g004
Figure 5. Glyphosate removal capacity by different catalyst dosages using (a) 9 W lamp and (b) 2 × 9 W lamps.
Water 13 03326 g005
Figure 6. The degradation of glyphosate into orthophosphate under different irradiation intensities.
Water 13 03326 g006
Figure 7. The mineralization of glyphosate into orthophosphate under different irradiation intensities.
Water 13 03326 g007
Figure 8. Photodegradation of 15 mg L−1 commercial glyphosate (pH 3.0) in the presence of 10 g L−1 TiO2/RHB (2 UV lamps emitting λ = 365 nm).
Water 13 03326 g008
Table 1. Elemental composition of RHB/TiO2 catalysts.
% WeightRHBTiO2/RHB
C
O
Si
Ti
Others
40.25
44.92
14.83
0
0
40.19
31.98
11.14
14.09
2.60
Total100100
Publisher’s Note: MDPI stays neutral with regard to jurisdictional claims in published maps and institutional affiliations.

