
Modeling Management and Climate Change Impacts on Water Pollution by Heavy Metals in the Nizhnekamskoe Reservoir Watershed


Laboratory of Regional Hydrology, Water Problems Institute of Russian Academy of Sciences, 119333 Moscow, Russia
*
Author to whom correspondence should be addressed.
Water 2021, 13(22), 3214; https://doi.org/10.3390/w13223214
Submission received: 27 September 2021
/
Revised: 5 November 2021
/
Accepted: 8 November 2021
/
Published: 12 November 2021
(This article belongs to the Special Issue Watershed Water Environment and Hydrology under the Influence of Anthropogenic and Natural Processes)
Abstract
:The semi-distributed physically based ECOMAG-HM model was applied to simulate the cycling of the heavy metals (HM) Cu, Zn, and Mn, and to identify spatial and temporal patterns of heavy metal pollution in water bodies of a large river catchment of the Nizhnekamskoe reservoir (NKR) in Russia. The main river of the catchment is the Belaya River, one of the most polluted rivers in the Southern Urals. The model was tested against long-term data on hydrological and hydrochemical monitoring of water bodies. It is shown that the pollution of rivers is formed mainly due to diffuse wash-off of metals into rivers from the soil-ground layer. Numerical experiments to assess the impact of water economic activities on river pollution were carried out by modeling scenarios of changes in the amount of metal discharged with wastewater, a disaster with a salvo discharge of pollutants, and the exclusion of anthropogenic impact on the catchment to assess self-purification of the basin. Modeling of chemical runoff in accordance with the delta-change climatic scenario showed that significant changes in water quality characteristics should not be expected in the near future up to 2050.
1. Introduction
Heavy metals (HMs) are one of the most dangerous pollutants of the environment. The main anthropogenic sources of HM are various enterprises of ferrous and non-ferrous metallurgy, mining enterprises, chemical enterprises, fuel installations, cement plants, electroplating industries, and transport. HM released into the environment are not decomposed, but rather only redistributed between its individual components. HMs accumulate relatively easily in soils, but their removal is slow. For example, the period of semi-removal of zinc from the soil is up to 500 years, while copper takes up to 1500 years [1]. In micro quantities, HMs are necessary for the processes of vital activity of organisms. Excessive amounts of HM are easily accumulated by the organs and tissues of hydrobionts and humans, adversely affecting their health and increasing the environmental risks of morbidity [2,3]. One of the main factors of the temporary detoxification of natural waters from HM ions is their adsorption by suspended particles, deposition in the form of poorly soluble inorganic compounds, and burial in bottom sediments.
HMs are one of the most common pollutants in the surface waters of Russia [4]. Their content in water bodies often exceeds the maximum allowed concentrations (MAC) established by the Russian Federation (Table 1), not only for fisheries and water use, but also for drinking water. Cases of high and extremely high pollution of HMs are recorded in individual water bodies, at which their concentrations reach values of 30–50 MAC or more.
In recent decades, a significant decrease in the amount of wastewater discharged through point sources and, accordingly, the amount of pollutants, has been observed in most river catchments of the Russian Federation [5,6]. However, the expected decrease in the HM content in many water bodies is not marked [4,7]. This discrepancy indicates the need to deepen the understanding of the influence of various processes occurring in river basins on the formation of river water quality. Such investigations are complicated by a number of circumstances. Firstly, the existing network of state hydrochemical monitoring of water bodies in Russia has large spatial and temporal sparsity, which makes it difficult to reliably identify the regularities of the hydrochemical regime and the formation of the quality of river water under the influence of changing natural and anthropogenic factors. Secondly, due to the imperfection of the accounting system of water user enterprises that provide statistical reports on wastewater discharges, it is quite difficult to correctly assess the contribution of point sources to water pollution [8,9,10]. Third, monitoring of diffuse sources of pollution in the catchment area is not carried out. The best indicators of diffuse pollution are medium and, especially, small rivers, but hydrochemical monitoring points are mainly located only in large rivers in places of organized wastewater discharge: Individual large industrial enterprises, thermal power plants, nuclear power plants, as well as in the locations of cities and large settlements. Prospects for studying the patterns of HM content in river basins, predicting its changes with possible changes in climate and economic activity, and planning water protection measures in low-light conditions with observational data are associated with the construction of mathematical models describing these patterns.
Modeling the water quality of river catchments has a relatively long history. Intensive development of methods for assessing river pollution associated with the use of fertilizers in agriculture began in the 1960s. These methods were based mainly on empirical relationships for calculating pollutant washouts from agricultural fields using correlations with climatic and physico-geographic parameters [11].
One of the first conceptual field-scale models of water quality was the CREAMS model (Chemicals Runoff and Erosion from Agricultural Management Systems) [12]. The model includes a description of processes in hydrology, erosion, plant, and chemistry sub-models and is used in agricultural management practices. The main limitations of the CREAMS are related to the small size of the simulated area bound by the agricultural field. The ideology of the CREAMS model was the impetus for the creation of many modifications of conceptual models, describing water quality formation in areas with nonpoint spatial pollution (reviews can be found in [13,14,15,16]).
Since the 2000s, semi-distributed models of the river runoff and water quality formation have been used to evaluate the effects of alternative management decisions on water resources and non-point source pollution in river basins. Among others, the Soil and Water Assessment Tool (SWAT) is widely used for the simulation of river discharge and pollution loads at different scales: From the continental scale [17], through the regional scale [18], to the scale of individual river catchments [19,20]. There is evidence in using semi-distributed models for the evaluation of measures to reduce contaminant loads and improve the ecological status of water bodies in Germany (SWIM, Soil and Water Integrated Model [21]; MONERIS, Modeling Nutrient Emissions in River Systems [22]; METALPOL model [23]) and in Sweden (HYPE, Hydrological Predictions for the Environment [24]) in the framework of the implementation of the European Water Framework Directive. In semi-distributed models, the watershed is divided into several subbasins—Hydrological Response Units (HRUs). Each HRU is divided into several layers, and the vertical and horizontal fluxes of water, sediment, and nutrients loadings that move into the river network are modeled. Previous authors [24] drew comparisons between several semi-distributed water quality models based on their complexity, input data constraints, and performance of the models. Overviews of the water quality formation models can be found in [25,26,27,28].
Most of the semi-distributed models of water quality formation in river basins were used mainly for biogenic elements (nitrogen and phosphorus). Much less research is devoted to modeling the formation, transport, and transformation of heavy metals in rivers, which may create serious environmental problems in the region. Such models are usually developed for mining areas [29] with widespread waste rock dumps, tailing dumps [19], and contaminated soil [30], as well as in areas with a wide spread of “dirty” industries [31]. For example, in [19], the load of HM transported by the highly contaminated mine drainage river has been assessed using a combination of the SWAT model (for hydrological simulation) and an empirical equation statistically relating local discharge with the concentration of elements. A statistical approach using a multilayer perceptron neural network model was also used in [29] to forecast the content of HM pollutants in stormwater sediments on the basis of atmospheric data and catchment physico-geographic characteristics. In [31], a detailed heavy metal transport and transformation module was developed and combined with the SWAT model for the purpose of simulating the fate and transport of metals at the watershed scale. This modification of the SWAT-HM model was calibrated and validated to simulate Zn and Cd dynamics in the watershed, which has been impacted by mining activities for decades. The authors noted that the developed model has a high potential for application in environmental risk analysis and pollution control to provide scientific support for pollution control and remediation decisions.
One physically based model of runoff and water quality formation in river basins developed in Russia is the ECOMAG-HM model (Ecological Model for Applied Geophysics–Heavy Metals) [30,32]. The model is well adapted to the description of processes in river basins with a snow-type water regime, as well as the structure and composition of hydrometeorological information in Russia. The hydrological module of the ECOMAG model has been repeatedly tested on many large river basins and is used in the practice of hydrological calculations, forecasts, and water resource management in the Russian Federation [33]. The hydrochemical module was applied to assess possible changes in river water pollution under various scenarios of the Pechenganikel mining complex in the north-west of the Kola Peninsula, which creates environmental problems in the region [30]. Besides, the model was verified using hydrochemical monitoring data in a large river basin to study the regime of HM concentrations in the watercourses of the Nizhnekamskoe reservoir (NKR) catchment in Russia (for copper [32] and zinc [34]) [35].
The main purpose of the study is to assess the ECOMAG-HM model’s potential to study spatio-temporal patterns of HM runoff formation in a large river basin (with the example of the NKR basin) to quantify scenarios of the water protection measures under possible changes in water economic activity and climate. The specific objectives of the study were (a) to evaluate the capabilities of the model for assessing HM pollution of river waters in various sections of the river network to solve the problem of designing a hydrochemical monitoring network; (b) to assess the contributions of diffuse and point anthropogenic sources to HM pollution in the NKR watershed; (c) to assess changes in water quality of water bodies under various scenarios of anthropogenic load on the river basin; and (d) to assess changes in the hydrological and hydrochemical regime of rivers under a scenario of possible climatic changes. In this paper, in the section of the testing results of the model, more attention is paid to the study of the spatio-temporal patterns of manganese in river waters. The results of the copper and zinc simulations in the river system are used for comparison with the manganese regime, as well as to illustrate the HM regimes under various scenarios of changes in water economic activity and climate.
2. Materials and Methods
2.1. Study Area: The Nizhnekamskoe Reservoir Watershed
The Nizhnekamskoe reservoir was created in the valley of the Kama River (the largest tributary of the Volga River) in 1979. The area of the NKR watershed between the Nizhnekamsk (Naberezhnye Chelny city) and Votkinsk (Tchaikovsky city) hydropower plants is 186,000 km2, most of it (142,000 km2) occupied by the basin of the Belaya River River (Figure 1). About 2/3 of the catchment area in the western and central parts is flat territories, and the eastern part is the Ural folded mountain region. The average height of the basin is 392 m, and the highest is 1654 m (Yaman-Tau Mountain). Forest occupies about 50% of the territory.
The climate of the territory is continental. There are a number of transitions from the climate of semi-arid steppe regions, where the annual precipitation ranges from 300–400 mm and the average annual air temperature is about 3 °C, to more humid areas (north-eastern and eastern mountain-forest), where the annual precipitation exceeds 600 mm and the average annual air temperature is below 1 °C. The rivers are mainly fed by snow. More than 60% of the annual runoff passes during the spring flood. The average annual lateral inflow of water to the NKR is 36.5 km3, of which 26.1 is accounted for by the flow of the Belaya River. To compensate for the shortage of water resources, which often occurs in low-water years, about 400 reservoirs and ponds with a volume of more than 100,000 m3, as well as many smaller ponds, operate in the basin. The largest reservoirs are Pavlovskoye on the Ufa River, Nugushskoye on the Nugush River, and Yumaguzinskoye on the Belaya River.
A feature of the geological structure of the territory is the wide distribution of ore deposits and the significant concentration of ore elements in rocks. More than 3000 deposits and manifestations of various types of minerals have been discovered in the NKR basin [36]. The soils of the catchment area (chernozems, sod-podzolic, gray forest) are characterized by a high content of humus and heavy mechanical composition. Well-drained mountain soils are common in the east of the region. Soils inherit the chemical composition of soil-forming rocks. In the soil, HMs are included in the composition of humic substances, forming strong complexes with humic and fulvic acids, and are not removed from it for hundreds and thousands of years [1]. The heavy mechanical composition of soils contributes to the increased accumulation of HM. About 60% of the studied territory is erosively dangerous land as a result of water and wind erosion. Eroded soils enriched with trace elements contribute to the entry of HMs into water bodies with sediments [36,37].
The industrial development of the region began almost 300 years ago, was associated with the development of mineral deposits, and took place without taking into account environmental restrictions. “Ancient” anthropogenic-transformed mining landscapes, modern industrial enterprises for the extraction and processing of mineral resources, large settlements, and their infrastructure objects are sources of additional metal supply to the catchment area. In the eastern part of the catchment, such sources are mining enterprises, while in the western and central parts, they are enterprises of oil production, oil refining, chemistry and petrochemistry, metallurgy, mechanical engineering and energy, and objects of storage of production and consumption waste.
As mentioned above, in recent decades, the volume of pollutants entering water bodies from controlled point sources has been decreasing for reasons that are not fully established: Perhaps due to the decrease in water consumption [5,6] or due to the decrease in the number of monitored water users providing statistical environmental reports of industry, settlements, and communal services on the 2-TP (vodkhoz) form [8]. In [38], an assessment of the correctness of the information contained in the reporting forms of 2-TP (vodkhoz) was evaluated. According to the results of the assessment, a large number of cases were revealed when the amount of metal actually contained in wastewater significantly exceeded the statistical data, and in some cases, the excess was 1–2 orders of magnitude. The revealed differences can be explained by the shortcomings of the existing system for monitoring the composition of wastewater at enterprises. In the absence of automatic continuous monitoring of the HM content in wastewater at enterprises, the assessment of the HM discharge is carried out either on the basis of individual episodic water samples, or indirectly by the number of products produced. Such approaches inevitably introduce significant errors in determining the actual HM discharges from point sources [9,10].
2.2. ECOMAG-HM Model
The semi-distributed physically based ECOMAG-HM model [30,32] was developed to simulate the spatio-temporal dynamics of hydrological and hydrochemical cycle components in large river basins. The model operates with a daily time step and consists of two main blocks: The hydrological submodel of runoff formation and the hydrochemical submodel of pollutant migration and transformation. The first submodel describes the main processes of a land hydrological cycle: Vertical fluxes (infiltration of rain and snowmelt water into the soil, percolation of water into deeper soil horizons and groundwater zone, evapotranspiration), changes in water and energy contents in different components of the geosystem (snow cover formation and melting, soil freezing and melting, surface water, soil moisture, groundwater level), and lateral fluxes (formation of surface, subsurface, groundwater flow), which form the river runoff.
The hydrochemical submodel describes the processes of migration and transformation of conservative pollutants in catchments. It accounts for pollutant accumulation on land surfaces, dissolution by melt and rainwater, penetration of dissolved forms of pollutants into soil, and interactions with soil solution and soil solid phases. Pollutants are transported by surface, subsurface, and groundwater flows to the river network and form the lateral diffuse inflow into rivers. The submodel of the transfer and transformation of pollutants in the river system include the lateral diffuse inflow and load of pollutants from point anthropogenic sources to the rivers and routed through the river network to the outlet of the catchment, taking into account the exchange of pollutants between the river water and riverbed.
The Information-Modeling Complex (IMC) ECOMAG was developed for easy use and adaptation of the model for river basins under various projects of information support in water resources management, forecasting water and hydrochemical regimes, and research. The IMC computer technology contains the calculation module of the mathematical model, databases, and instruments for information and technological support of this module. Thematic digital maps (a digital elevation model, hydrographic network, soils, and landscapes) are applied for automated division of the river basin into elementary watersheds (model cells, analog HRU in SWAT) and a schematization of the river network using the specific GIS tool Ecomag Extension. Data on hydrometeorological, hydrochemical, and water management monitoring as well as instruments for geoinformation processing of these spatial data are involved in the IMC ECOMAG for calibration of the model parameters, verification, testing of the model, and calculations for various projects.
The concept, algorithms, equations, and results of the application of the hydrological module in operative water management and forecast practice were described in many studies [33] and applied to river basins of different scales (including the largest in the northern hemisphere: The Volga, Lena, Selenga, Amur, Mackenzie, etc.) located in different geographic zones with different runoff formation conditions and hydrological regimes of water bodies. The geography of application of the hydrochemical module of the ECOMAG-HM model for environmental problems is more moderate. A description of the hydrochemical module and results of validation of the model were published in [30,32,34,35].
2.3. Data Preparation and Model Setup
For calculations on the model, boundary conditions were set in the form of daily spatial meteorological fields, concentrations of heavy metals in atmospheric precipitation, and pressure groundwater feeding the upper groundwater zone. Daily data on 56 meteorological stations located in the NKR watershed for the 1979–2011 period were used to construct meteorological fields of air temperature, precipitation, and air humidity deficit. The concentrations of metals in atmospheric precipitation were set by constant values based on the weighted average concentrations given in [39]. Furthermore, the concentrations of metals in the pressure groundwater were set as constant values, based on the data given in [40]. In addition, as information on the point anthropogenic sources of river water pollution, mean annual data on metal discharges with wastewater in 12 large settlements in the Belaya River were set on the basis of State statistical reporting forms 2-TP (vodkhoz) for the 2002–2007 period. Maps of heavy metals content in the arable soil layer on the territory of the Republic of Bashkortostan [41], which occupies a large part of the NKR catchment area, were used to set the initial conditions for the hydrochemical module of the ECOMAG-HM model.
To calibrate the model parameters and verify the hydrological module, data on daily river discharge at 5 hydrological gauges were used. The data of observations of HM concentrations at points of the Russian State Monitoring Survey on the Belaya River and its tributaries were used to calibrate the parameters and test the hydrochemical module: For copper and zinc, at 35 points for the 2004–2007 period; for manganese, at 26 points for the 2002–2007 period. As a rule, observations of the metal content in river waters were carried out once a month.
The spatial schematization of the catchment area and the river network in the NKR basin was produced using the Ecomag Extension tool on the basis of a digital elevation model. As a result, 503 elementary watersheds were identified in the catchment; their average area is about 400 km2.
The values of most of the model parameters were set from the IMC ECOMAG databases using available maps of land surface characteristics (relief, soil, vegetation) or were determined on the basis of literary data [42]. Some parameters of the model were corrected using the calibration procedure by comparisons with daily runoff hydrographs and observations of HM concentrations in river waters at observation stations within the framework of hydrological and hydrochemical monitoring of water bodies. Numerical experiments have shown that the most sensitive parameters of the hydrological submodel are the saturated hydraulic conductivities of soils, the evaporation index, and the degree–day coefficient of snow melting. In the hydrochemical submodel, the constants of the sorption equilibrium of HM in soils and the parameter accounting for the exchange of metals between river water and bottom sediments were refined by calibration.
2.4. Scenarios of the Water Economic Activity Changes Experiments
In order to assess the impact of water economic activity changes on river water pollution, a series of numerical experiments was evaluated, in which the following scenarios were performed:
- an increase in the amount of metal in the wastewater of all localities with controlled wastewater discharges;
- a salvo of a significant amount of HM into the watercourse as a result of an emergency discharge in one of the localities;
- complete exclusion of anthropogenic impact on the catchment.
2.4.1. Scenario 1. Change in the Amount of Wastewater Entering the River Waters
Water pollution was simulated under various scenarios of changes in the amount of metal discharged in wastewater at 0.1, 10, 20, 40, 60, 80, and 100 times in relation to the existing level (represented as 2-TP (vodkhoz) forms) in all localities. In fact, such changes may be due to an increase in industrial production, or in some cases, as a result of more objective and correct presentation of information in the 2-TP (vodkhoz) reports on the amounts of HM discharged by water users in some localities [9,10,38].
2.4.2. Scenario 2. The Simulation of a Disaster
The simulation of an extreme situation that led to a significant amount of HM entering the watercourse was carried out. The reason for this situation may be accidents at liquid waste storage facilities, multiple discharges of wastewater as a result of unstable operation of enterprises, unauthorized discharges of contaminated wastewater without treatment, etc. The algorithm of events was as follows. As the input to the model, various amounts of metals were dumped at a certain point in the river network during the day. Then the concentrations of metals in the river network below the emergency point were calculated.
2.4.3. Scenario 3. Exclusion of Anthropogenic Impact on the Catchment Area
The estimation of the time scale of self-cleaning of the catchment from HM in the scenario of complete exclusion of anthropogenic impact on the NKR basin was performed. It was assumed that HMs were not dumped in the wastewater, and the entry of metals into the atmosphere with industrial emissions was also excluded (the concentration of metals in precipitation was equal to zero). The concentration of metals in the pressure groundwater decreased to the lowest level in the range of typical values for the underground water of the studied region. Under these conditions, numerical experiments were carried out to estimate the dynamics of heavy metals in river waters for 400 years ahead. A series of historical data of meteorological observations at weather stations for 33 years, from 1979 to 2011, was used as a meteorological forcing. The final results of calculations of the river basin characteristics for 31 December 2011 were recorded at the starting point of 1 January 1979, and thus the calculations for the 33-year time series were repeated many times.
2.5. Description, Evaluation, and Processing of Climate Scenario Data
To construct a scenario of the future climate for the NKR basin, the trends in annual temperature, precipitation, and runoff for several meteorological and hydrological stations located in the watershed area over the period of 1956–2007 were analyzed. It was found that at the turn of the 1980s, there were changes in climate signals between the climate parameters for two periods. The average air temperature for the 1980–2007 period increased by about 1 °C compared to the previous period of 1956–1979. The increase in annual precipitation over the 1980–2007 period compared to the previous period averaged for the whole considered meteorological stations was about 10%. The difference in the mean annual runoff was about 10% in the gauges of the Belaya River during these periods (see examples in Figure 2). Modeling the water and chemical runoff for the future period, up to 2050, was carried out using the so-called “delta change” (DC) climatic scenario, assuming changes in climate parameters to be the same as for the previous observation periods. So, the obtained increments of the annual daily air temperature of 1 °C and daily precipitation multiplied to 1.1 were introduced to the corresponding historical daily series of climate parameters for the last observation period. It should be noted that similar trends in runoff changes for the region under consideration over the past decades and in the near future are given in the review [43].
3. Results and Discussion
3.1. ECOMAG-HM Testing of the Model
3.1.1. Model Verification
The hydrological submodel was calibrated and verified by comparing the observed and simulated runoff hydrographs at several hydrological stations in the NKR basin over the 1978–2013 period. The results of the tests showed satisfactory agreement between the observed and simulated runoff characteristics according to the Nash–Sutcliffe efficiency criterion for the daily hydrographs, and the PBIAS criterion for the annual runoff volumes [32,33]. Figure 3 shows these comparison results at four stations over the 2002–2007 period, which will be later used for the simulation of hydrochemical characteristics.
An additional successful test of the model for the rivers not covered by hydrometric observations was performed by comparing the map of the mean annual specific runoff estimated on the basis of averaging the simulated daily runoff in the nodes (centers of gravity) of elementary watersheds over many years with the map of specific runoff given in SNIP-2.01.14-83 [32,44]. The latter is used in Russia for the estimation of the hydrological characteristics in the design of hydraulic structures on rivers in the absence of hydrometric observations.
The hydrochemical submodel was tested by comparing observed and simulated concentrations of copper [32] and zinc [34] in different sections of rivers of the NKR basin. The rare frequency of observations at the hydrochemical monitoring points (usually up to 12 observations per year), as well as significant errors in determining HM concentrations in water samples (~50%), do not allow the full use of traditional statistical hydrological criteria for comparing the results of model calculations of intra-annual HM concentrations and episodic data of hydrochemical measurements [45]. Characteristics averaged over longer time periods can be determined more reliably based on such data.
Examples of the comparison of the intra-annual distribution of Mn concentrations (daily and averaged over quarter (three-month) periods) are shown in (Figure 4). As can be seen, seasonal changes in the Mn content are characterized by increased concentrations during high-water periods (snowmelt and rainfall runoff) and a decrease during the summer and winter low-flow periods. Correlation analysis showed that the maximal correlation coefficients, R, between the observed and simulated concentrations at all monitoring points in the basin, averaged by three months (quarters), were obtained for copper in the second quarter (the spring flood period, R = 0.55), for zinc in the second and third quarters (R = 0.50 and R = 0.69, respectively), and for manganese in all quarters (R varies in the range from 0.68 (fourth quarter) to 0.85 in the first quarter).
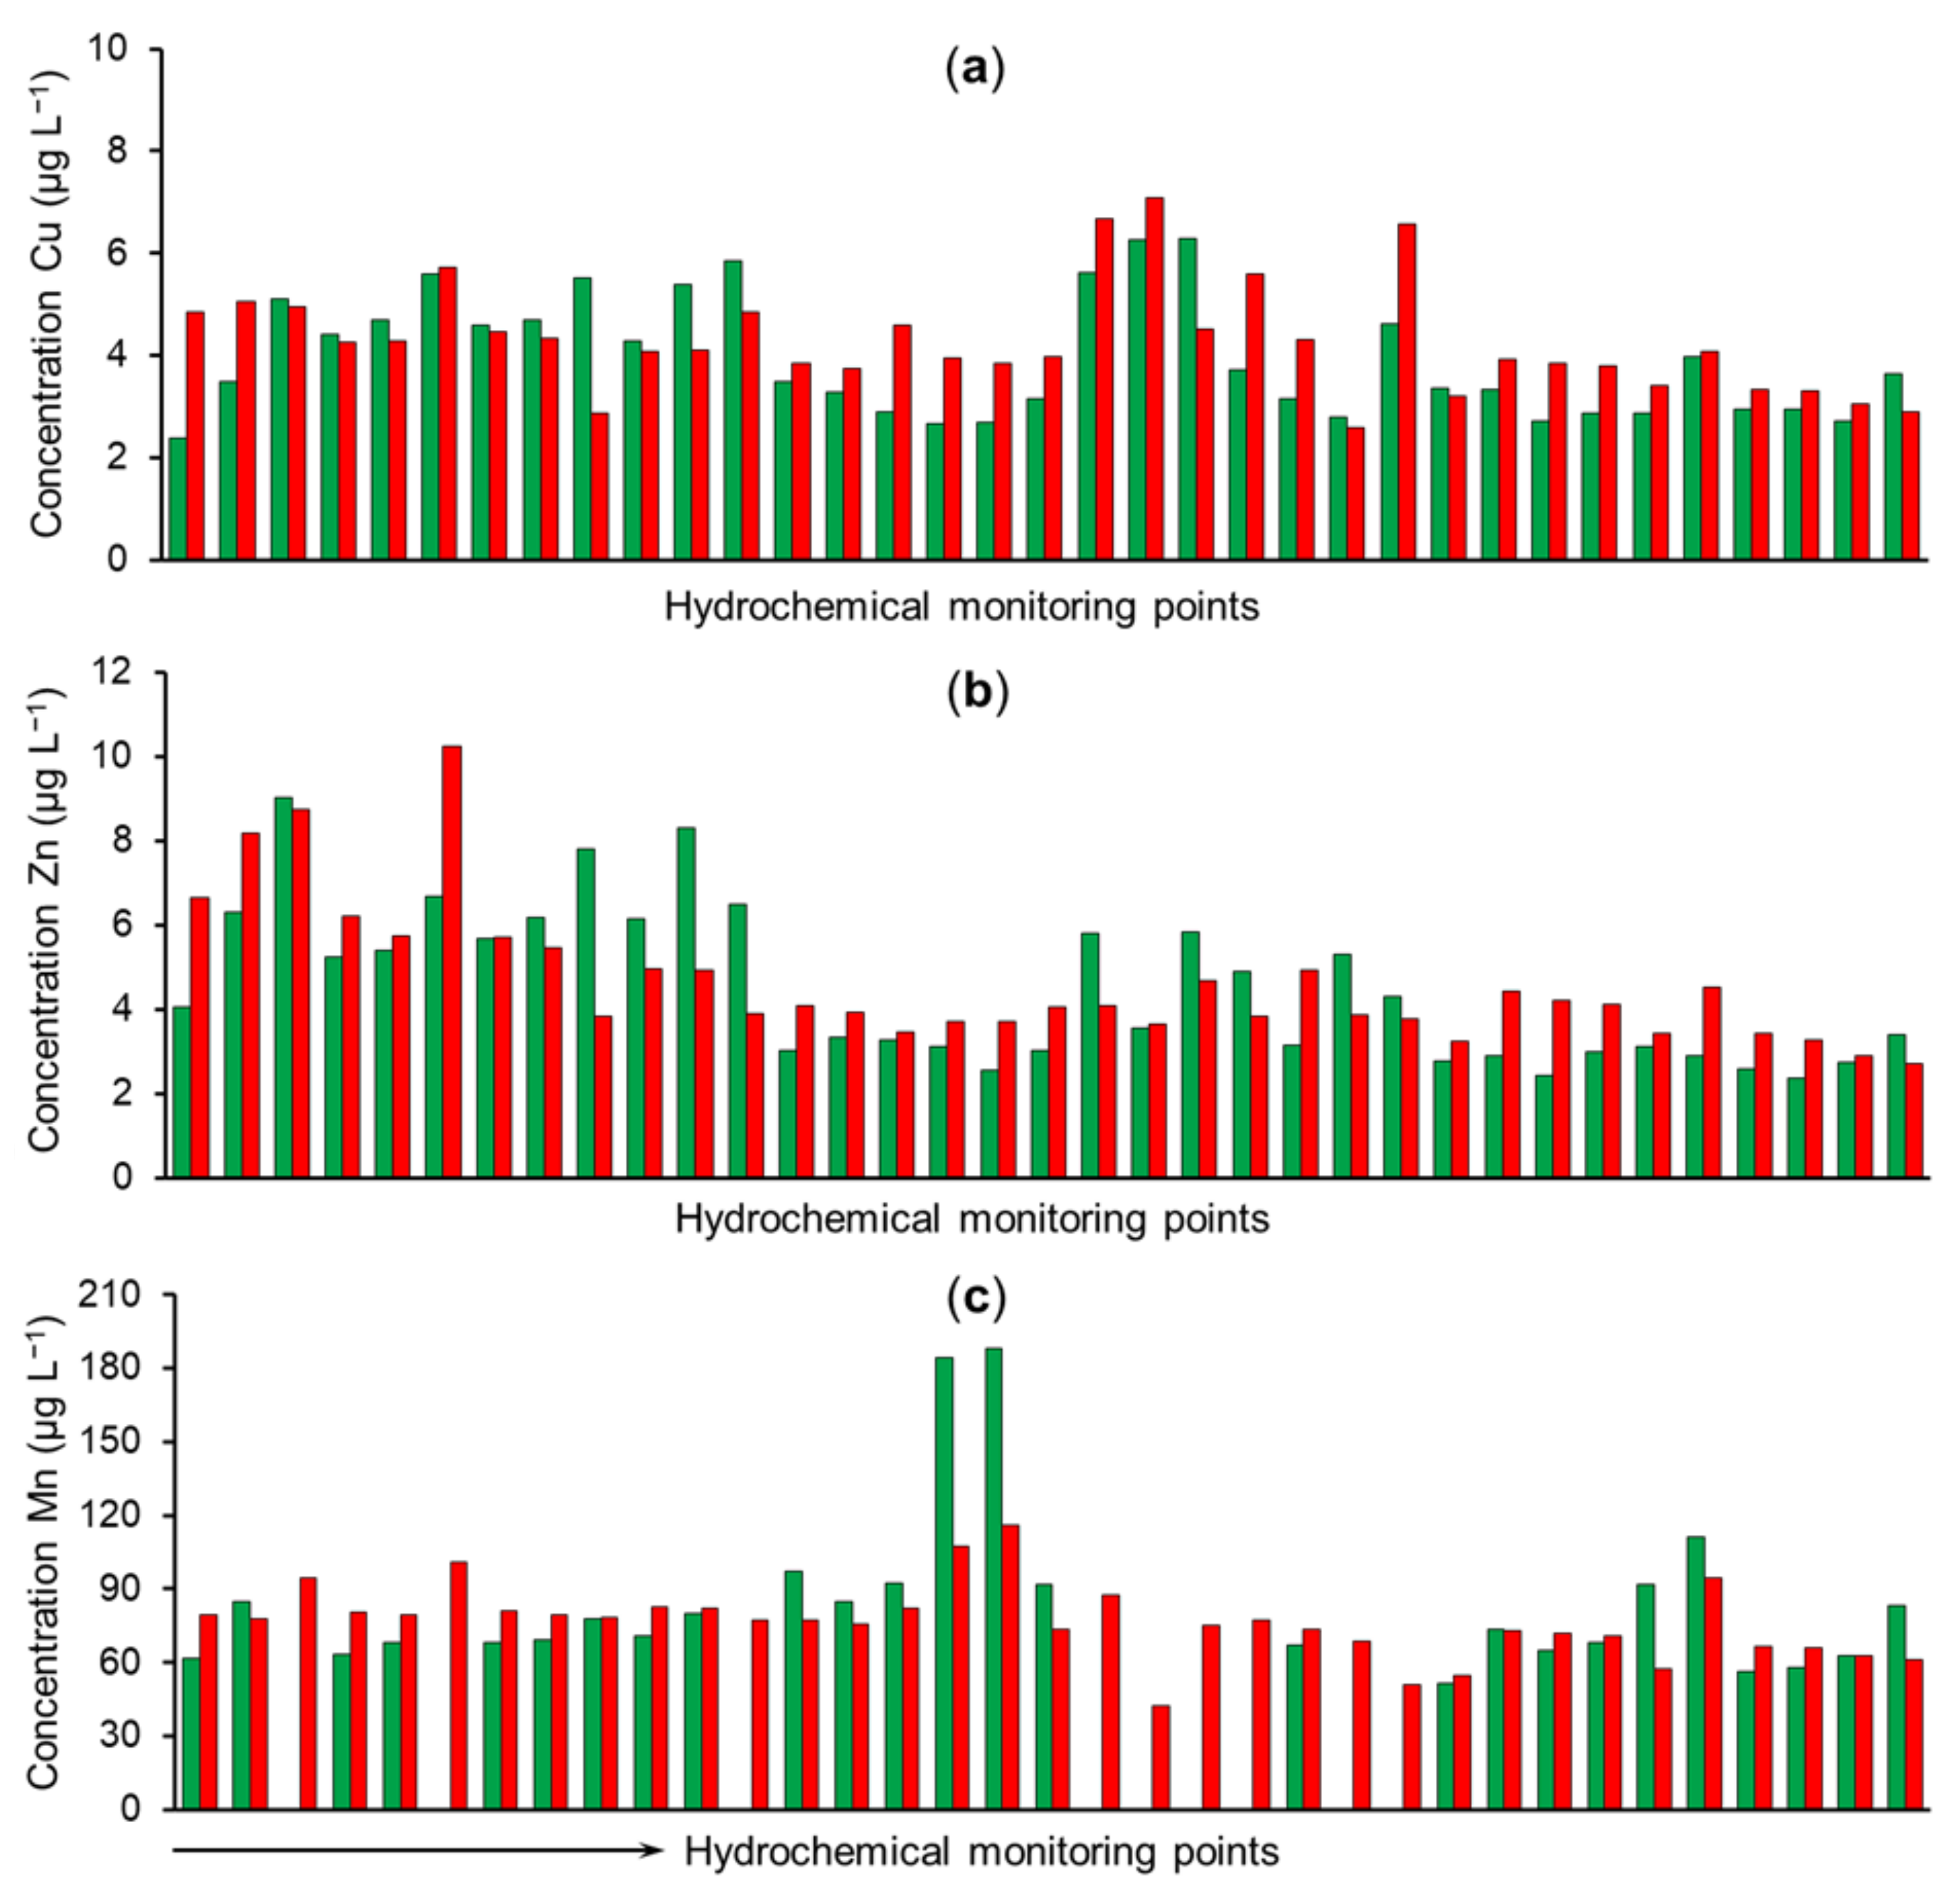
Spatial differences in the long-term mean annual HM concentrations in the Roshydromet hydrochemical monitoring points located in the order from the upper reaches of the Belaya River toward its inflow into the NKR differ significantly (Figure 5). Table 2 shows the correspondences between the observed and simulated HM concentrations and the range of changes in monitoring points. The correlation coefficients between simulated and measured concentrations are 0.58 for copper, 0.60 for zinc, and 0.80 for manganese.
Additional verification of the model was carried out by comparing the calculated and actual inflow of pollutants into the NKR. The model allows for calculating the balance of chemical components entering the river network and estimating the contribution of point (controlled wastewater discharges) and diffuse sources to river water pollution. As the information on point sources, yearly data on metal discharges with wastewater in 12 large localities were used. The actual inflow of metals from the catchment area to the NKR was estimated by multiplying the observed annual lateral inflow of water into the reservoir by the measured average annual concentration of metal at the last hydrochemical monitoring station on the Belaya River before its confluence with the NKR (Dyurtuli station) (Table 3).
Model balance calculations show that the total wash-off of metals in the rivers from the NKR catchment averaged over the period of simulation is formed by approximately 80–85% due to leaching from the soil-ground layer. Surface wash-off of metals into rivers usually does not exceed 20%. The share of HM entering the river network with wastewater discharges is small and amounts to ~1% of the total load of copper, ~4% of zinc, and 0.1% of the total load of manganese. A significant proportion of metals washed out from the catchment area accumulate with sediments in the river bottom: On average, ~46% copper, 62% zinc, and 30% manganese. These estimates are in good agreement with the results of HM retention in the Elbe River systems obtained using the METALPOL model [23]: For copper, on average, 51% with a range of variation from 35 to 60% for different tributaries; and for zinc, on average, 45% with a range of variation from 30 to 54%.
An example of the inter-annual dynamics of various sources of river water pollution and a comparison of the actual and simulated Mn load in the NKR is shown in Figure 6. The differences between the compared annual values can be largely explained by significant errors in determining the concentration of heavy metals in river water.
Inter-annual changes in the HM load in the river network and NKR are characterized by the increase in high-water years (2002, 2007), decrease in medium years (2003, 2005), and minimum values in low-water years (2004, 2006). Such inter-annual changes in the HM load occur when HMs enter the river network mainly from diffuse sources from the catchment area, which are affected by climatic factors. Thus, the results presented in this section indicate that, on the whole, the model adequately reproduces the main spatio-temporal patterns of HM runoff formation in the river basin and HM content in the river network.
3.1.2. Mapping of the Simulated HM Characteristics
Regularities of water quality formation in river basins are associated with the study of genetic components of river and chemical runoff; therefore, among the mapped characteristics, we will consider the HM concentrations in river waters and the HM wash-off with various genetic components of river runoff. The algorithm for determining spatial distributions of components of HM runoff based on the developed model was as follows. Daily fields of weather characteristics in the catchment area were constructed using data of meteorological stations, and the ECOMAG-HM model was applied to simulate runoff and HM removal in the local river network by surface, soil, and ground flow for all elementary watersheds. By averaging the daily fields over a multi-year period, maps of the mean annual specific HM load in the river network by various genetic components were obtained for cooper [32] and zinc [34].
The analysis of these maps demonstrates the spatial differences in the predominance of various genetic components in the formation of hydrochemical metal runoff in the NKR basin. Over most of the catchment area, the total HM load into the river network was formed mainly due to subsurface (soil and ground) runoff. The HM wash-off by surface water is almost an order of magnitude smaller, except for the western province of the basin, where the wash-off by surface runoff was comparable or slightly higher than the HM leaching by subsurface runoff.
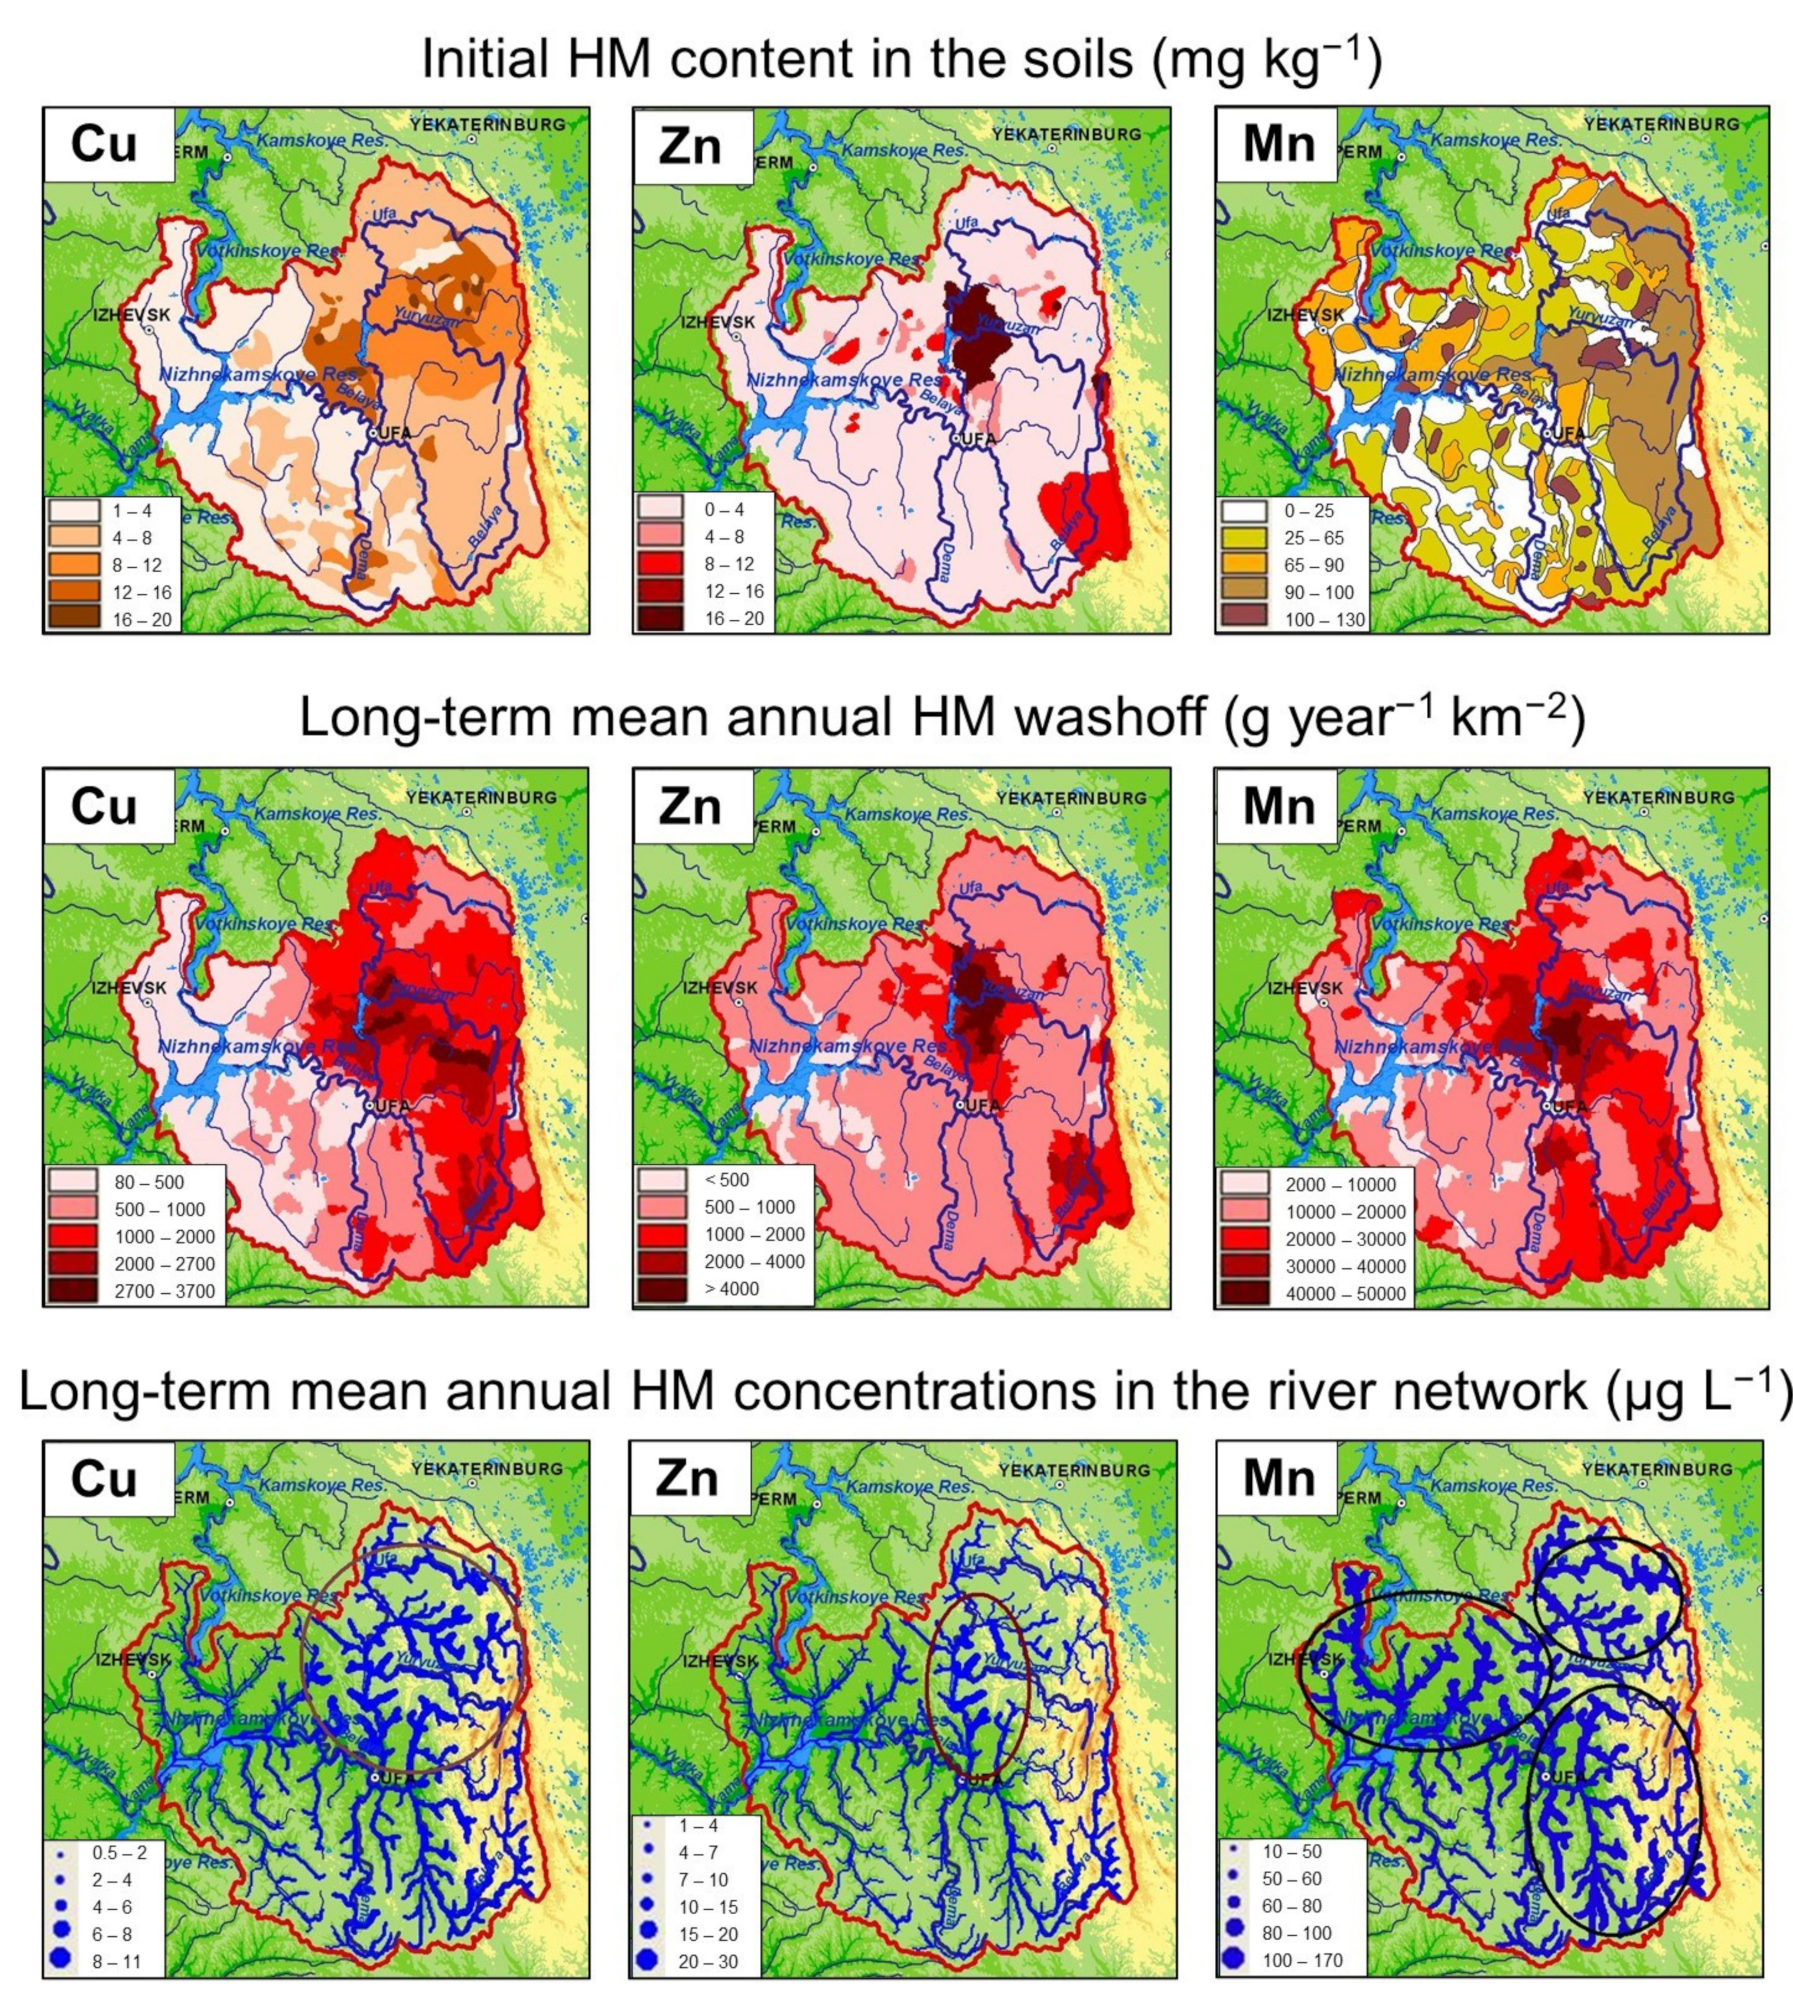
The map of the mean annual Cu, Zn, and Mn load in the river network shows the close correlation with the spatial distribution of the initial HM content in soils (Figure 7) due to the predominance of HM leaching from the underground zone in the water quality formation.
In turn, the spatial distribution of HM load affects the distribution of HM concentrations in the river network. A map of the simulated mean annual HM concentrations in river water was created (Figure 7) to analyze the spatial distribution of HM content in the NKR drainage basin, including the rivers not covered by hydrochemical observations. This map was obtained by averaging the simulated daily HM concentrations in the elements of the modelled river network over the period of simulation. The line thickness indicates the HM concentration in the river network in accordance with the legend.
As can be seen from Figure 7, small rivers that mainly flow near foci with a high content of HM in soils have higher levels of HM pollution. These areas with increased river pollution are delineated with shafts. Figure 7 clearly shows that a narrow area of increased concentrations of zinc in rivers is formed near the focus of increased zinc content in the soil in the area of the Ufa River catchment. The area with a high copper content in the rivers is noticeably larger and mainly covers the north-eastern part of the NKR basin. The distribution of the increased content of manganese in the soil in the catchment area is spotty; therefore, foci of increased concentrations of manganese in the river water are found everywhere, with the exception of the southwestern part of the basin. The maximum mean annual HM concentrations in these streams exceed the similar average for the other part of the NKR basin by 2–6 times and reach 11 μg·L−1 for copper, 29 μg·L−1 for zinc, and 166 μg·L−1 for manganese. When small, polluted tributaries flow into larger rivers, HM concentrations in river waters decrease as a result of dilution by cleaner water in larger watercourses. A similar effect was obtained in the results of simulating HM concentrations in river waters near polluted areas in the Liuyang River basin in China impacted by mining activities using the SWAT-HM model [31]. As already noted, hydrochemical monitoring points are usually located on large and medium-sized rivers in the immediate vicinity of large settlements and industrial enterprises, so the existing monitoring network does not cover small rivers that are most susceptible to diffuse pollution.
The analysis of simulated results shows that the water quality in the river monitoring points does not meet the MAC standards for fishing use regarding copper (by 2–7 times) and manganese (by 4–19 times). The entire range of changes in zinc concentrations is within the MAC standard. The water quality regarding copper and zinc in all monitoring points is suitable for drinking use. The content of manganese in river water exceeds the MAC standards for drinking use only at several points in some seasons of the year.
3.2. Modeling the Impact of Economic Activity on River Water Pollution
3.2.1. Change in the Amount of Metals Discharged in Wastewater
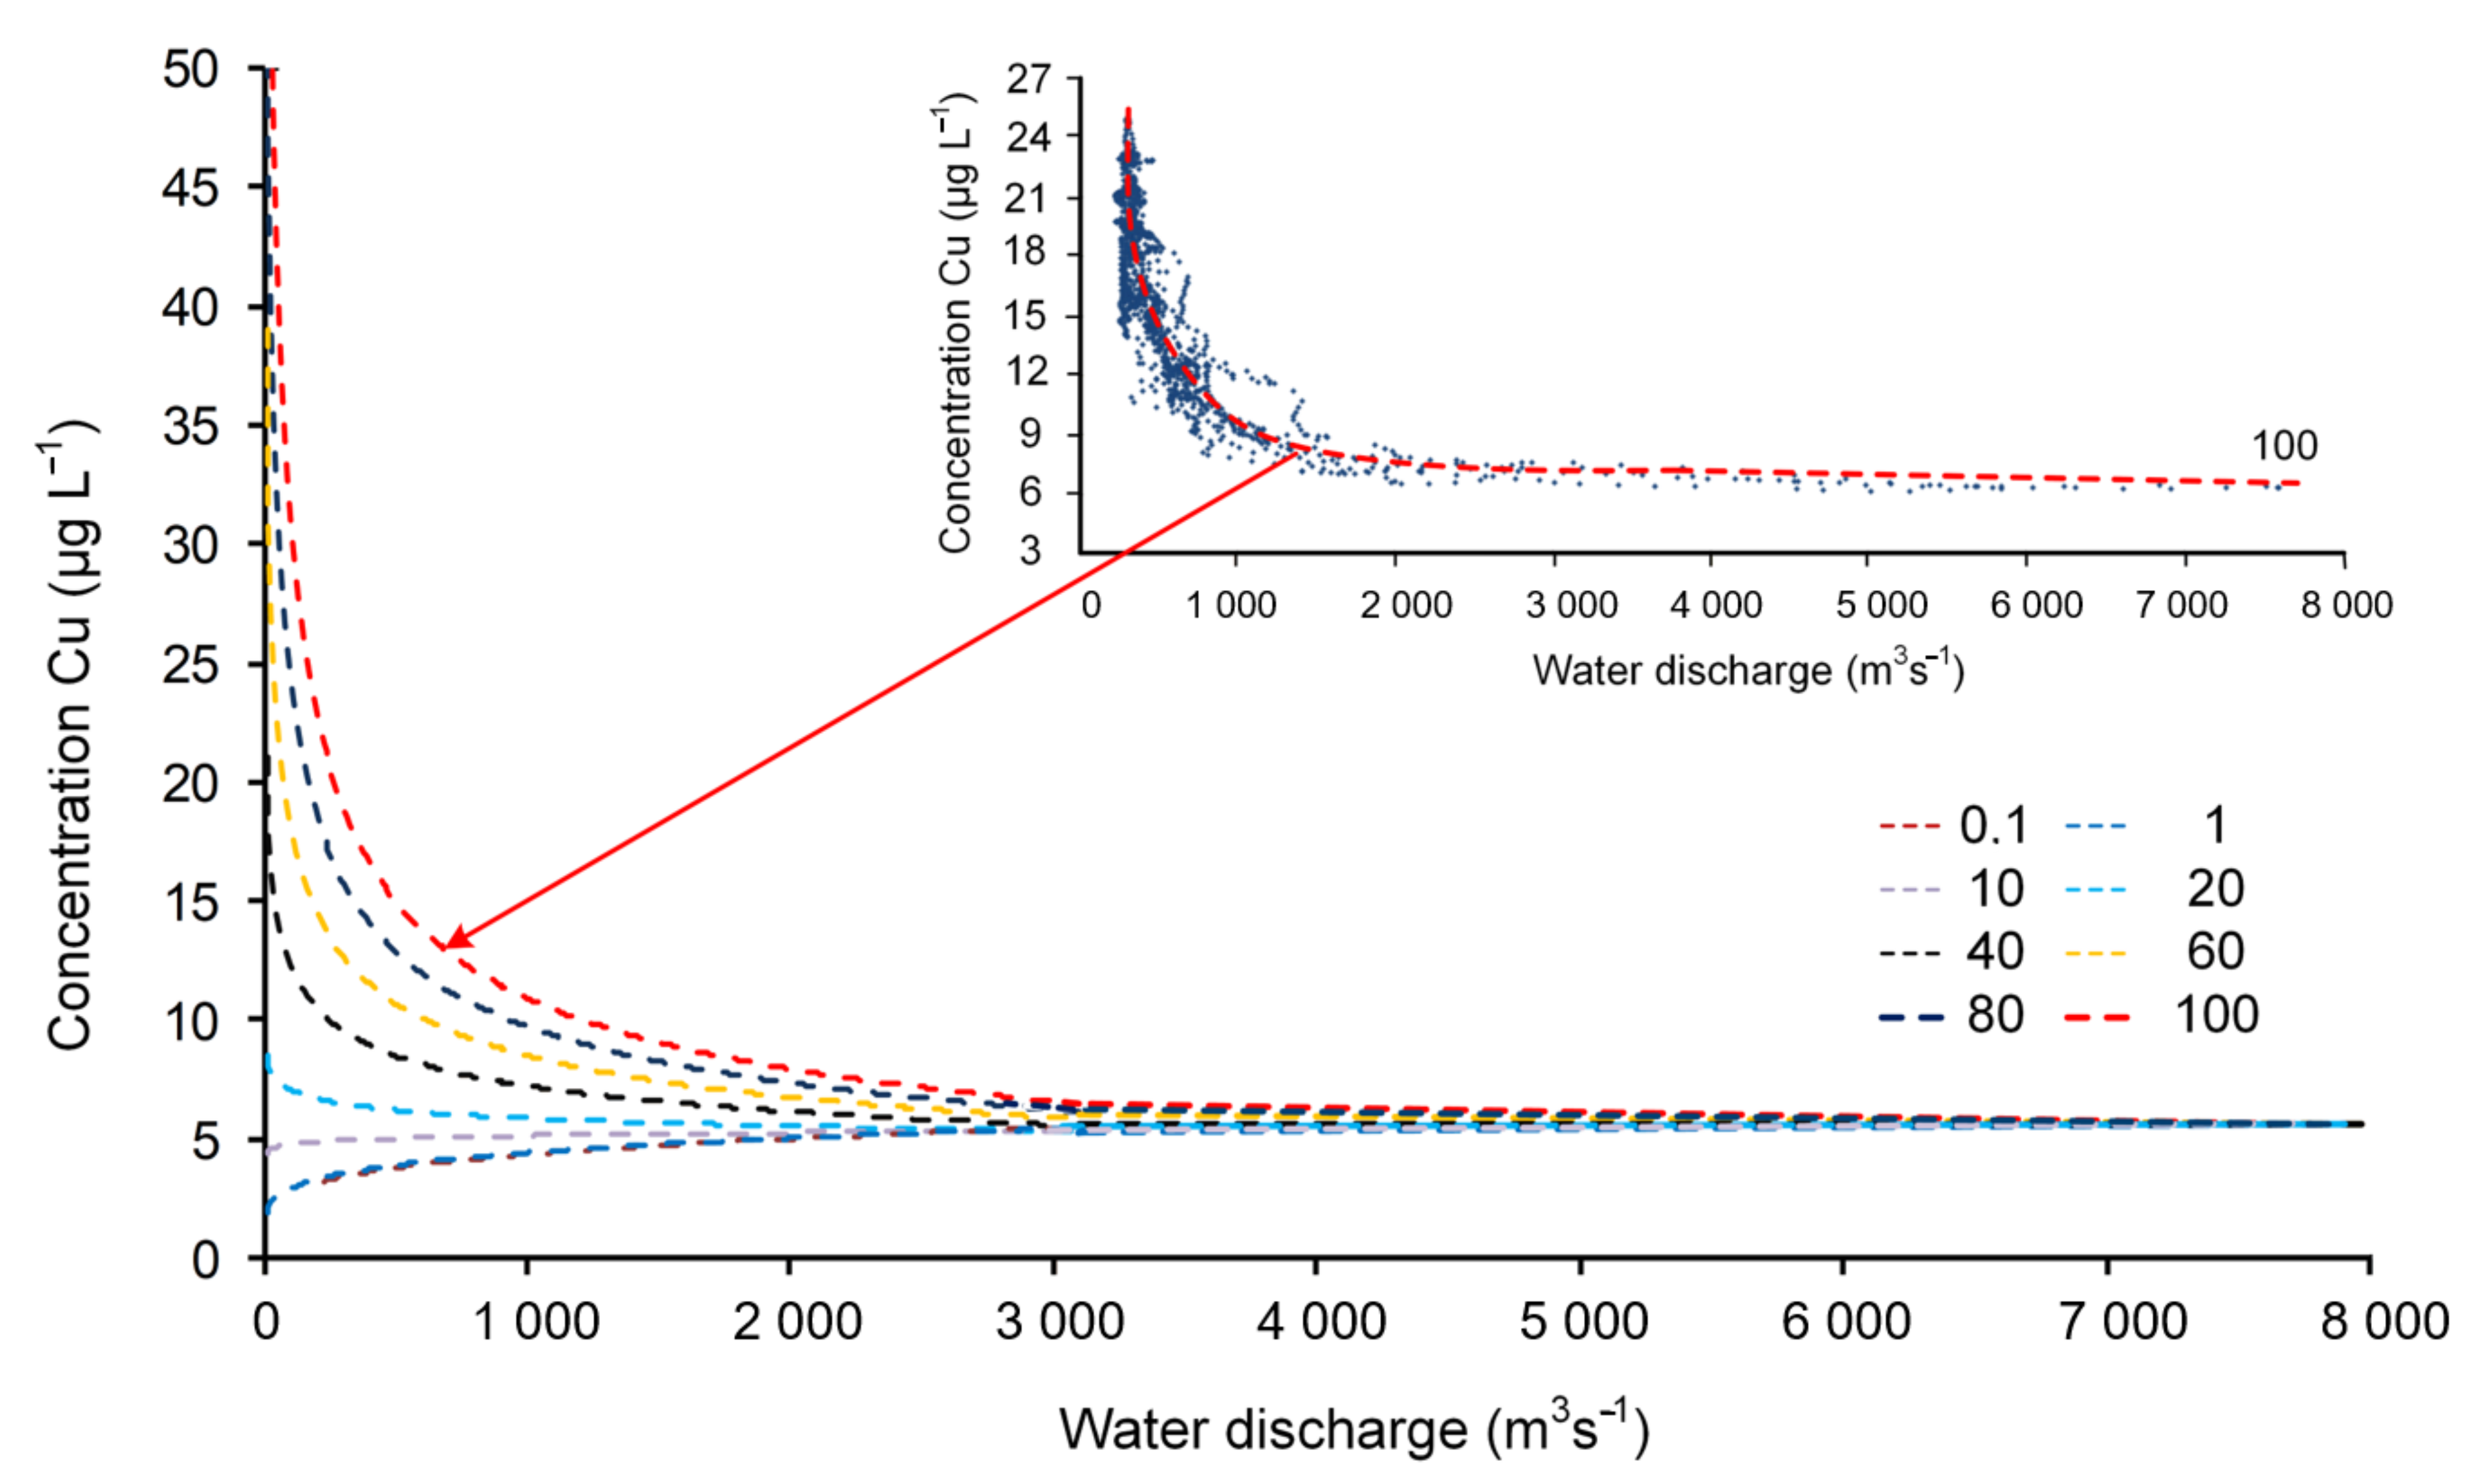
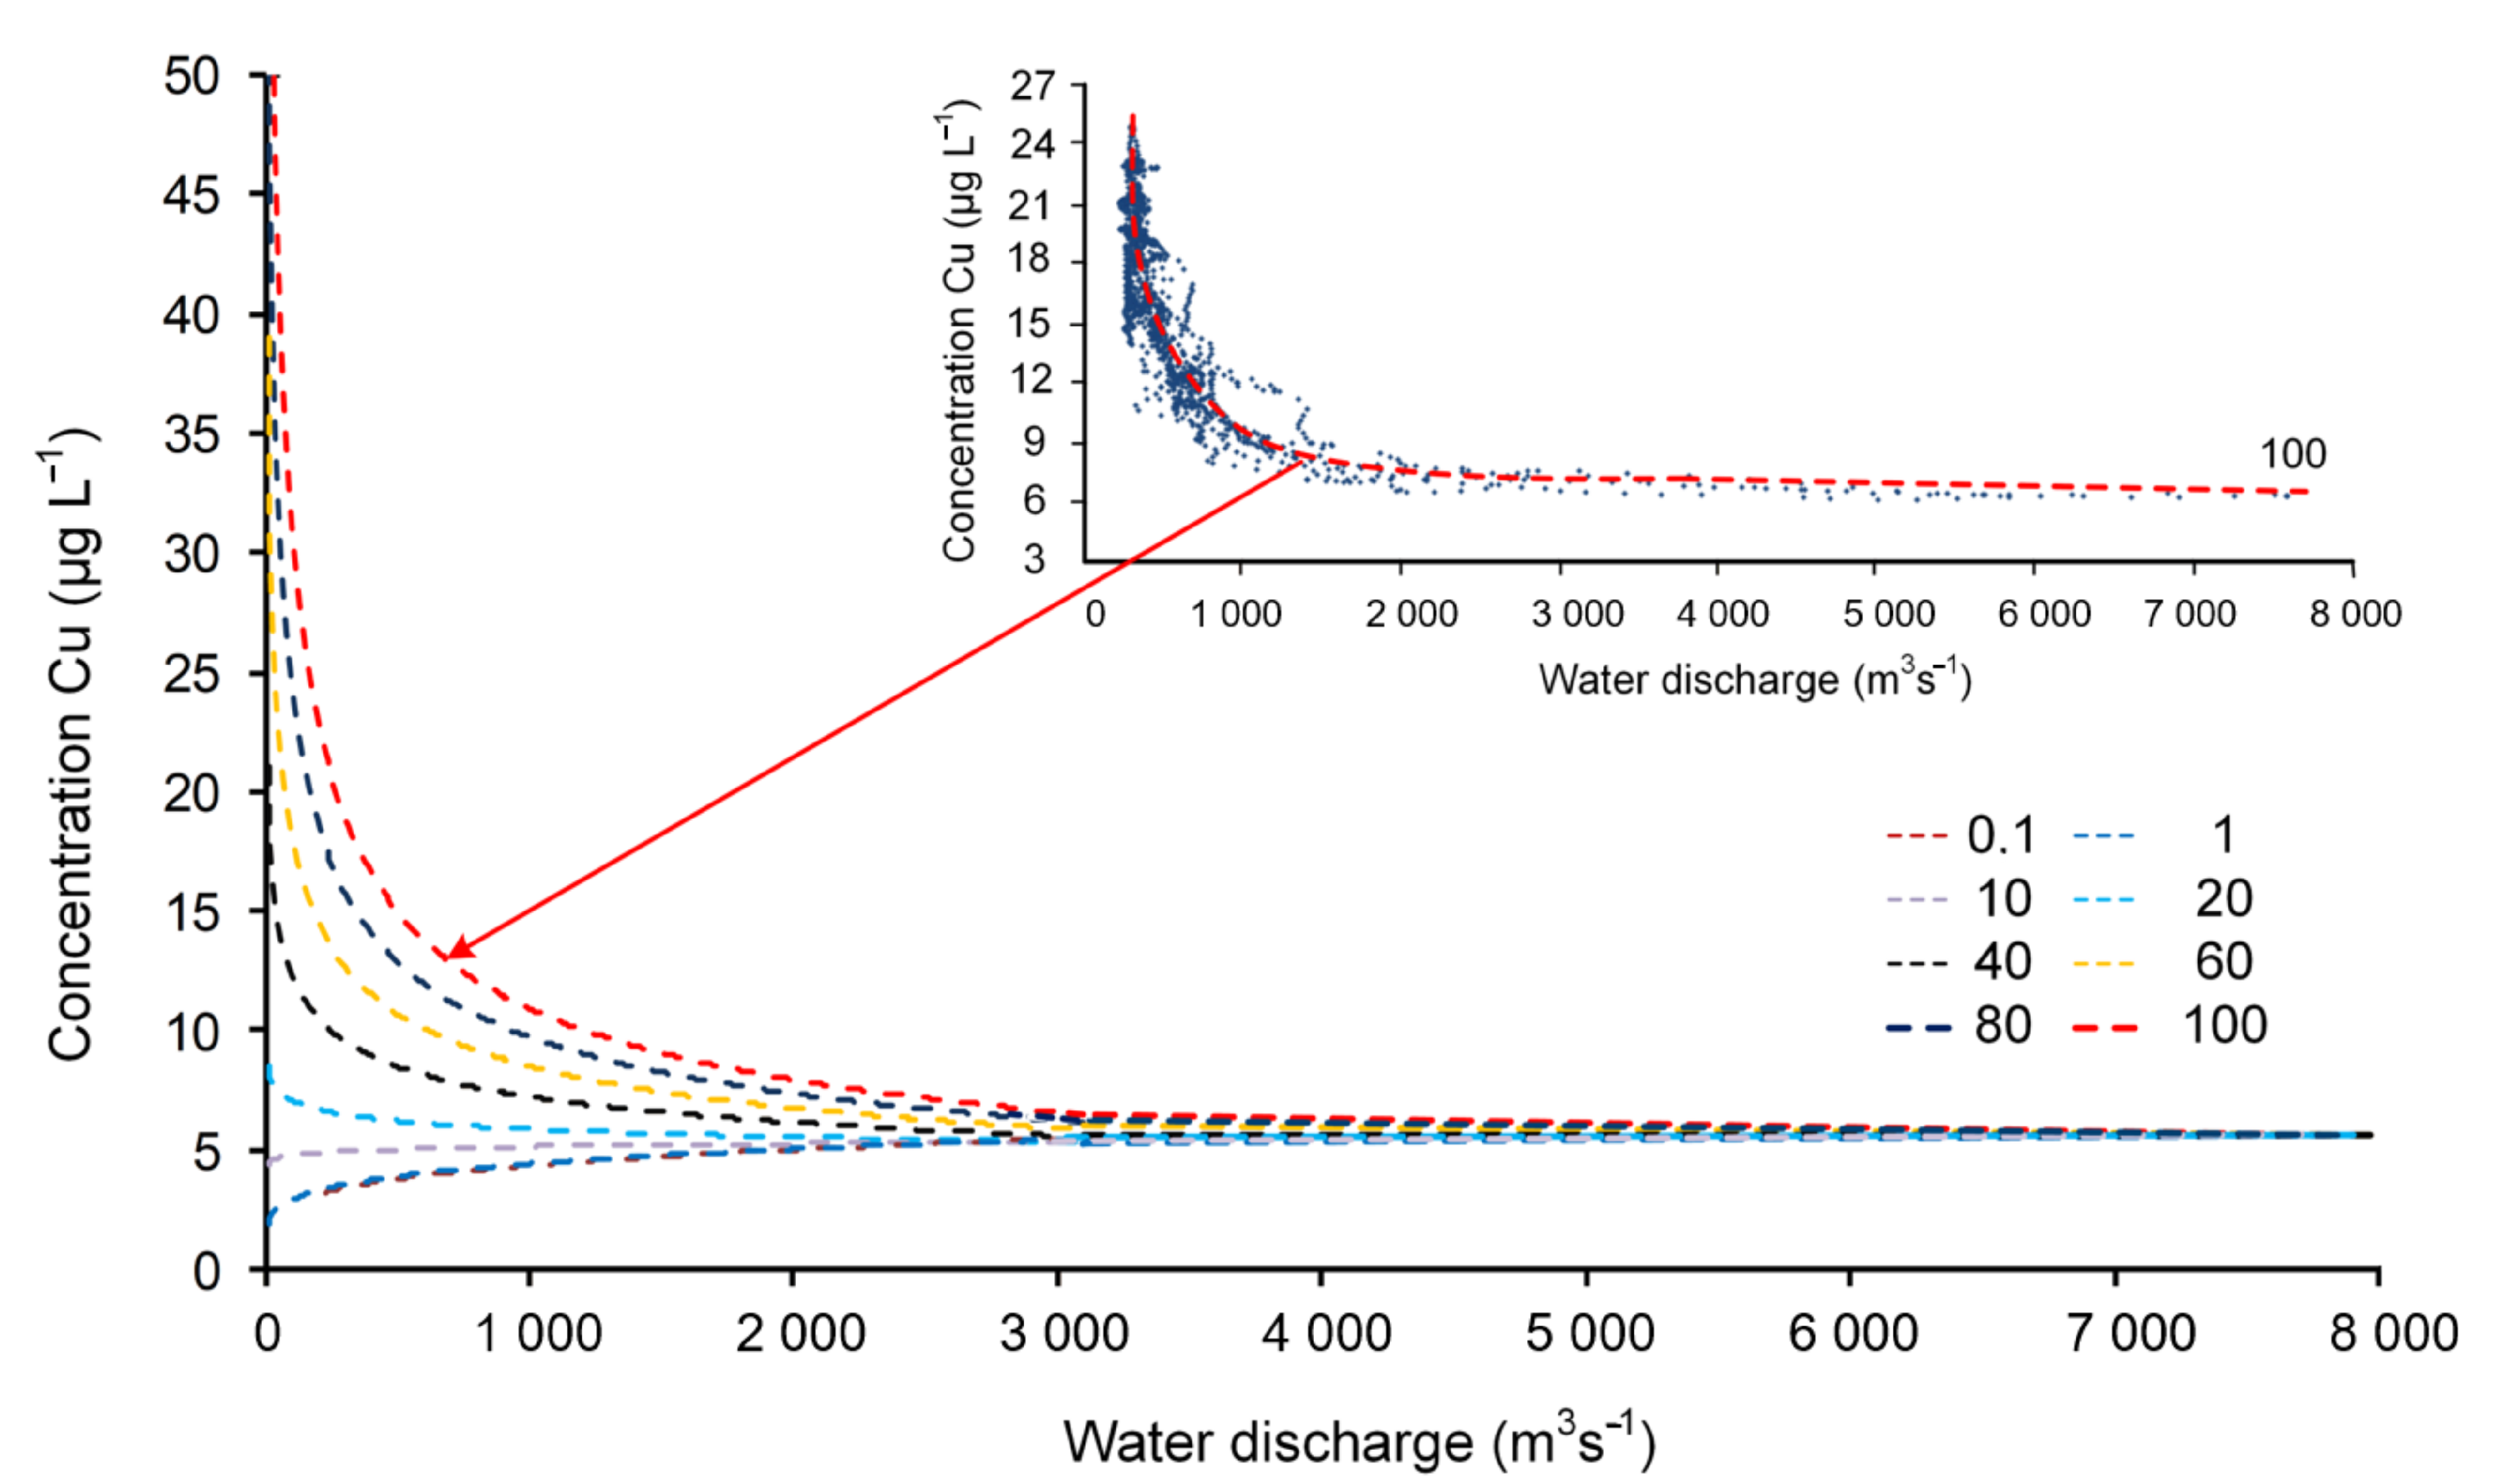
Intra-annual distribution. Figure 8 shows the simulated dynamics of the copper content in the Belaya River at Ufa city with actual wastewater discharges, as well as with the 60-times increase in copper content in wastewater. At the current level of the copper content in wastewater, its maximum concentration in the river water is simulated during high water periods (snowmelt and rainfall runoff) as a result of the metal load, mainly from diffuse sources. When the multiplicity of the increase in the content of metals in wastewater relative to the existing level exceeds a certain critical value, the following pattern occurs: During periods of high water, the lowest concentrations of metals begin to be observed in contrast to the original case (Figure 8). This occurs as a result of diluting highly polluted industrial wastewater in rivers with significantly less polluted snow and rainwater. Nomograms can be constructed for hydrochemical monitoring stations, showing the “critical” levels of anthropogenic load (the multiplicity of increase in metals discharged from wastewater relative to the existing level), at which such changes occur based on the results of numerical experiments. In particular, in the example shown in Figure 9, the relationship between the river discharges and maximal concentrations of copper in the Belaya River at Ufa city is reversed, when the discharge of copper into the river increases by 20 or more times.
Numerical experiments have shown (Figure 9) that with an increase in discharge of the Belaya River near the city of Ufa over 3500 m3·s−1, copper concentrations in river water asymptotically approach the value of ~6 µg·L−1 under various scenarios of wastewater loads. In other words, the contribution of point sources of pollution due to dilution is minimized during periods of high water, and the concentration of metals in river water is mainly determined by the maximum exchange capacity of the catchment leaching of HM from the watershed by surface and subsurface flow during intensive snowmelt or rainfall that forms the maximum runoff. This constant concentration can be named the equilibrium concentration of diffuse saturation of the river basin for this type of HM.
Mean annual characteristics. With an increase in the HM content in wastewater, the contribution of point sources to the river’s pollution in the NKR basin increases (Figure 10a). Thus, with a 20-fold increase in HM content in wastewater, the mean annual contribution of point sources to river water pollution is ~20% for copper, 44% for zinc, and 2% for manganese. A 100-fold increase in HM load increases the contribution of point sources to river pollution to ~53%, 80%, and 8%. An increase in the content of HM in wastewater also leads to an increase in their inflow by river water to the reservoir (Figure 10b). Thus, a 100-fold increase in metals causes an increase in the inflow into the NKR of copper by ~2 times, zinc by ~4 times, and manganese by 1.1 times.
3.2.2. Simulation of a Disaster with a Salvo Discharge of Pollutants
Figure 11 shows simulated changes in the maximum concentration of copper along the length of the river under various scenarios of copper salvo discharge (5000, 4000, 3000, 2000, 1000, 500, and 100 kg·day−1) into the Belaya River near Salavat city. As the contamination spot is removed from the site of the salvo discharge, the concentration of copper decreases intensively due to the dilution by the tributaries that flow into the Belaya River, and copper deposits on the river bottom along with sediments. As early as passing Ufa city (~300 km from the accident site), the maximum concentrations of copper are reduced by about two orders of magnitude.
3.2.3. Simulation of Self-Cleaning of the NKR Watershed under Exclusion of Anthropogenic Impact on the Catchment
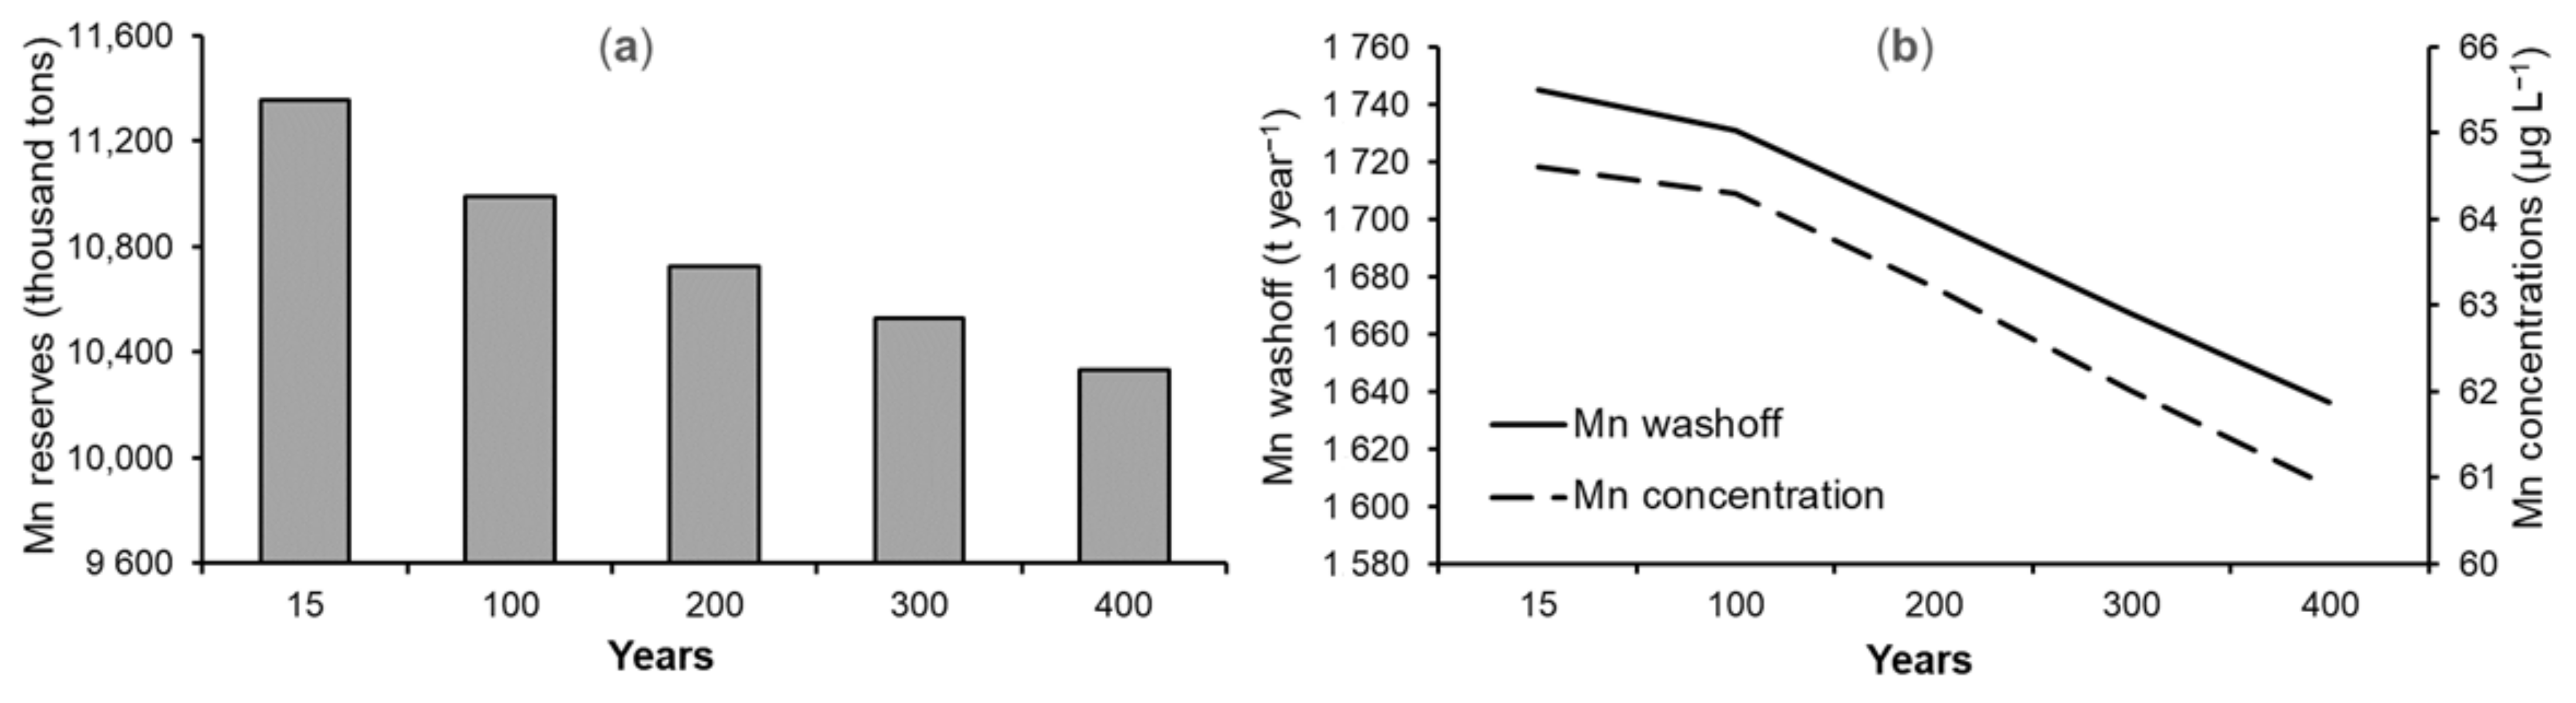
The estimation of time scales of the catchment’s self-purification from HM according to scenario 3 was carried out by simulating the dynamics of HM reserves with the complete exclusion of any anthropogenic impact on the basin over a 400-year period. Based on the maps of metal content in the soil [41], it was determined that in the NKR catchment, the initial reserves of copper are ~1000, zinc ~550, and manganese ~11,350 thousand tons (Figure 12a). The annual flow of copper, averaged over a 33-years period, from the catchment to the river network at the beginning of the calculation period was 147, zinc ~156, and manganese ~1745 t·year−1 (Figure 12b). After 200 years, calculations showed a decrease in the removal of copper, zinc, and manganese from the catchment area, respectively, to 140, 147, and 1700 t·year−1. After 400 years, the average annual removal of metals from the river network continued to decline, and amounted to 135, 140 t, and 1640 t year−1, respectively. Thus, in the absence of external impacts, the catchment area was slowly cleared and the content of copper in soils decreased to ~950, zinc to ~500, and manganese to ~ (Figure 12a) thousand tons. As a result of the reduction of metals reserves in the catchment area, their content in the river water decreased. Calculations have shown that over a 400-year period, due to the self-cleaning of the NKR basin, the average annual concentrations of copper, zinc, and manganese in river water decreased slightly by 6–8%.
3.3. Sensitivity of the Water and Chemical Runoff to Climatic Changes
Modeling the water and chemical runoff for the future period, up to 2050, was carried out using a DC climatic scenario, assuming changes in the climate parameters to be the same as the previous observation periods (increments of the daily air temperature of 1 °C and daily precipitation of 10%). Table 4 presents the results of numerical experiments for the simulation of river runoff characteristics under both historical data series and the DC scenario for the 2002–2007 period.
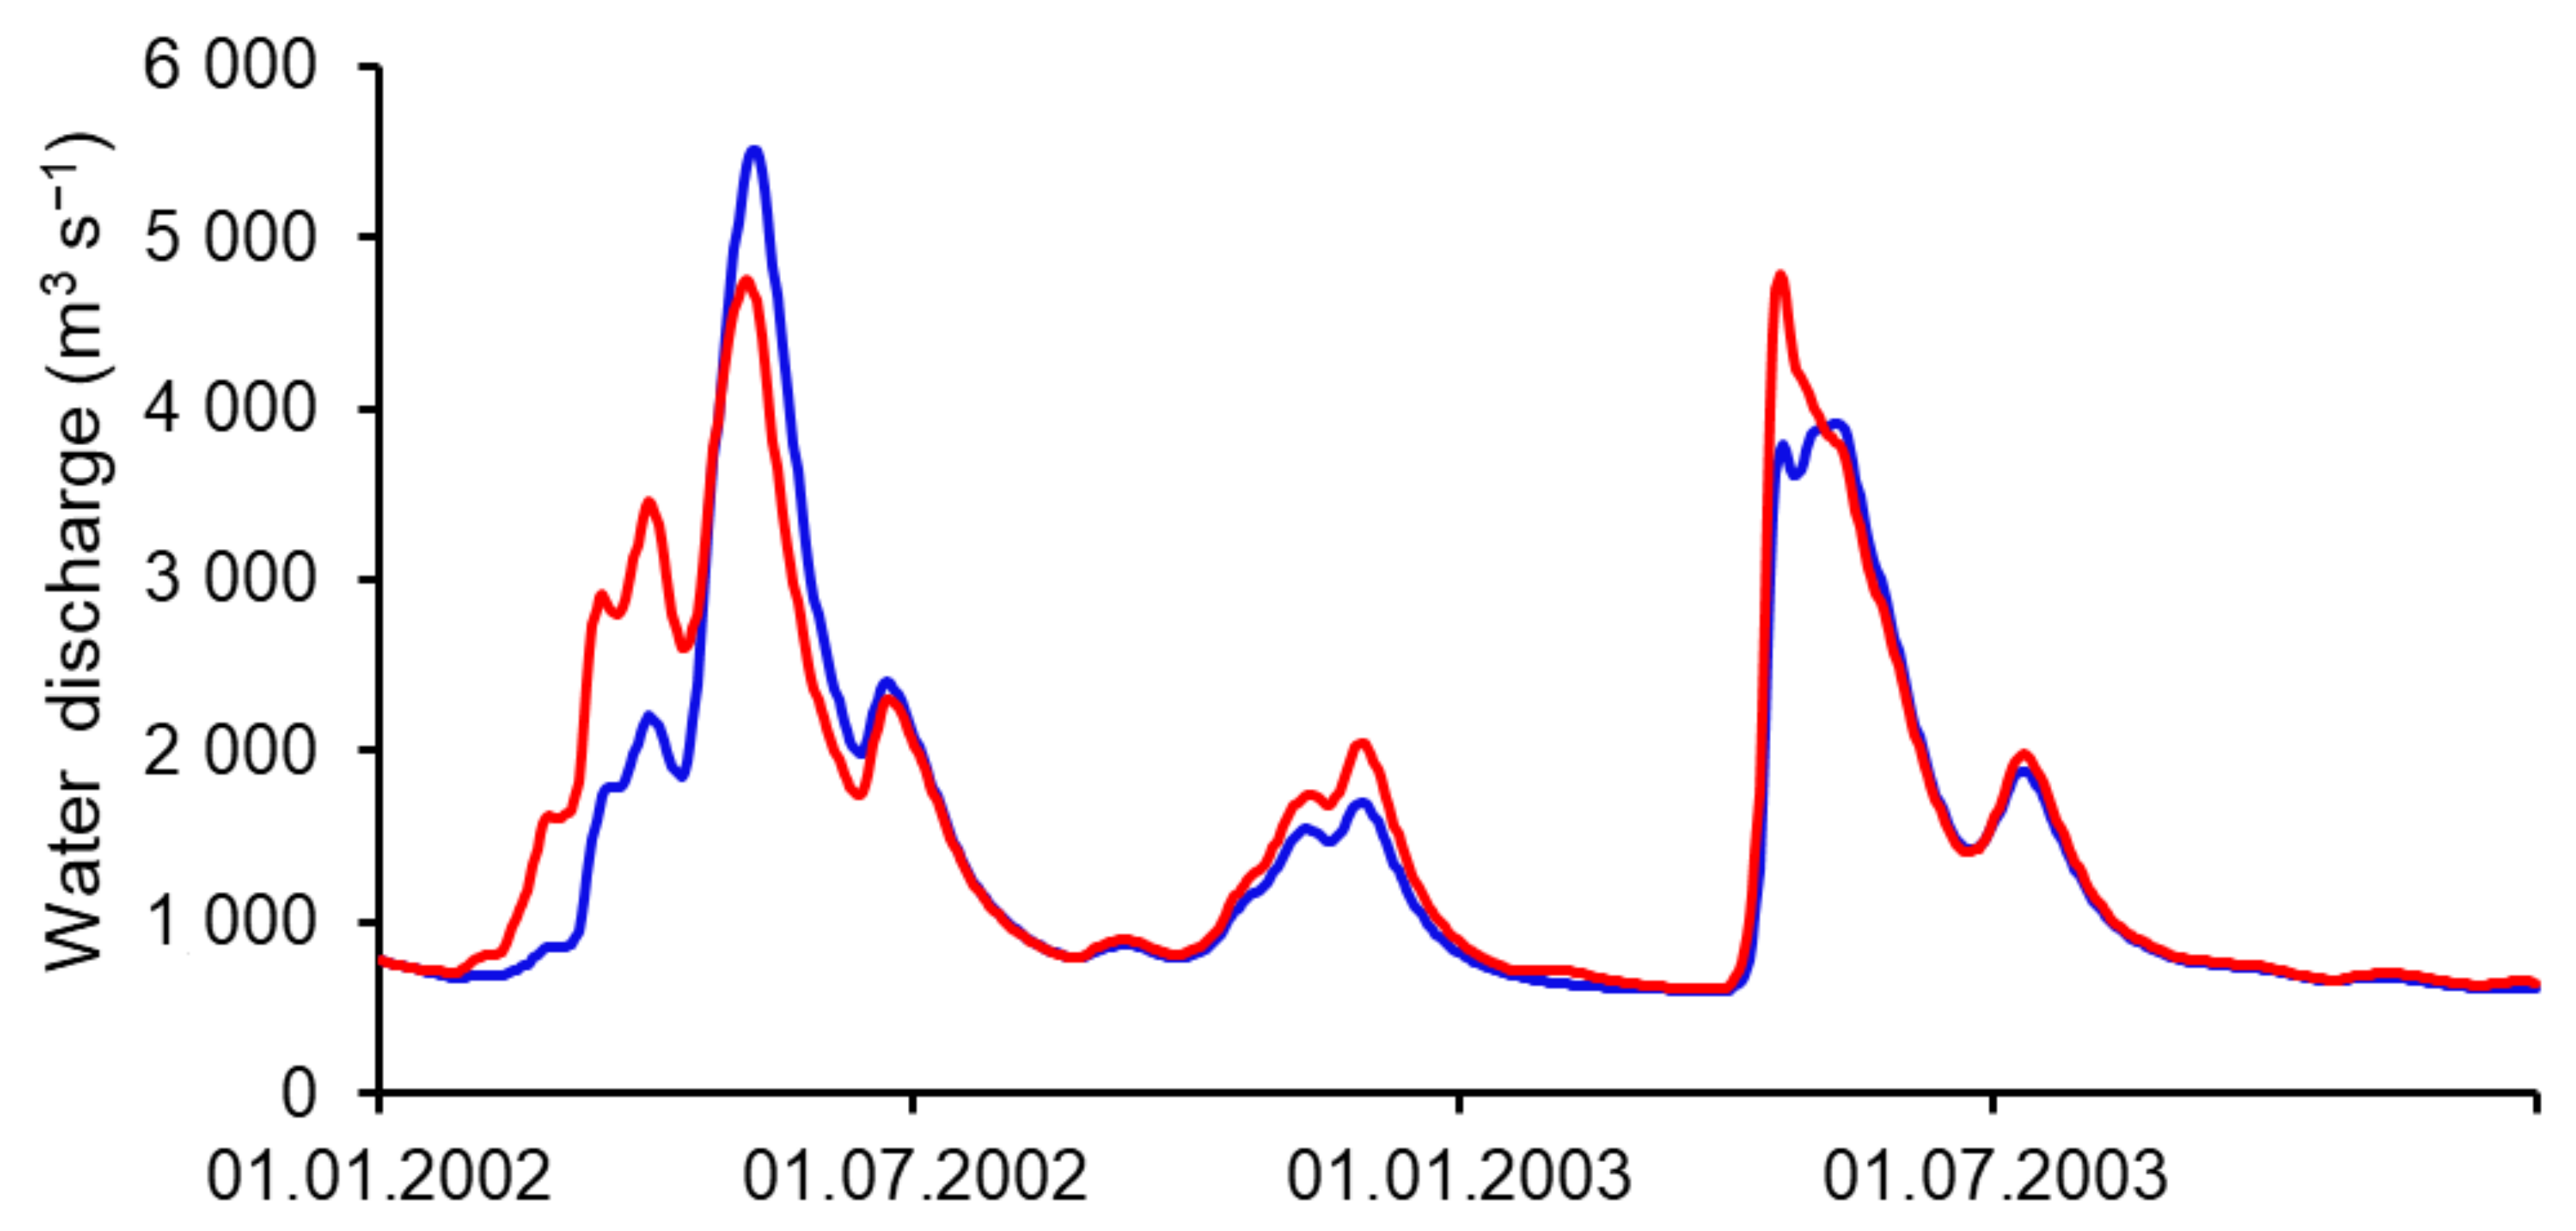
The mean annual inflow into the NKR under the DC scenario increased by 7% with a range from 4 to 12% in different years compared to the runoff simulated under historical meteorological data. Increments of the maximal discharges of the spring runoff in different years are multidirectional and vary from −14 to 22%. Both increments of runoff and changes in maximal discharges are not related to the amount of annual runoff. They are determined by the conditions of runoff formation during spring in specific years, and in particular, by the factor of “friendly” spring. Let us analyze this in more detail on the example of flow hydrographs for 2002–2003 (Figure 13).
The winter and pre-spring period of 2002 was characterized by an unstable temperature regime with frequent thaws. The increase of 1 °C in the DC scenario caused earlier snowmelt and the formation of a much larger first wave of spring runoff than those simulated from historical meteorological data. The maximum discharge in the second wave of spring runoff decreased by 14% due to the fact that a significant part of the snow water equivalent was consumed during the first wave of spring runoff.
The winter and pre-spring season of 2003 was much more severe in terms of temperature conditions than in 2002. Therefore, the increase in temperature by 1 °C did not cause earlier snow melting. The increased maximal snow water equivalent due to both the addition of precipitation in the winter season and more intense snowmelt in the spring under the DC scenario caused a 22% increase in maximal discharge of spring runoff, with the peak 18 days earlier than under the historical scenario.
It is more difficult to generalize the patterns of the influence of climate change on the characteristics of water quality. On the whole, the mean annual Mn concentrations in the last downstream hydrochemical station on the Belaya River (Durtuli gauge) averaged over 7 years in the DC scenario increased by 5% compared to those modeled based on historical meteorological data (Table 5).
The changes in annual Mn loads into the NKR in different years are proportional to increments in the mean annual runoff multiplied by the changes in annual concentrations at the last monitoring gauge on the Belaya River. The maximum Mn concentrations averaged over a 7-year period decreased slightly by 2%, and the range of changes in different years vary from 4 to −10%.
Let us compare these values with assessments of the climate change impact on the quantity and quality of water in the Elbe River basin performed using the process-oriented SWIM model [21]. Using climate change scenarios close to the one we employed, river runoff will increase by an average of 11% by the middle of the century. The predicted changes in the concentrations of nitrogen and phosphorus nutrients show multidirectional changes. Uncertainties and high spatial variability of characteristics within the basin may be associated with the schematization of the Elbe basin into a number of separate tributary catchments and with the need to calibrate the model parameters for each of these sub-catchments. In the ECOMAG-HM model, the whole basin and spatial variability of characteristics are simulated with a single set of model parameters.
4. Conclusions
The semi-distributed, physically based ECOMAG-HM model developed for modeling the hydrochemical cycle of heavy metals at the catchment scale was calibrated and verified for the large watershed of the Nizhnekamskoe reservoir according to hydrometeorological, hydrochemical, and water management monitoring data. The model was performed by comparing the observed and simulated river runoff hydrographs and behavior of HM (Cu, Zn, and Mn) concentrations in monitoring points on rivers of the NKR basin. Comparing results showed that seasonal changes in the metal content are characterized by increased concentrations during the high-water period (snowmelt and rainfall runoff). Inter-annual changes in the observed and simulated HM load into the river network and NKR are characterized by its increase in high-water years and minimum values in low-water years. Such seasonal and inter-annual changes in the HM load occur when HMs mainly enter the river network from diffuse sources of pollution on the catchment area caused by climatic factors. Model balance calculations have shown that the mean annual wash-off of metals into the rivers from the NKR catchment is approximately 80–85% attributed to leaching from the soil-ground layer, and the surface wash-off of metals usually does not exceed 20%. The contribution of HMs entering the river network with wastewater discharges is small and does not exceed 4%. A significant part (from 30 to 62%) of metals washed into rivers accumulate with sediments at the river bottom.
The simulated map of the total HM wash-off into the river network closely correlates with the spatial distribution of the initial content of HM in soils due to the predominance of HM leaching from the soil-ground zone in the diffuse sources of river pollution. The initial HM content in soils affects the distribution of HM concentrations in the river network to a large degree. As a result, the most polluted small rivers flow near areas with a high content of HM in the soils. This leads to the important consequences: Without maps of the initial content of heavy metals in soils, it is impossible to simulate spatial differences in water pollution in the river network.
Numerical experiments have shown that with an increase in discharge of the Belaya River more than a certain critical value, the contribution of point sources of pollution is minimized, and the concentration of metals in river water is mainly determined by the maximum exchange capacity of the catchment leaching HM from the watershed by surface and subsurface flows during intensive snowmelt or rainfall that forms the maximum flow; for the city of Ufa, the critical discharge is about 3500 m3·s−1, above which the copper concentrations in river water asymptotically approach the value of ~6 µg·L−1 under various scenarios of wastewater loads. This constant concentration can be called the equilibrium concentration of diffuse saturation of the river basin for this type of HM.
The simulation of time scales of the catchment’s self-purification from HMs under the scenario with complete exclusion of anthropogenic impacts on the basin has shown that over a 400-year period, the mean annual HM concentrations in the river water decreased by 6–8%. The low rate of reduction of heavy metal concentrations allows us to recommend their current annual values as background values in the NKR basin.
Modeling the river runoff for the future period up to 2050 under a DC climatic scenario showed that the mean annual inflow into the NKR increases by 7% with a range from 4 to 12% in different years. No significant changes in the characteristics of water quality for heavy metals should be expected in the near future. For example, averaged over 7 years, the mean annual Mn concentration increased by 5%, the maximum Mn concentration decreased slightly by 2%, and the annual Mn load into the NKR increased by about 10% compared to those modeled based on historical meteorological data.
The presented results show that the ECOMAG-HM model can be used as an information support tool for assessing water quality characteristics under possible climatic and anthropogenic changes in scientific and applied projects.
Author Contributions
Methodology, writing—review and editing, supervision, funding acquisition, Y.M.; data curation, formal analysis, visualization, project administration, T.F.; conceptualization, validation, investigation, resources, writing—original draft preparation, Y.M. and T.F. All authors have read and agreed to the published version of the manuscript.
Funding
This study was carried out under the Governmental Order to the Water Problems Institute, Russian Academy of Sciences, subject no. 0147-2019-0001.
Institutional Review Board Statement
Not applicable.
Informed Consent Statement
Not applicable.
Data Availability Statement
Not applicable.
Conflicts of Interest
The authors declare no conflict of interest.
References
- Maistrenko, V.N.; Khamitov, R.Z.; Budnikov, G.K. Ecological-Analytical Monitoring of Superecotoxicants; Khimiya: Moscow, Russia, 1996; 319p. (In Russian) [Google Scholar]
- Kumar, A.; Pinto, M.C.; Candeias, C.; Dinis, P.A. Baseline maps of potentially toxic elements in the soils of Garhwal Himalayas, India: Assessment of their eco-environmental and human health risks. Land Degrad. Dev. 2021, 32, 3856–3869. [Google Scholar] [CrossRef]
- Moiseenko, T.I.; Morgunov, B.A.; Gashkina, N.A.; Megorskiy, V.V.; Pesiakova, A.A. Ecosystem and human health assessment in relation to aquatic environment pollution by heavy metals: Case study of the Murmansk region, northwest of the Kola Peninsula, Russia. Environ. Res. Lett. 2018, 13, 065005. [Google Scholar] [CrossRef]
- Federal Service for Hydrometeorology and Environmental Monitoring of Russia. Surface Water Quality in the Russian Federation. Information about the Most Heavily Polluted Water Bodies in the Russian Federation (Appendix to Yearbooks 2011–2019); Roshydromet, Gidrokhim. Inst.: Moscow/Rostov-on-Don, Russia, 2020. (In Russian)
- Ministry of Nature Management and Ecology of the Republic of Bashkortostan. State Reports on the State of Natural Resources and the Environment in the Republic of Bashkortostan over 2005–2018; Minecologii RB: Ufa, Russia, 2006. (In Russian)
- Blokov, I.P. Environment and Its Protection in Russia. Changes over 25 Years; Sovet Grinpis: Moscow, Russia, 2018; 432p. (In Russian) [Google Scholar]
- Nikanorov, A.M.; Minina, L.I.; Lobchenko, E.E.; Emelyanova, V.P.; Nichiporova, I.P.; Lyampert, N.A.; Pervysheva, O.A.; Lavrenko, N.Y. Dynamics of Surface Water Quality in Large River Basins in the Russian Federation; Gidrokhim. Inst.: Rostov-on-Don, Russia, 2015. (In Russian) [Google Scholar]
- Ministry of Natural Resources and the Environment of the Russian Federation. State Report “On the State and Use of Water Resources of the Russian Federation in 2016”; NIA-Priroda: Moscow, Russia, 2017; 300p. (In Russian)
- Shcherbakov, B.Y.; Chilikin, A.Y.; Izhevskii, V.S. Volley discharges of industrial sewage and their consequences. Ekol. Prom-st. Ross 2002, 6, 39–41. (In Russian) [Google Scholar]
- Selezneva, A.V. Anthropogenic load on rivers from point pollution sources. Izv. Samar. Nauh. Ts. Ross. Akad. Nauk. 2003, 5, 268–277. (In Russian) [Google Scholar]
- Bedient, P.B.; Lambert, J.L.; Springer, N.K. Stormwater pollutant load runoff relationships. J. Water Pollut. Control Fed. 1980, 52, 2396–2404. [Google Scholar]
- Knisel, W.G. (Ed.) CREAMS: A field scale model for Chemical, Runoff and Erosion from Agricultural Management Systems. In USDA Conservation Research Report, No. 26; Dept. of Agriculture, Science and Education Administration: Washington, DC, USA, 1980; 690p. [Google Scholar]
- Gao, L.; Li, D. A review of hydrological/water-quality models. Front. Agr. Sci. Eng. 2014, 1, 267–276. [Google Scholar] [CrossRef] [Green Version]
- Krysanova, V.; Hattermann, F.; Huang, S.; Hesse, C.; Voß, A. Water quality modelling in mesoscale and large river basins. In Encyclopedia of Life Support Systems, Volume 2: Hydrological Systems Modeling; Eolss Publishers Co. Ltd.: Oxford, UK, 2009; pp. 11–48. [Google Scholar]
- Harmel, R.D.; Smith, P.K.; Migliaccio, K.W.; Chaubey, I.; Douglas-Mankin, K.R.; Benham, B.; Shukla, S.; Muñoz-Carpena, R.; Robson, B.J. Evaluating, interpreting, and communicating performance of hydrologic/water quality models considering intended use: A review and recommendations. Environ. Model. Softw. 2014, 57, 40–51. [Google Scholar] [CrossRef]
- Yang, Y.S.; Wang, L. A review of modelling tools for implementation of the EU Water Framework Directive in handling diffuse water pollution. Water Resour. Manag. 2010, 24, 1819–1843. [Google Scholar] [CrossRef] [Green Version]
- Abbaspour, K.C.; Rouholahnejad, E.; Vaghefi, S.; Srinivasan, R.; Yang, H.; Kløve, B. A continental-scale hydrology and water quality model for Europe: Calibration and uncertainty of a high-resolution large-scale SWAT model. J. Hydrol. 2015, 524, 733–752. [Google Scholar] [CrossRef] [Green Version]
- Santhi, C.; Kannan, N.; Arnold, J.G.; Di Luzio, M. Spatial calibration and temporal validation of flow for regional scale hydrologic modeling. J. Am. Water Resour. Assoc. 2008, 44, 829–846. [Google Scholar] [CrossRef]
- Galván, L.; Olías, M.; de Villarán, R.F.; Domingo Santos, J.M.; Nieto, J.M.; Sarmiento, A.M.; Cánovas, C.R. Application of the SWAT model to an AMD-affected river (Meca River, SW Spain). Estimation of transported pollutant load. J. Hydrol. 2009, 377, 445–454. [Google Scholar] [CrossRef]
- Zhang, P.; Liu, Y.; Yu, Z. Land use pattern optimization based on CLUE-S and SWAT models for agricultural non-point source pollution control. Math. Comput. Model. 2013, 58, 588–595. [Google Scholar] [CrossRef]
- Hesse, C.; Krysanova, V. Modeling climate and management change impacts on water quality and in-stream processes in the Elbe River basin. Water 2016, 8, 40. [Google Scholar] [CrossRef] [Green Version]
- Fuchs, S.; Scherer, U.; Wander, R.; Behrendt, H.; Venohr, M.; Opitz, D.; Hillenbrand, T.; Marscheider-Weidemann, F.; Götz, T. Calculation of Emissions into Rivers in Germany Using the MONERIS Model Nutrients, Heavy Metals and Polycyclic Aromatic Hydrocarbons; UBA Technical Report, No. 46; Federal Environment Agency: Dessau-Roßlau, Germany, 2010; 237p.
- Vink, R.; Peters, S. Modelling point and diffuse heavy metal emissions and loads in the Elbe basin. Hydrol. Process. 2003, 17, 1307–1328. [Google Scholar] [CrossRef] [Green Version]
- Lindström, G.; Pers, C.; Rosberg, J.; Strömqvist, J.; Arheimer, B. Development and testing of the HYPE (Hydrological Predictions for the Environment) model—A water quality model for different spatial scales. Hydrol. Res. 2010, 41, 295–319. [Google Scholar] [CrossRef]
- Arheimer, B.; Olsson, J. Integration and Coupling of Hydrological Models with Water Quality Models: Applications in Europe; SMHI: Norrköping, Sweden, 2003; 53p. [Google Scholar]
- Borah, D.K.; Bera, M. Watershed-scale hydrologic and nonpoint-source pollution models: Review of applications. Trans. ASABE 2004, 47, 789–803. [Google Scholar] [CrossRef] [Green Version]
- Ambrose, R.B.; Wool, T.A.; Barnwell, T.O. Development of water quality modeling in the United States. Environ. Eng. Res. 2009, 14, 200–210. [Google Scholar] [CrossRef] [Green Version]
- Tang, T.; Strokal, M.; van Vliet, M.T.H.; Seuntjens, P.; Burek, P.; Kroeze, C.; Langan, S.; Wada, Y. Bridging global, basin and local-scale water quality modeling towards enhancing water quality management worldwide. Curr. Opin. Environ. Sustain. 2019, 36, 39–48. [Google Scholar] [CrossRef]
- Bąk, Ł.; Szeląg, B.; Sałata, A.; Studziński, J. Modeling of heavy metal (Ni, Mn, Co, Zn, Cu, Pb, and Fe) and PAH content in stormwater sediments based on weather and physico-geographical characteristics of the Catchment-Data-Mining Approach. Water 2019, 11, 626. [Google Scholar] [CrossRef] [Green Version]
- Motovilov, Y. ECOMAG: A distributed model of runoff formation and pollution transformation in river basins. In Understanding Freshwater Quality Problems in a Changing World, Proceedings of H04, IAHS–IAPSO–IASPEI Assembly, Gothenburg, Sweden, 22–26 July 2013; IAHS Publ. 361: Wallingford, UK, 2013; pp. 227–234. [Google Scholar]
- Meng, Y.; Zhou, L.; He, S.; Lu, C.; Wu, G.; Ye, W.; Ji, P. A heavy metal module coupled with the SWAT model and its preliminary application in a mine-impacted watershed in China. Sci. Total Environ. 2018, 613–614, 1207–1219. [Google Scholar] [CrossRef] [PubMed]
- Motovilov, Y.G.; Fashchevskaya, T.B. Simulation of spatially-distributed copper pollution in a large river basin using the ECOMAG-HM model. Hydrol. Sci. J. 2019, 64, 739–756. [Google Scholar] [CrossRef]
- Motovilov, Y.G.; Gelfan, A.N. Runoff Formation Models in Problems of River Basin Hydrology; Russian Academy of Sciences: Moscow, Russia, 2018; 300p, (In Russian). Available online: https://www.iwp.ru/upload/iblock/a4a/a4ab6902d99c4fa97e5a0da01859042e.pdf (accessed on 7 November 2021).
- Fashchevskaya, T.B.; Motovilov, Y.G. Modeling water pollution under different scenarios of zinc load on the Nizhnekamskoe Reservoir watershed. Water Resour. 2019, 46, S69–S80. [Google Scholar] [CrossRef]
- Fashchevskaya, T.B.; Motovilov, Y.G. Simulation of Heavy Metal Pollution of Watercourses in the Basin of the Nizhnekamskoe Reservoir. Water Resour. 2020, 47, 794–809. [Google Scholar] [CrossRef]
- The Republic of Bashkortostan: Brief Ensyclopedia; Nauchnoe Izd. “Bashkirskaya Entsiklopediya”:: Ufa, Russia, 1996; 672p. (In Russian)
- Khaziev, F.K. Soils in the Republic of Bashkortostan and Their Fertility Control; Gilem: Ufa, Russia, 2007; 285p. (In Russian) [Google Scholar]
- Fashchevskaya, T.B.; Polianin, V.O.; Fedosova, L.V. Structural Analysis of Water Quality Formation in an Urban Watercourse: Point, Non-Point, Transit, and Natural Components. Water Resour. 2018, 45, S67–S78. [Google Scholar] [CrossRef]
- Chernogayeva, E.M. Tendencies and Dynamics of the State and Pollution of the Environment in the Russian Federation According to the Data of Long-Term Monitoring for the Last 10 Years. Analytical Review; Rosgydromet: Moscow, Russia, 2017; 51p. (In Russian) [Google Scholar]
- Abdrakhmanov, R.F.; Chalov, Y.N.; Abdrakhmanova, E.P. Fresh Groundwater in Bashkortostan; Informreklama: Ufa, Russia, 2007; 184p. (In Russian) [Google Scholar]
- Yaparov, I.M. Atlas of the Republic of Bashkortostan; Kitap: Ufa, Russia, 2005; 419p. (In Russian) [Google Scholar]
- Sauvé, S.; Manna, S.; Turmel, M.-C.; Roy, A.G.; Courchesne, F. Solid-solution partitioning of Cd, Cu, Ni, Pb and Zn in the organic horizons of a forest soil. Environ. Sci. Technol. 2003, 37, 5191–5196. [Google Scholar] [CrossRef] [PubMed]
- Gelfan, A.; Frolova, N.; Magritsky, D.; Kireeva, M.; Grigoriev, V.; Motovilov, Y.; Gusev, E. Climate change impact on annual and maximum runoff of Russian rivers: Diagnosis and projections. Fund. Appl. Climatol. 2021, 7, 36–79. (In Russian) [Google Scholar] [CrossRef]
- SNIP-2.01.14-83. Construction Standards and Regulations, Determining Design Hydrological Characteristics; Stroiizdat: Moscow, Russia, 1985; 36p. (In Russian)
- Moriasi, D.N.; Arnold, J.G.; Van Liew, M.W.; Bingner, R.L.; Harmel, R.D.; Veith, T.L. Model evaluation guidelines for systematic quantification of accuracy in watershed simulations. Trans. ASABE 2007, 50, 885–900. [Google Scholar] [CrossRef]
Figure 1.
Map of the Nizhnekamskoe Reservoir (NKR) watershed and location of monitoring posts: Hydrological gauges (circles) and hydrochemical monitoring points (triangles). The inset shows the location of the NKR watershed (pink) in the Volga basin (gray) and Eurasian continent.
Figure 1.
Map of the Nizhnekamskoe Reservoir (NKR) watershed and location of monitoring posts: Hydrological gauges (circles) and hydrochemical monitoring points (triangles). The inset shows the location of the NKR watershed (pink) in the Volga basin (gray) and Eurasian continent.
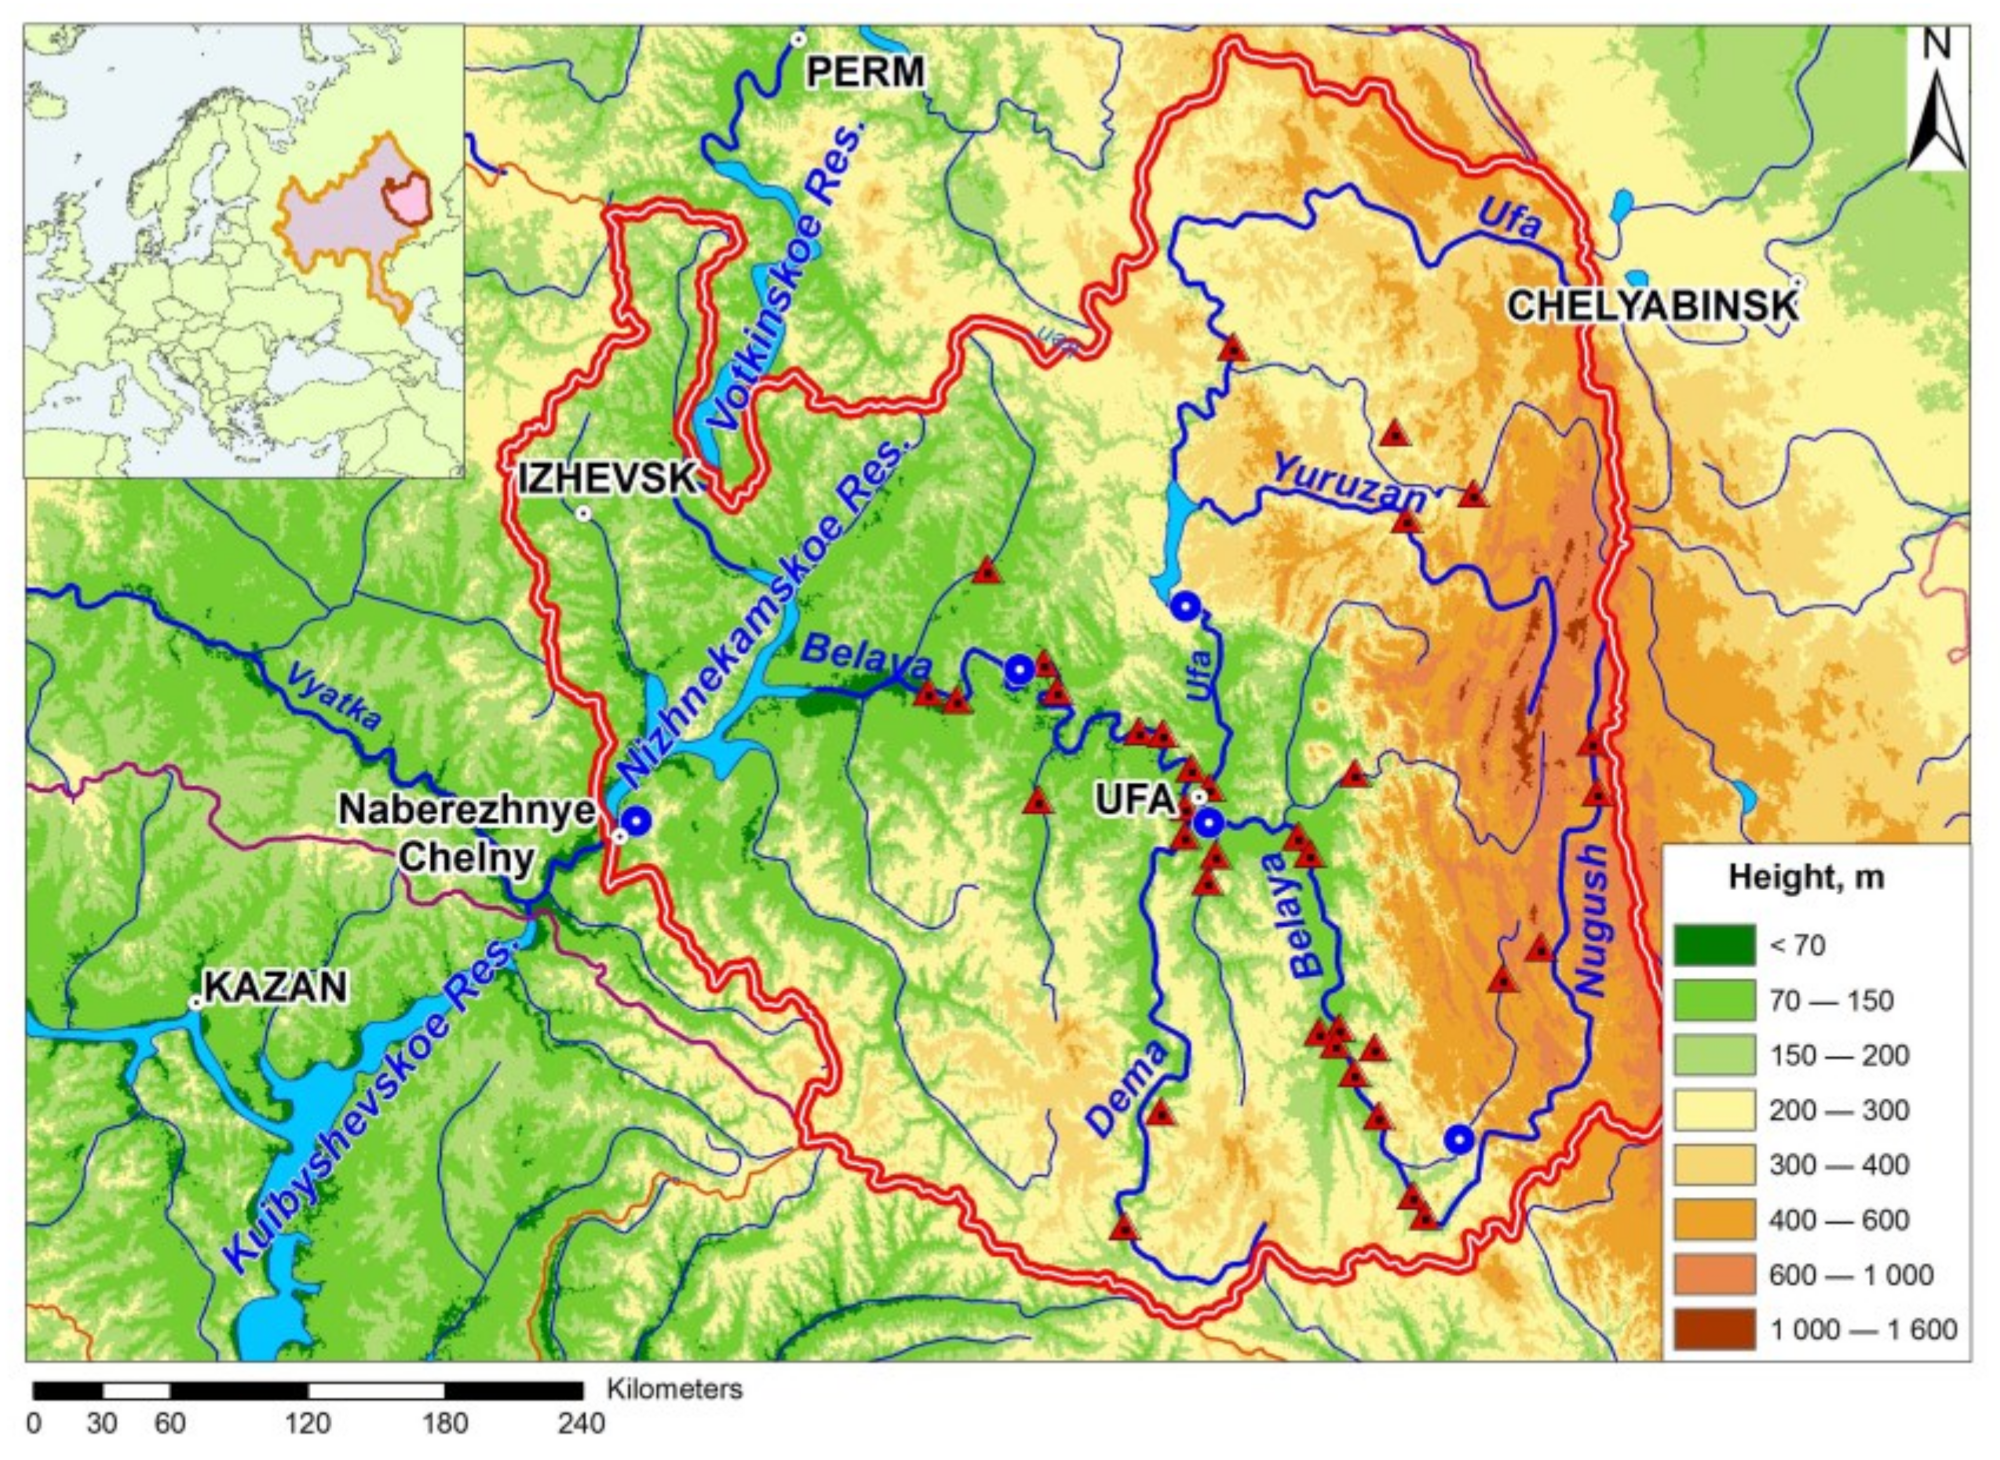
Figure 2.
Changes in mean annual air temperature (a) and precipitation (b) in Ufa station and the mean annual discharges (c) of the Belaya River at Birsk gauge for the 1956–2007 period (dotted lines are trends).
Figure 2.
Changes in mean annual air temperature (a) and precipitation (b) in Ufa station and the mean annual discharges (c) of the Belaya River at Birsk gauge for the 1956–2007 period (dotted lines are trends).
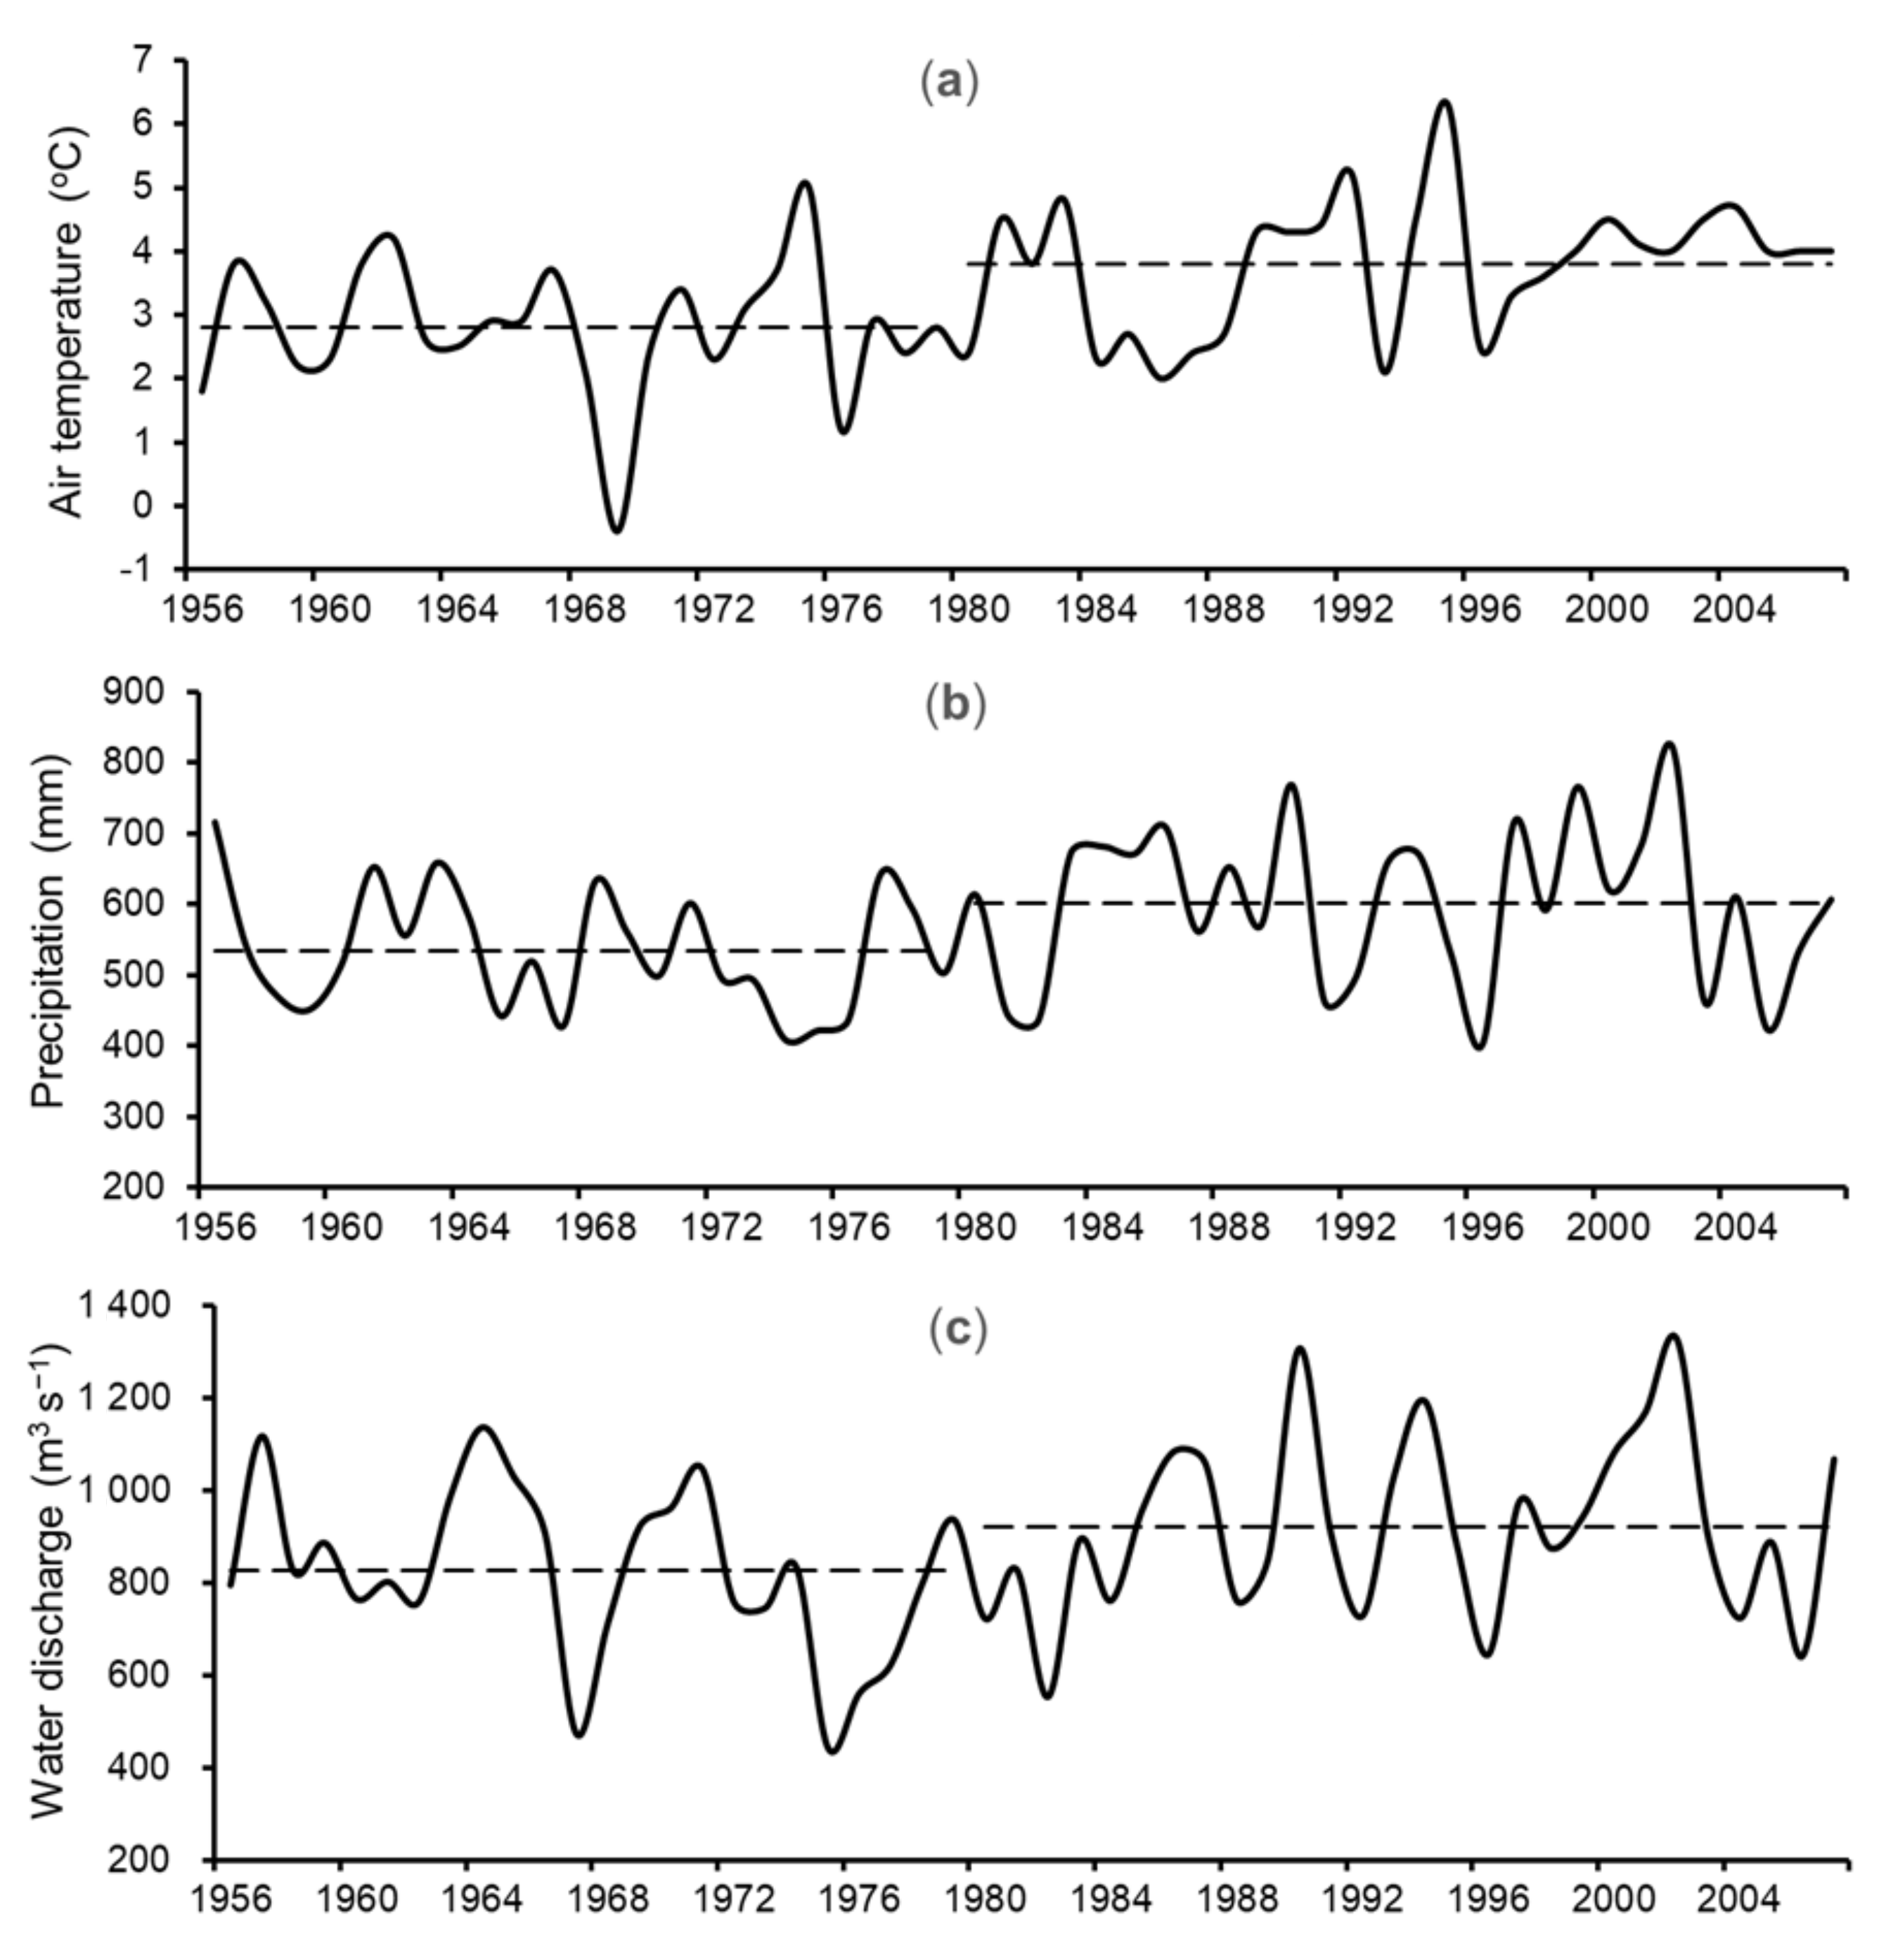
Figure 3.
Observed (blue) and simulated (red) hydrographs of the Belaya River and inflow into NKR.
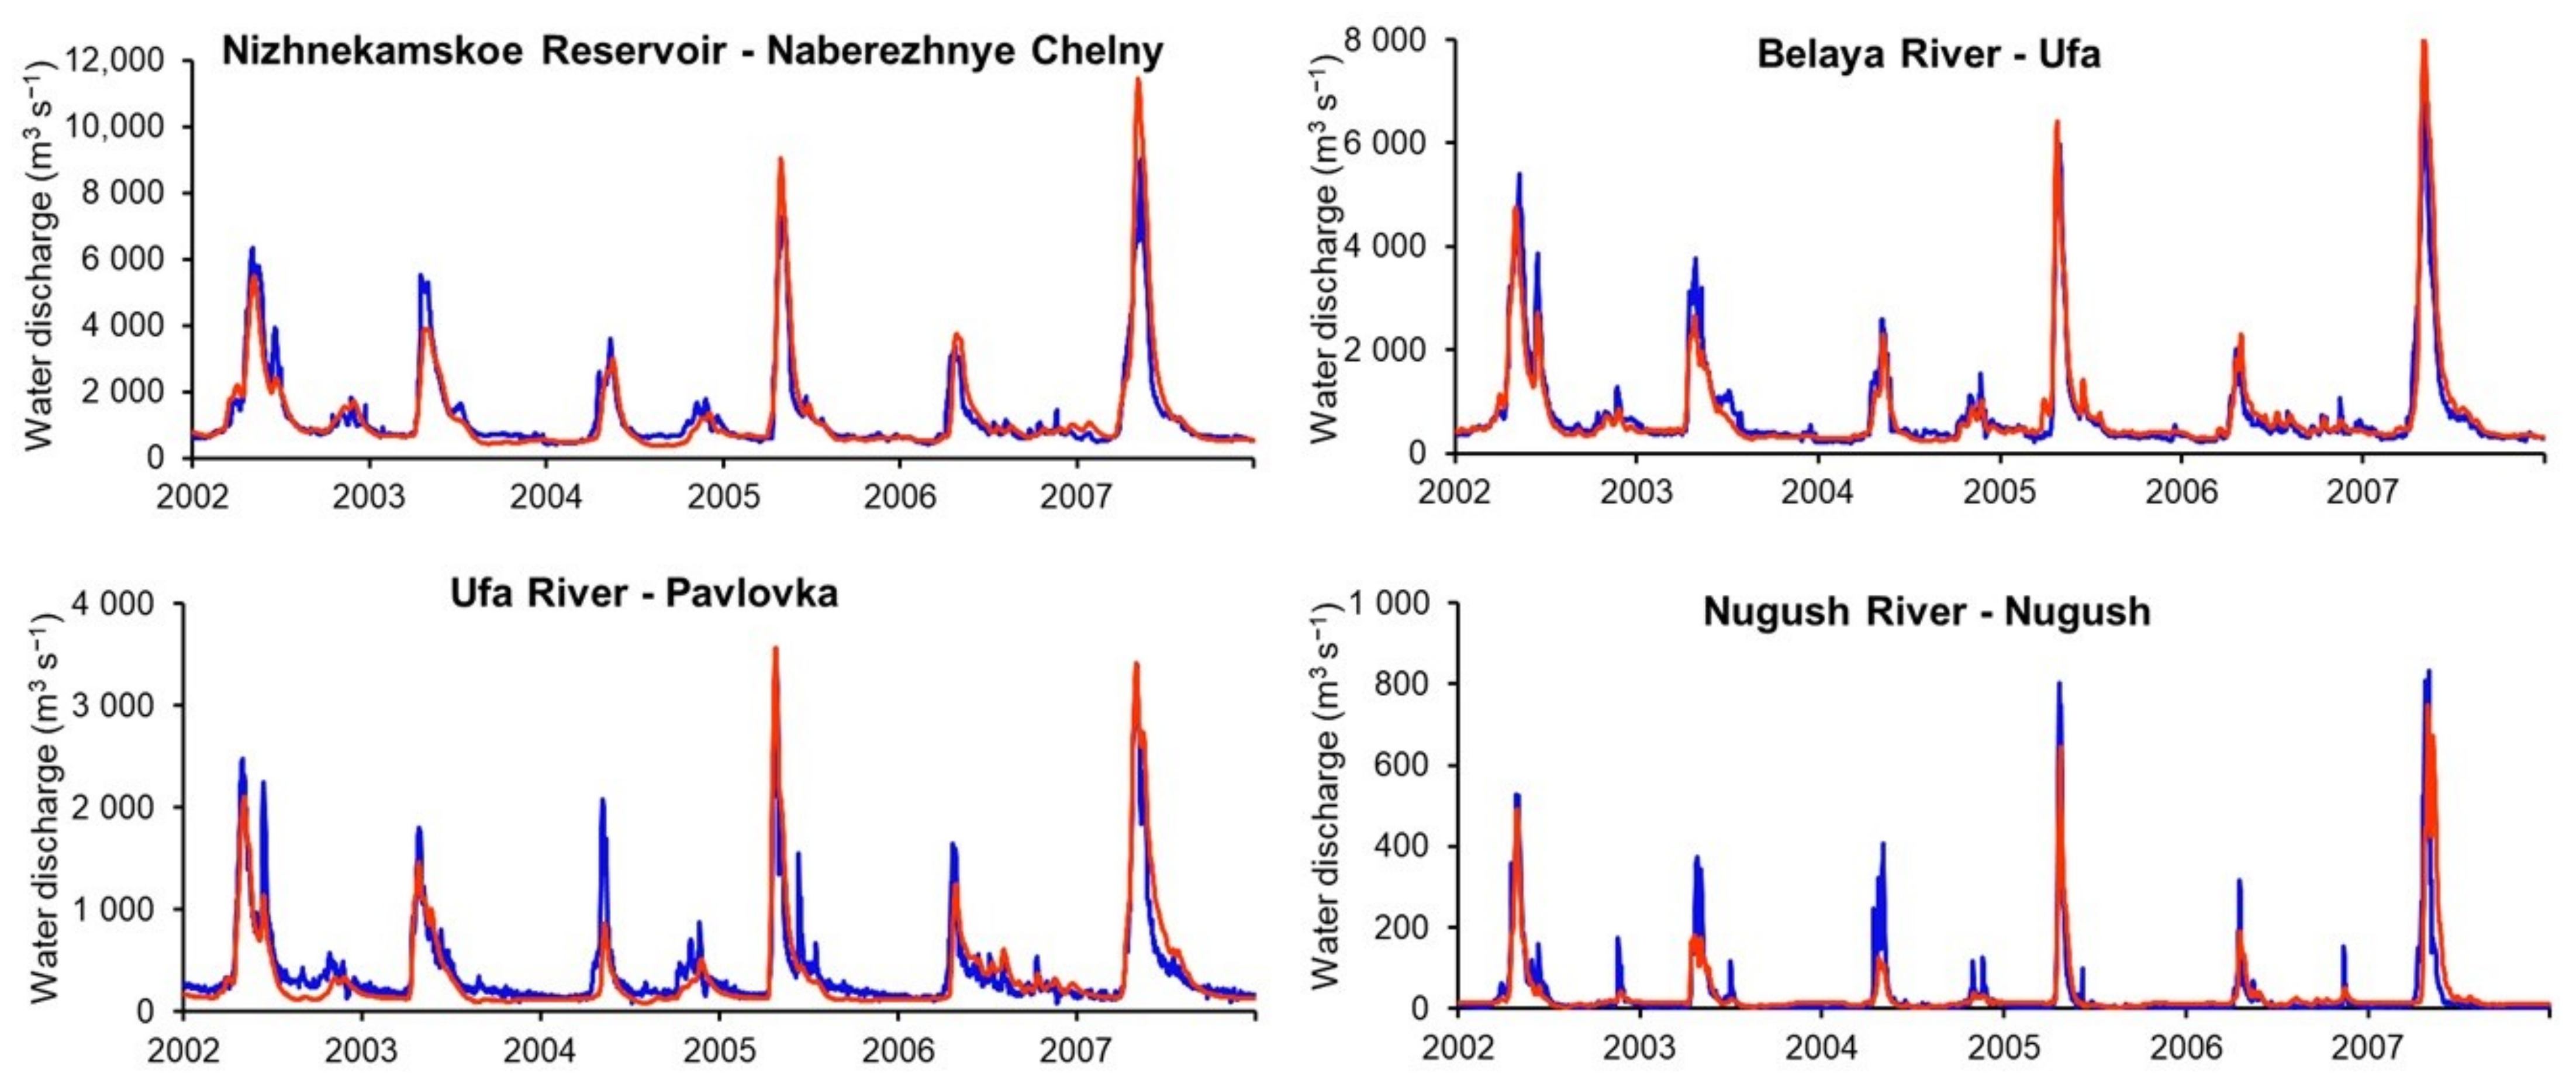
Figure 4.
Observed (green) and simulated (red) Mn concentrations at certain hydrochemical monitoring points over the 2002–2007 period: On the left, the dynamics with daily resolution; on the right, the mean intra-annual concentrations by quarters.
Figure 4.
Observed (green) and simulated (red) Mn concentrations at certain hydrochemical monitoring points over the 2002–2007 period: On the left, the dynamics with daily resolution; on the right, the mean intra-annual concentrations by quarters.
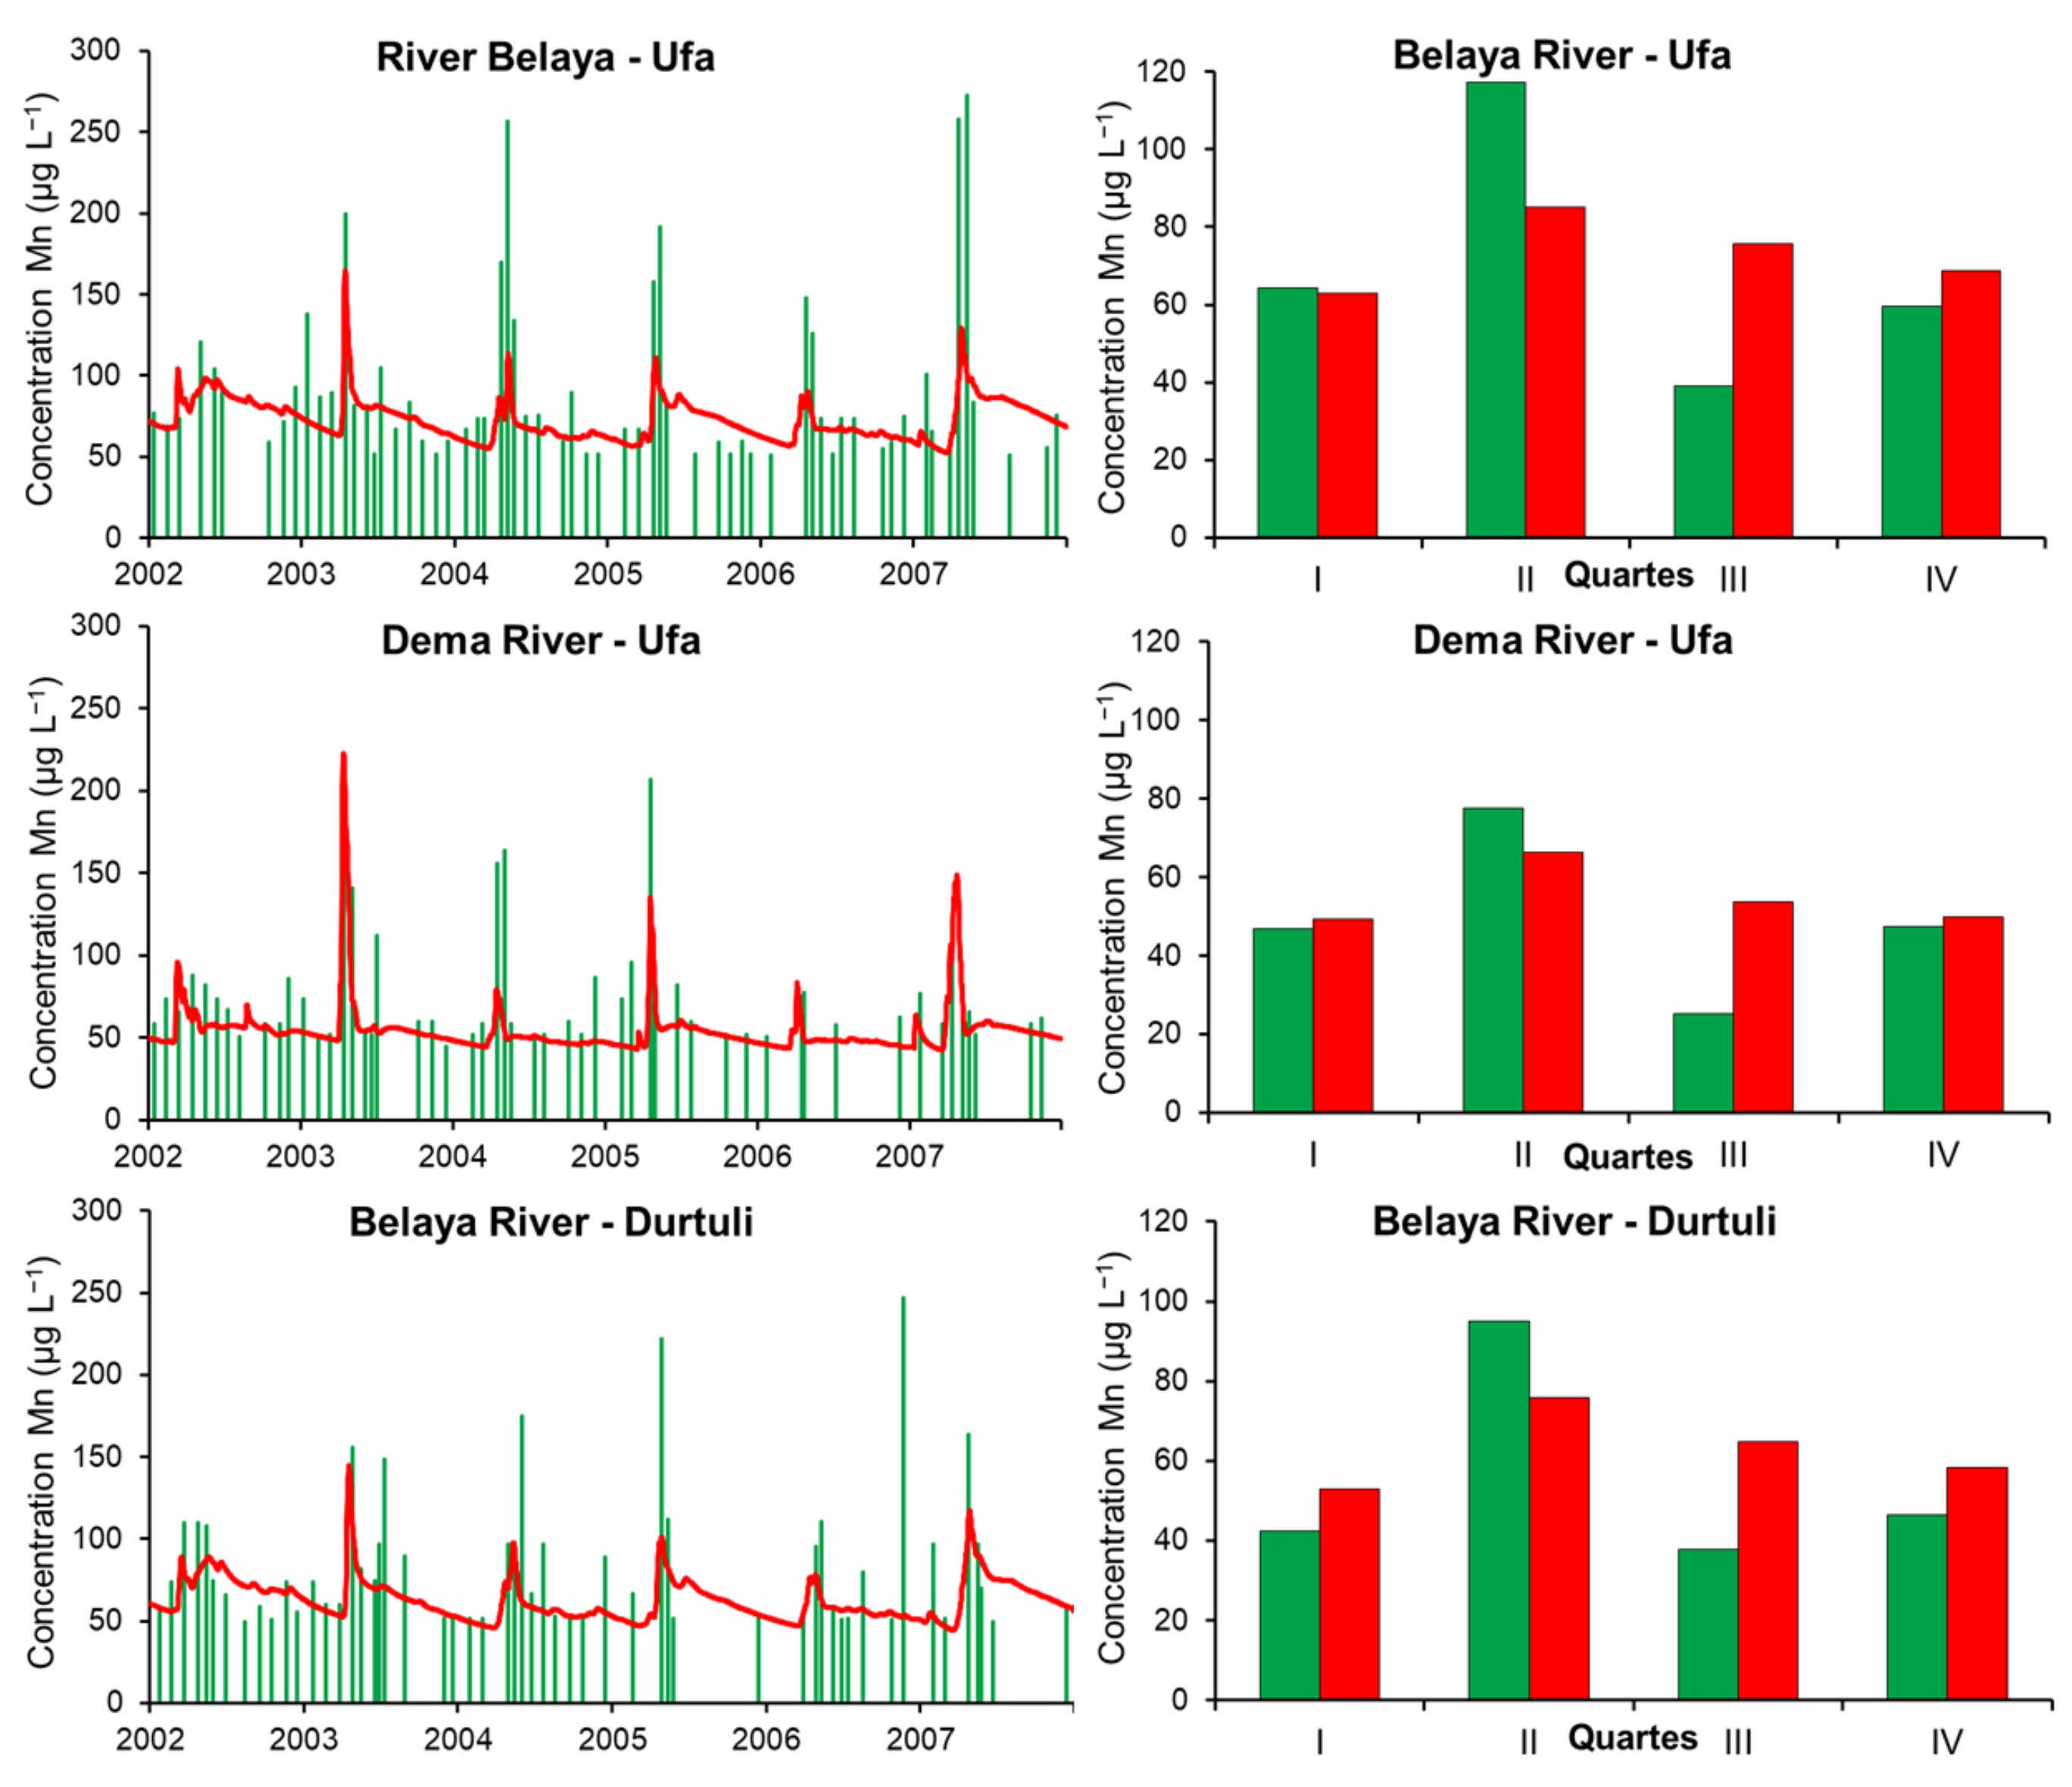
Figure 5.
Observed (green) and simulated (red) long-term mean annual heavy metal (HM) concentrations at the hydrochemical monitoring points located in the order from the upper reaches of the Belaya River toward its inflow into the NKR: (a) Cu; (b) Zn; (c) Mn. The arrow shows the direction of river flow.

Figure 6.
Inter-annual dynamics: (a) Simulated components of Mn load in the river network; (b) The actual and calculated Mn load in the NKR.
Figure 6.
Inter-annual dynamics: (a) Simulated components of Mn load in the river network; (b) The actual and calculated Mn load in the NKR.
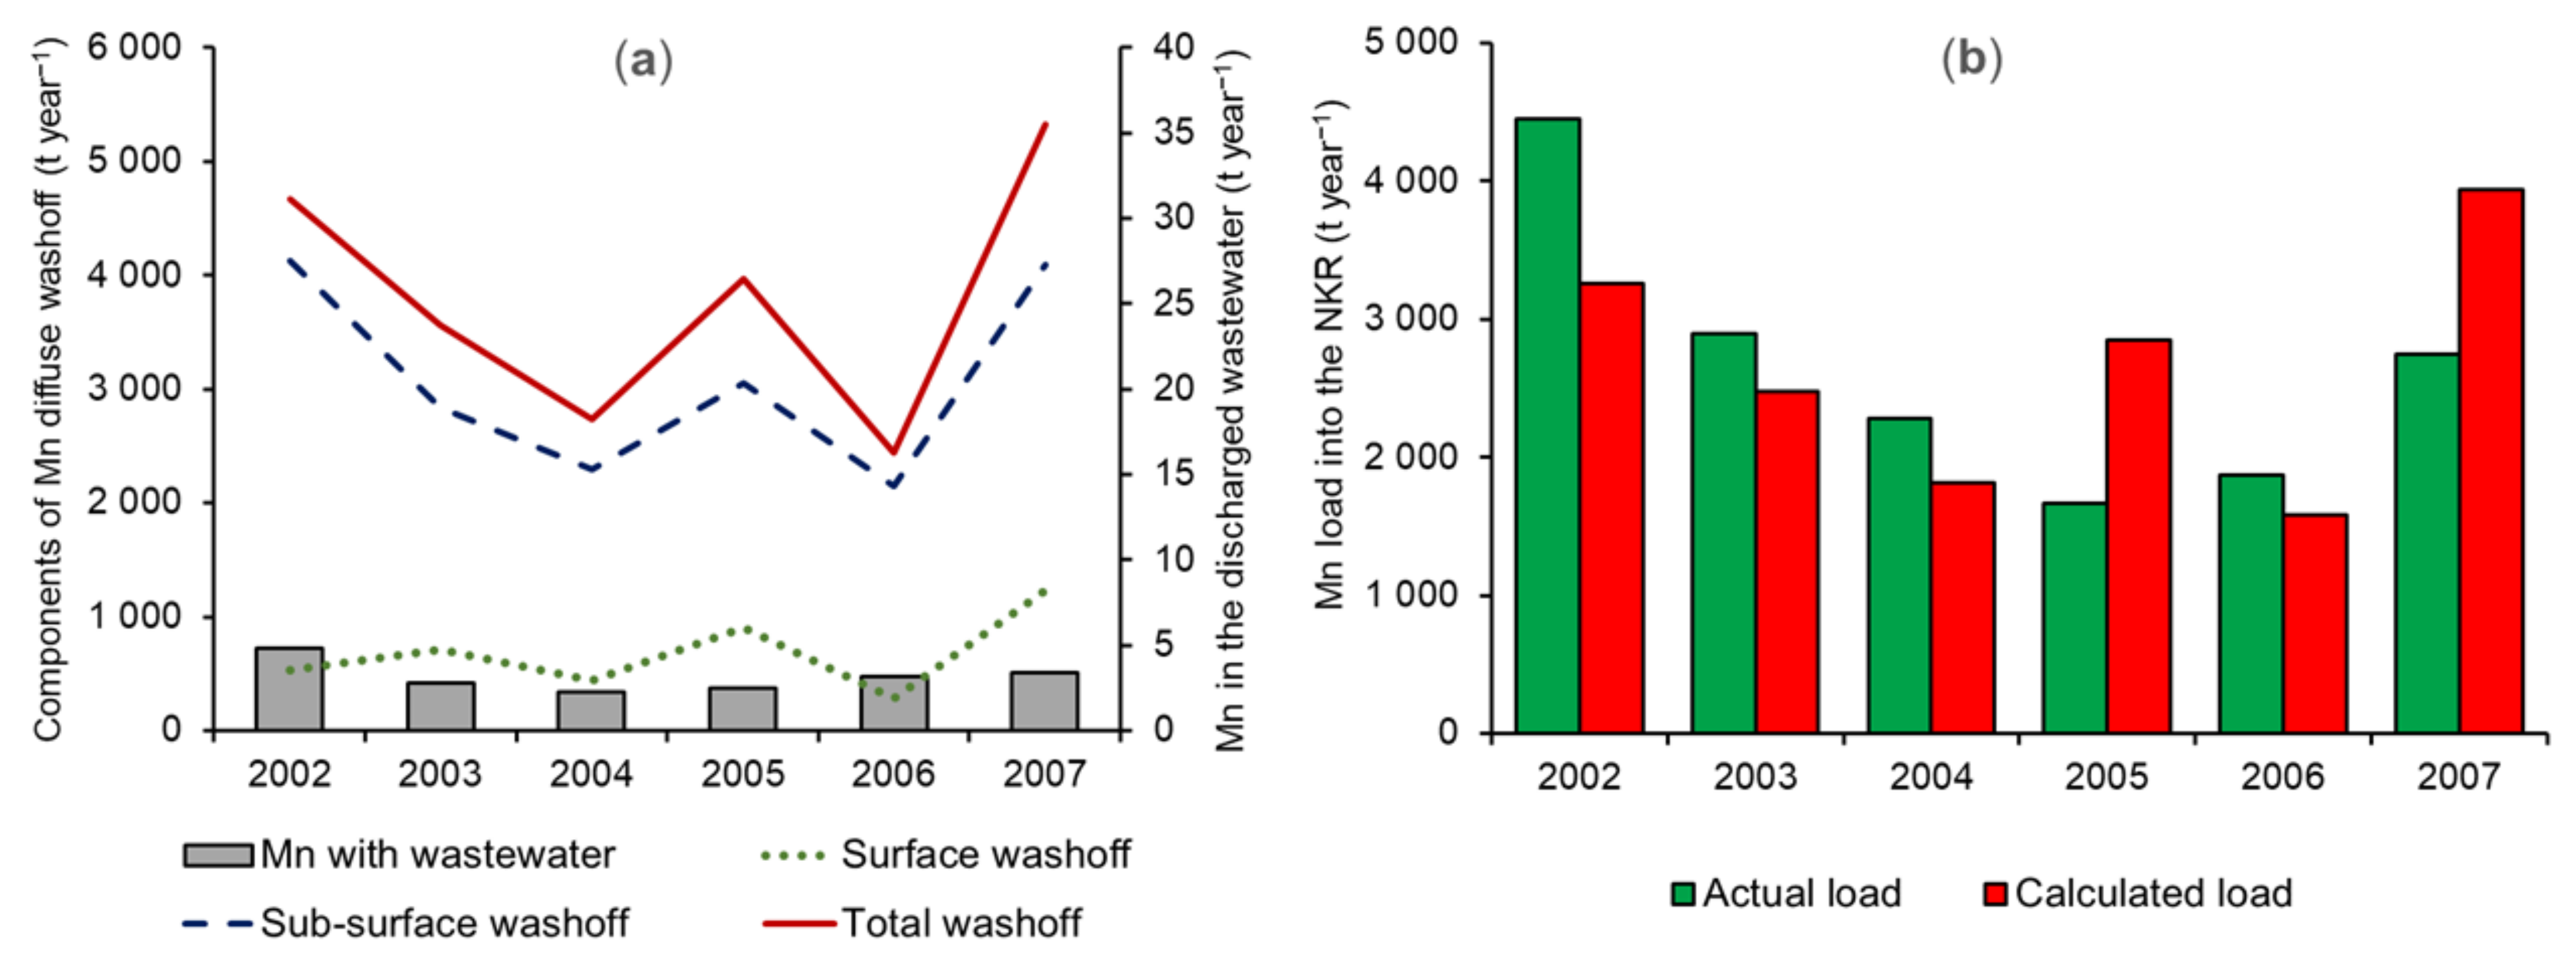
Figure 7.
Initial HM contents in the soils, long-term mean annual HM wash-off, and long-term mean annual HM concentrations in the river network.
Figure 7.
Initial HM contents in the soils, long-term mean annual HM wash-off, and long-term mean annual HM concentrations in the river network.

Figure 8.
Simulated hydrograph (blue) and dynamics of the copper content in the Belaya River (Ufa city) with the actual content of copper in wastewater (1) and with an increase in the copper content by 60 times (60) over the 2004–2007 period.
Figure 8.
Simulated hydrograph (blue) and dynamics of the copper content in the Belaya River (Ufa city) with the actual content of copper in wastewater (1) and with an increase in the copper content by 60 times (60) over the 2004–2007 period.
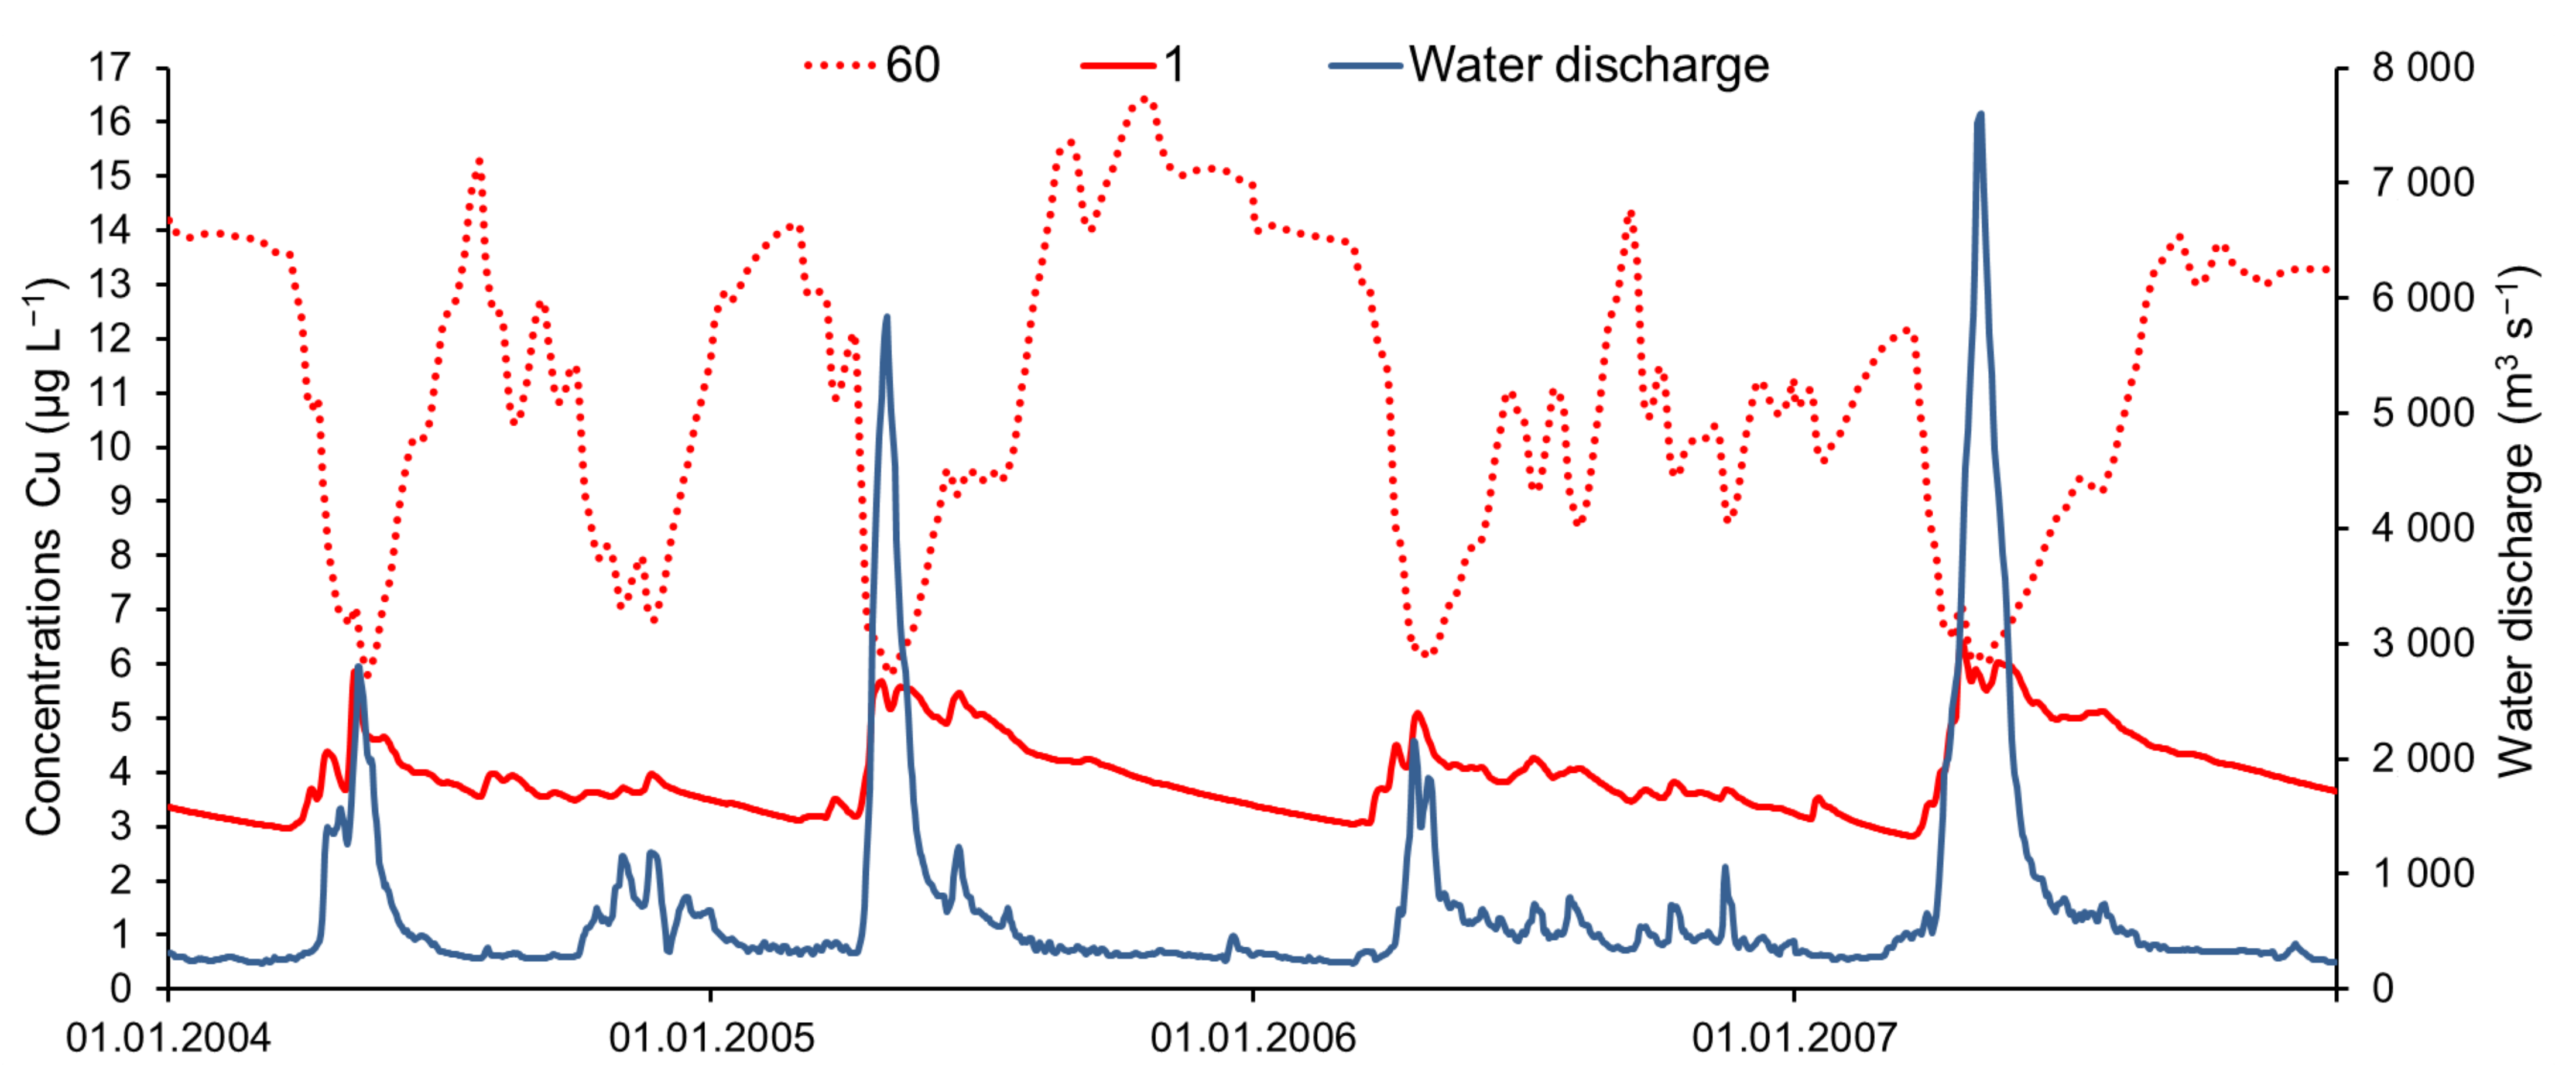
Figure 9.
Relationship between water discharges at the Belaya River (Ufa city) and the concentration of copper in river water with the actual content of copper in wastewater (1) and under scenarios of its change at 0.1, 10, 20, 40, 60, 80, 100 times.
Figure 9.
Relationship between water discharges at the Belaya River (Ufa city) and the concentration of copper in river water with the actual content of copper in wastewater (1) and under scenarios of its change at 0.1, 10, 20, 40, 60, 80, 100 times.

Figure 10.
Simulated anthropogenic impact on the NKR basin with changes in the metal content in the wastewater: (a) Contribution of point sources to the river water pollution, (b) wash-off of metals to the NKR.
Figure 10.
Simulated anthropogenic impact on the NKR basin with changes in the metal content in the wastewater: (a) Contribution of point sources to the river water pollution, (b) wash-off of metals to the NKR.
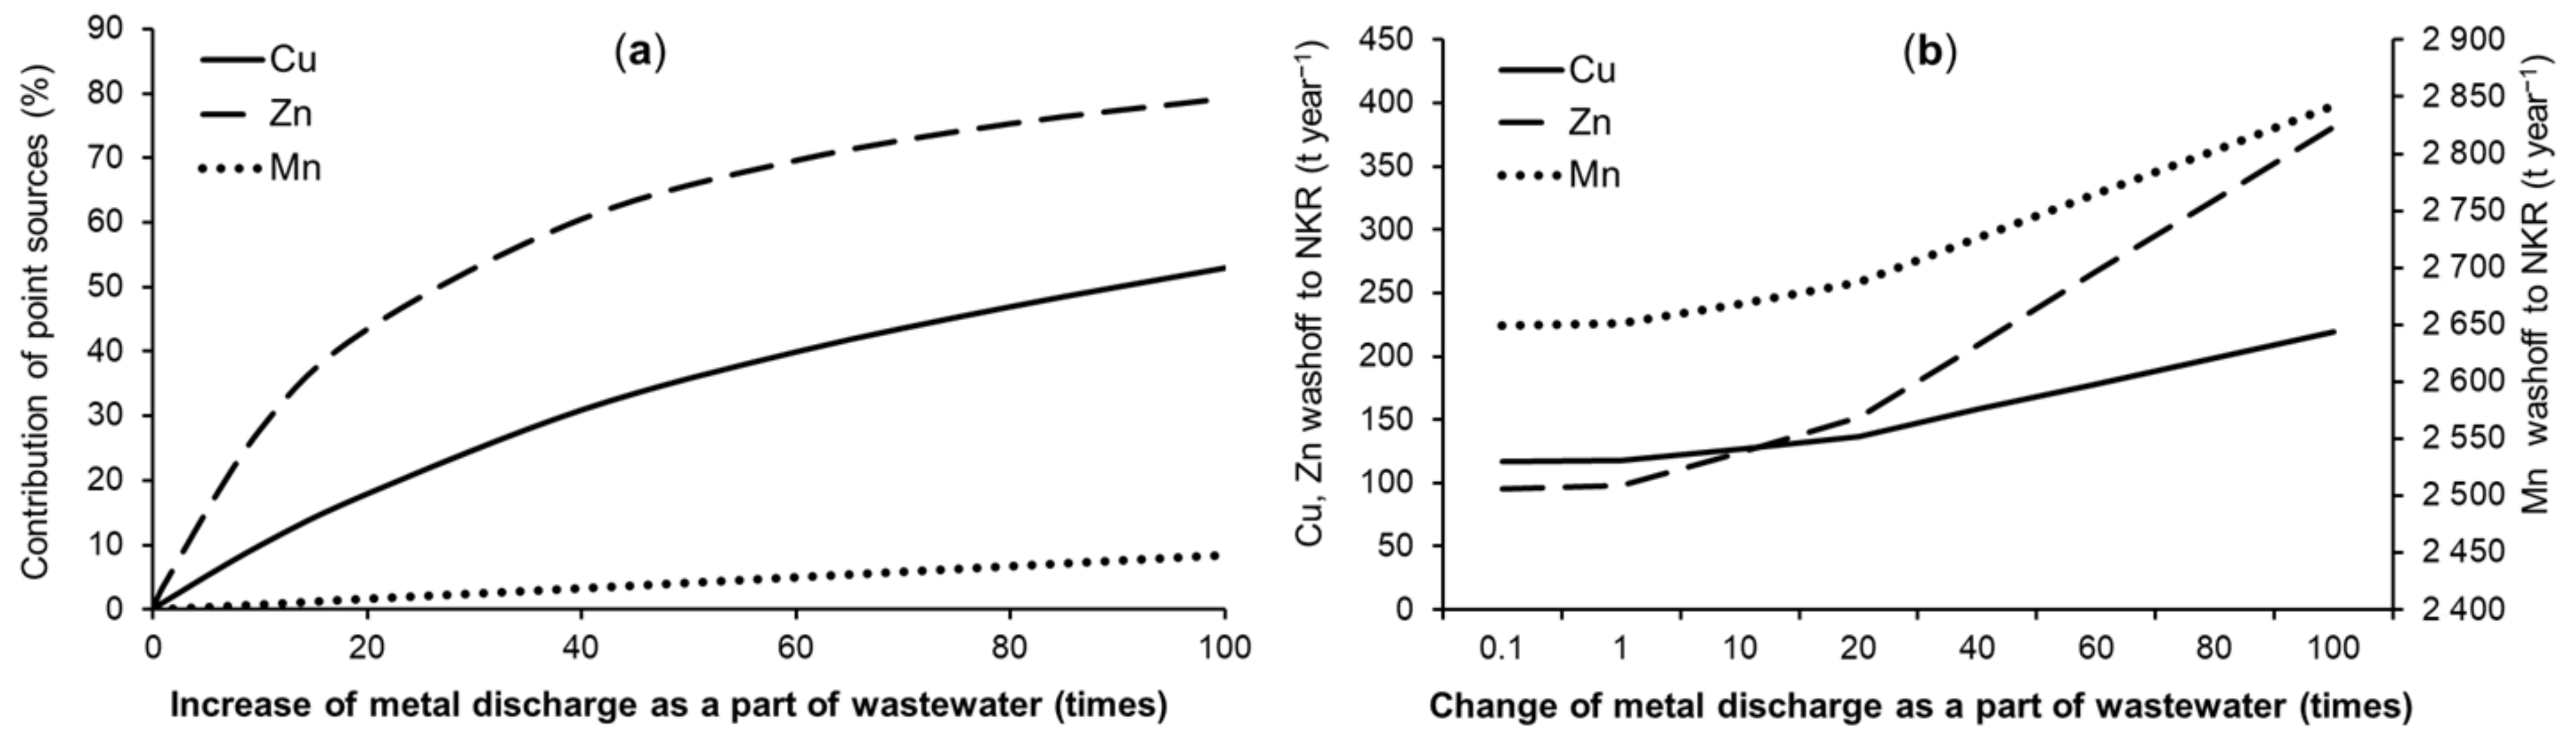
Figure 11.
Changes in the maximum concentration of copper at several hydrological stations along the Belaya River under various scenarios of copper dumping in the Salavat city (5000 kg, …, 100 kg).
Figure 11.
Changes in the maximum concentration of copper at several hydrological stations along the Belaya River under various scenarios of copper dumping in the Salavat city (5000 kg, …, 100 kg).
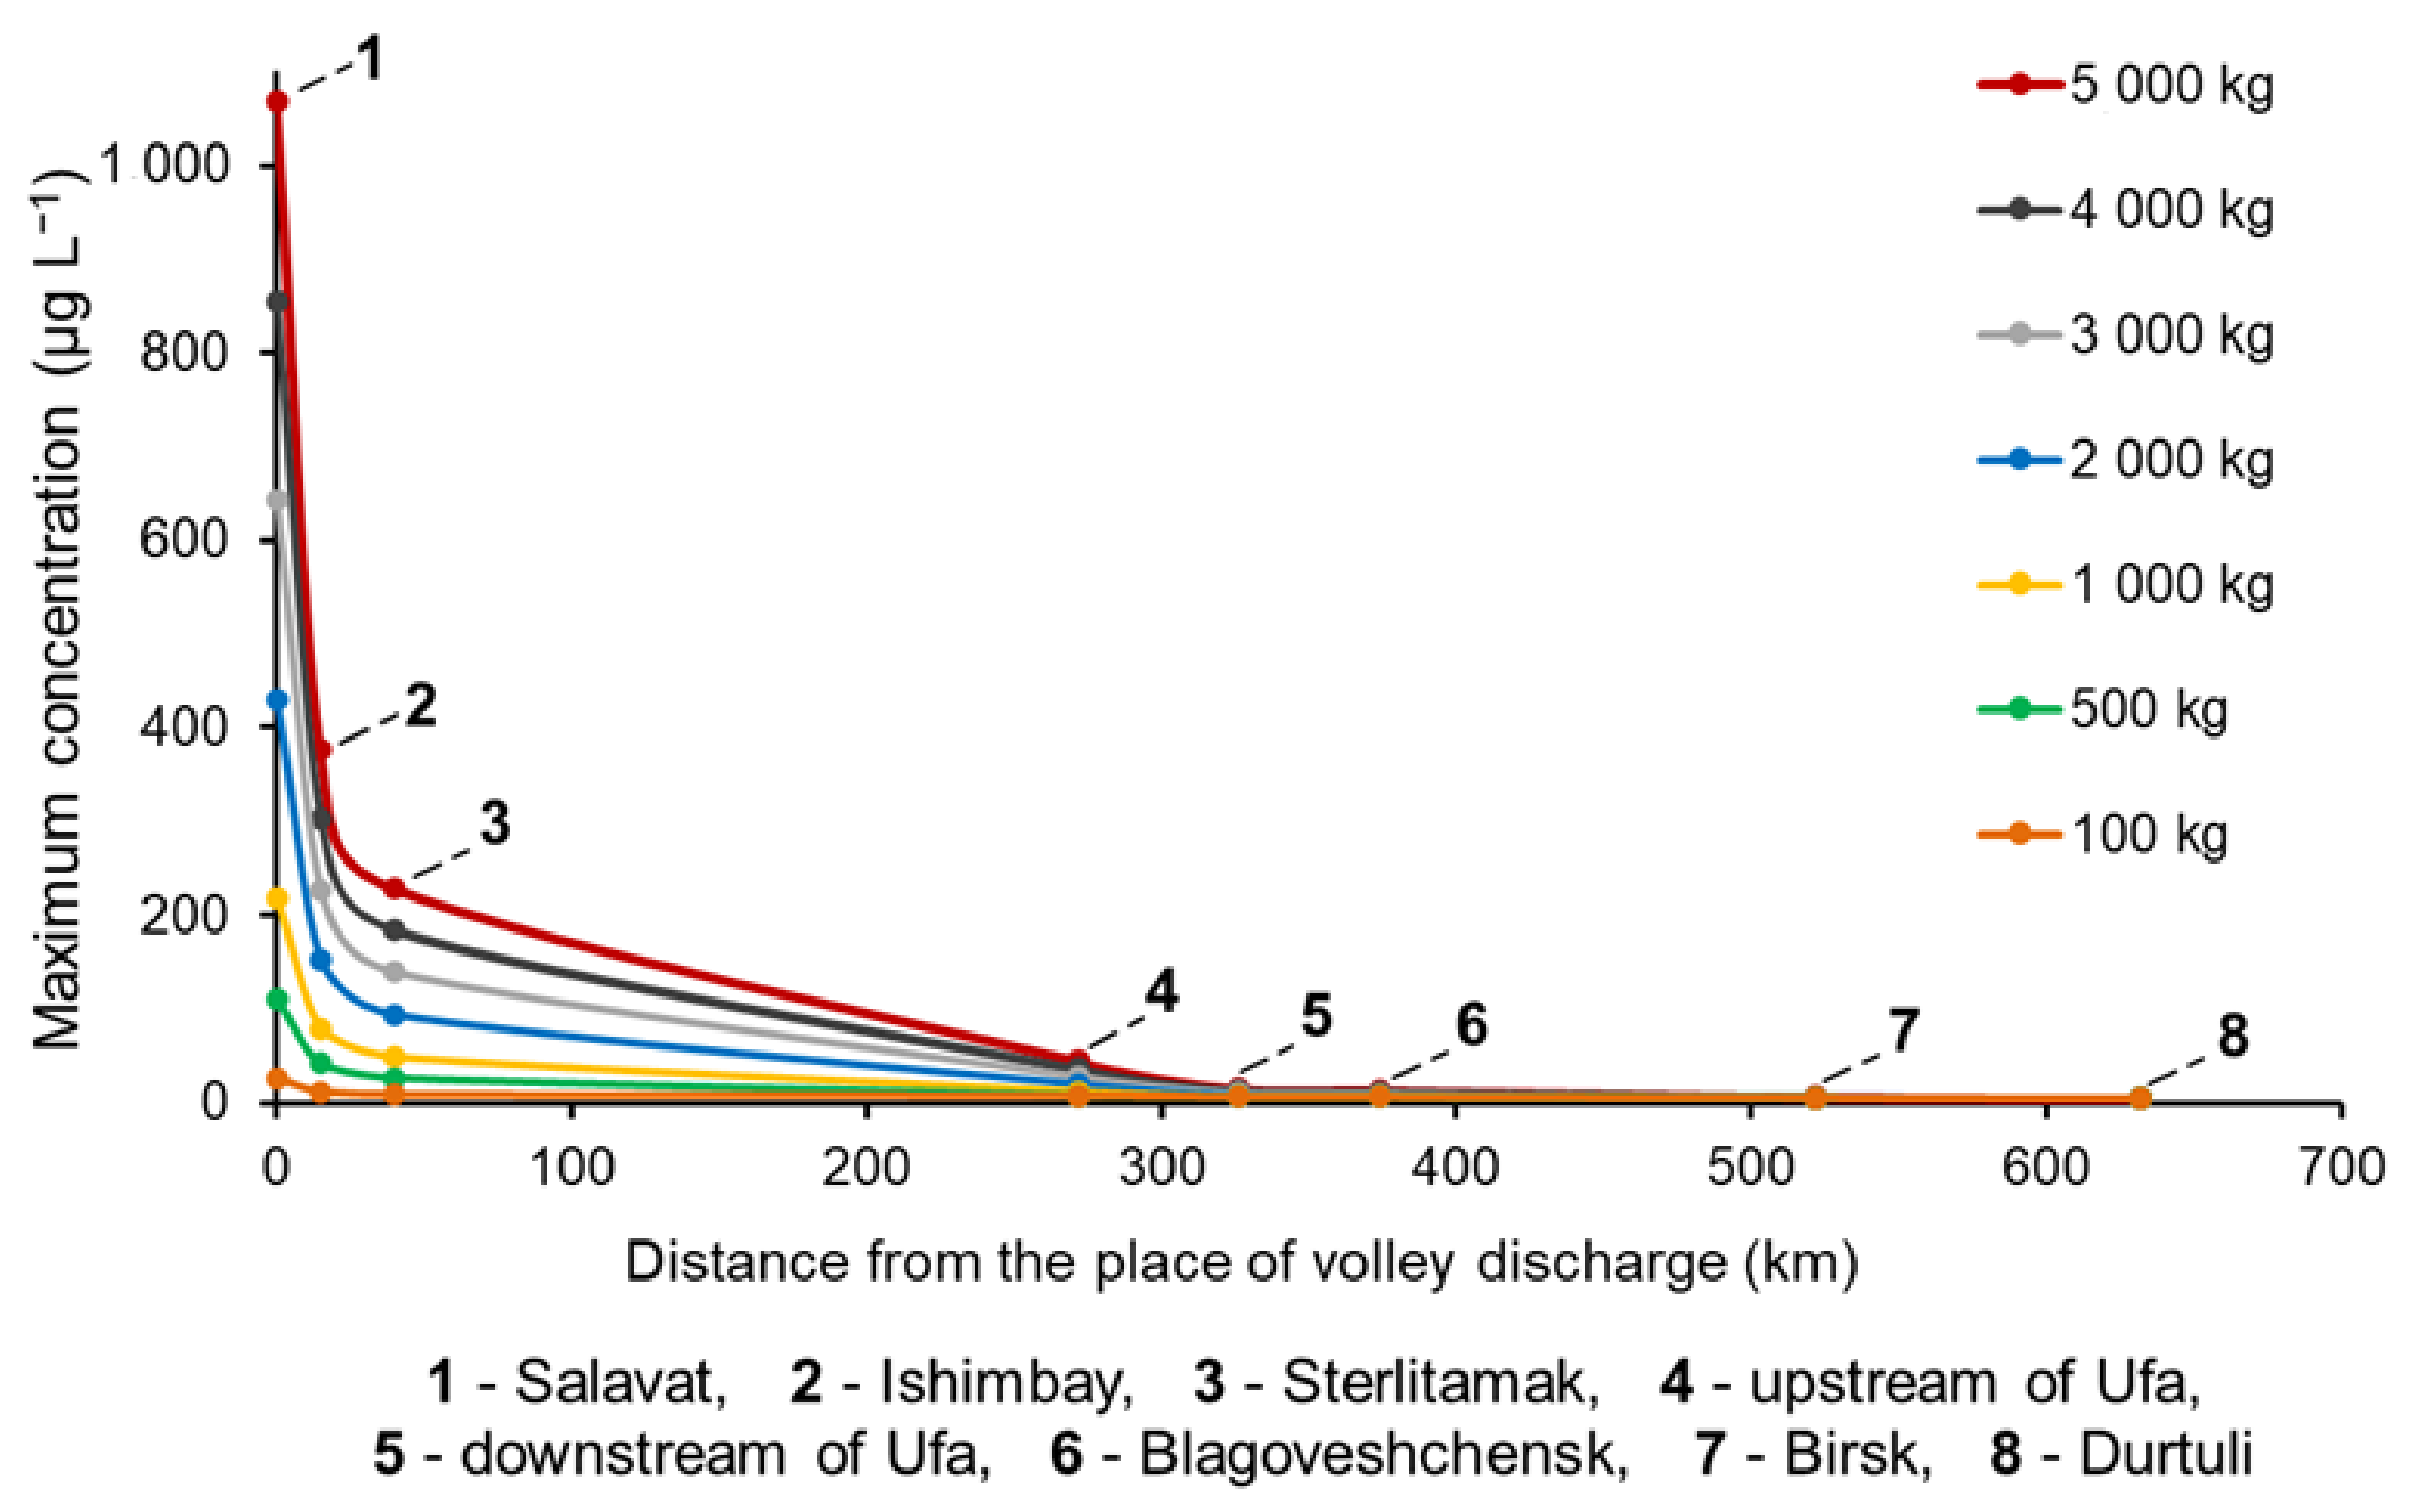
Figure 12.
Changes in Mn reserves in soils (a), wash-off intensity, and Mn concentration in river waters (b) over a 400-year self-purification period.
Figure 12.
Changes in Mn reserves in soils (a), wash-off intensity, and Mn concentration in river waters (b) over a 400-year self-purification period.

Figure 13.
Simulated hydrographs of lateral inflow into the NKR under historical (blue) and DC scenarios (red) over the 2002–2003 period.
Figure 13.
Simulated hydrographs of lateral inflow into the NKR under historical (blue) and DC scenarios (red) over the 2002–2003 period.


Table 1.
Maximum allowed concentrations (MAC) for some heavy metals (HM) in the Russian Federation (mg·L−1).
Table 1.
Maximum allowed concentrations (MAC) for some heavy metals (HM) in the Russian Federation (mg·L−1).
| HM | MAC in Water Bodies | |
|---|---|---|
| for Drinking Water | for Fisheries | |
| Cd | 0.001 | 0.005 |
| Mn | 0.1 | 0.01 |
| Cu | 1.0 | 0.001 |
| As | 0.01 | 0.05 |
| Ni | 0.02 | 0.01 |
| Hg | 0.0005 | 0.00001 |
| Pb | 0.01 | 0.006 |
| Zn | 1.0 | 0.01 |
| Cr3+ | 0.5 | 0.07 |
| Cr6+ | 0.05 | 0.02 |
Table 2.
Observed and simulated HM concentrations and its ranges of changes in monitoring points (µg·L−1).
Table 2.
Observed and simulated HM concentrations and its ranges of changes in monitoring points (µg·L−1).
| HM | Long-Term Mean Annual Concentration Averaged over Monitoring Points | Range of Changes in Long-Term Annual HM Concentrations at the Monitoring Points | ||||
|---|---|---|---|---|---|---|
| min | max | |||||
| Observ. | Simul. | Observ. | Simul. | Observ. | Simul. | |
| Cu | 3.94 | 4.28 | 2.38 | 2.59 | 6.29 | 7.10 |
| Zn | 4.48 | 4.65 | 2.36 | 2.72 | 9.03 | 10.24 |
| Mn | 84.4 | 77.1 | 42.4 | 42.4 | 188.0 | 116.1 |
Table 3.
Simulated components of HM load into the river network from the NKR watershed and the actual and simulated HM load into the NKR (t·year−1).
Table 3.
Simulated components of HM load into the river network from the NKR watershed and the actual and simulated HM load into the NKR (t·year−1).
| HM | HM Load | Actual Load of HM by Wastewater | HM Setting onto Riverbed | Total HM Load into NKR | ||
|---|---|---|---|---|---|---|
| With Surface Water Flow | With Subsurface Water Flow | Simulated | Actual | |||
| Cu | 40.3 | 174.3 | 2.3 | 99 | 118 | 119 |
| Zn | 35.8 | 197.5 | 8.9 | 144.3 | 98 | 114.5 |
| Mn | 685 | 3093 | 3.2 | 1134 | 2651 | 2651 |
Table 4.
Simulated runoff characteristics under historical data series (Hist.) and DC scenario (DC) for the 2002–2007 period.
Table 4.
Simulated runoff characteristics under historical data series (Hist.) and DC scenario (DC) for the 2002–2007 period.
| Years | Annual Runoff (km3) | Maximal Discharge (m3·s−1) | ||||
|---|---|---|---|---|---|---|
| Hist. | DC | Changes (%) | Hist. | DC | Changes (%) | |
| 2002 | 50.3 | 54.1 | 8 | 5503 | 4750 | −14 |
| 2003 | 38.5 | 40.1 | 4 | 3911 | 4790 | 22 |
| 2004 | 35.0 | 39.1 | 12 | 3877 | 3898 | 1 |
| 2005 | 43.4 | 45.6 | 5 | 8263 | 8199 | −1 |
| 2006 | 32.4 | 35.2 | 9 | 3038 | 3382 | 11 |
| 2007 | 55.2 | 58.6 | 6 | 9900 | −5 | |
| Mean | 42.5 | 45.4 | 7 | 5842 | 5820 | −0.4 |
Table 5.
Simulated water quality characteristics under historical data series and DC scenario for the 2002–2007 period.
Table 5.
Simulated water quality characteristics under historical data series and DC scenario for the 2002–2007 period.
| Years | Mn Annual Concentrations, Durtuli Gauge (µg·L−1) | Maximal Concentrations, Durtuli Gauge (µg·L−1) | Annual Mn Loads into the NKR (t·year−1) | ||||||
|---|---|---|---|---|---|---|---|---|---|
| Hist. | DC | Changes (%) | Hist. | DC | Changes (%) | Hist. | DC | Changes (%) | |
| 2002 | 70.5 | 72.4 | 3 | 88.3 | 92 | 4 | 3257 | 3553 | 9 |
| 2003 | 64.5 | 66.2 | 3 | 145 | 140 | −3 | 2474 | 2650 | 7 |
| 2004 | 55.5 | 59.4 | 7 | 96 | 90 | −6 | 1811 | 2139 | 18 |
| 2005 | 61.3 | 64.8 | 6 | 100 | 92 | −8 | 2845 | 3032 | 6 |
| 2006 | 54.8 | 58.5 | 7 | 77 | 85 | −10 | 1582 | 1841 | 16 |
| 2007 | 66.3 | 71.5 | 8 | 116 | 113 | −3 | 3936 | 4337 | 10 |
| Mean | 62.2 | 65.5 | 5 | 104 | 102 | −2 | 2651 | 2925 | 10 |
Publisher’s Note: MDPI stays neutral with regard to jurisdictional claims in published maps and institutional affiliations. |
© 2021 by the authors. Licensee MDPI, Basel, Switzerland. This article is an open access article distributed under the terms and conditions of the Creative Commons Attribution (CC BY) license (https://creativecommons.org/licenses/by/4.0/).
Share and Cite
MDPI and ACS Style
Motovilov, Y.; Fashchevskaya, T. Modeling Management and Climate Change Impacts on Water Pollution by Heavy Metals in the Nizhnekamskoe Reservoir Watershed. Water 2021, 13, 3214. https://doi.org/10.3390/w13223214
AMA Style
Motovilov Y, Fashchevskaya T. Modeling Management and Climate Change Impacts on Water Pollution by Heavy Metals in the Nizhnekamskoe Reservoir Watershed. Water. 2021; 13(22):3214. https://doi.org/10.3390/w13223214
Chicago/Turabian StyleMotovilov, Yury, and Tatiana Fashchevskaya. 2021. "Modeling Management and Climate Change Impacts on Water Pollution by Heavy Metals in the Nizhnekamskoe Reservoir Watershed" Water 13, no. 22: 3214. https://doi.org/10.3390/w13223214
Note that from the first issue of 2016, this journal uses article numbers instead of page numbers. See further details here.