Article

Assessment of Coagulation–Flocculation Process Efficiency for the Natural Organic Matter Removal in Drinking Water Treatment

Department of Environmental Engineering and Management, “Cristofor Simionescu” Faculty of Chemical Engineering and Environmental Protection, “Gheorghe Asachi” Technical University of Iasi, 73 D. Mangeron Street, 700050 Iasi, Romania
*
Author to whom correspondence should be addressed.
Water 2021, 13(21), 3073; https://doi.org/10.3390/w13213073
Submission received: 5 October 2021 / Revised: 23 October 2021 / Accepted: 30 October 2021 / Published: 2 November 2021
(This article belongs to the Section Wastewater Treatment and Reuse)

Abstract

:
Natural organic matter (NOM) represents a range of heterogeneous hydrophobic and hydrophilic components naturally occurring in the water source and, due to the fact that they can act as precursors for the disinfection, by-products may have a considerable impact on drinking water quality. Coagulation–flocculation (C/F) is among the most applied processes for NOM removal from water sources (especially rivers). In this study, C/F efficiency for a river water supply was investigated in cold and warm conditions, by varying the coagulant dose and mixing conditions. In this study, polyhydroxy aluminum chloride PAX XL 60, and polyacrylamide FloPam AN 910 SEP were used as coagulant and flocculant, respectively. Multiple water quality indicators were determined, such as turbidity, chemical oxygen demand (COD), dissolved organic carbon (DOC), and residual aluminum concentration. Some unconventional parameters relevant for NOM removal were also considered, like absorbance at 254 nm (A254), at 280 nm (A280), and at 365 nm (A365), as well as the ratios A254/DOC, A254/280, and A254/A365. After coagulation–flocculation, turbidity was completely removed in all the studied conditions. The DOC content was reduced by up to 22.65% at a low temperature and by up to 31.81% at a high temperature. After the addition of polyelectrolyte in cold conditions, the efficiency in terms of A254 increased by up to 37.4%, while the specific absorbance decreased. The high molecular weight NOM increased after C/F, based on the A254/A365 ratio. Chemometric analysis was employed in order to determine the effect of the coagulant dose on the process efficiency. The optimum coagulation–flocculation conditions were corroborated by means of the principal component analysis.

1. Introduction

Natural organic matter (NOM) is present in most of the surface water supplies, along with suspended particles, colloids, and pathogens. Natural organic matter is defined as a complex matrix of heterogeneous hydrophobic and hydrophilic components, naturally occurring in the water sources, as a result of different hydrological, biological, and geological interaction schemes [1,2,3]. NOM has a wide variety of chemical compositions, molecular sizes, functional group chemistries, solubilities, and polarities [2,4]. As a result of its composition, NOM does not have a set of defined functional groups, size distributions, acid-base functionalities, or chelating potentials [5].
The presence of natural organic matter in sources adequate for drinking water treatment, mainly humic acid and fulvic acid, contributes to the formation of disinfection by-products (DBPs), when water is treated with a disinfecting agent, such as chlorine or chloramine, which leads to the potential presence of carcinogenic compounds in conventionally treated waters (involving chlorination as the final stage of raw water treatment). These DBPs in drinking water, including aliphatic halogenated trihalomethanes (THMs), haloacetonitriles, and haloacetic acids (HAAs), have been found to be toxic and associated with many forms of cancer, endocrine disorders, or other diseases [6,7]. Due to the public concerns regarding the potential health effects of DBPs, the European Union (EU) regulated THMs, setting their limit at 100 µg/L [8]. In order to comply with EU regulations, the Romanian Government has set the same limit. Thus, the concentration of NOM from raw water must be reduced as much as possible, prior to the disinfection process, to minimize the formation of DBPs.
Numerous technologies have been employed to remove NOM in the treatment of drinking water, such as coagulation and flocculation (C/F), activated carbon adsorption, advanced oxidation, and membrane processes [4], but the most common and feasible drinking water processes are considered to be coagulation and flocculation, followed by sedimentation and sand filtration.
Coagulation is based on NOM particle destabilization using positively charged metals, with the formation of larger particles (flocs), followed by the settling of the organic pollutants. This is usually carried out with alum (Al2(SO4)3) or ferric chloride (FeCl3). The treatment of raw water in dry, cold (winter) conditions is especially difficult, since the coagulation process becomes hindered due to the adverse effects of low temperatures on the coagulation rate, coagulant dose, and structure of the formed flocs [9]. In addition, low turbidity means low concentration and the dimension of colloidal matter existing in the raw water. This further imposes on its removal using the above mentioned coagulants. In recent years, Al-based polymers are increasingly used in practice, as they have proved to be less sensitive to pH and temperature variation [10]. Furthermore, the coagulant dose needs to be optimized, in order to avoid the low-quality of the finished water, and even greater environmental (e.g., high sludge production) or human health (e.g., the potential of Alzheimer’s disease) impacts [6].
Polyhydroxy aluminum chloride (PACl) contains highly positive charged polycations, such as Al3+, [Al2(OH)2]4+, [Al8(OH)20]4+, [AlO4Al12(OH)24(H2O)12]7+, and other species [11,12]. These species have a great neutralization and destabilizing effect of NOM. An important characteristic of PACl coagulants is basicity, which controls the nature of the polymeric portion in PACl [13]. Several authors have investigated the influence of PACl basicity on coagulation efficacy. Zhang et al. [14] evaluated several synthesized PACl with basicity values between 63.4 and 90.3% in the coagulation process of a low temperature and low turbidity water. They observed a decrease in turbidity with an increase in PACl basicity. Another study reported a better turbidity removal with an increase in PACl basicity for a humic acid artificial water [15]. Moreover, the research of Yan et al. [16] indicated only a relatively better removal of NOM when using PACl with various basicity values on hydrophilic river waters with different alkalinities. The non-linear effect of PACl basicity on the coagulation performance in surface water treatment was also observed by Yang et al. [17]. Since the results are not conclusive, more research is needed regarding the efficiency of PACl coagulants having diverse basicity values, when applied to treating raw water with specific characteristics.
In real applications, the efficiency of coagulation and flocculation to remove NOM from surface water mainly depends on the coagulant’s type and dosage, pH value, mixing conditions, the water’s temperature, and the flocculant’s type and dosage, on one hand, and the properties of the NOM, on the other hand. It is known that low molecular weight NOM (i.e., hydrophilic moieties) usually require a higher coagulant dose than higher molecular weight NOM. This is because these compounds present a higher polarity and water solubility [4].
To better assess the nature of NOM and to successfully monitor these compounds throughout the technological processes, a few general parameters, including dissolved organic carbon (DOC), UV/Vis absorbance, and specific UV absorbance (SUVA), may be used [18,19].
The absorbance values recorded at different wavelengths, such as 254 nm, 280 nm, and 365 nm, are cited to distinguish the presence of certain components of NOM. Ratios of different absorbance values, like A254/A280 and A254/A365, represent specific parameters, which may be used to evaluate part of some humic substances with certain characteristics from a given sequence, e.g., the molecular weight, the high hydrophilic/hydrophobic ratio, and the degrees of reactivity in the presence of disinfection agents [19].
The absorbance recorded at a 254 nm wavelength (A254) indicates the concentration of organic compounds with aromatic groups or with extended conjugation [5,18].
The absorbance recorded at λ = 280 nm (A280) informs us of the presence of some unsaturated compounds with double bonds, π-π* interactions, and aromatic compounds with a high reactivity, which can interact with disinfection agents and form THMs. The A280 is associated, in particular, with the presence of precursors of THMs and HAAs [19].
The absorbance at 365 nm (A365) is a parameter correlated with the presence of aquatic humic compounds. It indicates the presence of some compounds resulting from aquatic heterotrophic metabolism, compounds with aromatic character, and nitrogen based functional groups. These compounds have a higher molecular weight and a more pronounced hydrophobic character in comparison with compounds characterized by A254 and A280 parameters [19].
SUVA, expressed in L/mg·m, is the ratio of absorbance at λ = 254 nm and the DOC concentration of the water sample [18,19]. A SUVA value of >4 indicates the presence of mainly hydrophobic and especially aromatic NOM, whilst a SUVA value of <3 suggests the existence of mainly hydrophilic NOM in raw water and drinking water [18,20].
The A254/A280 ratio allows the assessment of the compounds with the formation potential of THMs and HAAs during disinfection. The values of this ratio of approximately 1 indicate the predominant presence of compounds that can easily interact with chlorine [19]. The A254/A365 ratio can be correlated with the SUVA parameter, and the high values for the A254/A365 ratio are associated with the low values for SUVA [19].
This study presents a series of experiments obtained on a laboratory scale set up for the coagulation–flocculation of surface water from the Prut River, which is the drinking water supply for a city in northern Romania. The objectives of this study are: (a) to investigate the influence of the operational process parameters and water quality indicators (conventional and non-conventional, relevant for NOM removal) on the process performances in terms of removal efficiencies; (b) to select the optimum operating parameters for NOM removal under cold and warm conditions; and (c) to correlate the optimum coagulation–flocculation conditions (determined by laboratory experiments) with the principal component analysis. By means of an integrated approach, this study considers both the experimental coagulation–flocculation process efficiencies for NOM removal and the determination of the optimum conditions, with their statistical relevance.

2. Materials and Methods

2.1. Water Sampling and Characteristics

In order to evaluate the quality of the raw water from the drinking water treatment plant, the minimum, average, and maximum annual values of the quality indicators for the time period 2013–2020 were analyzed. The general characteristics of the raw water, namely the pH levels, oxidability (chemical oxygen demand, COD, determined with KMnO4), conductivity, turbidity, total hardness, ammonia, nitrates, nitrites, sulphates, and iron, are presented in Table 1. It was observed that the raw water quality does not always comply with the legislative requirements for conductivity, turbidity, and iron. Moreover, the average values for the turbidity and iron are between 5.8% and 169% higher than the maximum allowed concentrations (MACs). Meanwhile, the maximum recorded values were found to exceed the MACs by almost 5 times for iron and 7 times for turbidity, respectively.
Raw water samples for the coagulation–flocculation tests were collected from the water from the drain of the Prut River during a cold, dry season (December). The water parameters were analyzed according to the current Romanian Standard Methods for water quality analysis. Furthermore, the following unconventional parameters were calculated for monitoring the coagulation process: SUVA, A254/A280, and A254/A365.

2.2. Chemicals and Instruments

The water characteristics were determined in the Laboratory for Environmental Control and Analysis (LACMED) that is accredited by the Romanian Association for Accreditation (RENAR), under SR EN ISO/CEI 17025/2018. The total organic carbon (TOC) and dissolved organic carbon levels were measured using a Shimadzu VCPN-TNM1 TOC system. The A254, A280, and A365 were measured by a spectrophotometer (UV-VIS JASCO 630), using a quartz cell with a 1 cm path length, after filtration through a 0.45 µm membrane. Turbidity was measured using a 93703-11 HANNA HI turbidimeter, and the pH was measured using a C863 CONSORT multi-parameter, which was calibrated daily. Metal elements (Fe and Al) were analyzed using ContrAA 800G atomic absorption spectrometer (Analytik Jena), and the chemical oxygen demand was determined by a standard method (SR EN ISO 8467-2001).
The coagulation–flocculation experiments were carried out using a conventional jar test equipment (model JLT6 from VELP Scientifica) provided with a flat paddle impeller and variable speed.
The chemicals used for the experiments were polyhydroxy aluminum chloride (PACl), with the commercial name PAX XL 60 (Kemcristal, Romania), and polyacrylamide, with the commercial name FloPam AN 910 SEP (SNF, UK). Both chemicals were courteously provided by the local drinking water operator. PAX XL 60 is a medium basicity coagulant, with the formula Al(OH)x(CL)3−x (where x is in the range 0–2.3, typically x > 0.5). Additional characteristics of the coagulant can be found in Table S1, provided in the Supplementary Material of this article. The flocculant FloPam AN 910 SEP is an anionic polyacrylamide with a low charge density, very high molecular weight, and a pH of 6–8 (for 5 g/L).

2.3. Jar Test Procedure

In order to determine the optimal coagulant dose, coagulation–flocculation jar tests were performed, using raw water samples of 700 mL. The polyhydroxy aluminum chloride PAX XL 60 and the polyacrylamide FloPam AN 910 SEP were used as coagulant and flocculant (coagulant aid), respectively. All six coagulation–flocculation tests were realized at the natural pH level of the raw water. Several parameters, such as the coagulant dose, the river water temperature, the rapid and slow mixing time, and the presence or absence of the flocculant, were investigated. The coagulant dose varied in the range 50–200 μL/L (corresponding to 2–7 mg Al/L). Table 2 briefly presents the working conditions for the coagulation–flocculation tests.
After settling was completed, the samples of treated water were collected from the supernatant and analyzed. The removal efficiency (RE) of the coagulation–flocculation process was calculated using Equation (1), for a series of conventional water quality indicators, i.e., turbidity, COD, DOC, and residual aluminum concentration, and some unconventional parameters (A254, A280, and A365). The parameter of SUVA and the ratios A254/A280 and A254/A365 were also calculated:
R E   ( % ) = C i C f C i × 100
where Ci and Cf are the initial and the final concentration, for a certain water quality indicator, in mg/L or μg/L.

2.4. Chemometric Methods

Chemometric analysis of the experimental data was performed by correlation analysis and principal component analysis (PCA). The calculations and plots were made using the statistical language R (version 1.4.1106, RStudio PBC, Boston, MA, USA). The purpose of the correlation analysis was to determine the influence of the coagulant dose on the coagulation–flocculation efficiency at various operating conditions. The correlation maps were created using the corrplot package in R. Red and the blue circles correspond to positive and negative correlations, respectively. The color intensity and size of the circle reflect the magnitude of the correlation coefficients, which appear on the circles (between −1 and +1) [22]. The corrplots obtained are illustrated in Figures S4–S7 in the Supplementary Material. PCA is useful for reducing a large amount of data with minimal loss of information by using a set of principal components (PC). Thus, trends and correlations between data that are not easily obvious may appear. The original data covariance matrix in PCA is decomposed into scores (eigenvalues) that classify the samples and loadings (eigenvectors), classifying the descriptors in terms of their separation of the samples [23]. The PC are a combination of variables explaining the largest variation in the experimental data and may not have an obvious physical meaning. In this study, the PCA plots were created using the ggbiplot package in R and considered the relevant PC with scores over 1, unless otherwise stated.

3. Results and Discussion

3.1. Water Characterization

The raw water characteristics are presented in Table 3. The values obtained for the raw water quality indicators are representative of the medium–minimum range of values found in Table 1, and characteristic of the water quality in the dry season.
The values of the unconventional parameters considered in this study are also shown in Table 3. A water sample containing highly aromatic NOM presents the SUVA values over 4 mg/L [1]. A value of the SUVA indicator of 1.39 L/(mg∙m) suggests the presence of hydrophilic organic compounds in large quantities, with a low molecular weight and charge density. The hydrophobic fraction determined at λ = 280 nm is 1.4 times smaller than the total hydrophobic organic compounds (expressed as A254), indicating a high content of unsaturated compounds with double bonds, π-π* interactions, and high reactivity. The high A254/A365 value suggests a low content of hydrophobic organic compounds with a high molecular mass, when compared to the total NOM identified as A254 [19].

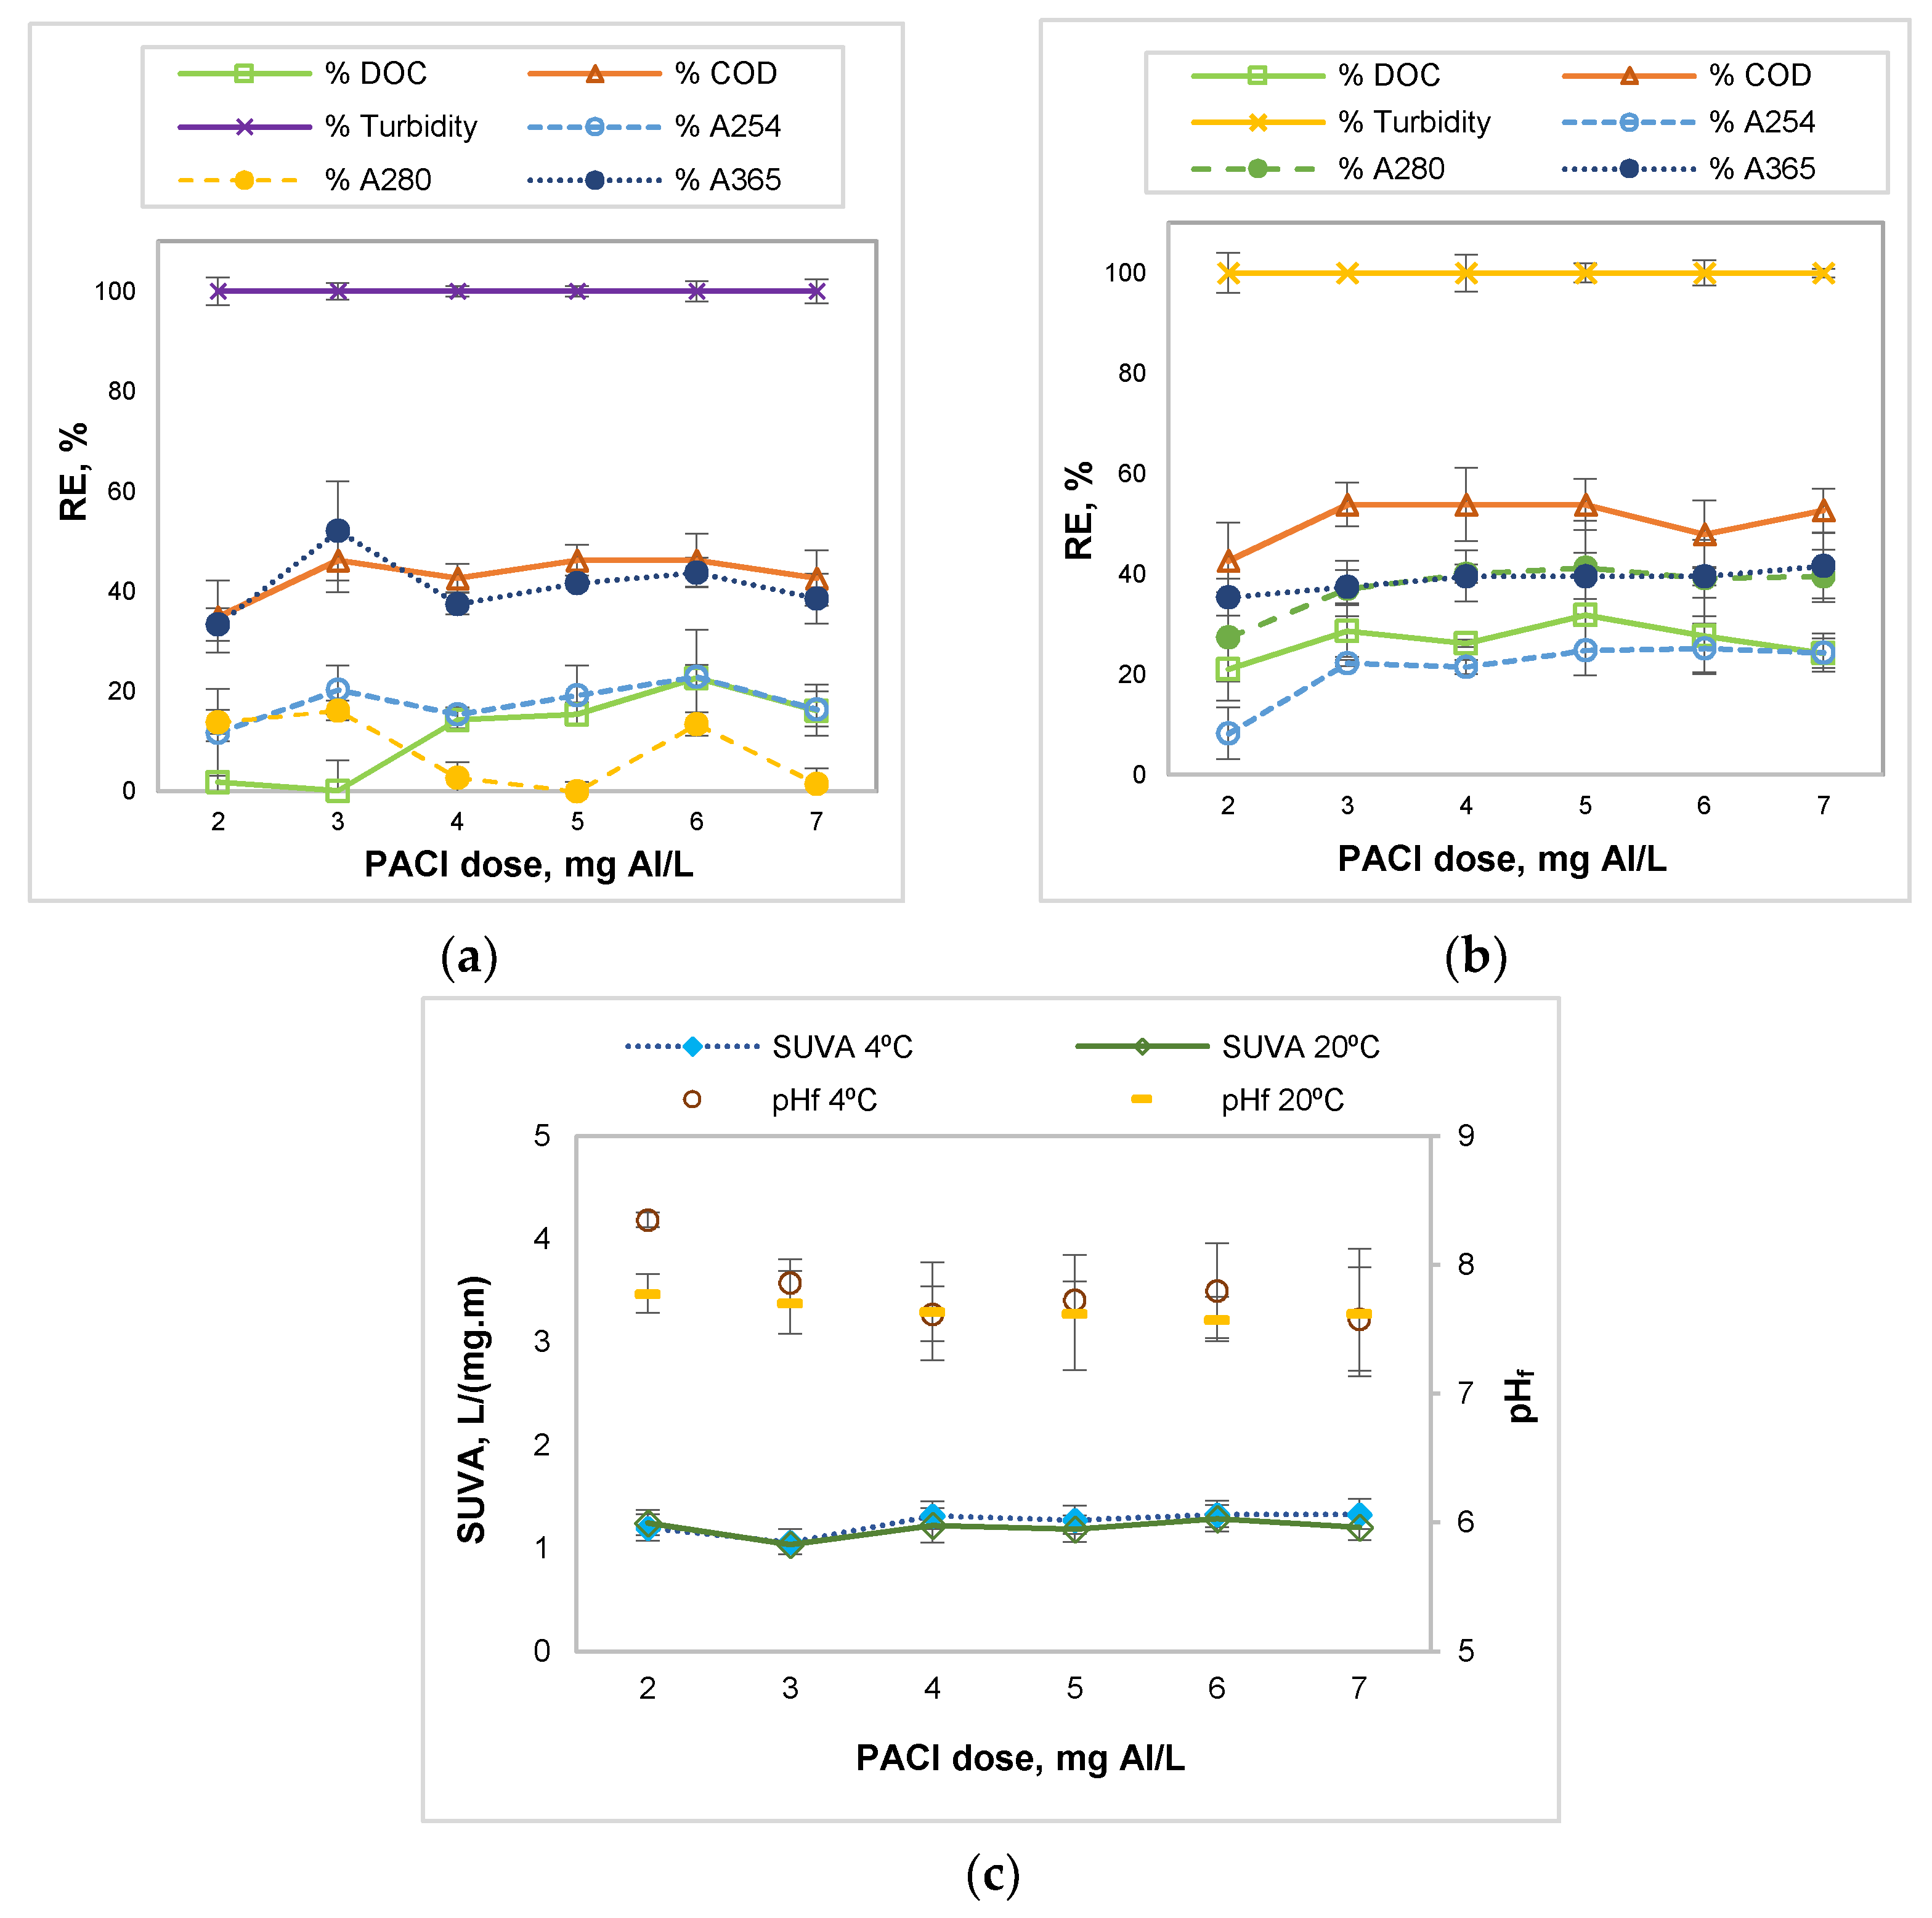
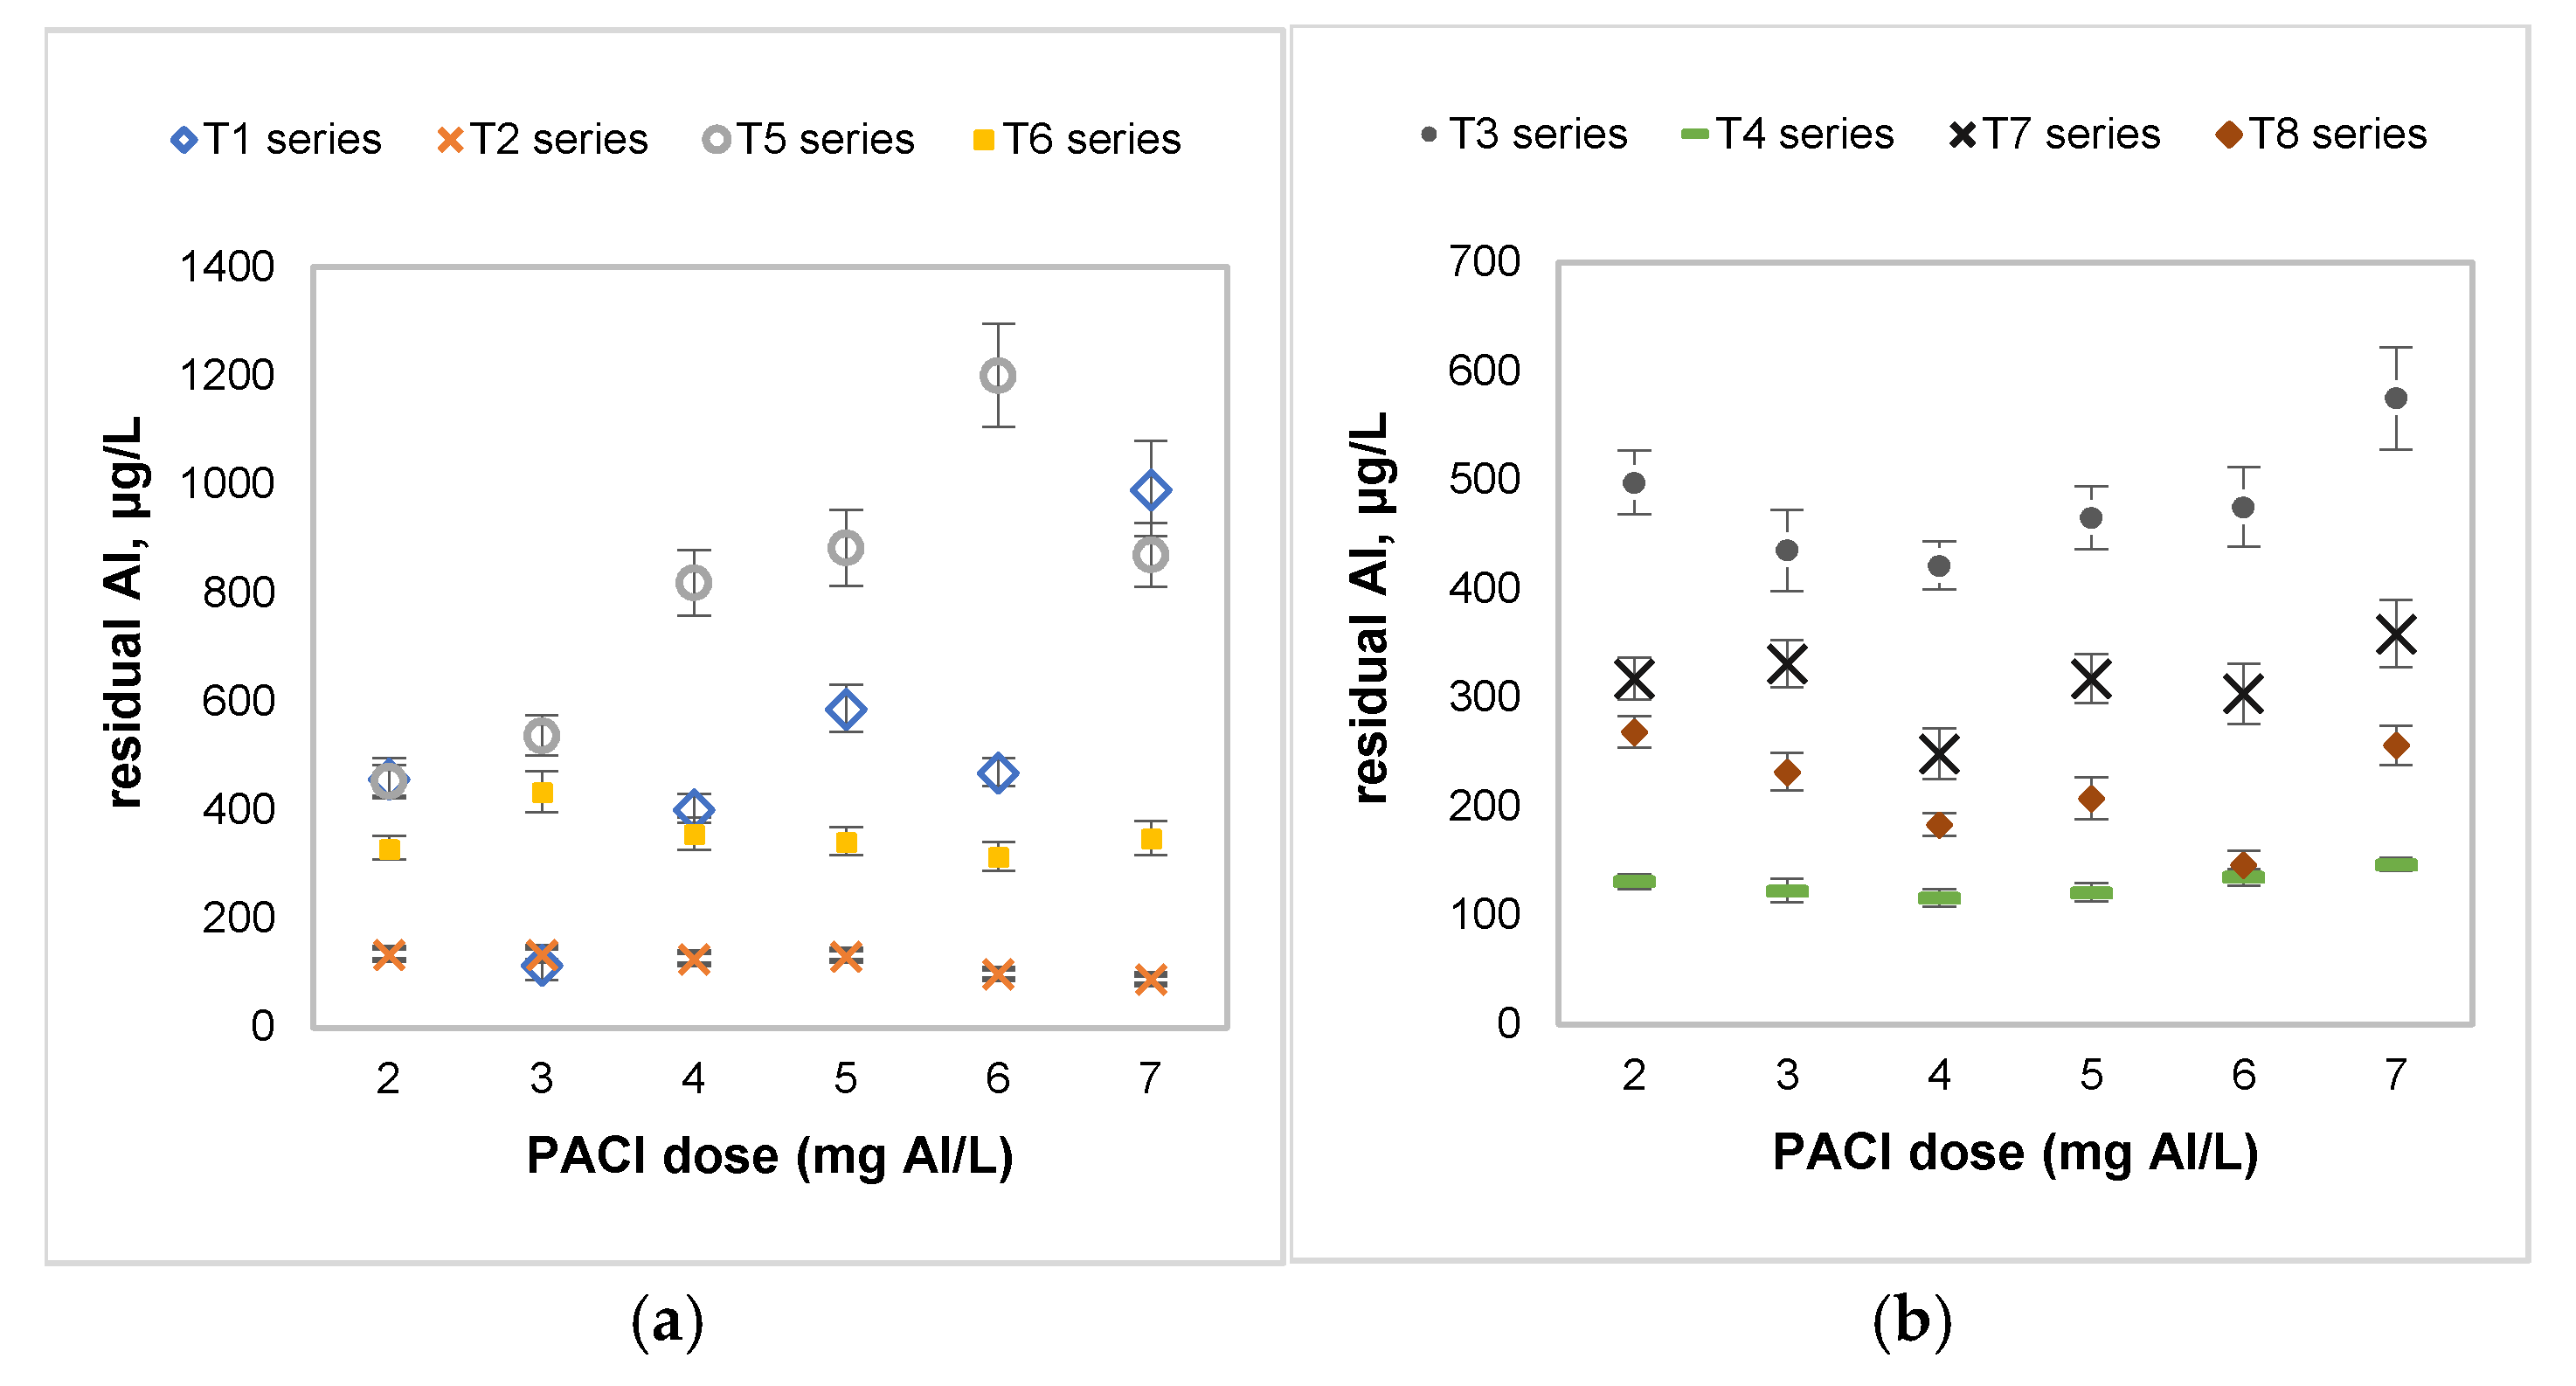
3.2. Influence of the Coagulant Dose

The removal efficiencies for the conventional water quality indicators after coagulation tests with a PACl dose of 2–7 mg Al/L are illustrated in Figure 1a,b.
It is evident that the colloids (turbidity) of the water sample were totally removed, independent of temperature. In fact, for all coagulation–flocculation tests in this study, turbidity was eliminated; hence, this indicator will not be mentioned in the rest of this section.
In case of COD, the removal efficiencies were below 53.85%. These values increased first with the coagulant dose, then reached a plateau, while at higher doses they decreased. When using the PACl coagulant for low-DOC river water, ref [24] have observed a decrease in efficiency for the coagulant dose over 3.48 mg Al/L, due to colloid re-stabilization. This trend was not observed when using alum as a coagulant.
In the case of efficiency removal in terms of COD, NOM content (expressed as A254), and DOC, the positive effect of the operating temperature can be observed.
The removal efficiencies obtained for the DOC parameter are mostly within the expected limits based on the initial SUVA value (<25%) [25], as shown in Figure 1a,b.
The NOM content decreased after coagulation, expressed by smaller values obtained at all the studied wavelengths (254, 280, and 365 nm) (Figure 1a,b). In general, the highest removal efficiencies of NOM (33.33–52.08%) were registered at 365 nm. The total NOM content, expressed as A254, was reduced between 8.27% and 25.26% vis-à-vis the value before coagulation. These reductions of the absorbance explain the higher values obtained in the example of the ratios A254/A280 and A254/A365 (Figure S1 in the Supplementary Materials).
It can be observed from Figure 1c that the SUVA values are quite close between the studied temperatures, especially at the PACl dose of <4mg Al/L. The correlation analysis shows a strong positive correlation between the SUVA and PACl dose at 4 °C (Figure S4a in the Supplementary Materials), which is explained by a marked increase in SUVA values up to 1.33 L/(mg∙m) after a coagulant dose higher than 4 mg Al/L. However, a weak correlation was found between the same parameters at 20 °C (Figure S4b in the Supplementary Materials), owning to the SUVA values being closer to each other.
From the correlation analysis, the coagulant dose shows a strong negative correlation with the DOC and pHf at low temperature coagulation tests (Figure S4a). At a higher temperature, a strong negative correlation was found between the PACl dose and the values for pHf and the NOM content (Figure S4b). The reader should be advised that the correlation analysis was performed by using the water quality indicator values and not the removal efficiency. This means that the sign of the correlation factor shown in Figure S4a,b will be the opposite to the trend presented in Figure 1a,b (i.e., a negative correlation coefficient means a positive dependency of removal efficiency).
The pH values, after the coagulation tests, decreased at a higher PACl dose, but not below the pH value of 7.58 (Figure 1c). The water pH influences both the efficiency of the coagulation process and the speciation of the NOM. At a neutral pH level, the dominant form of Al ions in an aqueous solution is aluminate, which is favorable for the charge neutralization of the dissolved NOM [10].
The residual aluminum in water was positively influenced by the pre-hydrolyzed coagulant dose (r = 0.54–0.72, Figure S4a,b) and the values after coagulation were over 403 μg/L (Figure 2). Similar values for the PACl coagulant were reported by [24].

3.3. Influence of the Polyelectrolyte Addition

Polyelectrolyte addition resulted in the forming of large, dense, and easily distinguished aggregates, which improved the settling rate. It was stated that an increased flocculation can be obtained as a result of bridge formation, when using an organic polyelectrolyte in the presence of an inorganic polymer with a high charge density [4]. The removal efficiencies in terms of the COD and DOC (Figure 3a,b) were two times higher than the values obtained from the coagulation experiments. In addition, as shown in Figure 2, the concentration of the residual aluminum was below 150 μg/L, which is lower than the Romanian legislative requirements, i.e., 200 μg/L. A study of the PACl application in the conventional treatment scheme (coagulation, sedimentation, and sand filtration) at a real scale was reported [26]. It was found that, in the presence of the high molecular weight anionic polyelectrolyte, the residual aluminum concentration was 60–90 μg/L.
Total NOM content, expressed as A254, was further reduced by up to approximately 40% at 20 °C (Figure 2a,b). A greater increase in NOM removal efficiency was observed at a low temperature, when comparing the removal efficiencies in terms of A254 and A280 (Figure 2a) with the experimental results from series T1 (Figure 1a). This fact may be explained by slower coagulation kinetics occurring at a low temperature [27,28]. The presence of a clarifying agent leads to improved sedimentation rates, by joining destabilized particles together and increasing their weight [29]. This proves the necessity of the addition of the polyelectrolyte, especially in cold weather conditions.
At 4 °C, the SUVA values were lower than those obtained from the coagulation experiments, as seen in Figure 2c. An opposite trend can be observed for the SUVA values at 20 °C, due to the lower values obtained for the DOC.
In comparison with the coagulation tests, the content of high-molecular weight hydrophobic NOM fraction measured at 365 nm did not significantly reduce in the presence of the polyelectrolyte (Figure 2a,b). Thus, the lower values for the A254/A365 ratio are explained by the change in the A254 values (Figure S1 in the Supplementary Materials). Moreover, the ratio A254/A280 presents similar values to the results of the tests for series T1 and T3.
In this case, the PACl influenced the residual pH and NOM content at both temperatures, presenting a strong negative correlation (Figure S5a,b in the Supplementary Materials).

3.4. Influence of Mixing Conditions

The mixing conditions (agitation time and mixing intensity) are important factors affecting the performance of the coagulation–flocculation process. In the rapid mixing stage, an efficient homogeneous dispersion of the polyelectrolyte should be performed in the shortest practicable time. Furthermore, the slow mixing allows for the collision between the small flocs, causing their subsequent aggregation, ideally without breaking. Mixing conditions that are either too high or too low result in flocculation that is only partial [30].
In order to investigate the influence of the agitation time, C/F experiments were also performed at the short agitation time of 1.5 min at 300 rpm for rapid mixing and 10 min at 60 rpm for slow mixing, considering different coagulant doses and temperatures. The experimental results are illustrated in Figures S2 and S3 in the Supplementary Materials.
By reducing the mixing to approximately half of the agitation time, the removal efficiencies at a lower temperature were reduced, by average, with 5.8% for COD, 2.15% for DOC, and 5.7% for A280, compared to the RE% at a longer agitation time (series T2, Figure S2a). Higher RE% were obtained for the total NOM content (as A254) and the NOM fraction with a high molecular weight (as A365): 4.7% and 5.9%, respectively (average values).
At 20 °C, the RE% for short time tests, i.e., series T7, were lower than series T4 (shown in Figure S2b) on average, with 1.6% for COD, 7% for DOC, and 23% for the high-reactive NOM (as A280). The increase in the A280 values also explains the lower A254/A280 ratios obtained (Figure S1a). In this case, the RE% also increased for A254 and A365 on average by 2% and 6.9%, respectively.
The most noticeable effect of the short time agitation was observed on the residual aluminum concentrations (Figure 2). At a lower temperature, this indicator was found to be in the range of 454.6–1201.2 μg/L, resulting in a 7.05-fold increase on average as compared to the results from T1 experimental series.
A strong negative correlation was found between the coagulant dose and NOM content at both temperatures studied (Figure S6a,b in the Supplementary Materials).
In order to study the mixing intensity, experiments at a lower mixing intensity (at 200 rpm for rapid mixing and 25 rpm for slow mixing) were also performed. The removal efficiencies of the water quality indicators are shown in Figure S3 in the Supplementary Materials. The RE% in terms of COD were in the range of 45.56–60.36% at 4 °C and 45.56–63.91% at 20 °C, which are lower in general than the values obtained in series T2 and T4. Moreover, the removal efficiency expressed as DOC decreased by 14% and 23.9% at 4 °C and 20 °C, respectively.
Regarding the NOM content, differences were noticed for the high reactivity dissolved compounds (as A280) when the efficiency was reduced, on average, by 14.9% compared to the data from series T4 (Figure S3b). The residual Al also presented higher levels under a low mixing intensity, as shown in Figure 2.
The correlation analysis at both temperatures indicated that the PACl dose strongly correlated with the pHf and the NOM content (Figure S7a,b in the Supplementary Materials).
These results indicate the inadequate mixing conditions, causing an inhomogeneous distribution of the polyelectrolyte. It was reported by [30] that the slow mixing intensity positively influences the charge neutralization coagulation when compared to sweep flocculation. Moreover, charge neutralization coagulation requires a longer slow mixing duration.
Based on the results described until now, the optimum mixing conditions are 3 min at 300 rpm for rapid mixing and 15 min at 60 rpm for slow mixing.

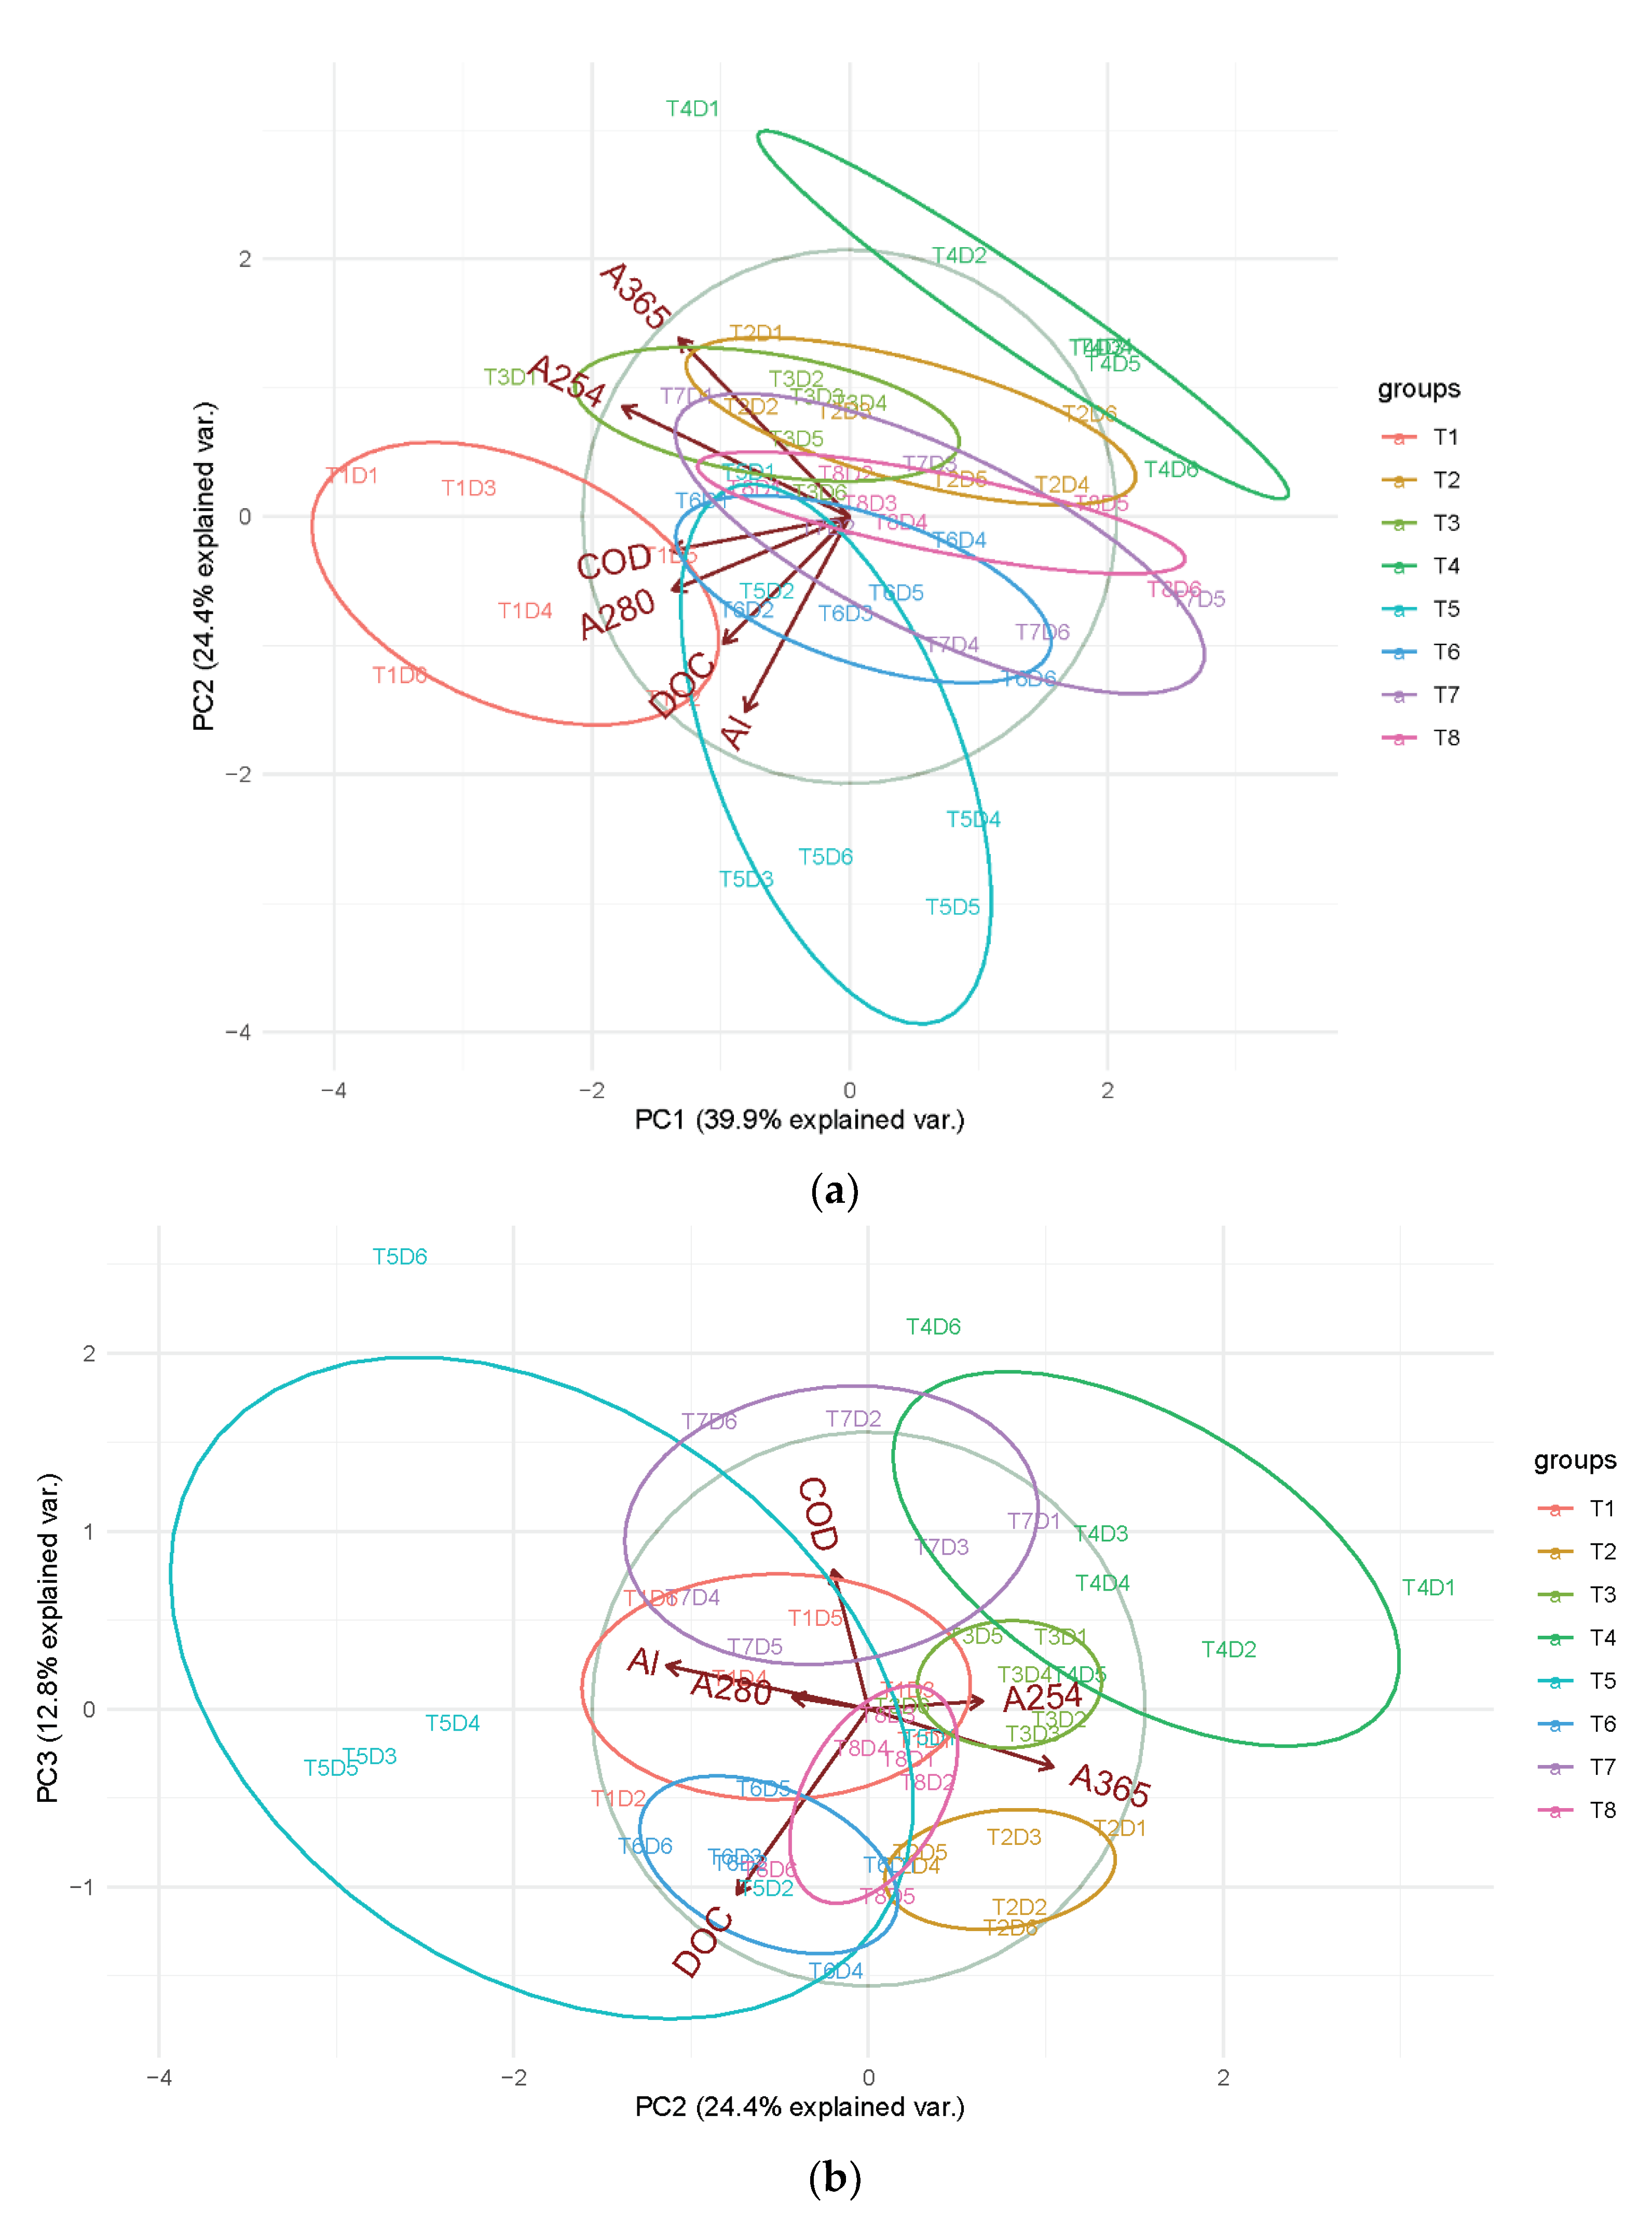
3.5. Principal Component Analysis

Principal component analysis was performed, first, for the tests at each temperature separately and, then, taking into account all tests.
The results of the PCA for the experiments performed in cold conditions (series T1, T2, T5, and T6) are presented in Figure S8 of the Supplementary Materials. It can be observed that PC1 captures 41.2% of the total variance, while PC2 captures 24.0%, and PC3 captures 20.0%. PC1 is negatively correlated with all quality indicators. In Figure S8a, a cluster can be seen on the negative side of PC1, corresponding to the T1 experimental series, when no polyelectrolyte was added. The experiments using polyelectrolyte, namely T2, T5, and T6, have predominantly positive scores for PC1. Another distinguishable cluster is reflected in the T2 series, and has negative scores for PC2. This experimental series was performed under the same conditions as T1, but with the addition of polyelectrolyte.
PC2 presents a strong and positive influence of residual Al and COD and is affected negatively by A365. In Figure S8b, PC3 shows a stronger positive influence by DOC and a smaller negative effect of A254 and A280. Here, we notice two clusters: the T2 series on the negative side of PC2 and the T6 series on the positive side of PC3. These experiments present the influence of mixing intensity. The wide spread of the T5 series (short mixing time) is due to higher values for residual Al and A280.
The principal component analysis of the experiments performed at 20 °C also resulted in three principal components explaining the total variance in the experimental data (Figure S9 in Supplementary Materials). PC1 (41.5%) is influenced negatively by all quality indicators, similar to the PCA results for the C/F experiments at 4 °C. A strong negative effect can be seen for A254, A365, and residual Al concentration. PC2 explains 21.6% of the variance and is positively influenced by DOC and A280. The third principal component can explain 17.3% of the variant and expresses a positive influence by COD and A280. In Figure S9a, the negative side of PC2 is related to low values for all the quality indicators and to the T4 experimental series, reflecting the optimal mixing conditions. The coagulation experiments (without the addition of polyelectrolyte) can be noticed separately on the negative side of PC1, while the C/F tests are mainly aggregated on the positive side. The PCA plot in Figure S9b indicates a more noticeable discrimination of the experimental series, although T7 and T8 remain as a duo of bad mixing conditions.
When we consider the PCA for all tests at both temperatures, discrimination is not that readily seen, except for in a few tests, as shown in Figure 4a. PC1 explains 39.9% of the total variance and is positively influenced by all the indicators considered. The second PC can explain 24.4% of the variance in the dataset. PC2 is positively influenced by A254 and A365 and negatively influenced by COD, A280, DOC, and the residual Al concentration.
The PCA at both temperatures corroborates with the optimal conditions of T2 (limited and at a dose of >5 mg Al/L) and T4 tests, as they appear on the lower side of the parameters. On the opposite side, T1 and T5 (both at a low temperature) can be distinguished, due to the higher values of COD and A280, and the residual aluminum concentration, respectively. It can be observed that T3 at a higher dose of PACl is similar to T2 at a lower coagulant dose. This, once again, confirms the influence of ambient temperature and polyelectrolyte presence on the efficiency of the coagulation process.
In order to verify if further discrimination of the dataset is possible, another principal component, PC3, was considered (eigenvalue of 0.87). PC3 (12.8%) is negatively influenced by DOC and A365. Figure 4b indicates that a segregation between T2 and T3 was indeed achieved. This occurred because of a lower influence of A254 on PC2 and PC3, than on PC1.

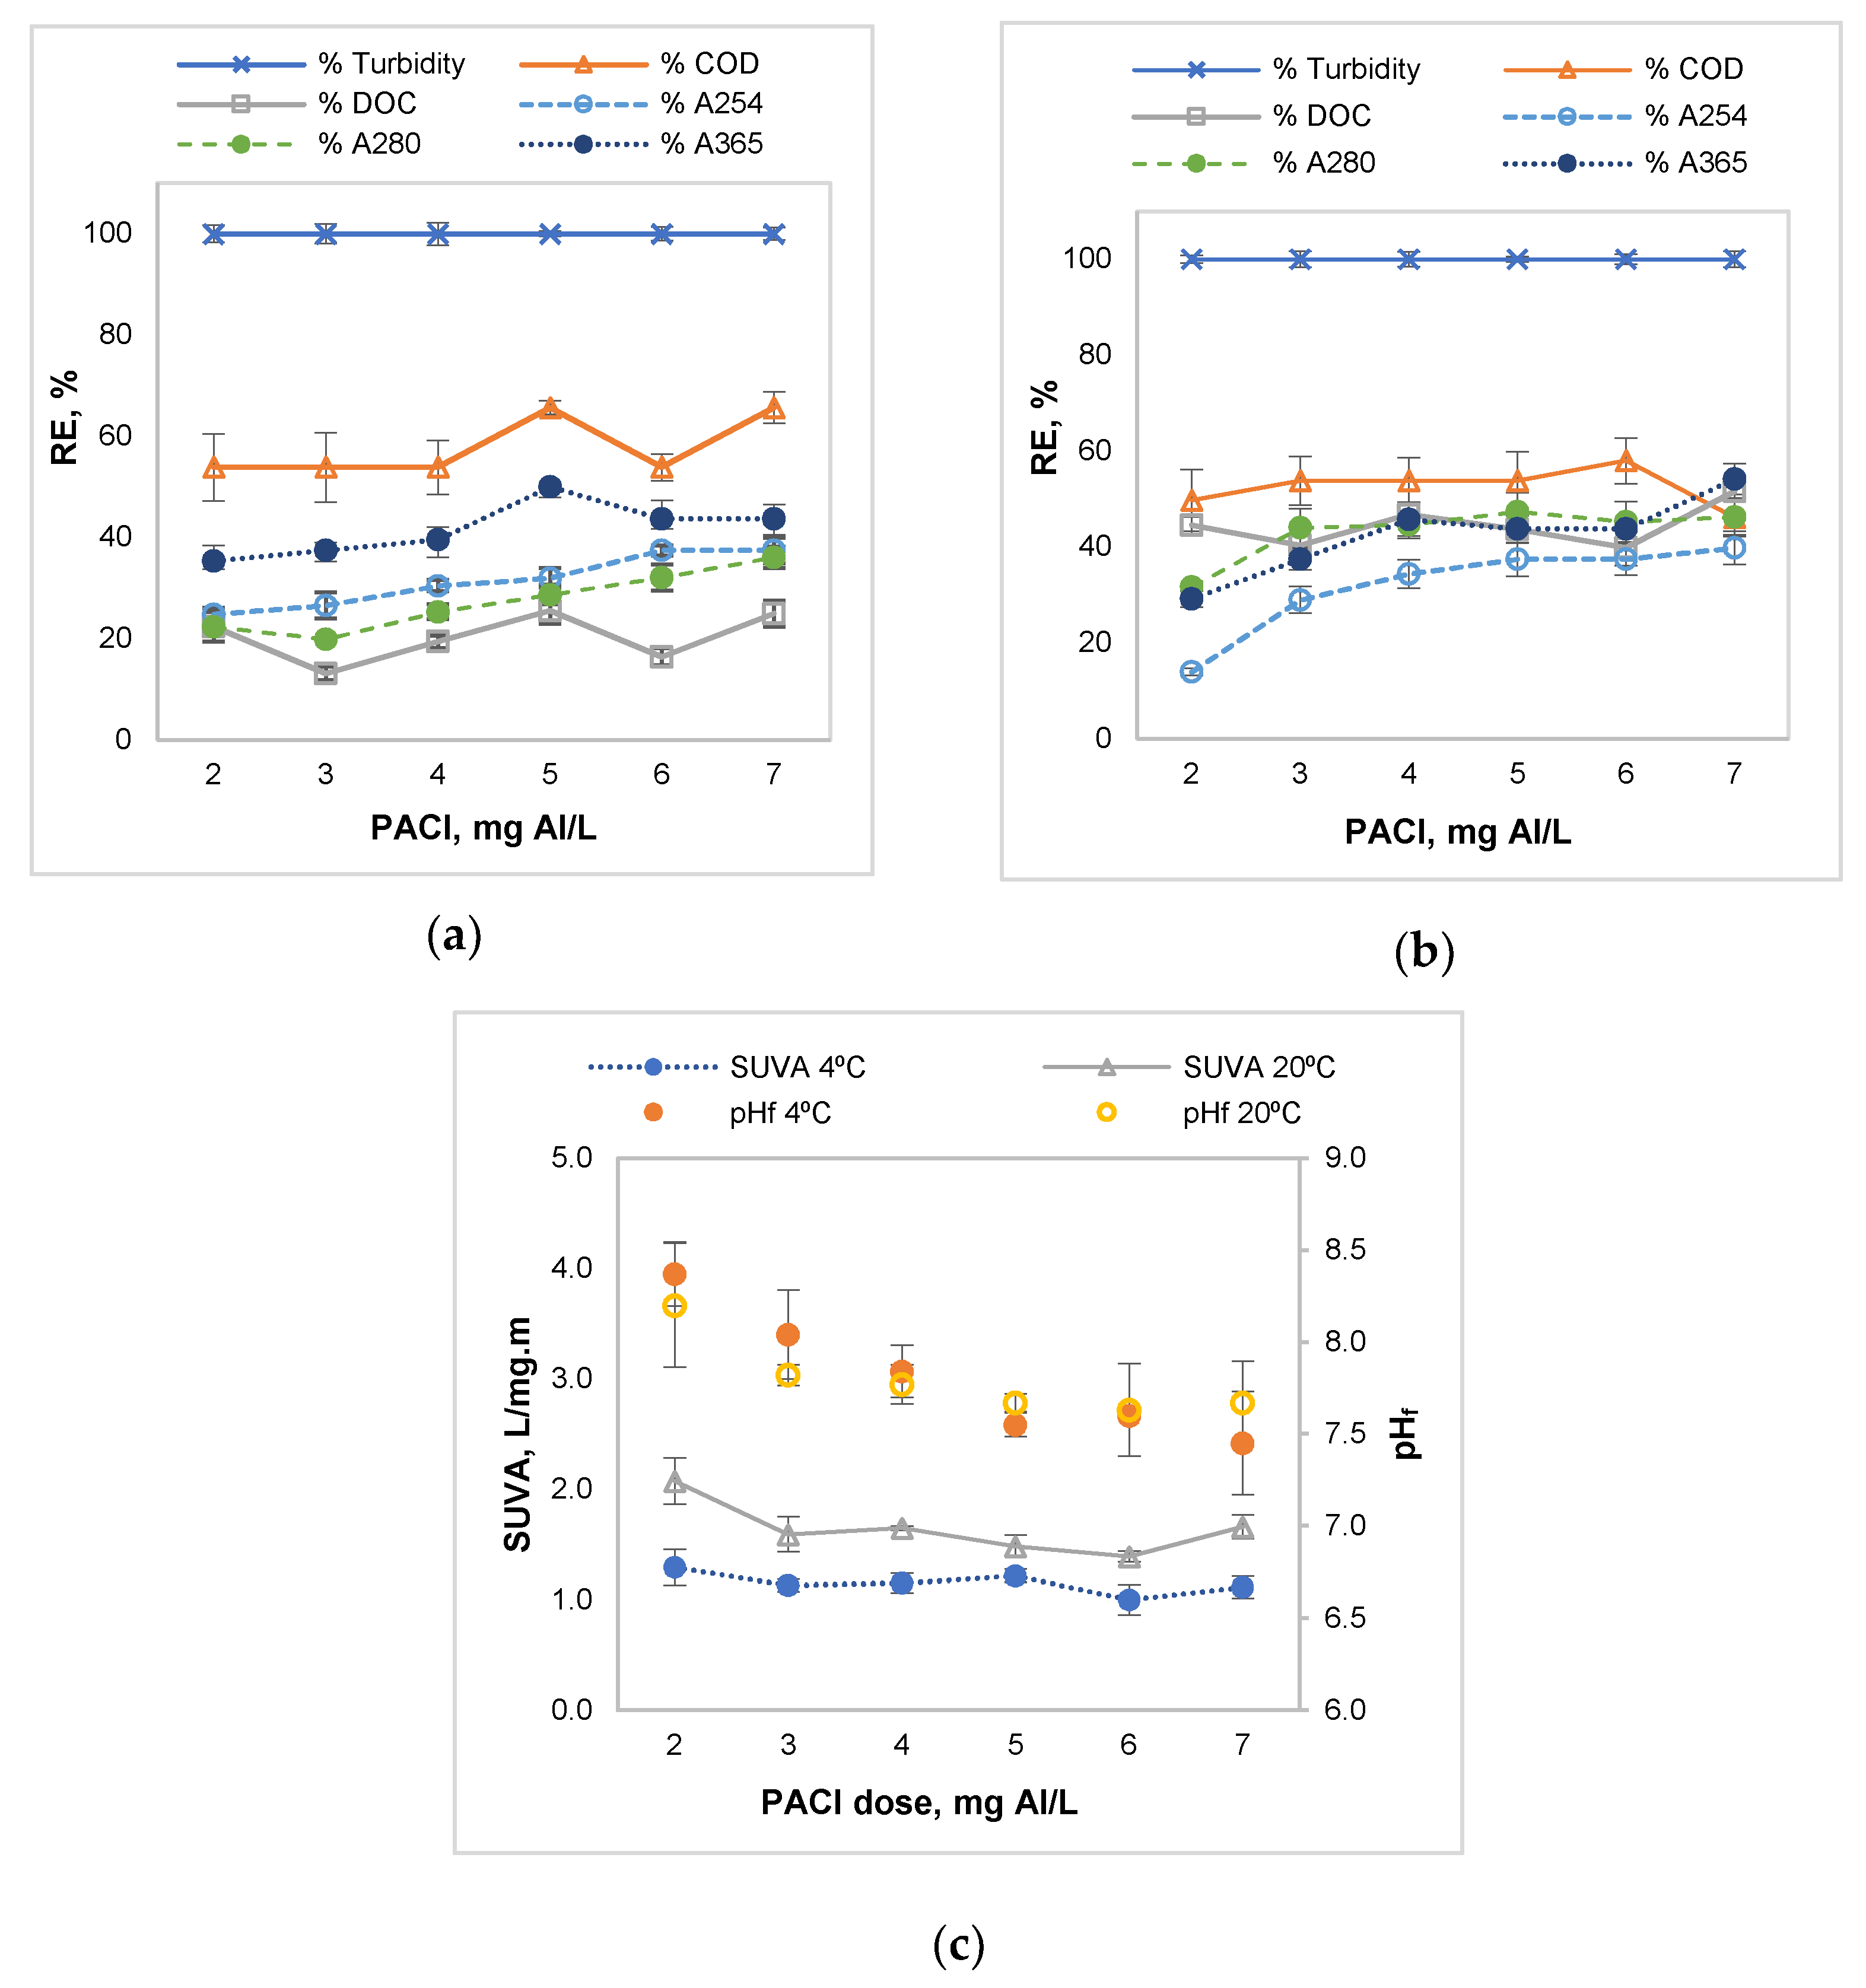
3.6. Selecting the Optimum Coagulant Dose

In a coagulation–flocculation process, the coagulant dose is one of the decisive factors of influence to achieve a high NOM removal efficiency and to prevent the propagation of disinfection by-product precursors. Recently, Lapointe et al. [31] used NOM fractionation to establish the choice of coagulant, in order to reduce the presence of disinfection by-product precursors. In their optimization, humic substances (hydrophobic fraction) and their breakdown products (more hydrophilic in nature) were considered, together with traditional water parameters like: DOC (as a measure of total NOM), turbidity, and filterable Al/Fe. In our study, we considered UV absorbance at different wavelengths (at 254 nm, 280 nm, 365 nm, and their ratios) to assess the optimal coagulant dose for water with low hydrophobicity. We found that, after coagulation, the SUVA values decreased compared to the initial value, suggesting the removal of unsaturated organic compounds from the water [32]. The lowest SUVA values corresponded to the lowest A254 values (reflective of lignin and humic compounds [17]) and the highest DOC values. If, at cold temperature, the SUVA levels decrease further after polyelectrolyte addition, in warm conditions, this parameter showed no significant change, despite the lower values of A254 and DOC. In this case, the absorbance values at 280 nm and 365 nm and, respectively, the ratios of A254/A280 and A254/A365 could be informative. As the absorbance values decreased, their relative contribution to the total NOM, expressed as A254, was higher (lower ratio values).
A280 is believed to be indicative of phenol, benzene, and amino acids [33], while A365 corresponds to humic compounds with a high molecular weight. The increase in A254 relative to A280 signifies an improved efficiency for these unsaturated compounds. In correlation with the lower values of A280, the higher values of the A254/A365 ratio may suggest an increase in the fraction of NOM with a high molecular weight, after the removal of some protein-like compounds.
The removal efficiency of A365 was higher than A280 for all coagulant doses in cold water, suggesting that a high molecular weight NOM requires a lower coagulant dose than the low molecular weight NOM. Since the former values have a predominantly higher proportion of negative charge per unit size and, hence, greater solubility, a higher dose of coagulant will be needed to achieve a higher driving force for the coagulation [4]. A similar situation can be described in the case of the first coagulant dose (i.e., 2 mg Al/L) for the experiments performed at a higher temperature.
For the selection of the optimum coagulant dose, we have considered the performance regarding the removal efficiencies for the more traditional quality indicators and the NOM content. In this evaluation, turbidity was excluded, based on the very high efficiency obtained, showing no influence in either choice. The evaluation of the optimal PACl dose is presented in Table S2 of the Supplementary Materials. According to the results, the PACl optimum dose was different at a lower temperature than at a higher one. A higher dose is necessary for a better C/F performance in cold conditions. A minimum performance score was obtained for a dose of 7 mg Al/L; however, a dose of 5 mg/L is recommended for reasons relating to the cost and environmental impact. An optimum dose of 4 mg Al/L was identified for warm water. Table 4 presents a short overview of Al-based coagulants used for the treatment of raw water that has specific characteristics, e.g., a low turbidity, and/or low temperature, and/or hydrophilic NOM, together with the considered water parameters to express the coagulation efficiency.

4. Conclusions

In this study, the efficiency of coagulation–flocculation for removing NOM from Prut River water was investigated.
Turbidity was removed completely after coagulation, with or without coagulant aid. The coagulant dose in the range of 2–7 mg Al/L did not generate an effluent pH value lower than 7, while the residual aluminum concentration was affected by the PACl dose, mixing conditions, and temperature.
The coagulant aid (polyelectrolyte) used to improve the effluent quality, decreased the values for all indicators. This trend was more noticeable for the coagulation–flocculation process at a lower temperature.
A shorter agitation time and lower mixing intensity produced inconsistent results, as some of the indicators, like DOC, COD, and A280, presented, on average, lower values than the optimum conditions tests. Moreover, the water quality was improved in terms of residual aluminum, A254, and A365.
The coagulant dose was found to be strongly correlated with different effluent quality indicators, depending on temperature, agitation time, and mixing intensity. Under optimum mixing conditions and in the presence of the coagulant aid, PACl dose manifested a strong negative influence on the NOM content (expressed as A254, A280, and A365), and the effluent pH, respectively. In cold conditions, the residual aluminum concentration in the water was also significantly impacted by the variation of coagulant dosage.
The principal component analysis showed that the efficiency of coagulation–flocculation experiments performed at non-optimal mixing conditions were similar to the coagulation experiments without the coagulant aid. The C/F at optimal working conditions discriminated from the other tests. Further work is necessary to relate these findings with the coagulation–flocculation mechanisms.

Supplementary Materials

The following materials are available online at https://www.mdpi.com/article/10.3390/w13213073/s1, Figure S1: Absorbance ratios after the coagulation-flocculation tests: (a) A254/A280 ratio, (b) A254/A365; Figure S2: Removal efficiency of coagulation-flocculation process at 4 °C (a) and 20 °C (b) under short agitation time; Figure S3: Removal efficiency of coagulation-flocculation process at 4 °C (a) and 20 °C (b) under low mixing intensity; Figure S4: Correlation plots for test series T1 (a) and T3; Figure S5: Correlation plots for test series T2 (a) and T4 (b); Figure S6: Correlation plots for test series T5 (a) and T7 (b); Figure S7: Correlation plots for test series T6 (a) and T8 (b); Figure S8: Principal component analysis for coagulation-flocculation tests at 4 °C: (a) PC2 vs PC1 and (b) PC3 vs PC2; Figure S9: Principal component analysis for coagulation-flocculation tests at 20 °C: (a) PC2 vs PC1 and (b) PC3 vs PC2; Table S1: Characteristics of PAX XL 60 coagulant used; Table S2: Coagulation-flocculation efficiency scores considering multiple water quality indicators.

Author Contributions

Conceptualization, C.P.M., I.M., and C.T.; methodology, C.P.M., I.M., and C.T.; validation, I.M., C.P.M., and M.A.-R.; formal analysis, I.M., C.P.M., and M.A.-R.; investigation, I.M., R.C., A.G., O.P., and I.R.; data curation, I.M.; writing—original draft preparation, C.P.M., and I.M.; writing—review and editing, C.T.; supervision, C.T.; project administration, C.P.M., and C.T.; funding acquisition, C.T., and C.P.M. All authors have read and agreed to the published version of the manuscript.

Funding

This research was funded by a grant from the Ministry of Research, Innovation and Digitization, CNCS/CCCDI–UEFISCDI, project number PN-III-P2-2.1-PED-2019-1996, within PNCDI III.

Institutional Review Board Statement

Not applicable.

Informed Consent Statement

Not applicable.

Data Availability Statement

Not applicable.

Conflicts of Interest

The authors declare no conflict of interest.

References

  1. Sillanpää, M.; Matilainen, A.; Lahtinen, T. Characterization of NOM. In Natural Organic Matter in Water; Elsevier: Amsterdam, The Netherlands, 2015; pp. 17–53. ISBN 9780128015032. [Google Scholar]
  2. Adusei-Gyamfi, J.; Ouddane, B.; Rietveld, L.; Cornard, J.-P.; Criquet, J. Natural organic matter-cations complexation and its impact on water treatment: A critical review. Water Res. 2019, 160, 130–147. [Google Scholar] [CrossRef] [Green Version]
  3. Jones, A.N.; Bridgeman, J. A fluorescence-based assessment of the fate of organic matter in water treated using crude/purified Hibiscus seeds as coagulant in drinking water treatment. Sci. Total Environ. 2019, 646, 1–10. [Google Scholar] [CrossRef] [Green Version]
  4. Dayarathne, H.N.; Angove, M.J.; Aryal, R.; Abuel-Naga, H.; Mainali, B. Removal of natural organic matter from source water: Review on coagulants, dual coagulation, alternative coagulants, and mechanisms. J. Water Process Eng. 2021, 40, 101820. [Google Scholar] [CrossRef]
  5. Brezinski, K.; Gorczyca, B. Multi-spectral characterization of natural organic matter (NOM) from Manitoba surface waters using high performance size exclusion chromatography (HPSEC). Chemosphere 2019, 225, 53–64. [Google Scholar] [CrossRef] [PubMed]
  6. Sillanpää, M.; Ncibi, M.C.; Matilainen, A.; Vepsäläinen, M. Removal of natural organic matter in drinking water treatment by coagulation: A comprehensive review. Chemosphere 2018, 190, 54–71. [Google Scholar] [CrossRef] [PubMed]
  7. Gilca, A.F.; Teodosiu, C.; Fiore, S.; Musteret, C.P. Emerging disinfection byproducts: A review on their occurrence and control in drinking water treatment processes. Chemosphere 2020, 259, 127476. [Google Scholar] [CrossRef]
  8. Directive (EU) 2020/2184 of the European Parliament and of the Council of 16 December 2020 on the Quality of Water Intended for Human Consumption (Recast), OJ L 435, 23.12.2020, pp. 1–62. Available online: https://eur-lex.europa.eu/eli/dir/2020/2184/oj (accessed on 10 June 2021).
  9. Xiao, F.; Ma, J.; Yi, P.; Huang, J.-C.H. Effects of low temperature on coagulation of kaolinite suspensions. Water Res. 2008, 42, 2983–2992. [Google Scholar] [CrossRef]
  10. Go, R.J.C.; Yang, H.L.; Kan, C.C.; Ong, D.C.; Garcia-Segura, S.; de Luna, M.D.G. Natural organic matter removal from raw surface water: Benchmarking performance of chemical coagulants through excitation-emission fluorescence matrix spectroscopy analysis. Water 2021, 13, 146. [Google Scholar] [CrossRef]
  11. Wang, C.; Alpatova, A.; McPhedran, K.N.; Gamal El-Din, M. Coagulation/flocculation process with polyaluminum chloride for the remediation of oil sands process-affected water: Performance and mechanism study. J. Environ. Manag. 2015, 160, 254–262. [Google Scholar] [CrossRef] [PubMed]
  12. Yan, M.; Wang, D.; Ni, J.; Qu, J.; Chow, C.W.K.; Liu, H. Mechanism of natural organic matter removal by polyaluminum chloride: Effect of coagulant particle size and hydrolysis kinetics. Water Res. 2008, 42, 3361–3370. [Google Scholar] [CrossRef]
  13. Lin, J.-L.; Huang, C.; Chin, C.-J.M.; Pan, J.R. Coagulation dynamics of fractal flocs induced by enmeshment and electrostatic patch mechanisms. Water Res. 2008, 42, 4457–4466. [Google Scholar] [CrossRef] [PubMed]
  14. Zhang, Z.; Jing, R.; He, S.; Qian, J.; Zhang, K.; Ma, G.; Chang, X.; Zhang, M.; Li, Y. Coagulation of low temperature and low turbidity water: Adjusting basicity of polyaluminum chloride (PAC) and using chitosan as coagulant aid. Sep. Purif. Technol. 2018, 206, 131–139. [Google Scholar] [CrossRef]
  15. Zhao, Y.X.; Phuntsho, S.; Gao, B.Y.; Yang, Y.Z.; Kim, J.-H.; Shon, H.K. Comparison of a novel polytitanium chloride coagulant with polyaluminium chloride: Coagulation performance and floc characteristics. J. Environ. Manag. 2015, 147, 194–202. [Google Scholar] [CrossRef]
  16. Yan, M.; Wang, D.; Yu, J.; Ni, J.; Edwards, M.; Qu, J. Enhanced coagulation with polyaluminum chlorides: Role of pH/Alkalinity and speciation. Chemosphere 2008, 71, 1665–1673. [Google Scholar] [CrossRef]
  17. Yang, Z.; Gao, B.; Cao, B.; Xu, W.; Yue, Q. Effect of OH/Al3+ ratio on the coagulation behavior and residual aluminum speciation of polyaluminum chloride (PAC) in surface water treatment. Sep. Purif. Technol. 2011, 80, 59–66. [Google Scholar] [CrossRef]
  18. Pan, Y.; Li, H.; Zhang, X.; Li, A. Characterization of natural organic matter in drinking water: Sample preparation and analytical approaches. Trends Environ. Anal. Chem. 2016, 12, 23–30. [Google Scholar] [CrossRef]
  19. Masu, S.; Burtica, G.; Manea, F.; Pisoi, I. Spectrophotometric parameters for organic matter characterization in raw and treated surface water. Environ. Eng. Manag. J. 2011, 10, 1451–1457. [Google Scholar] [CrossRef]
  20. Matilainen, A.; Gjessing, E.T.; Lahtinen, T.; Hed, L.; Bhatnagar, A.; Sillanpää, M. An overview of the methods used in the characterisation of natural organic matter (NOM) in relation to drinking water treatment. Chemosphere 2011, 83, 1431–1442. [Google Scholar] [CrossRef] [PubMed]
  21. Law 458/2002 on Drinking Water Quality, Modified and Republished in Romanian Official Monitor No. 705, Bucharest, Romania. Available online: http://legislatie.just.ro/Public/DetaliiDocument/37723 (accessed on 26 May 2021).
  22. RStudio. RStudio: Integrated Development for R; RStudio: Boston, MA, USA, 2021. [Google Scholar]
  23. Boubchir, M.; Aourag, H. Materials genome project: The application of principal component analysis to the formability of perovskites and inverse perovskites. Comput. Condens. Matter 2020, 24, e00495. [Google Scholar] [CrossRef]
  24. Iriarte-Velasco, U.; Álvarez-Uriarte, J.I.; González-Velasco, J.R. Enhanced coagulation under changing alkalinity-hardness conditions and its implications on trihalomethane precursors removal and relationship with UV absorbance. Sep. Purif. Technol. 2007, 55, 368–380. [Google Scholar] [CrossRef]
  25. Edzwald, J.K.; Tobiason, J.E. Enhanced coagulation: Us requirements and a broader view. Water Sci. Technol. 1999, 40, 63–70. [Google Scholar] [CrossRef]
  26. Zouboulis, A.; Traskas, G.; Samaras, P. Comparison of Efficiency between Poly-aluminium Chloride and Aluminium Sulphate Coagulants during Full-scale Experiments in a Drinking Water Treatment Plant. Sep. Sci. Technol. 2008, 43, 1507–1519. [Google Scholar] [CrossRef]
  27. Qiao, G.; Zhang, J.; Zhang, Q.; Feng, X.; Lu, Y.; Feng, W. The Influence of Temperature on the Bulk Settling of Cohesive Sediment in Still Water with the Lattice Boltzmann Method. Water 2019, 11, 945. [Google Scholar] [CrossRef] [Green Version]
  28. Fitzpatrick, C.S.B.; Fradin, E.; Gregory, J. Temperature effects on flocculation, using different coagulants. Water Sci. Technol. 2004, 50, 171–175. [Google Scholar] [CrossRef]
  29. Maćczak, P.; Kaczmarek, H.; Ziegler-Borowska, M. Recent Achievements in Polymer Bio-Based Flocculants for Water Treatment. Materials 2020, 13, 3951. [Google Scholar] [CrossRef]
  30. Zhang, Z.; Liu, D.; Hu, D.; Li, D.; Ren, X.; Cheng, Y.; Luan, Z. Effects of slow-mixing on the coagulation performance of polyaluminum chloride (PACI). Chin. J. Chem. Eng. 2013, 21, 318–323. [Google Scholar] [CrossRef]
  31. Lapointe, M.; Papineau, I.; Peldszus, S.; Peleato, N.; Barbeau, B. Identifying the best coagulant for simultaneous water treatment objectives: Interactions of mononuclear and polynuclear aluminum species with different natural organic matter fractions. J. Water Process Eng. 2021, 40, 101829. [Google Scholar] [CrossRef]
  32. Zhao, Y.X.; Gao, B.Y.; Shon, H.K.; Cao, B.C.; Kim, J.-H. Coagulation characteristics of titanium (Ti) salt coagulant compared with aluminum (Al) and iron (Fe) salts. J. Hazard. Mater. 2011, 185, 1536–1542. [Google Scholar] [CrossRef] [PubMed]
  33. Ytow, N.; Utsumi, M.; Seki, H. UV spectrometry for measuring particulate organic matter in natural water. Aquat. Sci. 1996, 58, 91–102. [Google Scholar] [CrossRef]
  34. Huang, X.; Sun, S.; Gao, B.; Yue, Q.; Wang, Y.; Li, Q. Coagulation behavior and floc properties of compound bioflocculant–polyaluminum chloride dual-coagulants and polymeric aluminum in low temperature surface water treatment. J. Environ. Sci. 2015, 30, 215–222. [Google Scholar] [CrossRef]
  35. Hidayah, E.N.; Chou, Y.-C.; Yeh, H.-H. Characterization and removal of natural organic matter from slow sand filter effluent followed by alum coagulation. Appl. Water Sci. 2018, 8, 3. [Google Scholar] [CrossRef] [Green Version]
  36. Gao, B.-Y.; Chu, Y.-B.; Yue, Q.-Y.; Wang, B.-J.; Wang, S.-G. Characterization and coagulation of a polyaluminum chloride (PAC) coagulant with high Al13 content. J. Environ. Manag. 2005, 76, 143–147. [Google Scholar] [CrossRef] [PubMed]
  37. Duan, S.-X.; Xu, H.; Xiao, F.; Wang, D.-S.; Ye, C.-Q.; Jiao, R.-Y.; Liu, Y.-G. Effects of Al species on coagulation efficiency, residual Al and floc properties in surface water treatment. Colloids Surf. A Physicochem. Eng. Asp. 2014, 459, 14–21. [Google Scholar] [CrossRef]
  38. Song, W.C.; Li, X.; Sun, S.H.; Yang, Y.L.; Jia, R.B. Test Study of Enhanced Coagulation for Conventional Treatment with Low Temperature and Low Turbidity. J. Residuals Sci. Technol. 2015, S39–S46. [Google Scholar] [CrossRef] [Green Version]
  39. Lou, I.; Gong, S.; Huang, X.; Liu, Y. Coagulation optimization for low temperature and low turbidity source water using combined coagulants: A case study. Desalin. Water Treat. 2012, 46, 107–114. [Google Scholar] [CrossRef]
  40. Lin, J.-L.; Ika, A.R. Effect of Al speciation on residual turbidity and Al minimization by coagulation with single and dual dosing. J. Water Supply Res. Technol. 2019, 68, 51–62. [Google Scholar] [CrossRef]
Figure 1. Removal efficiency of coagulation process at 4 °C (a) and 20 °C (b), and the SUVA results (c) for different PACl doses.
Water 13 03073 g001
Figure 2. Residual aluminum after the coagulation–flocculation tests at: (a) 4 °C and (b) 20 °C.
Water 13 03073 g002
Figure 3. Removal efficiency of the coagulation–flocculation process at 4 °C (a) and 20 °C (b), and the SUVA results (c) with polyelectrolyte addition.
Water 13 03073 g003
Figure 4. Principal component analysis for the coagulation–flocculation tests at both temperatures: (a) PC2 vs. PC1 and (b) PC3 vs. PC2. The notation D1…D6 represents the PACl dose in the range of 2–7 mg Al/L with an increment of 1.
Water 13 03073 g004
Table 1. General raw water characteristics in the period 2013–2020.
Quality
Indicator
pHConductivity (at 20 °C)TurbidityCOD
(Permanganate Index)
Total HardnessNH4NO3NO2SO42−Fe
UnitpH UnitsµS/cmUNTmg O2/L°Gemg/Lmg/Lmg/Lmg/Lμg/L
2013min7.15560.81.813.20.061.20.066.143
avg7.58487.022.121.250.212.00.02126.2412.4
max7.9102024.02.427.20.433.00.08156.2885
2014min7.05692.031.714.210.01.1077.287
avg7.38419.192.321.470.182.30.02122538
max8.0109420.42.730.80.473.40.06185.81139
2015min7.35101.31.813.20.041.70.0153.428
avg7.56764.92.221.450.082.30.0194.6355
max8.097313.72.531.60.153.00.02167.2846
2016min7.62271.982.08.810.01.40.020.437
avg7.85157.862.214.720.042.20.00468.8241
max8.381720.42.821.350.13.00.01126.7905
2017min7.24011.021.811.202.20.00235.543
avg7.85956.452.514.130.033.10.0167.6139
max8.380725.13.020.10.083.90.01113.4319
2018min7.44470.661.611.230.01.40.0123.919
avg7.86185.382.514.550.053.10.0158.778
max8.386013.23.923.680.136.90.03119.5187
2019min6.94882.82.111.670.052.60.00929.8116
avg7.78858.562.322.80.134.60.0399.4301.5
max8.41400402.740.90.246.70.2166.9546
2020min7.444191.462.011.450.022.90.00655.560
avg8.047435.292.216.620.115.10.0292.0142.4
max8.4118228.82.429.870.187.80.05175.5267
MAC * (Law 458/2002) [21]≥6.5; ≤9.52500≤55Min 50.5500.5250200
* Maximum allowed concentration.
Table 2. Conditions for experimental testing.
Tests SeriesPACl Dose (mg Al/L)T (°C)Coagulant Aid (mL/L)Stirring Conditions
Time of Rapid MixingTime of Slow Mixing
T12–7403 min at 300 rpm15 min at 60 rpm
T22–740.053 min at 300 rpm15 min at 60 rpm
T32–72003 min at 300 rpm15 min at 60 rpm
T42–7200.053 min at 300 rpm15 min at 60 rpm
T52–740.051.5 min at 300 rpm10 min at 60 rpm
T62–740.053 min at 200 rpm15 min at 25 rpm
T72–7200.051.5 min at 300 rpm10 min at 60 rpm
T82–7200.053 min at 200 rpm15 min at 25 rpm
Table 3. Raw water characteristics.
Quality IndicatorUnitValue
Conventional Parameters
pHunit. pH8.17 (at 21.5 °C)
TurbidityUNT1.27
Conductivity (at 20 °C)µS/cm561.0
COD (permanganate index)mg O2/L1.69
TOCmg/L2.49
Total suspended solidsmg/L49.0
NH4mg/L<0.05
NO2mg/L0.03
NO3mg/L1.39
Total nitrogenmg/L<1.0
Sulphatesmg/L70.40
Chloridemg/L48.99
Total hardness°G10.86
Feμg/L78.16
Alμg/L125.20
Unconventional Parameters
A254cm−10.0333
A280cm−10.0239
A365cm−10.0048
SUVAL/(mg∙m)1.39
A254/A280-1.39
A254/A365-6.93
Table 4. Comparison with other studies from literature.
Coagulant/FlocculantRaw Water CharacteristicsOptimum Coagulant DoseEfficiencyRef.
PAClLow turbidity and DOC, hydrophilic NOM, and low temperature10 mg Al/L30% DOC, 40% A254, and 34% turbidity[34]
PACl/compound bioflocculantLow turbidity and DOC, hydrophilic NOM, and low temperature10 mg Al/L29% DOC, 38% A254, and 40% turbidity[34]
PAClAcid pH and turbidity = 9.5 NTU40 mg Al/L78.5% humic acids, 75.6% fulvic acids, and 80.9% turbidity[10]
AlumHigh DOC and hydrophilic NOM8 mg Al/L23.5% non-purgedable DOC, 25% A254, 31.9% trihalomethanes formation potential, and 25.4% haloacetic acid formation potential[35]
AlCl3River water with turbidity = 151 NTU and pH = 8.122.6 mg Al/L63% turbidity[36]
PAClRiver water with turbidity = 151 NTU and pH = 8.121.3 mg Al/L93% turbidity[36]
PACl-Al13River water with turbidity = 151 NTU and pH = 8.121.3 mg Al/L95% turbidity[36]
AlCl3Low turbidity and DOC, and low temperature2.16 mg Al/L17.5% DOC, residual dissolved Al = 0.4 mg/L[37]
Al13Low turbidity and DOC, and low temperature2.16 mg Al/L19% DOC, residual dissolved Al = 0.2 mg/L[37]
Al30Low turbidity and DOC, and low temperature2.16 mg Al/L17% DOC, residual dissolved Al = 0.3 mg/L[37]
Composite potassium permanganate with composite polymeric aluminum ferric chloride/poly-dimethyl-diallyl- ammonium chloride coagulantRiver water, low turbidity, and low temperature-76.8% turbidity, 14.2% oxygen consumption, 60.8% THM, and 19.4% absorbable organic halogens[38]
FeCl3River water, low turbidity, and low temperature40 mg/L72.4% A254, 11.5% COD, and residual Fe = 0.08 mg/L[39]
Polyaluminum ferric chloride/FeCl3 (3:1 by mass)River water, low turbidity, and low temperature20 mg coagulant/L84% A254, 43% COD, and turbidity < 0.5 NTU, residual Al = 0.09 mg/L, and residual Fe = 0.01 mg/L[39]
Commercial PACl (8% Alpolymeric)/FeCl3 (2:1)Low turbidity18.8 mg Al/L81.28% turbidity, and
residual dissolved Al = 0.08 mg/L
[40]
Commercial PACl(35% Alpolymeric)/FeCl3 (2:1)Low turbidity18.8 mg Al/L81.92% turbidity, and
residual dissolved Al = 0.05 mg/L
[40]
PACl (90.3% basicity)/chitosanReservoir water, low temperature, and low turbidity8 mg Al2O3/L87% turbidity, 63% DOC, 82% A254, and residual Al < 0.15 mg/L[14]
PACl/anionic polyacrilamideRiver water, low temperature, low turbidity, and hydrophilic NOM7 mg Al/L100% turbidity, 65.68% COD, 24.94% DOC, 37.44% A254, 36.06% A280, 43.75% A365, and residual Al = 0.09 mg/L This study
PACl/anionic polyacrilamideRiver water, high temperature, low turbidity, and hydrophilic NOM4 mg Al/L100% turbidity, 53.85% COD, 46.79% DOC, 34.44% A254, 44.65% A280, 45.83% A365, and residual Al = 0.12 mg/LThis study
Publisher’s Note: MDPI stays neutral with regard to jurisdictional claims in published maps and institutional affiliations.

