
Changes in Selected Water Quality Parameters in the Utrata River as a Function of Catchment Area Land Use


1
Independent Department of Agricultural and Environmental Chemistry, Institute of Agriculture, Warsaw University of Life Sciences, Nowoursynowska 166, 02-787 Warsaw, Poland
2
Department of Biometry, Warsaw University of Life Sciences, Nowoursynowska 166, 02-787 Warsaw, Poland
*
Author to whom correspondence should be addressed.
Water 2021, 13(21), 2989; https://doi.org/10.3390/w13212989
Submission received: 13 September 2021
/
Revised: 18 October 2021
/
Accepted: 19 October 2021
/
Published: 22 October 2021
(This article belongs to the Topic Emerging Solutions for Water, Sanitation and Hygiene)
Abstract
:Surface waters are very important for society, as they are a source of potable water, as well a water supply for agricultural, industrial and recreational purposes. This paper presents changes in the quality of the water in the Utrata River, along its entire length, as a function of the catchment area’s land use. Water-quality measurements were carried out once a month for a total period of one year (April 2019–March 2020) at 24 measurement points. The concentrations of the following compounds were measured: total phosphorus, ammonia nitrogen and nitrate nitrogen, dissolved oxygen, and chemical oxygen demand. The results were compared with the limit values specified in the Regulation of the Minister of Maritime Economy and Inland Navigation. In order to determine the impact of land use on water quality in the Utrata River, principal component analyses (PCA) were conducted. The research demonstrated a considerably negative impact of agricultural land use and the presence of urban areas on the water quality of the Utrata River, with elevated concentrations of total phosphorus, ammonia nitrogen, nitrate nitrogen and COD, and decreasing concentrations of dissolved oxygen. The presented results point to the need for effective strategies to mitigate the adverse impact of agriculture and urbanisation on the environment and surface waters.
1. Introduction
Most studies on pollution and the eutrophication of freshwaters mainly concern lakes and reservoirs; the quality of flowing waters should be the subject of more extensive research. Rivers are the main source of inland water for domestic, industrial and irrigation purposes. They are also the natural habitat of many ecosystems and are essential for hydrological and biochemical cycles [1,2]. The intensification of urbanisation, agriculture and deforestation is leading to irreversible changes in the environment and its ecosystems. The conversion of natural areas for agricultural or urban use increases the generation and transfer of pollutants into flowing waters and water bodies. The main pollutants are organic matter and nutrients from agricultural fields or sewage treatment plants, as well as toxic substances, such as heavy metals and hydrocarbons, generated as a result of intensifying urbanisation processes [3,4]. Another very important cause of pollution in agro-urban rivers is a combination of pollution from untreated sewage and surface run-off from agricultural land. This results in the dispersive spread of pollution [5].
In addition to catchment area land use, other important factors influencing water quality in rivers include meteorological and climate-related parameters, such as season, water level, precipitation and air temperature [6]. Water quality in Polish rivers has a significant impact on the water quality in the Baltic Sea, since agricultural and municipal pollution causes its eutrophication and the formation of oxygen “deserts”, which may lead to the degradation of this unique aquatic ecosystem. Polluted rivers are responsible for 20–30% of the amount of nitrogen and nearly 100% of the amount of phosphorus in the waters of the Baltic Sea [7].
The presence of nutrients, such as phosphorus and nitrogen forms, significantly exacerbate the deterioration of surface-water quality. Sources of the former include municipal sewage and water runoff from urban areas [8]. Phosphorus concentrations in rivers are also significantly affected by atmospheric conditions, and increase during the spring thaw and after heavy rainfalls, which wash phosphorus away from agricultural fields [8].
It has been demonstrated that the pollution of rivers with nitrogen is mainly the result of fertilising fields with manure, and the inflow of domestic and industrial wastewater. On the other hand, the pollution level of flowing waters with nitrogen compounds is lower in forested areas and grasslands [9]. A reduction of nitrogen concentration in river waters is also observed after they flow through water bodies such as lakes, reservoirs and ponds, due to the process of sedimentation [10].
Chemical oxygen demand (COD), is an estimate of the amount of organic pollutants equivalent to the amount of oxygen consumed in their chemical oxidation process. It has been demonstrated that elevated COD values in flowing waters can be the result of both severe pollution with biodegradable organic substances and non-organic, toxic substances [11]. Elevated COD levels are often associated with high concentrations of total phosphorus and ammonia nitrogen, and this correlation is particularly evident during the summer months, when there is a greater inflow of agricultural pollutants. When the anthropogenic impact on the environment is reduced, the COD level in river waters decreases, as was observed during the COVID-19 pandemic [12,13].
Dissolved oxygen (DO) is one of the most important indicators of water purity. Low oxygen concentrations indicate higher levels of water pollution, and can be caused by factors such as high temperature, high organic matter content and the respiration of aquatic organisms. Among the listed water quality parameters, it is DO that is of crucial importance, from the point of view of the aquatic environment and ecology. The level of DO in waters can change considerably in weekly, as well as daily cycles, and depends on several other water quality variables (such as total phosphorus [TP] and COD), as well as interactions between them [14]. Oxygen is very important for the proper functioning of aquatic ecosystems, and its amount is indicative of their condition. Low DO concentration leads to a loss of biodiversity in aquatic ecosystems [15].
High concentrations of total phosphorus, ammonia nitrogen, nitrate nitrogen and COD, with simultaneous low DO concentration in rivers, can lead to eutrophication. Such rivers are often characterised by intense algal growth, intense odour and colour, and their aquatic ecosystems are negatively affected. In addition, water availability for drinking and industrial purposes is significantly reduced. The main cause of eutrophication is considered to be human activity: agriculture and, more importantly, inadequate municipal services management [16,17].
The objective of the research presented in this paper was to investigate the impact of catchment area land use (grasslands, urbanised or agricultural areas) on selected water quality parameters such as total phosphorus, nitrate nitrogen, ammonia nitrogen, DO and COD concentrations, all of which have a significant impact on flora, fauna and aquatic ecosystems.
2. Materials and Methods
The Utrata River flows through the Mazowieckie Province. It has its source in Ojrzanów and flows into the Bzura River in Sochaczew. The total length of the river is about 78 km. The Utrata river basin covers an area of 702 km2. The Utrata river basin can be divided into three sections (Figure 1), in the first section the river flows through grassland, in the second section through urbanized areas and in the third last section river flows through agricultural areas [18]. The Utrata River is exposed to an inflow of pollution from various anthropogenic sources, such as: intensively farmed agricultural areas, urbanised areas, sewage treatment plants or fish ponds [19].
2.1. Description of the Field Campaign
Water samples were taken between April 2019 and March 2020 at 24 points along the river Utrata. The sampling points were located in areas of different land use:
- Samples 1–10 came from grasslands,
- Samples 10–15 from urbanised areas and
- Samples 16–24 from agricultural areas (Figure 2).
In total, 288 samples were collected.
Water from the River Utrata was collected in 1-litre sterile bottles at a distance of 1.5–2 m from the shore. The bottles were capped below the surface to avoid oxygen ingress. The bottles were then placed in a polystyrene box to avoid cooling or overheating during transport to the laboratory. All analyses were performed on the day of collecting of samples.
2.2. Methods
The following parameters were analysed:
The measurement results were compared with the Regulation of the Minister of Maritime Economy and Inland Navigation of 11 October 2019 on the classification of ecological condition, ecological potential, chemical condition and the method of classification of the state of surface water bodies, as well as environmental quality standards for priority substances.
According to Regulation of the Minister of Maritime Economy and Inland Navigation water may be classified in one of two classes:
- Water quality class I—very good ecological status
- Water quality class II—good ecological status.
If the values defined as limits for water quality class II are exceeded, such water is not classified. In Poland scientists use two classes since these waters can be widely used for domestic purposes. Non-classified waters have very limited possibilities for use. The results are presented graphically as means, and standard deviations (SD) as error bars. Statistical comparisons of means were conducted using multifactor analysis of variance (ANOVA) and Tukey’s HSD method of multiple comparisons, at a probability level of 0.05. Relationships between weather variables and variables characterising water quality were analysed using principal component analysis (PCA). The results of PCA are presented graphically using biplots, where variables are presented together with the months in which the study was conducted. The plots are presented using the first (PC1) and the second (PC2) principal component. On the basis of the plots, we can evaluate relationships between meteorological variables (Table 1) and traits that describe water quality (e.g., elements, chemicals, etc.). If the direction of the lines presented on PCA plots is very similar it indicates strong positive correlation, if the direction is opposite the correlations is strong but negative, if the direction of two lines is about 90 degrees (right angle) it indicates lack of the correlation between such variables. Locations near one of the points for the months in the plot indicate that months are similar in meteorological variables, as well similar in water pollution indicators. Large distances between two months in the plots indicate large differences between them.
2.3. Weather Conditions
The following chapter presents the results of the meteorological and hydrological observations.
3. Results
The following chapter presents the results of physicochemical measurements of the Utrata River water, presented graphically as means, and standard deviations (SD) as error bars.
The average concentration of total phosphorus in the waters of the Utrata River was 1.68 mg P/dm3; this significantly exceeded the permissible values for water quality classes I and II, which are <0.17 and <0.33 mg P/dm3, respectively. The lowest total phosphorus concentration in river waters was recorded in the spring—in April, close to the source of the river, in grasslands (measurement points 1–10) and averaged 0.407 mg P/dm3—while the highest was recorded in the summer—in August and September, in agricultural areas (3.48 P/dm3). Phosphorus contamination of the waters of the Utrata River for most of the year exceeded the limits specified in the Regulation of the Minister of Maritime Economy and Inland Navigation (Figure 3).
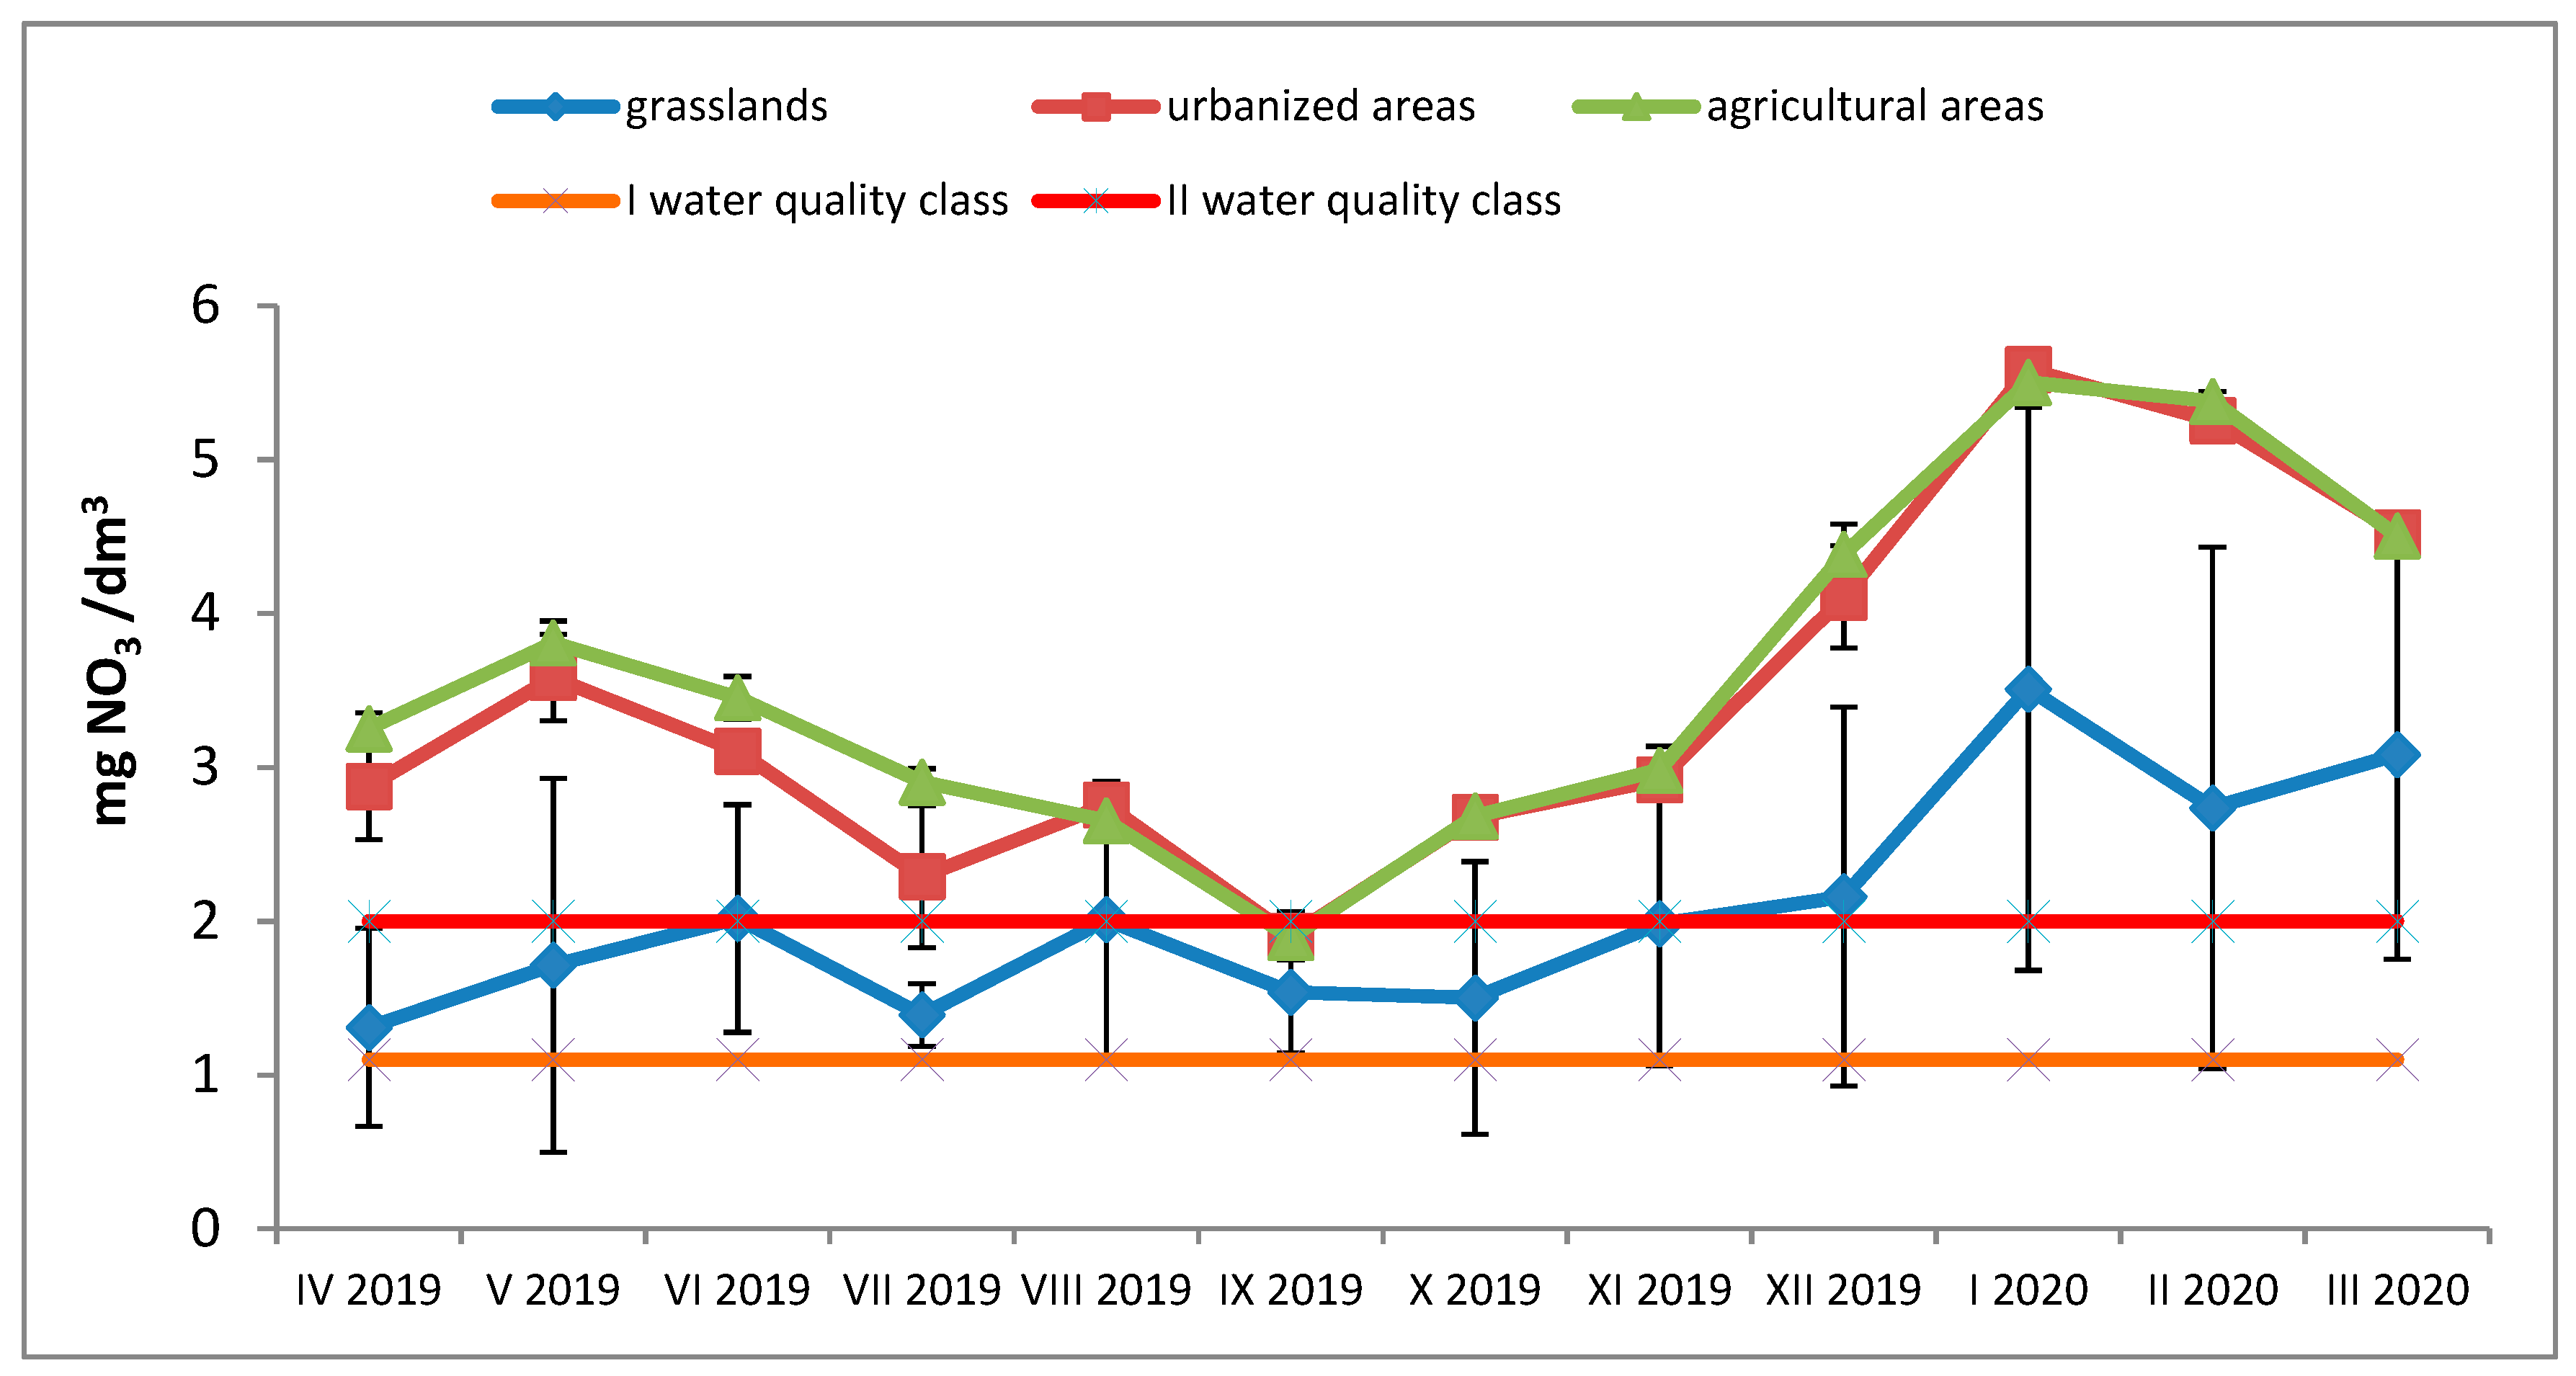
The mean concentration of nitrogen from nitrates in the waters of the Utrata River was 2.76 mg N-NO3/dm3 and significantly exceeded the permissible values for water quality classes I and II, which are <1.1 and <2 mg N-NO3/dm3, respectively. The lowest mean concentration of nitrated nitrogen in river waters was recorded in the summer, in the upper course of the river in grasslands (measurement points 1–10) and averaged 1.32 N-NO3/dm3, while the highest (5.13 N-NO3/dm3) was recorded in the winter, in agricultural areas. The contamination of the waters of the Utrata River with nitrate nitrogen in urban and agricultural areas exceeded the limit values specified in the Regulation of the Minister of Maritime Economy and Inland Navigation throughout the entire year (Figure 4).
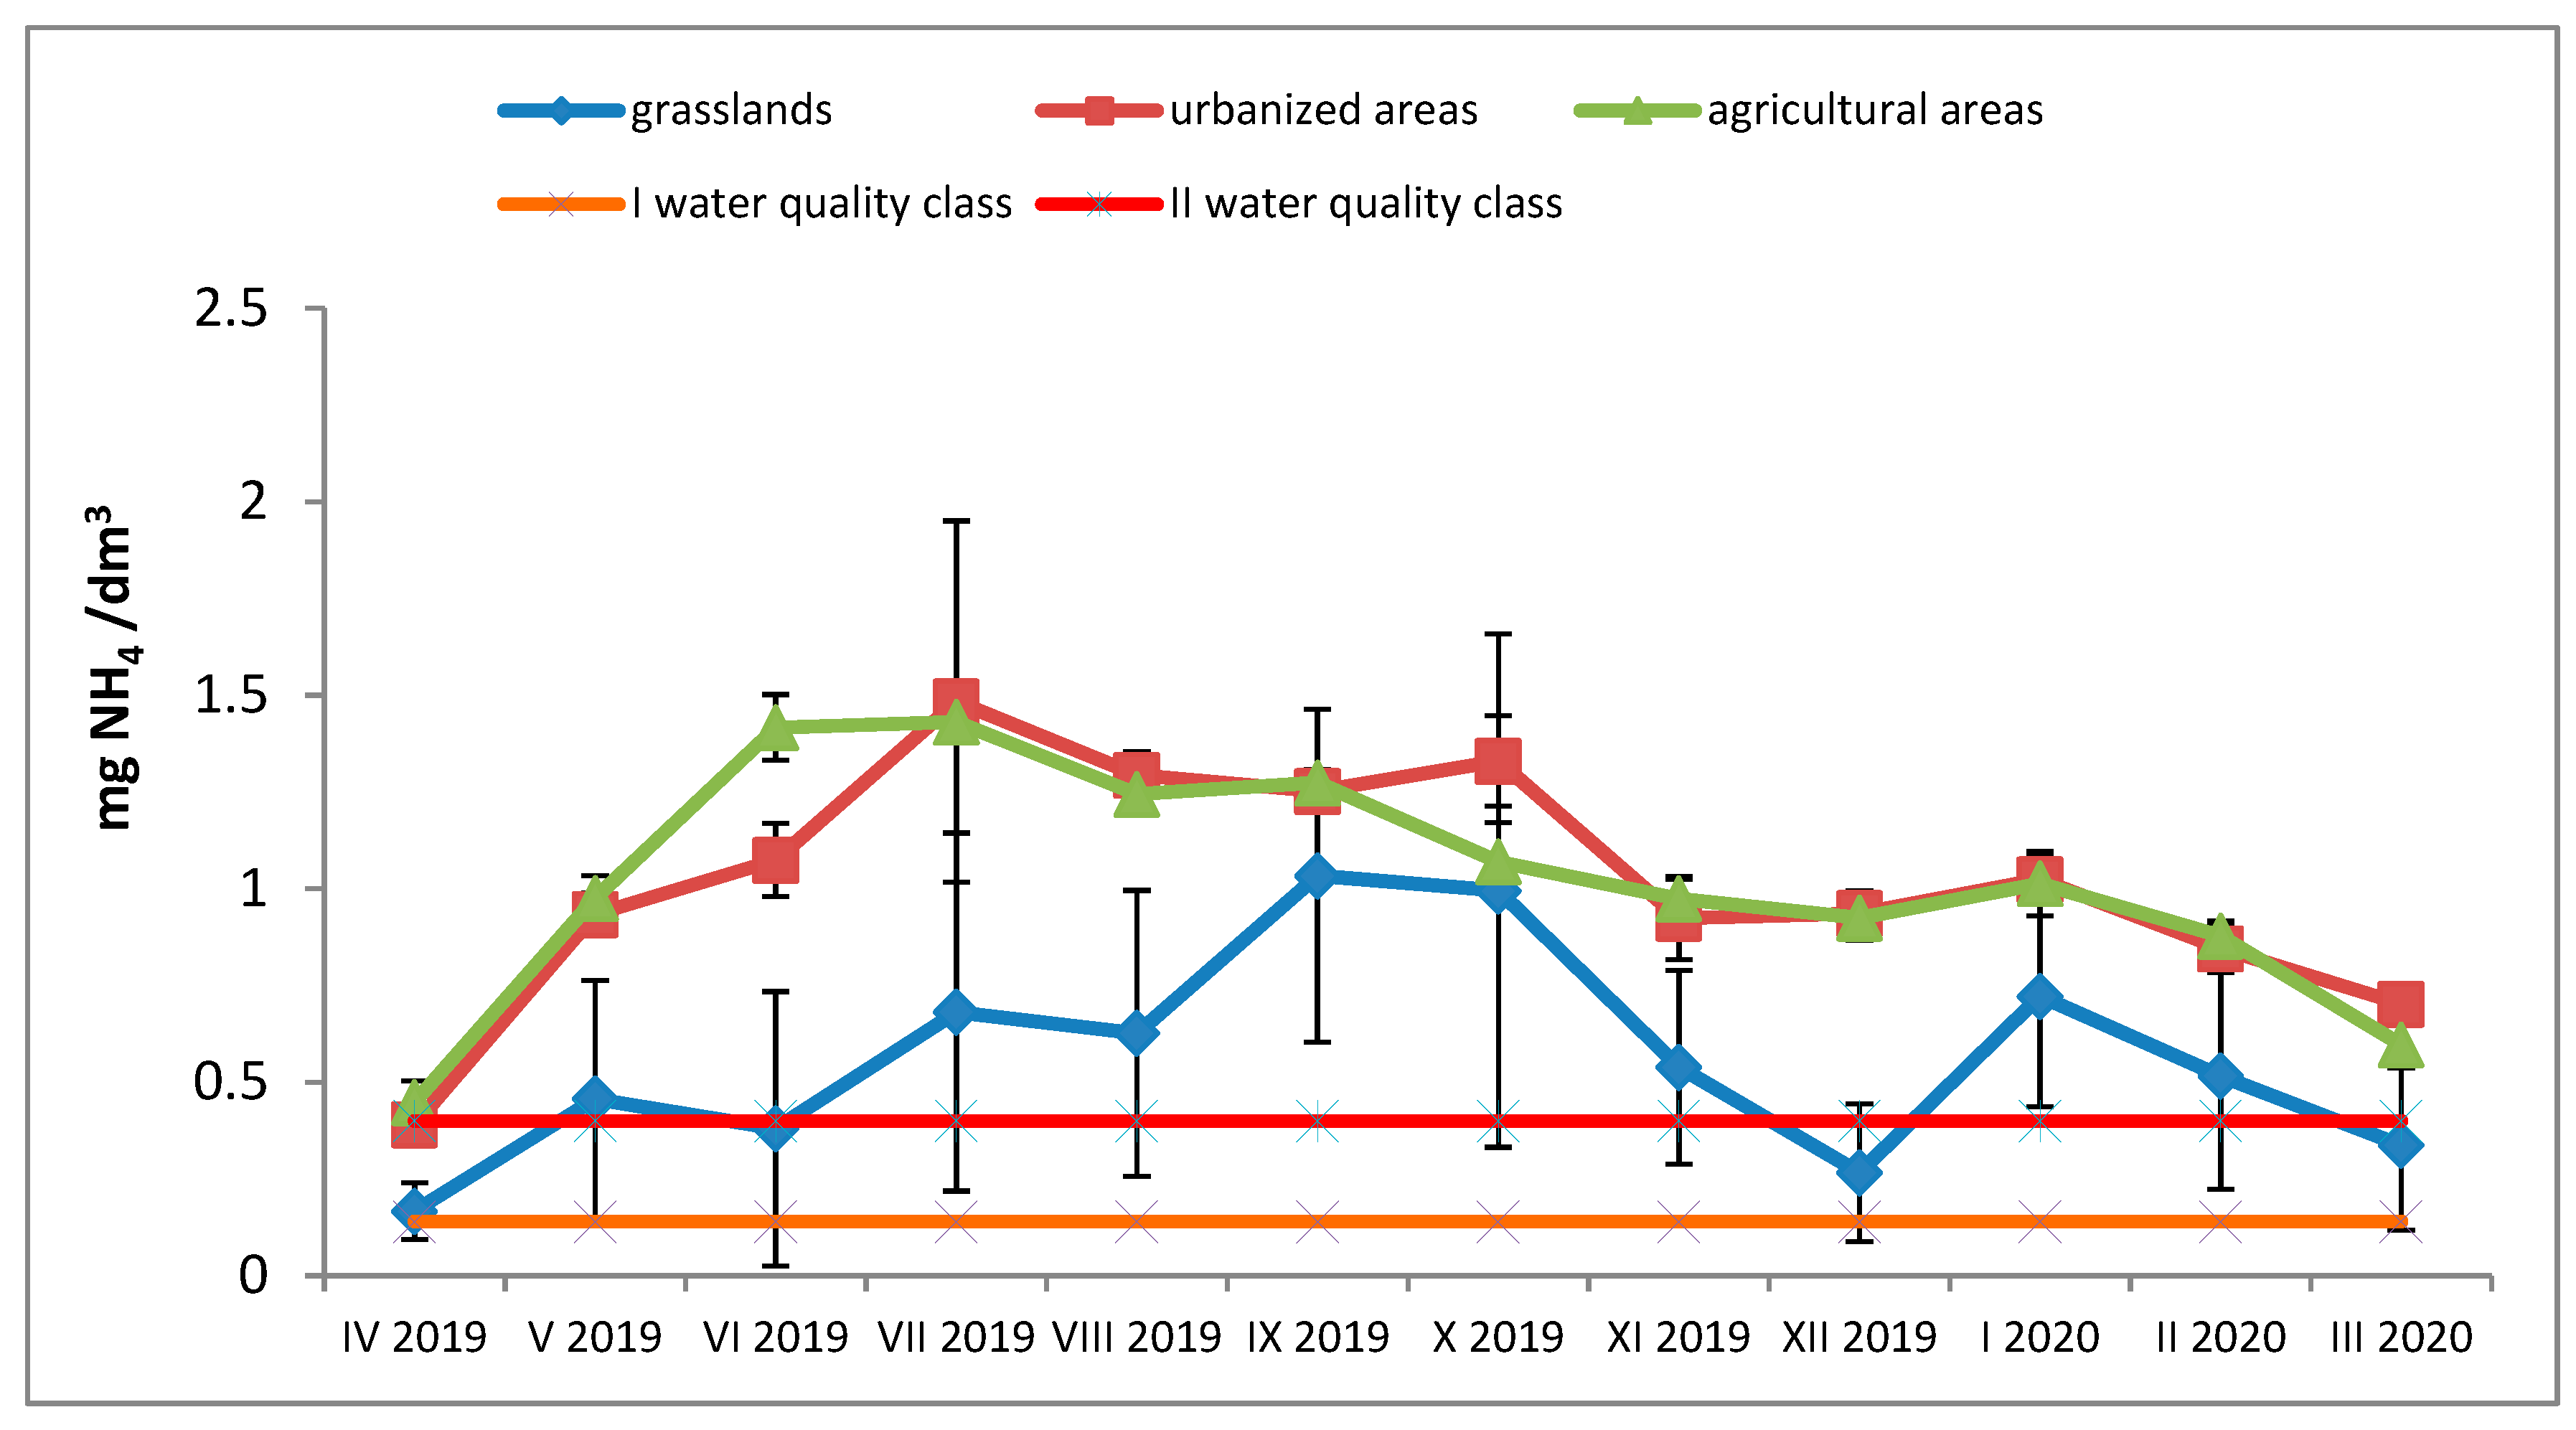
The mean annual concentration of nitrogen from ammonia in the Utrata River was 0.8 mg N-NH4/dm3 and significantly exceeded the permissible limit values established in Poland for class I and II of water purity, 0.14 N-NH4/dm3 i 0.4 N-NH4/dm3, respectively. The lowest mean concentration of ammonia nitrogen (0.31 N-NH4/dm3) was recorded in the spring in grasslands, while the highest (1.34 N-NH4/dm3) was recorded in the summer in agricultural areas. The highest recorded concentration of N-NH4 three times exceeded the limit of class II water quality (Figure 5).
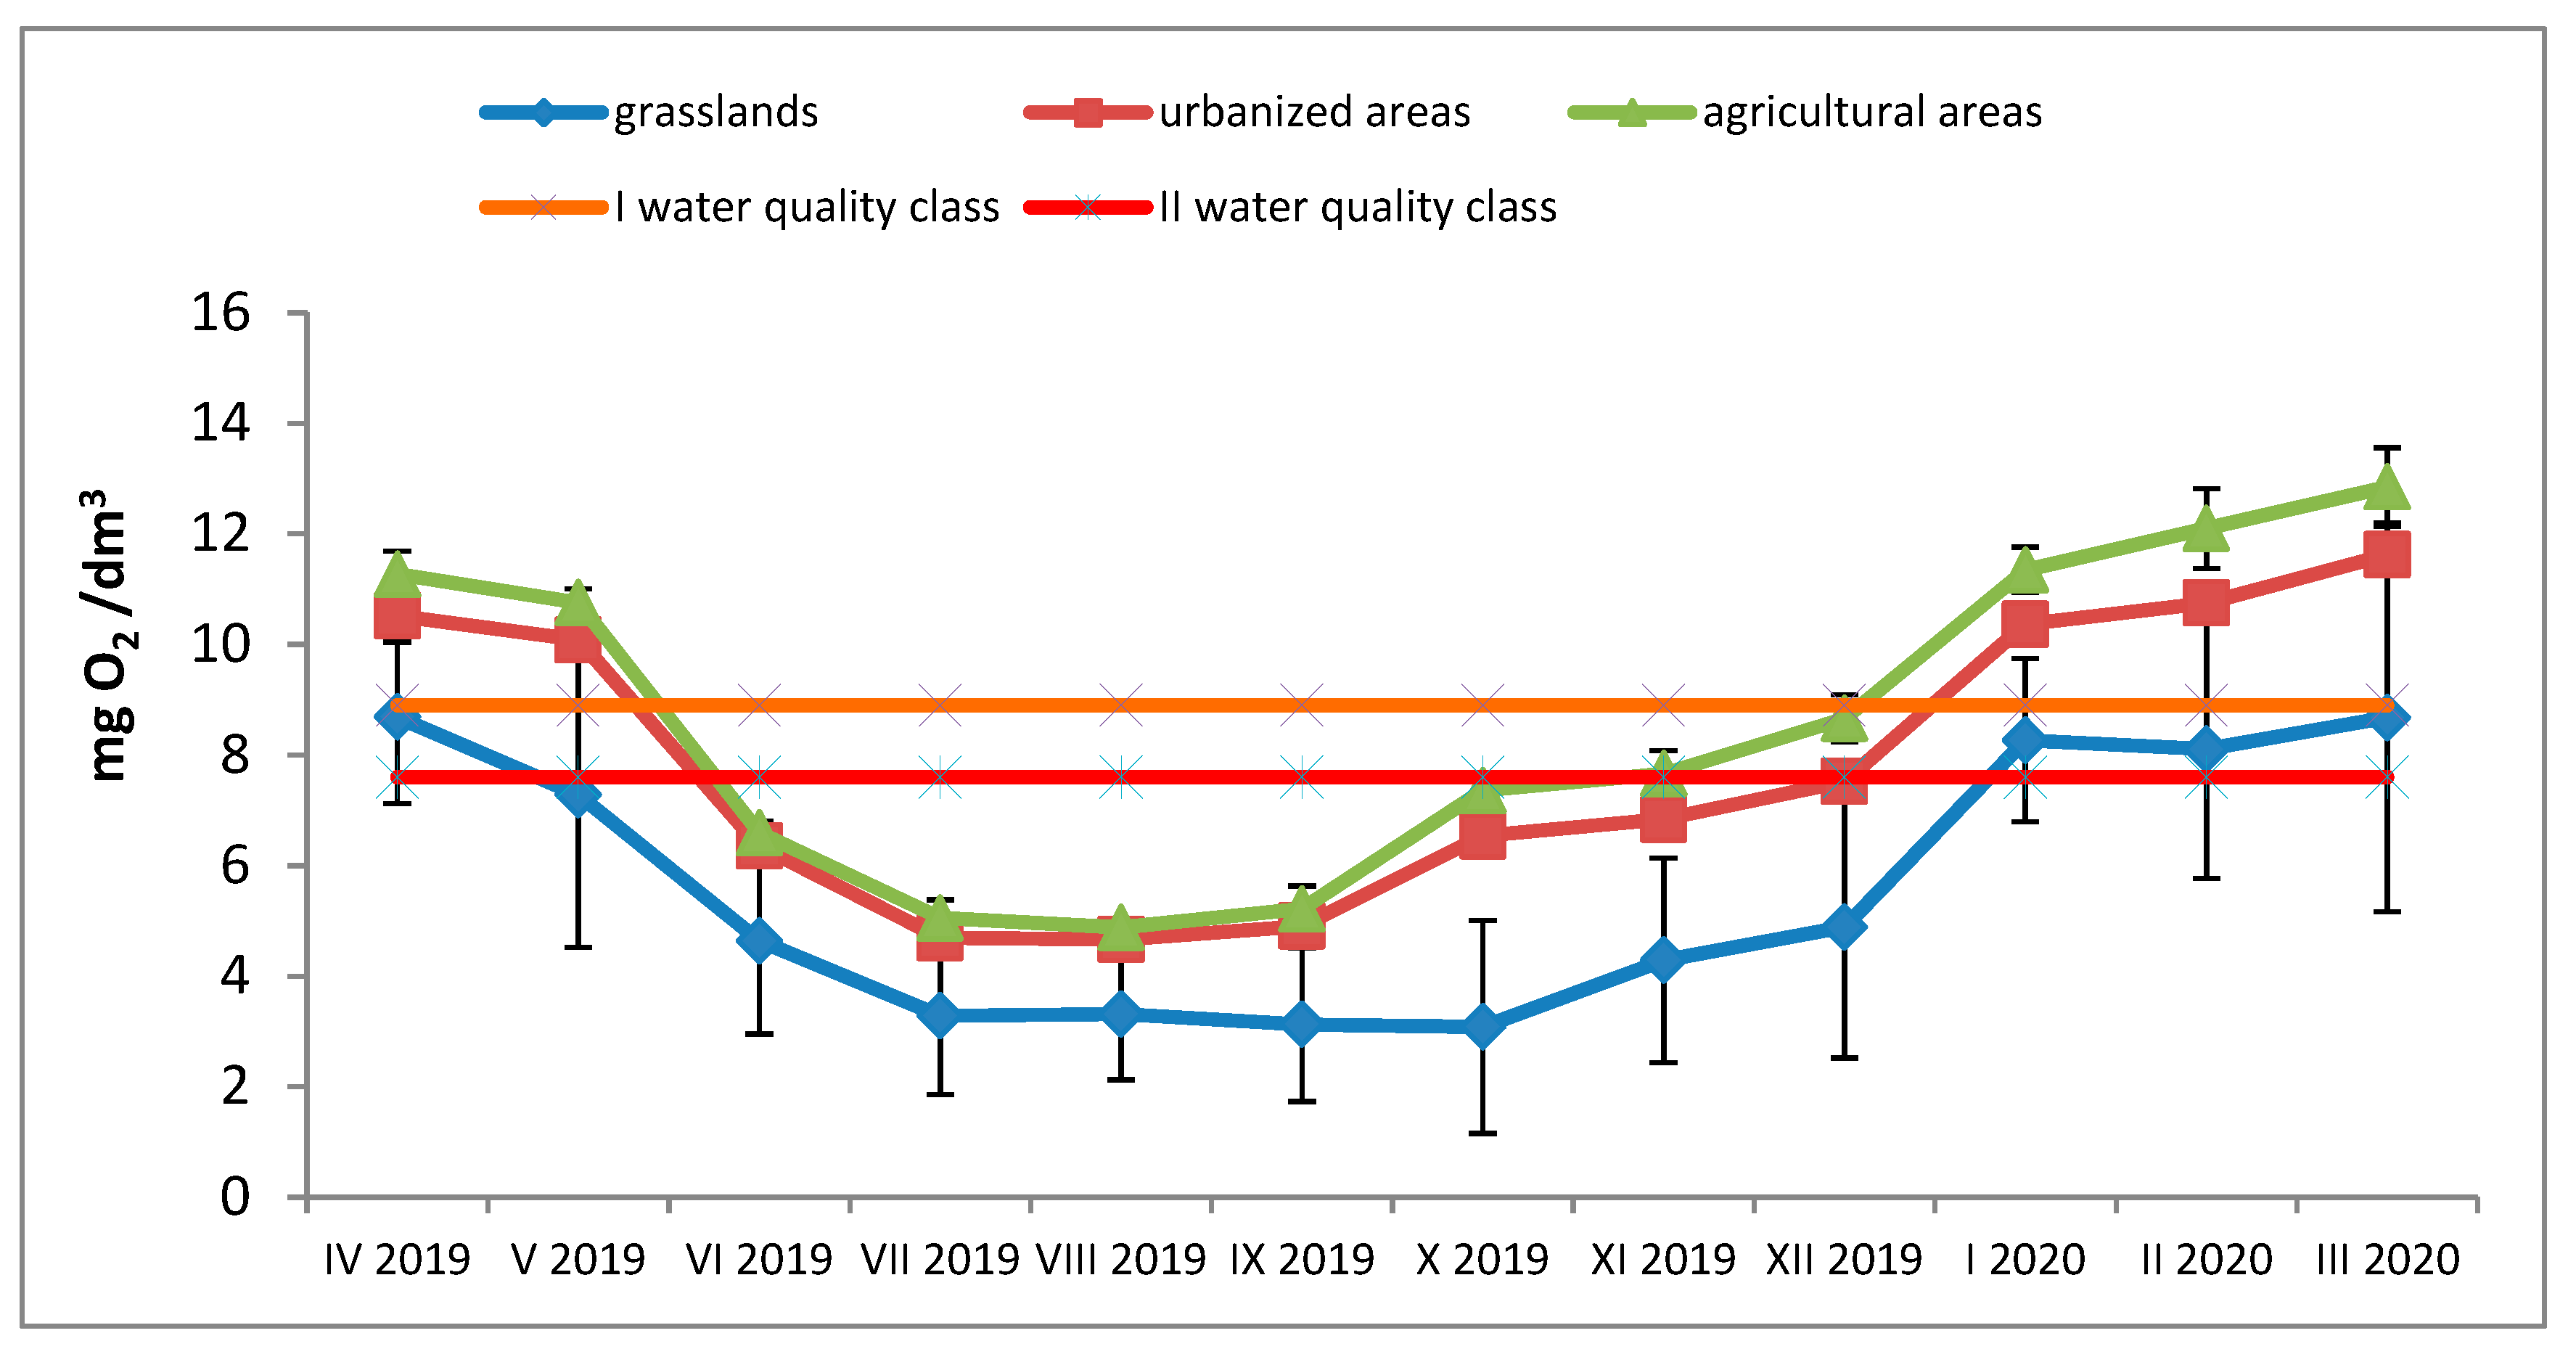
The concentration of dissolved oxygen in the waters of the Utrata River varied, depending on the season. The highest concentration was recorded in the winter in agricultural areas in the lower course of the river (12.09 mg O2/dm3—class I water quality), while the lowest was recorded in the upper course of the river, in grasslands (mean 2.59 mg O2/dm3), which exceeded the permissible limits for water quality class II (beyond classification) (Figure 6).
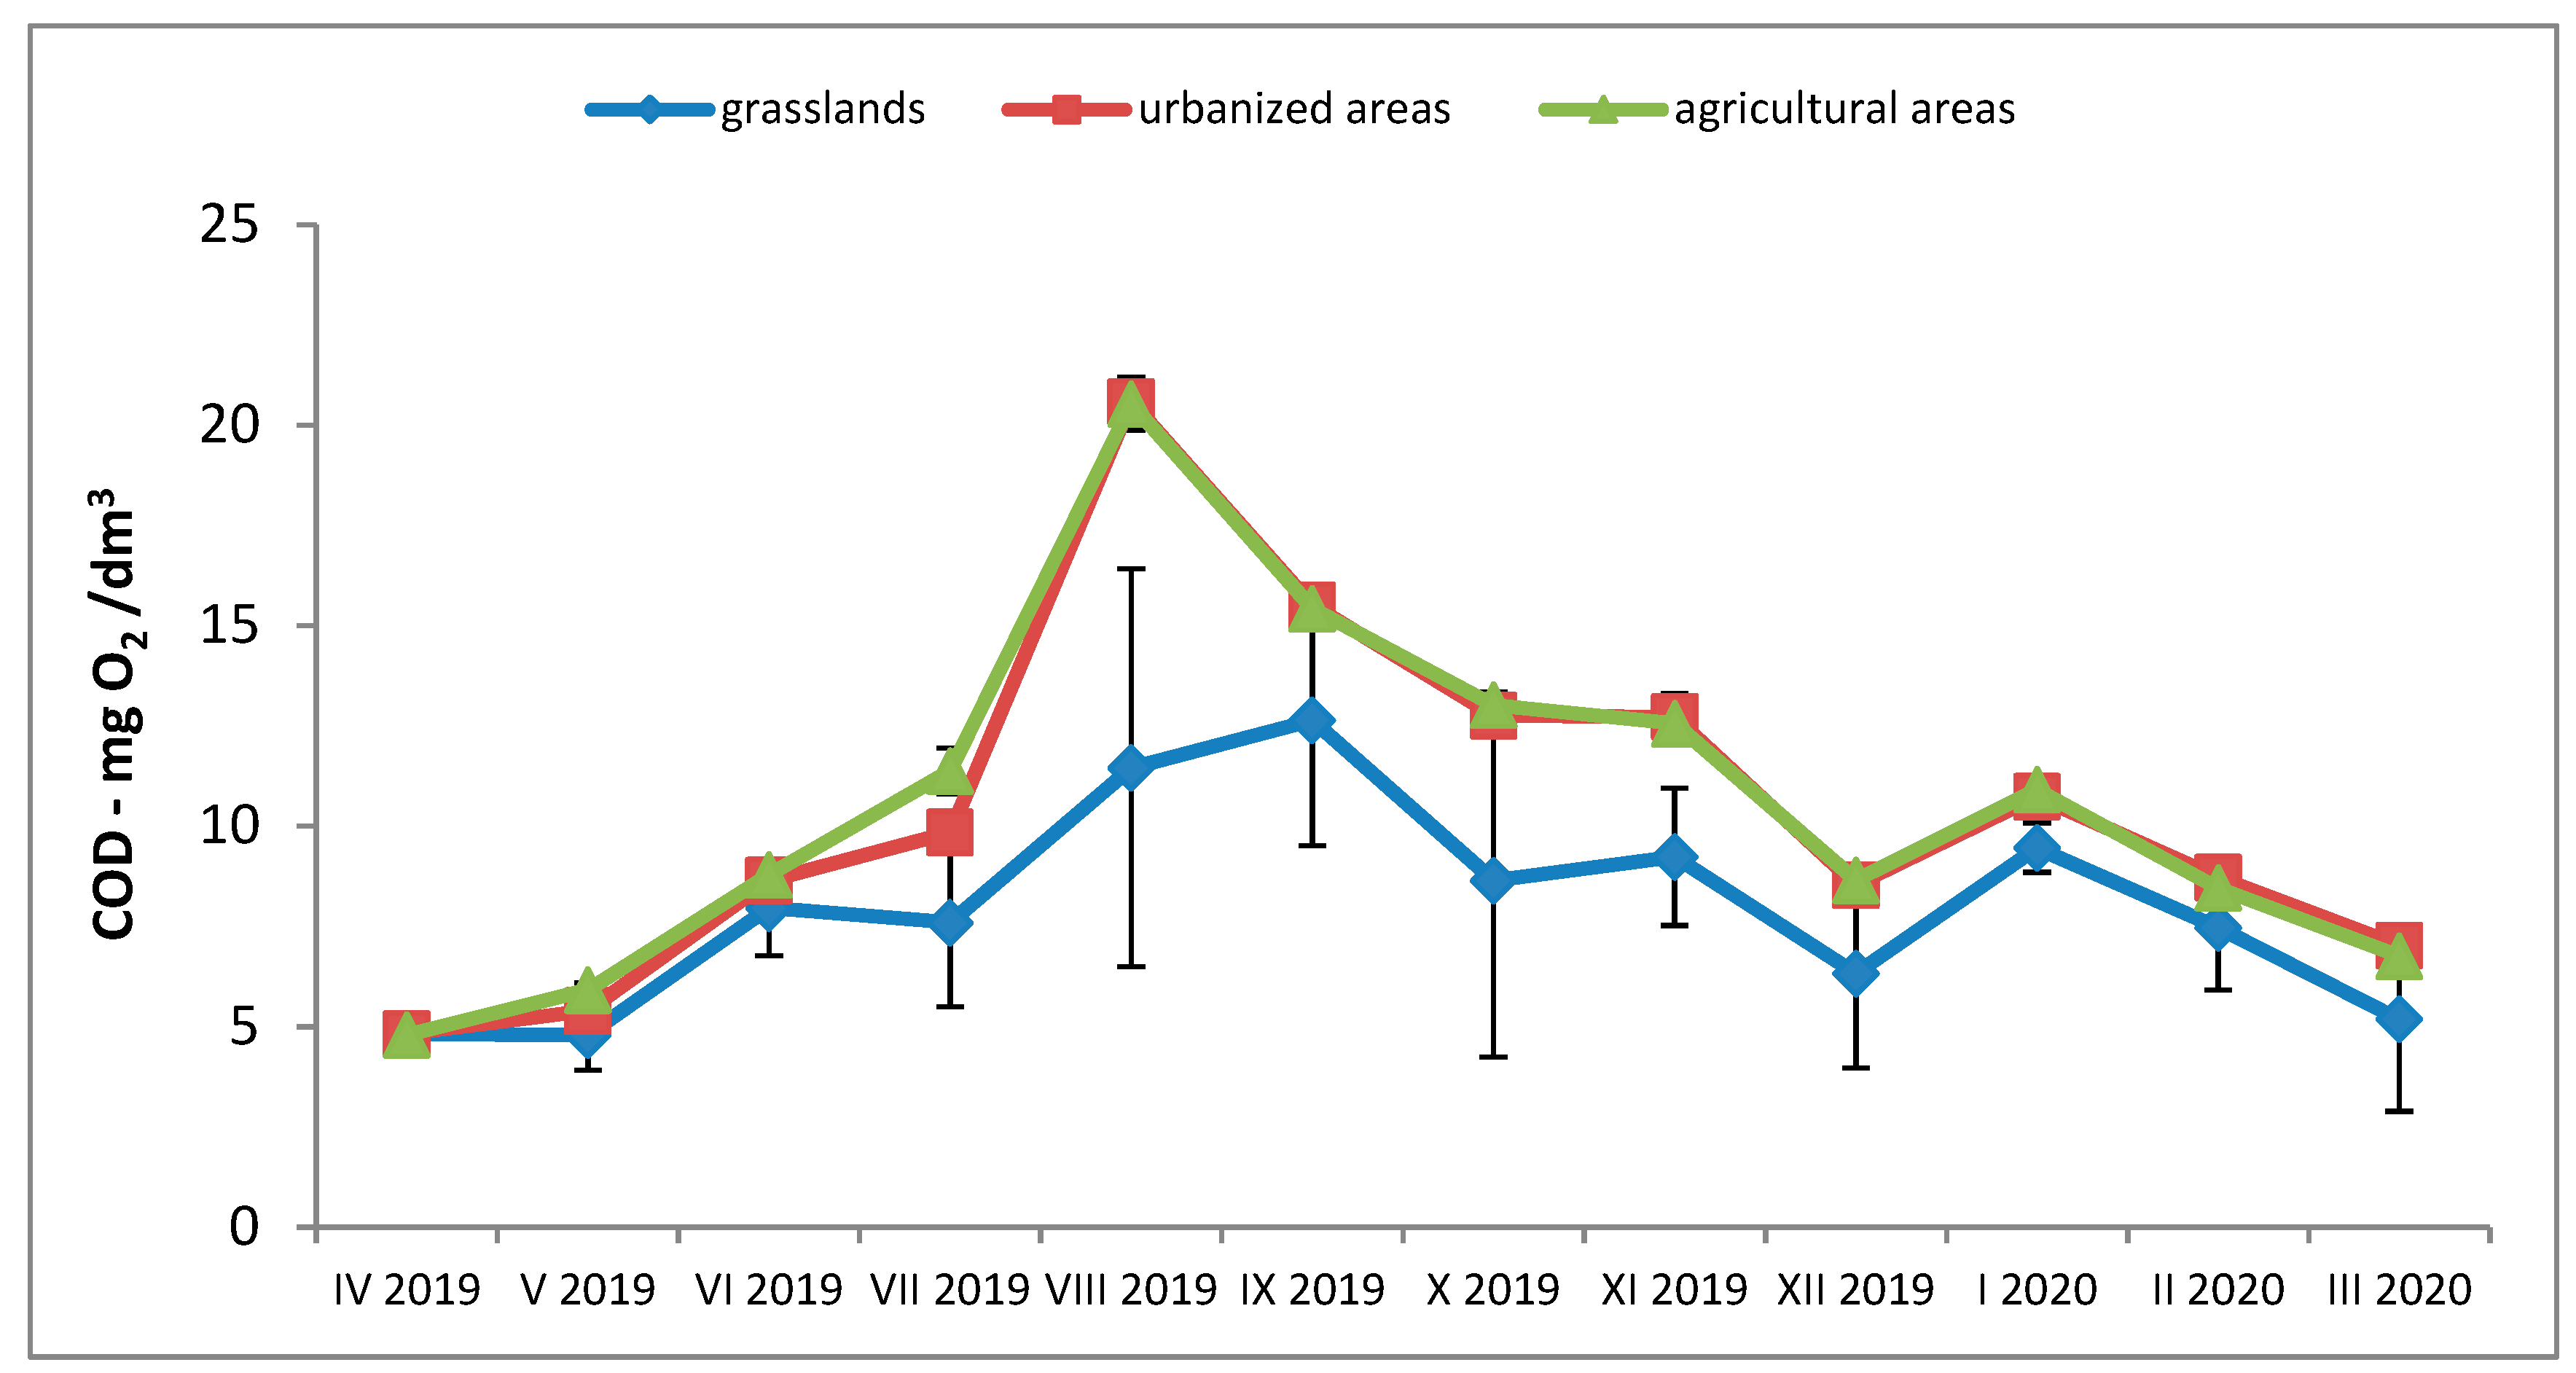
The lowest COD values were recorded in the spring months in grasslands (mean 5.43 mg O2/dm3), while the highest mean COD concentration was recorded in agricultural areas in the summer months (15.78 mg O2/dm3).
The following chapter presents the results of relationships between weather variables and variables characterising water quality analysed from the Utrata River water (Figure 7).
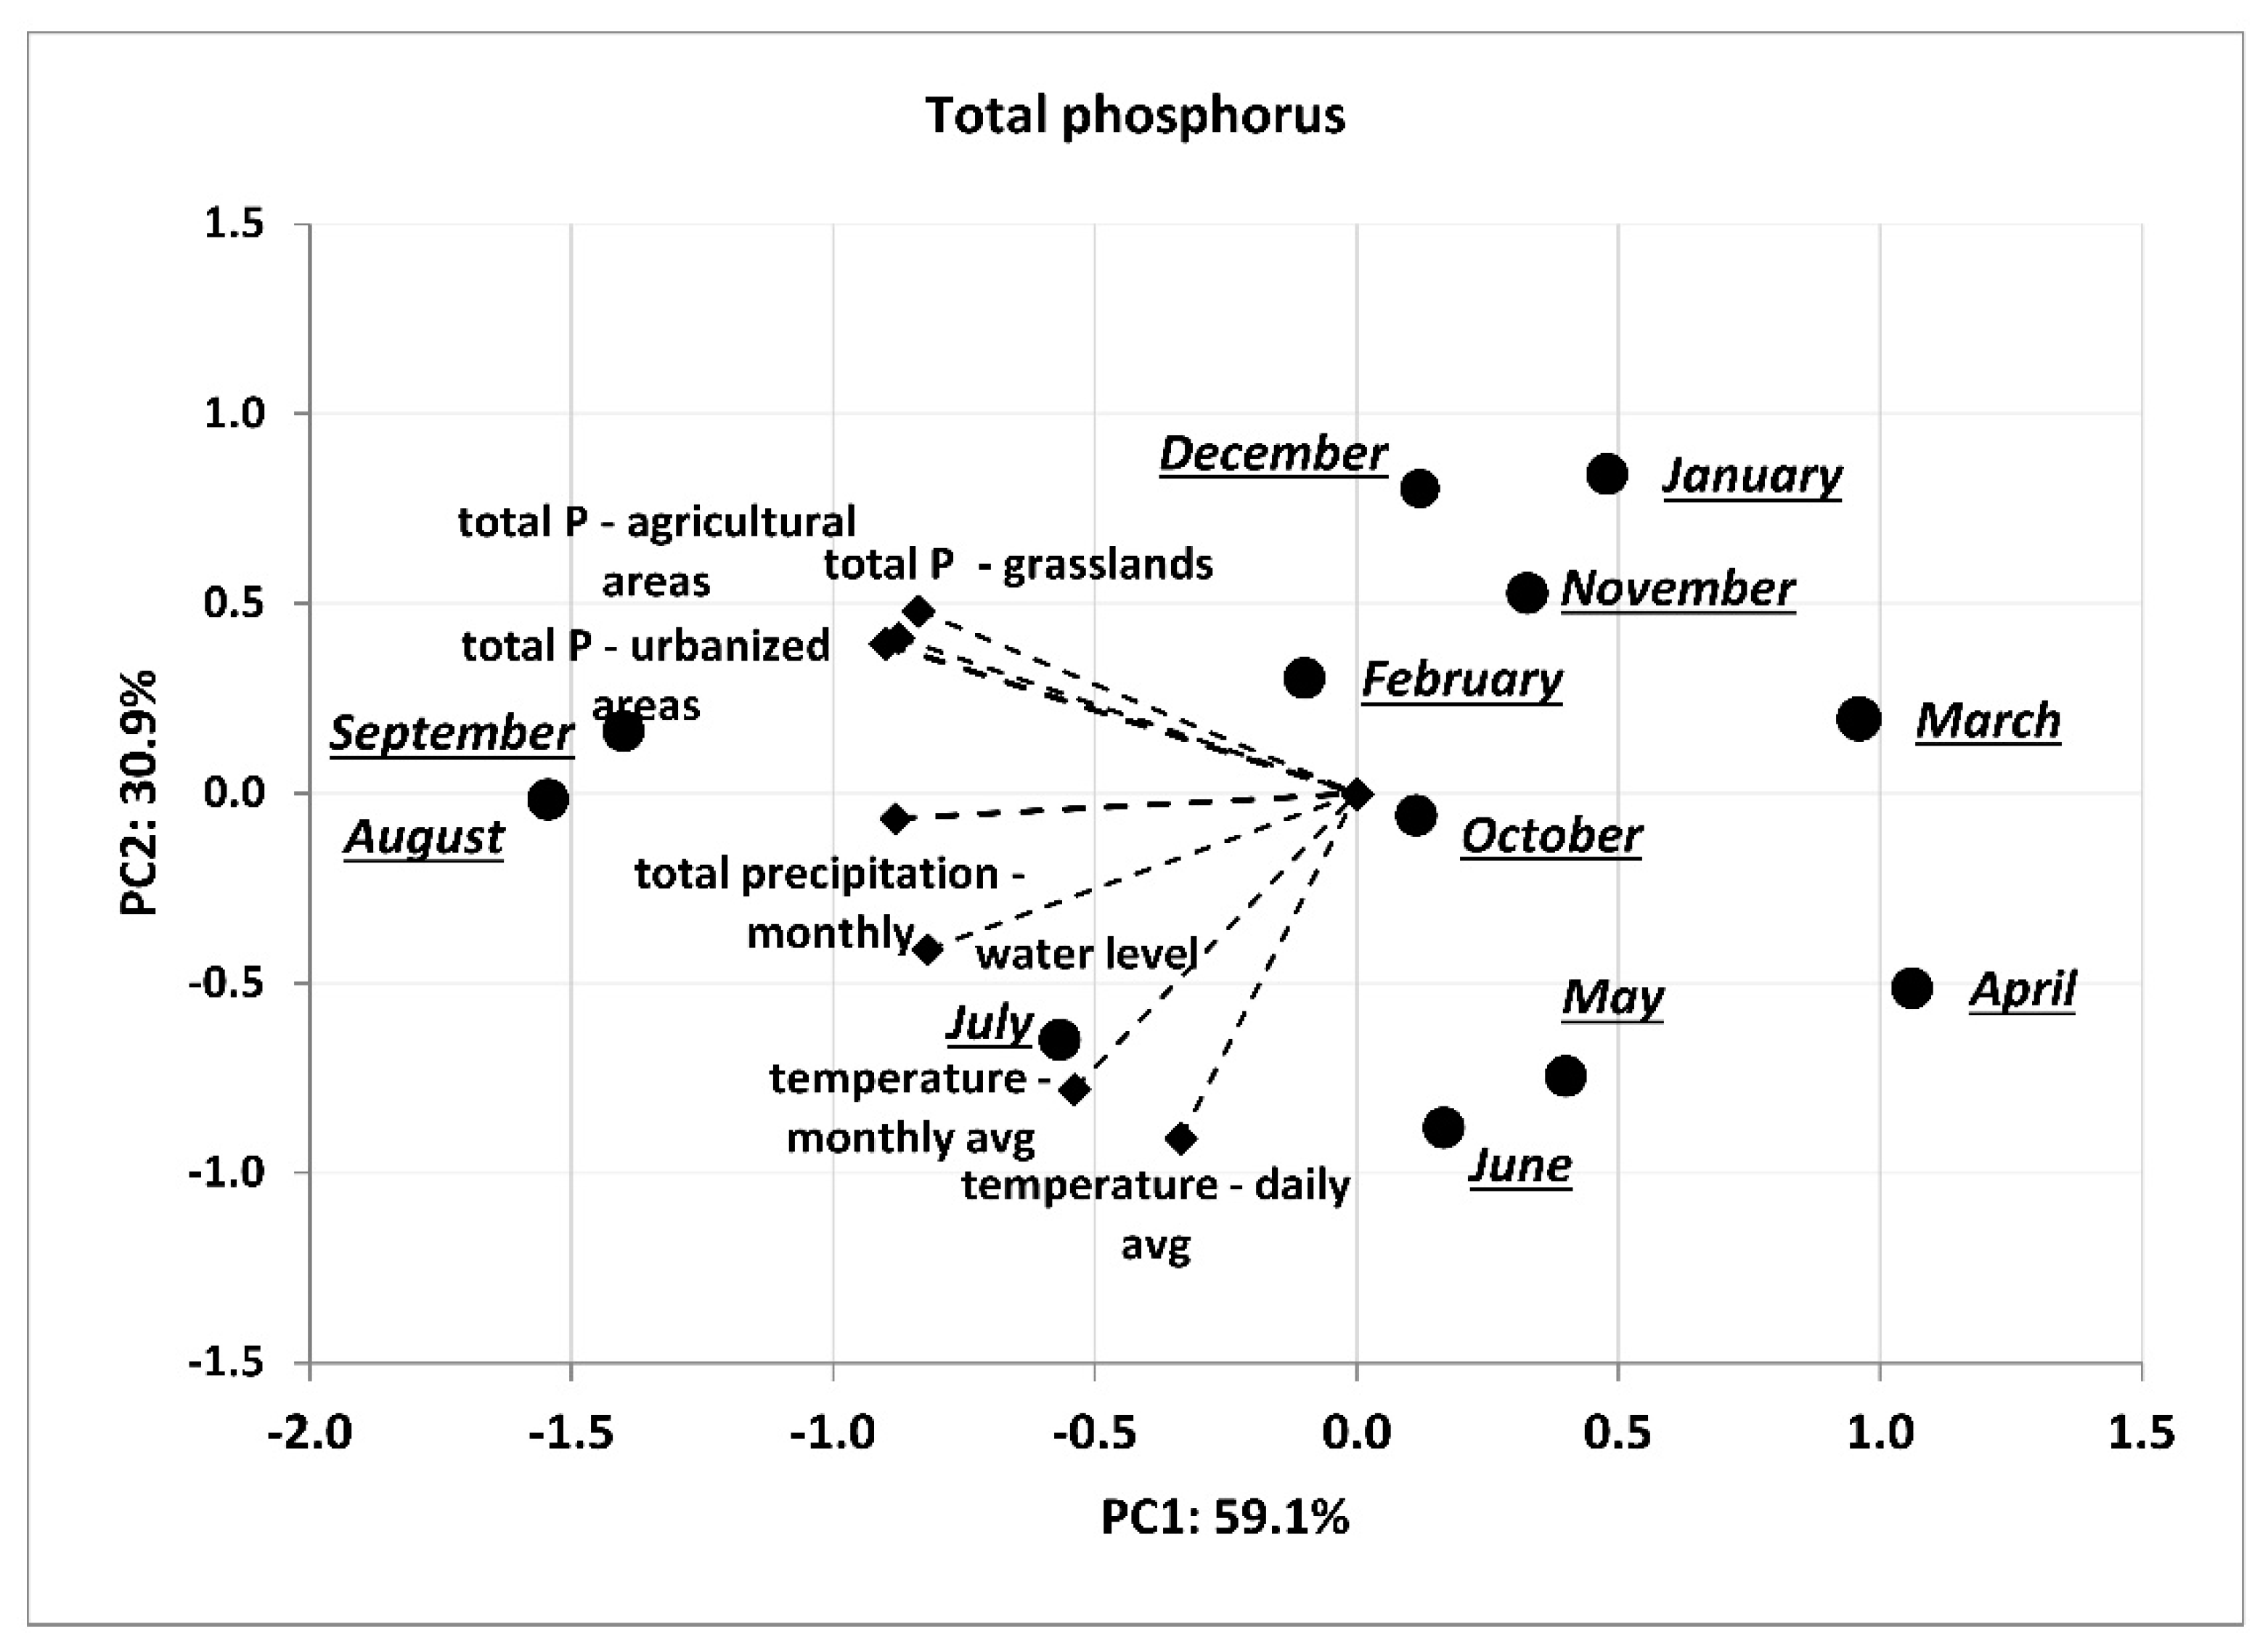
The PCA analysis showed that, irrespective of the catchment area land use, the total phosphorus concentration in the Utrata River was strongly positively correlated with total precipitation, while only slightly correlated with temperature and water level (Figure 8).
Regardless of the catchment area land use, the nitrated nitrogen concentration in the river was strongly negatively correlated with mean daily temperature (higher nitrate nitrogen concentration at lower temperatures). In turn, it was only slightly correlated with precipitation and water level (Figure 9).
Ammonia nitrogen concentration in the Utrata River in agricultural areas was strongly positively correlated with total precipitation and water level. In the other types of areas (grasslands and urban areas), this correlation was also positive, but weaker. The concentration of this form of nitrogen in water varies—to some extent—due to changes in water and air temperature (Figure 10).
Dissolved oxygen concentration in water in all types of areas (agricultural areas, grasslands and urban areas) was strongly negatively correlated with total precipitation and water level. In turn, only a slight correlation was found between dissolved oxygen concentration and temperature changes (Figure 11).
Regardless of the catchment area land use, the chemical oxygen demand was not significantly correlated with precipitation, water level or temperature. Among all these variables, the strongest positive correlation was found between COD and temperature (Figure 12).
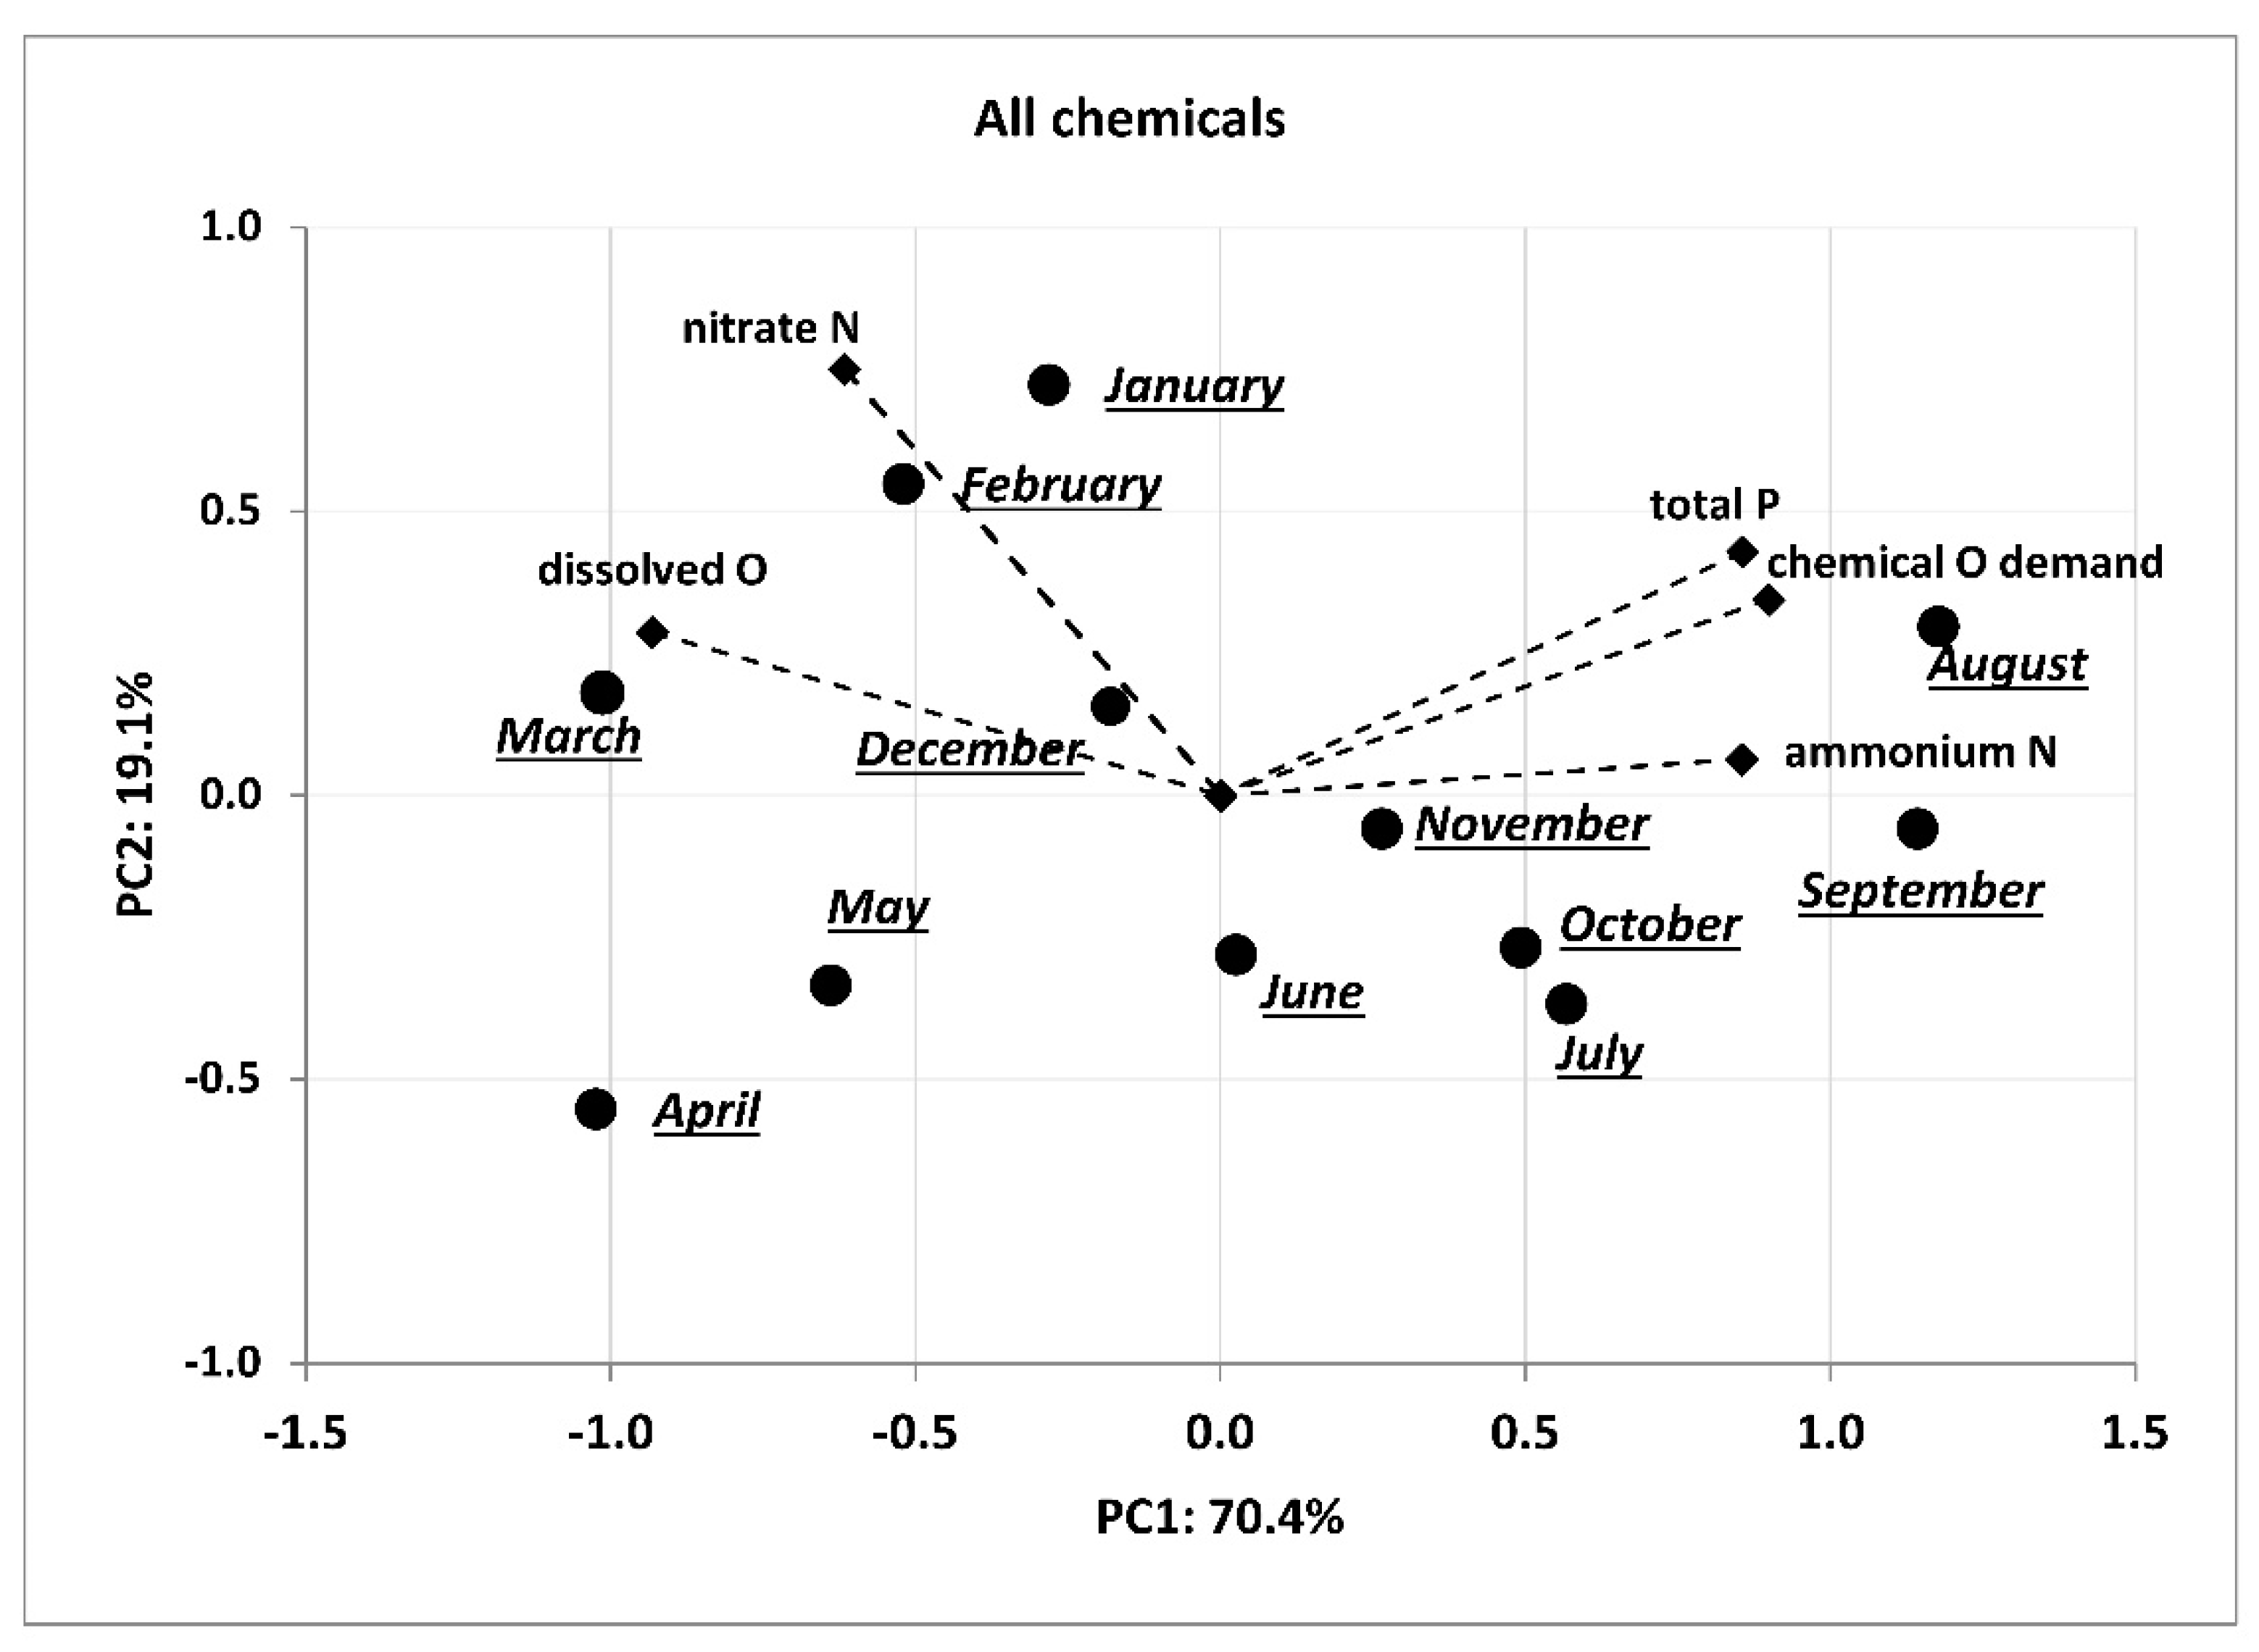
Based on the PCA analysis, a strong positive correlation was found between the concentration of total phosphorus and chemical oxygen demand. In addition, COD was positively correlated with ammonia nitrogen concentration. The concentrations of total P, COD and N-NH4 were, at the same time, negatively correlated with the concentration of dissolved oxygen in the river (Figure 13).
4. Discussion
The waters of the Utrata River had very high total phosphorus concentrations throughout the entire year. The highest concentrations were recorded in the areas used for agricultural purposes. In addition, a positive correlation was found between total phosphorus concentration and total precipitation. This may be related to the washing away, by rain, of organic matter that later flows into the Utrata River [25]. Rainfall also increases total phosphorus concentration in urban areas via storm drains [26]. The highest contamination level of the Utrata River by phosphorus during the months of June–September coincides with the intensification of agricultural activity in these areas [27].
The increase in phosphorus concentration in river waters in urban areas may be related to the proximity of sewage treatment plants [28] and stormwater runoff of phosphorus during heavy rainfall [29]. In the catchment area of the Utrata River, there are two sewage treatment plants, one in Walendów and one in Pruszków [30]. Another factor that increases the concentration of total phosphorus in the Utrata River is its tributary, the Raszynka River, which flows through fish ponds and carries a very high pollution load [31].
The highest concentration of nitrate nitrogen in the water of the Utrata River was observed during the winter months. The concentration of N-NO3 in river waters was negatively correlated with total monthly precipitation and temperature. These results are corroborated by the research conducted on the Loess Plateau in China [32]. The concentration of nitrate ions in the waters of the Utrata River was elevated in urban areas. During the winter months with scant precipitation and a low water level of the river, the main sources of nitrate nitrogen were likely to have been local. One such source, which contributes significantly to the deterioration of water quality, is sewage treatment plants [33]. It is also during the winter months that nitrate ions are washed away most intensely from agricultural areas; similar results were observed in the Nizhny Novgorod Area in Russia [34]. Catchments dominated by cereal crops show higher nitrate nitrogen concentrations in rivers, while catchments dominated by forests show lower nitrogen discharge and decreasing nitrate nitrogen concentrations downstream. This correlation is particularly visible during the summer months Correlations between increased nitrate nitrogen concentrations and cereal cultivation were also noted in USA and in Europe [35,36,37].
Ammonia nitrogen concentration was the highest during the summer and spring months in agricultural areas and was positively correlated with total precipitation. This may be related to the washing-away of nitrogen compounds from fields into the river during heavy rainfalls. Similar correlations were observed in northwestern China [38]. The results of the research on the Wujiang River Basin also indicated that anthropogenic sources, such as natural and artificial fertilisers and sewage inflow, were the main sources of ammonia nitrogen pollution in the waters [38]. Ammonia nitrogen concentrations were also significantly higher in urban areas, which is probably linked to the proximity of sewage treatment plants and the presence of domestic and industrial wastewater in the river. Similar correlations were observed in the Asi River (Turkey) [39], in the Curved River (Kosovo) [40] and in Poland [41]; however, these correlations were not as strong as in the case of agricultural areas, which proves that agricultural activities contribute, to the largest extent, to ammonia nitrogen pollution in the Utrata River. Ammonia nitrogen concentration in river waters can also be depend on the level of dissolved oxygen concentration [42].
Dissolved oxygen concentrations were highest during the winter months, which was due to lower water temperatures and higher oxygen solubility. Due to the very high air temperatures in the summer months and progressive eutrophication processes, the dissolved oxygen concentration in the River Utrata was lowest then [43]. Dissolved oxygen concentrations in rivers show a downward trend year-over-year, which is linked to global warming and increasing surface water temperature [44]. The insufficient oxygen concentration in the Utrata River may be due to a high degree of urbanisation, and also to the presence of sewage treatment plants, which are a source of organic pollutants [45]. Dissolved oxygen concentration varies greatly depending on the course of the river, which may be the result of an increased inflow of organic pollutants in its lower course [46], especially in urbanised and agricultural areas. The presence of all the examined nutrients (total phosphorus, ammonia nitrogen, nitrate nitrogen) had an impact on the reduced dissolved oxygen concentration in the Utrata River, which may be explained by oxidoreduction reactions occurring in the water, or increased microbial activity [47,48].
The chemical oxygen demand in the waters of the Utrata River is strongly negatively correlated with dissolved oxygen concentration, and positively correlated with nutrient content. This is connected with oxidoreduction reactions and self-purification processes in river waters. A high level of COD is associated with the presence of organic substances in the water, which undergo direct oxidation using oxygen contained in the water, or biochemical conversion to inorganic compounds with the participation of microorganisms, using oxygen absorbed from the water [49,50,51]. The research demonstrated that COD concentration increased downstream, which may be related to the accumulation of organic pollutants of municipal and agricultural origin [52]. Elevated COD concentrations, in urban areas, may be due to the discharge of water from sewage treatment plants and the inflow of the Raszynka River, which is heavily loaded with organic compounds [53]. In turn, high COD concentrations during the summer months may be the result of greater inflow of pollutants from agricultural sources. It may also be due to the presence of a large numbers of microorganisms in the river [54,55]. Another potential source of high COD concentrations during the summer months is high temperature, which causes a significant decrease in DO concentration, which oxidises the compounds in water responsible for high COD [56,57]. The rapid increase of COD concentrations during the summer months is caused by the accumulation of many factors: high temperature, low DO concentration, intensive agricultural production, eutrophication, and the presence of sewage; therefore it is very difficult to identify the main source of pollution [58,59,60].
In the areas used for grassland, considerably lower values of all the examined indicators of water pollution were observed. In these areas, the concentrations of total phosphorus, ammonia and nitrate nitrogen and COD were reduced, while DO concentration increased. Many other studies have demonstrated similar correlations, since such areas do not have any sources of pollution of an agricultural, urban or industrial nature [61,62,63].
Urban and agricultural areas have a significantly negative impact on water quality. In these areas, the concentration of total phosphorus, ammonia and nitrate nitrogen and COD increased, while DO concentration decreased. This may be due to surface runoff washing away nutrients, the proximity of sewage treatment plants, the inflow of industrial wastewater and water from storm sewers. Similar correlations have been demonstrated in studies by other researchers [64,65].
5. Conclusions
The Utrata River is polluted with nutrients (total phosphorus, nitrate nitrogen and ammonia nitrogen) in urban and agricultural areas.
During the winter months, with low temperatures, low total precipitation and low water level, local sources, such as sewage treatment plants, are the main source of nitrate nitrogen pollution thereof.
The presence of nutrients—total phosphorus, ammonia nitrogen and nitrate nitrogen—decreases dissolved oxygen concentration and increases chemical oxygen demand.
In order to improve the surface water quality of the Utrata River, it is recommended to increase the efficiency of wastewater treatment, to improve the use of animal manure and fertilisers, and improve the land-use management in the catchment area. It is also recommended to increase the buffer zones between agricultural land and the river.
Author Contributions
Conceptualization, K.D., B.R. and W.S.; methodology, K.D.; software—NOT APPLICABLE validation, K.D., B.R. and W.S.; formal analysis, D.G.; investigation, K.D.; resources, K.D.; data curation, K.D.; writing—original draft preparation, K.D.; writing—review and editing, B.R. and W.S.; visualization, K.D.; supervision, B.R. and W.S.; project administration, B.R.; funding acquisition, K.D. All authors have read and agreed to the published version of the manuscript.
Funding
This research received no external funding.
Institutional Review Board Statement
Not applicable.
Informed Consent Statement
Not applicable.
Data Availability Statement
(a) meteorological data come from the meteorological station located directly at the Experimental Station and are available on the IMiGW website in Warsaw: https://meteomodel.pl/dane/; (b) DOI is given for the scientific works cited; (c) the presented results are original research results not published anywhere and therefore are not available to the public.
Conflicts of Interest
The authors declare no conflict of interest.
References
- Paule-Mercado, M.; Lee, B.; Memon, S.; Umer, S.; Salim, I.; Lee, C.-H. Influence of land development on stormwater runoff from a mixed land use and land cover catchment. Sci. Total. Environ. 2017, 599, 2142–2155. [Google Scholar] [CrossRef] [PubMed]
- Yahya, A.S.A.; Ahmed, A.N.; Othman, F.B.; Ibrahim, R.K.; Afan, H.A.; El-Shafie, A.; Fai, C.M.; Hossain, S.; Ehteram, M.; Elshafie, A. Water quality prediction model based support vector machine model for ungauged river catchment under dual scenarios. Water 2019, 11, 1231. [Google Scholar] [CrossRef] [Green Version]
- Cavalcante, H.; Cruz, P.S.; Viana, L.G.; Silva, D.d.L.; Barbosa, J.E.d.L. Influence of the use and the land cover of the catchment in the water quality of the semiarid tropical reservoirs. J. Hyperspectr. Remote Sens. 2017, 7, 389–398, ISSN:2237-2202. [Google Scholar] [CrossRef] [Green Version]
- Shi, P.; Zhang, Y.; Li, Z.; Li, P.; Xu, G. Influence of land use and land cover patterns on seasonal water quality at multi-spatial scales. Catena 2017, 151, 182–190. [Google Scholar] [CrossRef]
- Peruzzi, C.; Galli, A.; Chiaradia, E.A.; Masseroni, D. Evaluating longitudinal dispersion of scalars in rural channels of agro-urban envi-ronments. Environ. Fluid Mech. 2021, 21, 925–954. [Google Scholar] [CrossRef]
- Rodrigues, V.; Estrany, J.; Ran-zini, M.; de Cicco, V.; Tarjuelo Martín-Benito, J.M.; Hedo, J.; Lucas-Borja, M.E. Effects of land use and seasonality on stream water quality in a small tropical catchment: The headwater of Córrego Água Limpa, São Paulo (Brazil). Sci. Total Environ. 2018, 622, 1553–1561. [Google Scholar] [CrossRef] [PubMed] [Green Version]
- Bartnicki, J. Atmospheric contribution to eutrophication of the Baltic Sea. In Air Pollution Modeling and its Application XXVI; Springer: Cham, Switzerland, 2018; pp. 53–57. [Google Scholar]
- Rattan, K.; Corriveau, J.; Brua, R.; Culp, J.; Yates, A.; Chambers, P. Quantifying seasonal variation in total phosphorus and nitrogen from prairie streams in the Red River Basin, Manitoba Canada. Sci. Total. Environ. 2017, 575, 649–659. [Google Scholar] [CrossRef]
- Shi, P.; Zhang, Y.; Song, J.; Li, P.; Wang, Y.; Zhang, X.; Li, Z.; Bi, Z.; Zhang, X.; Qin, Y.; et al. Response of nitrogen pollution in surface water to land use and social-economic factors in the Weihe River watershed, northwest China. Sustain. Cities Soc. 2019, 50, 101658. [Google Scholar] [CrossRef]
- Schmadel, N.M.; Harvey, J.W.; Alexander, R.B.; Schwarz, G.E.; Moore, R.B.; Eng, K.; Gomez-Velez, J.; Boyer, E.; Scott, D. Thresholds of lake and reservoir connectivity in river networks control nitrogen removal. Nat. Commun. 2018, 9, 2779. [Google Scholar] [CrossRef] [Green Version]
- Abed, S.A.; Ewaid, S.; Al-Ansari, N. Evaluation of water quality in the Tigris River within Baghdad, Iraq using multivariate statistical techniques. J. Phys. Conf. Ser. 2019, 1294, 072025. [Google Scholar] [CrossRef]
- Li, C.; Liu, Q.; Lei, G.; Wu, B. The NH_4^+ -N Pollution in the Liuxi River and the Correlations Analysis of NH_4^+ -N and TN, COD, DO. Int. Core J. Eng. 2020, 6, 64–68. [Google Scholar] [CrossRef]
- Arif, M.; Kumar, R.; Parveen, S.; Verma, N. Reduction in water pollution in Yamuna River due to lockdown under COVID-19 pandemic. Pharma Innov. J. 2020, 9, 84–89. [Google Scholar]
- Csábrági, A.; Molnár, S.; Tanos, P.; Kovács, J.; Molnár, M.; Szabó, I.; Hatvani, I.G. Estimation of dissolved oxygen in riverine ecosystems: Comparison of differently optimized neural networks. Ecol. Eng. 2019, 138, 298–309. [Google Scholar] [CrossRef]
- Rout, C. Assessment of water quality: A case study of river Yamuna. Int. J. Earth Sci. Eng. 2017, 10, 398–403. [Google Scholar] [CrossRef]
- Jarvie, H.P.; Neal, C.; Withers, P.J. Sewage-effluent phosphorus: A greater risk to river eutrophication than agricultural phosphorus? Sci. Total. Environ. 2006, 360, 246–253. [Google Scholar] [CrossRef] [PubMed]
- Hilton, J.; O′Hare, M.; Bowes, M.; Jones, J.I. How green is my river? A new paradigm of eutrophication in rivers. Sci. Total. Environ. 2006, 365, 66–83. [Google Scholar] [CrossRef]
- Wojtkowska, M. Wpływ sposobu zagospodarowania zlewni na poziom zanieczyszczenia rzeki Utraty. Gaz Woda Tech. Sanit. 2006, 11, 70–72. [Google Scholar]
- Rydałowski, M.; Jurczuk, S.; Łempicka, A. Charakterystyka sprzętu i organizacji użytkowania środków ochrony roślin w gospodarstwach na terenie Utraty. Water Environ. Rural Areas 2008, 8, 63–79. [Google Scholar]
- Google Maps. Available online: https://www.google.com/maps/@52.0870381,20.6425979,43960m/data=!3m1!1e3 (accessed on 30 September 2021).
- PN EN 25813: Water Quality—Determination of Dissolved Oxygen—Iodometric Method; Polish Committee for Standardization: Warsaw, Poland, 1997.
- PN EN ISO 8467: Water Quality–Determination of Permanganate Index; Polish Committee for Standardization: Warsaw, Poland, 2001.
- PN EN ISO 6878: Water Quality—Determination of Phosphorus—Ammonium Molybdate Spectrometric Method; Polish Committee for Standardization: Warsaw, Poland, 2006.
- PN-EN ISO 11732: Water Quality—Determination of Ammonium Nitrogen by Flow Analysis (CFA and FIA) and Spectrometric Detection; Polish Committee for Standardization: Warsaw, Poland, 2007.
- Stackpoole, S.M.; Stets, E.G.; Sprague, L.A. Variable impacts of contemporary versus legacy agricultural phosphorus on US river water quality. Proc. Natl. Acad. Sci. USA 2019, 116, 20562–20567. [Google Scholar] [CrossRef] [Green Version]
- Hu, Y.; Long, C.M.; Wang, Y.-C.; Kerkez, B.; Scavia, D. Urban total phosphorus loads to the St. Clair-Detroit River System. J. Great Lakes Res. 2019, 45, 1142–1149. [Google Scholar] [CrossRef]
- Dey, G.; Banerjee, P.; Sharma, R.K.; Maity, J.P.; Etesami, H.; Shaw, A.K.; Huang, Y.-H.; Huang, H.-B.; Chen, C.-Y. Management of phosphorus in salinity-stressed agriculture for sustainable crop production by salt-tolerant phosphate-solubilizing bacteria—A review. Agronomy 2021, 11, 1552. [Google Scholar] [CrossRef]
- Pistocchi, C.; Tamburini, F.; Gruau, G.; Ferhi, A.; Trevisan, D. Tracing the sources and cycling of phosphorus in river sediments using oxygen isotopes: Methodological adaptations and first results from a case study in France. Water Res. 2017, 111, 346–356. [Google Scholar] [CrossRef] [PubMed] [Green Version]
- Podedworna, J. Ocena efektu ekologicznego modernizacji i rozbudowy oczyszczalni ścieków dla potrzeb analizy porealizacyjnej—Zagadnienia metodyczne i studium przypadku oddziaływania ścieków oczyszczonych na jakość wód odbiornika. Gaz Woda Tech. Sanit. 2017, 1, 25–30. [Google Scholar] [CrossRef]
- Burzyńska, I. Evaluation of selected physical and chemical indicators in Raszynka River. Woda Środowisko Obszary Wiejskie 2016, 16, 23–34. [Google Scholar]
- Ji, W.; Xiao, J.; Toor, G.S.; Li, Z. Nitrate-nitrogen transport in streamwater and groundwater in a loess covered region: Sources, drivers, and spatiotemporal variation. Sci. Total. Environ. 2021, 761, 143278. [Google Scholar] [CrossRef]
- Yi, Q.; Chen, Q.; Hu, L.; Shi, W. Tracking nitrogen sources, transformation, and transport at a basin scale with complex plain river networks. Environ. Sci. Technol. 2017, 51, 5396–5403. [Google Scholar] [CrossRef]
- Dolgov, S.V.; Koronkevich, N.I. Biogenic runoff from the Nizhny Novgorod area. Water Resour. 2019, 46, S94–S100. [Google Scholar] [CrossRef]
- Tang, J. Dynamic linkages between vegetation phenology and seasonal changes in water quality in the Choptank watershed, USA. Int. J. Remote. Sens. 2015, 36, 3041–3057. [Google Scholar] [CrossRef]
- De Girolamo, A.M.; Balestrini, R.; D′Ambrosio, E.; Pappagallo, G.; Soana, E.; Porto, A.L. Antropogenic input of nitrogen and riverine export from a Mediterranean catchment. The Celone, a temporary river case study. Agric. Water Manag. 2017, 187, 190–199. [Google Scholar] [CrossRef]
- Malagó, A.; Bouraoui, F.; Vigiak, O.; Grizzetti, B.; Pastori, M. Modelling water and nutrient fluxes in the Danube River basin with SWAT. Sci. Total. Environ. 2017, 603, 196–218. [Google Scholar] [CrossRef] [PubMed]
- Hu, Y.; Lu, Y.; Liu, C.; Shang, P.; Liu, J.; Zheng, C. Sources and dynamics of dissolved inorganic carbon, nitrogen, and phosphorus in a large agricultural river basin in Arid Northwestern China. Water 2017, 9, 415. [Google Scholar] [CrossRef] [Green Version]
- Ağca, N.; Doğan, K. Assessment of ammonium, nitrate and phosphorus pollution in the Asi River. In Proceedings of the 1st International Congress on Biosystems Engineering (ICOBEN 2019), Antakya, Turkey, 24–27 September 2019. [Google Scholar]
- Kadriu, S.; Sadiku, M.; Kelmendi, M.; Shala, A. The impact of polluting sources on the physical-chemical properties of water in the Curved River in Kosovo. J. Environ. Treat. Tech. 2020, 9, 368–374. [Google Scholar] [CrossRef]
- Borysiewicz, A.; Bonisławska, M.; Czerniejewski, P.; Kierasiński, B. Quality analysis of waters from selected small water courses within the river basins of Odra River and Wisła River. Rocznik Ochrona Środowiska 2019, 21, 1202–1216. [Google Scholar]
- Lin, J.; Chen, N.; Wang, F.; Huang, Z.; Zhang, X.; Liu, L. Urbanization increased river nitrogen export to western Taiwan Strait despite increased retention by nitrification and denitrification. Ecol. Indic. 2020, 109, 105756. [Google Scholar] [CrossRef]
- Null, S.E.; Mouzon, N.R.; Elmore, L.R. Dissolved oxygen, stream temperature, and fish habitat response to environmental water purchases. J. Environ. Manag. 2017, 197, 559–570. [Google Scholar] [CrossRef] [PubMed]
- Hosseini, N.; Johnston, J.; Lindenschmidt, K.-E. Impacts of climate change on the water quality of a regulated Prairie River. Water 2017, 9, 199. [Google Scholar] [CrossRef] [Green Version]
- Huang, J.; Yin, H.; Chapra, S.C.; Zhou, Q. Modelling dissolved oxygen depression in an Urban River in China. Water 2017, 9, 520. [Google Scholar] [CrossRef] [Green Version]
- Yaseen, Z.M.; Ehteram, M.; Sharafati, A.; Shahid, S.; Al-Ansari, N.; El-Shafie, A. The integration of nature-inspired algorithms with least square support vector regression models: Application to modeling river dissolved oxygen concentration. Water 2018, 10, 1124. [Google Scholar] [CrossRef] [Green Version]
- Mena-Rivera, L.; Salgado-Silva, V.; Benavides-Benavides, C.; Coto-Campos, J.M.; Swinscoe, T.H.A. Spatial and seasonal surface water quality assessment in a tropical urban catchment: Burío River, Costa Rica. Water 2017, 9, 558. [Google Scholar] [CrossRef] [Green Version]
- Basheer, A.O.; Hanafiah, M.M.; Abdulhasan, M.J. A study on water quality from Langat River, Selangor. Acta Sci. Malays. 2017, 1, 1–4. [Google Scholar] [CrossRef]
- Ahmed, A.M. Prediction of dissolved oxygen in Surma River by biochemical oxygen demand and chemical oxygen demand using the artificial neural networks (ANNs). J. King Saud. Univ. Eng. Sci. 2017, 29, 151–158. [Google Scholar] [CrossRef] [Green Version]
- Grzywna, A. The change of quantity and quality outflow of water in Ochożanka River basin. J. Water Land Dev. 2017, 35, 57–62. [Google Scholar] [CrossRef]
- Sokolov, D.; Erina, O.; Tereshina, M.; Chalov, S. Human impact on organic matter distribution in the Moskva River. In E3S Web of Conferences; EDP Sciences: Les Ulis, France, 2020; Volume 163, p. 05013. [Google Scholar]
- Arifi, K.; Tahri, L.; El Abid, A.; Hafiane, F.Z.; Elblidi, S.; Yahyaoui, A.; Fekhaoui, M. Impact of wastewater from the rural commune of Jmaa Moulblad on the physico-chemical quality of the waters of the Grou River (Rabat region, Morocco). In E3S Web of Conferences; EDP Sciences: Les Ulis, France, 2018; Volume 37, p. 01008. [Google Scholar]
- Duca, G.; Mereuta, A.; Velisco, N.; Tanaselia, C.; Mitina, T. Determination of quality indicators of Prut River water. Chem. J. Mold. 2019, 14, 61–67. [Google Scholar] [CrossRef]
- Zhu, L.; Song, J.; Liu, W. Using CSLD method to calculate COD pollution load of Wei River watershed above Huaxian Section, China. In IOP Conference Series: Earth and Environmental Science; IOP Publishing: Bristol, UK, 2017; Volume 100, p. 12016. [Google Scholar]
- Mirsaeedghazi, H. Effect of trout farm on the water quality of river using Iran water quality index (IRQWI): A case study on Deinachal River. J. Food Bioprocess Eng. 2018, 1, 13–20. [Google Scholar]
- Wu, Y.; Lin, H.; Yin, W.; Shao, S.; Lv, S.; Hu, Y. Water quality and microbial community changes in an Urban River after micro-nano bubble technology in situ treatment. Water 2019, 11, 66. [Google Scholar] [CrossRef] [Green Version]
- Nguyen, G.T. Evaluating current water quality monitoring system on Hau River, Mekong Delta, Vietnam using multivariate statistical techniques. Appl. Environ. Res. 2020, 42, 14–25. [Google Scholar] [CrossRef]
- Burzyńska, I. Monitoring of selected fertilizer nutrients in surface waters and soils of agricultural land in the river valley in Central Poland. J. Water Land Dev. 2019, 43, 41–48. [Google Scholar] [CrossRef] [Green Version]
- Kumar, B.; Singh, U.K.; Ojha, S.N. Evaluation of geochemical data of Yamuna River using WQI and multivariate statistical analyses: A case study. Int. J. River Basin Manag. 2019, 17, 143–155. [Google Scholar] [CrossRef]
- Uddin, N.; Jamil, N.A.H.M.; Reza, S. Seasonal variations and assessment of oxygen demanding parameters (DO, BOD, COD) in Solmari River, Bangladesh. Int. J. Eng. Sci. IJES 2017, 6, 45–48. [Google Scholar] [CrossRef]
- Mishra, B.K.; Regmi, R.K.; Masago, Y.; Fukushi, K.; Kumar, P.; Saraswat, C. Assessment of Bagmati river pollution in Kathmandu Valley: Scenario-based modeling and analysis for sustainable urban development. Sustain. Water Qual. Ecol. 2017, 9, 67–77. [Google Scholar] [CrossRef]
- Pang, Y.; Xiang, S.; Chu, Z.-S.; Xue, L.-Q.; Ye, B.-B. Relationship between agricultural land and water quality of Inflow River in Erhai Lake basin. Huan Jing Ke Xue Huanjing Kexue 2015, 36, 4005–4012. [Google Scholar] [PubMed]
- Ahearn, D.S.; Sheibley, R.W.; Dahlgren, R.A.; Anderson, M.; Johnson, J.; Tate, K.W. Land use and land cover influence on water quality in the last free-flowing river draining the western Sierra Nevada, California. J. Hydrol. 2005, 313, 234–247. [Google Scholar] [CrossRef]
- Namugize, J.N.; Jewitt, G.; Graham, M. Effects of land use and land cover changes on water quality in the uMngeni river catchment, South Africa. Phys. Chem. Earth Parts A B C 2018, 105, 247–264. [Google Scholar] [CrossRef]
- Wojtkowska, M.; Bojanowski, D. Influence of catchment use on the degree of river water pollution by forms of phosphorus. Rocznik Ochrona Środowiska 2018, 20, 887–904. [Google Scholar]
- Zhang, W.; Jin, X.; Zhu, X.; Meng, X.; Zhu, Y.; Zhang, C.; Tang, W.; Shan, B. Do NH 3 and chemical oxygen demand induce continuous release of phosphorus from sediment in heavily polluted rivers? Ecol. Eng. 2017, 102, 24–30. [Google Scholar] [CrossRef]
Figure 1.
Study area—land use [20].
Figure 1.
Study area—land use [20].
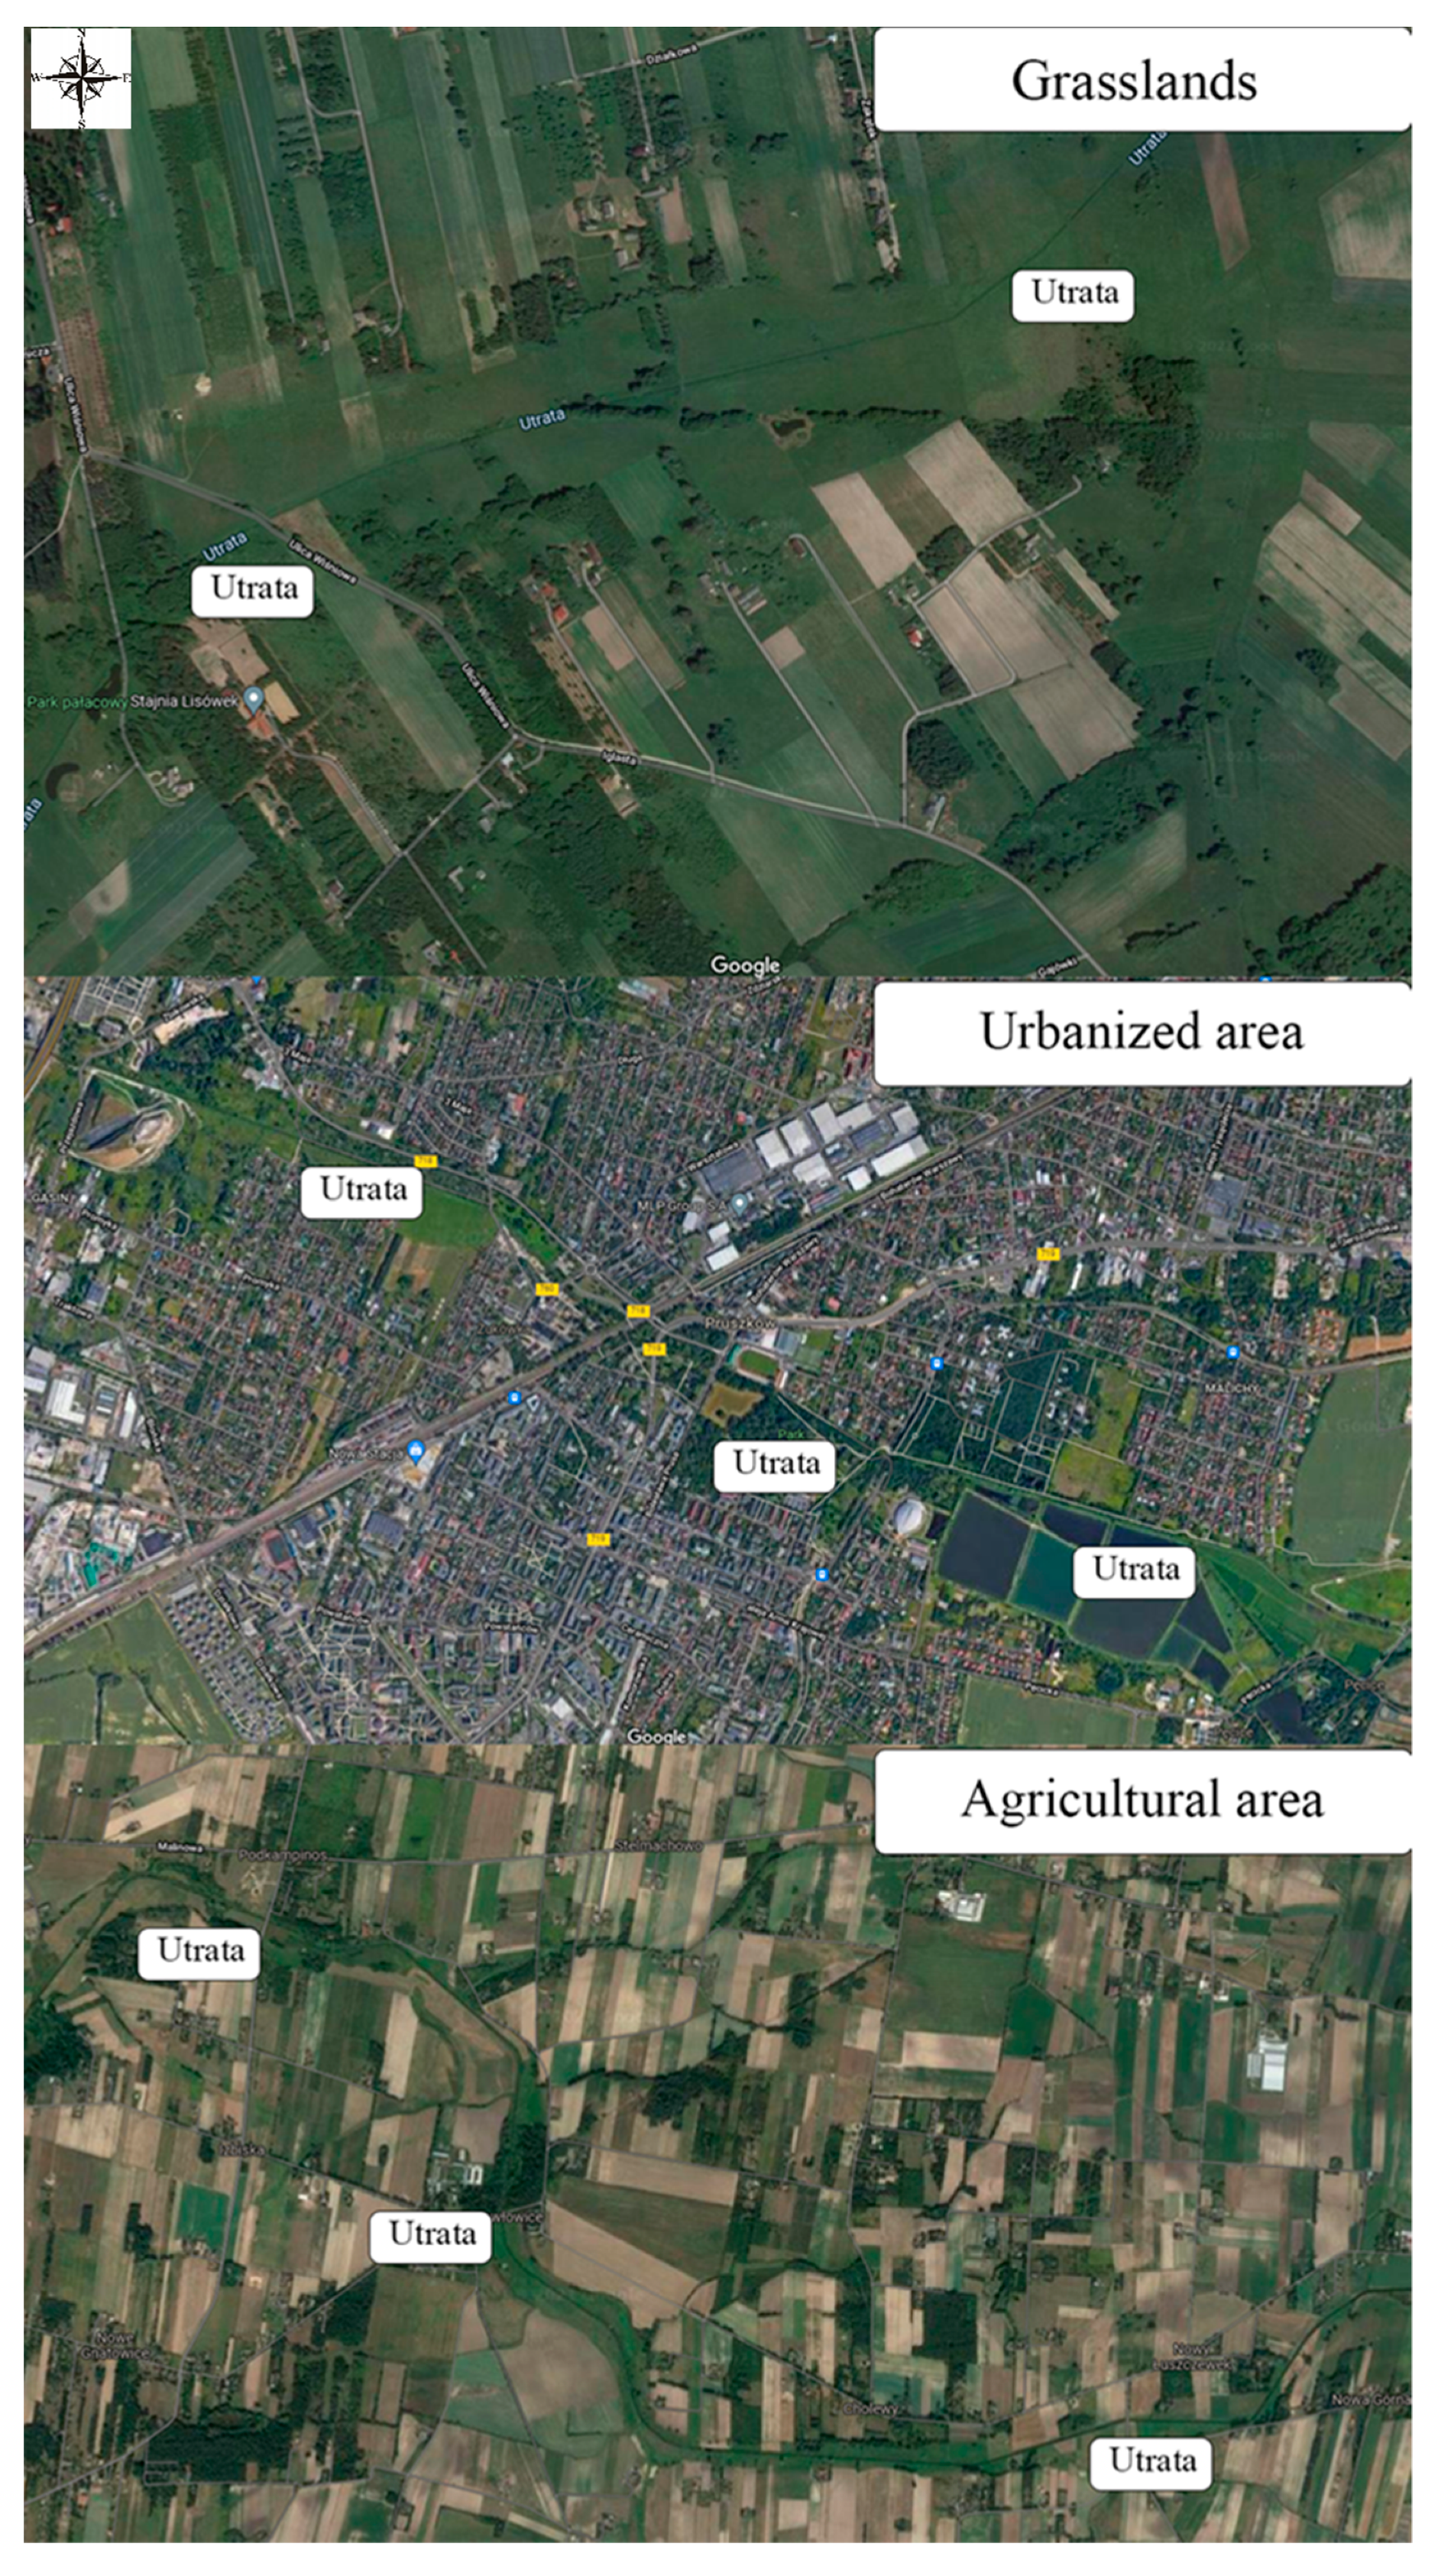
Figure 2.
Study area—locations of control-measurement points on the Utrata river; https://mapy.geoportal.gov.pl/imap/Imgp_2.html?gpmap=gp0 (accessed on 1 August 2021).
Figure 2.
Study area—locations of control-measurement points on the Utrata river; https://mapy.geoportal.gov.pl/imap/Imgp_2.html?gpmap=gp0 (accessed on 1 August 2021).
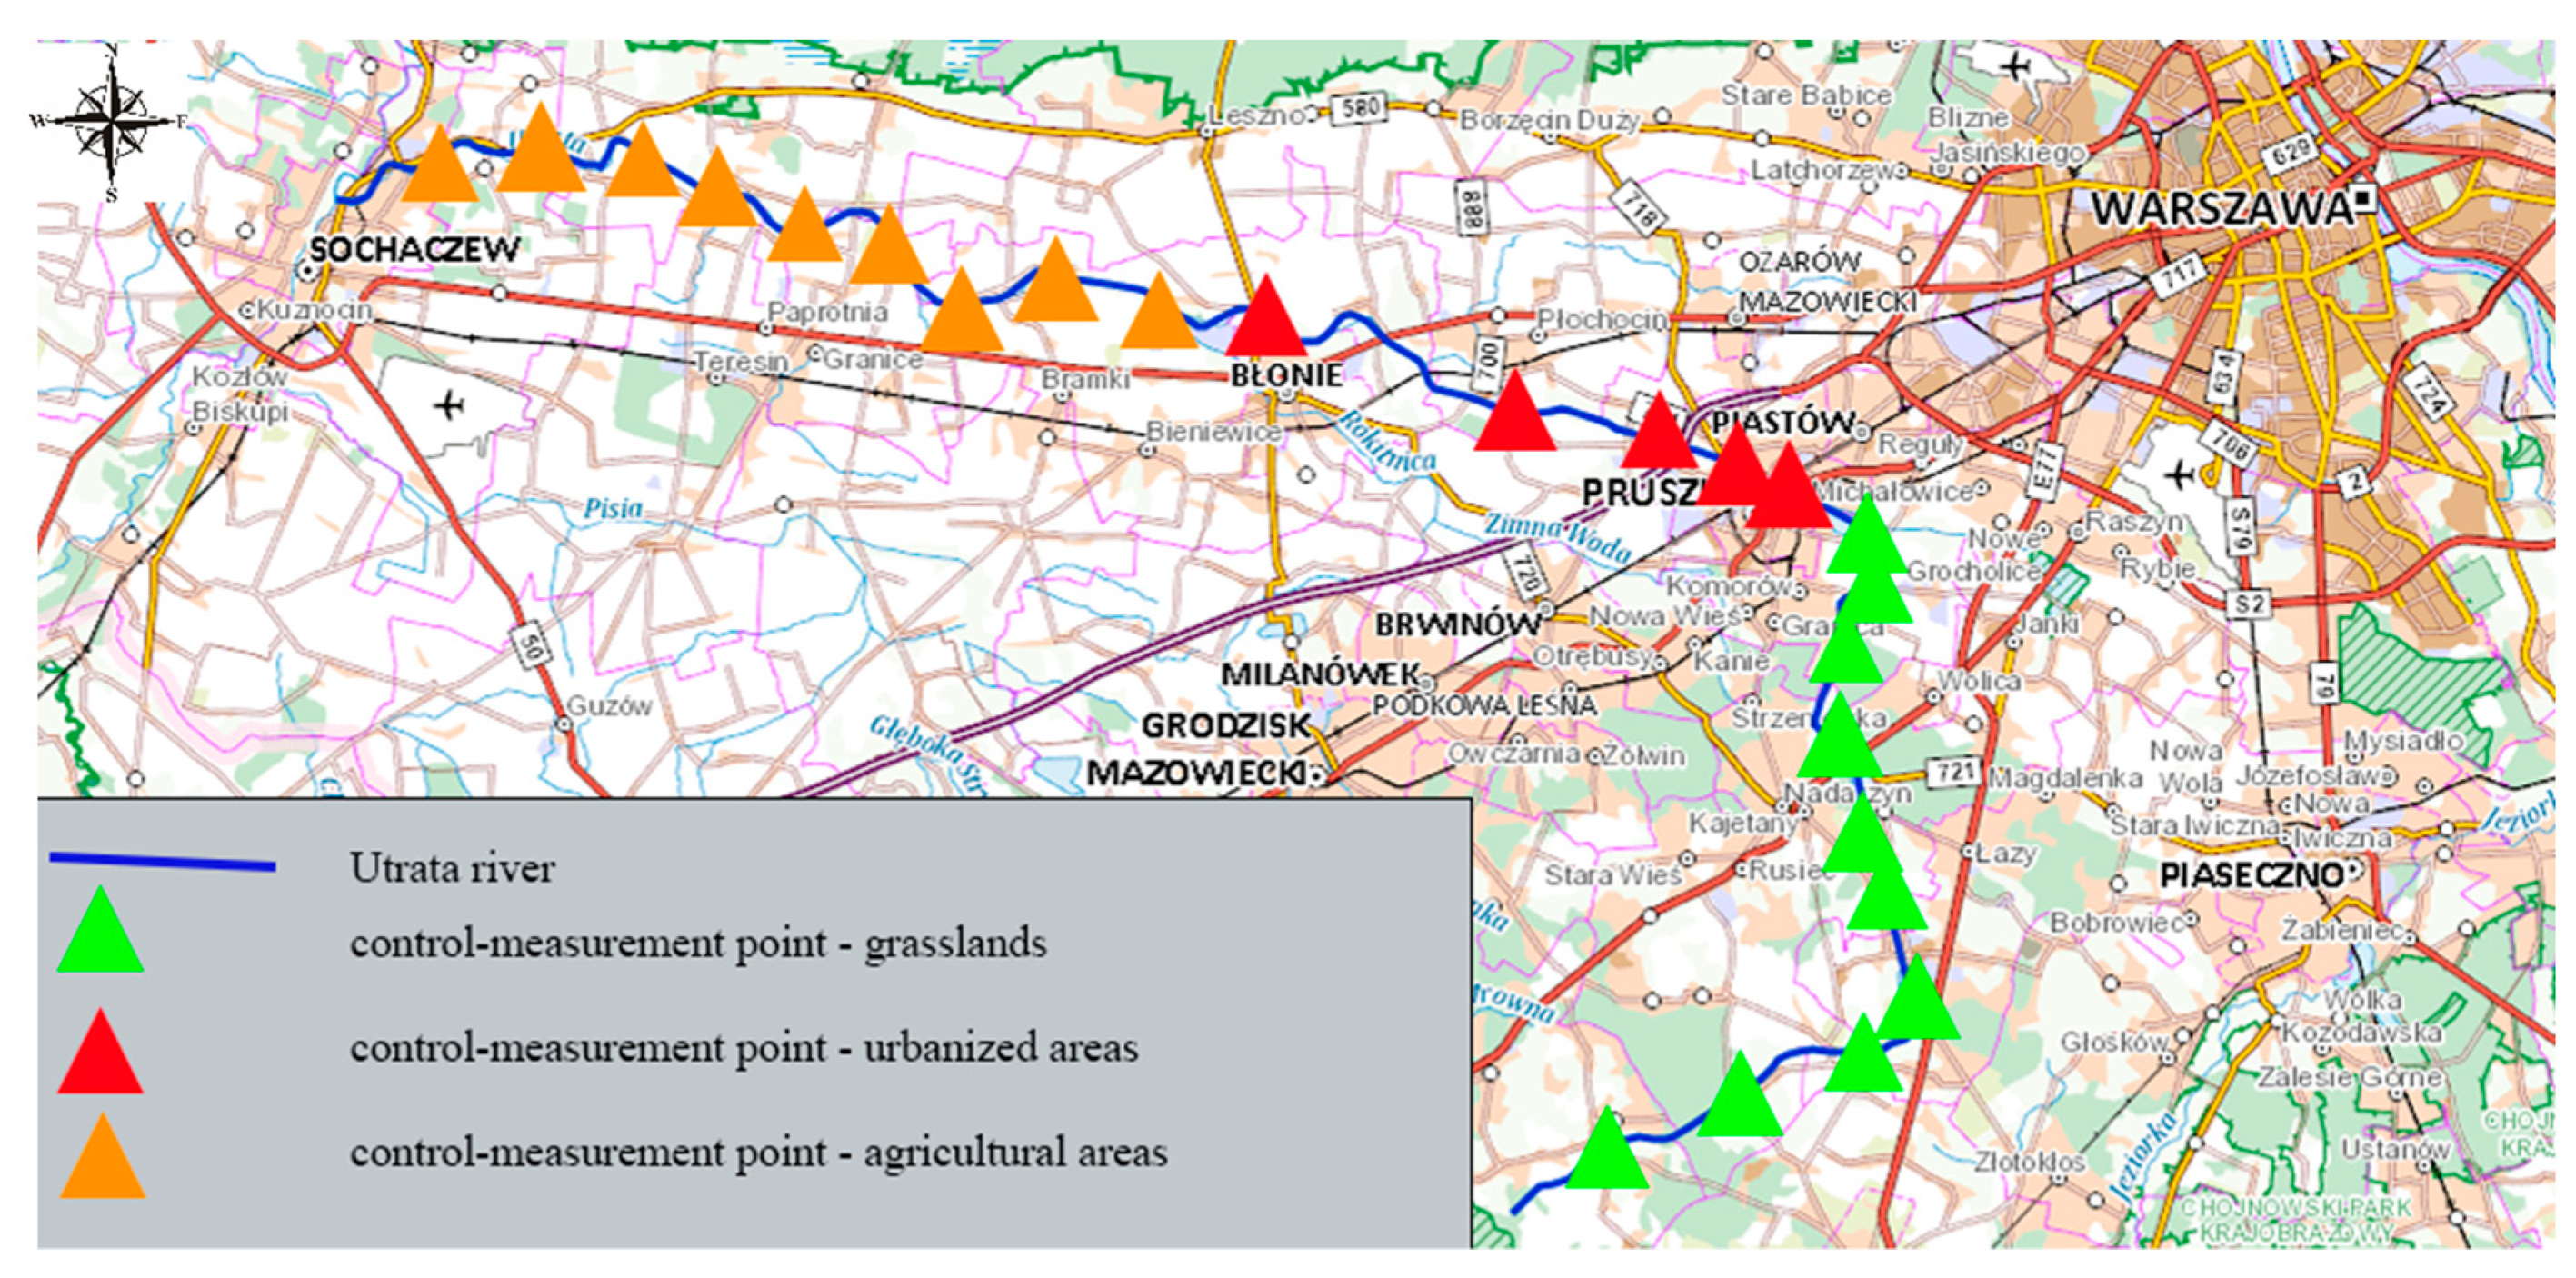
Figure 3.
Mean and standard deviation for the total phosphorus concentration in the water as a function of sampling date and catchment area land use.
Figure 3.
Mean and standard deviation for the total phosphorus concentration in the water as a function of sampling date and catchment area land use.

Figure 4.
Mean and standard deviation for nitrates in the water as a function of sampling date and catchment area land use.
Figure 4.
Mean and standard deviation for nitrates in the water as a function of sampling date and catchment area land use.

Figure 5.
Mean and standard deviation for nitroge from ammonia in the water as a function of sampling date and catchment area land use.
Figure 5.
Mean and standard deviation for nitroge from ammonia in the water as a function of sampling date and catchment area land use.

Figure 6.
Mean and standard deviation for the concentration of dissolved oxygen in the water as a function of sampling date and catchment area land use.
Figure 6.
Mean and standard deviation for the concentration of dissolved oxygen in the water as a function of sampling date and catchment area land use.

Figure 7.
Mean and standard deviation for the concentration of COD in water as a function of sampling date and catchment area land use.
Figure 7.
Mean and standard deviation for the concentration of COD in water as a function of sampling date and catchment area land use.

Figure 8.
PCA analysis for the relationships between: catchment area land use, weather conditions and total phosphorus concentration in the Utrata River.
Figure 8.
PCA analysis for the relationships between: catchment area land use, weather conditions and total phosphorus concentration in the Utrata River.

Figure 9.
PCA analysis for the relationships between: catchment area land use, weather conditions and nitrate nitrogen concentration in the Utrata River.
Figure 9.
PCA analysis for the relationships between: catchment area land use, weather conditions and nitrate nitrogen concentration in the Utrata River.
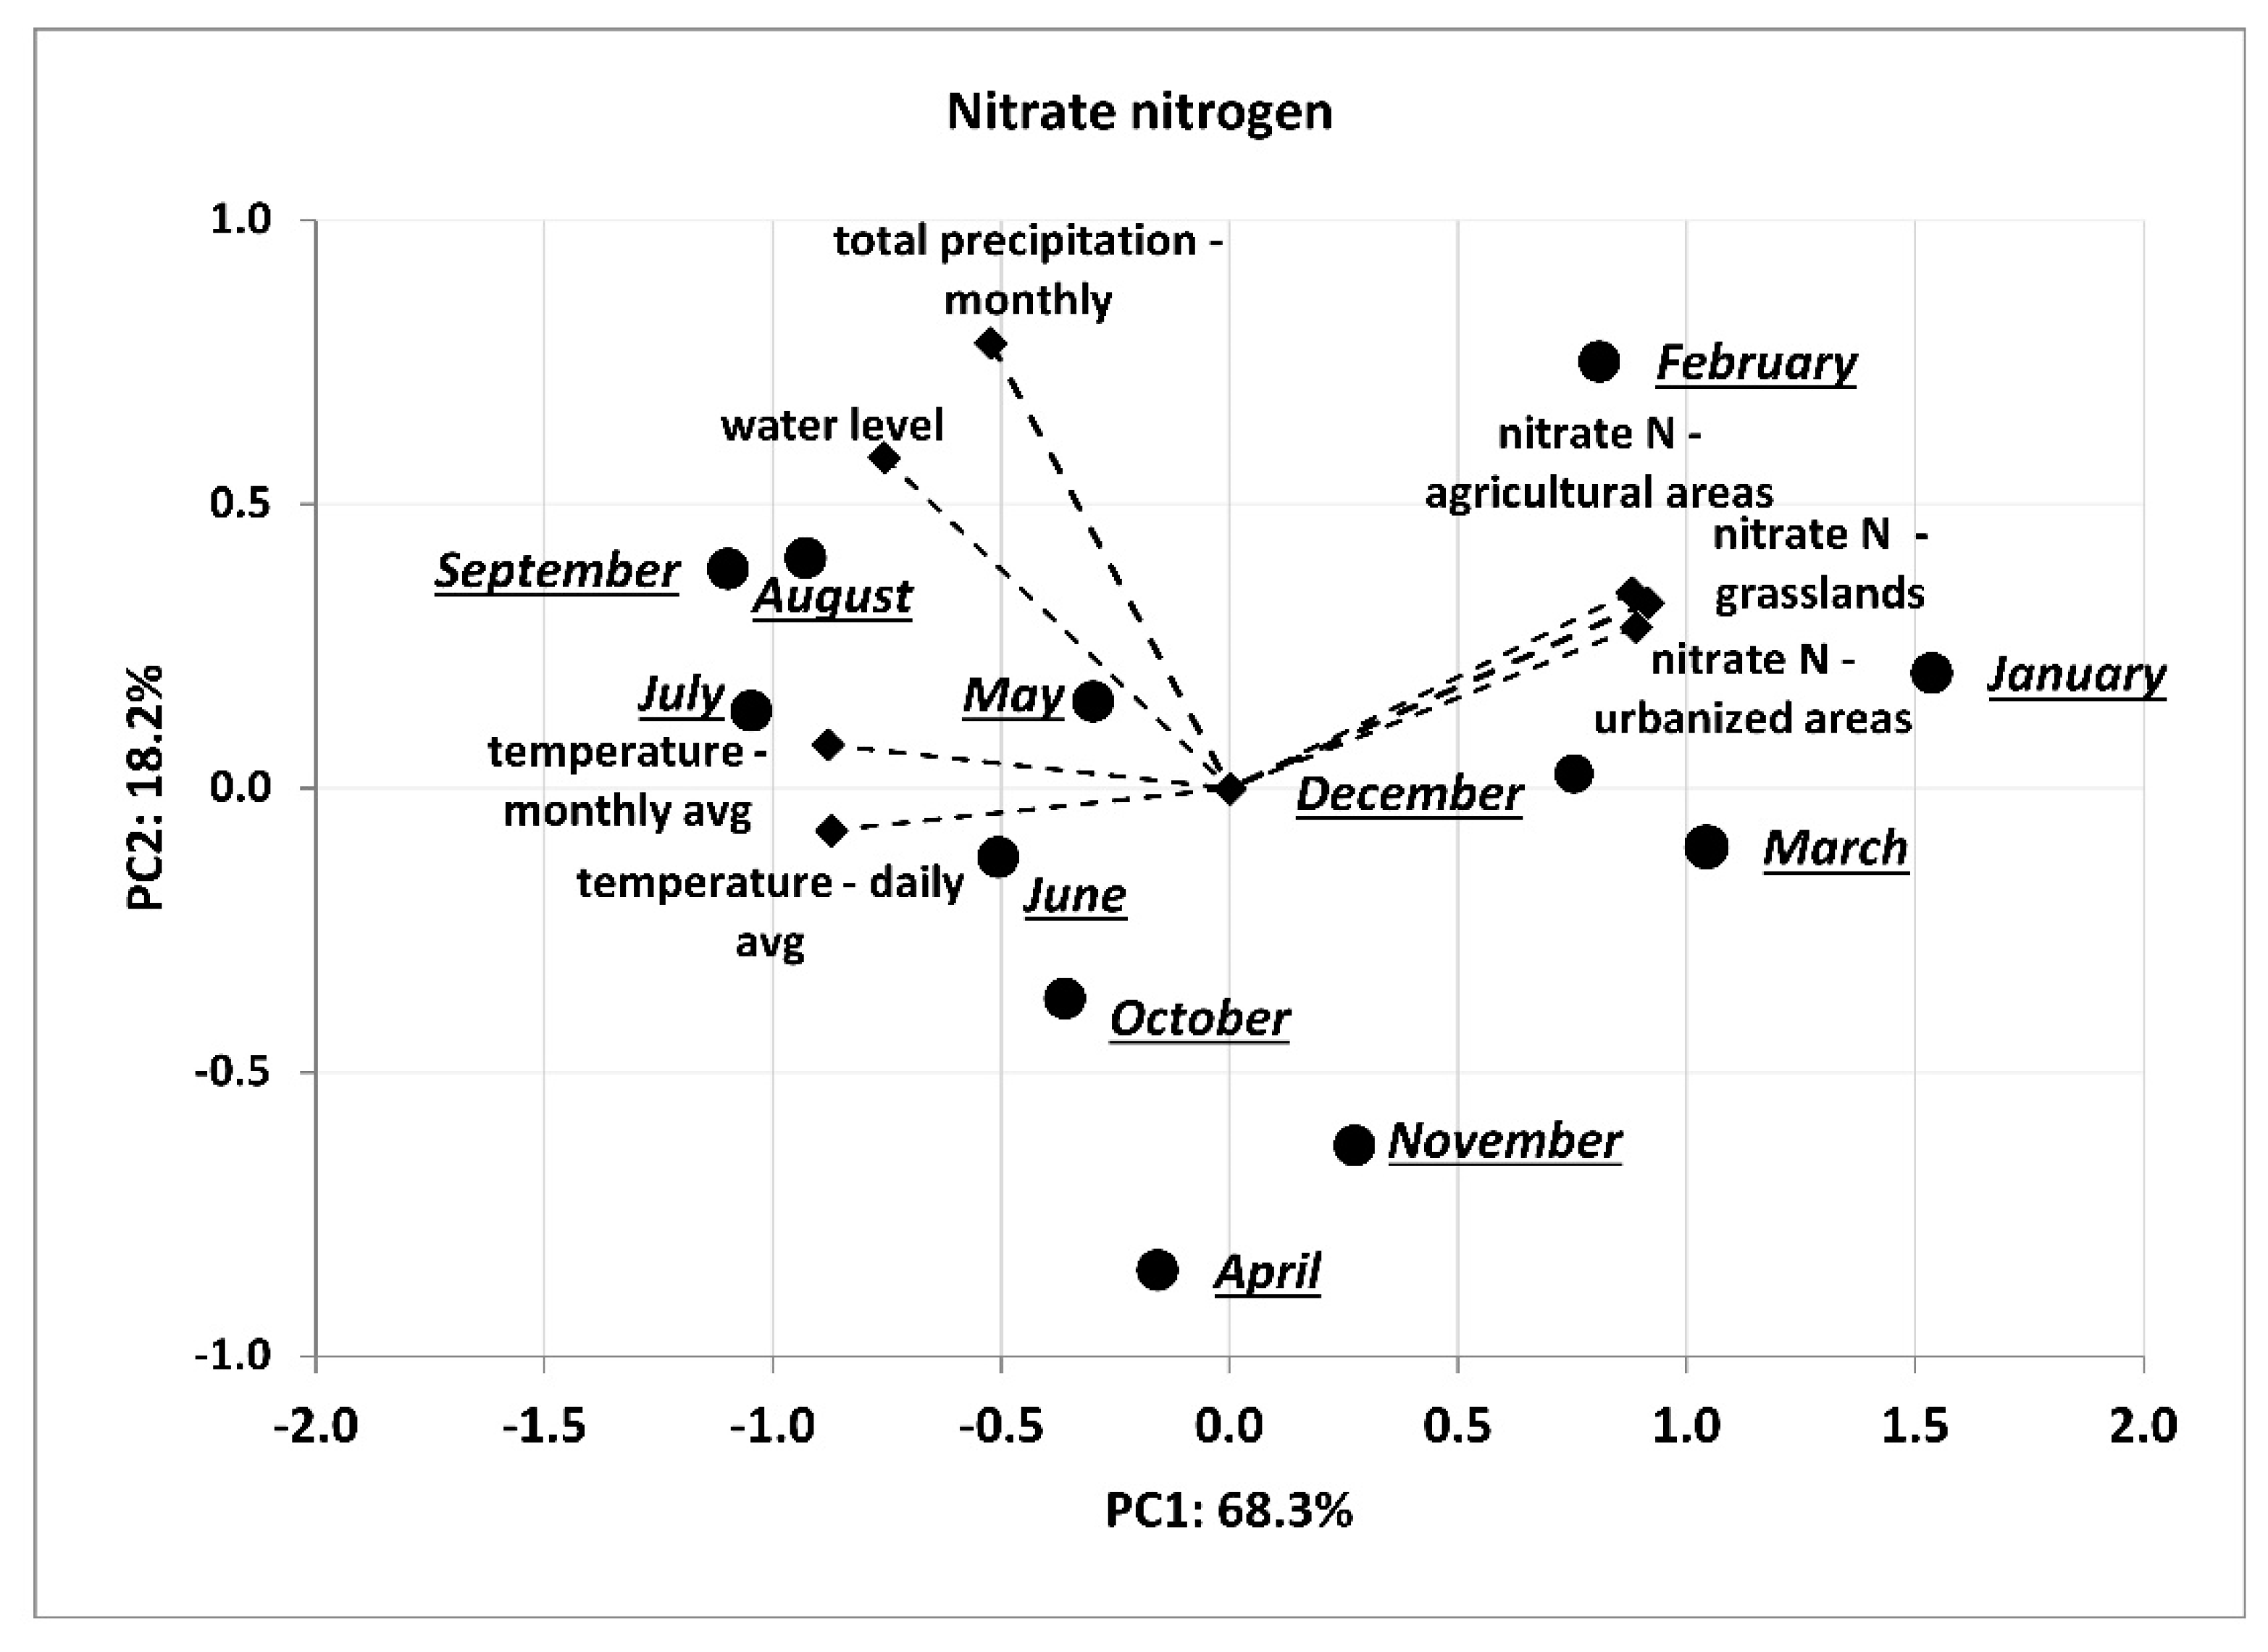
Figure 10.
PCA analysis for the relationships between: catchment area land use, weather conditions and ammonium nitrogen concentration in the Utrata River.
Figure 10.
PCA analysis for the relationships between: catchment area land use, weather conditions and ammonium nitrogen concentration in the Utrata River.
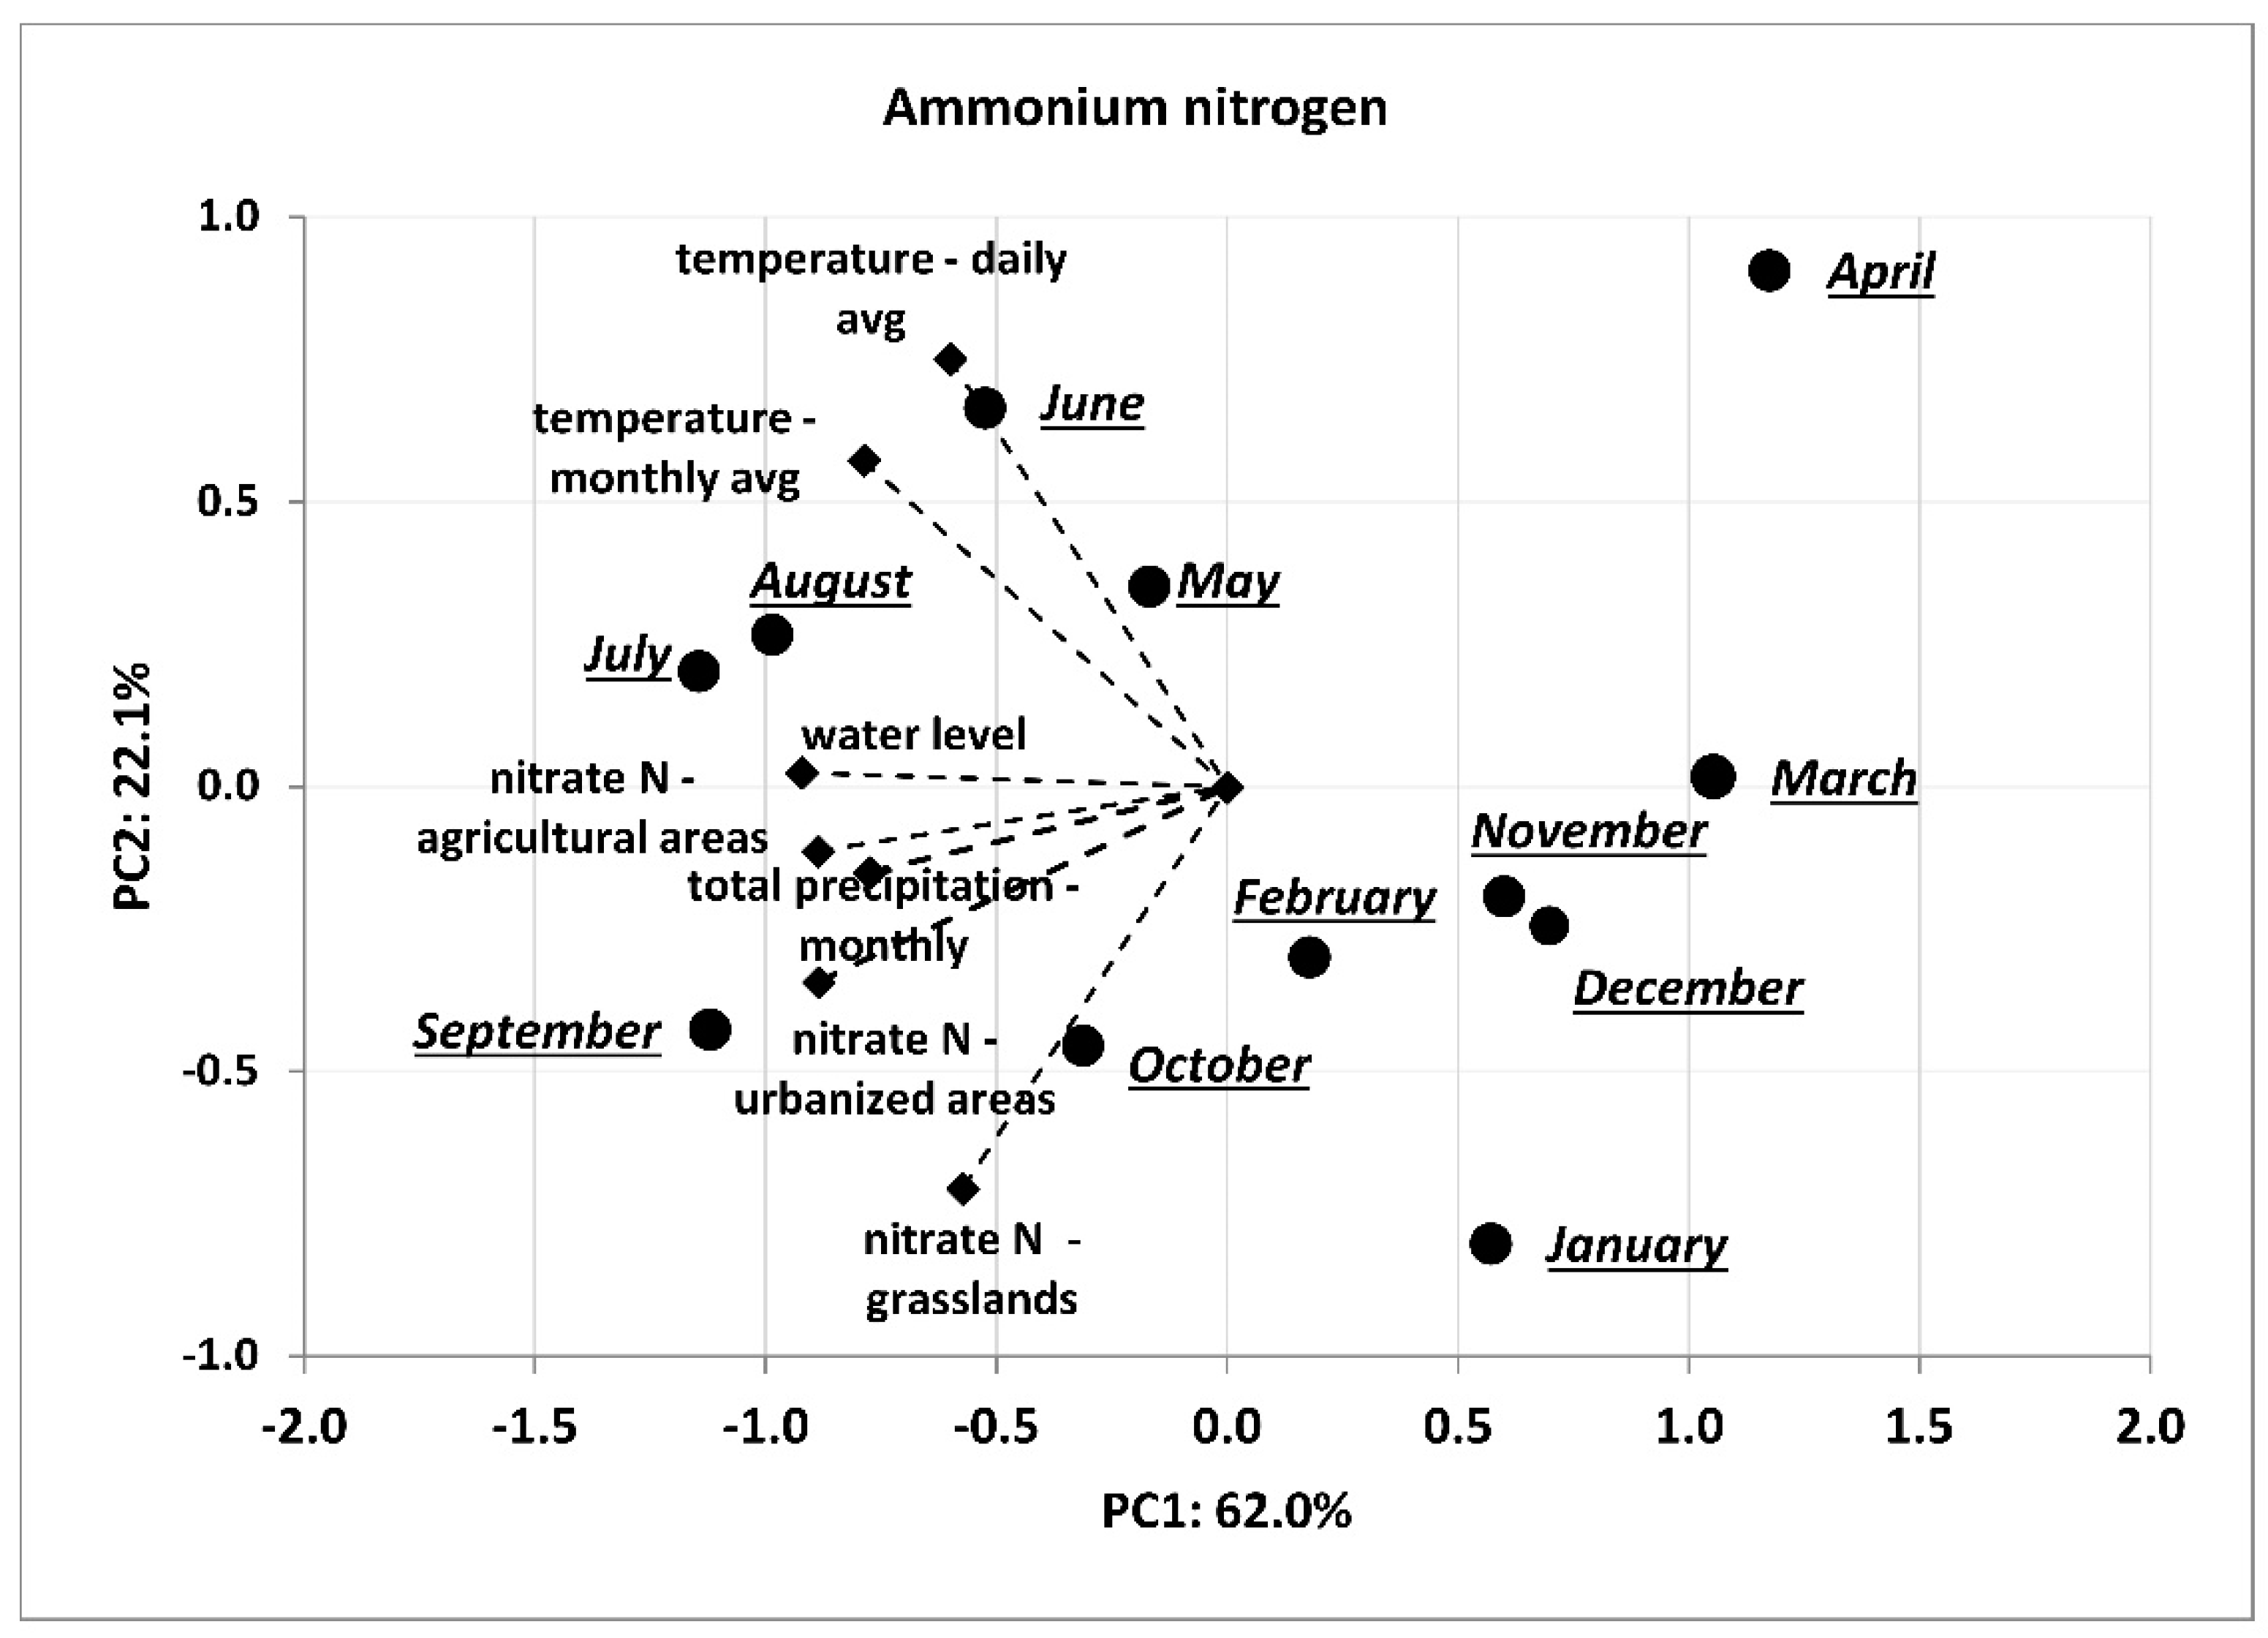
Figure 11.
PCA analysis for the relationships between: catchment area land use, weather conditions and dissolved oxygen concentration in the Utrata River.
Figure 11.
PCA analysis for the relationships between: catchment area land use, weather conditions and dissolved oxygen concentration in the Utrata River.
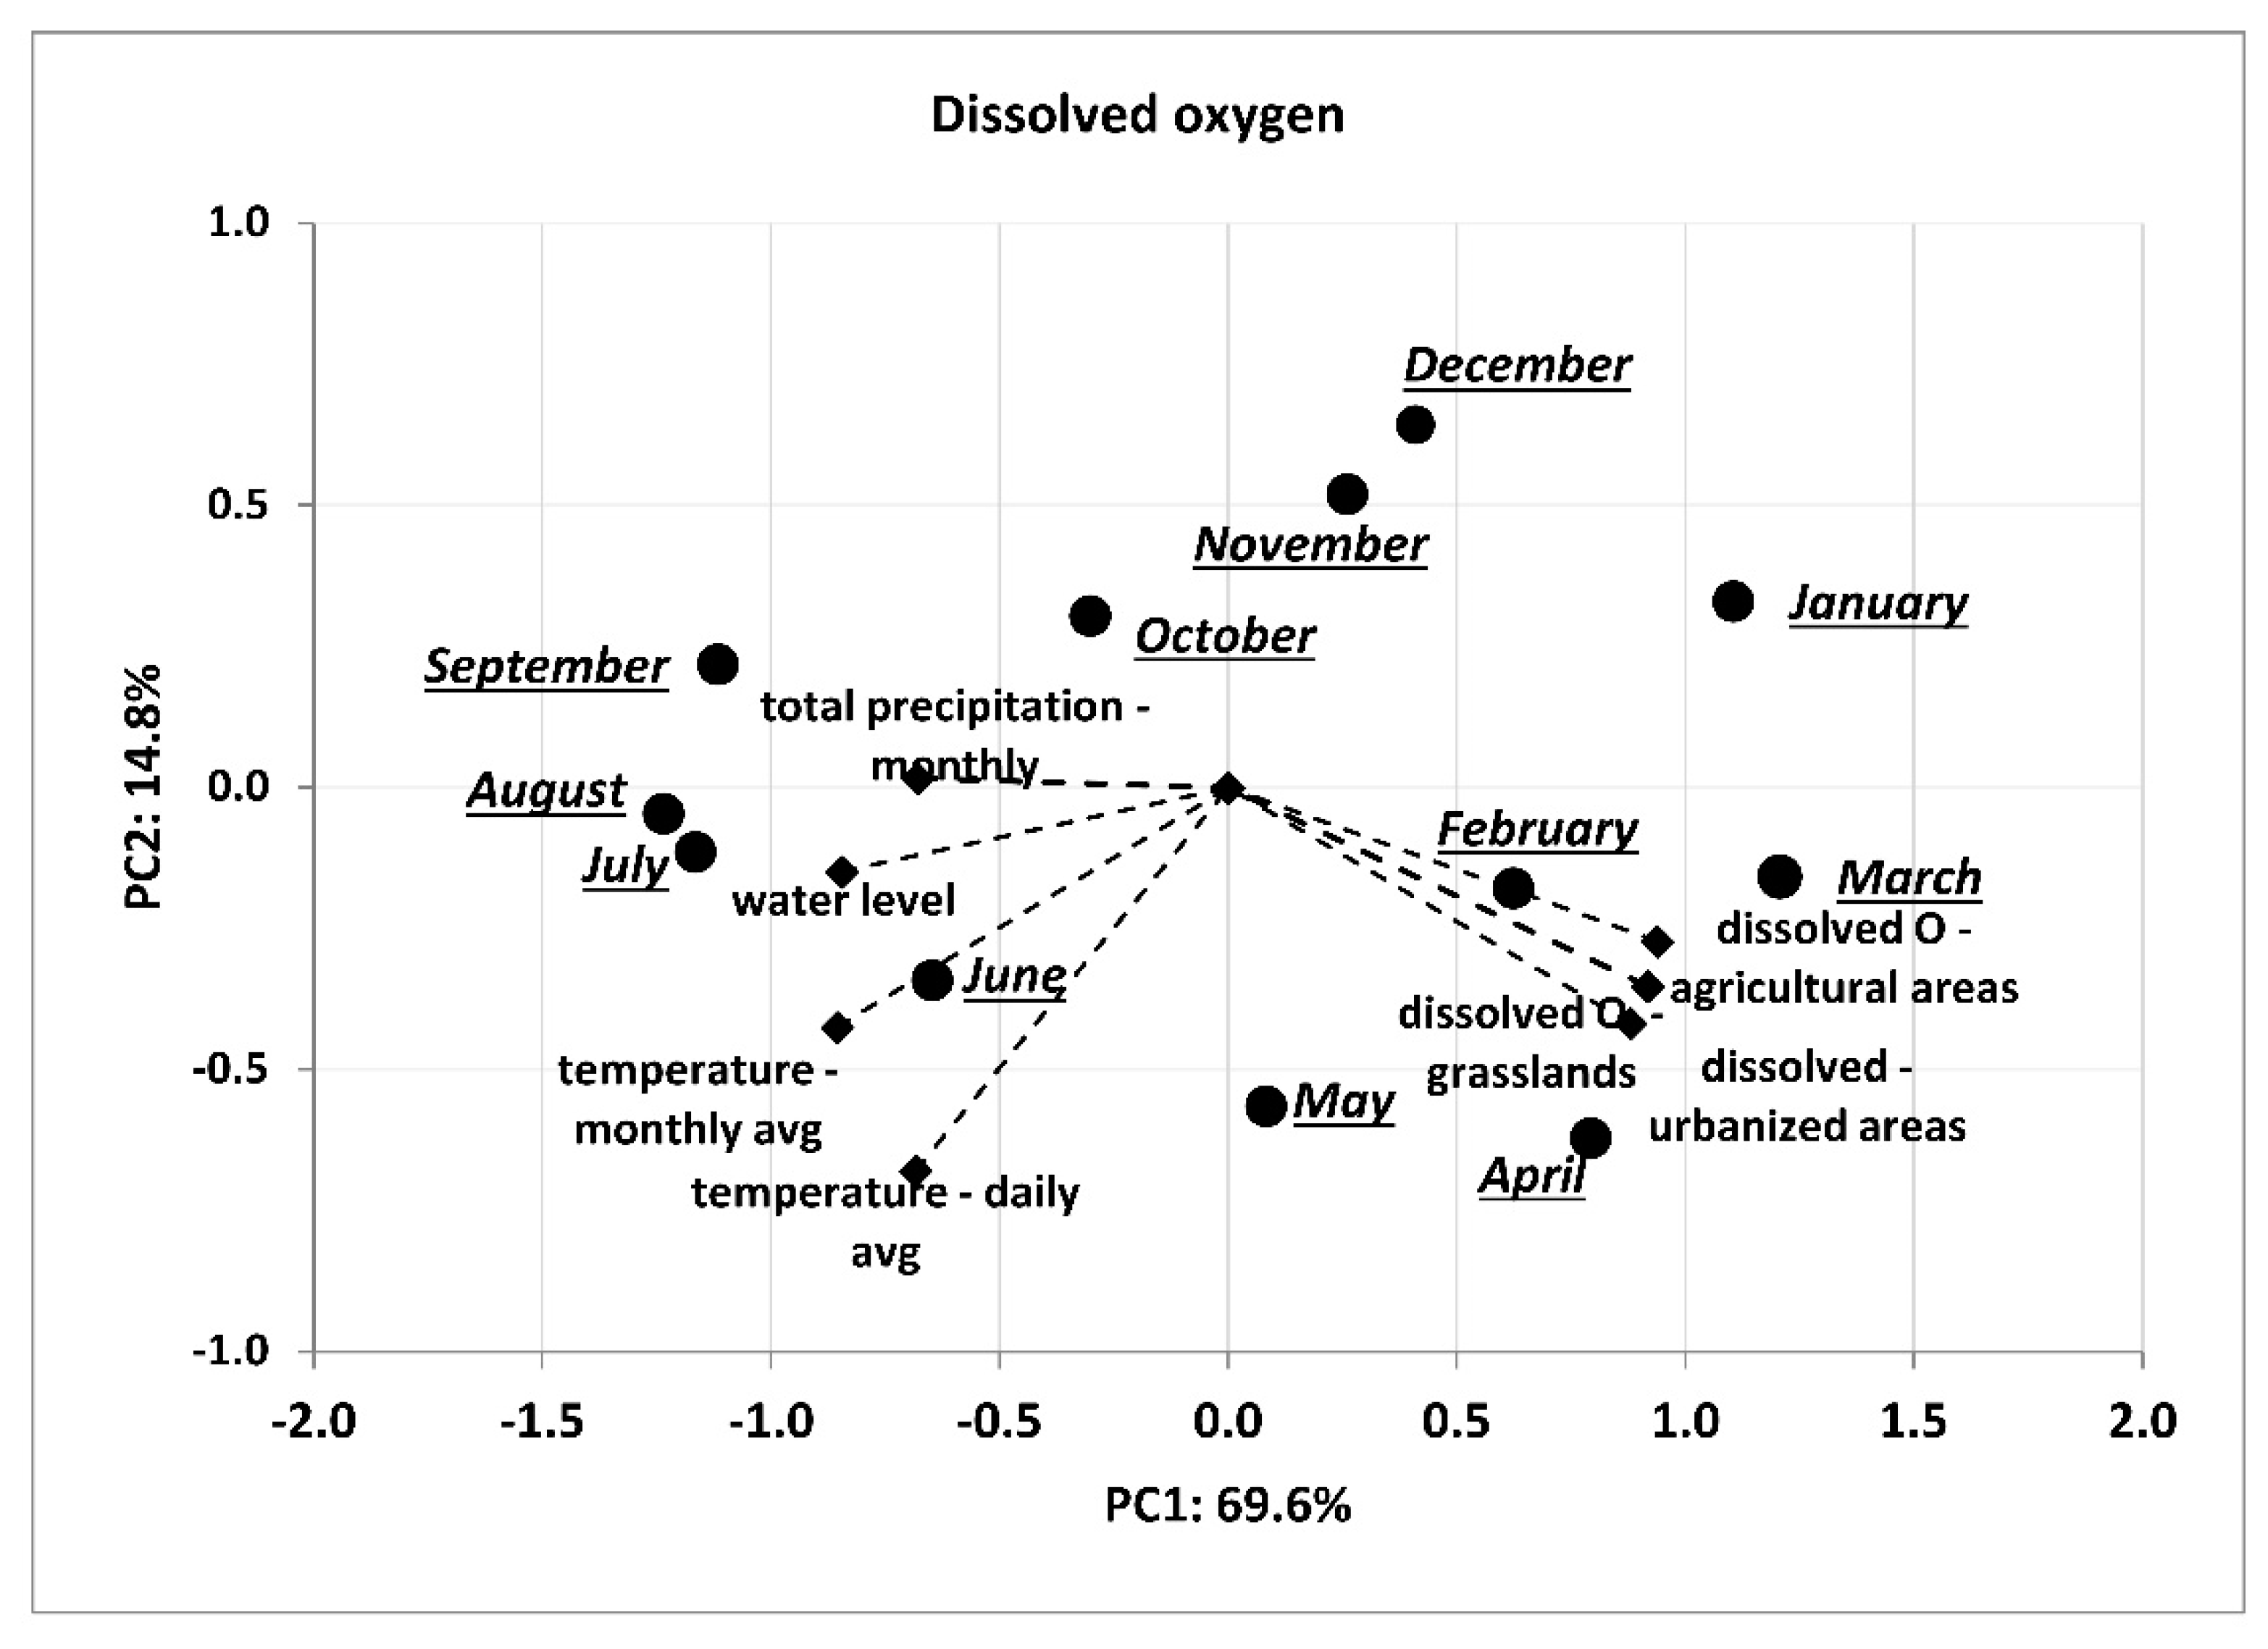
Figure 12.
PCA analysis for the relationships between: characterising the catchment area land use, weather conditions and the chemical oxygen concentration in the Utrata River.
Figure 12.
PCA analysis for the relationships between: characterising the catchment area land use, weather conditions and the chemical oxygen concentration in the Utrata River.
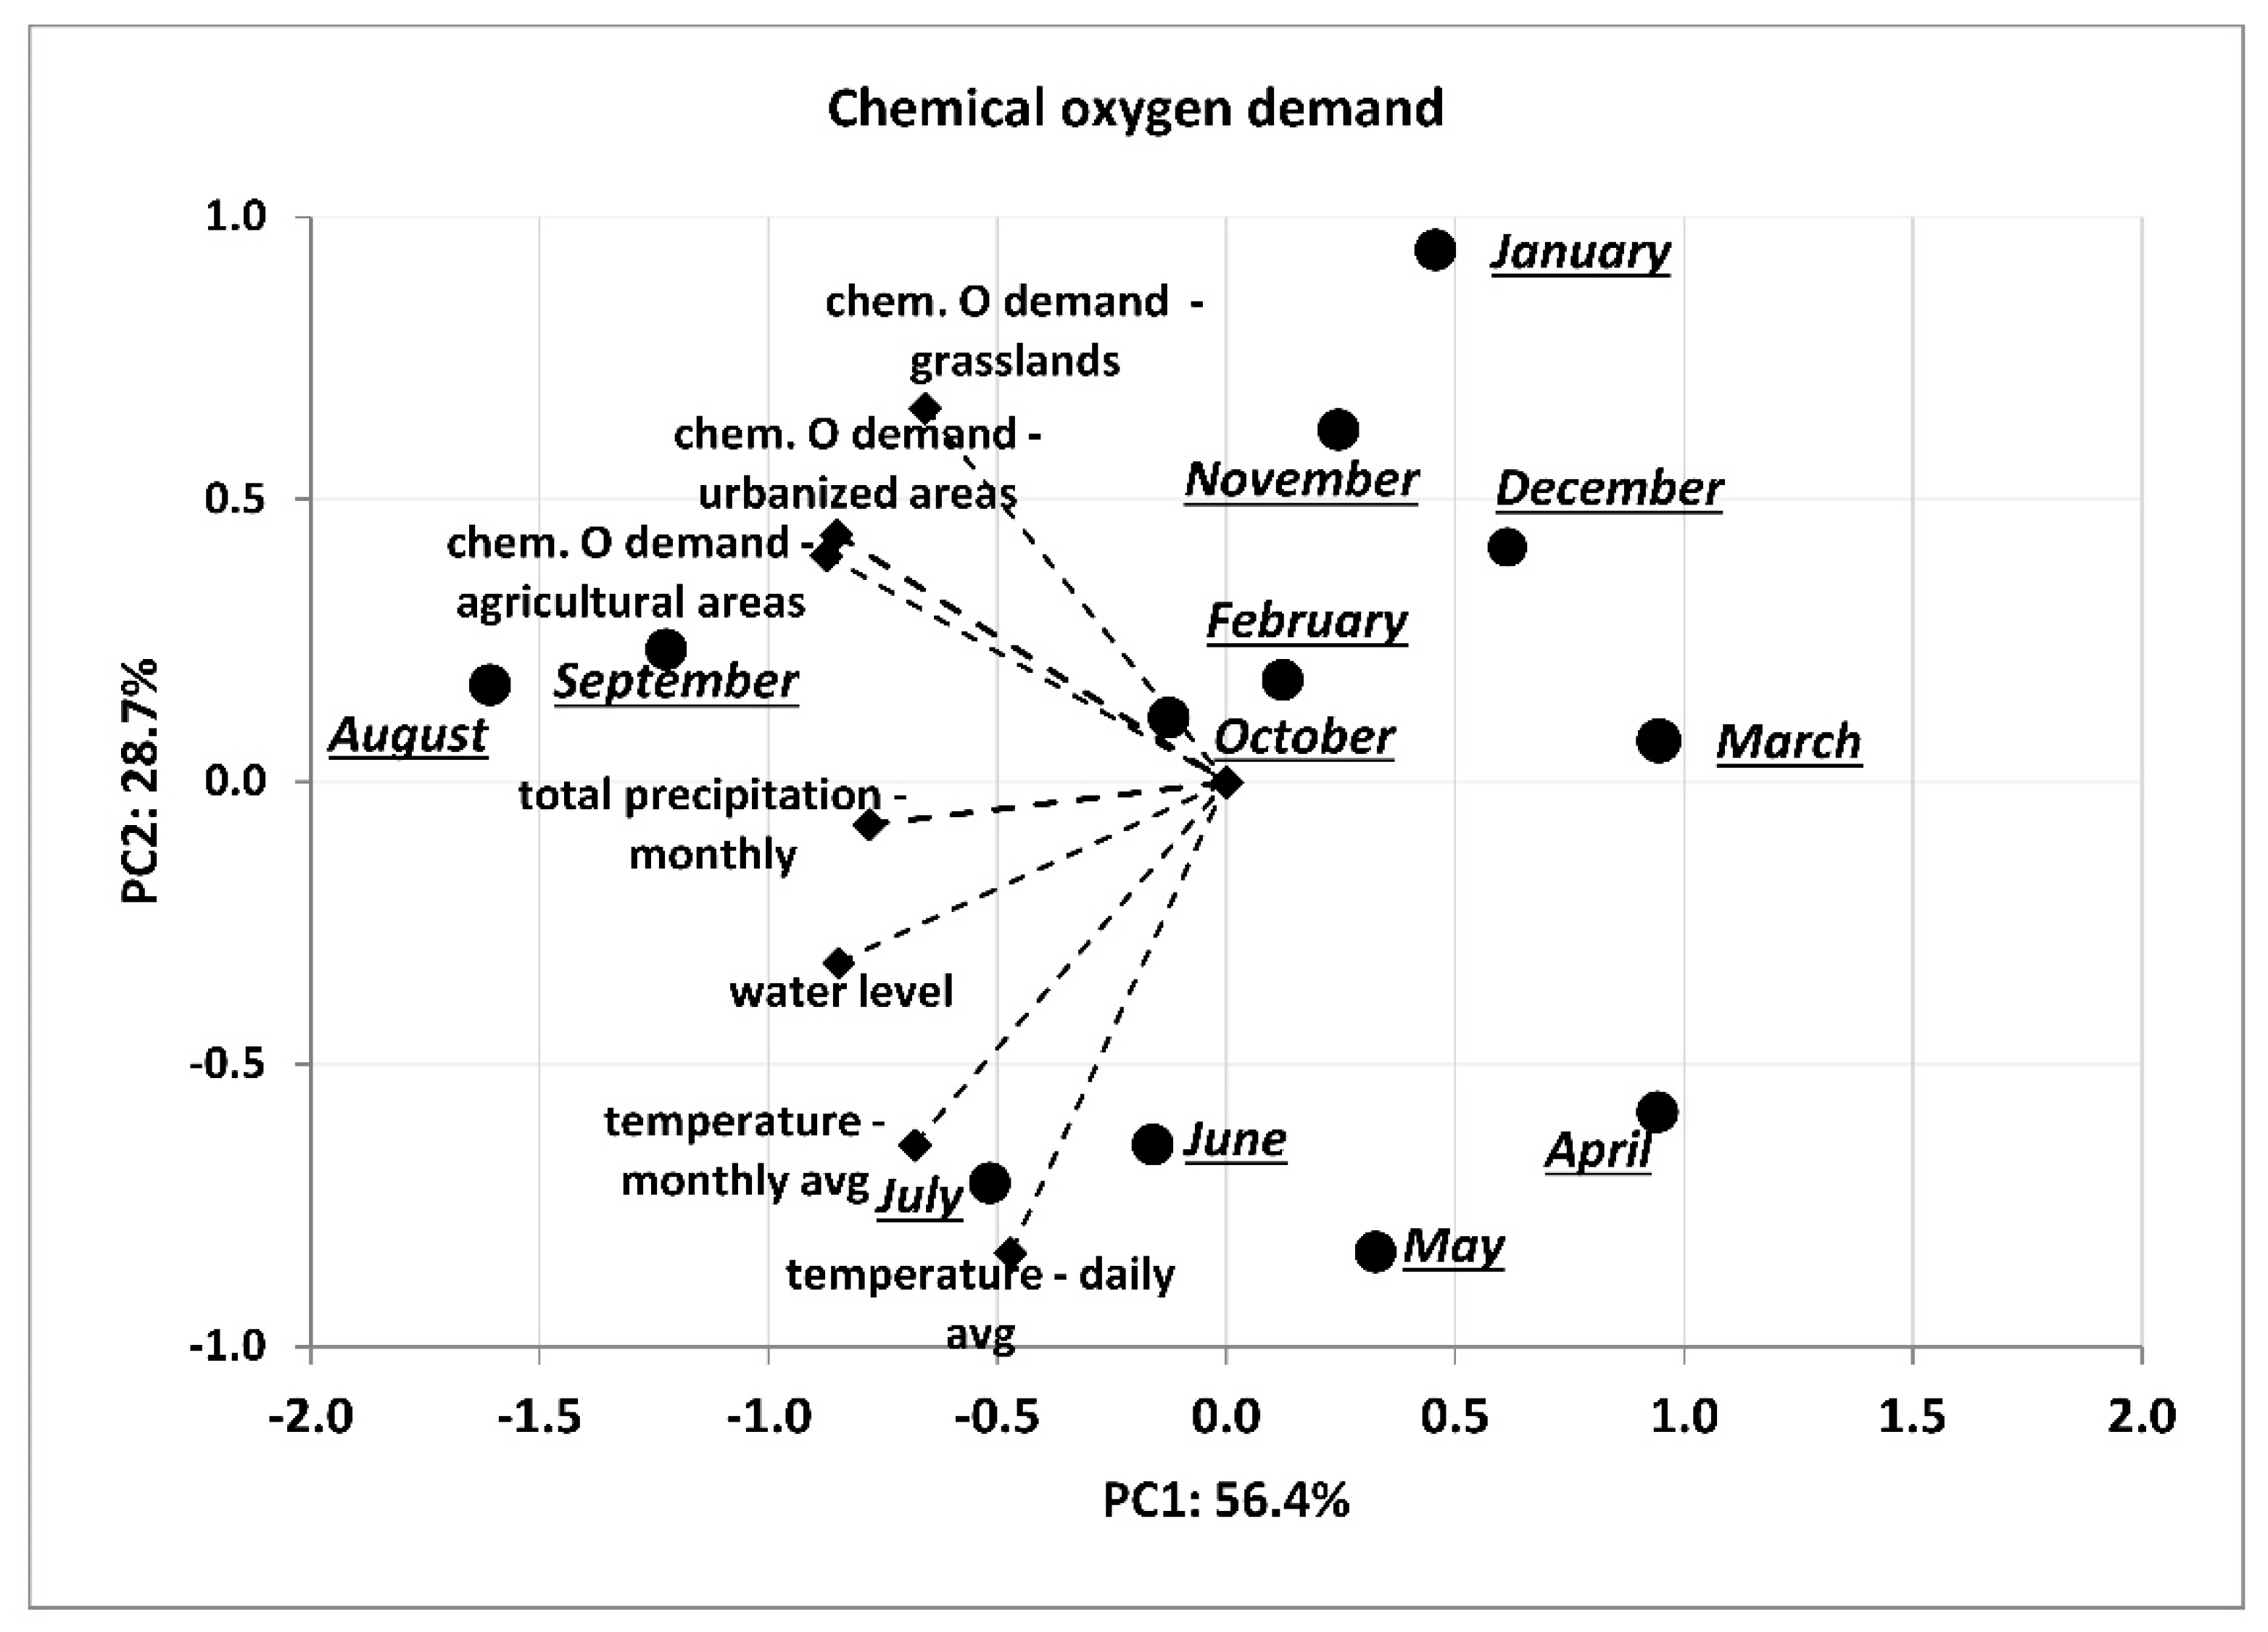
Figure 13.
PCA analysis for the relationships between: concentration of total phosphorus, nitrate nitrogen, ammonium nitrogen, dissolved oxygen and chemical oxygen demand during the months of April 2019–March 2020.
Figure 13.
PCA analysis for the relationships between: concentration of total phosphorus, nitrate nitrogen, ammonium nitrogen, dissolved oxygen and chemical oxygen demand during the months of April 2019–March 2020.


Table 1.
Water level [mm], temperature: daily and monthy average [C], total precipitation [mm] of Utrata river in the months of April 2019–March 2020.
Table 1.
Water level [mm], temperature: daily and monthy average [C], total precipitation [mm] of Utrata river in the months of April 2019–March 2020.
| Months | 4/2019 | 5/2019 | 6/2019 | 7/2019 | 8/2019 | 9/2019 | 10/2019 | 11/2019 | 12/2019 | 1/2020 | 2/2020 | 3/2020 |
|---|---|---|---|---|---|---|---|---|---|---|---|---|
| water level [cm] | 86 | 132 | 133 | 140 | 150 | 161 | 134 | 94 | 99 | 85 | 135 | 95 |
| temperature daily average [C] | 17.9 | 16.9 | 18.4 | 20.5 | 17.8 | 13.9 | 11 | 7.4 | 2.5 | 1 | 8 | 6.5 |
| temperature monthly average [C] | 9.8 | 13.2 | 22 | 19 | 20.1 | 14 | 10,4 | 6 | 3.1 | 2.2 | 3.9 | 4.3 |
| total precipitation—monthly average [mm] | 11.9 | 47.5 | 24.1 | 64.3 | 69.5 | 79.1 | 21.6 | 13.6 | 40.4 | 28.6 | 53.8 | 15.1 |
Publisher’s Note: MDPI stays neutral with regard to jurisdictional claims in published maps and institutional affiliations. |
© 2021 by the authors. Licensee MDPI, Basel, Switzerland. This article is an open access article distributed under the terms and conditions of the Creative Commons Attribution (CC BY) license (https://creativecommons.org/licenses/by/4.0/).
Share and Cite
MDPI and ACS Style
Dębska, K.; Rutkowska, B.; Szulc, W.; Gozdowski, D. Changes in Selected Water Quality Parameters in the Utrata River as a Function of Catchment Area Land Use. Water 2021, 13, 2989. https://doi.org/10.3390/w13212989
AMA Style
Dębska K, Rutkowska B, Szulc W, Gozdowski D. Changes in Selected Water Quality Parameters in the Utrata River as a Function of Catchment Area Land Use. Water. 2021; 13(21):2989. https://doi.org/10.3390/w13212989
Chicago/Turabian StyleDębska, Katarzyna, Beata Rutkowska, Wiesław Szulc, and Dariusz Gozdowski. 2021. "Changes in Selected Water Quality Parameters in the Utrata River as a Function of Catchment Area Land Use" Water 13, no. 21: 2989. https://doi.org/10.3390/w13212989
Note that from the first issue of 2016, this journal uses article numbers instead of page numbers. See further details here.