A Hypogene Karst Development Pattern Controlled by the Deep-Cycle of Groundwater in the Syncline in Huanjiang, Guangxi, China
by
Hongqi Dong
1,2, 
Yong Dan
1,2,*, 
Jiapeng Liang
1,2,
Bin Liang
1,2,
Guoquan Nie
1,2 and
Shaocong Ji
1,2 1
Institute of Karst Geology, Chinese Academy of Geological Sciences, Guilin 541004, China
2
Key Laboratory of Karst Dynamics, Institute of Karst Geology, CAGS, Guilin 541004, China
*
Author to whom correspondence should be addressed.
Water 2021, 13(2), 199; https://doi.org/10.3390/w13020199
Submission received: 29 November 2020
/
Revised: 12 January 2021
/
Accepted: 12 January 2021
/
Published: 15 January 2021
(This article belongs to the Special Issue Recent Advances in Karstic Hydrogeology)
Abstract
:Hypogene karst is a special manifestation of karst development in spatial scale. Intensive study of its development mechanism has significant meaning for engineering construction, shale gas and geothermal exploitation. To reveal the developing pattern of hypogene karst in Huanjiang syncline, karst groundwater at different depths in wells HD1-2 and HD1-4 and karst springs was selected as the research object. Through the analysis of geochemistry and stable isotopes of karst groundwater, it was revealed that the circulation pattern of deep karst water came from the common recharge of meteoric water and fossil water hosted in karst caves, runoff of deep faulting belts and discharge of large karst springs, over Huanjiang syncline, which provides good hydrodynamic conditions for hypogene karst development. Meanwhile, the widely developed faulting belts and structural fissures provide primitive dissolution space. Through the above analysis, the paper constructs a hypogene karst development pattern controlled by the deep cycle of groundwater in Huanjiang syncline.
1. Introduction
In the 20th century, there were many classical karst studies under the background of shallow unconfined geology. The main characteristic of this karst was recharge by meteoric water, with the water moving from top to bottom from the recharge area to form karst caves, which Palmer (1991) [1] classified as epigenic karst [1]. Since the 1960s, it has been gradually recognized that the hot fluid moves upward from the deep to form dissolution caves [2,3,4,5,6,7,8]. From the 1970s to the 1980s, the dissolution of sulfuric acid produced by the oxidation of deep fluid with high H2S was also recognized [9,10]. At the end of 20th century, the concepts of hypogene karst and hypogene speleogenesis were formally put forward [1,6], and Palmer’s research results promoted a karst classification [1]. A large number of hypogene karst caves have been discovered around the world in the last 20 years (e.g., in Eastern Europe, western Ukraine, central Italy, the Middle East, New Mexico, Tennessee, Australia). Phenomena that could not be explained by epigenic karst in the past are now well explained by hypogene karst [11,12,13,14,15,16,17,18,19,20]. Therefore, it has to be admitted that our understanding of hypogene karst morphology and theory is more widespread and profound than before.
Chinese scholars’ understanding and application of hypogene karst are somewhat different from Palmer (1991) [1]. They believe that the karsts located in the deep slow flow zone below the local excretion base level, and controlled by the non-erosion base level, are all classified as hypogene karst [21,22,23,24]. Therefore, in addition to the hypogene karst considered by Palmer (1991) [1], Chinese karst scholars believe that the karst phenomenon formed by the deep groundwater circulation below the local drainage base level is also a hypogene karst. As a special karst phenomenon, hypogene karst is a particular manifestation of karst development in spatial scale, but this karst phenomenon was not recognized in the era of weak drilling engineering. Recently, with the implementation of large hydraulic engineering, hypogene geothermal resources development and hypogene oil–gas resource exploitation in China, a large number of hypogene speleogenesis have been found in drilling and engineering processes [25,26,27,28,29,30,31]. For example, there is a 1.6 m high karst cave more than 2580 m below ground in the Guizhou province of China, which is equivalent to 1070 m below sea level (the sea level is the lowest excretion datum). There are nearly 20 karst caves, with a maximum height of 20 m, in Huanjiang, Guangxi, China (these caves are below the minimum excretion datum level, which indicates that they belong to hypogene karst). In addition, 6000 m below ground, karst caves have also been found in the Shunbei area of the Xinjiang province of China. Studies have shown that these caves are much lower than the paleo-exposed surfaces; thus, paleo-exposed surface karsts are not likely explain their genesis, and they are more likely caused by deep karsts controlled by faults.
Based on the analysis of basic conditions of karst development, many Chinese scholars have put forward different genetic patterns, such as groundwater deep circulation karst (valley-type hypogene karst and syncline basin-type hypogene karst) [32], deep hydrothermal karst, deep organic acid karst and deep sulfide deposit karst, etc. [28,33,34]. The above results promote hypogene karst research to some extent. However, previous studies mainly focused on the deep karst phenomenon at a certain point and do not provide systematic data to prove the hypogene karst from a regional perspective.
During shale gas drilling in Huanjiang syncline, Guangxi, China, from 2016 to 2018, deep karst caves were found in the process of drilling through carbonate rock in order to explore shale gas in the lower part of the rock. More than 20 karst caves were found in four wells, distributed 70–1200 m below the ground’s surface, and the maximum cave height reached 20 m. In this paper, Huanjiang syncline is selected as the study area. Based on the regional tectonic background and regional karst hydrogeological conditions, the paper studies recharge and runoff characteristics of deep groundwater, through geochemical and stable isotopic analysis of groundwater sampled in springs and wells. Furthermore, the paper puts forward a hypogene karst caves development pattern, in order to provide technical support during resource development and to avoid bore-out hypogene speleogenesis.
2. Geologic Setting
Huanjiang syncline is located in the northwest of Guangxi province in southern China (Figure 1) and covers 2000 km2, much of which is covered by Carboniferous strata, with only sporadic occurrence of Permian and Triassic strata. The Devonian strata is exposed around the syncline, and the boundaries of syncline are the North–Northeast and North–West direction faults. Affected by multi-stage tectonic, ruptures and folds develop in the depression, with more developed in the high angle fault zone, and most of the faults are normal faults, while a few are reverse faults. The general strike of structure line is in the NNE–SSW direction, with dip angles of 5~20° of strata only in the vicinity of large fault zones of more than 20°. Trapped syncline and anticline develop in the Huanjiang depression. The anticline axis generally exposes silicalite and marlstone of middle-upper Devonian strata. The syncline mostly exposes upper Carboniferous strata, but lower Permian strata in the axis. The dip angle of flanks strata is generally 10–20°, and locally it is greater than 20° [35,36,37].
The soluble carbonate rocks in the area are Carboniferous-Permian platform facies carbonate rocks with large area outcropping; however, karstification of marlstone and silicalite in Devonian and clastic rocks in Triassic are not found. The main karst strata are the Datang formation of Lower Carboniferous, the Dapu, Huanglong, and Maping formations of Upper Carboniferous, and the Qixia, Maokou, and Heshan formations of Permian, with accumulative thickness of thousands of meters. Except for the Dapu formation, which is a set of fine-medium dolomites and lime dolostone, the formations are pure limestone, which belongs to the continuous formation of mega-thick carbonate rocks with strong solubility [35,36]. The argillaceous content in the lower part of Lower Carboniferous increases and gradually transitions to the large shale of the Yanguan formation of the Lower Carboniferous, which is the bottom boundary of karstification [35,36].
The study area has a subtropical monsoon climate, with an annual average temperature of 19.9 °C. The rainfall is concentrated mostly in rainy season (June–September), which accounts for more than 75% of the total annual rainfall; annual average rainfall is 1389.1–1750.3 mm. In addition, Huanjiang syncline is located mainly on the southern slope of the Yunnan-Guizhou Plateau [35,36]. The terrain is high in the north and low in the south. The surface drainage flows from north to south and turns to the east near Hechi, affected by the east–west faults [38,39]. With abundant precipitation, appropriate temperature and a large set of carbonate rocks, coupled with certain hydrodynamic conditions, the surface karst develops strongly, forming the typical peak-karst landform in the area.
3. Methods and Test
In order to understand the genesis and geological characteristics of deep karst caves, the methods of well core analysis, regional hydrogeological survey, groundwater geochemistry, isotope testing and geophysical exploration are mainly used.
3.1. Deep Karstification of Well and Groundwater Sampling
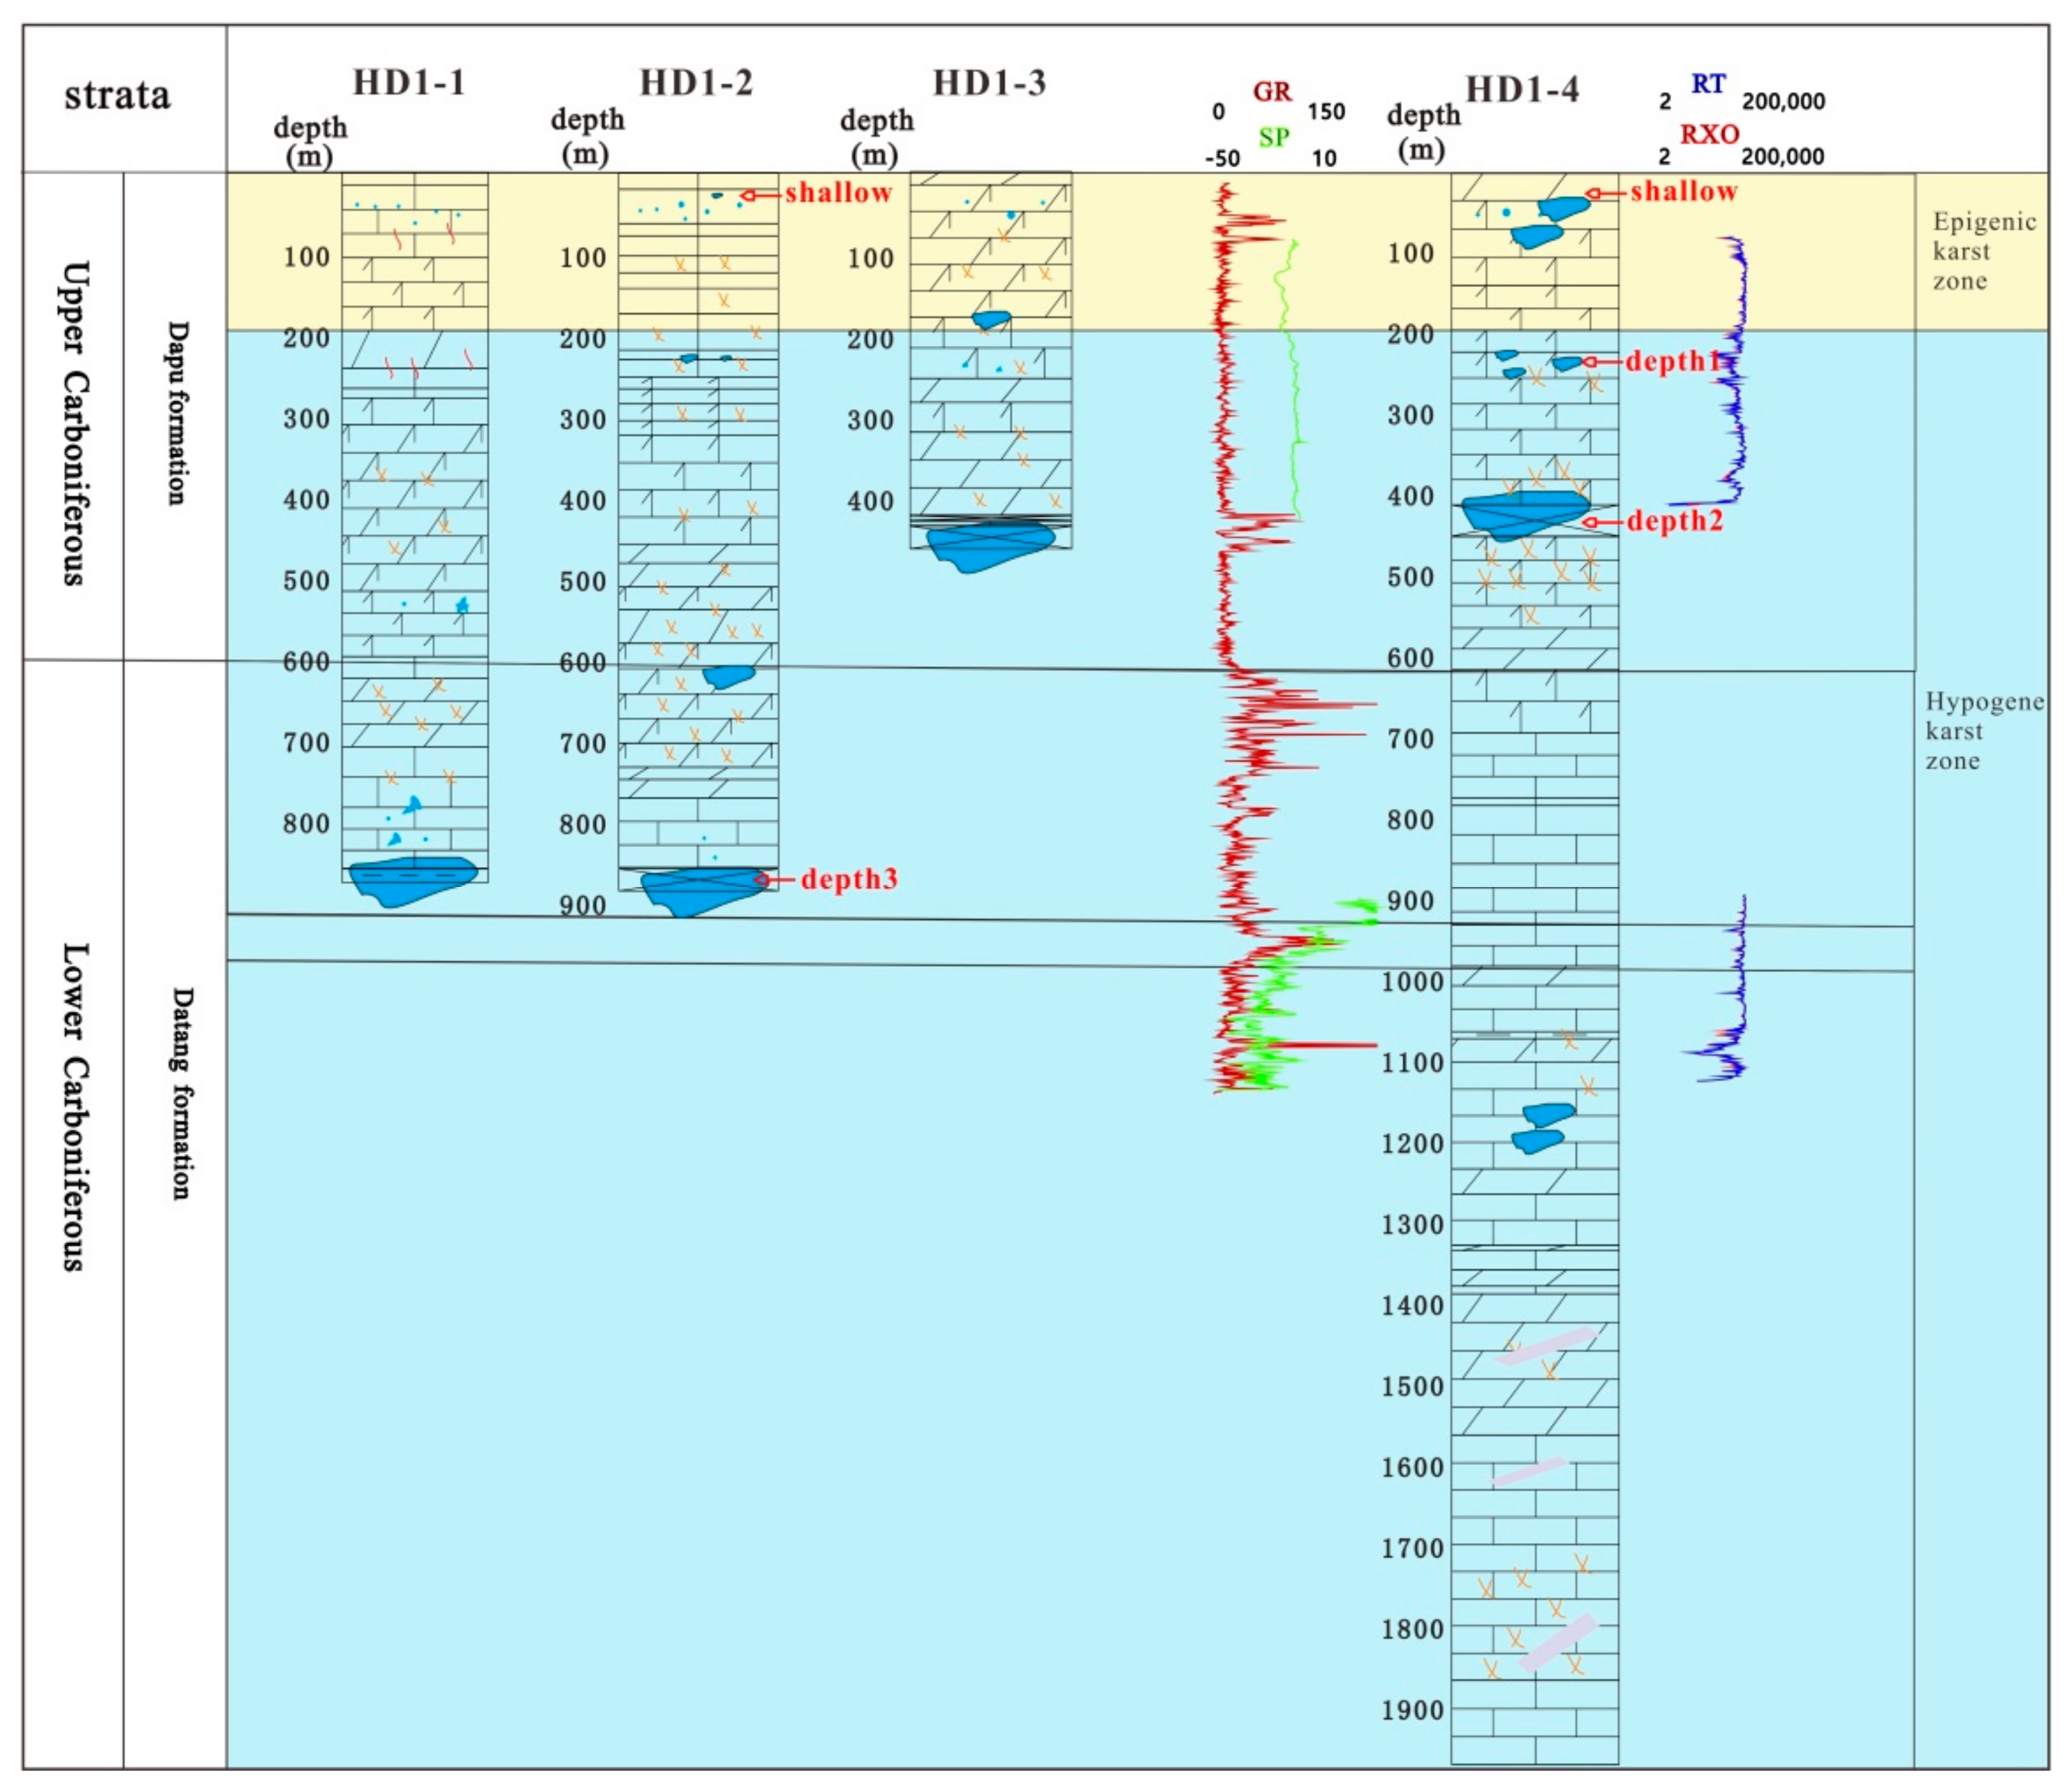
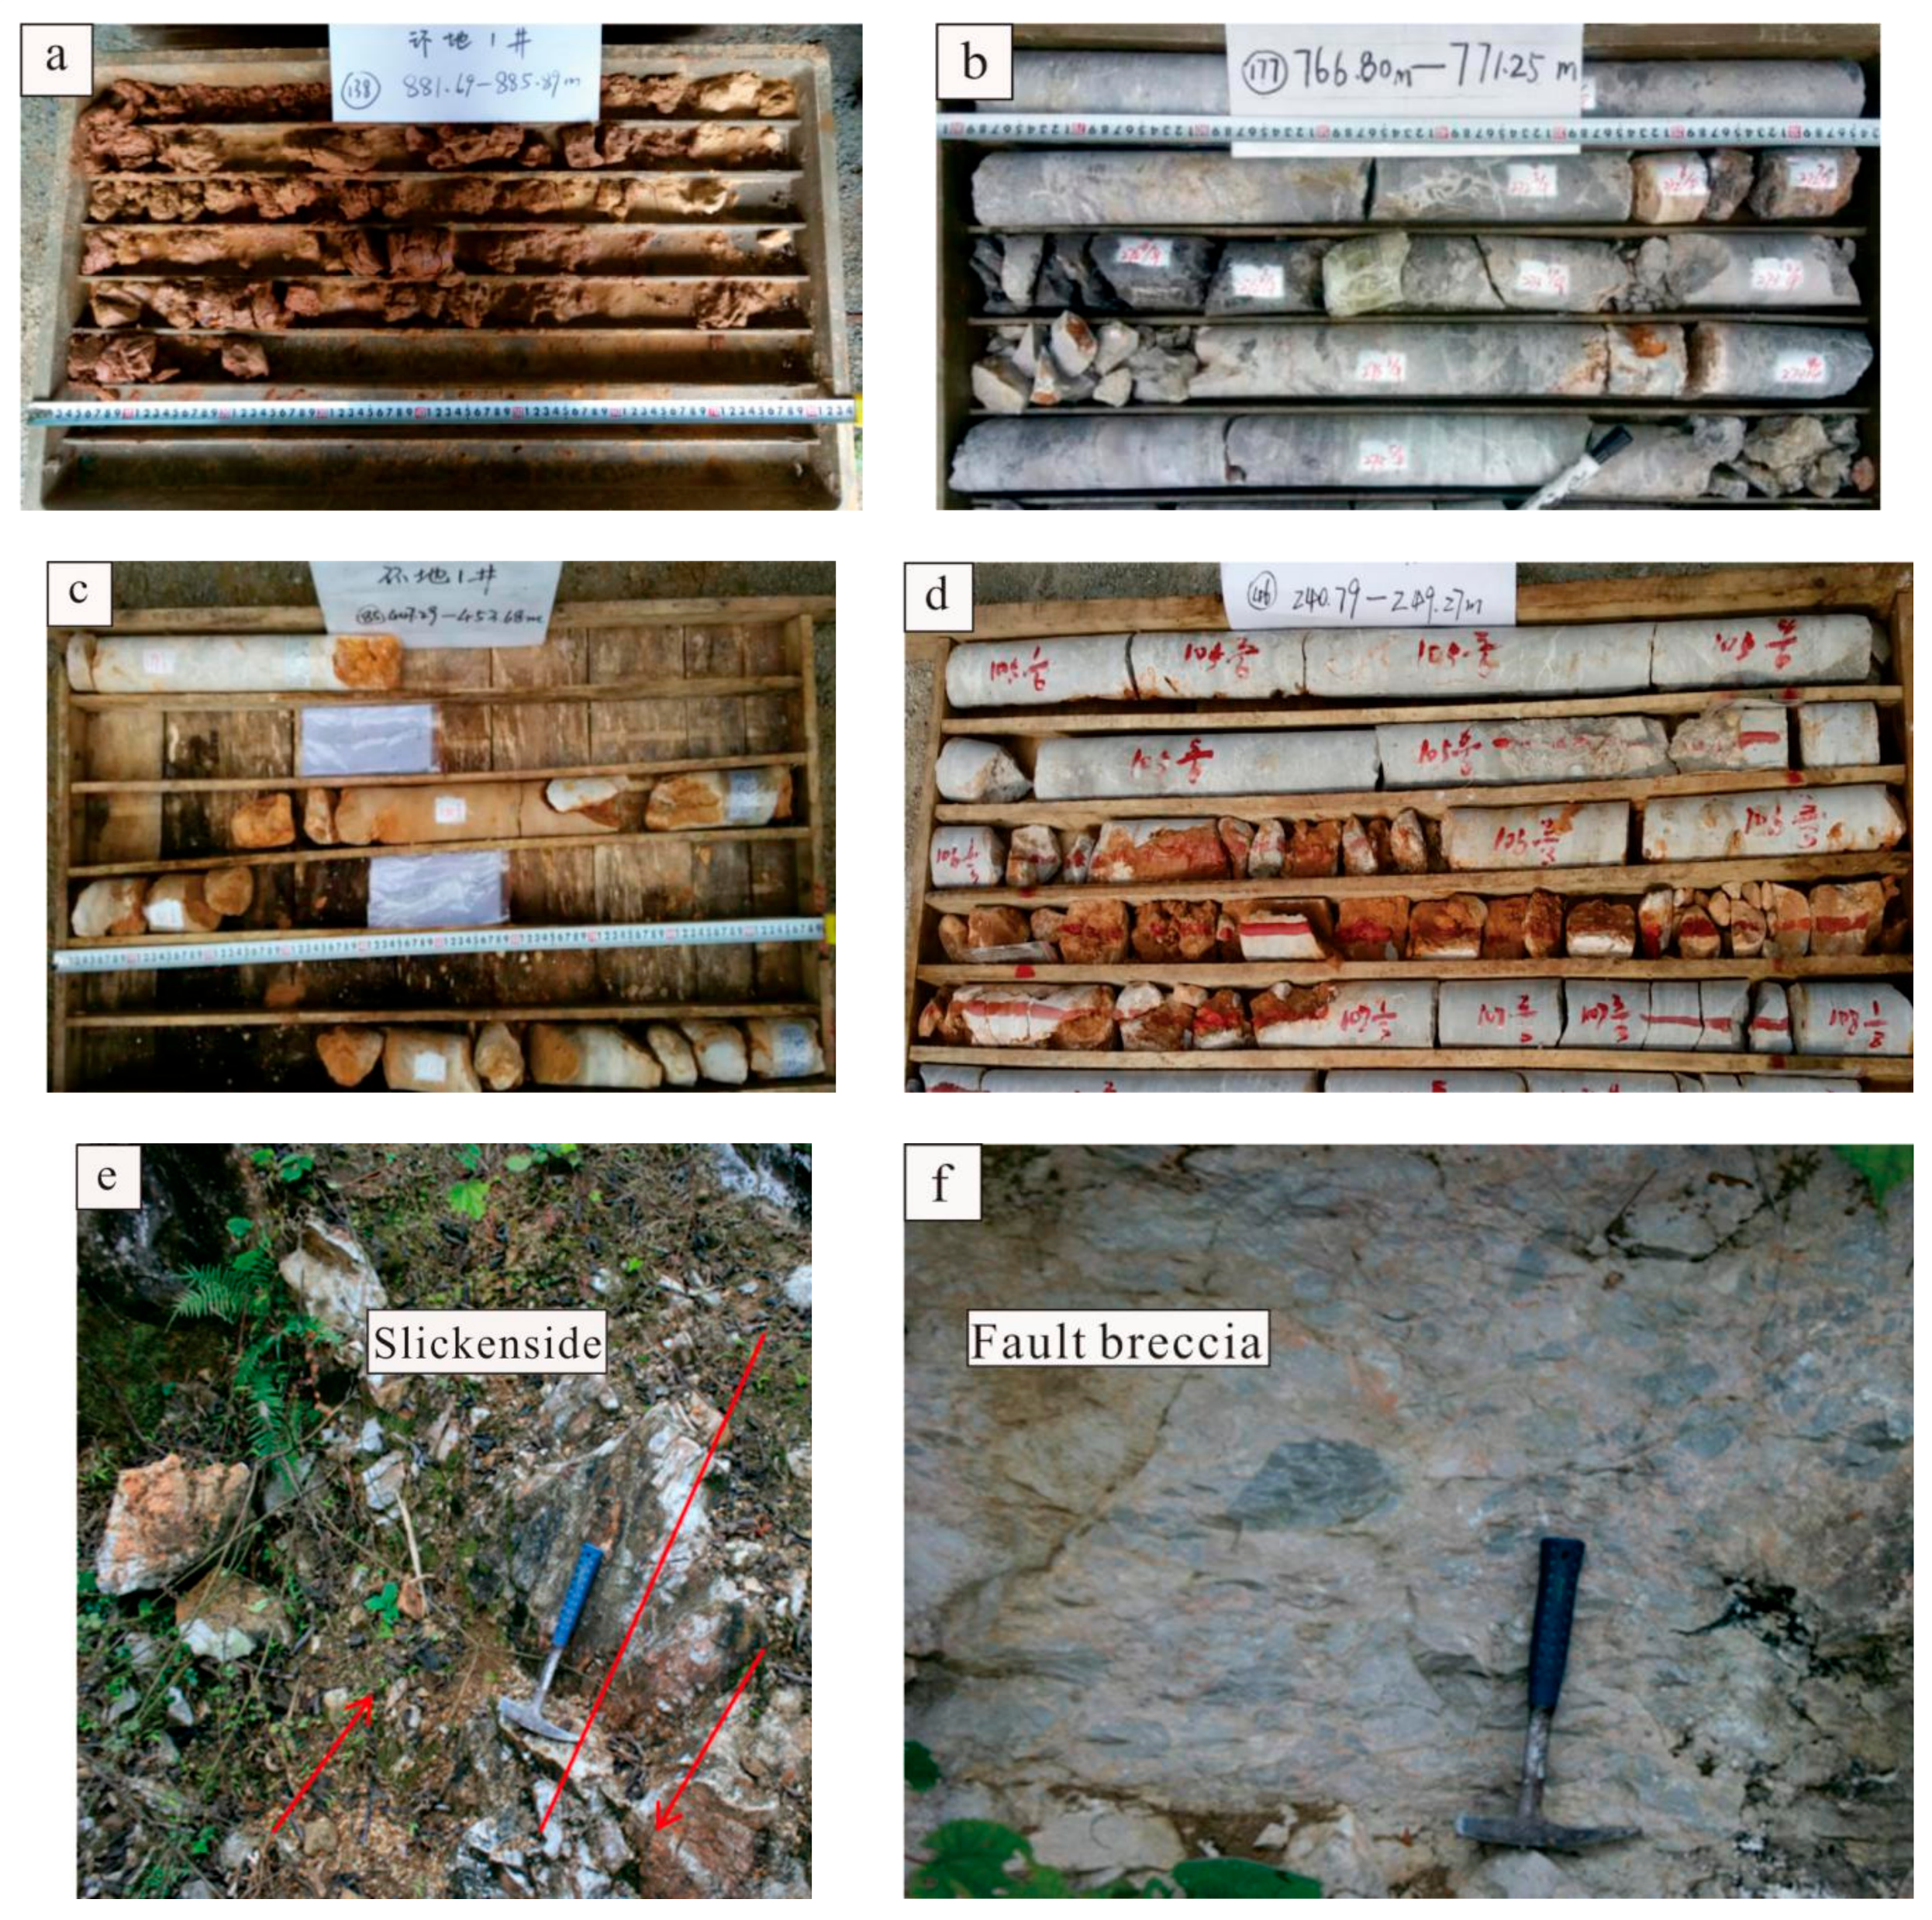
The wells used (HD1-2, HD1-4) are located in the syncline basin of the Huanjiang depression. Four wells are located within 100 m, with a sea level elevation of 200 m. All four wells are found hypogene speleogenesis below sea level (Figure 2). The depth of karst caves in HD1-2 is 861–887 m, developing a large number of reticular fractures and corrosion pores on the upper part (Figure 3a,b). The main karst cave development sections of HD1-4 are 40–80 m, 230–250 m, 420–450 m and 1100–1200 m. Tawny clay filling can be seen in the caves developed above 450 m, and a large number of reticular fractures can be seen on the drill core surface (Figure 3c,d).
According to the definition of deep karst by Chinese scholars, this article uses the lowest excretion datum for sea level as the boundary; shallower than 200 m of well depth is defined as the epikarst development zone, and deeper than 200 m is defined as the hypogene karst development zone. The HD1-4 karst cave development section, 230–250 m and 420–450 m, and HD1-2 karst cave development section, 861–887 m, are set as depth1, depth2 and depth3, respectively. From January to November 2018, the groundwater fixed-depth sampler produced by Shanghai Geological Instrument Factory in China was used to collect karst water samples at five sampling points at the surface and deep parts of HD1-2 and HD1-4. No water samples were obtained in November.
3.2. Regional Hydrogeological Survey and Groundwater Sampling
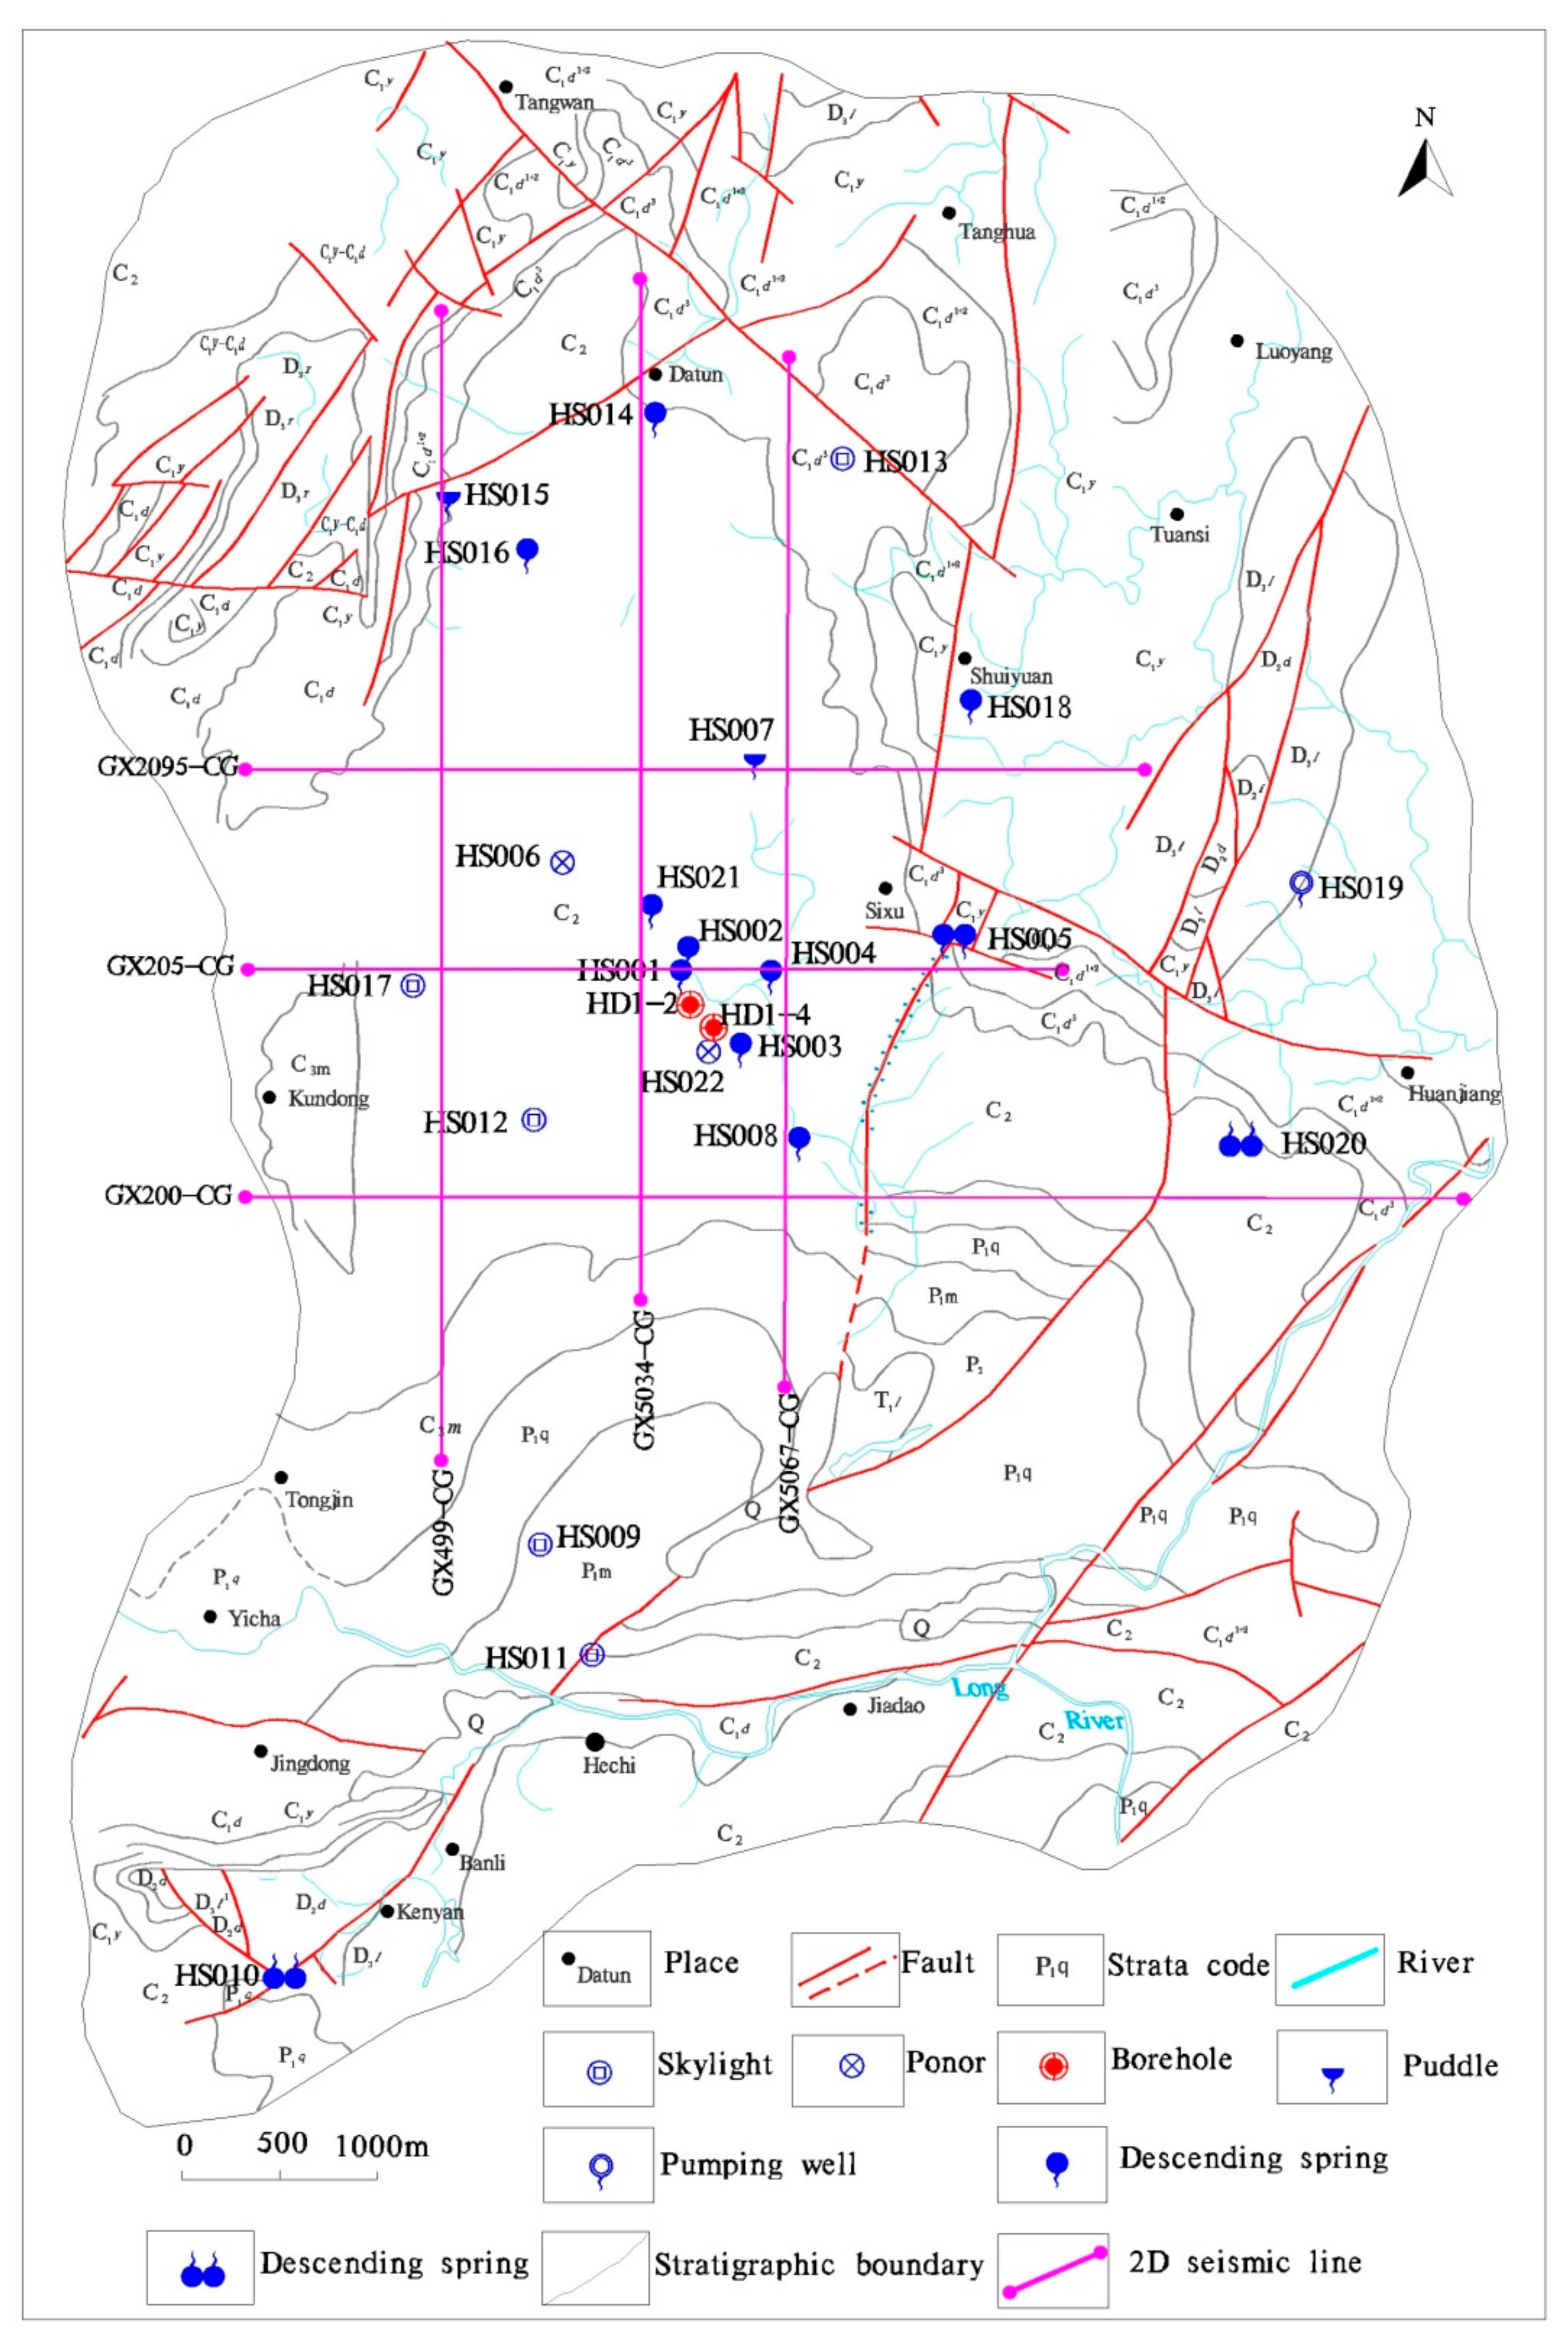
In January 2018, in order to understand the hydrogeological conditions of the deep groundwater in the well, hydrogeological surveys and samplings of the Huanjiang syncline area were carried out. It was found that there were faults near the surface of the well, and scratches and fault breccias were visible (Figure 3e,f). In order to find out the origin of deep groundwater in the well, the outcrop of Cly clastic rock was used to delineate the boundary of deep groundwater karstification, and 16 groundwater points, including sinkholes, springs, puddles and skylights, were investigated in the area. Five groundwater points, including ascending springs and skylights, were investigated near the southern and eastern boundaries to explore the discharge of deep groundwater. Finally, geological surveys and field tests were used to determine information such as geological conditions of sample points, water temperature, flow and elevation.
Twenty-two water samples in the study area were collected from springs, underground rivers, skylights and ponors in January 2018. Ascending spring (HS010) water samples were collected in the south of the well from January to November 2018 (sampling places showing in Figure 4). A total of 85 water samples were collected. Water samples were collected by filling 500 mL polyethylene bottles, and sealing the bottle (after confirming there were no bubbles in the bottle) to prevent evaporation and external pollution of the sample. All water samples were stored in a cold storage at 4 °C and sent to the Institute of Karst Geology, Chinese Academy of Geological Sciences (IKG, CAGS), for testing.
3.3. Test Methods forf Hydrochemistry
The hydrochemistry test took place in the test center of IKG, CAGS. The test instrument for cations was an inductively coupled plasma emission spectrometer with a test precision of 0.001; an ion chromatograph was used for anions, with a test precision of 0.01. The ambient temperature and relative humidity were 24.2 °C and 42.8%, respectively.
3.4. Test Methods for Stable Isotopes
A stable isotope mass spectrometer (Item no.: MAT253, Thermo Fisher, Waltham, MA, American) was used to test δD and δ18O. The test precision for δ2H and δ18O was 2‰ and 0.1‰, respectively. The ambient temperature and relative humidity were 24.8 °C and 40%, respectively. All deuterium and oxygen isotope test results were relative to the Vienna mean seawater (VSMOW) per thousand deviation, expressed by δ‰.
where R is the ratio of isotope abundance in the extracted water sample and the average seawater in Vienna (2H/H and 18O/16O).
3.5. Geophysical Interpretation Methods
In order to accurately understand the geological conditions of hypogene karst in Huanjiang syncline, six two-dimensional seismic profiles were collected in this area; the deep geological strata and faults were explained using Discovery software, and the structure map of the top surface of the Carboniferous rock pass formation was prepared using the interpolation method.
4. Results
4.1. Hydrogeological Characteristics of Sampling Points
With the purpose of determining the relationship between the well and these water points, spring points and skylights near the wells were investigated. With the purpose of finding excretion points, ascending springs near C1y in the south and east were investigated. In addition, structures, faults and breccias near wells were investigated to determine the impact of structures on wells’ recharge and discharge. Elevation, exposed condition, water table, flow and water temperature are listed in Table 1.
It can be seen from Table 1 that wells HD1-2 and HD1-4 and spring HS010 are all located in the fault structure influence zone, and other spring points are far away from the fault. In the water temperature test results from January, the well water temperature showed an obvious upward trend with the increase in depth. The water temperature of HS010 was 24.1 °C, which was higher than that of other sampling points. With the exception of HS010, all karst springs, puddles and ponors had significant seasonal differences in flow, which showed that the flow in the rainy season was much larger than that in the dry season.
4.2. Geochemistry of Deep Karst Groundwater
The chemical test results of karst water samples for five sampling points for wells HD1-2 and HD1-4, as well as HS010 and other spring water samples, were statistically calculated. The results are shown in Table 2.
The pH value of karst groundwater in the study area was between 7.12 and 8.02, indicating neutral to weakly alkaline water. The minimum pH value of HS010 was close to HD1-4-depth1 and HD1-4-depth2; the minimum pH values of the three types of groundwater were measured from dry season water samples. The maximum pH value was close to HD1-4-depth2, and the maximum pH of the two types of water samples were measured from rainy season water samples.
The annual variation of TDS ranged from 346.15–868.21 mg/L, and all karst groundwater is freshwater. With month as the minimum time unit, HS010 had the smallest TDS coefficient of variation, which was close to HD1-2-shallow and HD1-2-depth3. HD1-4-depth2 had the largest TDS variation coefficient, which was 0.17, indicating that the deep karst water TDS of HD1-4-depth2 had the largest variation with time and was most affected by seasons.
Ca2+ was the most abundant cation in groundwater, followed by Mg2+. Except for the HD1-4-depth1 and HD1-4-depth2 deep karst water in March and September, the sum of Ca2+ and Mg2+ accounted for 76.8–99.9% of the total cations. HCO3− was the most concentrated anion in groundwater. CO32− was only detected in the water samples of HS010 and HD1-2 and HD1-4 in August. The CO32− content detected in HD1-4-shallow and HS010 was the closest, at 325.12 mg/L and 235.02 mg/L, respectively.
According to the classification of the Piper diagram (Figure 5), the hydrochemical type in the study area was dominated by the HCO3-Ca•Mg type, accounting for 69.4% of all samples, reflecting the control effect of dolomite in the study area on the hydrochemistry characteristics of the water body. The water samples of HD1-4-shallow, HD1-4-depth1, HD1-4-depth2 and HS010 in August were HCO3•SO4-Mg, indicating that there may have been water exchange between HD1-4 and HS010 during this period.
4.3. δ2H and δ18O Characteristics of Deep Groundwater
Statistical analysis was performed on the δ2H and δ18O test results of the karst spring HS010 and other spring and well water samples, and the maximum, minimum, average, standard deviation and coefficient of variation were determined. The results are listed in Table 3.
The local meteoric water line (LMWL) in Huanjiang was δ2H = 8.29δ18O + 13.60 (n = 111, R2 = 0.9596), deviating from the global meteoric water line (GMWL, δ2H = 8δ18O + 10), showing that water vapor migration or rainfall in the area is affected by evaporation in different degrees [40,41].
The karst groundwater stable isotopic composition demonstrated significant variation from January to November. The δ2H values varied from −35.40 to −59.1‰, with a mean of −47.03‰, while δ18O values varied from −6.36 to −8.8‰, with a mean of −7.33‰. The mean isotopic values for the groundwater plotted on the LMWL are shown in Figure 6. Most samples were on or near the LMWL and GMWL, while most of other springs were plotted in the upper left of Figure 6, with significant differences among them, suggesting a local evaporation signature before infiltration to a greater or lesser degree.
The results showed that the δ2H and δ18O values for the HS010 sample were closest to HD1-4-depth2, and the δ2H and δ18O values for the HS010 and HD1-4-depth2 samples showed seasonal variation, being more negative in the dry season and more positive in the rainy season; this was opposite to the samples of HD1-2-shallow, HD1-2-depth3, HD1-4-shallow and HD1-4-depth1.
5. Discussion
5.1. Comparative Analysis of Physical Characteristics of Sampling Points
Wells HD1-2 and HD1-4 are located in the influence range of the fault zone in the syncline. The temperature of groundwater in the well gradually increases with the increase of well depth, and the highest temperatures for wells HD1-2 and HD1-4 are 33 °C and 42 °C, respectively. HS010 is an ascending spring exposed to the fault, and its water temperature is significantly higher than that of other springs, indicating that HS010 may accept the recharge from deep underground hot water; however, other springs do not accept recharge from deep underground hot water, which is the reason why HS010 still maintains a high temperature in January (winter) [42]. HS010 has a slight fluctuation of 310.5 L/s in dry season and 360.9 L/s in rainy season. The flow of other springs in dry season and rainy season is significantly different. The flow in rainy season is 2–20 times of that in dry season, indicating that other springs are seasonal springs controlled by precipitation, and the recharge is precipitation. In addition to receiving rainfall recharge, HS010 also has other recharge sources, and it is speculated that the other recharge sources of HS010 are from the hypogene circulation of karst groundwater [43,44,45].
5.2. Hydrochemistry Evolution of Deep Karst Water
A comparative analysis of the water chemical composition of 22 springs in January showed that HS010 had the lowest TDS, 434.465 ppm, among all the springs, which was quite different from most springs. For the samples of HS010, except for the water sample from October, which had a small TDS value (346.147 ppm), the TDS test results were between 430.465–459.375 ppm. The TDS values for other springs were between 485.581–644.742 ppm. Regardless of the dry or rainy season, the water samples of HS010 were different from the other springs, indicating that HS010 may have different sources of recharge than the other springs [46]. Huanjiang has the highest rainfall in August, and the HS010 spring had the smallest TDS value in October, indicating that HS010 may receive groundwater from distant groundwater formed by atmospheric precipitation infiltration [47].
In addition, among the test results for all water samples in January, the lowest value of Mg2+ is for other springs, and its the highest value is for wells. The Ca2+ value is the highest for other springs and the lowest value for wells. The K+ value is the highest for other springs and the lowest value for wells and HS010. Finally, the Na+ value is the lowest for other springs and the highest value for wells and HS010. It is speculated that the other springs are not related to the wells.
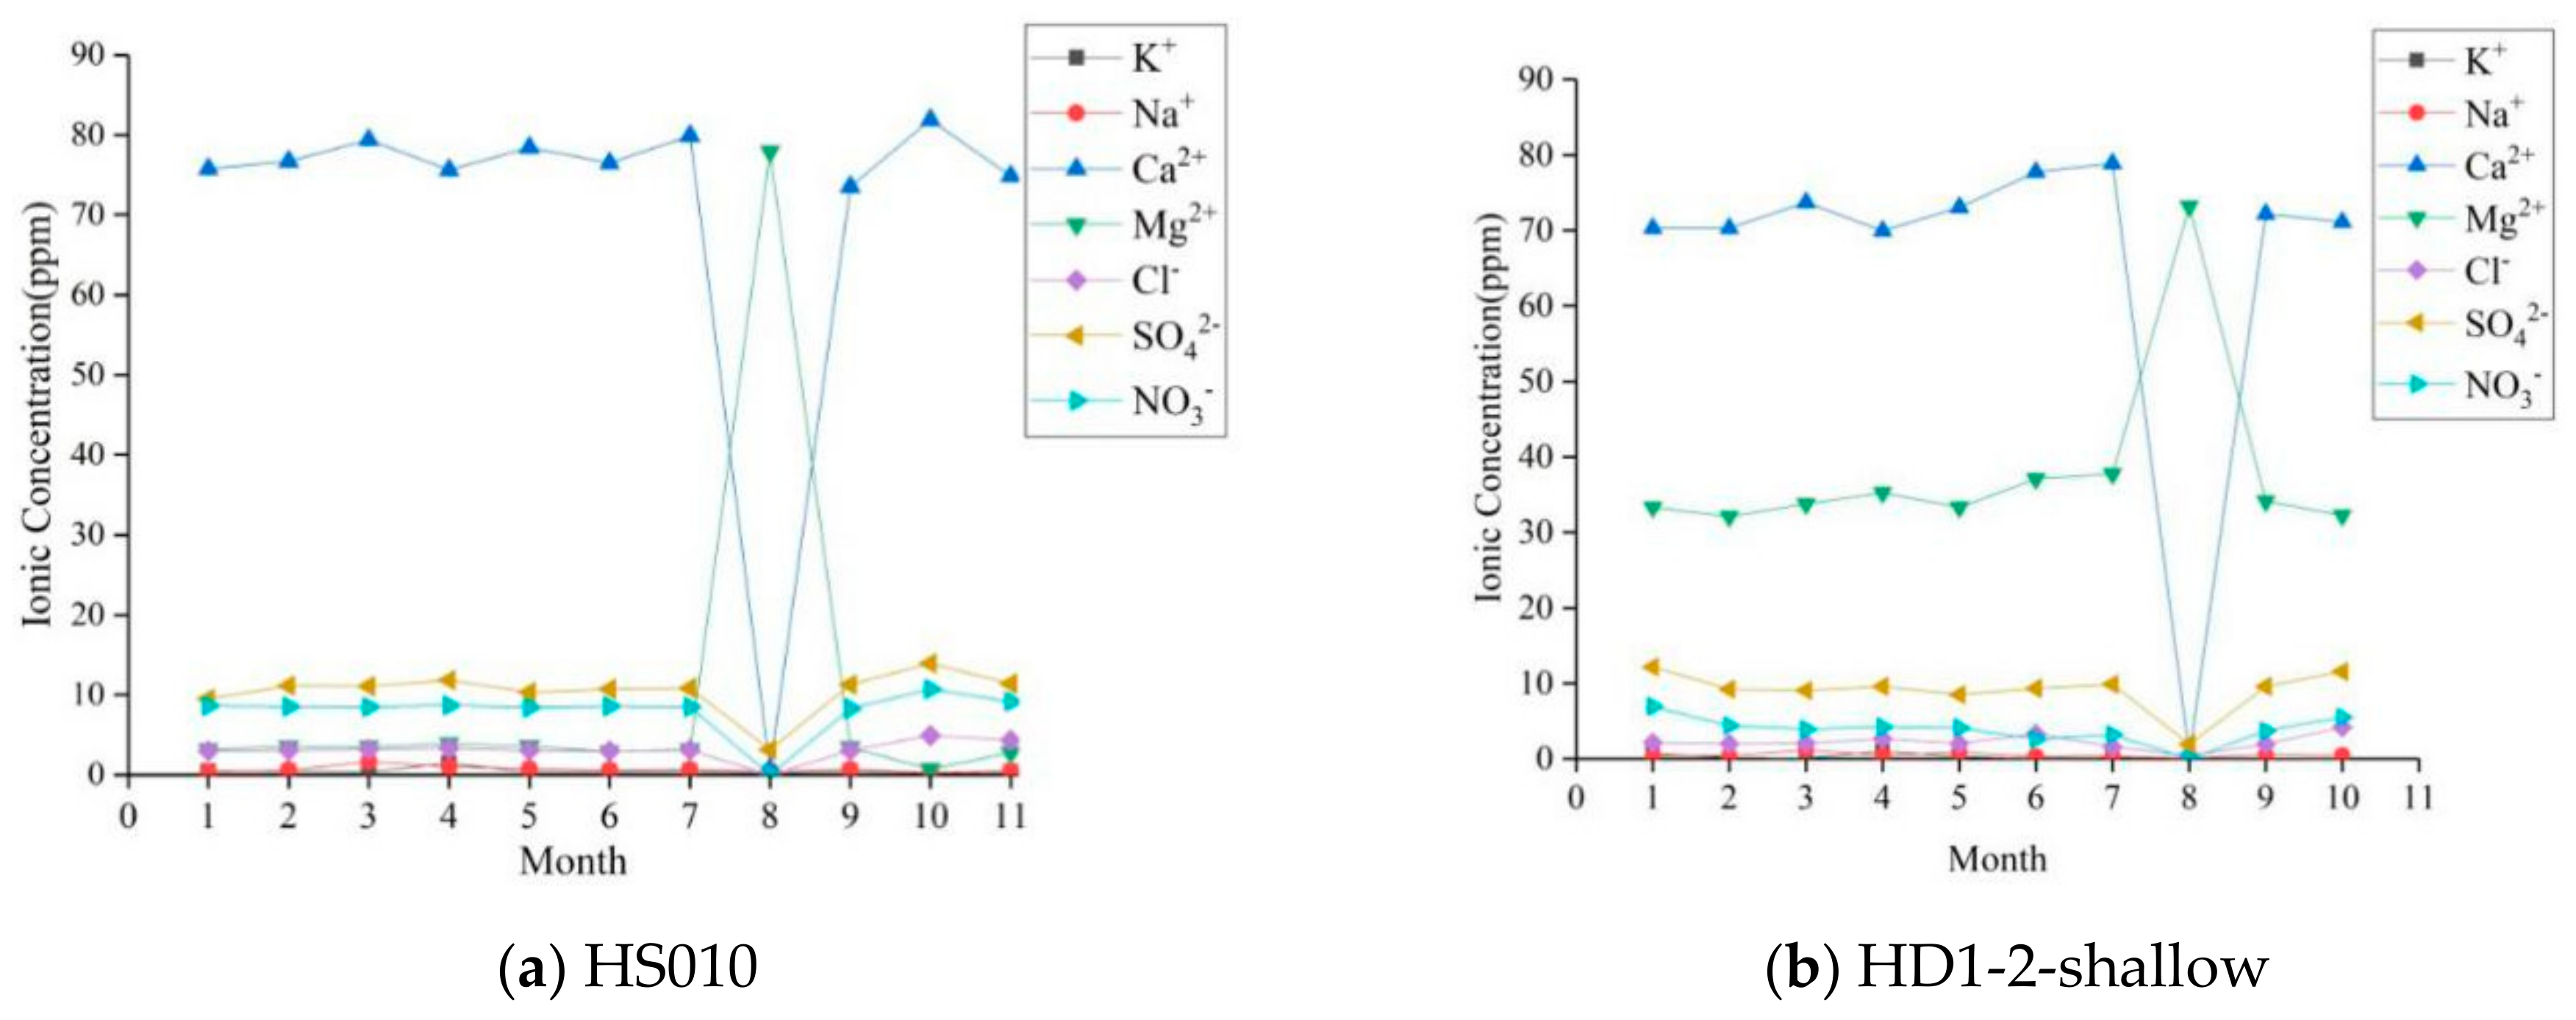
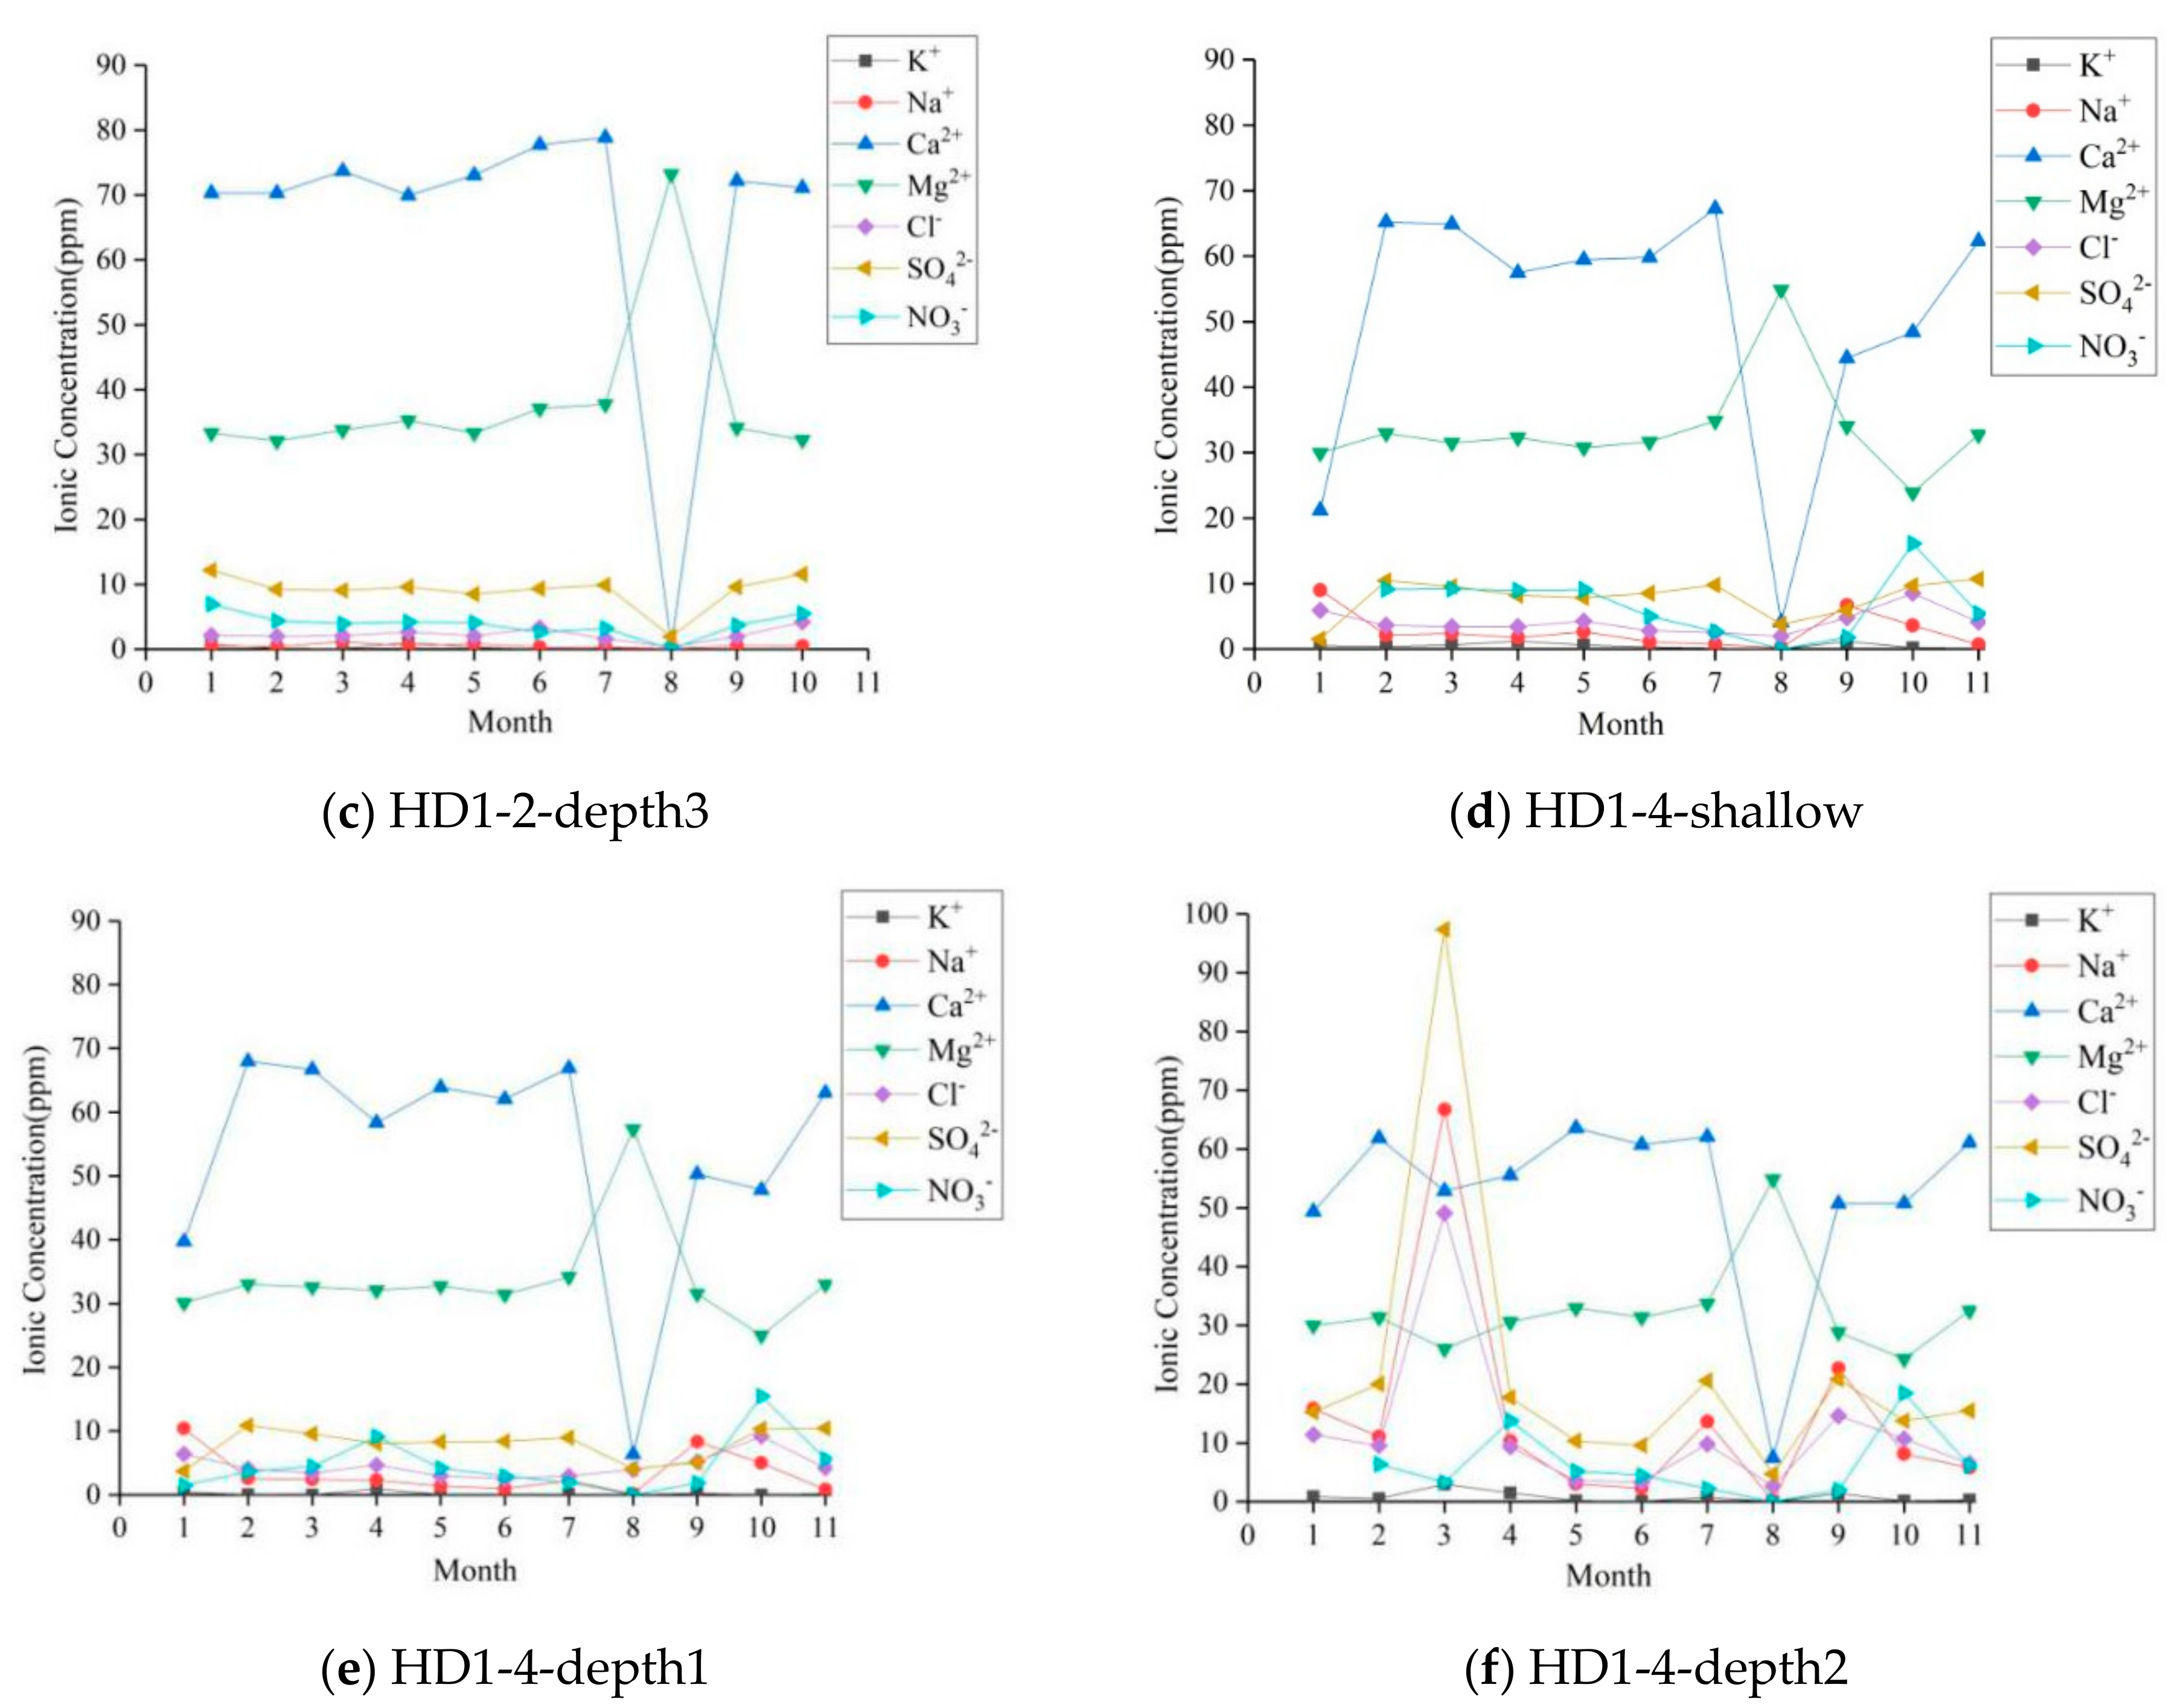
The water chemical compositions at five sampling points for spring HS010 and wells HD1-2 and HD1-4 were compared and analyzed vertically (Figure 7). It was found that the variation trend for the main ion concentration of all water samples was consistent with seasonal rhythm. It was manifested mainly as the concentration of each ion in a stable state from January to July; the concentration of Ca2+ decreased sharply, while the concentration of Mg2+ increased heavily in August and then returned to the initial level in September. This indicated that a close hydraulic connection and frequent conversion relationship existed between well HD1-2 and HS010 during the dry and rainy seasons. The chemical composition of groundwater is affected by meteoric water and presents seasonal fluctuations. The water chemical composition measured at the three vertical sampling points of HD1-4 was different from HD1-2 and HS010. The main manifestation was the consistent variation trend in the rainy season and the opposite in the dry season. This is especially the case for the HD1-4-depth2 water samples in March, where the SO42−, Cl−, Na+, TDS and pH values were the highest values of all the water samples detected. The lithology at sampling point HD1-4-depth2 is dolomitic limestone, with reticular fractures and karst caves. In dry season, the groundwater receives recharge from paleo-water reserved in adjacent caves through reticular fractures, resulting in abnormal chemical composition.
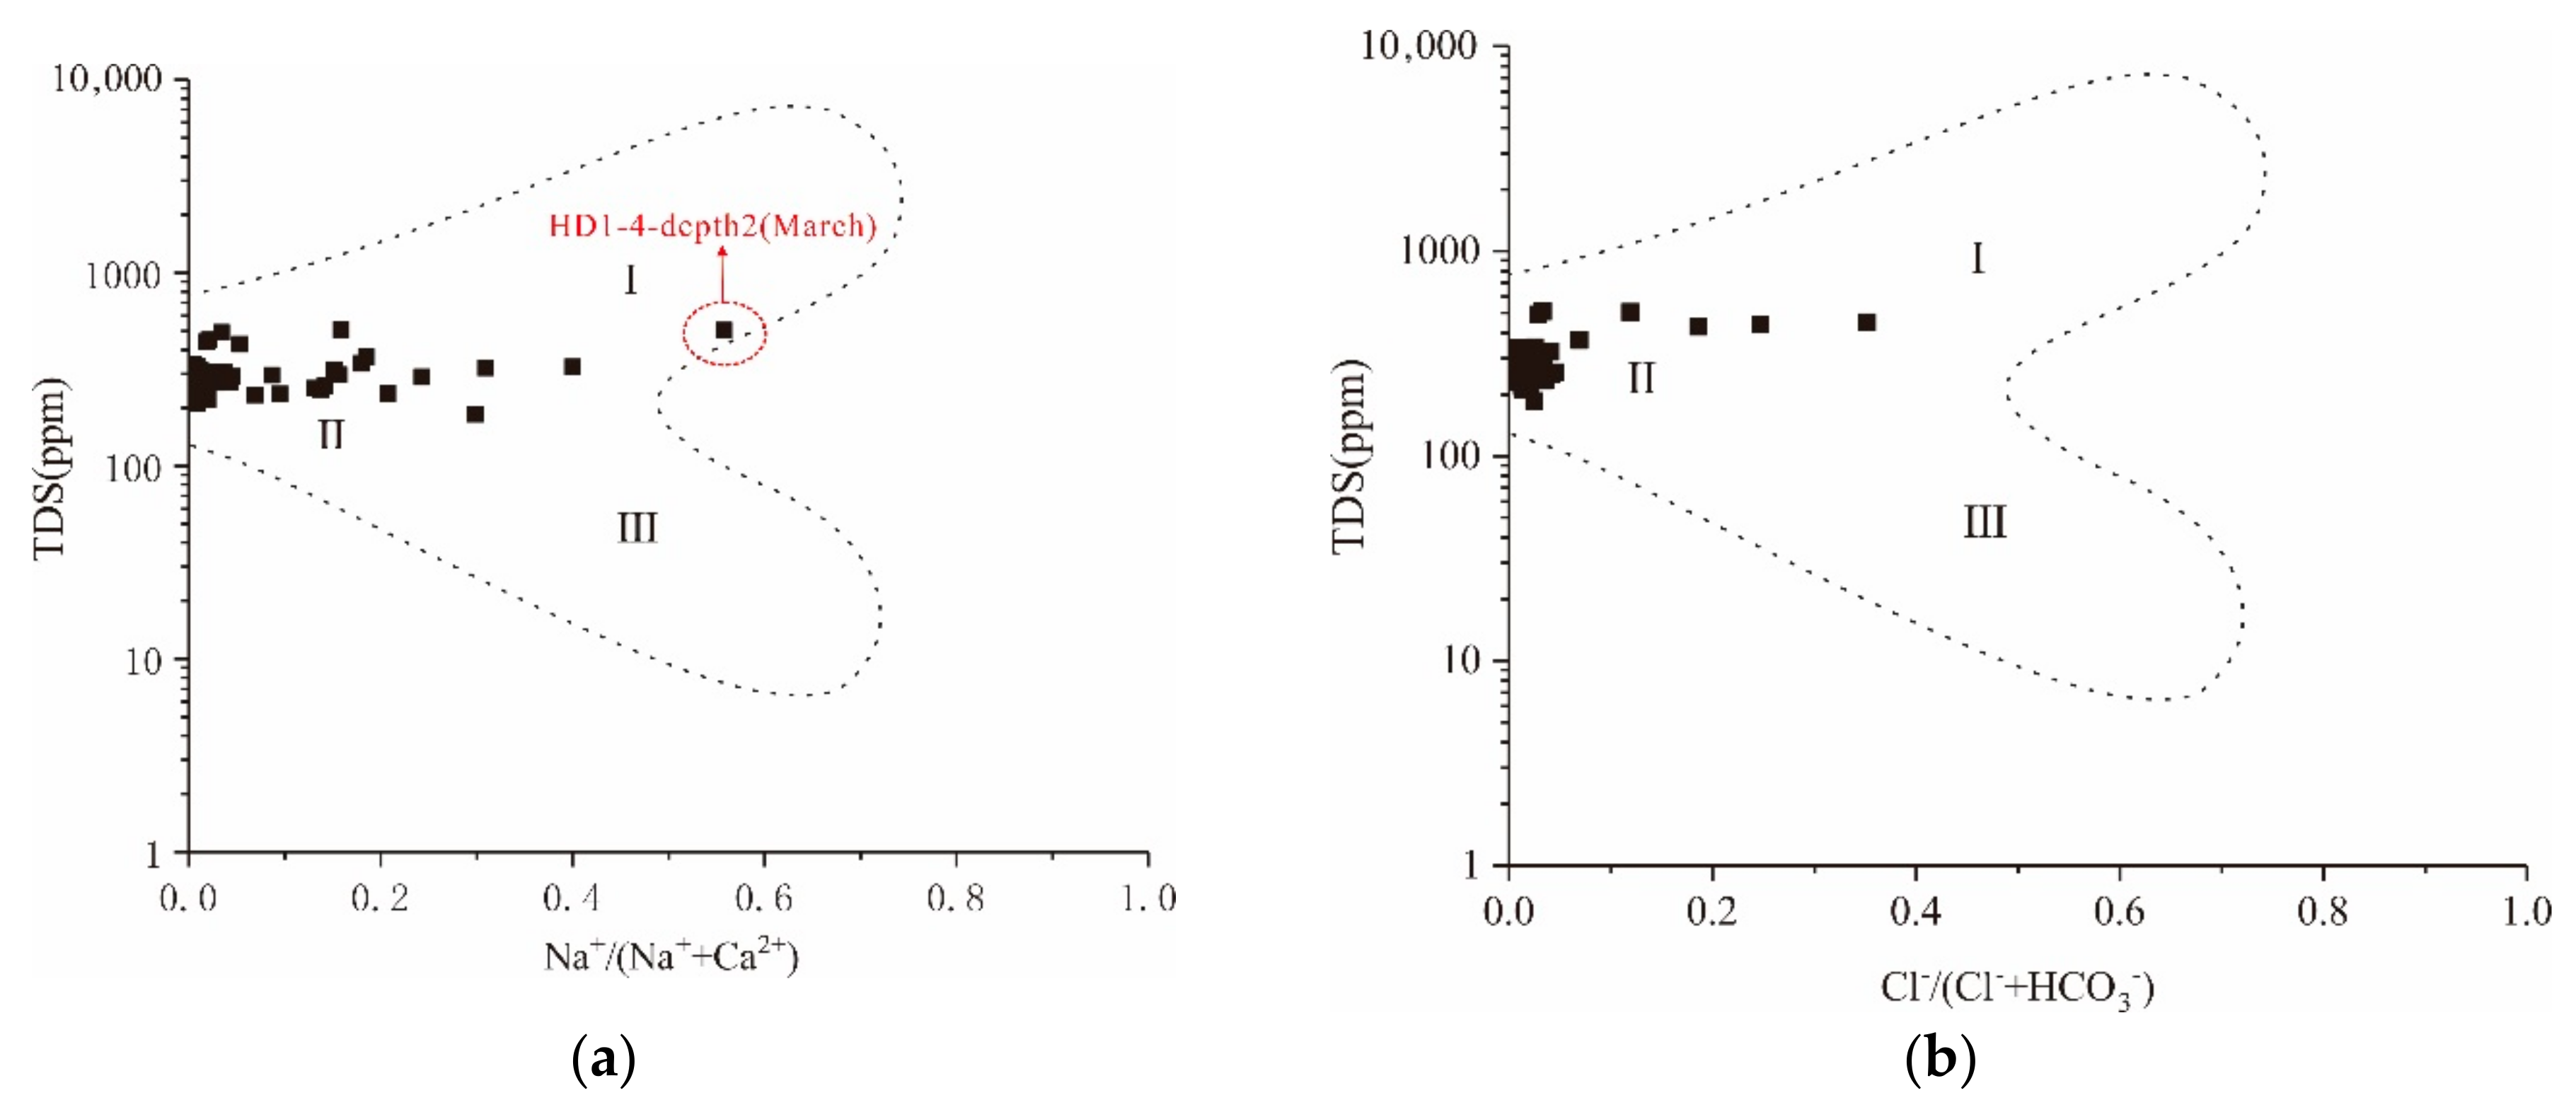
In order to determine the control factors of the chemical composition of karst groundwater, all water sample TDS, cation ratio (Na+/(Na+ + Ca2+)) and anion ratio (Cl−/(Cl− + HCO3−)) were calculated, and a Gibbs diagram was drawn (see Figure 8) [48,49]. The ratio of Na+/(Na+ + Ca2+) was between 0.006 and 0.4, and the ratio of Cl−/(Cl− + HCO3−) was between 0.001 and 0.35. The main controlling factor that determines the chemical composition of groundwater is rock weathering. The HD1-4-depth2 water sample collected in March was affected more by evaporation and concentration than rock weathering, indicating that the groundwater at the sampling point HD1-4-depth2 in the dry season is recharged by the highly concentrated paleo-water from adjacent aquifers or caves [47,50].
Principal component analysis of the water chemistry test results showed that HCO3− and Ca2+ were the anions and cations that contributed significantly to the water chemistry in the study area. Correlation analysis could reflect the similarity of the chemical components of karst water [51]. Table 4 shows the Pearson correlation coefficient matrix between the chemical components of different water samples in the study area. TDS had the greatest correlation with HCO3−, with a correlation coefficient of 0.78, indicating that the dissolution of carbonate rocks in the study area played a decisive role in the TDS of karst water [51]. Ca2+ was highly correlated with Mg2+, Ca2+ with HCO3−, and Mg2+ with CO32−, indicating that the chemical composition of deep karst water in the study area is controlled by the dissolution of limestone and dolomite [52,53,54]. The correlation coefficient between Mg2+ and Ca2+ was −0.75; the decrease of Ca2+ concentration corresponds to the increase of Mg2+ concentration (see Figure 7), with the most significant in August. August is the month with the highest rainfall in the study area; thus, during the maximum rainfall period, rainfall has a significant control effect on the chemical composition of karst groundwater, indicating that karst groundwater was recharged by precipitation during the rainy season [52].
In general, taking the well sampling depth as the scale, shallow (0–20 m), depth1 (230 m), depth2 (430 m) and depth3 (860 m) water chemical components had significant differences. In dry season, the shallow water chemistry characteristics of the well were basically the same as HS010, depth3 and other springs, but were quite different from depth1 and depth2. The main manifestations were the difference of Na+, SO42−, and Cl− ion concentration; the concentration of depth1 and depth2 was higher than other sampling points. This shows that the groundwater at the shallow well, HS010 and depth3 sampling points had a consistent source of recharge and may have had a good hydraulic connection. Based on the characteristics of karst development in well cores, it was inferred that surface water or shallow groundwater continuously replenished deep groundwater at depth3 through densely developed fault structures and reticular cracks, resulting in the same chemical characteristics of deep groundwater and shallow groundwater. Because the faults zone between the well and HS010 was very developed, the faults connected the well with HS010, and the deep karst water at depth3 was discharged to HS010 through the fault zone. This was the direct reason why HS010 still maintained a large flow of 310.5 L/s in the dry season.
5.3. Isotopic Characteristics and Indications of Karst Groundwater
It can be seen from the relationship between δ2H and δ18O that, except for a few other springs, all water samples fell near the GMWL and the LMWL, indicating that the karst groundwater originated from meteoric water [47,55,56].
The water samples of well HD1-2 were distributed along the LMWL, which was obviously the result of the combined effect of mixing and evaporation [57]. Water points were distributed at the lower left of the LMWL and upper left of the GMWL during the dry season, and at the upper right of the LMWL and GMWL during the rainy season. From the shallow to deep samples of HD1-2, the values of δ2H and δ18O gradually became negative, indicating that during the dry season, well HD1-2 may have been supplied by deep cave water or paleo-water through reticular cracks and fracture zones.
The water samples of well HD1-4 were densely distributed near the LMWL and GMWL, with most of the water points distributed between the two, and a few distributed in the lower right of the GMWL. This shows that well HD1-4 was supplied by a mixture of modern atmospheric precipitation and ancient atmospheric precipitation [58]. From the shallow to deep samples of HD1-4, the values of δ2H and δ18O gradually became negative. Compared with well HD1-2, the hydrogen and oxygen isotope values of depth3 were the most negative, depth2 was second, and depth1 was positive. The shallow hydrogen and oxygen isotope values were the most positive, and the hydrogen and oxygen isotope values showed the characteristics of decreasing vertically with depth.
The water samples of spring HS010 and other springs were distributed on both sides of the LMWL, but the distribution range was quite different. The distribution area of other springs was far from the LMWL and GMWL, and the distribution areas were scattered and far from wells. This shows that the δD and δ18O of other springs were quite different from the wells and that there may be no hydraulic connection. The spring HS010 was densely distributed near the LMWL, which coincided with the distribution area of HD1-4-depth2. The dry season was the most representative. The δ2H and δ18O of HD1-4-depth2 were similar to HS010, but quite different from HD1-2 and other springs. This shows that HS010 had different recharge from other springs and demonstrates the homology effect with HD1-4-depth2. It further shows that there was hydraulic connection between HS010 and well HD1-4, and HS010 was recharged by the deep karst water of well HD1-4 during the dry season [58]. In the rainy season, the δ2H and δ18O of HS010 and HD1-4-depth2 were positive, while the δ2H and δ18O of other springs and HD1-2 were negative. According to Liu C. (2015) [41], the δ2H and δ18O of meteoric water were positive in dry season and negative in rainy season in the Huanjiang area. The opposite variation trend for HS010 and HD1-4-depth2 showed that HS010 and HD1-4-depth2 had other recharge besides the recharge of meteoric water. The isotope relationship showed that there was a significant hydraulic connection between HS010 and well HD1-4.
5.4. Hypogene Groundwater Circulation and Hypogene Karst Development Pattern
5.4.1. Bottom of Deep Karst Groundwater Circulation
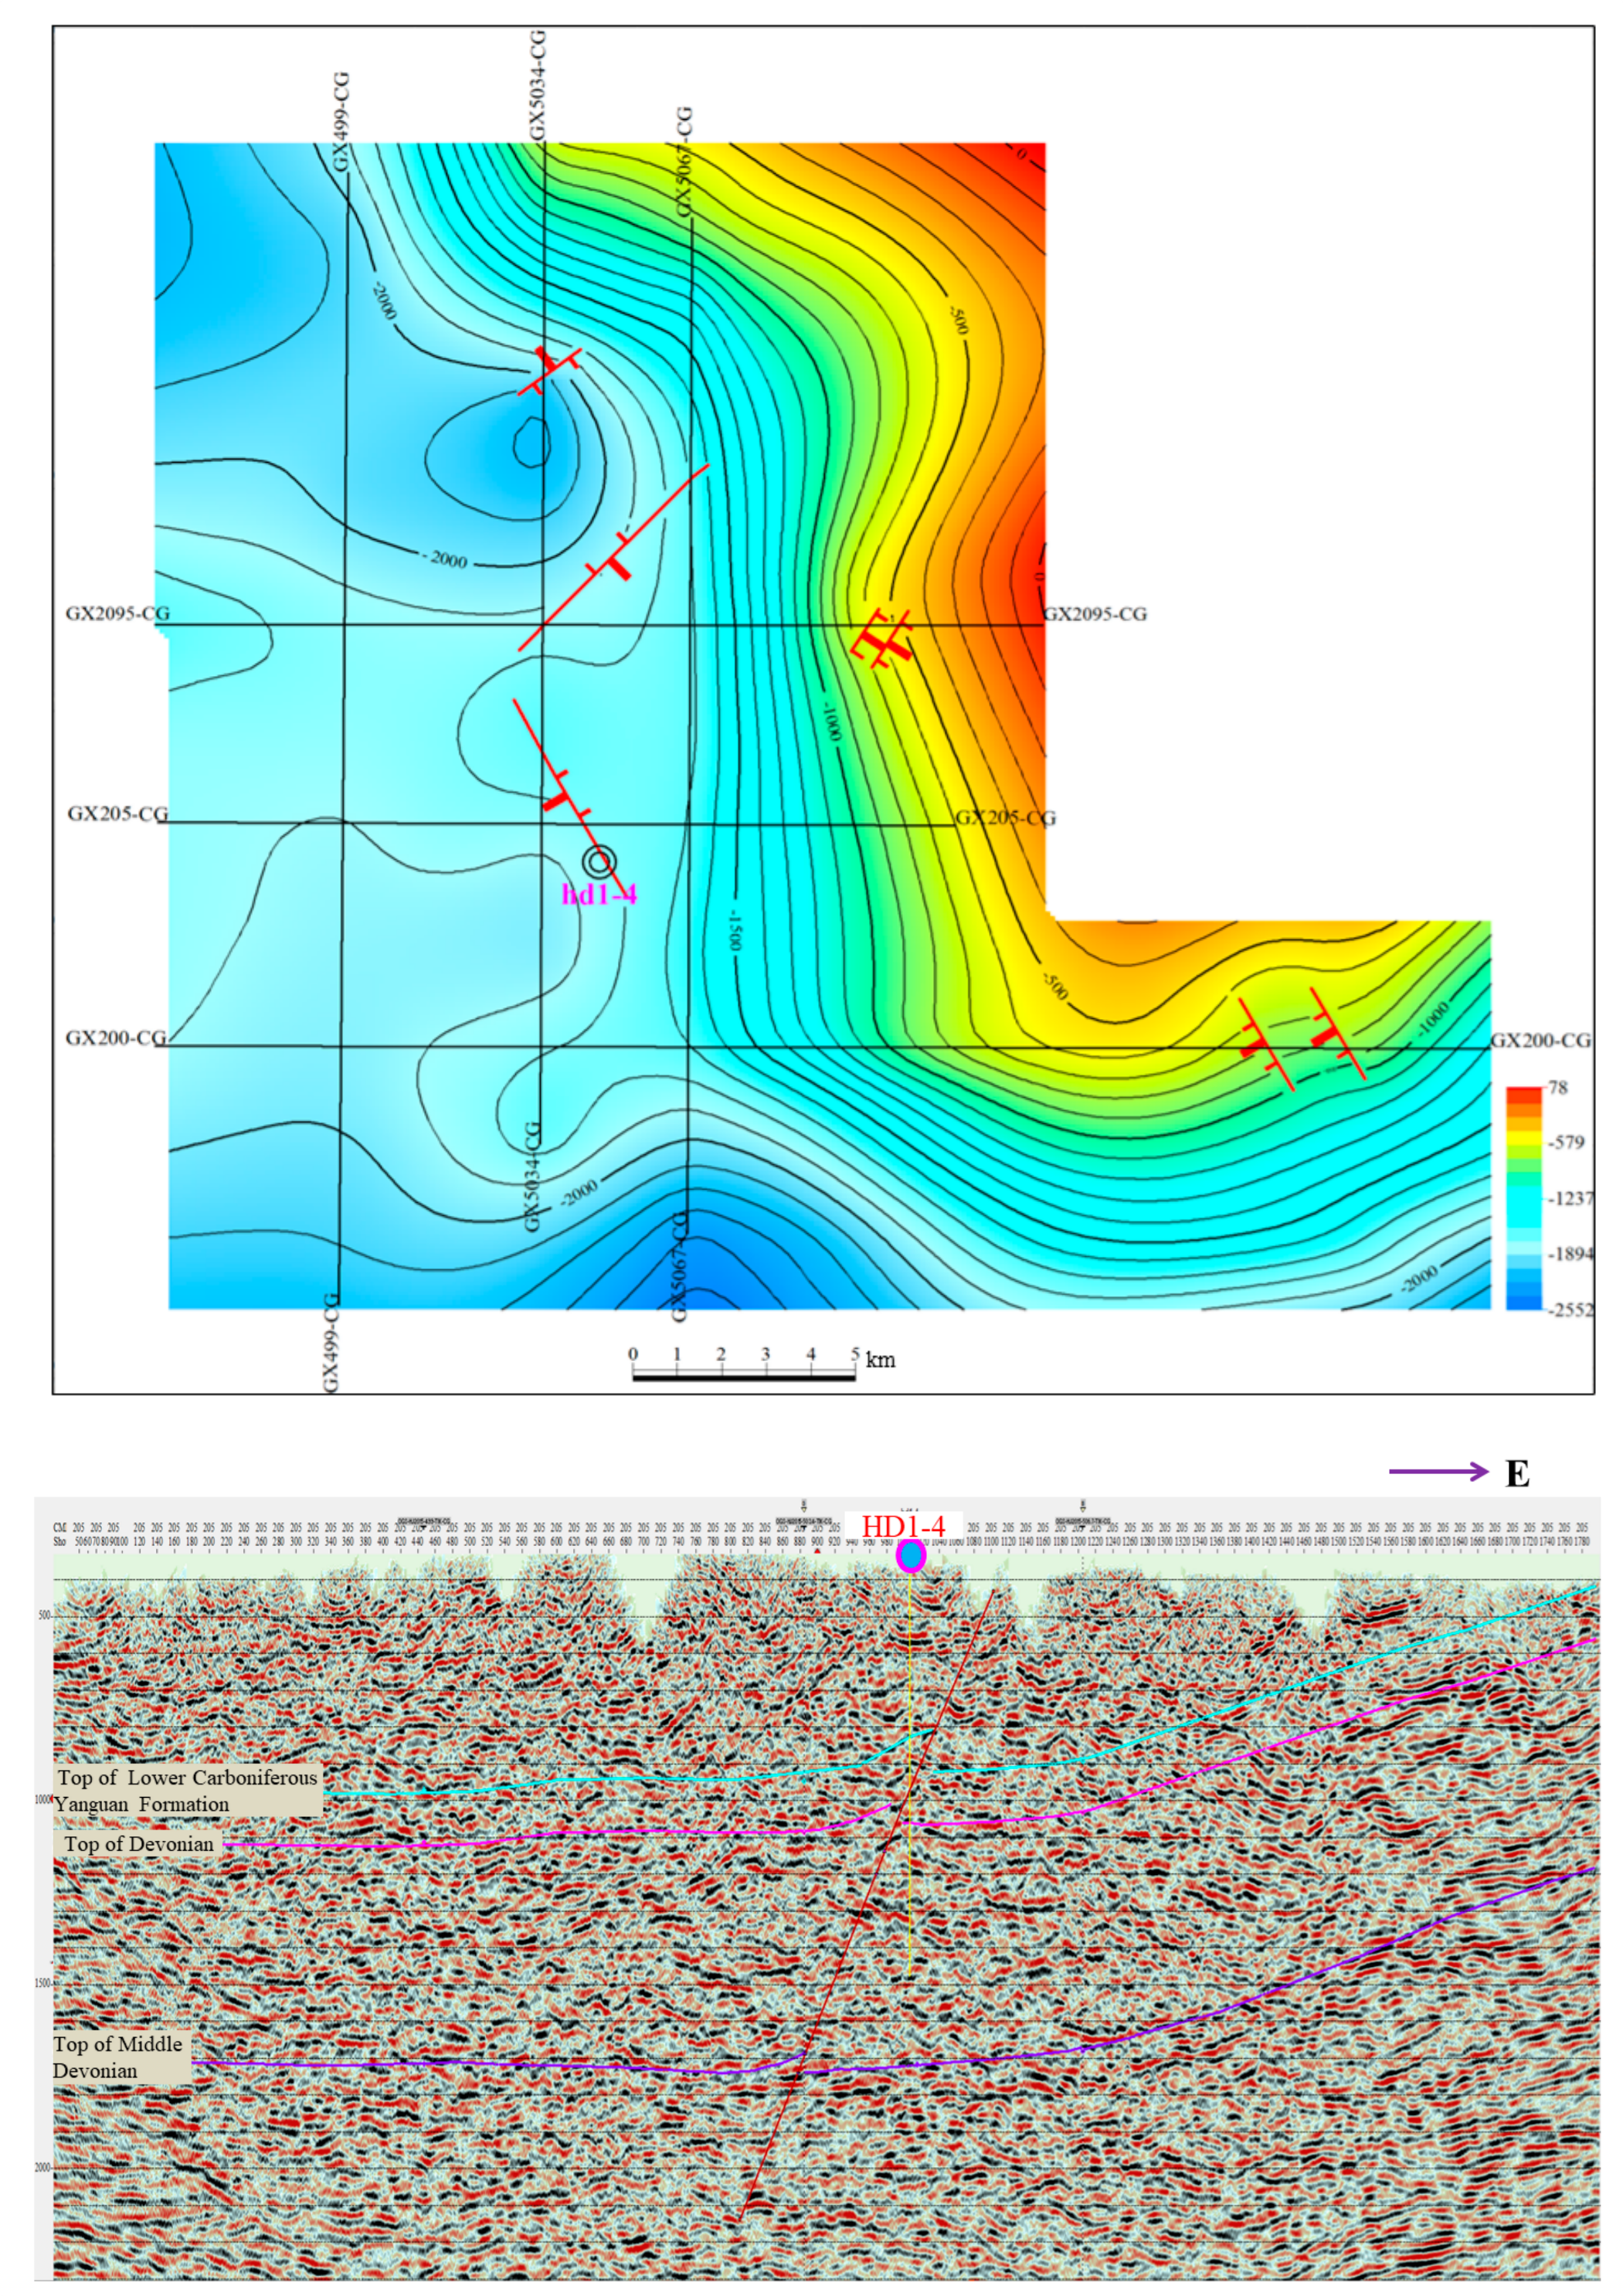
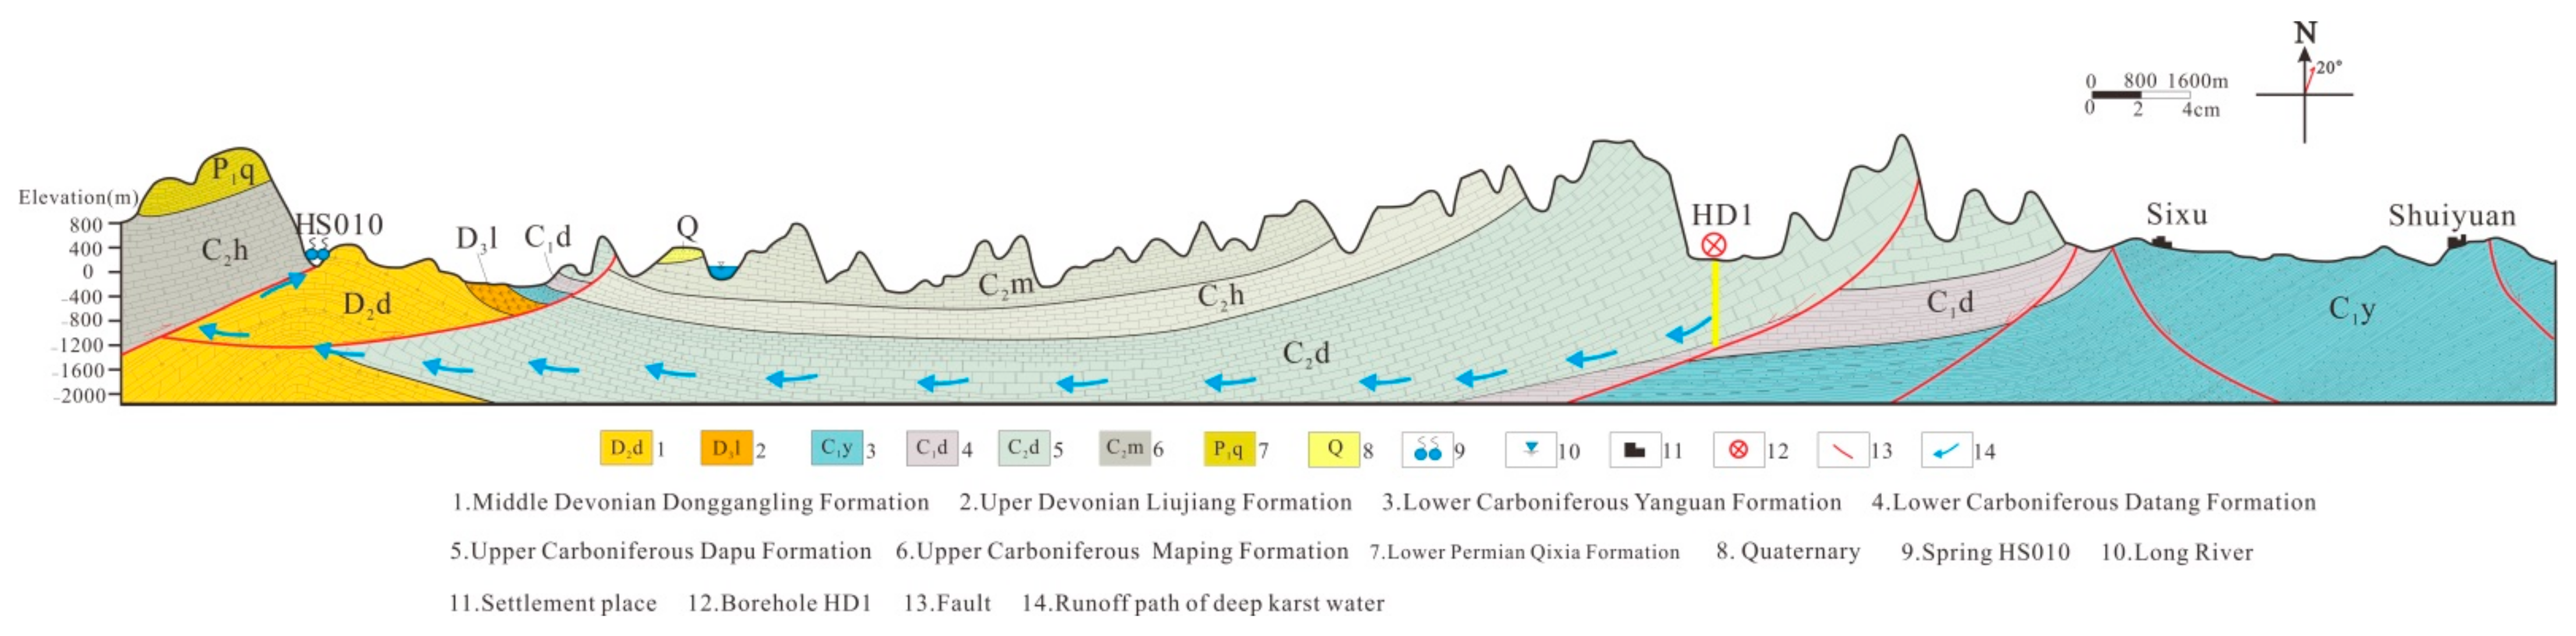
It can be seen from the development stratum of karst caves in the wells that the large set of dolomite and limestone of a Carboniferous system was the main karst strata, the lower voluminous shale of carbonate rock was the bottom surface that could be reached by hypogene karst, and the shale of lower Carboniferous rock pass formation was the bottom surface of karst in this area. The top surface structure map of the Yanguan formation, compiled based on seismic data (Figure 9), shows that the karstification bottom surface is a syncline structure with a steep east and gentle west, high in the north, and low in the middle and south. As there is no seismic data for HS010 further south, the changes in the bottom surface cannot be clearly understood. However, according to regional geological surveys, the core of the southern syncline was cut by the fault (Figure 10).
5.4.2. Hydrodynamic Analysis of Hypogene Karst
Huanjiang syncline is high in the north and low in the south. Surface and groundwater flow from the north to the south. An analysis of karst groundwater chemistry and hydrogen and oxygen isotopes indicated that the deep cavern water in the core of the syncline was recharged by modern atmospheric precipitation and could form a deep circulation of groundwater with the karst spring HS010 in the southern part of the syncline. Therefore, the topography difference from north to south provided good hydrodynamic conditions for the development of hypogene karst.
5.4.3. Runoff Channels of Hypogene Karst Groundwater
According to well core analysis, the development of the hypogene karst cave was closely related to fractures. A large number of network cracks and dissolved pores and holes along the cracks developed in the well core. Through seismic interpretation and surface investigation, we identified a NW-trending Tongtian fault zone, and fault scratches could be observed on the surface (Figure 5 and Figure 6; Figure 9). This fault zone had obvious water conductivity. The chemical characteristics of water at different depths in the well showed that, on the one hand, the surface atmospheric fresh water could flow from the top down to the deep, and on the other hand, the deep groundwater along the fault zone could flow sideways (Figure 11). After the internal syncline fault zone and the NE-trending regional fault zone converged, groundwater flowed along the regional fault and discharged to HS010 in the south. Therefore, the faults were runoff channels for hypogene karst groundwater.
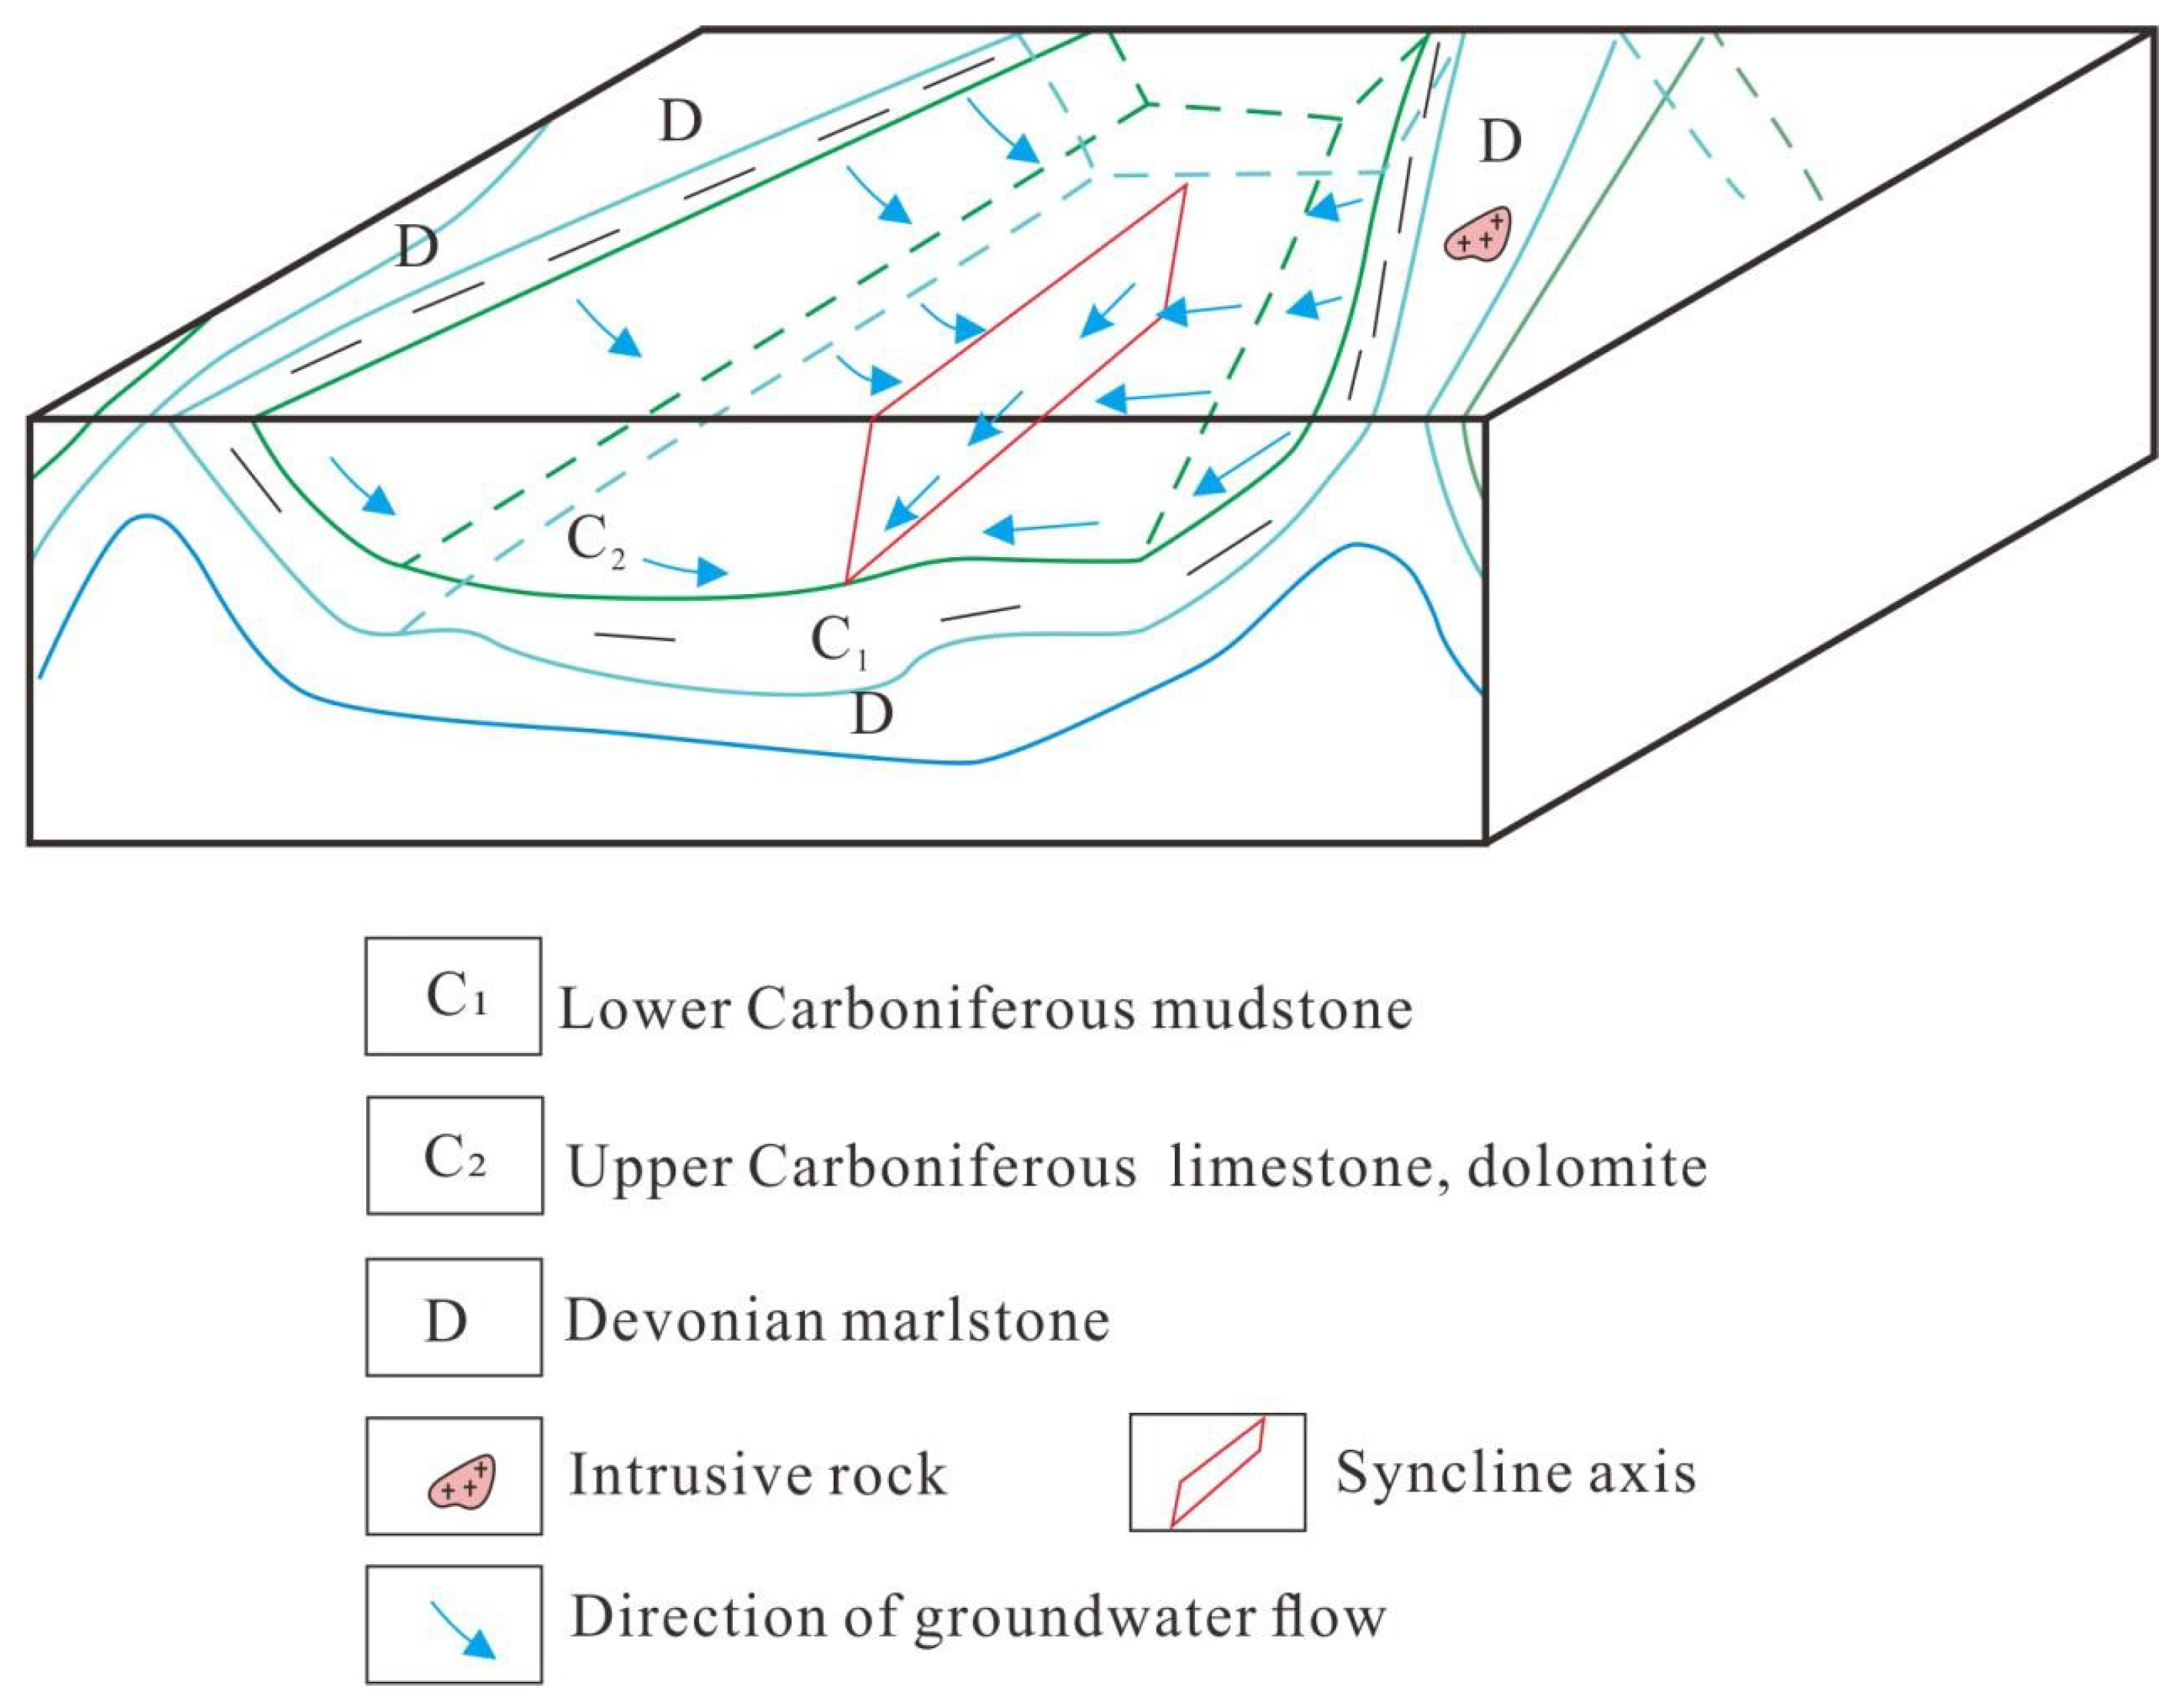
With sufficient dissolution space and good hydrodynamic conditions, the degree of karstification will increase exponentially [59]. The unique syncline structure, vertical and horizontal fault zones and deep circulating groundwater in the study area affect the development of deep karsts in the Huanjiang area. According to comprehensive analysis, this study establishes a hypogene karst development pattern controlled by the deep circulation of groundwater in the syncline structure (Figure 12).
6. Conclusions
Core and field investigations show that hypogene karst caves in Huanjiang are developed in the large set of Carboniferous carbonate rocks and are related to faults. Well water geochemical analysis shows the karst water in the shallow well, depth3 and HS010 has a good hydraulic connection. The shallow groundwater recharges the deep groundwater of depth3 through the fault structure, and then it discharges to HS010 in the south through fractures. Hydrogen and oxygen isotope analysis reveals the recharge–discharge relationship between HS010 and the wells. According to the characteristics of the top surface features of the shale structure in the Yanguan formation on the karst bottom surface explained by geophysical exploration, it is considered that the syncline structure overturning southward is the hydrodynamic condition, and after the surface water from the north, east and west of the syncline falls into the syncline, it flows southward and is discharged at HS010 through the faults. Therefore, this article suggests that the hypogene karst development pattern in the Huanjiang area is a karst development pattern of deep circulation of groundwater controlled by faults in the syncline structure. Therefore, under certain tectonic and hydrogeological conditions, hypogene karst is more common than our previous understanding, and its development depth is not controlled by the local discharge datum, but by the bottom of non-carbonate rock. The proposal of this pattern can provide guidance for the development of shale gas resources in the lower part of carbonate rocks in southern China to avoid the fault zone in the syncline core during well formation, and effectively reduce the risk of well hypogene karst caves. At the same time, the proposed pattern can guide the exploration of karst cavern type oil and gas reservoirs near the deep fault zone.
Author Contributions
Conceptualization, Y.D.; methodology, Y.D.; formal analysis, Y.D.; investigation, G.N. and S.J.; Writing—Original draft preparation, H.D.; Writing—Review and editing, J.L.; project administration, B.L. and Y.D.; all the co-authors performed a critical revision of the intellectual content of the paper. All authors have read and agreed to the published version of the manuscript.
Funding
This research was funded by the National Key R&D Program of China (No. 2018YFC0604301), the Nonprofit Industry Research Program of the Chinese Academy of Geological Sciences (YYWF201723), the Geological Survey Program of the China Geological Survey (DD20190723, DD20190562), the Natural Science Foundation of Guangxi, China (2016GXNSFAA380185, 2020GXNSFAA297095), the basic research program of Institute of Karst Geology, Chinese Academy of Geological Sciences (2020012, 2020018).
Institutional Review Board Statement
Not applicable.
Informed Consent Statement
Not applicable.
Acknowledgments
Shi Di-Shi of the Center of Oil and Natural Gas Resource Exploration, China Geological Survey, was of great assistance during core observation and two-dimensional seismic data collection. Du Wen-Yue and Yang Hui of the Institute of Karst Geology of the Chinese Academy of Geological Sciences were of great support during sample testing and analysis processes. Hu Xiu-Quan of Chengdu University of Technology was of great assistance during seismic data processing.
Conflicts of Interest
The authors declare no conflict of interest.
References
- Palmer, A.N. Origin and morphology of limestone caves. Geol. Soc. Am. Bull. 1991, 103, 1–21. [Google Scholar] [CrossRef]
- Kunsky, J. Thermomineral karst and caves of Zbrasov, Northern Moravia. Proc. Czechoslov. Soc. Geol. 1957, 62, 306–351. [Google Scholar]
- Dublyansky, Y.N. Hydrothermal karst in the Alpine folded region of the South of the USSR. Kras i Speleologia 1980, 3, 18–36. [Google Scholar]
- Dublyansky, Y.V. Speleogenetic History of the Hungarian Hydrothermal Karst. Environ. Geol. 1995, 25, 24–35. [Google Scholar] [CrossRef]
- Dublyansky, Y.V. Speleogenesis: Evolution of Karst Aquifers; National Speleological Society: Huntsville, AL, USA, 2000; pp. 298–303. [Google Scholar]
- Ford, D.C.; Williams, P.W. Karst Geomorphology and Hydrology; Unwin Hyman: London, UK, 1989; p. 601. [Google Scholar]
- Ford, D.C. Karst geomorphology, caves and cave deposits: A review of North American contributions during the past half century. In Perspectives on Karst Geomorphology, Hydrology and Geochemistry; Harmon, R.S., Wicks, C.W., Eds.; Paper 404; GSA Special: Boulder, CO, USA, 2006; pp. 1–14. [Google Scholar]
- Ford, D.C.; Williams, P.W. Karst Hydrogeology and Geomorphology; Wiley: Chichester, UK, 2007. [Google Scholar]
- Egemeier, S.J. Cavern development by thermal waters. Natl. Speleol. Soc. Bull. 1981, 49, 31–51. [Google Scholar]
- Hill, C.A. Geology of Carlsbad Cavern and other caves in the Guadalupe Mountains, New Mexico and Texas. N. Mex. Bu. Mines and Min. Res. Bull. 1987, 117, 150. [Google Scholar]
- Anette, S.E.; Libby, A.S. Microbial contributions to cave formation: New insights into sulfuric acid speleogenesis. Geology 2004, 32, 369–372. [Google Scholar]
- Harmon, R.S.; Wicks, C.M.; Ford, D.C.; White, W.B. Perspectives on Karst Geomorphology, Hydrology, and Geochemistry—A Tribute Volume to Derek C. Ford and William B. White, 2nd ed.; Geological Society of America: London, UK, 2006. [Google Scholar]
- Palmer, A.N. Distinction between epigenic and hypogenic maze caves. Geomorphology 2011, 134, 9–22. [Google Scholar] [CrossRef]
- Onac, B.P.; Hess, J.W.; White, W.B. The relationship between the mineral composition of speleothems and mineralization of breccia pipes: Evidence from corkscrew cave, Arizona, USA. Can. Mineral. 2007, 45, 1177–1188. [Google Scholar] [CrossRef]
- Audra, P.; D’antoni-Nobecourt, J.C. Hypogenic caves in France. Speleogenesis and morphology of the cave systems. Bull. Soc. Geol. Fr. 2010, 181, 327–335. [Google Scholar] [CrossRef]
- Broughton, P.L. Syndepositional architecture of the northern Athabasca Oil Sands Deposit, northeastern Alberta. Can. J. Earth Sci. 2015, 52, 21–50. [Google Scholar] [CrossRef]
- Walker, J.; Almasi, I.; Potma, K.; O’Keefe, J. Hypogenic karst beneath the Athabasca Oil Sands: Implications for oil sands mining operations. Bull. Can. Petrol. Geol. 2017, 65, 115–146. [Google Scholar] [CrossRef]
- Frumkin, A.; Langford, B.; Lisker, S.; Amrani, A. Hypogenic karst at the Arabian platform margins: Implications for far-field groundwater systems. Bull. Geol. Soc. Am. 2017, 129, 1636–1659. [Google Scholar] [CrossRef]
- Frumkin, A.; Langford, B. Arid hypogene karst in a multi-aquifer system: Hydrogeology and speleogenesis of Ashalim Cave, Negev Desert, Israel. In Advances in Karst Research: Theory, Fieldwork and Applications; Parise, M., Gabrovšek, F., Kaufmann, G., Ravbar, N., Eds.; Geological Society, Special Publications: London, UK, 2018. [Google Scholar]
- Bertotti, G.; Audra, P.; Auler, A.; Bezerra, F.H.; de Hoop, S.; Pontes, C.; Prabhakaran, R.; Lima, R. The Morro Vermelho hypogenic karst system (Brazil): Stratigraphy, fractures, and flow in a carbonate strike-slip fault zone with implications for carbonate reservoirs. AAPG Bull. 2020, 104, 2029–2050. [Google Scholar] [CrossRef]
- Duan, Z.C. Deep and Ultra-Deep Karst. Geol. Sci. Technol. Inf. 1982, S1, 117–119. (In Chinese) [Google Scholar]
- Ren, M.E.; Liu, Z.Z.; Wang, F.Y. Karst Introduction, 2nd ed.; Commercial Press: Beijing, China, 1983; pp. 26–49. [Google Scholar]
- Gao, J. Deep Karst. Eng. Investig. 1987, 1, 47–50. (In Chinese) [Google Scholar]
- Fei, Y.L. The issue of development on karst deep valley. Water Power 1980, 5, 21–23. (In Chinese) [Google Scholar]
- Klimchouk, A.B. Hypogene Speleogenesis: Hydrogeological and Morphogenetic Perspective; Special Paper, 1; National Cave and Karst Research Institute: Carlsbad, NM, USA, 2007. [Google Scholar]
- Zou, C.J. Application of tritium analysis to the study of deep karst and seepage problems at reservoir and dam sites. Carsol. Sin. 1988, 7, 132–138. (In Chinese) [Google Scholar]
- Li, Y.C.; Han, B.P. Deep karst periods and types in the Tengxian and Peixian coal bearing basin. Procedia Earth Planet. Sci. 1993, 11, 59–61. (In Chinese) [Google Scholar]
- Xia, R.Y. New progress in the study of paleokarst and deep karst in oil and gas fields. Carsol. Sin. 2001, 1, 20. (In Chinese) [Google Scholar]
- Huang, S.Y.; Song, H.R. Deep karstification of gas-oil reservoir. Carsol. Sin. 1997, 16, 189–198. (In Chinese) [Google Scholar]
- Lolcama, J.L.; Cohen, H.A.; Tonkin, M.J. Deep karst conduits, flooding, and sinkholes; lessons for the aggregates industry. Eng. Geol. 2002, 65, 151–157. [Google Scholar] [CrossRef]
- Xu, M.; Mao, B.Y.; Zhang, Q. Evolvement and ecpectation of research on the modern deep karst. Adv. Earth Sci. 2008, 23, 495–501. (In Chinese) [Google Scholar]
- Li, M.Q. The Simulation Study Deep karst Formation Conditions. In Karat Caves and Physiognomy; Science Press: Beijing, China, 1985. (In Chinese) [Google Scholar]
- Mao, B.Y.; Xu, M.; Bai, A.Z. Study on the Karst Development Law and Mechanism of Heshan Coal Field in Guangxi Province. Res. Soil Water Conserv. 2008, 1, 205–208. (In Chinese) [Google Scholar]
- Pan, W.Q.; Liu, Y.Y.F.; Dickson, J.A.D.; Shen, A.J.; Han, J.; Ye, Y.; Gao, H.L.; Guan, P.; Zheng, X.P. The Geological Model of Hydrothermal Activity in Outcrop and the Characteristics of Carbonate Hydrothermal Karst of Lower Paleozoic in Tarim Basin. Acta Sedimentol. Sin. 2009, 27, 983–994. (In Chinese) [Google Scholar]
- Regional Geological Survey Report of Luocheng Sheet (scale, 1:200000); The Geological Survey of Guangxi Zhuang Autonomous Region; Guangxi Geological Bureau Press: Nanning, China, 1968. (In Chinese)
- Regional Geological Survey Report of Donglan Sheet (scale, 1:200000); The Geological Survey of Guangxi Zhuang Autonomous Region; Guangxi Geological Bureau Press: Nanning, China, 1971. (In Chinese)
- Wu, G.G.; Yao, G.S.; Xu, Z.Y.; Guo, Q.X.; Chen, Z.L. Structural patterns and origin of tectonic reformation in guizhong depression. Mar. Orig. Pet. Geol. 2009, 14, 33–40. (In Chinese) [Google Scholar]
- Liu, B.; Li, S.Z.; Zhou, Y.G.; Jin, C.; Dai, L.M.; Liu, L.P.; Wang, T.; Wang, J.; Hao, Y.; Liu, E.S. Structural features and evolution of the Hechi-Yizhou fault zone, northern Guangxi-insights from shallow to deep structures of its Liucheng segment. Geotecton. Metallog. 2009, 33, 488–496. (In Chinese) [Google Scholar]
- Mao, P.X.; Jin, A.M.; Lou, Z.H. Investigation of pore structure and fractal characteristics of marine shale reservoirs of the Upper Paleozoic in Huanjiang sag, Guizhong depression. Chin. J. Geol. 2019, 54, 130–144. (In Chinese) [Google Scholar]
- Craig, H. Isotopic variations in meteoric water. Science 1961, 133, 1702–1703. [Google Scholar] [CrossRef]
- Liu, C. Responses of Stormflow to Rainfall in a Typical Karst Catchment Based on Stable Isotopes and Hydrogeochemistry. Ph.D. Thesis, Hunan Normal University, Changsha, China, 2015. (In Chinese). [Google Scholar]
- Song, Y.; Li, B.Z. Hydrochemical and isotopic analysis of groundwater in the Huize Lead-Zinc mining district, Yunnan. Acta Geol. 2018, 92, 1081–1089. (In Chinese) [Google Scholar]
- Schoen, R.; Ladouche, B.; Aquilina, L.; Bakalowicz, M.; Cubizolles, J. Hydro-chemical investigation of karstic systems (southern France); 2; Hydrodynamic and chemical monitoring of springs. J. Conf. Abs. 1999, 4, 562. [Google Scholar]
- Bakalowicz, M. The infiltration zone of karst aquifers; investigation methods; structure and behavior. Hydrogeologie 1995, 4, 3–21. [Google Scholar]
- Bakalowicz, M. Geochemistry of Water Applied to the Study of Karst Aquifers and Karstification. Ph.D. Thesis, Universite Pierre et Marie Curie, Paris VI, Paris, France, 1979; p. 269. [Google Scholar]
- Liang, J.W.; Li, R.X.; Chen, Y.L. Geochemical behaviors and genesis of formation water in 8th Member of Xiashihezi Formation in western Sulige gas field, Ordos Basin. Oil Gas Geol. 2013, 34, 625–631. (In Chinese) [Google Scholar]
- Chen, J.C.; Ji, B.C.; Liu, Z.; Zhang, Z.W.; Zhang, S.Y. Isotopic and hydro-chemical evidence on the origin of groundwater through deep-circulation ways in Lake Daihai region, Inner Mongolia plateau. J. Lake Sci. 2013, 25, 521–530. (In Chinese) [Google Scholar]
- Kortatsi, B.K. Hydrochemical framework of groundwater in the Ankobra Basin, Ghana. Aquat. Geochem. 2007, 13, 41–74. [Google Scholar] [CrossRef]
- Gibbs, R.J. Mechanisms controlling world water chemistry. Science 1970, 170, 1088–1090. [Google Scholar] [CrossRef]
- Wang, Y.P.; Wang, L.; Xu, C.X. Hydro-geochemistry and genesis of major ions in the Yangtze River, China. Geol. Bull. China 2010, 29, 46–456. (In Chinese) [Google Scholar]
- Wu, X.; Zheng, Y.; Zhang, J.; Wu, B.; Wang, S.; Tian, Y.; Li, J.; Meng, X. Investgating hydrochemical groundwater processes in an Inland agricultrural area with limited data: A clustering approach. Water 2017, 9, 723. (In Chinese) [Google Scholar] [CrossRef] [Green Version]
- Zhang, Q.H.; Zhao, Y.F.; Tang, J.L.; Lu, W.; Luo, Z.X. Hydrochemistry characteristics and recharge source of groundwater in typical watersheds of Beijing-Tianjin-Hebei region, China. J. Nat. Resour. 2020, 35, 1314–1325. (In Chinese) [Google Scholar]
- Zhang, T.; He, J.; Li, J.J.; Cao, Y.T.; Gong, L.; Liu, J.W.; Bian, C.; Cai, Y.M. Major ipnic features and possible controls in the groundwater in the Hamatong River basin. Environ. Sci. 2018, 39, 4981–4991. (In Chinese) [Google Scholar]
- Gao, S.; Li, C.S.; Jia, C. Spatiotemporal difference study of karst hydrochemical characteristics in the Baotu Spring area of Jinan. Acta Geol. Sin. 2019, 93, 61–70. (In Chinese) [Google Scholar]
- Liu, D.; Liu, S.M.; Xu, Z.M. Environmental isotope studies on shallow groundwater in the lower Tarim River, Xinjiang. J. Chengdu Univ. Technol. 1997, 24, 89–95. (In Chinese) [Google Scholar]
- Brijraj, K.D.; Moser, H. Application of environment isotopes to groundwater study in arid region. J. Hydrol. 1988, 98, 133–146. [Google Scholar]
- Galvao, P.; Hirata, R.; Halihan, T.; Tarada, R. Recharge sources and hydrochemical evolution of an urban karst aquifer, Sete Lagoas, M.G. Brazil. Environ. Earth Sci. 2017, 76, 158–178. [Google Scholar] [CrossRef]
- Li, J. Geochemistry of Clayey Aquitard Pore Water and Its Implication on Environment-a Case Study in the Coastal Plain of Northwest Bohai Bay; China University of Geosciences: Wuhan, China, 2014. [Google Scholar]
- Xu, M.; Mao, B.Y.; Yang, Y.N.; Zhang, Q.; Jiang, L.W. The Formation Mechanism and Suitability for Engineering of Modern Deep Karst, 3rd ed.; Sci. Press: Beijing, China, 2017; pp. 42–46. [Google Scholar]
Figure 1.
Tectonic location of the HuanJiang area. (A) Regional geological map of Huanjiang syncline, Guangxi. (B) Karst geomorphic map of Huanjiang syncline, Guangxi. Note: Figure 1A is from a geological survey of Guangxi, 1971; Figure 1B is from Google Earth.
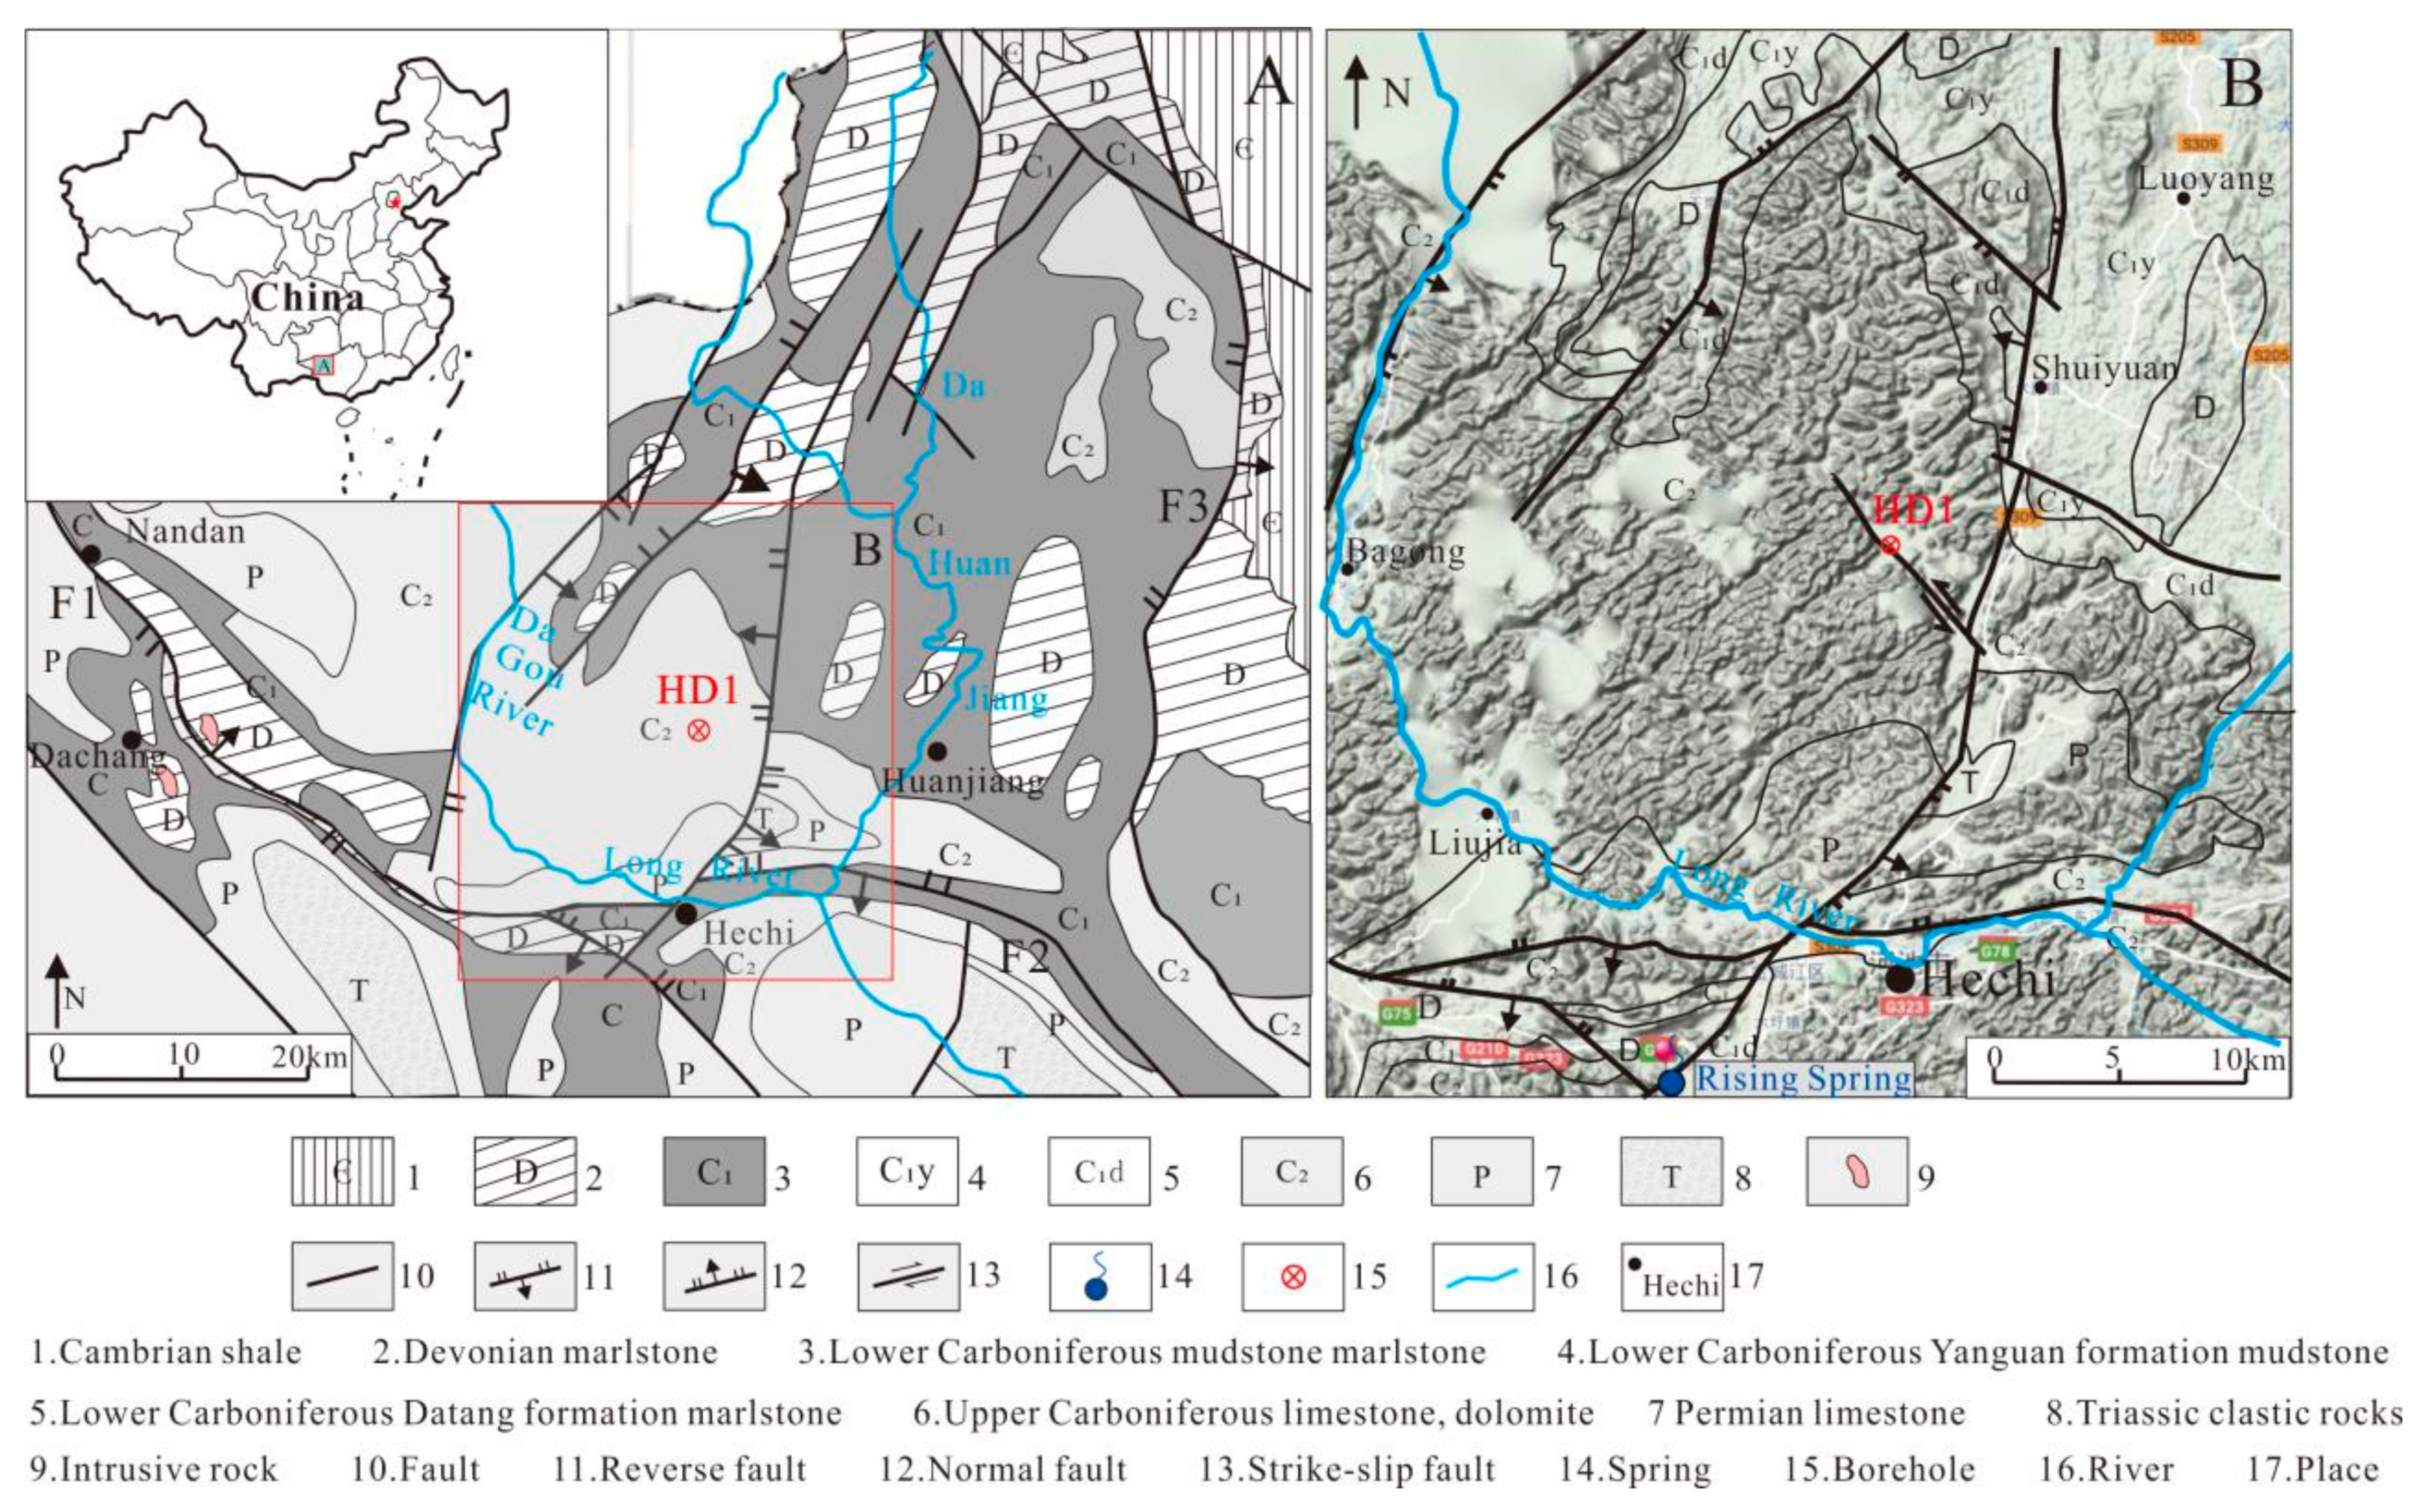
Figure 2.
Comparison map of middle and deep karst caves in Huanjiang syncline wells (three karst sections are found in the 230 m, 430 m, and 860 m caves).
Figure 2.
Comparison map of middle and deep karst caves in Huanjiang syncline wells (three karst sections are found in the 230 m, 430 m, and 860 m caves).

Figure 3.
Characteristics of karst development of a single well. (a) Cave filled with clay, 881.69–885 m, HD1-2 well. (b) The reticular cracks, 766.8–771.25 m, HD1-2 well. (c) Caves, 447–453 m, HD1-4 well. (d) Cracks filled with clay, 240–249 m; surface fault mark near the well: (e) slickensides and (f) fault breccia.

Figure 4.
Distribution map of karst groundwater sampling places in Huanjiang syncline.

Figure 5.
Water chemistry type division map.
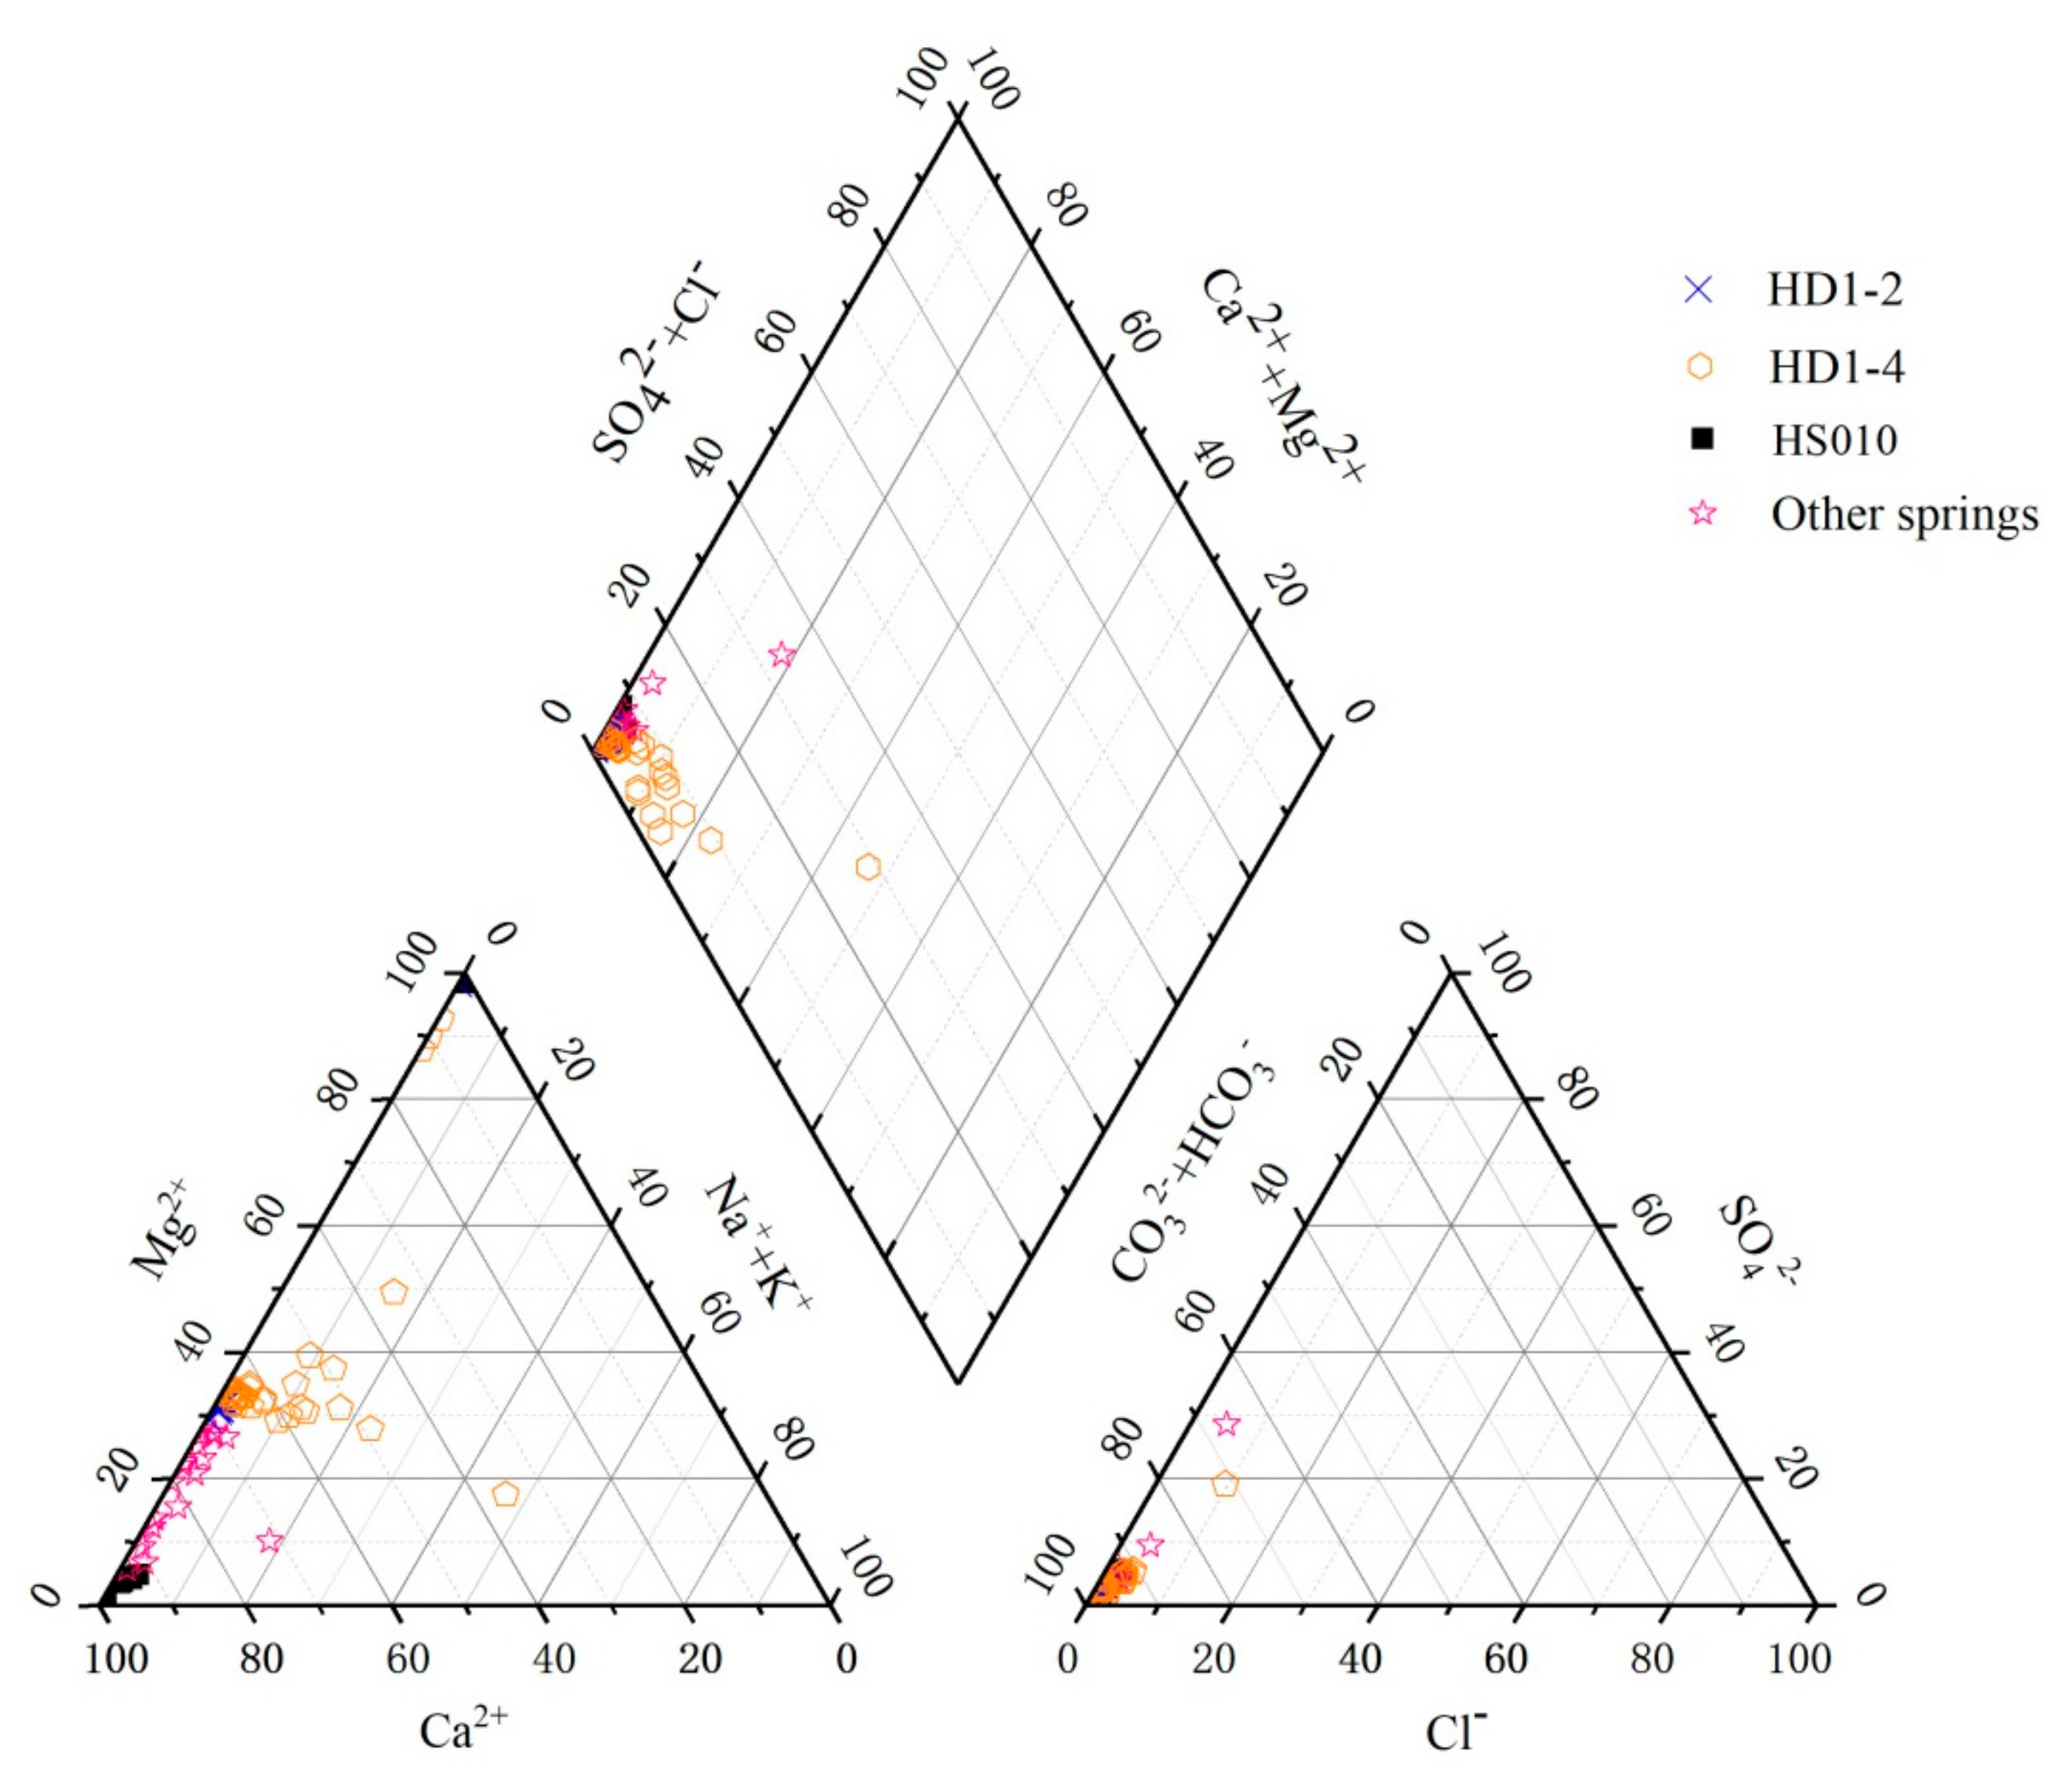
Figure 6.
Plot of δD versus δ18O for groundwater samples––the relationship between the distribution area of various types of water samples and GMWL and LMWL.
Figure 6.
Plot of δD versus δ18O for groundwater samples––the relationship between the distribution area of various types of water samples and GMWL and LMWL.
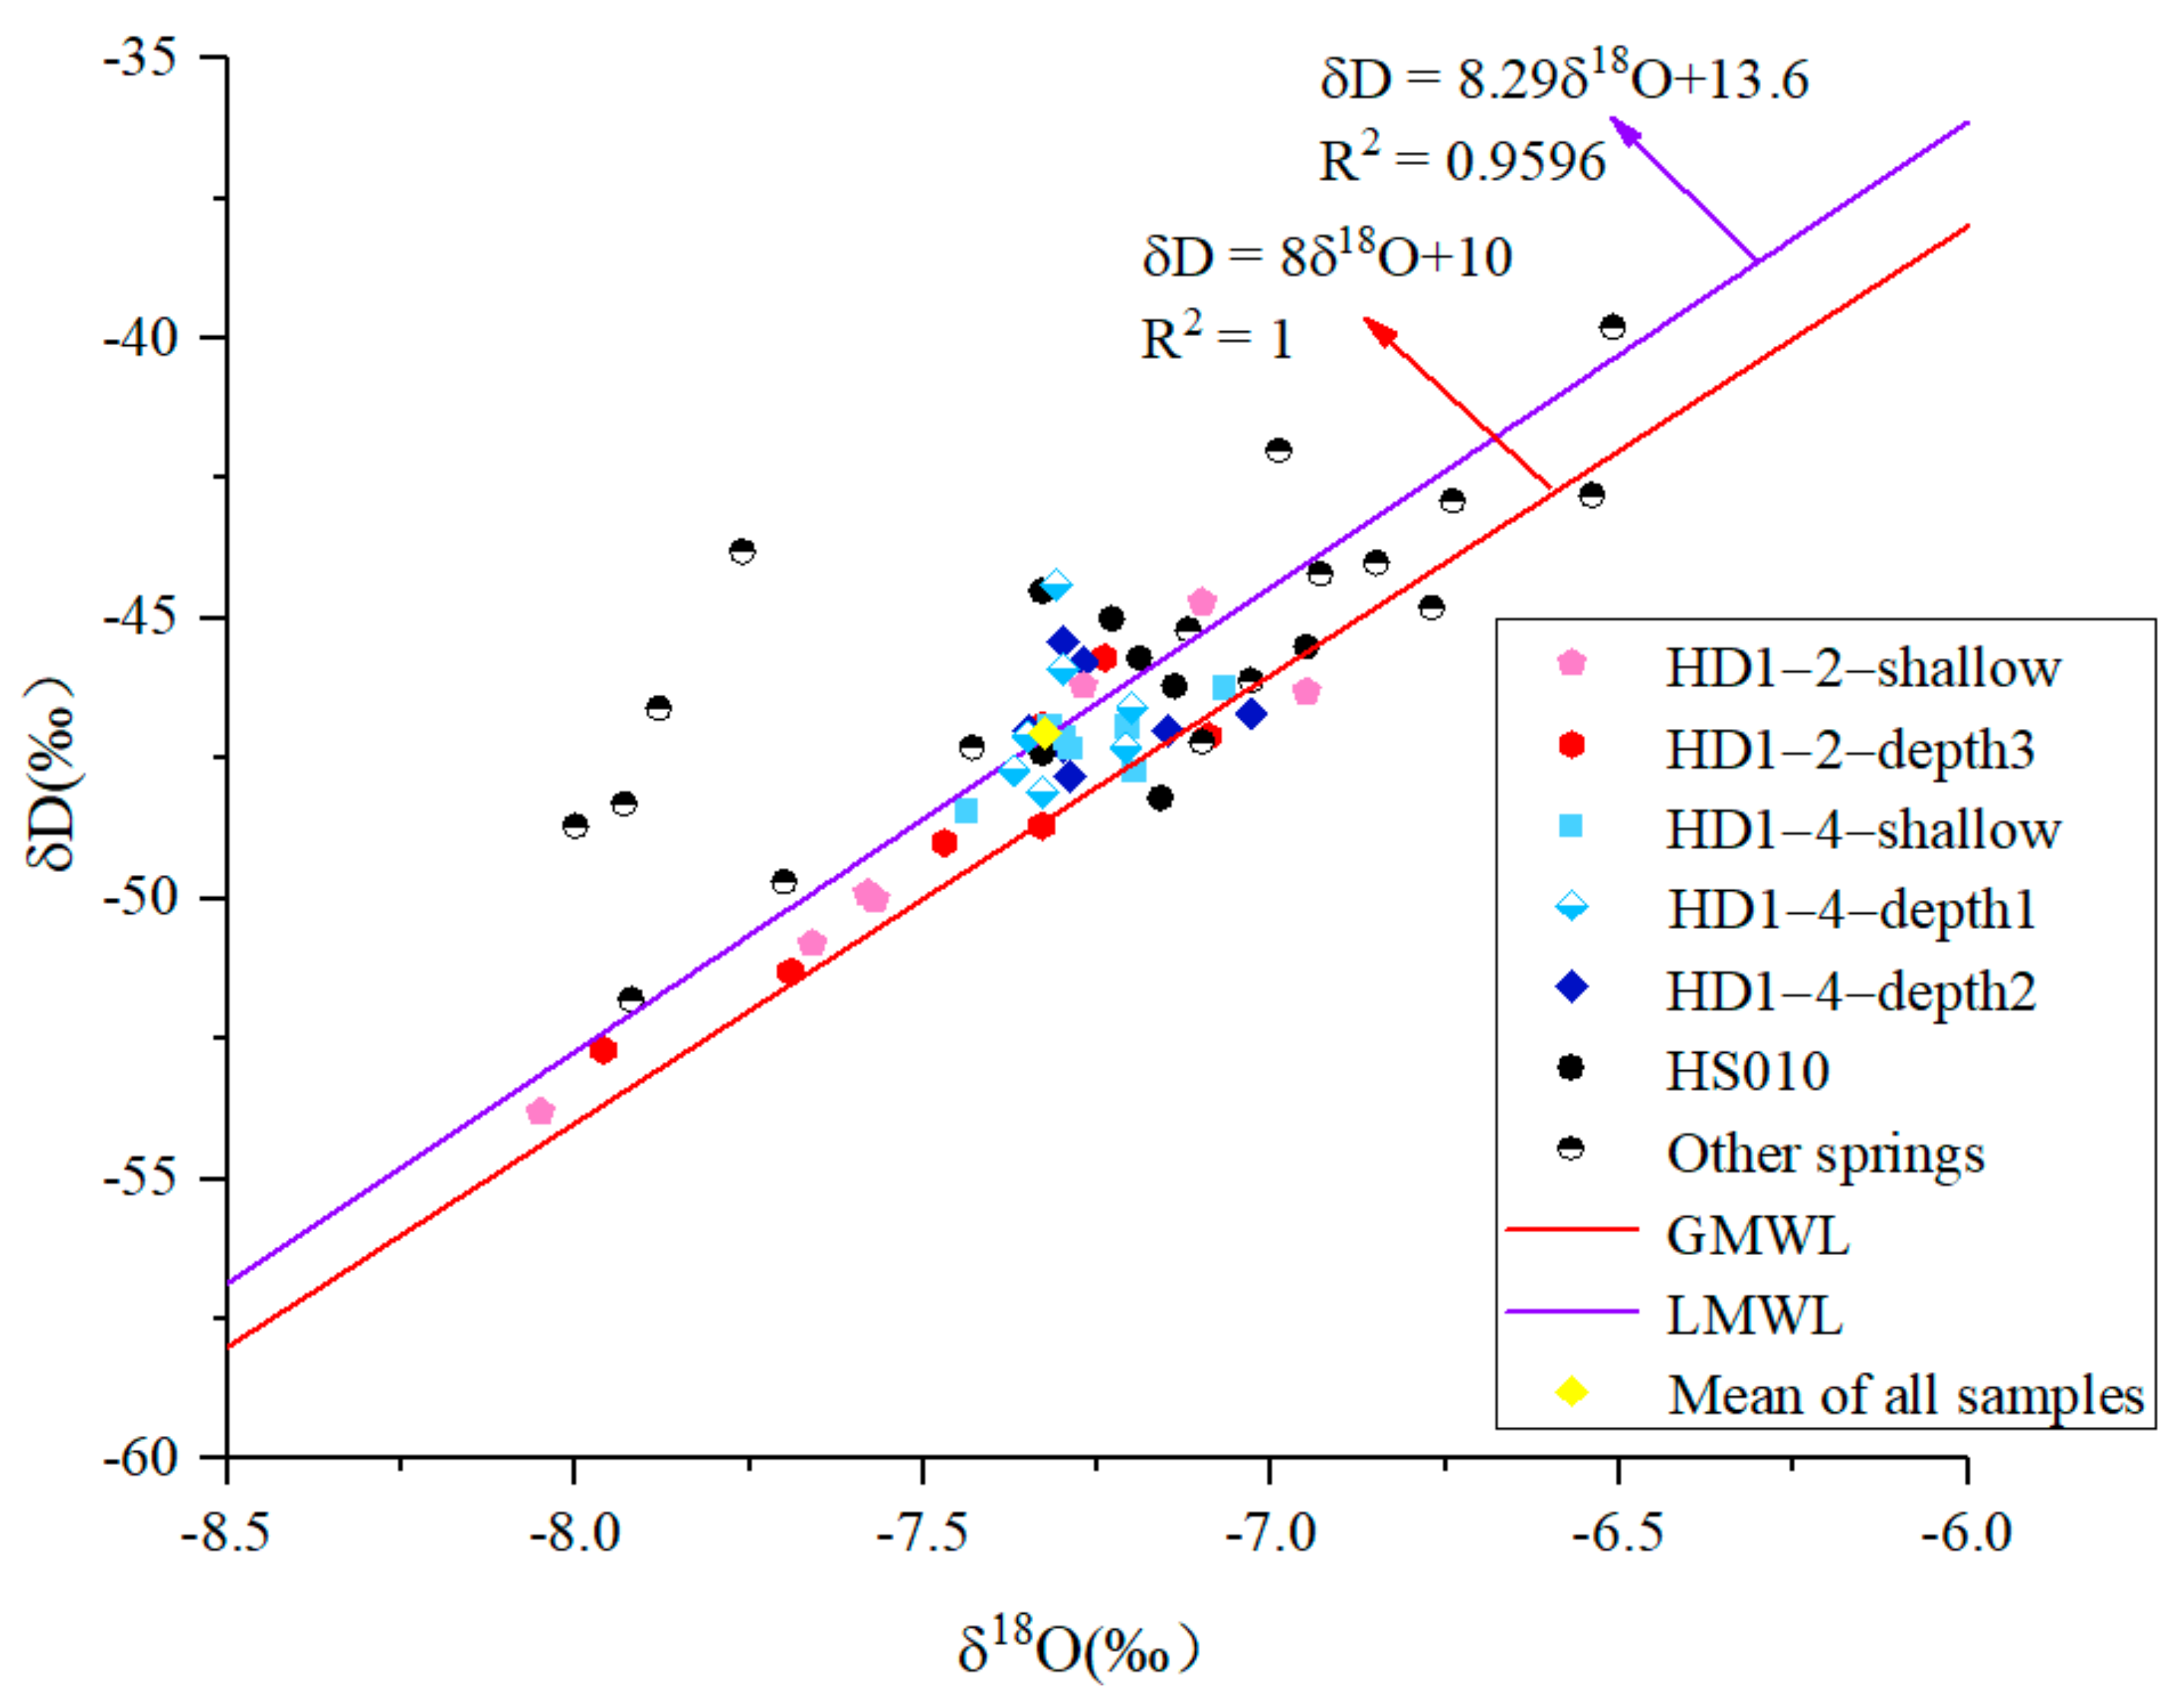
Figure 7.
Trend chart of main anion and cation concentration changes over time.


Figure 8.
Gibbs graph of karst groundwater in Huanjiang syncline, Guangxi (Ⅰ: evaporation and concentration; Ⅱ: rock weathering; Ⅲ: meteoric weather).
Figure 8.
Gibbs graph of karst groundwater in Huanjiang syncline, Guangxi (Ⅰ: evaporation and concentration; Ⅱ: rock weathering; Ⅲ: meteoric weather).

Figure 9.
Top figure: structural map of shale top surface of Carboniferous Yanguan formation in Huanjiang syncline (according to the interpretation data of 2D seismic GX205-CG strata; isoline represents depth.) Bottom figure is an E–W 2D seismic, fault and strata interpretation profile near HD1 wells (HD1 wells are located in the fault).

Figure 10.
Sectional view of actual geological map of deep karst in Huanjiang syncline. (The deep karst groundwater of HD1 well in the northern part of the syncline recharge the karst spring HS010 in the southern part of the syncline through the fracture zone).
Figure 10.
Sectional view of actual geological map of deep karst in Huanjiang syncline. (The deep karst groundwater of HD1 well in the northern part of the syncline recharge the karst spring HS010 in the southern part of the syncline through the fracture zone).

Figure 11.
Spatial interpretation of deep karst controlled by faults in Huanjiang syncline HD1 well.
Figure 11.
Spatial interpretation of deep karst controlled by faults in Huanjiang syncline HD1 well.
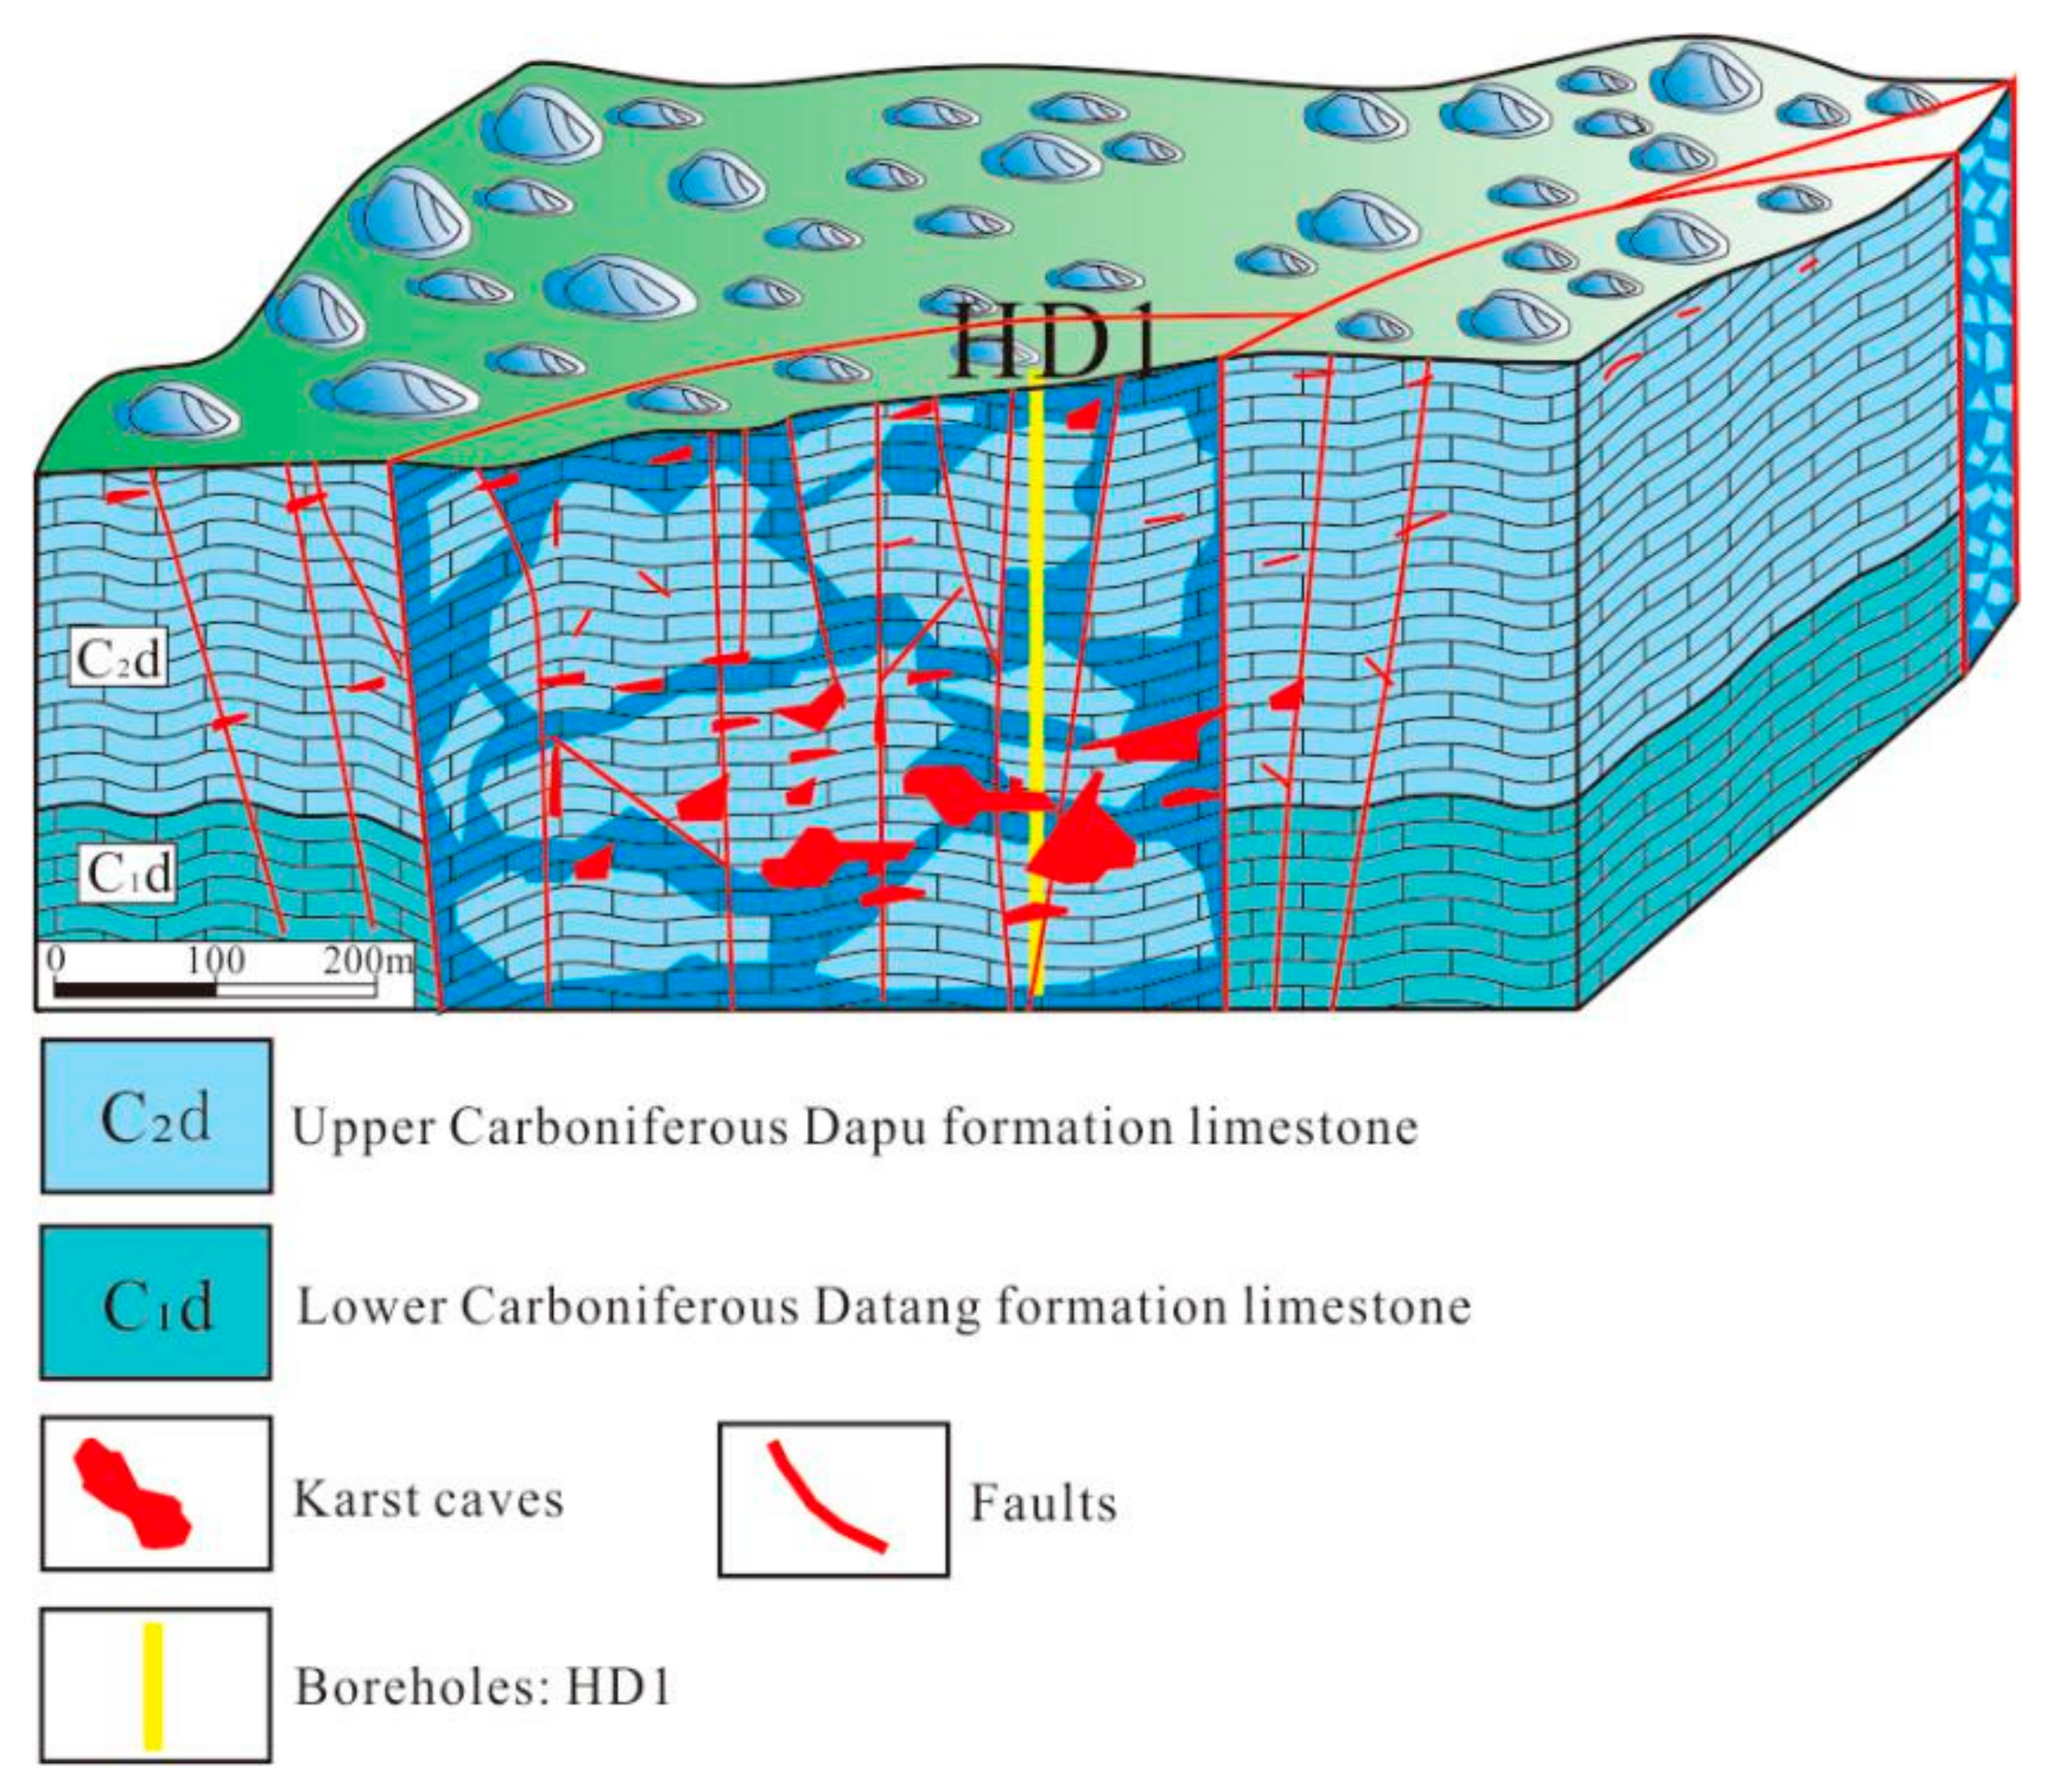
Figure 12.
Fault control deep groundwater karst pattern diagram for Huanjiang syncline.


Table 1.
Hydrogeological information and field test results of sampling points in Huanjiang syncline.
Table 1.
Hydrogeological information and field test results of sampling points in Huanjiang syncline.
| ID | Elevation(m) | Type | Exposed Condition | Temperature (°C)/January | Average Flow in Dry Season (L/s) | Average Flow in Rainy Season (L/s) | Water Table (m) |
|---|---|---|---|---|---|---|---|
| HD1-2 | 200 | well | C2d/Near the fault | 20~33/depth: 0–850 m | / | / | 7~20 |
| HD1-4 | 200 | well | C2d/Near the fault | 20~42/depth: 0–1100 m | / | / | 7~20 |
| HS001 | 193 | descending spring | C2h | 21.2 | 5.5 | 30.5 | 0 |
| HS002 | 187 | descending spring | C2h | 20.3 | 31 | 70 | 0 |
| HS003 | 172 | descending spring | C2h | 21.2 | 20.5 | 69 | 0 |
| HS004 | 176 | descending spring | C2h | 19.2 | 62.1 | 115 | 0 |
| HS005 | 183 | descending spring | C1d | 19.8 | 2 | 15 | 0 |
| HS006 | 252 | ponor | C2d | 16.1 | 10.5 | 80.7 | 1.2 |
| HS007 | 334 | puddle | C2d | 19.8 | / | / | 1 |
| HS008 | 135 | descending spring | C2d | 20.2 | 93.1 | 174.8 | 0 |
| HS009 | 100 | skylight | P1m | 21.2 | / | / | 30 |
| HS010 | 113 | ascending spring | Fault | 24.1 | 310.5 | 360.9 | 0 |
| HS011 | 92 | skylight | C2m | 20.8 | / | / | 19 |
| HS012 | 194 | skylight | C2h | 21.2 | / | / | 21 |
| HS013 | 365 | skylight | C1d | 21.6 | / | / | 1.5 |
| HS014 | 399 | descending spring | C2d/C1d/On the stratigraphic boundary | 19.6 | 18 | 47 | 0 |
| HS015 | 382 | puddle | C1d | 21.3 | / | / | 1.5 |
| HS016 | 417 | descending spring | C2h | 20.6 | 0.1 | 1.9 | 0 |
| HS017 | 191 | skylight | C2h | 21.2 | 173.1 | 246.7 | 0.9 |
| HS018 | 100 | descending spring | C1d | 20.2 | 0.01 | 1.8 | 0 |
| HS019 | 122 | pumping well | D3 | 22 | / | / | 18 |
| HS020 | 190 | ascending spring | C2d/C1d/On the stratigraphic boundary | 21.8 | 1.8 | 13.9 | 0 |
| HS021 | 217 | descending spring | C2h | 20.8 | 20.3 | 48.2 | 0 |
| HS022 | 183 | ponor | C2h | 17.3 | 1.1 | 10.5 | 1.3 |
| Long River | 110 | river | / | 17.2 | / | / | 0 |
Table 2.
Parameter statistics for major ions.
| Parameters | Sampling ID | pH | TDS | K+ | Na+ | Ca2+ | Mg2+ | Cl− | SO42− | HCO3− | NO3− |
|---|---|---|---|---|---|---|---|---|---|---|---|
| ppm | |||||||||||
| MIN | HD1-2-shallow | 7.12 | 522.45 | 0.03 | 0.10 | 0.52 | 32.09 | 0.41 | 1.96 | 11.99 | 0.00 |
| HD1-2-depth3 | 7.52 | 508.23 | 0.01 | 0.04 | 1.18 | 30.44 | 0.34 | 2.12 | 11.52 | 0.00 | |
| HD1-4-shallow | 7.38 | 418.94 | 0.04 | 0.23 | 4.10 | 23.92 | 1.99 | 1.54 | 8.72 | 0.00 | |
| HD1-4-depth1 | 7.45 | 459.55 | 0.01 | 0.14 | 6.37 | 25.01 | 2.52 | 3.70 | 7.28 | 0.00 | |
| HD1-4-depth2 | 7.43 | 448.41 | 0.04 | 0.14 | 7.44 | 24.28 | 2.63 | 4.69 | 8.02 | 0.00 | |
| HS010 | 7.44 | 346.15 | 0.15 | 0.24 | 0.72 | 0.72 | 0.00 | 3.14 | 11.13 | 0.00 | |
| Other springs | 7.12 | 485.58 | 0.15 | 0.05 | 62.65 | 5.20 | 1.38 | 5.92 | 227.23 | 0.04 | |
| MAX | HD1-2-shallow | 7.82 | 750.88 | 1.04 | 1.19 | 78.84 | 73.19 | 4.17 | 12.17 | 413.51 | 6.94 |
| HD1-2-depth3 | 7.99 | 732.08 | 1.05 | 1.11 | 77.29 | 69.56 | 4.12 | 11.78 | 402.91 | 6.12 | |
| HD1-4-shallow | 7.81 | 650.88 | 1.22 | 9.01 | 67.25 | 54.86 | 8.53 | 10.69 | 355.18 | 16.12 | |
| HD1-4-depth1 | 7.84 | 667.46 | 0.96 | 10.38 | 68.00 | 57.35 | 9.16 | 10.88 | 363.42 | 15.49 | |
| HD1-4-depth2 | 8.02 | 868.21 | 2.96 | 66.72 | 63.58 | 54.84 | 49.08 | 97.36 | 371.09 | 18.47 | |
| HS010 | 7.88 | 459.38 | 1.47 | 1.64 | 81.87 | 77.93 | 4.92 | 13.92 | 236.02 | 10.71 | |
| Other springs | 7.65 | 644.74 | 2.39 | 19.63 | 88.28 | 29.50 | 16.91 | 97.83 | 336.41 | 18.46 | |
| MEAN | HD1-2-shallow | 7.57 | 672.33 | 0.28 | 0.53 | 65.78 | 38.22 | 2.24 | 9.09 | 339.60 | 3.86 |
| HD1-2-depth3 | 7.68 | 671.16 | 0.21 | 0.54 | 65.99 | 37.71 | 2.08 | 9.21 | 339.82 | 3.80 | |
| HD1-4-shallow | 7.59 | 561.53 | 0.50 | 2.82 | 50.41 | 33.60 | 4.13 | 7.83 | 282.21 | 6.14 | |
| HD1-4-depth1 | 7.65 | 584.47 | 0.20 | 3.31 | 53.92 | 33.90 | 4.49 | 7.97 | 294.41 | 4.59 | |
| HD1-4-depth2 | 7.66 | 632.73 | 0.79 | 14.51 | 52.37 | 32.39 | 11.85 | 22.33 | 303.11 | 5.63 | |
| HS010 | 7.58 | 437.76 | 0.46 | 0.65 | 70.71 | 9.32 | 3.09 | 10.40 | 209.56 | 8.05 | |
| Other springs | 7.38 | 552.39 | 0.86 | 1.55 | 75.53 | 17.47 | 4.74 | 15.69 | 288.46 | 3.63 | |
| STD | HD1-2-shallow | 0.19 | 62.29 | 0.34 | 0.30 | 23.14 | 12.43 | 1.00 | 2.75 | 116.88 | 1.81 |
| HD1-2-depth3 | 0.15 | 62.39 | 0.34 | 0.34 | 22.93 | 11.35 | 0.96 | 2.68 | 116.36 | 1.64 | |
| HD1-4-shallow | 0.15 | 80.39 | 0.40 | 2.72 | 20.28 | 7.61 | 1.83 | 2.92 | 98.24 | 4.92 | |
| HD1-4-depth1 | 0.11 | 68.53 | 0.28 | 3.27 | 18.20 | 8.14 | 1.90 | 2.57 | 100.88 | 4.35 | |
| HD1-4-depth2 | 0.17 | 108.20 | 0.88 | 18.52 | 15.81 | 7.98 | 12.91 | 25.40 | 103.17 | 5.72 | |
| HS010 | 0.11 | 30.43 | 0.33 | 0.38 | 22.17 | 21.62 | 1.15 | 2.56 | 62.72 | 2.62 | |
| Other springs | 0.15 | 42.89 | 0.70 | 4.30 | 7.96 | 7.31 | 4.12 | 19.93 | 29.87 | 5.03 | |
| C.V | HD1-2-shallow | 0.02 | 0.09 | 1.23 | 0.57 | 0.35 | 0.33 | 0.45 | 0.30 | 0.34 | 0.47 |
| HD1-2-depth3 | 0.02 | 0.09 | 1.63 | 0.62 | 0.35 | 0.30 | 0.46 | 0.29 | 0.34 | 0.43 | |
| HD1-4-shallow | 0.02 | 0.14 | 0.80 | 0.96 | 0.40 | 0.23 | 0.44 | 0.37 | 0.35 | 0.80 | |
| HD1-4-depth1 | 0.01 | 0.12 | 1.38 | 0.99 | 0.34 | 0.24 | 0.42 | 0.32 | 0.34 | 0.95 | |
| HD1-4-depth2 | 0.02 | 0.17 | 1.11 | 1.28 | 0.30 | 0.25 | 1.09 | 1.14 | 0.34 | 1.02 | |
| HS010 | 0.01 | 0.07 | 1.38 | 1.71 | 3.19 | 0.43 | 2.68 | 4.07 | 3.34 | 3.08 | |
| Other springs | 0.02 | 10.76 | 0.61 | 1.61 | 2.88 | 3.32 | 2.15 | 3.44 | 2.92 | 2.31 | |
Table 3.
Statistics for δ2H and δ18O values.
| Index | Parameters | HS010 (‰) | HD1-2 -shallow (‰) | HD1-2 -depth3 (‰) | HD1-4 -shallow (‰) | HD1-4 -depth1 (‰) | HD1-4 -depth2 (‰) | Other Springs (‰) |
|---|---|---|---|---|---|---|---|---|
| δ2H | min | −48.20 | −53.80 | −52.70 | −48.40 | −48.10 | −47.80 | −59.10 |
| max | −44.50 | −44.70 | −45.70 | −46.20 | −44.40 | −45.40 | −35.40 | |
| mean | −46.21 | −48.81 | −48.77 | −47.21 | −46.72 | −46.70 | −46.28 | |
| STD | 1.28 | 3.20 | 2.50 | 0.69 | 1.25 | 0.84 | 5.29 | |
| C.V | 0.03 | 0.07 | 0.05 | 0.01 | 0.03 | −0.02 | 0.11 | |
| δ18O | min | −7.34 | −8.05 | −7.96 | −7.44 | −7.37 | −7.35 | −8.80 |
| max | −6.95 | −6.95 | −7.09 | −7.07 | −7.20 | −7.03 | −6.36 | |
| mean | −7.21 | −7.45 | −7.44 | −7.26 | −7.30 | −7.24 | −7.35 | |
| STD | 0.13 | 0.37 | 0.29 | 0.12 | 0.07 | 0.11 | 0.70 | |
| C.V | 0.02 | 0.05 | 0.04 | 0.02 | 0.009 | –0.01 | 0.09 |
Table 4.
Correlation coefficient matrix of ionic concentration.
| Ionic Name | K+ | Na+ | Ca2+ | Mg2+ | Cl− | SO42− | HCO3− | CO32− | NO3− | TDS |
|---|---|---|---|---|---|---|---|---|---|---|
| K+ | 1 | 0.58 | 0.16 | -0.25 | 0.66 | 0.66 | 0.09 | −0.22 | 0.11 | 0.12 |
| Na+ | 0.58 | 1 | −0.13 | 0.00 | 0.95 | 0.78 | 0.12 | −0.10 | 0.06 | 0.34 |
| Ca2+ | 0.16 | −0.13 | 1 | −0.75 | −0.02 | 0.20 | 0.68 | −0.82 | 0.29 | 0.29 |
| Mg2+ | −0.25 | 0.00 | −0.75 | 1 | −0.12 | −0.21 | −0.21 | 0.66 | −0.42 | 0.28 |
| Cl− | 0.66 | 0.95 | −0.02 | −0.12 | 1 | 0.82 | 0.11 | −0.15 | 0.20 | 0.28 |
| SO42− | 0.66 | 0.78 | 0.20 | −0.21 | 0.82 | 1 | 0.11 | −0.18 | 0.30 | 0.29 |
| HCO− | 0.09 | 0.12 | 0.68 | −0.21 | 0.11 | 0.11 | 1 | −0.82 | 0.03 | 0.78 |
| CO32− | −0.22 | −0.10 | −0.82 | 0.66 | −0.15 | −0.18 | −0.82 | 1 | −0.32 | 0.33 |
| NO− | 0.11 | 0.06 | 0.29 | −0.42 | 0.20 | 0.30 | 0.03 | −0.32 | 1 | 0.17 |
| TDS | 0.12 | 0.34 | 0.29 | 0.28 | 0.28 | 0.29 | 0.78 | 0.33 | 0.17 | 1 |
Publisher’s Note: MDPI stays neutral with regard to jurisdictional claims in published maps and institutional affiliations. |
© 2021 by the authors. Licensee MDPI, Basel, Switzerland. This article is an open access article distributed under the terms and conditions of the Creative Commons Attribution (CC BY) license (http://creativecommons.org/licenses/by/4.0/).
Share and Cite
MDPI and ACS Style
Dong, H.; Dan, Y.; Liang, J.; Liang, B.; Nie, G.; Ji, S. A Hypogene Karst Development Pattern Controlled by the Deep-Cycle of Groundwater in the Syncline in Huanjiang, Guangxi, China. Water 2021, 13, 199. https://doi.org/10.3390/w13020199
AMA Style
Dong H, Dan Y, Liang J, Liang B, Nie G, Ji S. A Hypogene Karst Development Pattern Controlled by the Deep-Cycle of Groundwater in the Syncline in Huanjiang, Guangxi, China. Water. 2021; 13(2):199. https://doi.org/10.3390/w13020199
Chicago/Turabian StyleDong, Hongqi, Yong Dan, Jiapeng Liang, Bin Liang, Guoquan Nie, and Shaocong Ji. 2021. "A Hypogene Karst Development Pattern Controlled by the Deep-Cycle of Groundwater in the Syncline in Huanjiang, Guangxi, China" Water 13, no. 2: 199. https://doi.org/10.3390/w13020199
Note that from the first issue of 2016, this journal uses article numbers instead of page numbers. See further details here.