Analysis of 220 Years of Floodplain Population Dynamics in the US at Different Spatial Scales


1
Department of Sustainable Development, Environmental Sciences and Engineering, KTH Royal Institute of Technology, 10046 Stockholm, Sweden
2
Department of Earth Sciences, Uppsala University, 75236 Uppsala, Sweden
3
Centre of Natural Hazards and Disaster Science (CNDS), 75236 Uppsala, Sweden
*
Author to whom correspondence should be addressed.
Water 2021, 13(2), 141; https://doi.org/10.3390/w13020141
Submission received: 18 December 2020
/
Revised: 2 January 2021
/
Accepted: 4 January 2021
/
Published: 9 January 2021
(This article belongs to the Special Issue Flood Risk in the Anthropocene)
Abstract
:In this study, we explore the long-term trends of floodplain population dynamics at different spatial scales in the contiguous United States (U.S.). We exploit different types of datasets from 1790–2010—i.e., decadal spatial distribution for the population density in the US, global floodplains dataset, large-scale data of flood occurrence and damage, and structural and nonstructural flood protection measures for the US. At the national level, we found that the population initially settled down within the floodplains and then spread across its territory over time. At the state level, we observed that flood damages and national protection measures might have contributed to a learning effect, which in turn, shaped the floodplain population dynamics over time. Finally, at the county level, other socio-economic factors such as local flood insurances, economic activities, and socio-political context may predominantly influence the dynamics. Our study shows that different influencing factors affect floodplain population dynamics at different spatial scales. These facts are crucial for a reliable development and implementation of flood risk management planning.
1. Introduction
Floodplains are considered to be the cradle of civilization. The fertile land in between the Tigris and Euphrates rivers, which allows easy access to water for commerce, navigation and livelihoods, set the basis for the proliferation of the states of Assyria, Babylon, and Sumer in this region. Since then, human development has been closely linked to the benefit offered by floodplains and to the danger of flooding [1]. Over recent decades, the introduction of flood management plans and flood risk mitigation measures has attempted to control (or reduce) urbanization and development in floodplains. However, major urban settlements around the world are still located in floodplain areas or deltas [2]; on average, every year, more than 100 million people are affected by flooding [3,4]. Furthermore, economic flood losses and flood fatalities are on the rise, due, among other factors, to the value of assets in floodplains and the enhanced frequency and magnitude of floods [1,5,6,7,8].
Flood mitigation measures are usually classified into two broad simplified categories, both aiming at reducing flood risk and limit flood consequences for floodplain population.
On the one side, structural protection measures aim at significantly reducing the probability of flooding; traditionally, levees are one of the most popular measures adopted to protect floodplain from floods of given return periods. On the other side, nonstructural measures can be adopted to reduce vulnerability and thus reduce flood risk. Increased flood awareness, increased preparedness, and the increased coping capacities of institutions and population living in floodplains have shown adaptation capacities that can mitigate flood risk [6,9,10,11].
How and if structural and nonstructural protection measures affect the urbanization of floodplains is a topic of high interest in the scientific community.
Back in 1945, White [12] introduced the concept of levee paradox, referring to the unintended consequences of structural measures in inducing a false sense of safety in the floodplain community. This might in turn reduce risk perception, leading to an increased investment in high-value assets in the floodplains and the consequent higher flood risk in case of a levee breach [13,14,15,16,17].
The negative impact of an extreme event tends to decrease if a similar event occurs within short time [9,10,11]. This is illustrated as an adaptation effect. However, Di Baldassarre et al. [18] suggest that the adaptation effect increases flood exposure through human migration to riparian areas. Recently, Ferdous et al. [16] showed that for a case study in Bangladesh, the adaptation effect, often indicated as a soft effective flood protection measure, comes with high costs to the society and might prevent socio-economic growth in the floodplain areas, especially in low-income countries [19].
The dynamics of floodplain population in different countries have been investigated to show societal response to flooding and to mitigation measures [15,20,21].
Rossi et al. [22] made a first large-scale assessment of the impact of natural hazards on population developments in the US in between 1960 and 1970, concluding that there was no discernible effect of floods, tornadoes or hurricanes on the changes in population or housing stocks experienced by counties. Schultz and Elliott [23], using a similar approach, found a correlation between population growth and property damage caused by natural hazards.
Collenteur et al. [15] evaluated the impacts of flood events on the spatial distribution of population and consequent learning effect at the contiguous United States (US) and at local scale, after the 1993 Mississippi flood. The large-scale study showed a positive statistical relationship between flood damage and population growth which is not described as causal due to lack of spatial data in this study. The local analysis revealed the presence of a learning effect at institutional and community levels right after the flood.
Xu et al. [20] analyzed spatiotemporal patterns of urban expansion in China from 1992 to 2015 using nighttime light data, vegetation index data, and land surface temperature data. The result suggested, among different patterns of urban expansion, that edge expansion of urban areas is the main cause of cropland loss in China.
Mård et al. [21] also used satellite nighttime light data to perform a global analysis to discern the relationship between long-term changes in human proximity to rivers and intense flood events. They found that, at a global scale, from 1992 to 2013, a decrease in human proximity to rivers is observed after flood occurrences, mainly for societies who do not strongly rely on structural protection measures.
Several studies showed an influence of occurrence of flood events on socio-economic conditions, financial situation (such as GDP), and population dynamics [7,24,25].
Winsemius et al. [24] integrated existing global flood risk projections, socio-economic development dynamics, and climate change and showed that global economic damages increased faster than global financial wealth. Additionally, Willner et al. [25] showed the relation between river floods and loss in GDP on a global scale.
Alfieri et al. [7] found that the use of flood protection only reduces the frequency of small floods but exposes society to catastrophic floods, which require long recovery processes. Therefore, adaptation efforts should favor measures targeted at reducing the impacts of floods, rather than trying to avoid them.
As showed by Collenteur et al. [15], Mård et al. [21], and Smith et al. [26], a large-scale analysis may not help in representing the causal relationship between flood occurrences and floodplain population dynamics, due to lack of higher spatial and temporal-scale data and the complexity of involved socio-economic processes. However, local case studies provide promising results for understanding the underlying dynamics.
With this study, we aim at contributing to understanding links between long-term changes in floodplain population dynamics, occurrence of flood events, and implementation of structural and nonstructural measures. To this end, we collected data spanning 220 years (from 1790 to 2010) and performed our analysis at three different scales (over the contiguous US), to assess the importance of the domain scale:
- (i)
- national level, in which long-term changes in floodplain population growth rate and proportion of floodplain population were evaluated for the contiguous US;
- (ii)
- state level, in which the relationship between floodplain population dynamics indicators and flood occurrence, flood damage, structural and nonstructural flood protection measures were evaluated for the state of Arkansas;
- (iii)
- county level, in which the relationships identified in the state-level analysis were further investigated for Sebastian county in Arkansas.
In particular, we identified two research questions for unravelling the relationship of dynamics and flood-related variables:
- (1)
- how do floodplain population dynamics change when the analysis is downscaled from national to state to county levels in the US, from 1790 to 2010?
- (2)
- What are the relationships between floodplain population dynamics and flood events, related damages, and flood protection measures in the selected study area?
2. Case Study and Data
We first focused our study on the contiguous US and later further narrowed down our analyses by selecting one state (Arkansas) and one county (St. Sebastian) within that state (Figure 1). The reason that led to selecting US is twofold. Firstly, flood is one of the major natural hazards in the US. About 12% of the total land area in the US is made up of 100-year floodplains [27] (Figure 1), and almost 10% of the total population lives in the 100- and 500-year combined floodplains [28,29]. Additionally, the annual average flood damage in the US increased from USD 5.6 billion in the 1990s to about USD 10 billion in the 2000s. Thus, understanding floodplain population dynamics will provide important information for disaster loss reduction and for future risk management strategies for the US. Secondly, data analysis is of pivotal importance to disentangling the relationship between flood occurrence and population dynamics.
We used high-resolution population raster data (1 km resolution) from 1790 to 2010 [30] (decadal information), thus a total of 23 raster images was analyzed in ArcMap 10.7.2 (ESRI, Redlands, California, USA). Floodplain areas of US were identified from the global high-resolution raster data GFPLAIN250m proposed by Nardi et al. [31]. This dataset was compiled using a hydrogeomorphic approach in which floodplains are identified directly from the topography as unique morphological entities, regardless of the presence or lack of flood protection structures [31]. For this reason, the implementation of flood mitigation measures does not affect floodplain delineation and thus the analysis of our study.
Data of flood events before 1950 were collected from various historical records which were described as major or significant flood events. After 1950, flood events were selected from the Federal Emergency Management Agency (FEMA) major disaster declaration records; flood damages and flood protection measures were available, since 1790, for the US and freely accessible from the United States Geological Survey (USAGS), National Oceanic and Atmospheric Administration (NOAA), United States Census Bureau, Spatial Hazard Events and Losses Database for the United States (SHELDUSA,) and different research articles and official documents. More details about the datasets implemented in this study, their spatial and temporal discretization, and sources are described in Table 1.
The state of Arkansas and the county of San Sebastian were selected after discussing the outcomes of the national-wide analysis (see Section 4.2 and Section 4.3 for details).
3. Methods
We evaluated floodplain population dynamics using different spatial data and methods to explore the human–flood dynamics in the US. The national-level analysis aimed at estimating the floodplain population dynamics by assessing two main indicators—i.e., the floodplain population growth rate and proportion of population living in the floodplains. On the other hand, both state- and county-level analyses focused on the spatio-temporal relationship of floodplain population dynamics with flood events, damage, and flood interventions.
3.1. National-Level Analysis
At the national-level, floodplain population dynamics were analyzed by means of two spatial variables: floodplain population growth rate and proportion of floodplain population.
Floodplain population growth rate (GFP), from 1790 to 2010, was calculated using the growth rate formula (Equation (1)):
where t is the specific decade and P is the population in the floodplain in that specific decade.
On the other hand, the proportion of floodplain population (PFP) from 1790 to 2010 was calculated as the ratio between the floodplain population and the total state population. We then filtered outliers’ values of distributed GFP and PFP generated from numerical gaps in the datasets to avoid errors and shift to centroid locations. Finally, the central tendency for GFP was calculated using median centroid and temporal change of PFP for each decade [44].
3.2. State-Level Analysis
A representative state was selected for this analysis based on the location of the median centroid for GFP and PFP in each decade. In particular, we selected the state that showed the highest proportion of floodplain population values and lower variation over the analyzed period.
For the selected state, we first evaluated the spatio-temporal relations of floodplain population dynamics based on GFP and PFP. In particular, for each county in the selected state, the PFP was calculated using the same procedure described in Section 3.1.
We then collected and analyzed annual time-series of historical flood events records, associated damage, construction of structural measures (levees), introduction of flood insurance-related measures, indicators of floodplain population dynamics (i.e., GFP and PFP), and total state population in the floodplains (Supplementary Materials Table S3). Table 1 shows all sources of flood-related variables used in this analysis. For occurrence of flood events, structural and nonstructural flood protection measures, records were aggregated as a dichotomous variable (i.e., “0” and “1”) for each year. Damage data were used as the monetary value in USD, and yearly value is the sum of the total damage in case of multiple flood events occurring in any year. Qualitative analyses were performed to investigate the temporal trends between floodplain population dynamics and flood-related variables based on the aforementioned collected flood-related data (see Section 2).
3.3. County-Level Analysis
Based on the previously selected US state, the county with highest variance of the PFP value was selected for county-level evaluation of floodplain population dynamics. We followed the same method as in the state-level analysis for the qualitative assessment of the interplay between floodplain population dynamics and flood-related variables previously introduced (i.e., flood events records, associated damage, levee construction, and flood insurance-related measures reported in the Supplementary Materials Table S4).
Finally, a comparison between floodplain population dynamics indicators at national, state, and county levels was carried out. The standard deviations of the floodplain population dynamics indicators (GFP and PFP) were estimated for each spatial scale and compared to the changes found in the literature.
4. Results and Discussion
4.1. National-Level Analysis
4.1.1. Floodplain Population Growth Rate
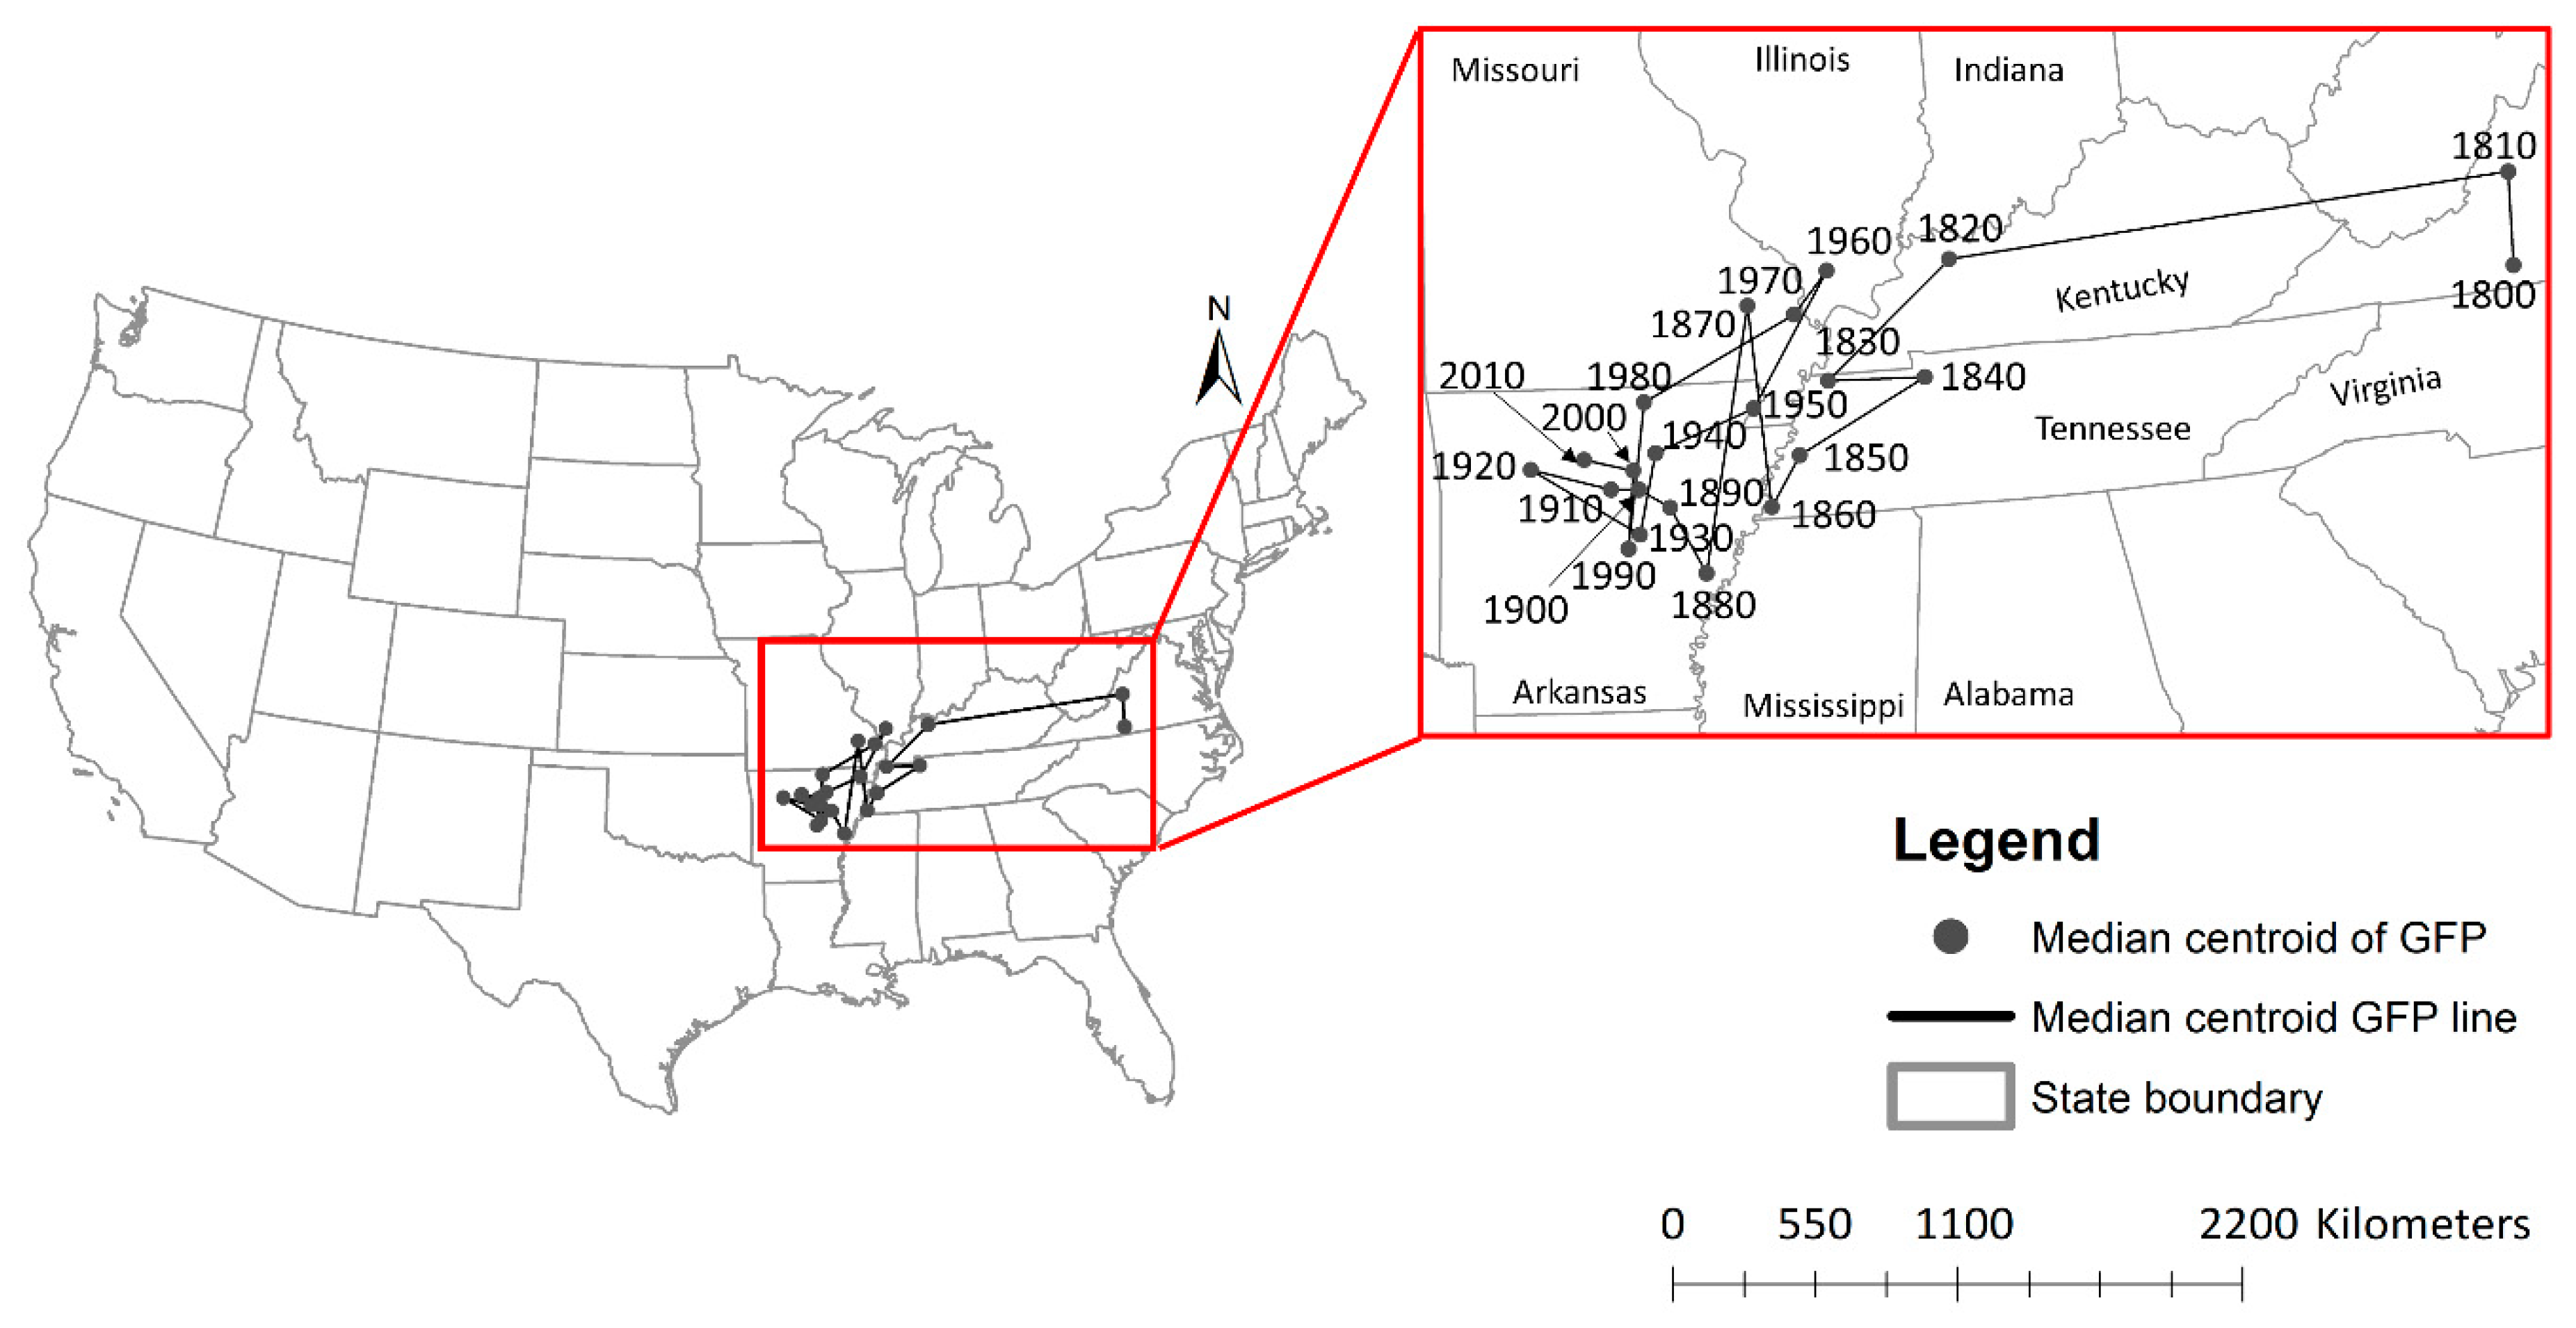
First, we calculated the total floodplain population for each state (reported in the Supplementary materials Table S5) and we then estimated the temporal changes in the GFP (Supplementary materials Table S6). We found that the GFP shifted largely east to west and slightly north to south from 1790 to 2010 (Figure 2). As expected, at the beginning of 1800 the centroid of the GFP was located in the east coast, around the state of Virginia, as it is there where the first colonies were established. Over the years, the GFP moved significantly towards west as outcome of the migration process also driven by the increased access to land and water resources [44]. Since then, the centroid of the distributed GFP showed small variations and it mostly remained around the state of Arkansas (Figure 2). These small shifts show a general tendency of the floodplain population to homogenously spread within the US territory and keep the centroid value around the state of Arkansas and in the lower Mississippi river basin in the last 110 years. While these analyses provide valuable information about the temporal variation of the GFP centroid, they do not show the spatial variation of GFP. For this reason, we assessed the spatial variation of PFP over time in the US.
4.1.2. Spatio-Temporal Pattern of Growth Rate of Floodplain Population
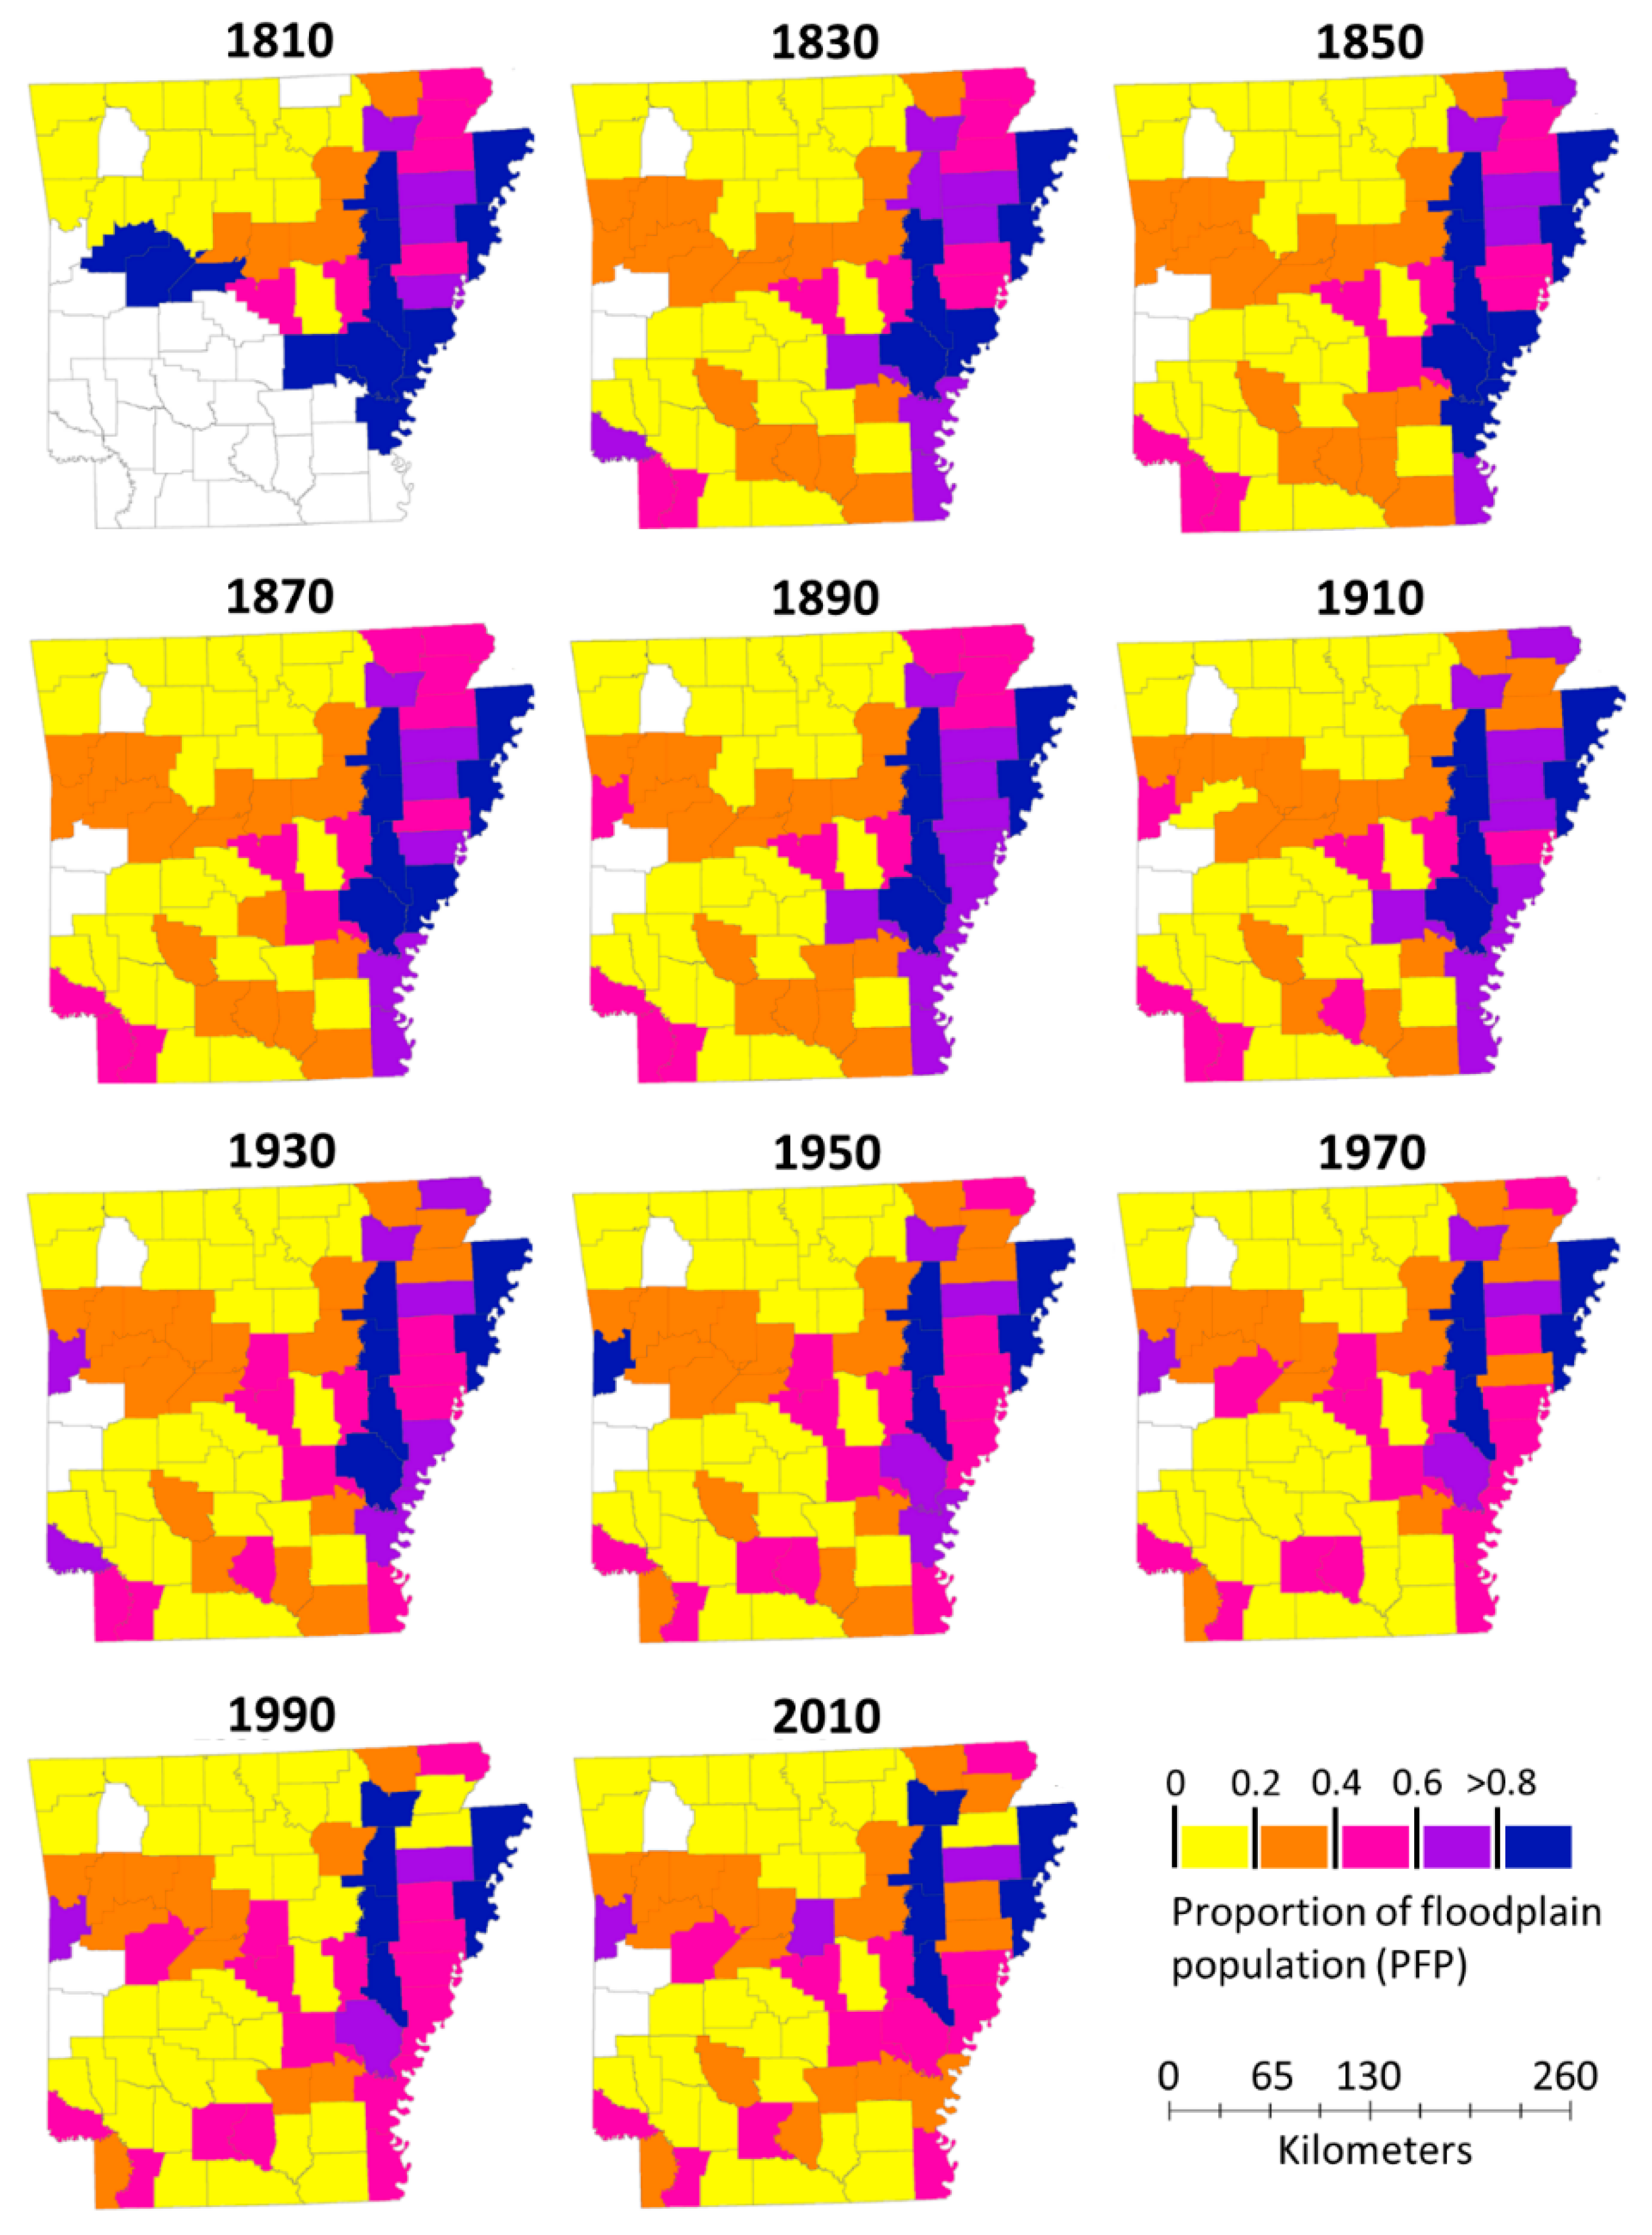
The results of Figure 3 show the spatio-temporal distribution of PFP (we show here only results every two decades, more results are reported in Table S7 of the Supplementary Materials). High values indicate that more people live within floodplains than outside. The spatial analysis shows high values of PFP when the population starts settling down in a particular state, which then tends to reduce in later decades when populating the same state (Figure 3). For example, when people began to settle in 1790, more than 80% of the population of Ohio, Indiana, and Illinois were living in the floodplains. The floodplain population proportion dropped below 40% for Ohio and Indiana later in 1800 and for Indiana in 1830. The ratio remains below 40% for these states in the rest of the decades up to 2010. A similar trend in PFP was observed in Arkansas, Florida, Iowa, Kansas, Louisiana, Mississippi, Nebraska, Ohio, South Dakota, and Washington. In these states, the PFP was more than 80% when the population started settling down and then dropped below 40% in successive decades. However, in Louisiana the average PFP remained 66% approximately (Figure 3). Other states showed similar initial high PFP values but a decreasing trend in later decades. Trend analyses of the PFP ratio for each state are included in the Supplementary Materials. From the results of Figure 3 it can be also noted that the variation of PFP over the years is higher in the states within the Mississippi river basin.
The temporal fluctuations of the average PFP values for the contiguous US is shown in Figure 4, where one can see that it increased from 1790 to 1880, remained stable for the next 60 years up to 1950, and then decreased slowly reaching a value of about 14% in 2010. Figure 4 shows also an increasing trend of the population moving outside the floodplains with time, which suggests that floodplain population dynamics may be influenced by flood risk perception that might have changed as structural and nonstructural measures were implemented. To further investigate this assumption, we decided to narrow down the analysis at finer spatial resolution—a state-level analysis is reported in the next section.
4.2. State-Level Analysis
Based on its downstream position within the Mississippi basin and its high values of GFP and PFP, we selected the state of Arkansans for the evaluation of the spatio-temporal relationship between floodplain population dynamics and flood occurrence, flood damage, levee construction and flood insurances. The total floodplain area of Arkansans is about 32% of the total state area [31,32,45]. Urbanization started from 1820 with all the population settled down in the floodplains. After that, the PFP decreased to about 0.31 in 1850, which gradually increased to 0.39 in 1950 and then continued to decline until 2010 to 0.28 (Figure 5 and Figure 6a). Arkansas is prone to flooding due not only to the Mississippi river, but also to the Arkansas, Red, White, Black, Ouachita and Saint Francis rivers (Figure 1).
In Arkansas, the spatio-temporal changes of the PFP varied differently among counties. In some counties, the floodplain population remained stable even when exposed to frequent flooding, while in other counties the PFP changed, following the same trend found for the whole US. The reason for such deviations can be related to the high agricultural production of the state that mainly depends on the floodplains richness [33]. Arkansans was frequently flooded, and these flood events were followed by the implementation of structural flood protection measures, which were then frequently monitored, maintained, and improved since 1849 as response to floods [46]. This might be partly explained by an institutional learning effect, in agreement with the findings of Collenture et al. [15] after the 1993 flood event in St.Louis, Missouri.
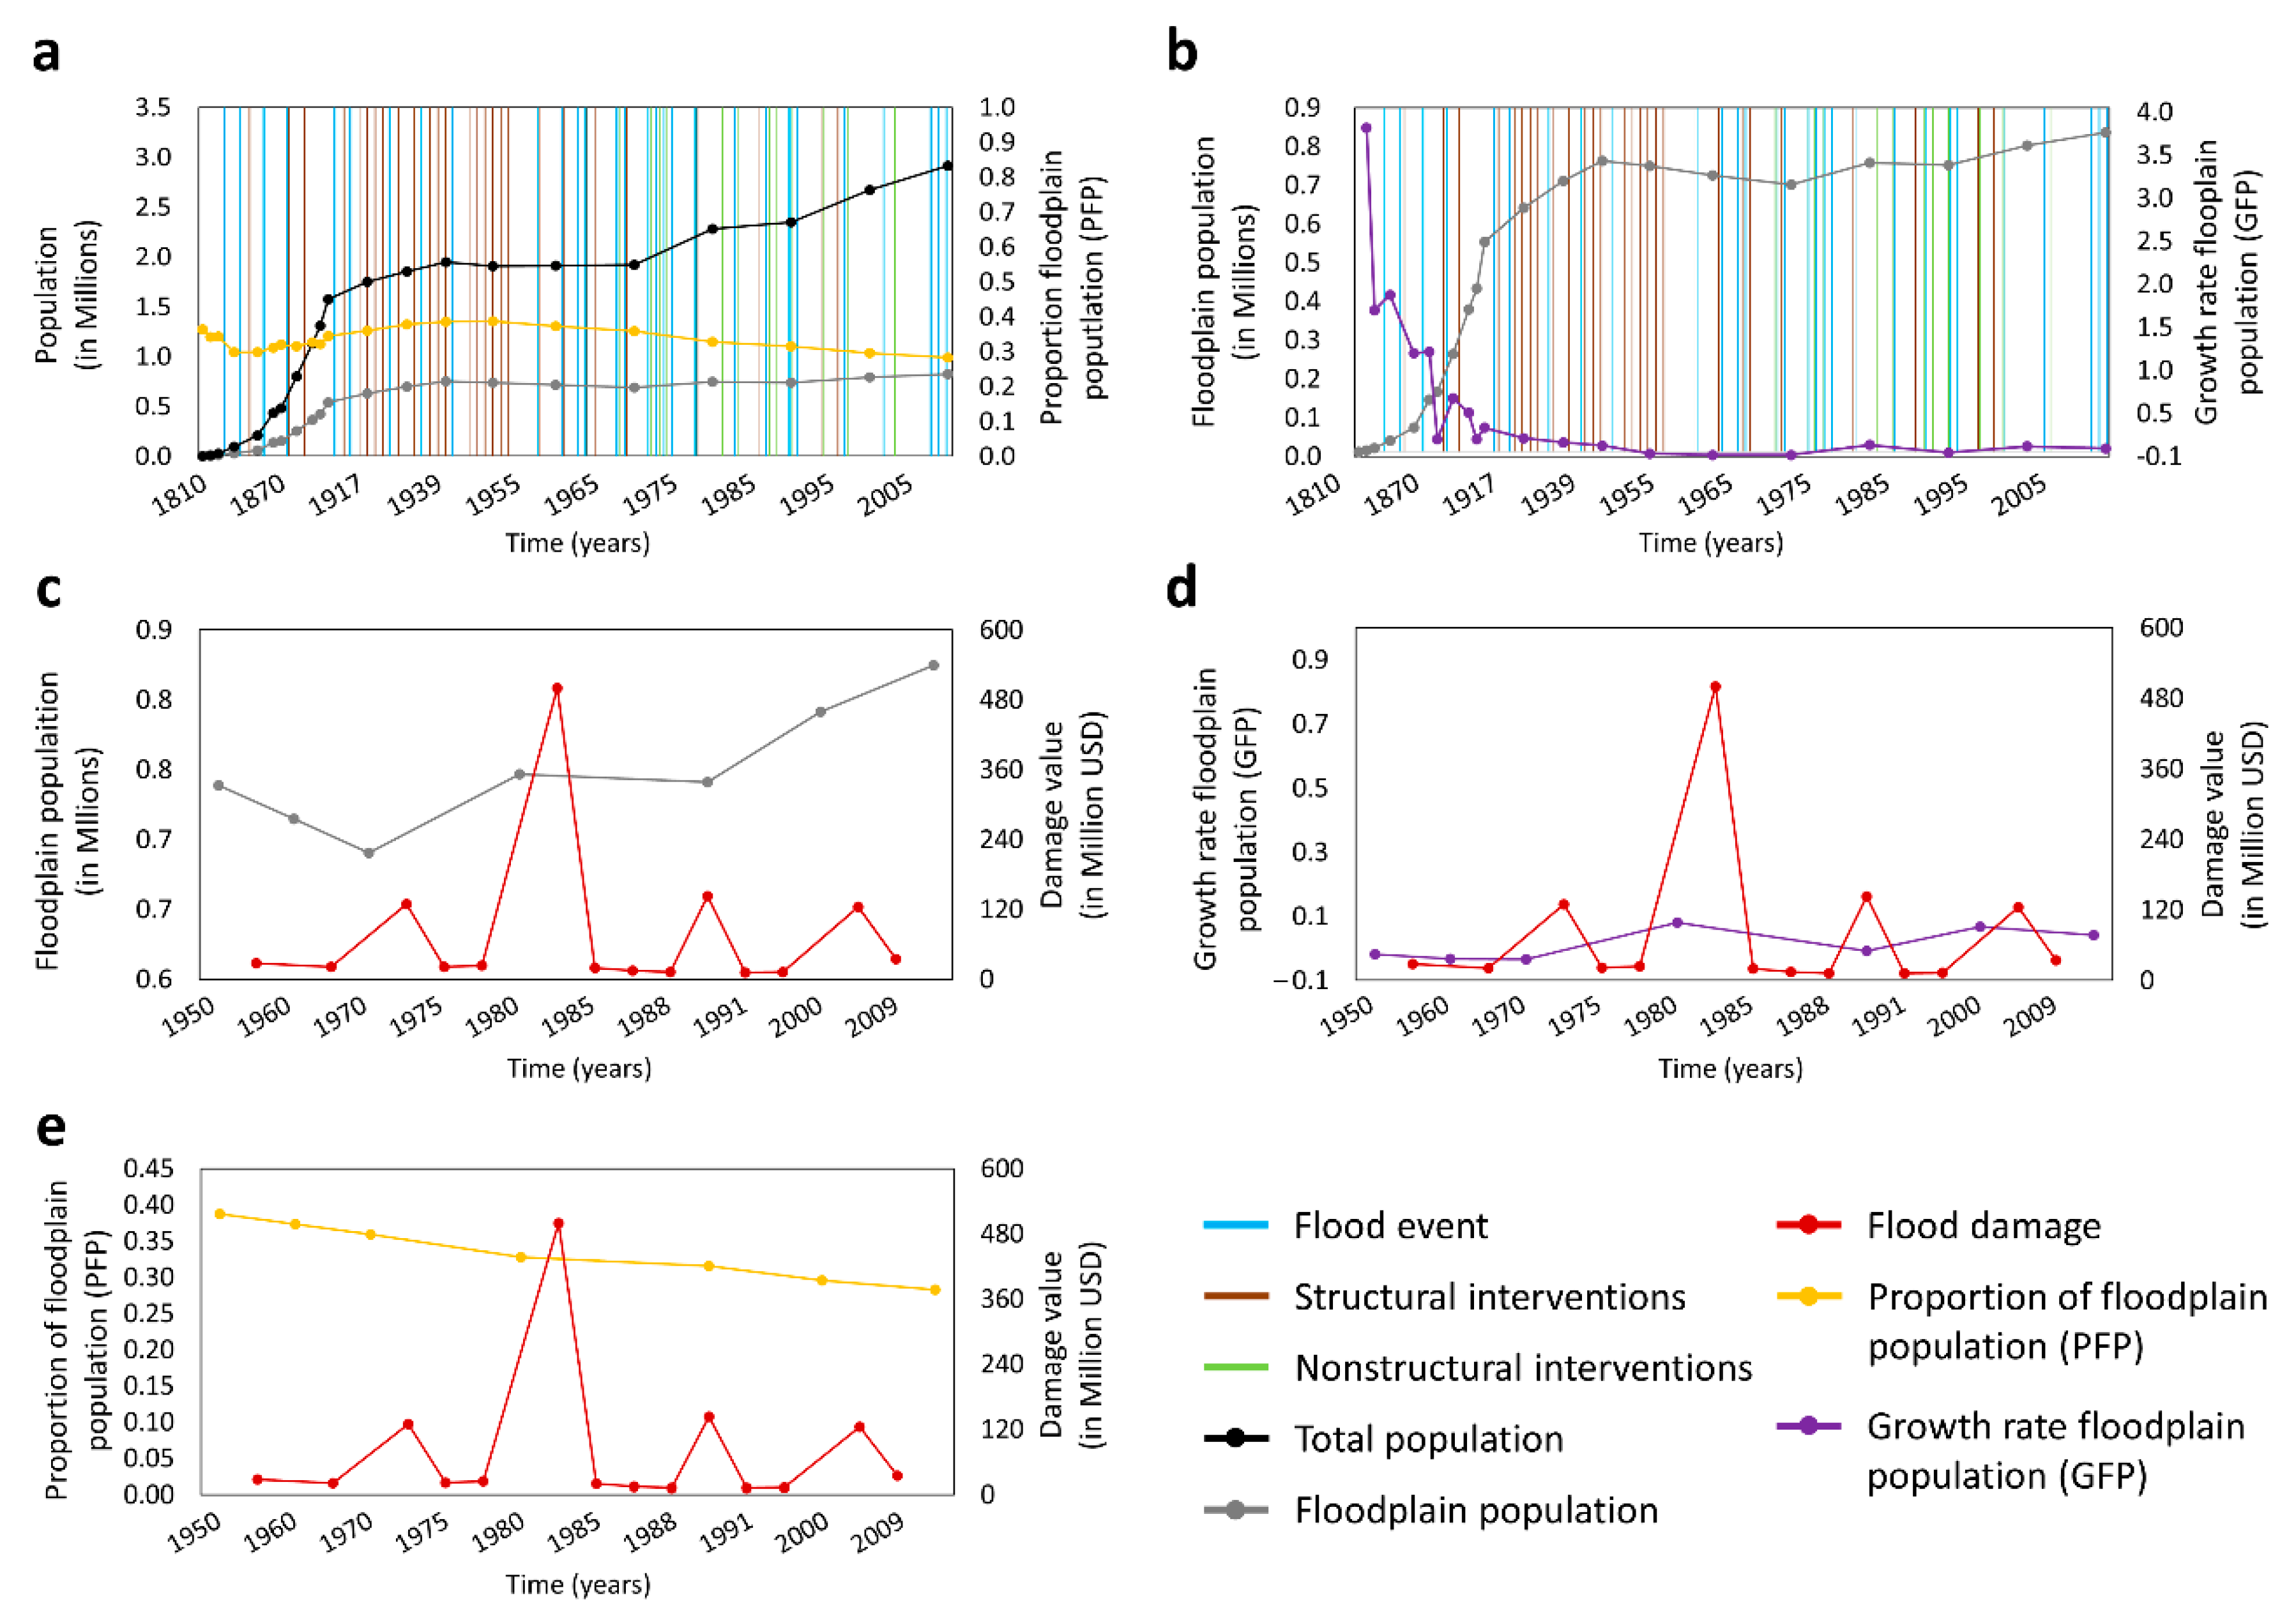
The occurrence of several recorded flood events since 1950, some of which had intense magnitudes, i.e., in 1983 and 1993 [37,47], have triggered a response from local authorities who have implemented both structural and nonstructural measures. Looking at our results, the population seems to be risk-adverse, and continued to settle outside the floodplains after 1950. The introduction of the flood insurance act in 1968 and extensive propaganda to encourage people to apply to the flood insurance program from 1970 to 1980 [37] might be associated with an increase in total floodplain population during these decades. A decrease in floodplain population in 1990 can be associated with the large flood event that occurred in 1983 which caused damages amounting to USD 500 million [47]. It is not clear if the economic damages after the 1983 flood event or the modifications of flood insurance premium from 1981 to 1987 influenced the floodplain population in 1990. However, the presence of the learning effect is visible in the reduced floodplain population in 1990. In 1993, another flood event caused significant damage but far less than the flood in 1983. An immediate institutional response was observed through increasing the cost of compliance to compensate for flood damages and renovation of 366 levees in the area [38]. These interventions seem to have had a positive influence on the floodplain population, which increased again in 2000 and 2010, similarly to the findings of Mard et al. [21]. Additionally, other studies showed a significant variation in social memory in different geo-social, economic, and political contexts [15,47]. However, floodplain populations can be affected by many other socio-economic factors in addition to renovated levee systems or introduction of increased costs of compliance. In fact, as previously described, we observed that, despite the levee construction, the floodplain population continued to fall from 1940 to 1970 and increased again in 1980 after the introduction of the flood insurance program. Therefore, we cannot draw a general conclusion of the relationship between floodplain population dynamics, flood severity, and flood adaptation measures at the state level.
Below we present details of the analysis performed on the state of Arkansas.
4.2.1. Spatio-Temporal Pattern of Floodplain Population Ratio
The spatio-temporal pattern of PFP within the counties of Arkansans is reported in Figure 5 (every two decades). In 1810, more than 90% of the population settled down in 12 of the 46 counties, all located in the north and north-east side of the Arkansas River floodplains. (Figure 5). In contrast to what we observed at the national level, overall, PFP was not significantly reduced over the decades, but it maintained stable values around 0.9 (Figure 5).
When observing the 22 counties located in the northern and north-eastern part of Arkansans outside of the floodplains, we can see a large variability range of PFP. In particular, for nine counties the PFP differed significantly, changing from more than 0.9 in 1810 to less than 0.2 in 2010 with more than 1% variance (see Table S2 in the Supplementary Materials). For the remaining 13 counties, the variance of floodplain population proportion was less than 0.01 (see Table S2 in the Supplementary Materials) and the proportion of floodplain population was less than 0.1 from 1810 to 2010 (Figure 5).
The 27 counties of the southern and south-western part of the state started getting populated after 1830. Again, a major part of the population settled in the floodplains of Mississipi, Ouachita, and Red rivers. Only 4 of these 27 counties have considerable floodplain areas. The PFP varied from less than 0.6 in 1820 to less than 0.4 in 2010 in these counties. In the remaining counties, where the floodplain area is limited, no noticeable changes in PFP values were observed.
4.2.2. Temporal Analysis between Floodplain Population Dynamics and Flooding Adaptation Measures
In this analysis, we looked at the time series of flood events, related flood damages, implementation of structural (levee system construction) and nonstructural measures (flood insurance act), and floodplain and state populations in Arkansas. Figure 6 summarizes the collected data. As can be observed, the proportion of floodplain population was 0.36 in 1810 which reduced to 0.3 in the following 30 years. The GFP changed rapidly from 377% in 1810 to 7% in 1940. Additionally, a first structural intervention was implemented after the 1844 flood event and from 1840 to 1950 the proportion of floodplain population increased to 0.39 at a slower pace. From 1950 onwards, the proportion of the floodplain population gradually decreased down to 0.28.
Between this time span, records of major flood events were found in 1844, 1858, 1874, 1912, 1916, 1927, and in 1937 (vertical blue lines in Figure 6a,b). As a consequence, structural protection measures were constructed and flood act policies implemented at different times (green and brown vertical lines in Figure 6a,b), such as Swamp Act 1849, “Levee only” policy by Mississippi river commission in 1882, Federal flood control Act in 1917, and Flood control Act (Mississippi river and its tributaries) in 1928. Such records indicate an active institutional response to flood events.
Records of flood damage are available from 1950 onwards and have been added to the analysis in Figure 6c–e. One can see that from 1950 to 2000 a series of multiple flood events occurred with an average recurring time of about 2–5 years. Levees were constructed between 1951 and 1996 to reduce flood damages. In addition, flood insurances were also issued from 1968, followed by improved flood policies from 1972 up to 2003 [38]. During these decades, from 1950 to 1970, a negative GFP can be observed in Figure 6d. Significant property damages occurred during the 1973 flood event, with economic losses of about USD 130 million. In 1983, another severe flood event caused higher economic damage of about USD 500 million, which is the highest ever recorded due to flood since 1955. Between 1990 and 2000, the flood damage showed a relatively lower value than previous floods and the growth rate slightly improved to 8% in 1980 which again decreased to (−1%) in 1990. After 1990, the growth rate increased to 7% in 2000 with the floodplain population increasing in 2000. Data in Figure 6 show active dynamics of population changes, occurrence of flooding, and implementation of measures.
4.3. County-Level Analysis
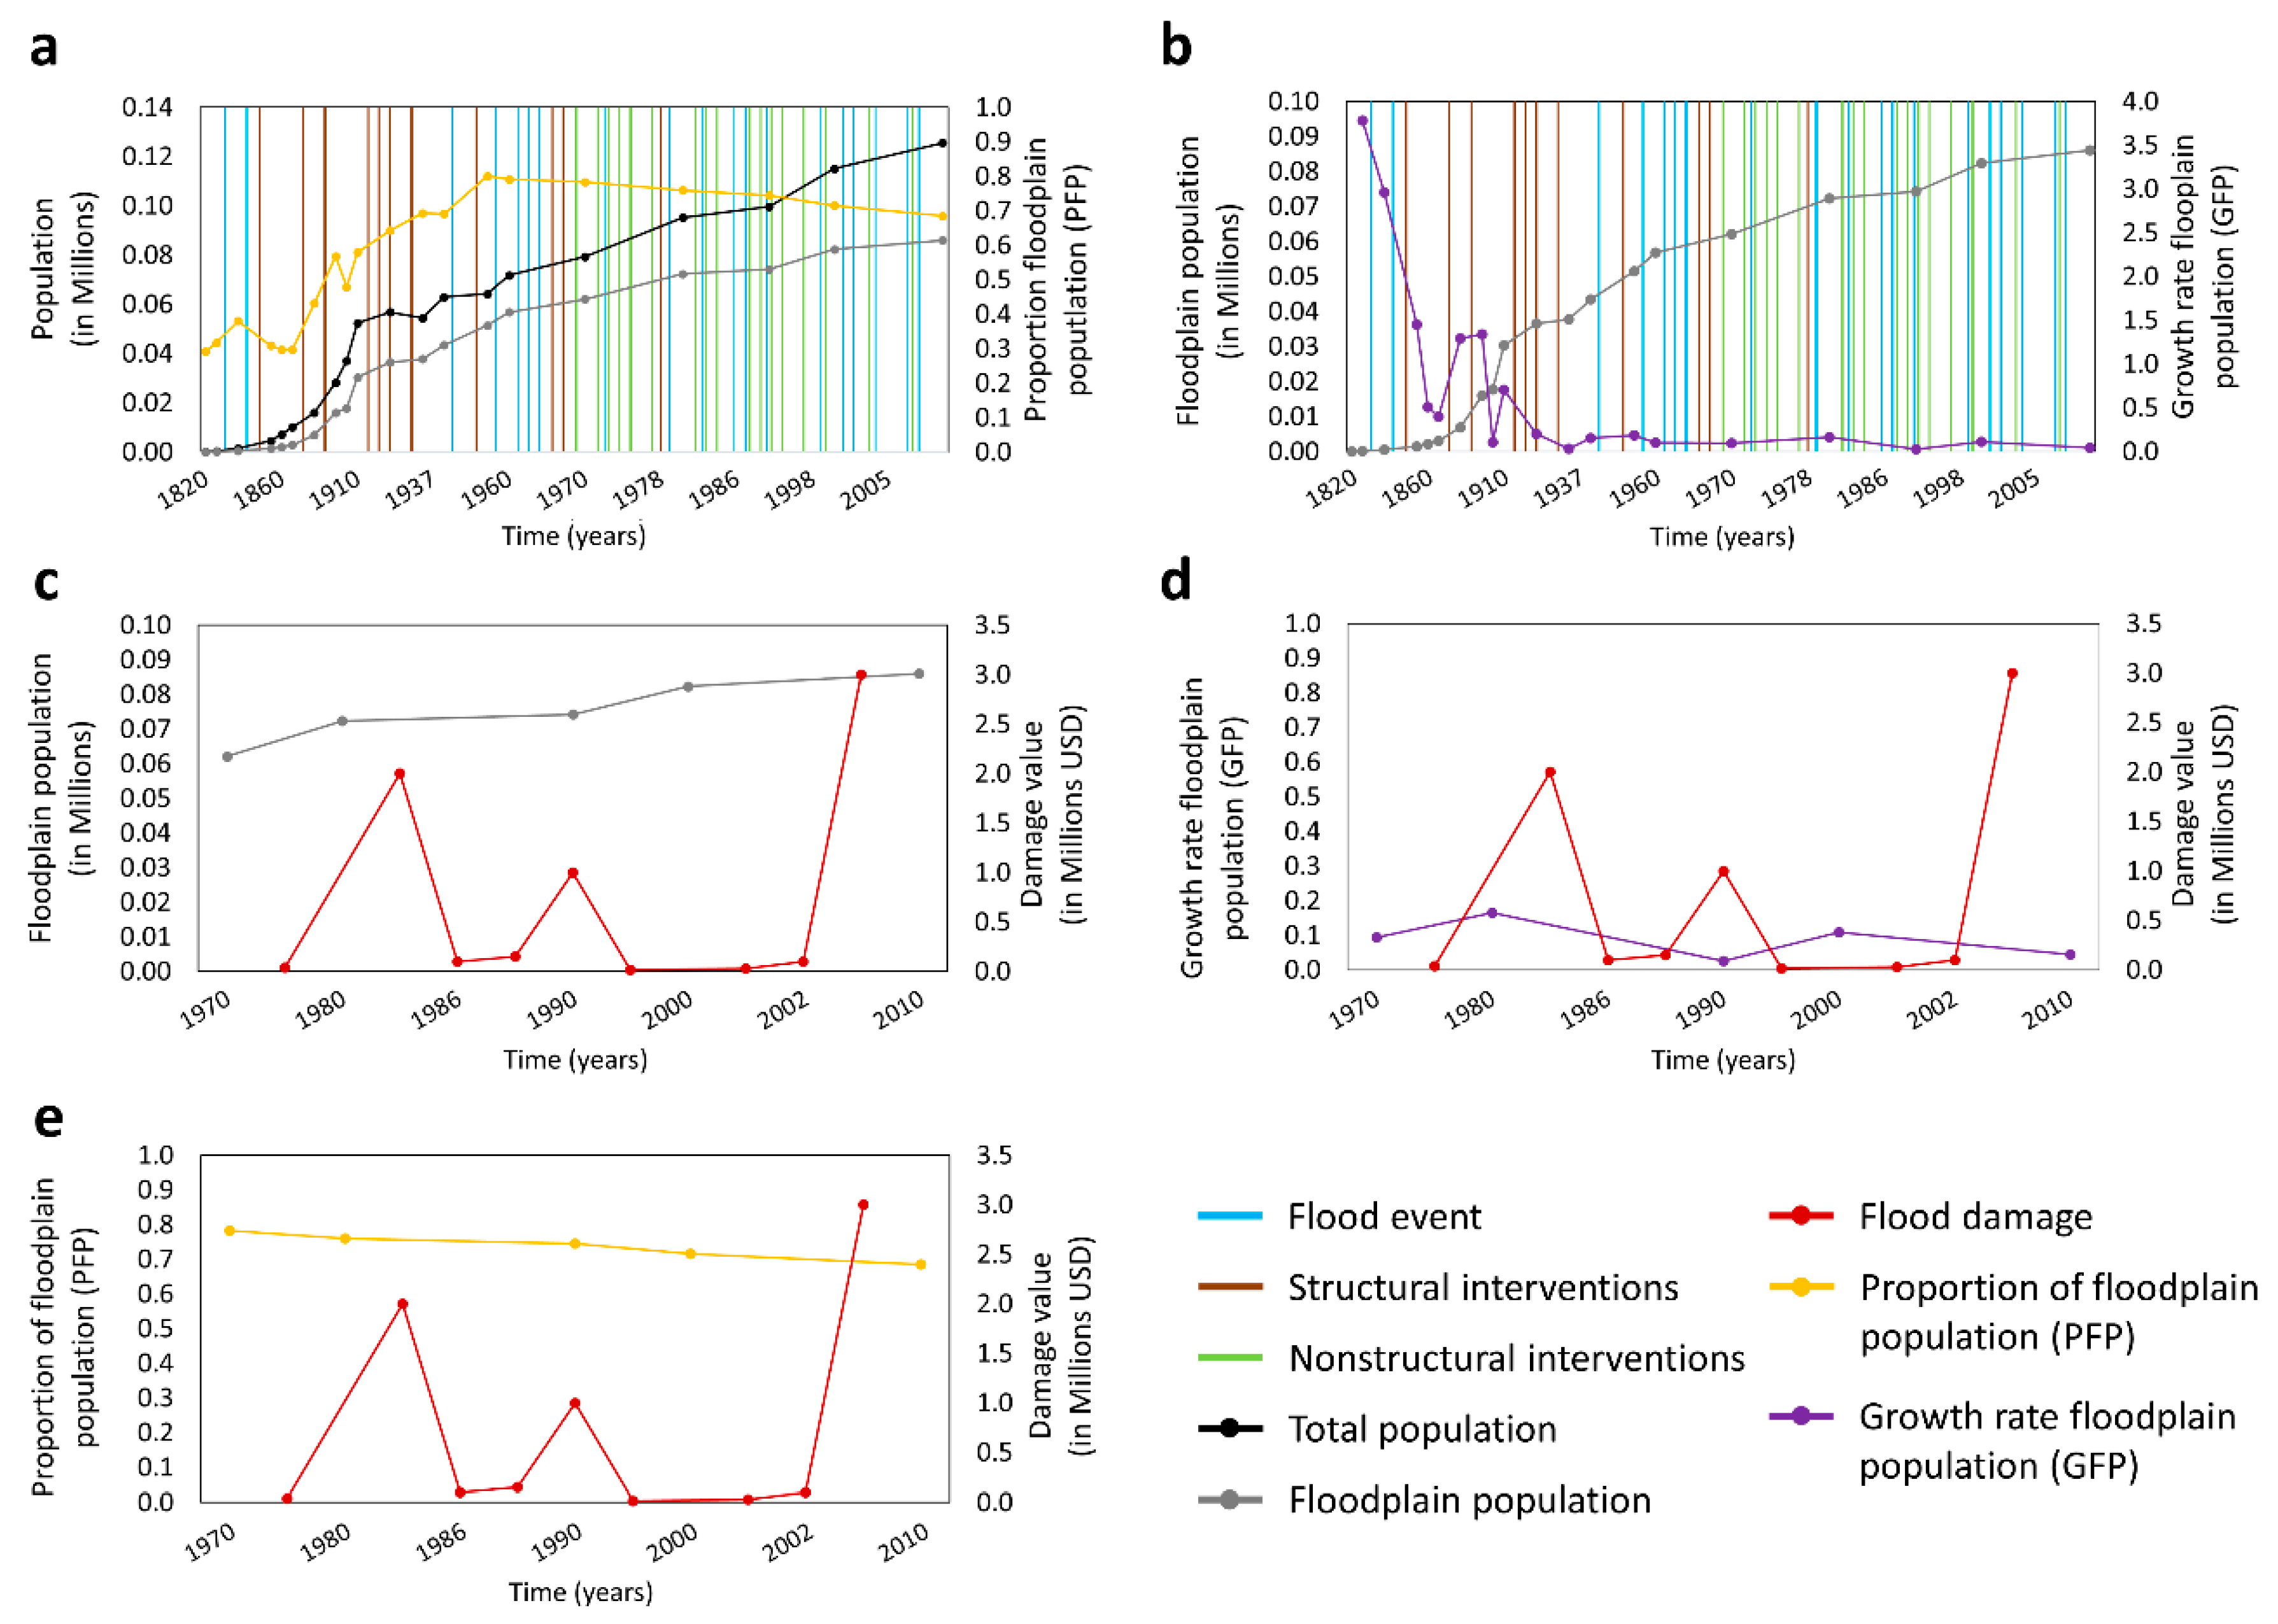
For this analysis, we selected Sebastian county because, as observed from the spatio-temporal changes in PFP of the counties in the state of Arkansas, Sebastian county showed the maximum variances value (see Table S2 in the Supplementary Materials). Sebastian county is located in the south-west side of Arkansas River and about 26% of the total area is within floodplains (Figure 1). The total floodplain population of Sebastian county increased at a consistent pace without sudden rises or drops, despite the occurrence of different flood events and introduction of flood protection measures. The PFP continued to rise until 1950 and then gradually fall until 2010 (see Table S8 in the Supplementary Materials). The learning effect that can underlie population dynamics at the state level in Arkansas is not visible in Sebastian county, where more local factors in addition to flood severity and adaptation measures might drive the floodplain population of the county.
People started to settle down in the Sebastian floodplains in 1820. Unlike the spatio-temporal trend described above for the state of Arkansas, the proportion of floodplain population varied significantly in Sebastian county. From 1820 to 1840, the PFP increased, but it decreased in the following 30 years. After 1880, the floodplain population increased in Sebastian and it reached a PFP of 0.8 in 1950. After that, we observed gradual reduction in the PFP up to 0.69 in 2010 (Figure 7a). Although a major flood occurred 1833, PFP increased in 1840 and then decreased in the period 1850–1870 despite several structural flood protection measures being implemented. A similar dynamic was found after the flood event of 1944, in which the total floodplain population increased to more than outside of the floodplain from 1820 to 1950. Despite structural flood protection measures being taken in 1965, 1968, and 1978 and nonstructural flood protection measures being implemented at different times between 1968 and 2003, the floodplain population decreased. The GFP also shows a similar pattern as found in Arkansas and, in 1980, the growth rate increased slightly to 16% which later reduced to 4% with a few fluctuations. However, the floodplain population growth rate was not negative for 210 years (Figure 7b).
If one looks at flood damages, one can see that fewer damages were produced by flood events in 1986 and 1987 than in 1983. During those flood events, the total floodplain population remained almost constant, whereas the PFP and GFP reduced. From 1990 to 2000, few flood damages were observed, and total floodplain population increased, while PFP reduced. After flood damage in 2004, the total floodplain population increased slightly but the GFP and PFP continued to further reduce (Figure 7c–e).
4.4. Comparison between Spatial Scales
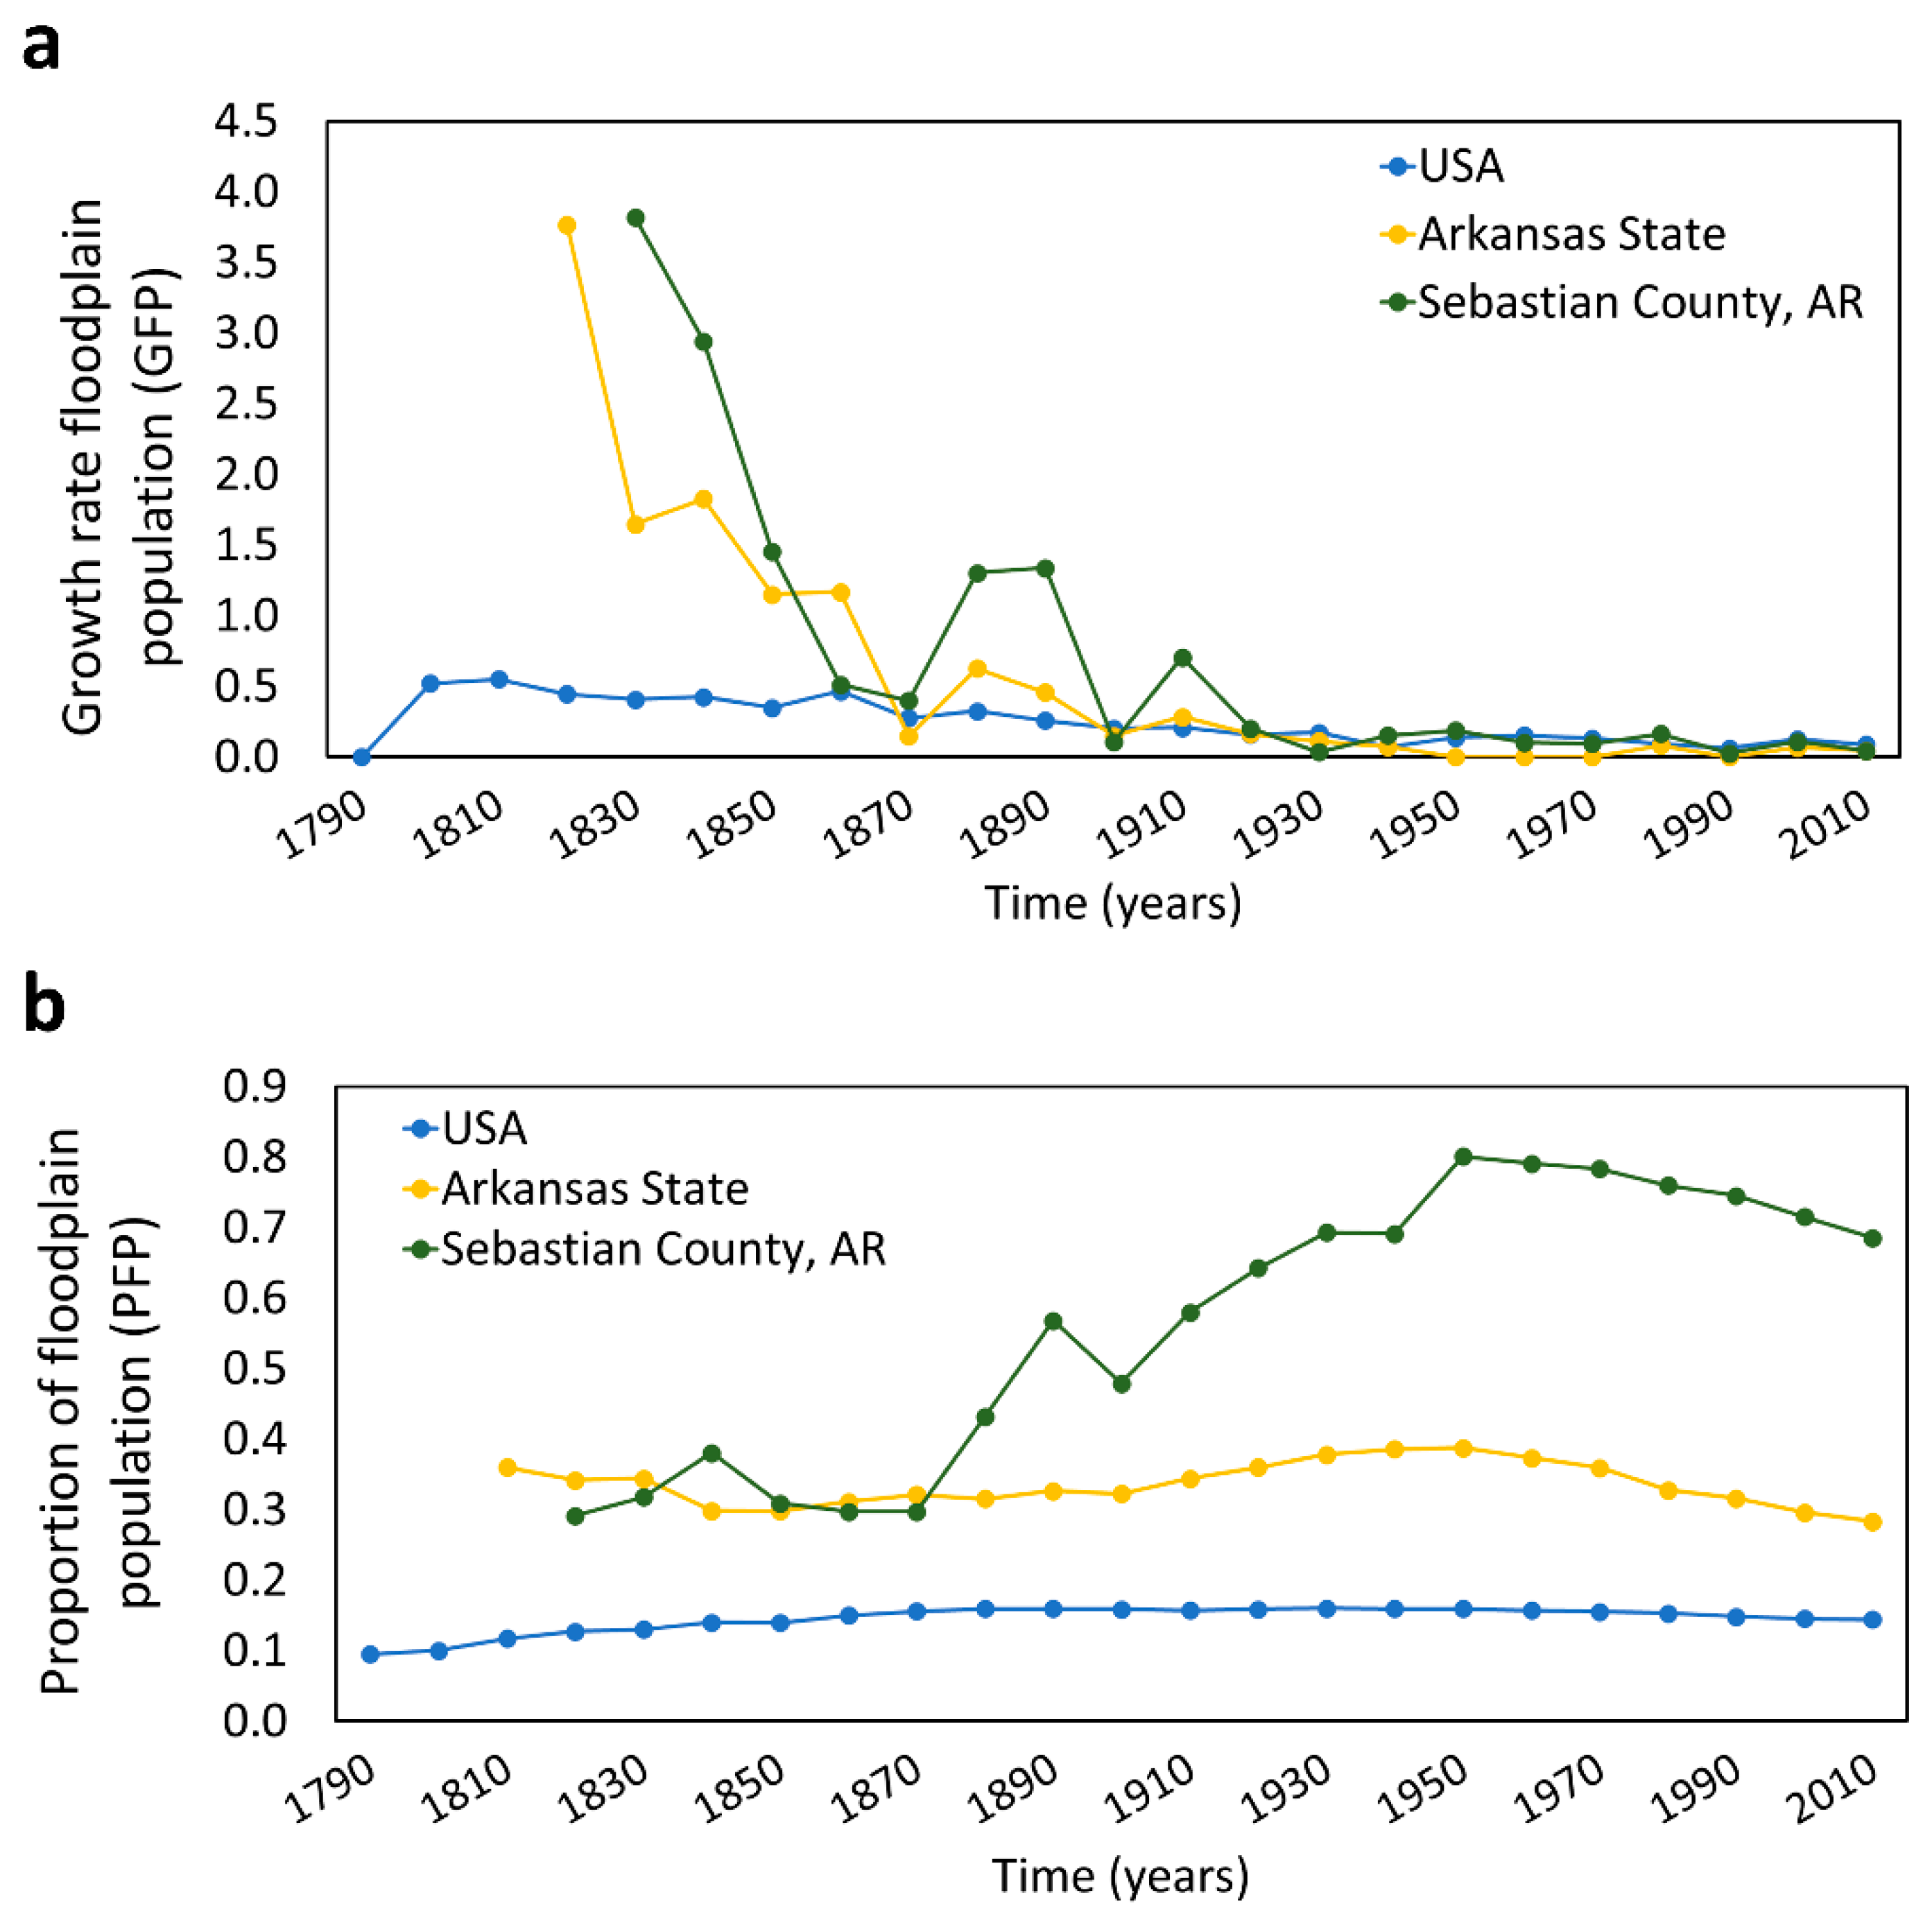
The GFP and PFP dynamics in the US, in the state of Arkansas, and in Sebastian county were compared (Figure 8) to investigate changes from large to local scales. For the US, the PFP was about 0.09 in 1790 and increased to 0.16 in 1870. From 1870 to 1970, the ratio remained stable, while after 1970 this ratio slightly declined and reached 0.14 in 2010. The standard deviation of PFP for the whole country is equal to 0.02 (see Table S1 in the Supplementary Materials).
In Arkansas, PFP varied more than it did at country level. The proportion of floodplain population was 0.36 in 1820 and reduced to 0.3 in 1850. From 1860, the PFP grew from 0.31 to 0.39 until 1950. After 1950, the ratio reduced again becoming 0.28 in 2010. The standard deviation is 0.03, which is slightly higher than one observed at the national level (see Table S2 in the Supplementary Materials).
In Sebastian, the variation of PFP floodplain population ratio was very significant, as reported in Figure 8. The PFP fluctuated from 0.29 in 1820, to 0.57 in 1890, and then reduced to 0.48 in 1900.
It can be observed that GFP for the state and county scales reduced from 4.0 in 1830 and reached a value of about 0.5 in 1870. After that, stable and slightly declining values were observed up to 2010, while PFP increased from 1870. Similarly to the state of Arkansans, in 1950 the PFP increased to 0.8 to then decreased again to 0.69 in 2010. Increasing standard deviation values are found from the national level to county level (0.19) (see Tables S1 and S2 in the Supplementary Materials).
These results show the need for more local analysis, as performed here for the state of Arkansas and Sebastian county, to be able to formulate more generalized patterns in factors concurring with regard to shaping floodplain population dynamics.
5. Conclusions
In this study, we investigated floodplain population dynamics in the US at three different spatial scales over a time period of 220 years. First, the floodplain population growth rate and proportion of floodplain population were evaluated in the contiguous US from 1790 to 2010. Then, based on the long-term central tendency of the floodplain population growth rate and proportion of floodplain population, the state of Arkansas and one of its counties, Sebastian county, were selected for further evaluation of the floodplain population dynamics.
Time-series of flood occurrence, flood damage, and structural and nonstructural interventions with floodplain population dynamics indicators were investigated for the state of Arkansas and Sebastian county.
The main findings of our study, related to the research questions that we originally posed, are:
- (1)
- Our long-term analysis shows that, at all spatial scales, populations settled down in floodplain areas when initially moving to a state or a county but moved outside floodplains over the years. As the floodplain population at the national scale homogenously spread within US territory, the centroid value of the GFP stabilized around the state of Arkansas and in the lower Mississippi river basin.
- (2)
- The analysis of time-series of flood occurrence, flood damage, floodplain population and mitigation measures show active dynamics of local (structural) and national (nonstructural) responses to flooding. Floodplain population dynamics changed over time, in Arkansas and in particular in Sebastian county, where intense mitigation measures took place.
Floodplain population dynamics are a complex phenomenon influenced by a variety of factors including hydrological, social, economic and political factors. This is particularly true when such analysis is carried on over a long period. Our analysis, for example, does not account for racial discrimination. Slavery was abolished in the US in late 1865; this might have been a turning point in shaping floodplain populations, especially in central-southern states of US. Furthermore, one might argue that a lack of jobs, economic crisis and industrialization (according to the National Bureau of Economics, there have been 47 recessions in the US from 1857 up to date and a Great Depression in the 1930s), might have contributed to inside/outside floodplain migration. Thus, drawing general conclusions on the sole influence of structural and nonstructural measures on floodplain population dynamics is not comprehensive of such a complex interaction. Nevertheless, we see the decision adopted by local and national institutions to build levees and implement—or reinforce—flood policies as economic and political signals in shaping floodplain dynamics and thus flood risk.
In our analysis, we collected a large amount of population data over 220 years. We want to note that while we are grateful for the richness of the data, this is decadal information. A decadal pace is reasonable for analyzing trends of floodplain population dynamics over 220 years for the entire US, but it did not allow us to fully capture the temporal dimension of occurrence of floods on implementation of mitigation measures and, in turn, on floodplain population dynamics. A finer pace of population data would allow us to better account for any learning effect and decay rate of flood memory among the population, which contributes to floodplain dynamics.
By reflecting on the results of our study, we plan to further investigate floodplain dynamics by:
- analyzing, at the national level, population dynamics of flooded and non-flooded areas, to look at how the occurrence of flood events might contribute to shaping population dynamics in different locations;
- increasing the number of local case studies, at state and county levels, to acquire a broader perspective of local dynamics and to draw more general conclusions on floodplain dynamics over time;
- analyzing, at the local scale, performance of mitigation measures (i.e., looking at levee failure and number of flood insurance over time) on floodplain population dynamics.
Our exploratory investigation contributes to the understanding of floodplain population processes. Unlocking the underlying mechanisms that drive floodplain dynamics is a crucial component in improving future flood risk management.
Supplementary Materials
The following are available online at https://www.mdpi.com/2073-4441/13/2/141/s1, Figure S1: Spatial distribution of the ratio between floodplain population and total population for the US States for the period 1790–2010 in 10-year intervals. Figure S2: Proportion of floodplain population for Arkansas state starting from 1810 in 10-year intervals. Table S1: Statistical analysis of proportion of floodplain population (PFP) for each state of the United States. Table S2: Statistical analysis of the proportion of floodplain population (PFP) for each county of Arkansas. Table S3: Summary of flood events, damage, and flood protection measures with the year of flood occurrence, the introduction of flood protection measures and source of information in Arkansas State. Table S4: Summary of the historical flood events, flood damage data in terms of property damage in thousand USD, structural protection measures and related acts, policies, design, guideline and construction time, non-structural measure, i.e., flood insurance-related acts, guidelines, modifications and related decisions in Sebastian County, Arkansas. Table S5: Total floodplain population per state from 1790–2010. Table S6: Growth of Floodplain Population (GFP) in each state from 1790–2010. Table S7: Proportion of Floodplain Population (PFP) in each state from 1790–2010. Table S8: Total Floodplain Population, Floodplain to the total population ratio (PFP), and floodplain population growth rate (GFP) in Sebastian county.
Author Contributions
Conceptualization, F.A., M.M. and L.B.; methodology, F.A., M.M. and L.B.; software, F.A.; formal analysis, F.A., M.M. and L.B.; resources, M.M. and L.B.; data curation, F.A.; writing—original draft preparation, F.A.; writing—review and editing, M.M. and L.B.; visualization, F.A.; supervision, M.M. and L.B. All authors have read and agreed to the published version of the manuscript.
Funding
Part of this research was also supported by the Swedish Research Council FORMAS and the Centre of Natural Hazards and Disaster Science, CNDS. M.M was supported by the European Research Council (ERC) within the project HydroSocialExtremes: Uncovering the Mutual Shaping of Hydrological Extremes and Society [ERC Consolidator Grant 771678, H2020 Excellent Science].
Institutional Review Board Statement
Not applicable.
Informed Consent Statement
Not applicable.
Data Availability Statement
Publicly available datasets were analyzed in this study. All data are listed in Table 1 where references are provided.
Conflicts of Interest
The authors declare no conflict of interest. The funders had no role in the design of the study; in the collection, analyses, or interpretation of data; in the writing of the manuscript, or in the decision to publish the results.
References
- Di Baldassarre, G.; Brandimarte, L.; Montanari, A.; Lins, H.; Koutsoyiannis, D.; Brandimarte, L.; Blöschl, G. Flood fatalities in Africa: From diagnosis to mitigation. Geophys. Res. Lett. 2010, 37. [Google Scholar] [CrossRef] [Green Version]
- McGranahan, G.; Balk, D.; Anderson, B. The rising tide: Assessing the risks of climate change and human settlements in low elevation coastal zones. Environ. Urban. 2007, 19, 17–37. [Google Scholar] [CrossRef]
- Ohl, C.A. Flooding and human health. Br. Med. J. 2000, 321, 1167–1168. [Google Scholar] [CrossRef] [PubMed]
- Opperman, J.J.; Galloway, G.E.; Fargione, J.; Mount, J.F.; Richter, B.D.; Secchi, S. Sustainable Floodplains through Large-Scale Reconnection to Rivers. Science 2009, 326, 1487–1488. [Google Scholar] [CrossRef] [PubMed]
- Milly, P.C.; Wetherald, R.T.; Dunne, K.A.; Delworth, T.L. Increasing risk of great floods in a changing climate. Nat. Cell Biol. 2002, 415, 514–517. [Google Scholar] [CrossRef] [PubMed]
- Jongman, B.; Hochrainer-Stigler, S.; Feyen, L.; Aerts, J.C.J.H.; Mechler, R.; Botzen, W.J.W.; Bouwer, L.M.; Pflug, G.C.; Rojas, R.; Ward, P.J. Increasing stress on disaster-risk finance due to large floods. Nat. Clim. Chang. 2014, 4, 264–268. [Google Scholar] [CrossRef]
- Alfieri, L.; Feyen, L.; Di Baldassarre, G. Increasing flood risk under climate change: A pan-European assessment of the benefits of four adaptation strategies. Clim. Chang. 2016, 136, 507–521. [Google Scholar] [CrossRef] [Green Version]
- Mazzoleni, M.; Mård, J.; Rusca, M.; Odongo, V.; Lindersson, S.; Di Baldassarre, G. Floodplains in the Anthropocene: A global analysis of the interplay between human population, built environment and flood severity. Water Resour. Res. 2020. [Google Scholar] [CrossRef]
- Di Baldassarre, G.; Viglione, A.; Carr, G.; Kuil, L.; Yan, K.; Brandimarte, L.; Blöschl, G. Debates-Perspectives on socio-hydrology: Capturing feedbacks between physical and social processes. Water Resour. Res. 2015, 51, 4770–4781. [Google Scholar] [CrossRef]
- Mechler, R.; Bouwer, L.M. Understanding trends and projections of disaster losses and climate change: Is vulnerability the missing link? Clim. Chang. 2014, 133, 23–35. [Google Scholar] [CrossRef]
- Kreibich, H.; Vorogushyn, S.; Apel, H.; Chinh, D.T.; Gain, A.K.; Dung, N.V.; Schröter, K.; Merz, B.; Di Baldassarre, G.; Mård, J.; et al. Adaptation to Flood Risk: Results of International Paired Flood Event Studies. Earth’s Future 2017. [Google Scholar] [CrossRef] [Green Version]
- White, G.F. Human Adjustment to Floods: A Geographical Approach to the Flood Problem in the United States; Research Paper no. 29.; The University of Chicago: Chicago, IL, USA, 1945. [Google Scholar]
- Kates, R.W.; Colten, C.E.; Laska, S.; Leatherman, S.P. Reconstruction of New Orleans after Hurricane Katrina: A research perspective. Proc. Natl. Acad. Sci. USA 2006, 103, 14653–14660. [Google Scholar] [CrossRef] [PubMed] [Green Version]
- Montz, B.; Tobin, G.A. Livin’ Large with Levees: Lessons Learned and Lost. Nat. Hazards Rev. 2008, 9, 150–157. [Google Scholar] [CrossRef]
- Collenteur, R.; De Moel, H.; Jongman, B.; Di Baldassarre, G. The failed-levee effect: Do societies learn from flood disasters? Nat. Hazards 2014, 76, 373–388. [Google Scholar] [CrossRef]
- Ferdous, R.; Di Baldassarre, G.; Brandimarte, L.; Wesselink, A. The interplay between structural flood protection, population density, and flood mortality along the Jamuna River, Bangladesh. Reg. Environ. Chang. 2020, 20, 5. [Google Scholar] [CrossRef] [Green Version]
- Tobin, G.A. The levee love affair: A stormy relationship? J. Am. Water Resour. Assoc. 1995, 31, 359–367. [Google Scholar] [CrossRef]
- Di Baldassarre, G.; Saccà, S.; Aronica, G.T.; Grimaldi, S.; Ciullo, A.; Crisci, M. Human-flood interactions in Rome over the past 150 years. Adv. Geosci. 2017, 44, 9–13. [Google Scholar] [CrossRef] [Green Version]
- Ferdous, R.; Wesselink, A.; Brandimarte, L.; Di Baldassarre, G.; Rahman, M. The levee effect along the Jamuna River in Bangladesh. Water Int. 2019, 44, 496–519. [Google Scholar] [CrossRef]
- Xu, M.; He, C.; Liu, Z.; Dou, Y. How Did Urban Land Expand in China between 1992 and 2015? A Multi-Scale Landscape Analysis. PLoS ONE 2016, 11, e0154839. [Google Scholar] [CrossRef] [Green Version]
- Mård, J.; Di Baldassarre, G.; Mazzoleni, M. Nighttime light data reveal how flood protection shapes human proximity to rivers. Sci. Adv. 2018, 4, eaar5779. [Google Scholar] [CrossRef] [Green Version]
- Rossi, P.H.; Wright, J.D.; Wright, S.R.; Weber-Burdin, E. Are there long term effects of American natural disaster? Estimation of floods, hurricanes, and tornadoes occurring 1960 to 1970 on U.S. Census tracts in 1970. Mass Emergencies 1978, 3, 117–132. [Google Scholar]
- Schultz, J.; Elliott, J.R. Natural disasters and local demographic change in the United States. Popul. Environ. 2012, 34, 293–312. [Google Scholar] [CrossRef]
- Winsemius, H.C.; Aerts, J.C.J.H.; Van Beek, L.P.H.; Bierkens, M.F.P.; Bouwman, A.; Jongman, B.; Kwadijk, J.C.J.; Ligtvoet, W.; Lucas, P.L.; Van Vuuren, D.P.; et al. Global drivers of future river flood risk. Nat. Clim. Chang. 2016, 6, 381–385. [Google Scholar] [CrossRef]
- Willner, S.; Otto, C.; Levermann, A. Global economic response to river floods. Nat. Clim. Chang. 2018, 8, 594–598. [Google Scholar] [CrossRef]
- Smith, A.; Bates, P.; Wing, O.; Sampson, C.; Quinn, N.; Neal, J. New estimates of flood exposure in developing countries using high-resolution population data. Nat. Commun. 2019, 10, 1814. [Google Scholar] [CrossRef] [PubMed] [Green Version]
- Woznicki, S.A.; Baynes, J.; Panlasigui, S.; Mehaffey, M.; Neale, A. Development of a spatially complete floodplain map of the conterminous United States using random forest. Sci. Total Environ. 2019, 647, 942–953. [Google Scholar] [CrossRef] [PubMed]
- Peri, C.; Rosoff, S.; Yager, J. Data Brief: U.S. Population in Floodplains; NYU Furman Center: New York, NY, USA, 2017. [Google Scholar]
- Wing, O.E.J.; Bates, P.; Smith, A.M.; Sampson, C.C.; A Johnson, K.; Fargione, J.; Morefield, P. Estimates of present and future flood risk in the conterminous United States. Environ. Res. Lett. 2018, 13, 034023. [Google Scholar] [CrossRef]
- Fang, Y.; Jawitz, J. High-resolution reconstruction of the United States human population distribution, 1790 to 2010. Sci. Data 2018, 5, 180067. [Google Scholar] [CrossRef] [Green Version]
- Nardi, F.; Annis, A.; Di Baldassarre, G.; Vivoni, E.R.; Grimaldi, S. GFPLAIN250m, a global high-resolution dataset of Earth’s floodplains. Sci. Data 2019, 6, 180309. [Google Scholar] [CrossRef]
- USA State Boundaries. Available online: https://www.arcgis.com/home/item.html?id=540003aa59b047d7a1f465f7b1df1950 (accessed on 11 December 2020).
- Arkansas GIS Office. Available online: https://gis.arkansas.gov/ (accessed on 11 December 2020).
- U.S. Geological Survey (USGS). Available online: https://www.sciencebase.gov/catalog/ (accessed on 11 December 2020).
- Federal Emergency Management Agency (FEMA). Available online: www.fema.gov (accessed on 11 December 2020).
- Park, H. The Arkansas River Floods of 1943. Ark. Hist. Q. 1943, 2, 202–213. [Google Scholar] [CrossRef]
- Barry, J.M. Rising Tide: The Great Mississippi Flood of 1927 and How it Changed America, 6th ed.; Simon & Schuster: New York, NY, USA, 1997. [Google Scholar]
- Rogers, J.D. Evolution and Development of Flood Control Engineering (GE 4001). Available online: https://web.mst.edu/~rogersda/umrcourses/ge301/ (accessed on 11 December 2020).
- Federal Emergency Management Agency (FEMA). History of Levees. Available online: https://www.fema.gov/sites/default/files/2020-08/fema_history-of-levees_fact-sheet_0512.pdf (accessed on 11 December 2020).
- USACE. National levee database of USACE: 1938–2010. Available online: https://levees.sec.usace.army.mil (accessed on 11 December 2020).
- The American Institutes for Research. A Chronology of Major Events Affecting the National Flood Insurance Program; FEMA: Hyattsville, MD, USA, 2005.
- Pielke, R.A., Jr.; Downton, M.W.; Barnard Miller, J.Z. Flood Damage in the United States, 1926–2000: A Reanalysis of National Weather Service Estimates; UCAR: Boulder, CO, USA, 2002; Available online: https://sciencepolicy.colorado.edu/flooddamagedata/full_report.html (accessed on 11 December 2020).
- Hazards and Vulnerability Research Institute. The Spatial Hazard Events and Losses Database for the United States, Version 9.0. Available online: http://www.sheldus.org (accessed on 11 December 2020).
- Median Center (Spatial Statistics)—ArcMap|Documentation. Available online: https://desktop.arcgis.com/en/arcmap/latest/tools/spatial-statistics-toolbox/median-center.htm (accessed on 10 December 2020).
- Gallman, R.E. Economic Growth and Structural Change in the Long Nineteenth Century; Cambridge University Press: Cambridge, UK, 2000; Volume 2, pp. 1–56. [Google Scholar] [CrossRef]
- Arkansas Crops & Commercial Horticulture|Production & Verification. Available online: https://www.uaex.edu/farm-ranch/crops-commercial-horticulture/ (accessed on 7 June 2020).
- Bubeck, P.; Botzen, W.J.W.; Kreibich, H.; Aerts, J.C.J.H. Long-term development and effectiveness of private flood mitigation measures: An analysis for the German part of the river Rhine. Nat. Hazards Earth Syst. Sci. 2012, 12, 3507–3518. [Google Scholar] [CrossRef]
Figure 1.
The contiguous US with states boundaries, floodplains area, and a focus on the state of Arkansas and Sebastian county with boundaries and floodplains area.
Figure 1.
The contiguous US with states boundaries, floodplains area, and a focus on the state of Arkansas and Sebastian county with boundaries and floodplains area.
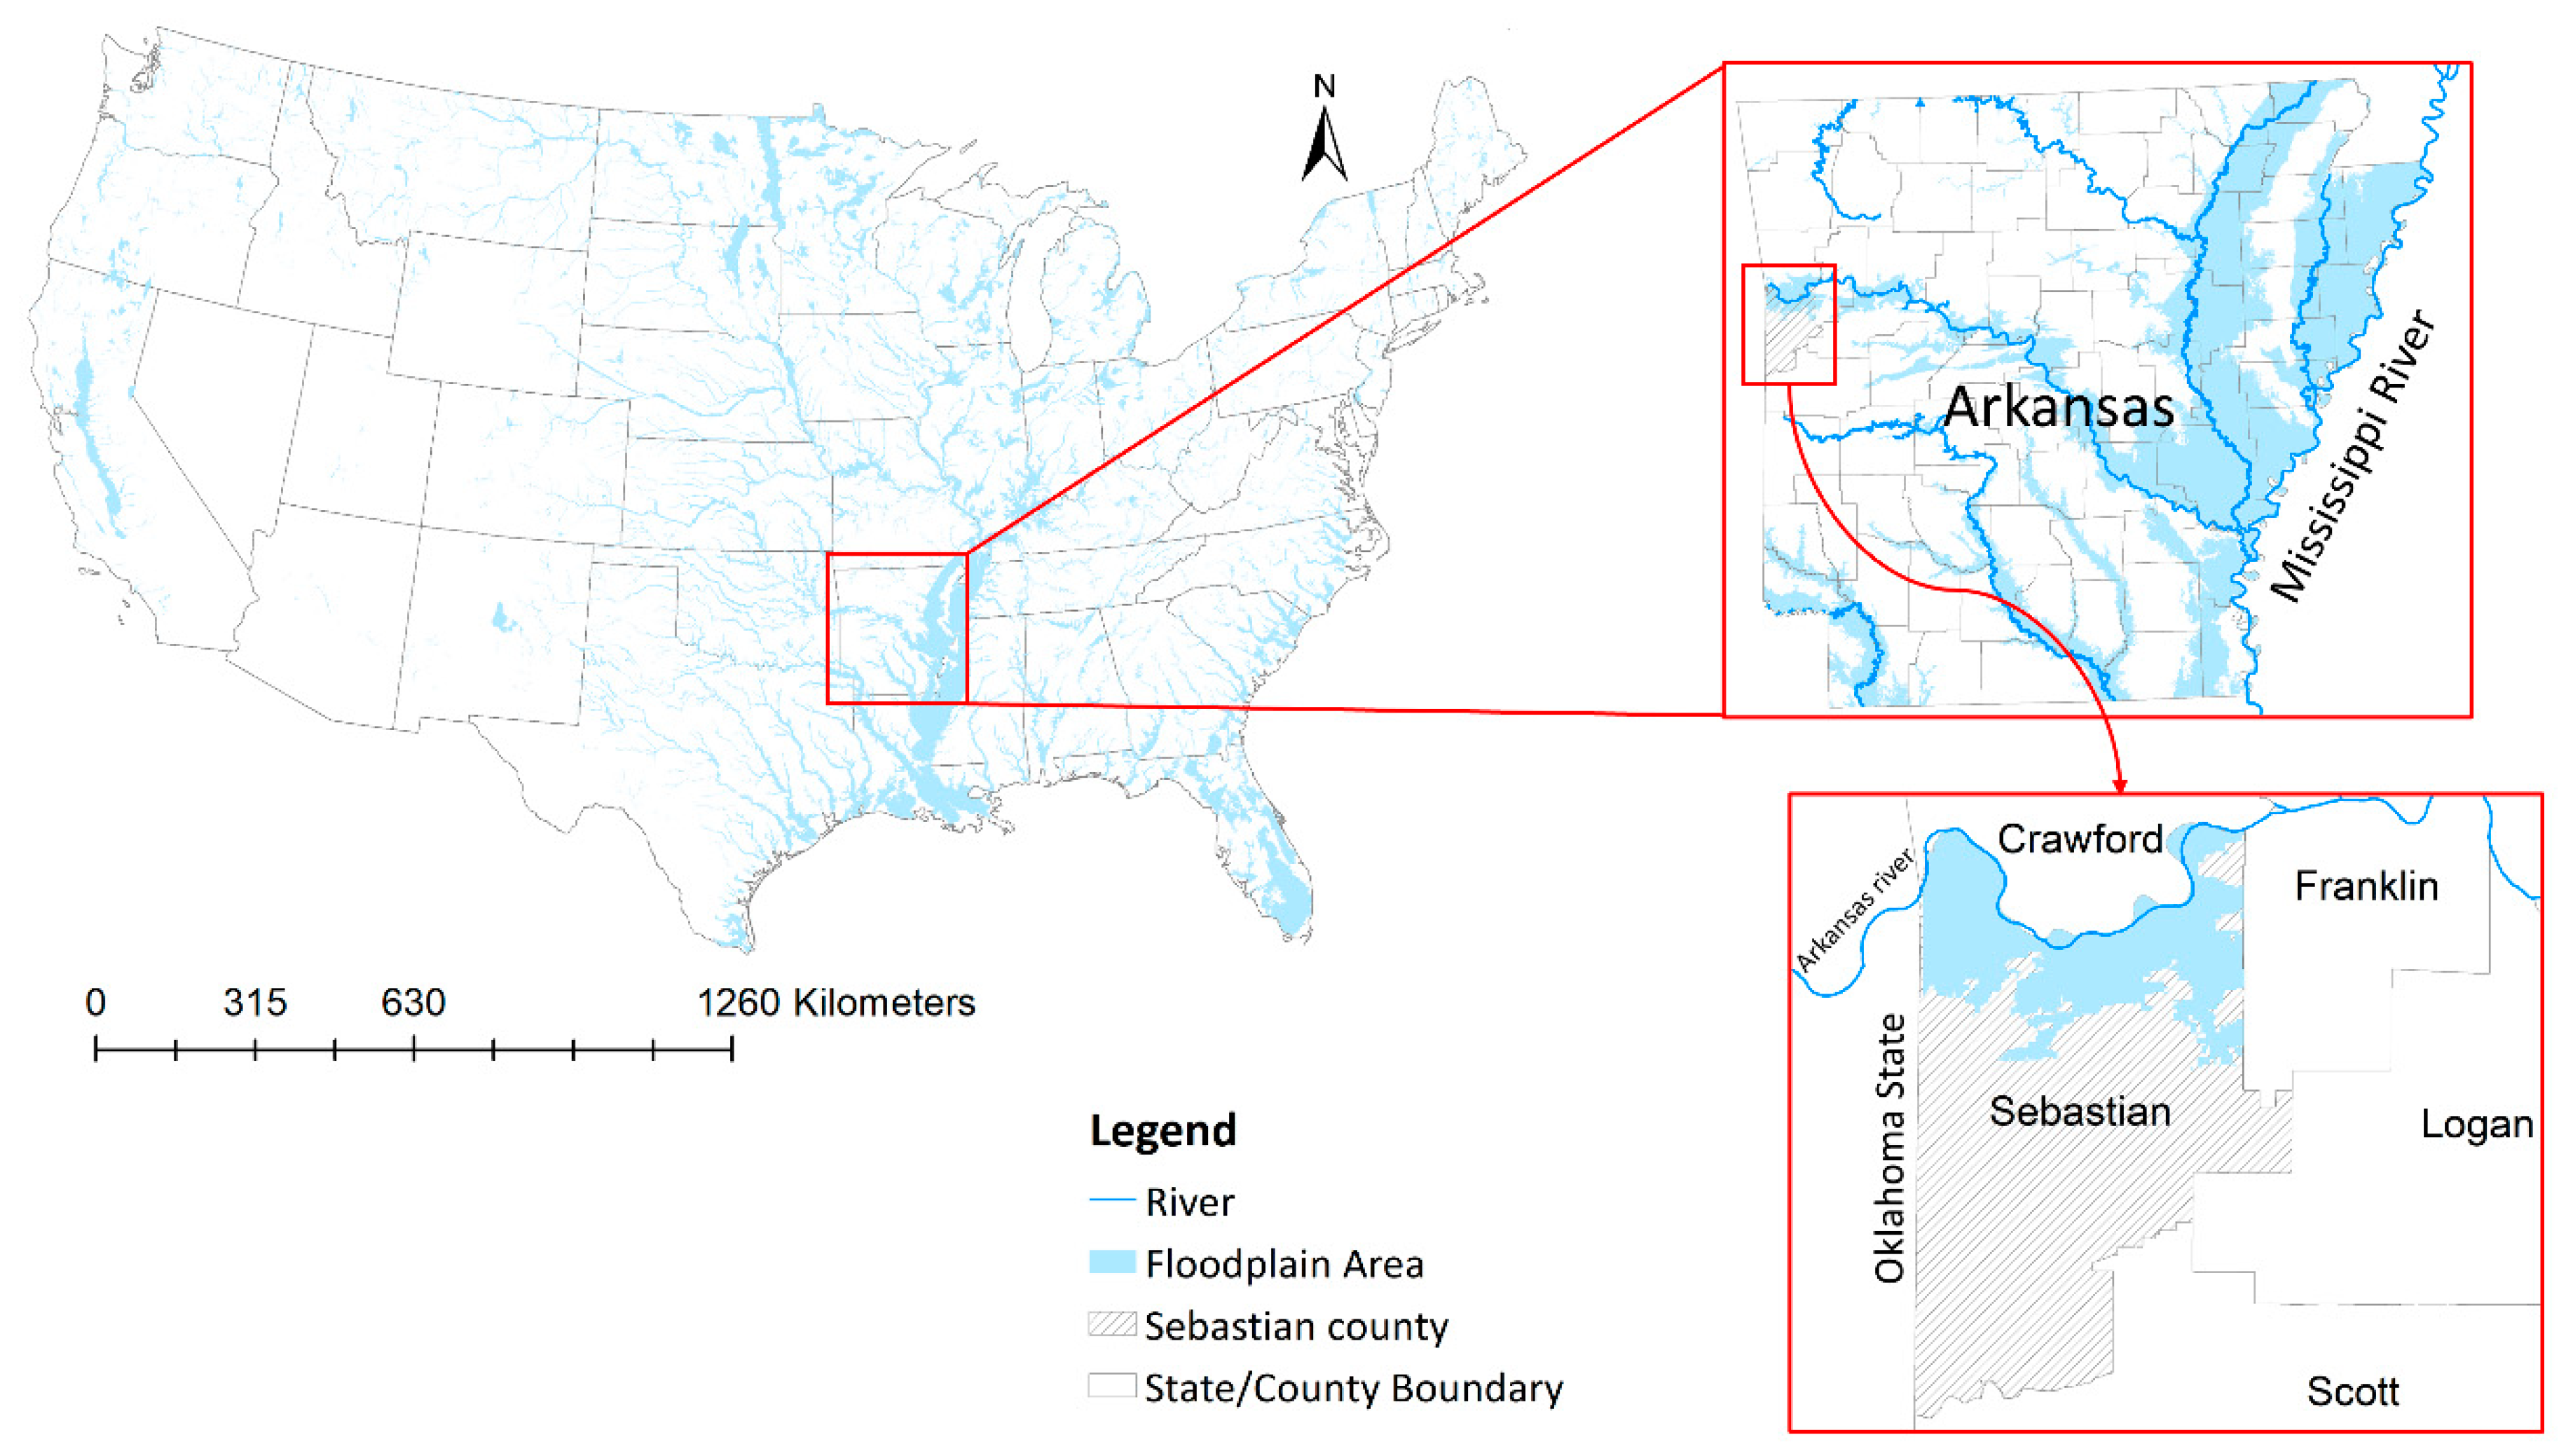
Figure 2.
Spatial distribution of the centroids of the growth rate of floodplain population (GFP) from 1790 to 2010.
Figure 2.
Spatial distribution of the centroids of the growth rate of floodplain population (GFP) from 1790 to 2010.

Figure 3.
Spatial distribution of the ratio between floodplain population and total population for the US States for the period 1790–2010. (See Figure S1 in Supplementary Materials for the floodplain population (PFP) for the US in 10-year intervals).
Figure 3.
Spatial distribution of the ratio between floodplain population and total population for the US States for the period 1790–2010. (See Figure S1 in Supplementary Materials for the floodplain population (PFP) for the US in 10-year intervals).
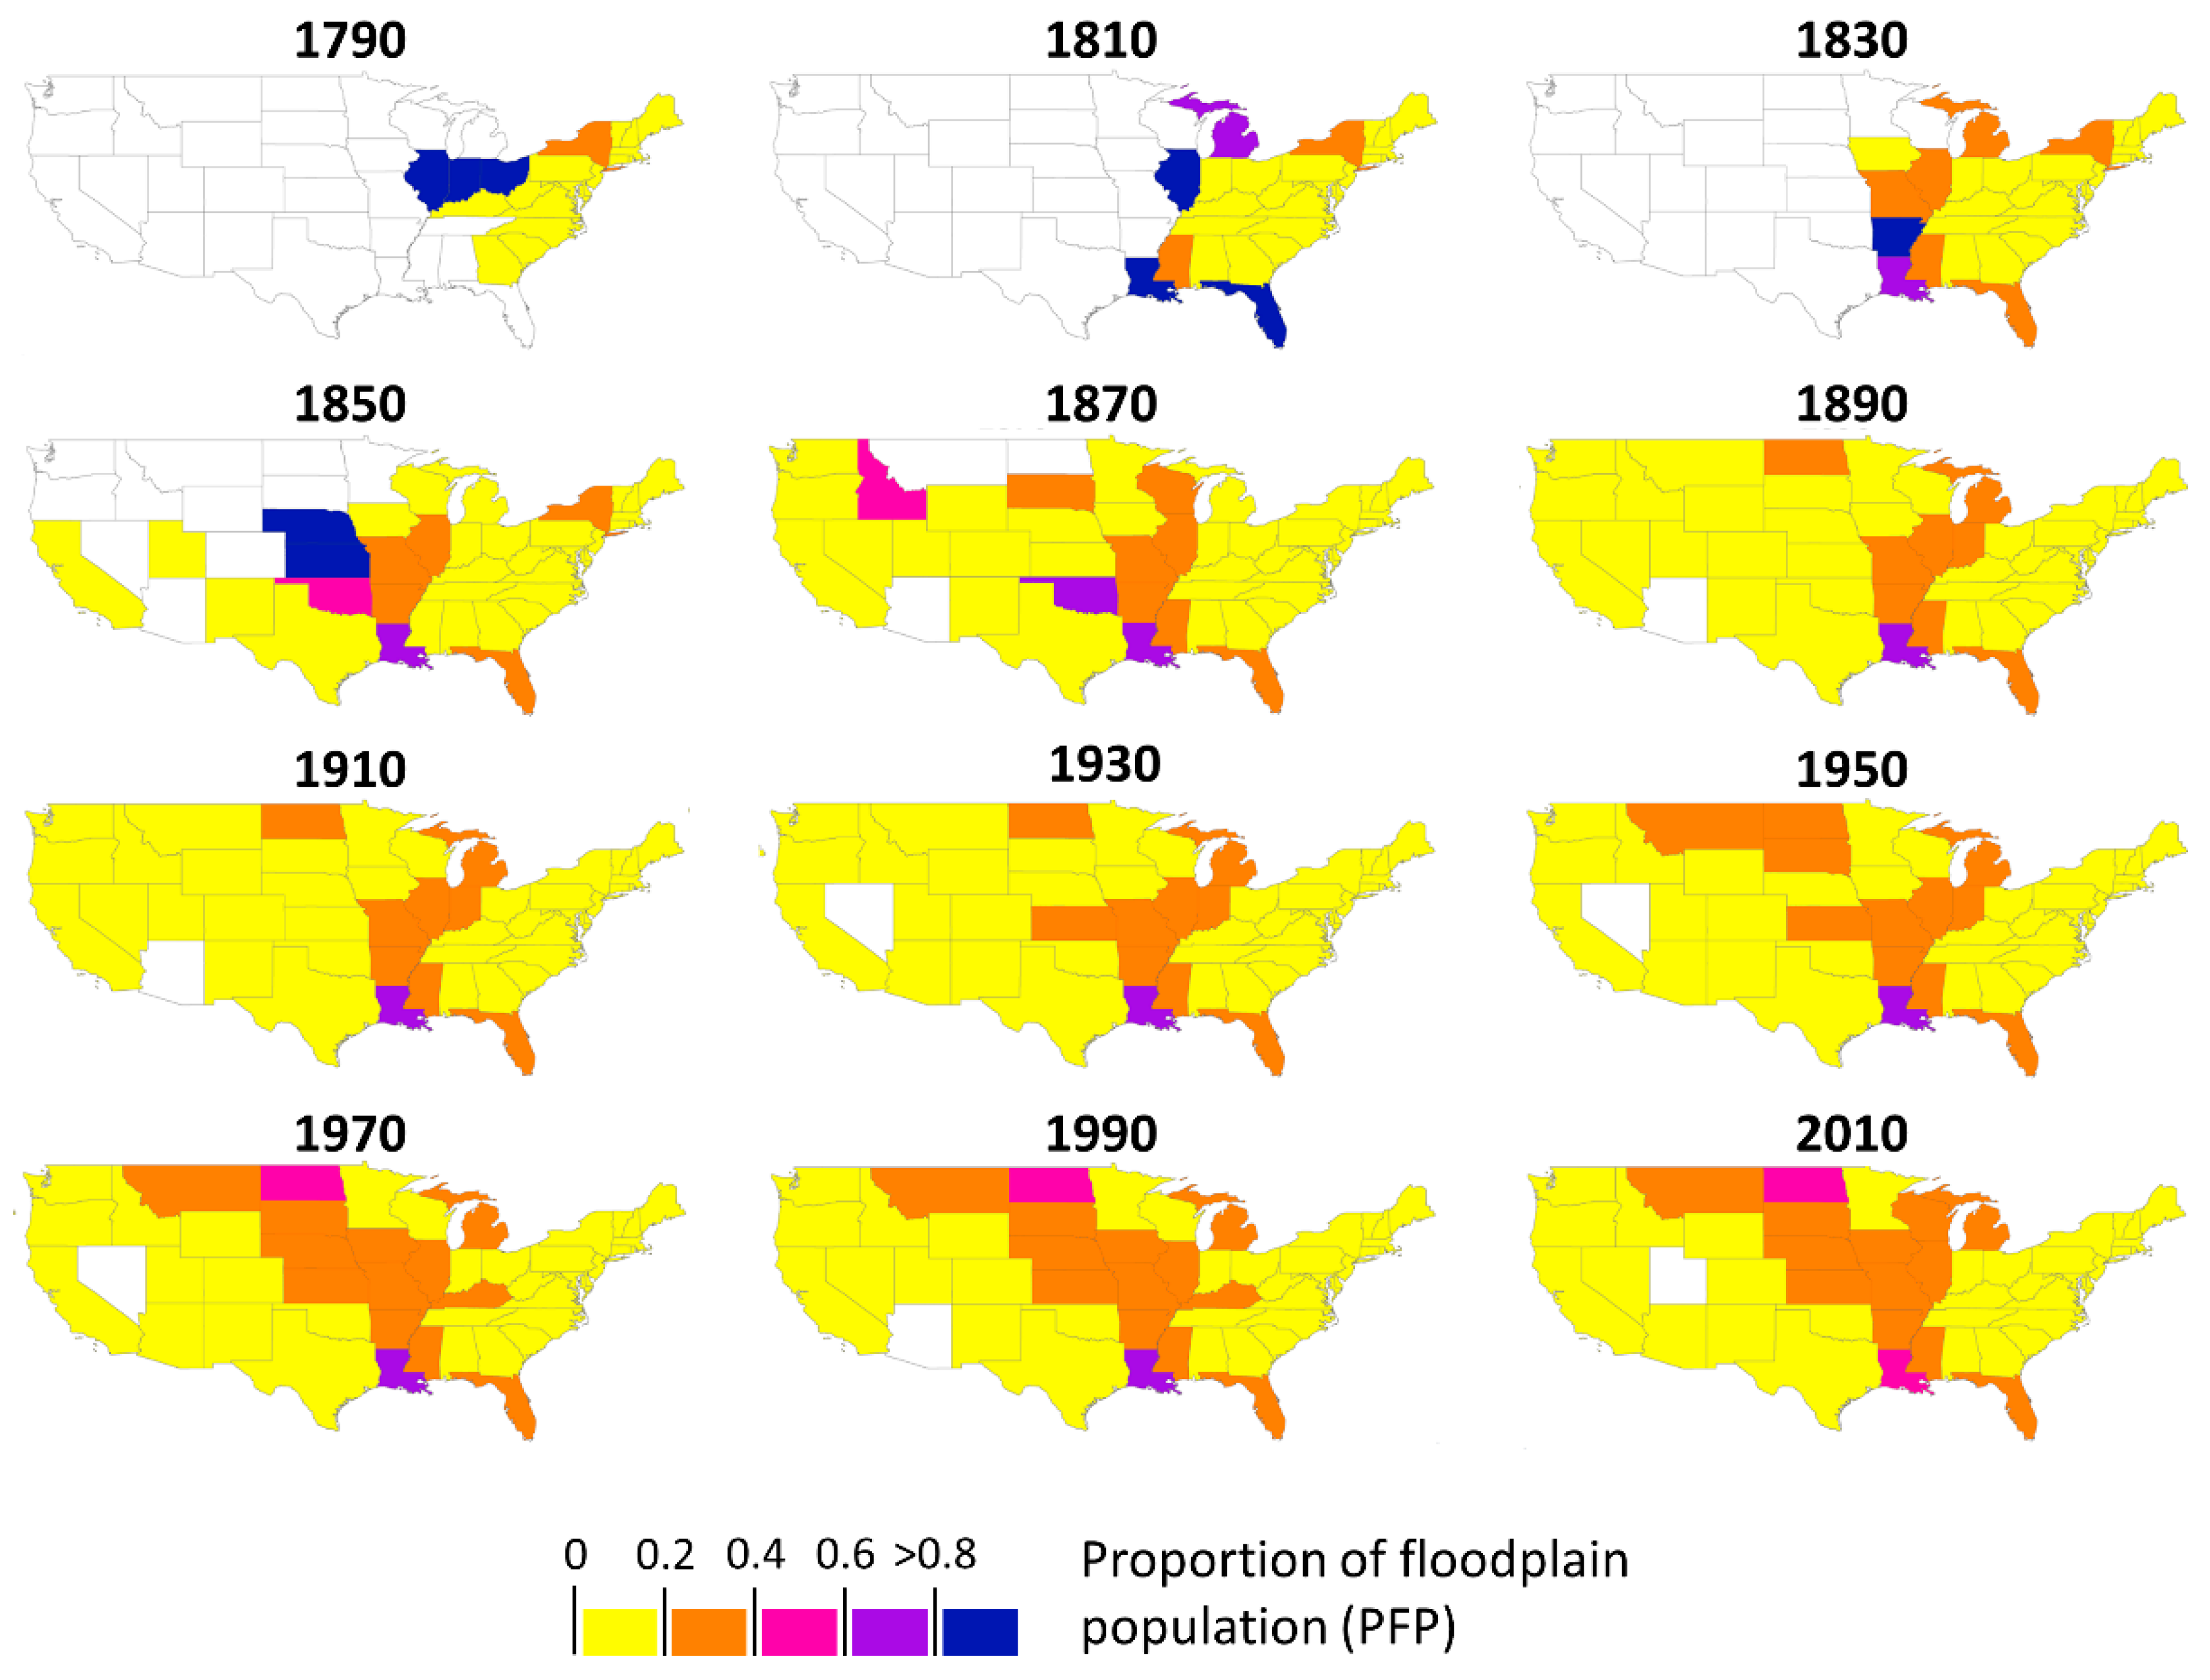
Figure 4.
Temporal change in population and floodplain to the total population ratio in the contiguous US from 1790 to 2010.
Figure 4.
Temporal change in population and floodplain to the total population ratio in the contiguous US from 1790 to 2010.
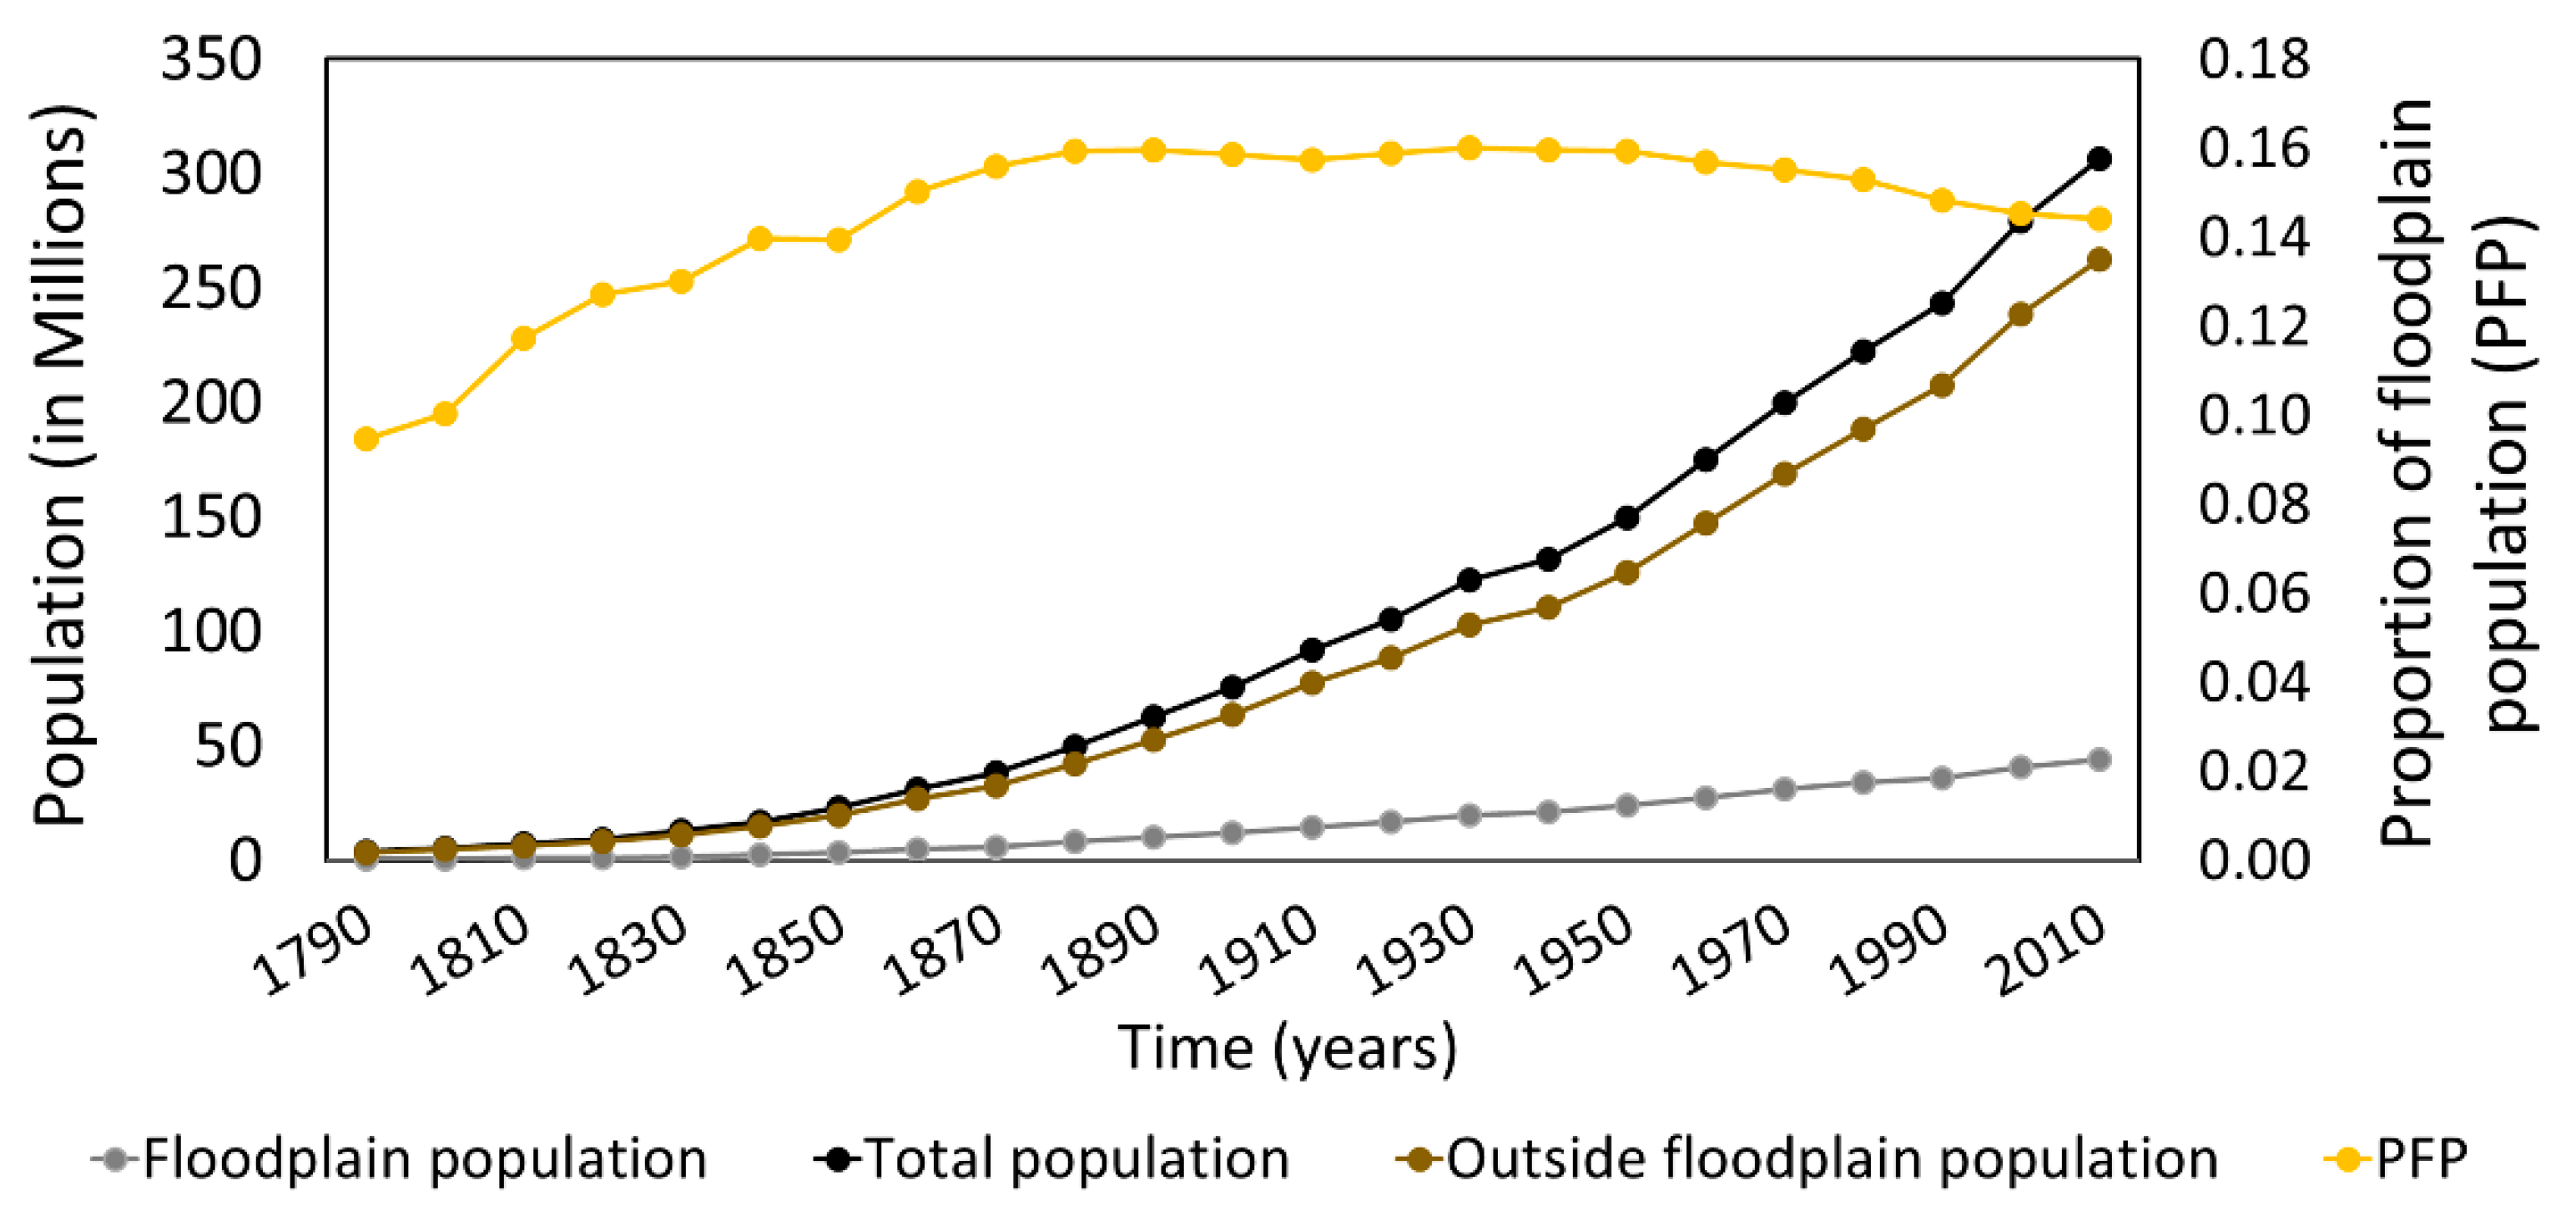
Figure 5.
Proportion of floodplain population for the state of Arkansas starting from 1810. (See Figure S2 in Supplementary Materials for PFP for the state of Arkansas in 10-year intervals).
Figure 5.
Proportion of floodplain population for the state of Arkansas starting from 1810. (See Figure S2 in Supplementary Materials for PFP for the state of Arkansas in 10-year intervals).

Figure 6.
Time-series of floodplain population dynamics, flood events, and related adaptation measures in the state of Arkansans. (a) Total state population, floodplain population, proportion of floodplain population, occurrence of flood events, and structural and nonstructural interventions; (b) floodplain population, floodplain population growth rate, occurrence of flood events, and structural and nonstructural interventions; (c–e) flood damages (in thousand USD), floodplain population, floodplain population growth rate, and proportion of floodplain population.

Figure 7.
Time-series of floodplain population dynamics, flood events, and related adaptation measures in Sebastian county. (a) Total state population, floodplain population, proportion of floodplain population, occurrence of flood events, and structural and nonstructural interventions; (b) floodplain population, floodplain population growth rate, occurrence of flood events, and structural and nonstructural interventions; (c–e) flood damages (in thousand USD), floodplain population, floodplain population growth rate, and proportion of floodplain population.

Figure 8.
(a) Growth rate of floodplain population (GFP) and (b) proportion of floodplain population (PFP) observed at the three different spatial scales (national, state, and county levels) proposed in this study.
Figure 8.
(a) Growth rate of floodplain population (GFP) and (b) proportion of floodplain population (PFP) observed at the three different spatial scales (national, state, and county levels) proposed in this study.

Table 1.
Datasets used for spatial and temporal analysis of floodplain population dynamics, historical flood events, and intervention measures.
Table 1.
Datasets used for spatial and temporal analysis of floodplain population dynamics, historical flood events, and intervention measures.
| No. | Data Description | Spatial Resolution | Temporal Resolution | Source |
|---|---|---|---|---|
| 1 | Population data for the whole US | Raster (Res.: 1 km) | 1790–2010 | [30] |
| 2 | Floodplain boundary of US | Raster (Res.: 250 m) | - | [31] |
| 3 | Administrative boundary (Country, state, county) | Polygon Shape file | - | [32] [33] |
| 4 | River Shapefile (US) | Polyline | - | [34] |
| 5 | Flood events | [35]: 1953–2010 [36,37]: 1833–1950 | [35] [36] [37] | |
| 6 | Structural intervention (Levee construction, related policy formulation) (1849–2010) | CSV | [38]: 1849–1950 [39,40]: 1950–2010 | [38] [39] [40] |
| 7 | Flood insurance program | Official documents | 1968–2005 | [41] |
| 10 | Flood damage data 1 | PDF, CSV | 1955–2010 [42]: State level [43]: County level | [42,43] |
1 Federal Emergency Management Agency (FEMA) and the Federal Government cannot vouch for the data or analyses derived from these data after the data retrieved from the Agency’s website(s) or Data.gov.
Publisher’s Note: MDPI stays neutral with regard to jurisdictional claims in published maps and institutional affiliations. |
© 2021 by the authors. Licensee MDPI, Basel, Switzerland. This article is an open access article distributed under the terms and conditions of the Creative Commons Attribution (CC BY) license (http://creativecommons.org/licenses/by/4.0/).
Share and Cite
MDPI and ACS Style
Akhter, F.; Mazzoleni, M.; Brandimarte, L. Analysis of 220 Years of Floodplain Population Dynamics in the US at Different Spatial Scales. Water 2021, 13, 141. https://doi.org/10.3390/w13020141
AMA Style
Akhter F, Mazzoleni M, Brandimarte L. Analysis of 220 Years of Floodplain Population Dynamics in the US at Different Spatial Scales. Water. 2021; 13(2):141. https://doi.org/10.3390/w13020141
Chicago/Turabian StyleAkhter, Firoza, Maurizio Mazzoleni, and Luigia Brandimarte. 2021. "Analysis of 220 Years of Floodplain Population Dynamics in the US at Different Spatial Scales" Water 13, no. 2: 141. https://doi.org/10.3390/w13020141
Note that from the first issue of 2016, this journal uses article numbers instead of page numbers. See further details here.