Cryosphere Water Resources Simulation and Service Function Evaluation in the Shiyang River Basin of Northwest China


1
Qilian Alpine Ecology and Hydrology Research Station, Key Laboratory of Ecohydrology of Inland River Basin, Northwest Institute of Eco-Environment and Resources, Chinese Academy of Sciences, Lanzhou 730000, China
2
University of Chinese Academy of Sciences, Beijing 100049, China
*
Author to whom correspondence should be addressed.
Water 2021, 13(2), 114; https://doi.org/10.3390/w13020114
Submission received: 10 December 2020
/
Revised: 26 December 2020
/
Accepted: 29 December 2020
/
Published: 6 January 2021
(This article belongs to the Section Hydrology)
Abstract
:Water is the most critical factor that restricts the economic and social development of arid regions. It is urgent to understand the impact on cryospheric changes of water resources in arid regions in western China under the background of global warming. A cryospheric basin hydrological model (CBHM) was used to simulate the runoff, especially for glaciers and snowmelt water supply, in the Shiyang River Basin (SRB). A cryosphere water resources service function model was proposed to evaluate the value of cryosphere water resources. The annual average temperature increased significantly (p > 0.05) from 1961 to 2016. The runoff of glacier and snowmelt water in the SRB decreased significantly. This reduction undoubtedly greatly weakens the runoff regulation function. The calculation and value evaluation of the amount of water resources in the cryosphere of Shiyang River Basin is helpful to the government for adjusting water structure to realize sustainable development.
1. Introduction
Cryosphere science is an emerging science. The cryosphere elements consist of glacial ice, sea ice, ice shelves, ice caps, continental glaciers, valley glaciers, permafrost, as well as snow and ice in rivers and lakes [1]. Studies on the cryosphere have accelerated since 1972 when, at the Stockholm Human Environment Conference, the World Meteorological Organization (WMO) proposed the cryosphere as a fifth earth sphere alongside the atmosphere, hydrosphere, lithosphere, and biosphere [2]. Subsequently, the World Climate Research Programmer (WCRP) launched its core “climate and cryosphere” (CliC) plans in 2000. Then, the International Union of Geodesy and Geophysics (IUGG) made the decision to add the International Cryospheric Science Association (IACS) as a new association in 2007. Since the start of the twenty-first century, cryosphere research has seen unprecedented development around the world [2]. The Fifth Assessment Report of the Intergovernmental Panel on Climate Change (IPCC) confirmed the fact of global warming in the past 100 years and pointed out that the impact of human activities has been the main cause of climate warming since the mid-20th century [3]. Much of this frozen world, the cryosphere, has been melting as a result of global warming [1]. In the western cold regions of China (WCRC), many changes have taken place in the cryosphere. The glacier area has decreased by 12.9% from 1960 (59,425 km2) to 2012 (51,766 km2) [4,5]. The permafrost has experienced widespread degradation [6]. Snow cover has shown a small increase trend in the WCRC between 1951 and 1997 [7]. These changes will definitely affect the water cycle and yearly runoff variation in the cold alpine watershed [8,9,10,11,12]. An increase or decrease in river basin runoff will have an important impact on river basin water resources planning, management, and sustainable use. With the proposal and development of the concept of cryosphere service function [13,14,15,16], and the establishment of a scientific system of cryospheric science, cryospheric changes and their impacts have received increasing concern [2]. The impact of changes in the cryosphere on the socioeconomic field is now a research hotspot. Its research route is change, impact, adaptation, and service.
Quantifying the effect of cryospheric changes on runoff in the WCRC has been the basis of research. Much work has been performed on climate and streamflow changes for individual basins in the WCRC. Chen et al. [17] investigated the hydrological response to climate change in the Tarim River Basin. In the same year, Li et al. [18] analyzed the influence of climatic change on the flow over the upper Hei River Basin (UHR). Later, Ma et al. [19] studied eight catchments in the Shiyang River Basin (SRB) and investigated changes in annual streamflow in the WCRC. Wang et al. [20] investigated the effects of climate change on streamflow of the Xiying and Zamu rivers in the SRB, based on the Soil and Water Assessment Tool (SWAT).
These studies lack an analysis of climate change on glacial and snowmelt water. Melt modeling is a crucial element in any attempt to predict runoff from snow-covered or glacierized areas, as well as to assess changes in the cryosphere associated with climate change [21]. Singh et al. [22] developed a conceptual snowmelt model (SNOWMOD) based on the temperature index model and applied it to the study of the contribution of glaciers and snowmelt to the runoff in the Himalayas. Konz et al. [23] used the TAC (D) model to simulate runoff in a poorly gauged, highly glacierized Himalayan headwater. Chen et al. [24] constructed several models to simulate Koxkar glacial meltwater runoff. Zhao et al. [25] coupled energy balance and a mass balance algorithm to the variable infiltration capacity (VIC) model, and used it to simulate the glacial runoff in Aksu River Basin. Luo et al. [26] coupled the glacier module with the SWAT model to simulate the glacier runoff process in the Manas River Basin in the Tianshan Mountains. Model simulation is the main method for a comprehensive analysis of watershed hydrological elements. Distributed hydrological model coupled with glaciers, snow cover, and frozen soil modules can output these results. Creatively, Chen et al. [27] proposed a new distributed cryospheric basin hydrological model (CBHM) to evaluate the effects of cryospheric changes on streamflow in the UHR, and they studied and discussed the comprehensive effects of cryospheric changes on river runoff, including glaciers, snow cover, and permafrost, in the past and future.
The study of cryosphere service (CS) function and its value evaluation is still in the infancy stage. Xiao et al. [28] defined CS as the benefit that the cryosphere provides to human society, and classified the different services of CS as supply, accommodation, social culture, and living environment service. Later, some scholars [13,29,30,31,32] also studied the service function of the cryosphere. However, these studies were mainly theoretical studies on CS and lacked further practical research. Cryosphere water resources service (CWRS) is the most significant CS to directly affect human societies [30], which is the important breakthrough of the research of service function in cryosphere [33]. We aim to make a breakthrough in this area.
A CBHM applied to the upper Hei River Basin has achieved very good results, which have formed the basis for research on CWRS. However, research on CWRS cannot only involve a small watershed. Whether the model can be applied in more watersheds and a larger scale is a problem that needs to be solved. Further studies are still necessary. The purpose of this paper is to apply a CBHM to the scale of a water system. Furthermore, we aim to propose an evaluation system of CWRS function and also study the current status of CWRS functions. In this study, we applied a CBHM to seven catchments in the SRB, an important arid region in northwest China. The monthly runoff and its components were simulated from 1961 to 2016. Using the model output of cryosphere water resources and the socioeconomic data, we evaluated and divided the functions of CWRS in the study area. Our research expanded the research scale from a single watershed to the scale of a water system containing multiple watersheds and provided ideas and methods for studying the service function of the cryosphere water resources.
2. Study Area and Methods
2.1. Study Area
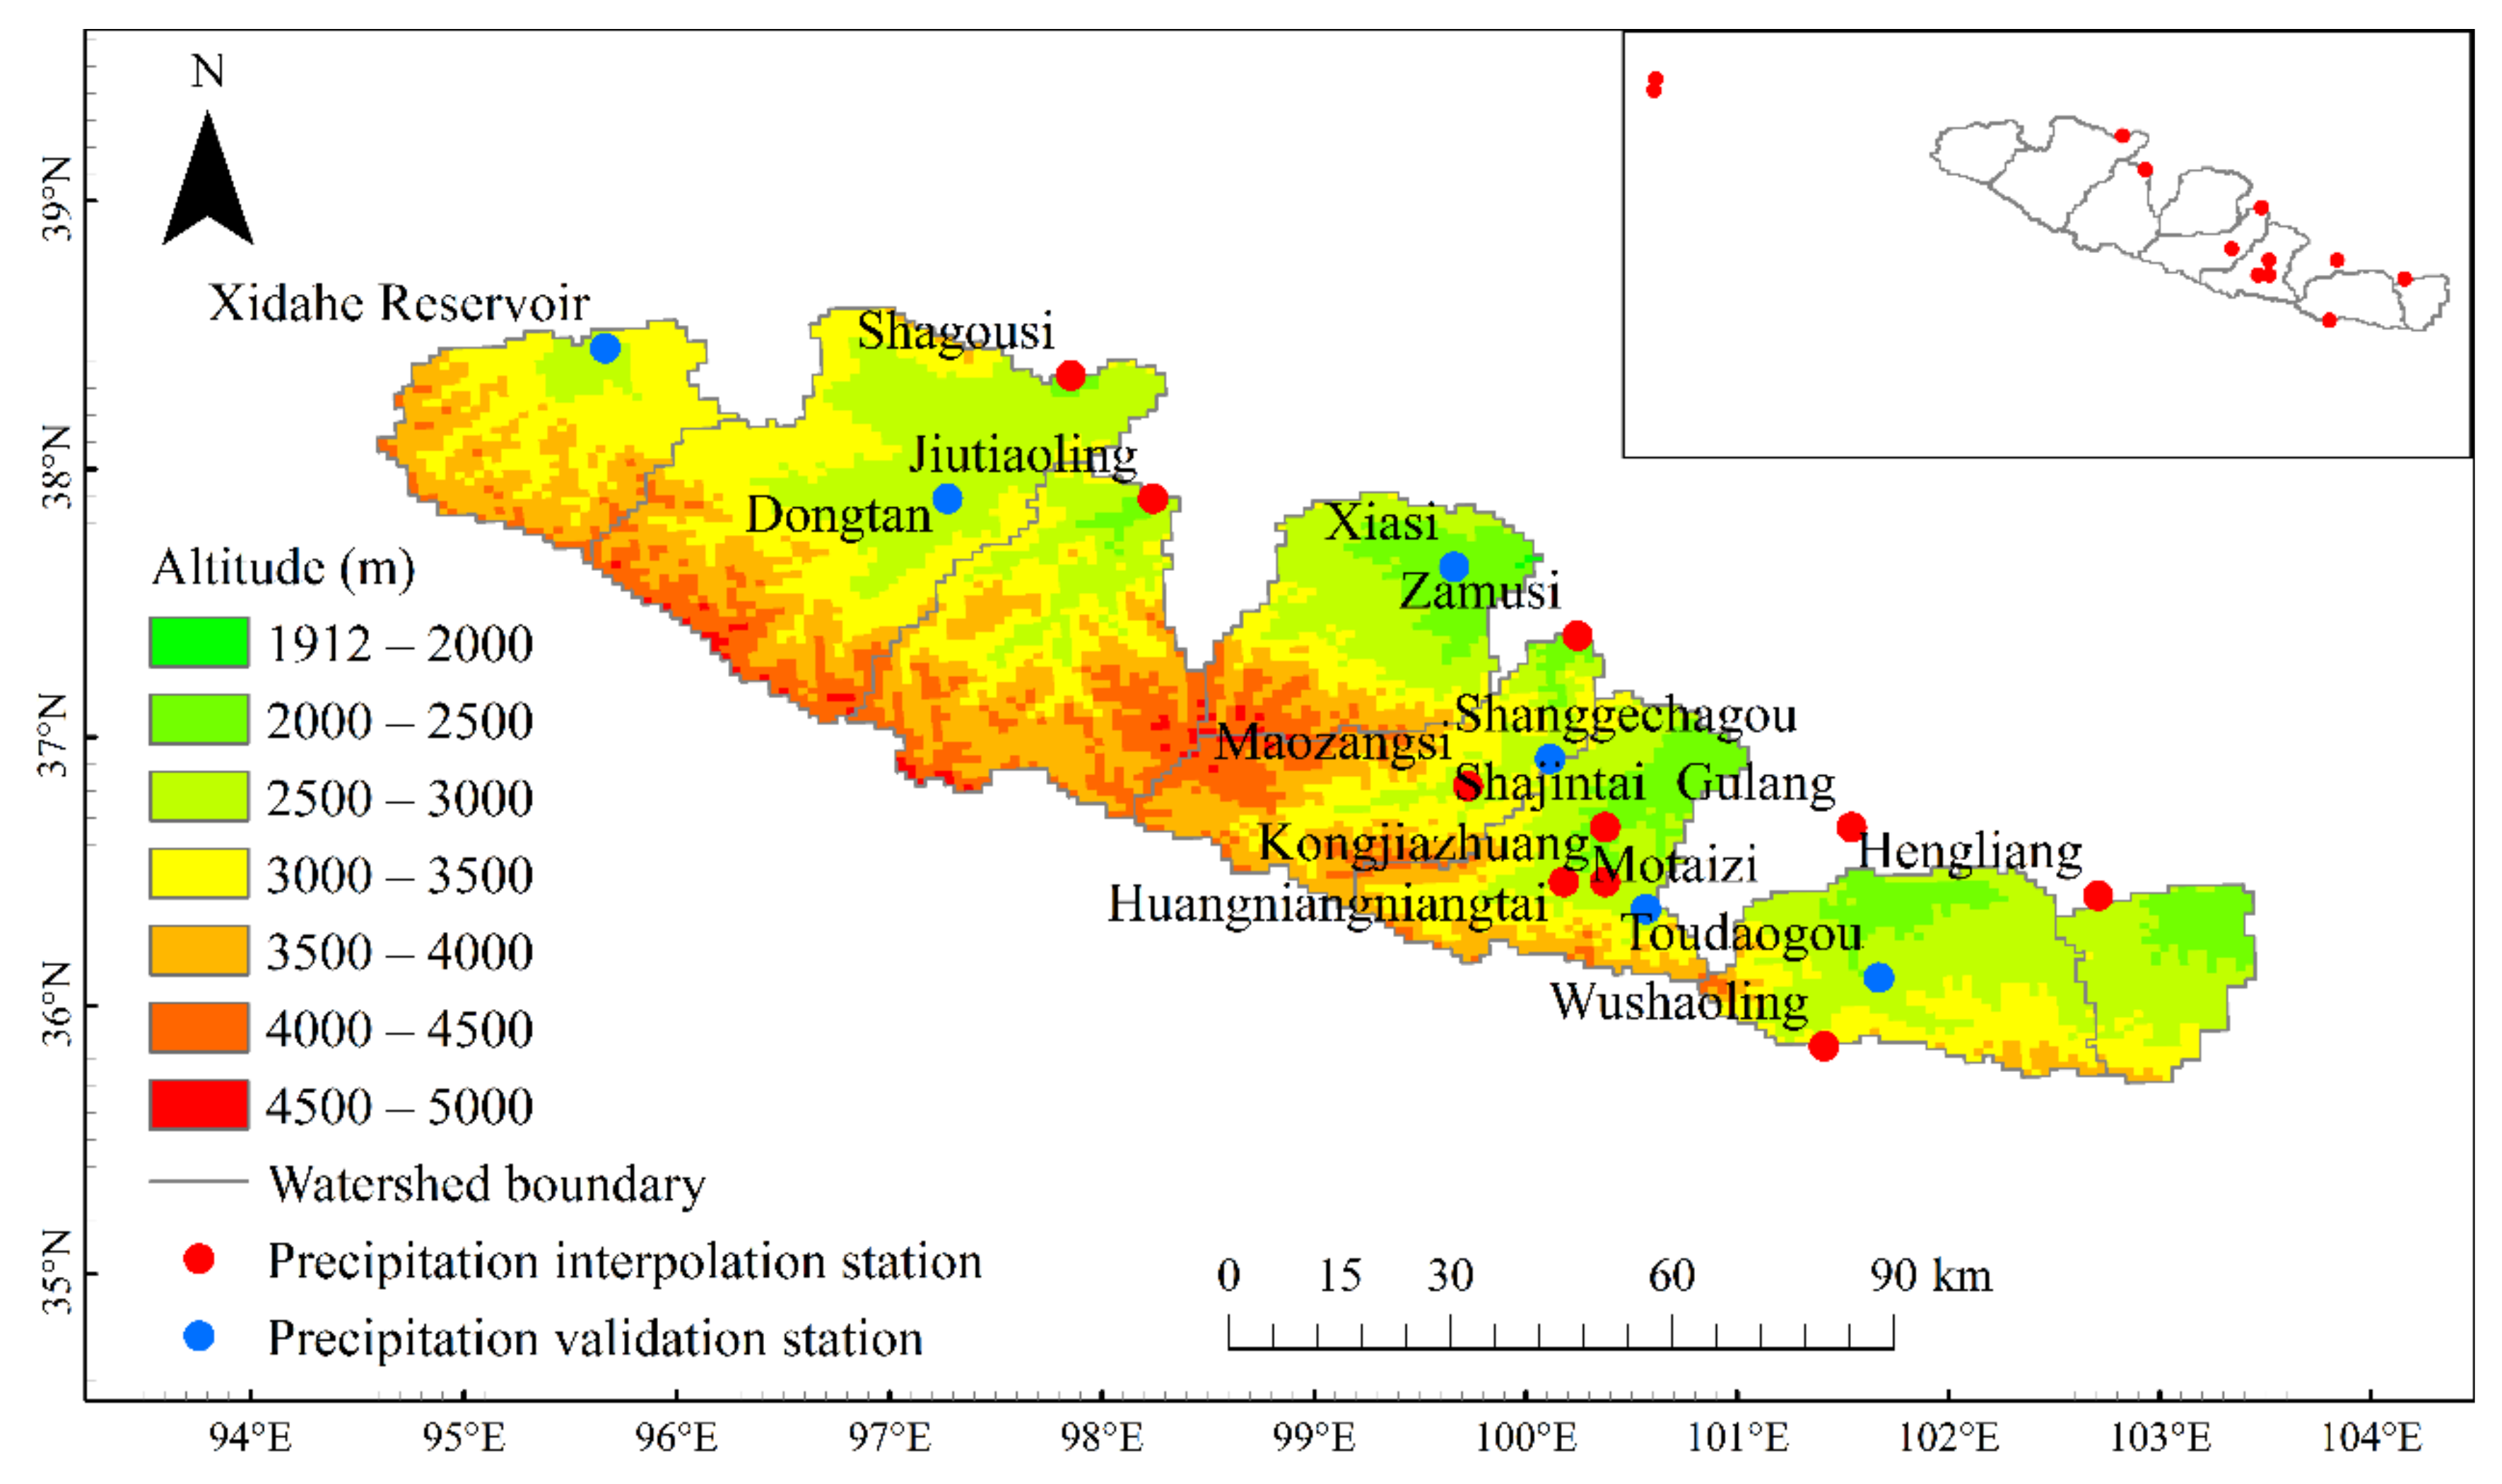
The Shiyang River Basin is located in the east part of the Hexi Corridor in Gansu Province in northwest China [19]. It is on the west of the Wushaoling Mountains and north of the Qilian Mountains at longitude of 100°57′–104°12′ E and latitude of 37°02′–39°17′ N, occupying an area of 41,600 km2 (Figure 1). The administrative divisions of the watershed include the four prefecture-level cities of Jinchang, Wuwei, Zhangye, and Baiyin, and nine counties of Liangzhou, Gulang, Minqin, Tianzhu, Yongchang, Jinchuan, Sunan, Shandan, and Jintai. The Shiyang River Basin is one of the three inland river basins of the Hexi Corridor, and the headwater rivers from east to west are the Dajing, Gulang, Huangyang, Zamu, Jinta, Xiying, Dongda, and Xida Rivers. The flow characteristics of the river and the control station information are shown in Table 1. The sources of river supply are atmospheric precipitation in mountainous areas and melting snow and ice in the high mountains. The mean annual runoff is 1.50 billion m3.
The Shiyang River Basin is deep in the hinterland of the mainland and belongs to a continental temperate arid and semi-arid climate. The alpine mountain area (altitude 2000–5000 m) of the southern Qilian Mountains is a semi-humid to semi-arid humid area, with an annual precipitation of 300.0–600.0 mm, pan evaporation of 700.0–1200.0 mm [19], and drought index of 1–4.
The total population of the Shiyang River Basin, in 2016, was 2.21 million people, with urban and rural populations of 0.97 million and 1.25 million, respectively and the GDP was 62.63 billion yuan, including 12.39 billion yuan in the primary industry, 25.30 billion yuan in the second industry, and 24.95 billion yuan in the tertiary industry. Wuwei City is a key area of economic, political, and social development in the Shiyang River Basin, with a population of 82.1%, an irrigated area of 68.8%, a GDP of 73.7%, and total grain output of 81.1%. It is also the most concentrated population and water resource development area in the Hexi region, with the highest degree of utilization and the most prominent contradiction between supply and demand.
2.2. Cryospheric Basin Hydrological Model
2.2.1. Model Overview
The cryospheric basin hydrological model (CBHM) is a distributed hydrological model that considers the special hydrological process in the alpine mountain area of an inland river basin. The CBHM was derived from a distributed runoff model [34] and its updated version, the distributed water-heat coupled model [35]. In version 1, the glacier and snowmelt runoff was estimated, with the simple degree-day method [27]. In the DWHC, Chen et al. [35] added a permafrost hydrology model, and described the model structure and basic equations, and the model calibration results using the data measured at meteorological stations [36], together with Mesoscale Model version 5 (MM5) outputs [37]. On the basis of the model base and 10 years of field observations of water balance and cryospheric hydrology in the WCRC, Chen et al. [27] created a new cryospheric basin hydrological model (CBHM) to evaluate the effects of cryospheric changes on streamflow from the UHR. The CBHM uses the digital elevation model (DEM) grid unit as the minimum calculation unit, and the spatial resolution is 1 × 1 km. The spatial resolution is one month. The major model components consist of solid and liquid precipitation separation and correction, canopy interception, glacier melting runoff, snow cover melt runoff, water-heat coupled processes in frozen soil, estimation of ET, infiltration model, runoff generation, and flow concentration. The principles and formulae of these models are shown in detail in [27].
2.2.2. Data Sources
In the CBHM, the input meteorological data, including precipitation, air temperature, and potential evaporation were obtained mainly from the Hydrographic Yearbook of the People’s Republic of China, published by the Hydrographic Bureau of the Ministry of Water Resources of the People’s Republic of China. Some data from the Hulu watershed were downloaded from the Cold and Arid Region Scientific Data Center (CARSDC, 2020). The digital elevation models (DEM), permafrost area, vegetation, and land cover/use data were downloaded from CARSDC. The glacier data were obtained from the first [38] and second Chinese glacier inventories [4]. The layered soil characteristics were obtained from the Water Resources Bureau of the Shiyang River Basin and by experiment in the field and laboratory. Data for service function evaluation research came from the Gansu Provincial Department of Water Resources.
2.3. Model Calibrations and Validation
2.3.1. Precipitation Validation
Precipitation is the most important input for watershed hydrology simulation. According to the precipitation data from multiple stations around or in the basin, a multiple regression equation is used to establish the statistical relationship between monthly precipitation and longitude, latitude, and altitude as follows:
where P is monthly precipitation (mm); xa is albers projection x coordinate; ya is albers projection y coordinate; z is altitude; and a, b, c, d, e, f, g are regression parameters. We used data from 12 meteorological stations (Figure 2) of the China Meteorological Administration to calculate precipitation from 1961 to 2016 in the study basin. There are ten precipitation stations (Shagousi, Jiutiaoling, Maozangsi, Huangniangniangtai, Zamusi, Kongjiazhuang, Shajintai, Wushaoling, Gulang, and Hengliang) within the Shiyang River Basin. The altitude of these stations ranges from 2010 to 3045 m. Because there is no precipitation station in the high-altitude area of the Shiyang River Basin, two sites (Hulu-1, Hulu-6) in the Hulugou watershed were added as supplements, 110 km west of the Shiyang River Basin. The altitudes of these two sites are 2980 and 4484 m, respectively. The precipitation data from six stations (Xidahe Reservoir, Dongtan, Xiasi, Shanggechagou, Motaizi and Toudaogou, in Figure 2) were used for validation.
2.3.2. Evapotranspiration Validation
Evapotranspiration (ET) is an important part of watershed water balance. In the CBHM, total ET includes vegetation transpiration, soil evaporation, canopy interception evaporation, and snow evaporation or sublimation. Due to lack of sufficient actual ET observation data in the Shiyang River, we used MOD16/ET monthly product data to verify the simulated ET results. MOD16 products are produced by the Numerical Terradynamic Simulation Group (NTSG) of the University of Montana, Missoula [39]. In this study, monthly scale MOD16/ET data with a spatial resolution of 0.05° grid was used (Get URL: http://files.ntsg.umt.edu/data/NTSG_Products/MOD16/).
2.3.3. Snow Cover Validation
In the CBHM, the snow cover area is the monthly snowfall area. We used Moderate Resolution Imaging Spectroradiometer (MODIS) snow cover product to verify the simulation results. The product name is MODIS Snow Cover Monthly L3 Global 0.05 Deg CMG, and it is a dataset that reports monthly average snow cover, in 0.05 degree (approximately 5 km) resolution climate modeling grid (CMG) cells. Monthly averages for each CMG cell are calculated from the corresponding 28–31 days of observations in the MOD10C1 daily maximum snow cover extent dataset.
2.3.4. Glacier Validation
The glacier module simulated glacial meltwater, glacier depth, volume, and area. Through visual interpretation of landsat satellite remote sensing images, we obtained some glacial area data of the Shiyang River Basin. The model was validated by comparing the output glacier area of the model with the remote sensing observations.
2.3.5. Runoff Validation
The mean monthly runoff was simulated from 1961 to 2016 in the Shiyang River Basin. Some river basins were simulated from the established year of the hydrological station. Data for the first 20 years were used for CBHM calibration, and data in the latter part were used for validation. The revised Nash–Sutcliffe coefficient (NSE) [34,40] and the balance error B [41] were used to evaluate the simulation accuracy [27] as:
where Qi,obs and Qi,sim are the observed and simulated monthly average runoff in month i, respectively. A model is more efficient when NSE is close to one and B is close to zero [41].
2.4. Evaluation of Cryosphere Water Resources Service Function
The most direct and important service function of cryosphere water resources is the water supply function. The most important point of the research is the function of the water resources provided by the cryosphere for the human social system in peoples’ lives, as well as production and maintenance of the arid zone oasis ecosystem.
Water supply refers to the amount of water provided to users by various water conservancy projects. According to the type of water use, the water supply can be divided into the following four parts: agricultural irrigation, industrial production, urban and rural life, and ecological environment. According to the type of engineering, the water supply is divided into reservoir engineering, cellar engineering, diversion sluice engineering, and water intake pumping station engineering. The runoff studied, in this paper, refers to the water supply of reservoir engineering. First, we allocate the annual runoff to each county, according to the water supply of the reservoir engineering in each county. Then, the water resources are redistributed according to the type of water use. Finally, we combined the water of each county with economic data to evaluate the value of cryosphere water resources.
CBHM output results, the total annual runoff, snowmelt water runoff, and glacier meltwater runoff of each small watershed, are used as input to the cryosphere water resources service evaluation model.
The formula for calculating the value of cryosphere water resources is as follows:
where V is cryosphere water service value and Va, Vi, Vd, Ve are, respectively, the service value of cryosphere water resources as agricultural water, industrial water, drinking water, and ecological water. The formula of these four parts is as follows:
Agricultural service value
where GDPa is the regional GDP of primary industry, Wa is agricultural irrigation water, W is water supply of water conservancy projects, r is the water supply distribution ratio of reservoir engineering in each county, and Ri is the annual runoff of each river.
Industrial service value
where GDPi is regional GDP of secondary industry and Wi is the industrial production water supply.
Life service value
where Pw is residential water price and Wd is the urban and rural domestic water.
Ecological service value
where Pe is ecological service value of 1 m3 water and We is ecological water.
3. Results
3.1. Validation
In order to determine the usability of the CBHM, some output results of the model were verified. The combined graphs below show a comparison of the output of precipitation, evapotranspiration, snow area, and glacier area with the results of measured or remote sensing data.
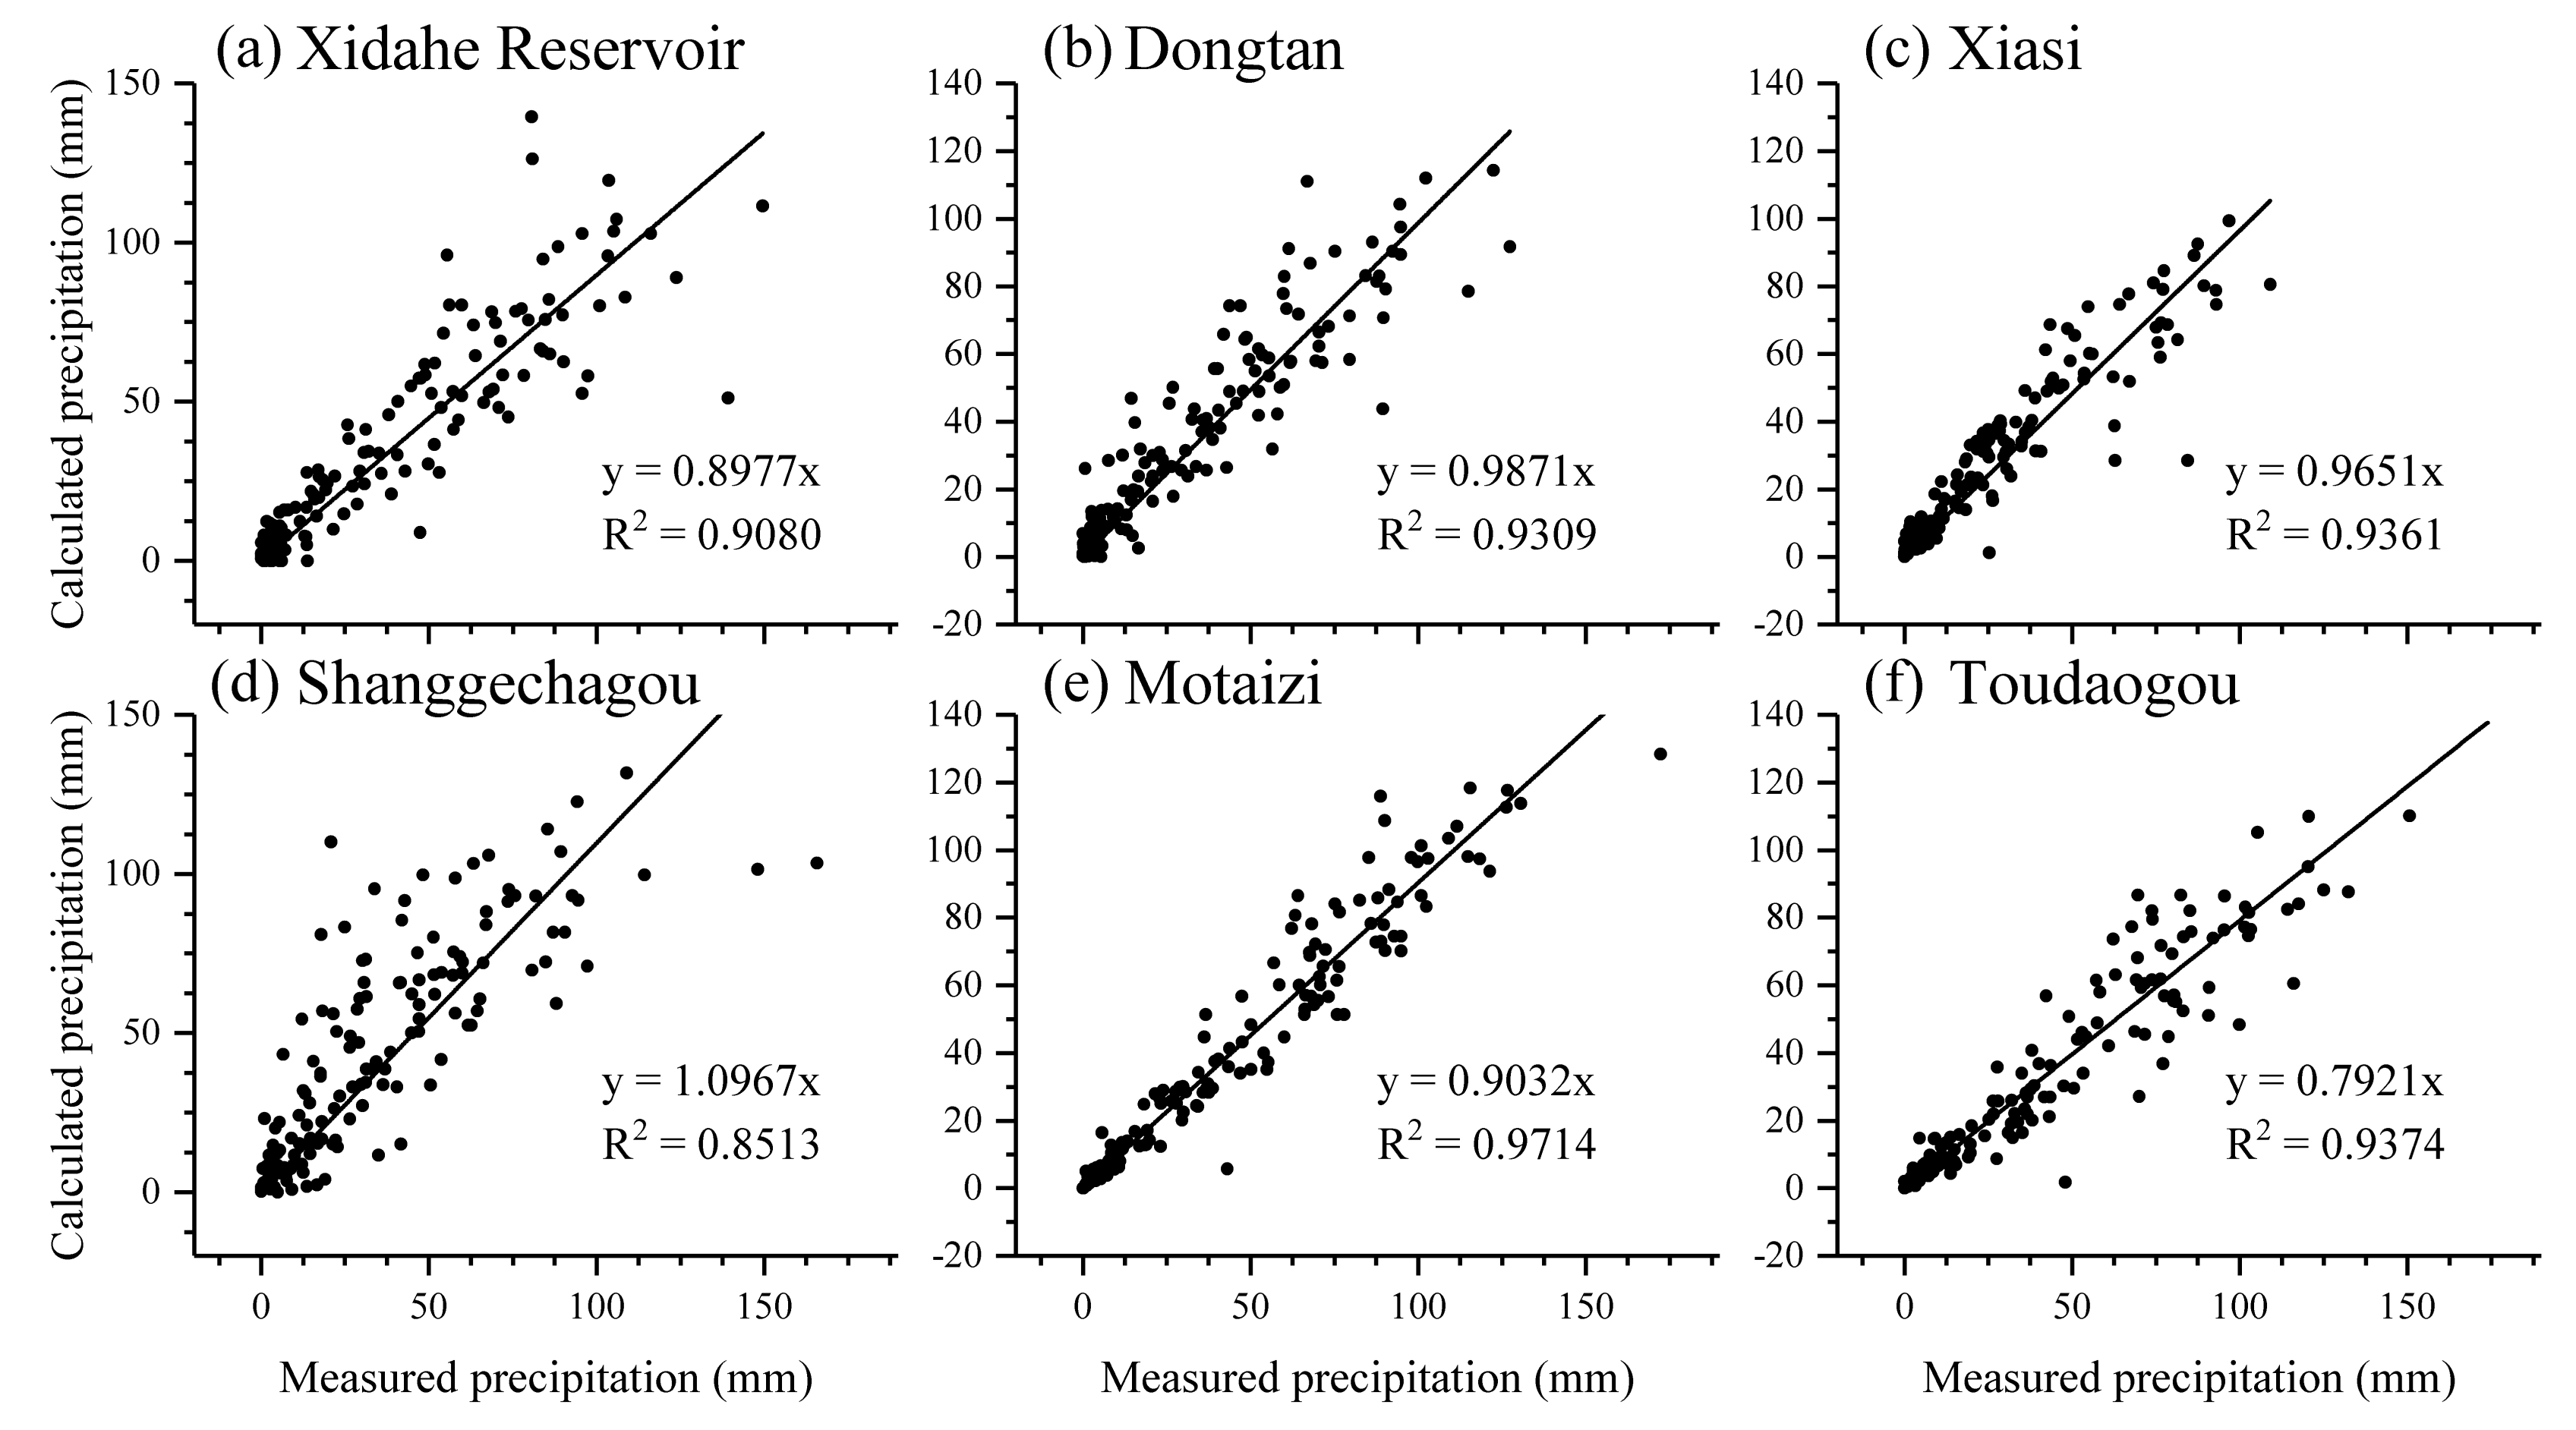
In Figure 3, the monthly precipitation validation results of six precipitation station in Shiyang River Basin from 2002 to 2016 are compared. The data for 2003 and 2011 are not shown due to lack of data. Six verification stations are evenly distributed in the Shiyang River Basin from west to east (Figure 2). The simulated monthly precipitation and the observation values of the rainfall stations are expressed in the form of a scatter diagram and a linear correlation analysis of the simulated and observed values. The results show that the correlation coefficient between precipitation calculation results and measured values is significant. The correlation coefficients between simulated and observed values at five stations are all higher than 0.9. The precipitation simulation results at station Shanggechagou are relatively poor (R2 = 0.851).
Figure 4 presents the change curve of CBHM calculated monthly ET and MOD16/ET monthly product data of three rivers in the Shiyang River Basin from 2000 to 2015. The simulated evapotranspiration in three watersheds is basically consistent with the change trend of remote sensing data results. Closer inspection of the figure shows the model calculated ET is generally higher than the remote sensing value in the summer. On the contrary, the CBHM results are lower than the MOD16/ET data in the winter.
Figure 5 shows the comparison of the snow area simulated by the model with the remote sensing snow area data from MODIS. From 2000 to 2010, the simulated snow area results are closer to the MODIS results of seven rivers in the Shiyang River Basin. The snow area change curve shows a bimodal change. The two peaks occur in December and March with January as the boundary. It is obvious that, as compared with the MODIS snow area results, the simulated snow area of the model is lower in December and higher in March. The MODIS dataset reports monthly average snow cover in 0.05 degree (approximately 5 km) resolution climate modeling grid (CMG) cells. Monthly averages are computed from daily snow cover observations in the MODIS/Terra Snow Cover Daily L3 Global 0.05 Deg CMG (MOD10C1) dataset. The snow area we output is based on the degree-day factor model based on monthly average temperature. Therefore, there are some differences between the two results.
This is the most recent version of these data to test the simulation results of the glacier model. We used glacier area as analytical content (Figure 6). The glacier area, simulated by the model, fits well with the visual interpretation results of remote sensing images (R2 = 0.993).
Overall, these results indicate that the input data and output results of the model are reasonable.
3.2. Monthly Streamflow
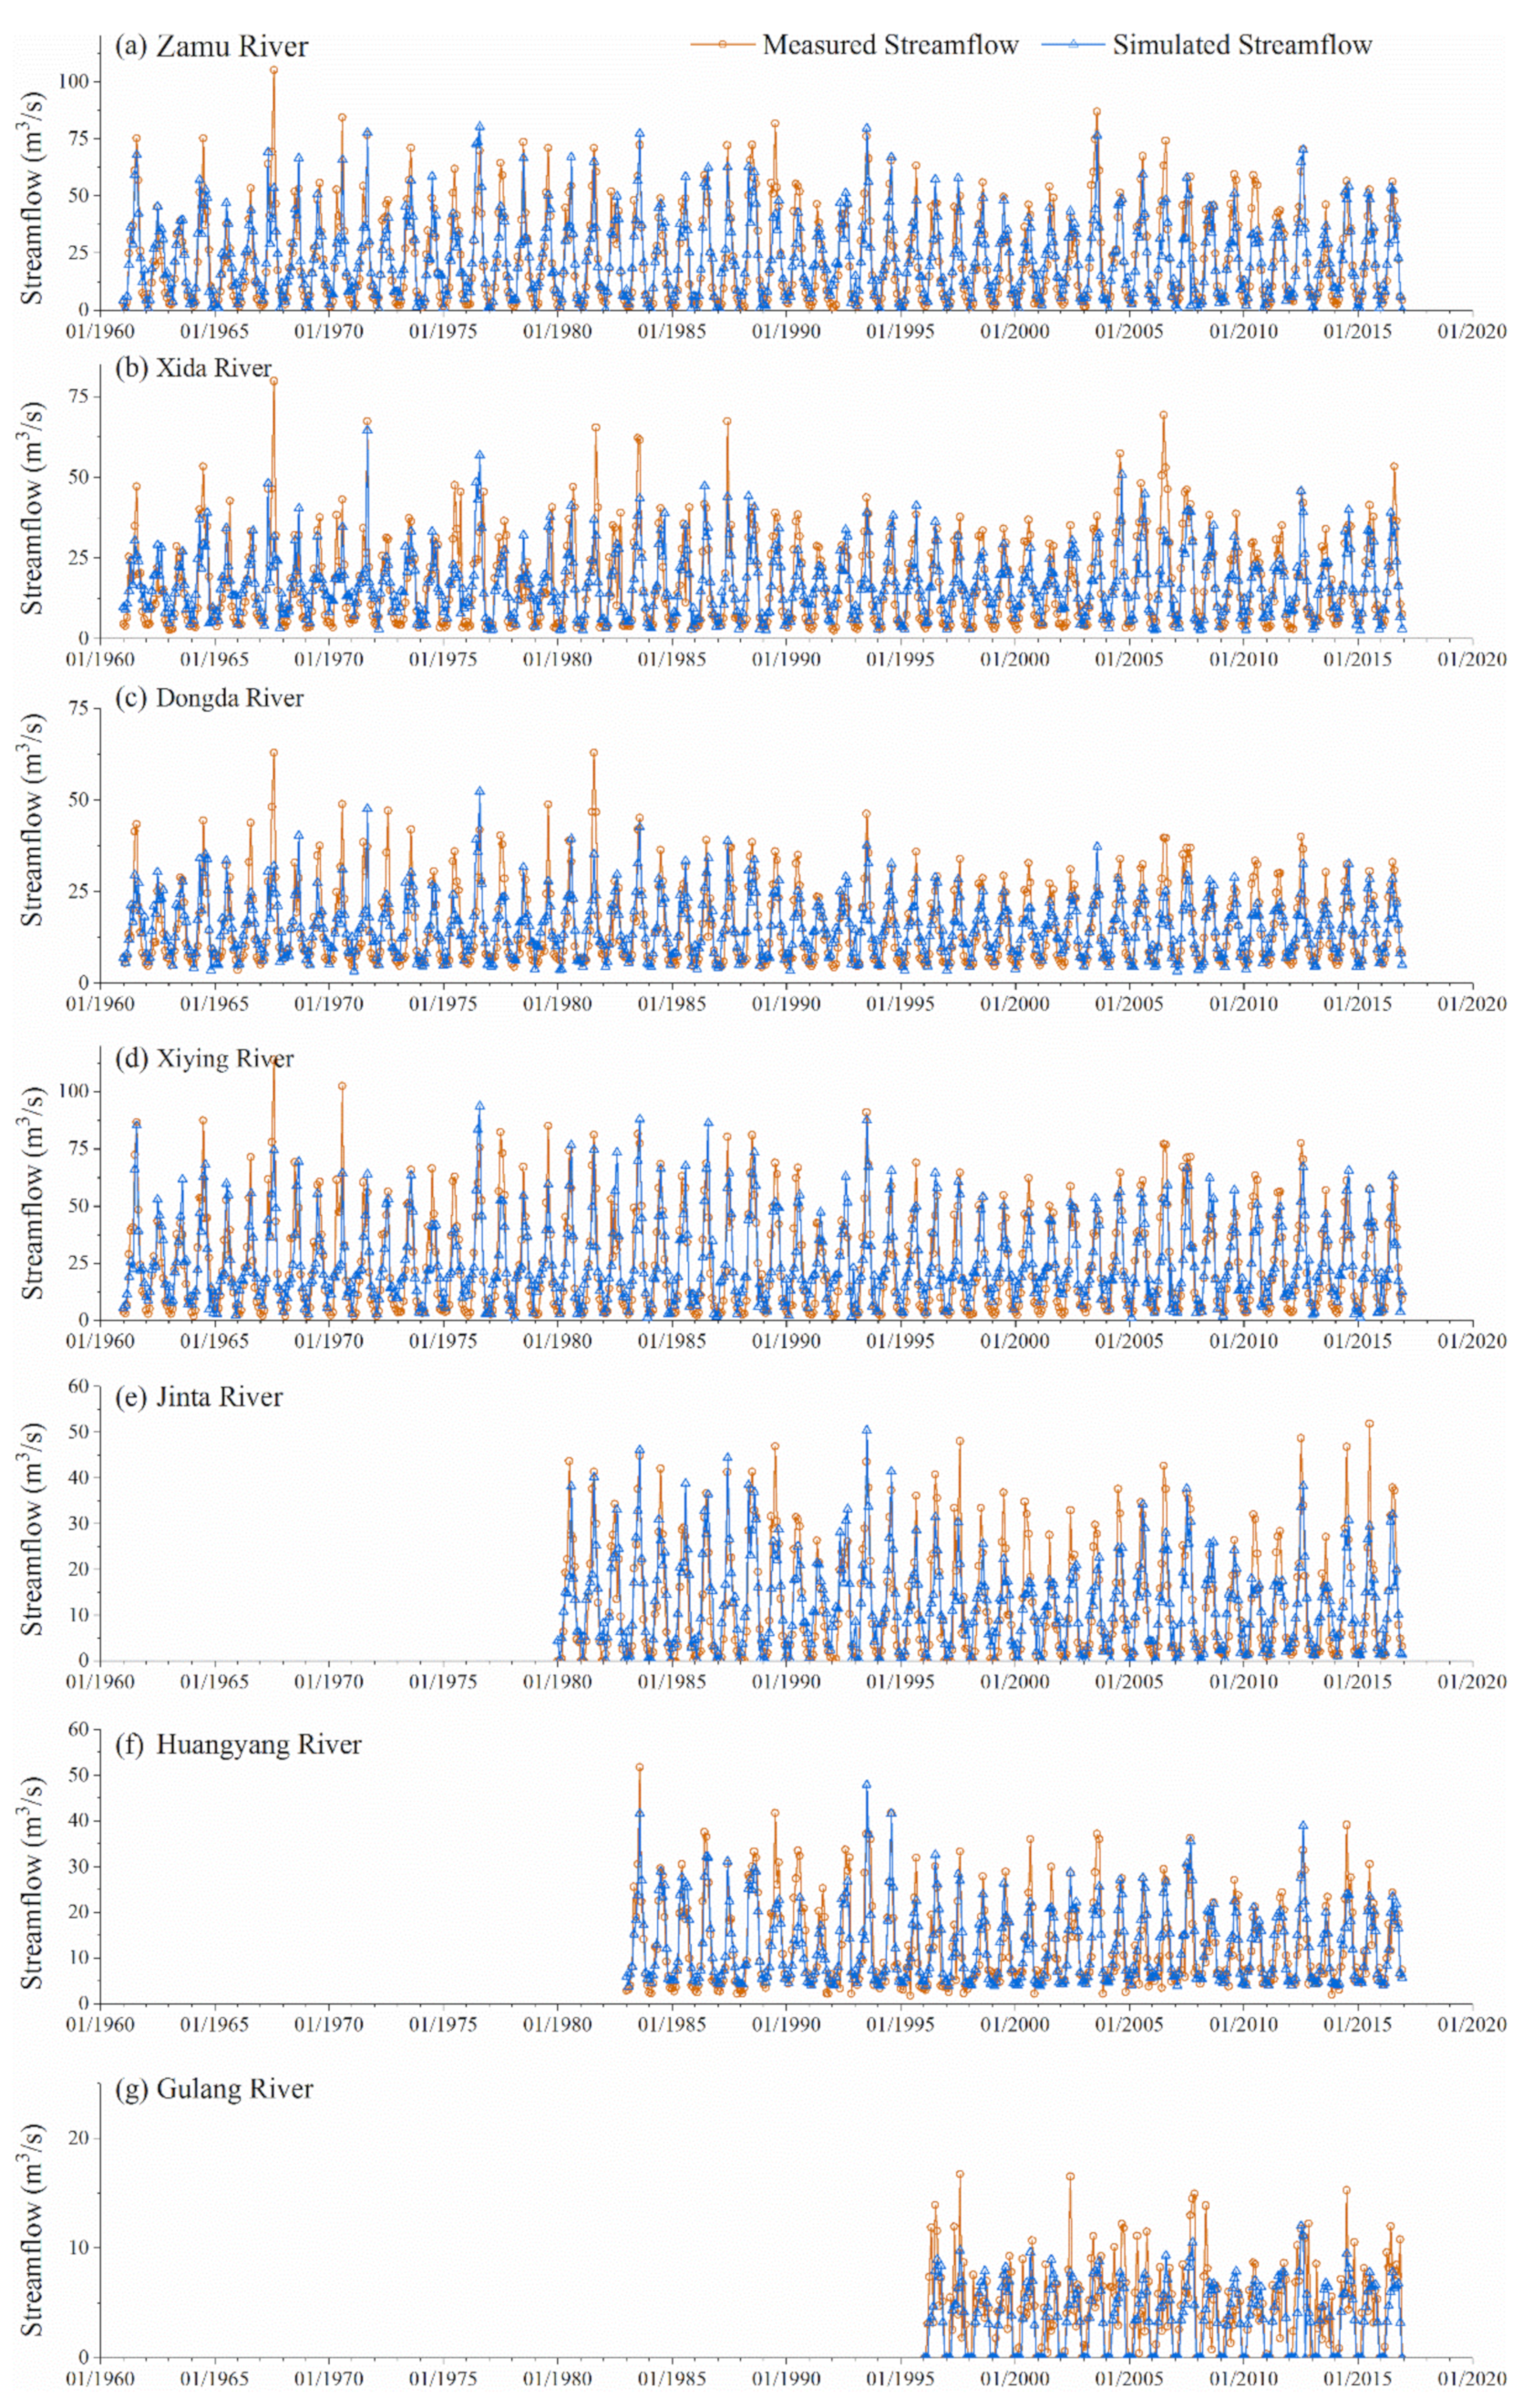
Figure 7 shows the CBHM-simulated monthly streamflows at seven watersheds of the Shiyang River Basin as compared with the observed data.
The simulation period of monthly flow in the four catchments (Zamu River, Xiying River, Dongda River, and Xida River) is from 1961 to 2016. The flow simulation of the Jinta River (1980) and Huangyang River (1983) catchment started when the hydrological station was built. Due to lack of data, the simulation period of the Gulang River catchment is from 1996 to 2016. Because there is no flow data for the Dajing River catchment, no simulation is conducted. The CBHM-simulated monthly discharges matched well with the measured discharges in the Shiyang River Basin. Table 2 below provides the revised NSE and balance error B of the seven catchments. The monthly flow simulation results of the Zamusi watershed are the best. The worst simulation results of the monthly flow are in the Gulang watershed.
3.3. Water Balances
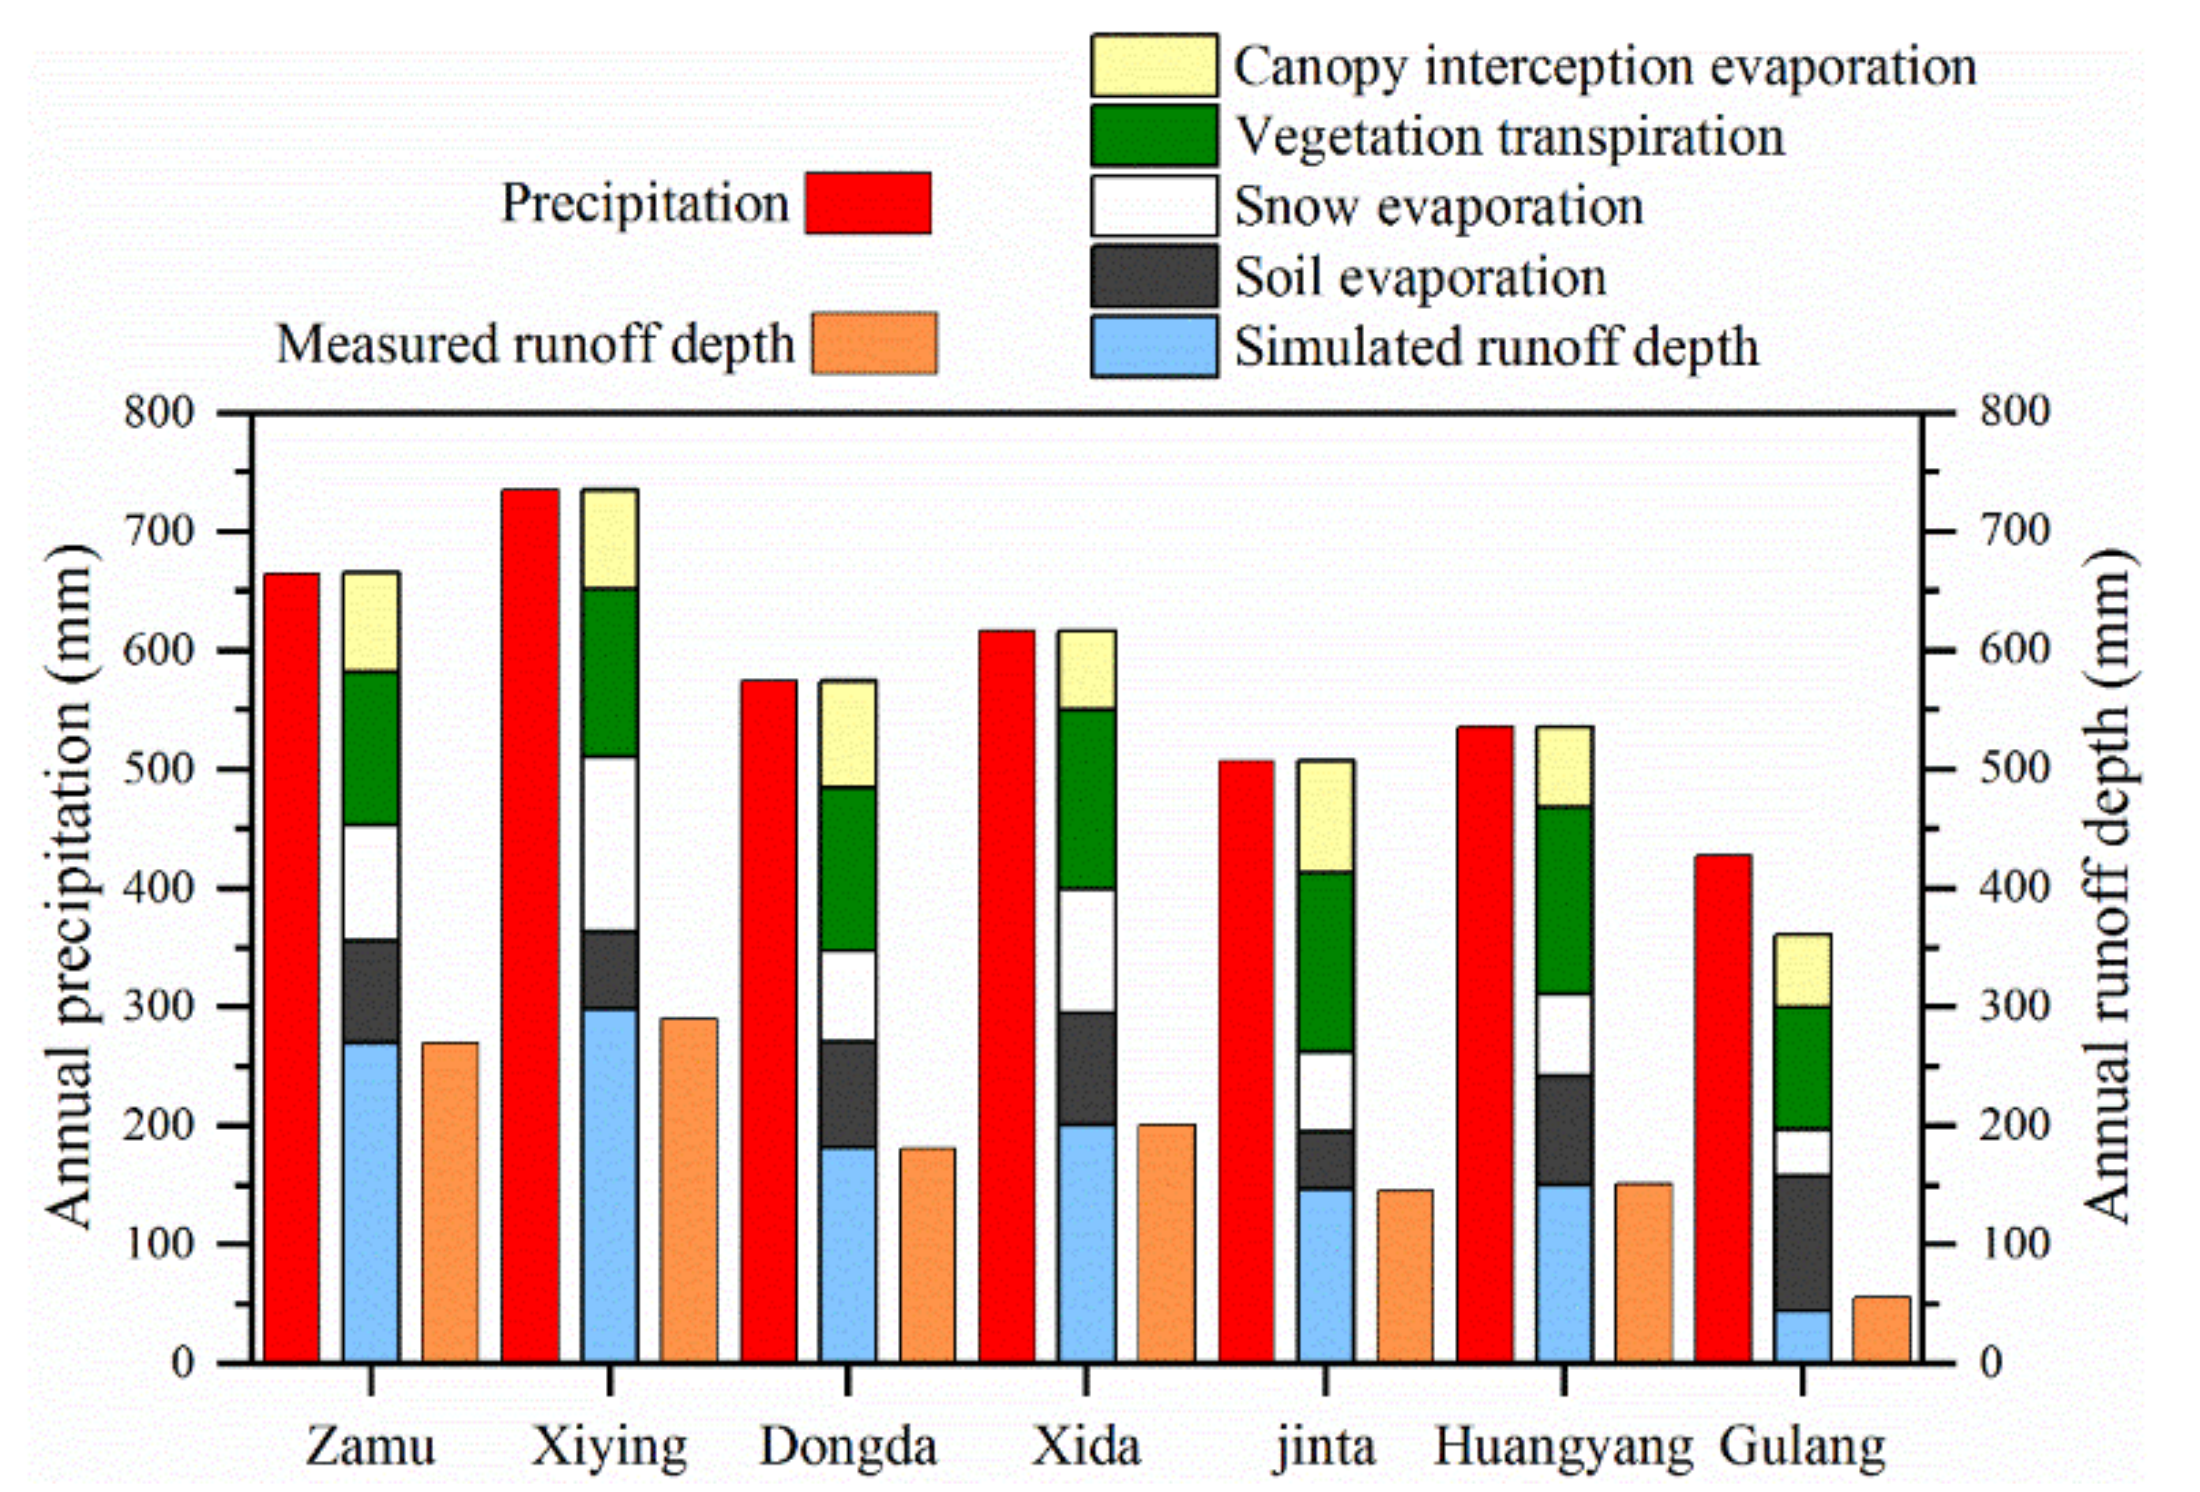
The bar chart below (Figure 8) shows the average annual water balance in the simulation period of seven watersheds in the Shiyang River Basin. Except for the Gulang River Basin, the annual precipitation, total evaporation, and the runoff of the other six river basins, meet the water balance. The simulated and measured annual average runoff depth is almost the same.
3.4. The Impact of Climate Change on Water Resources
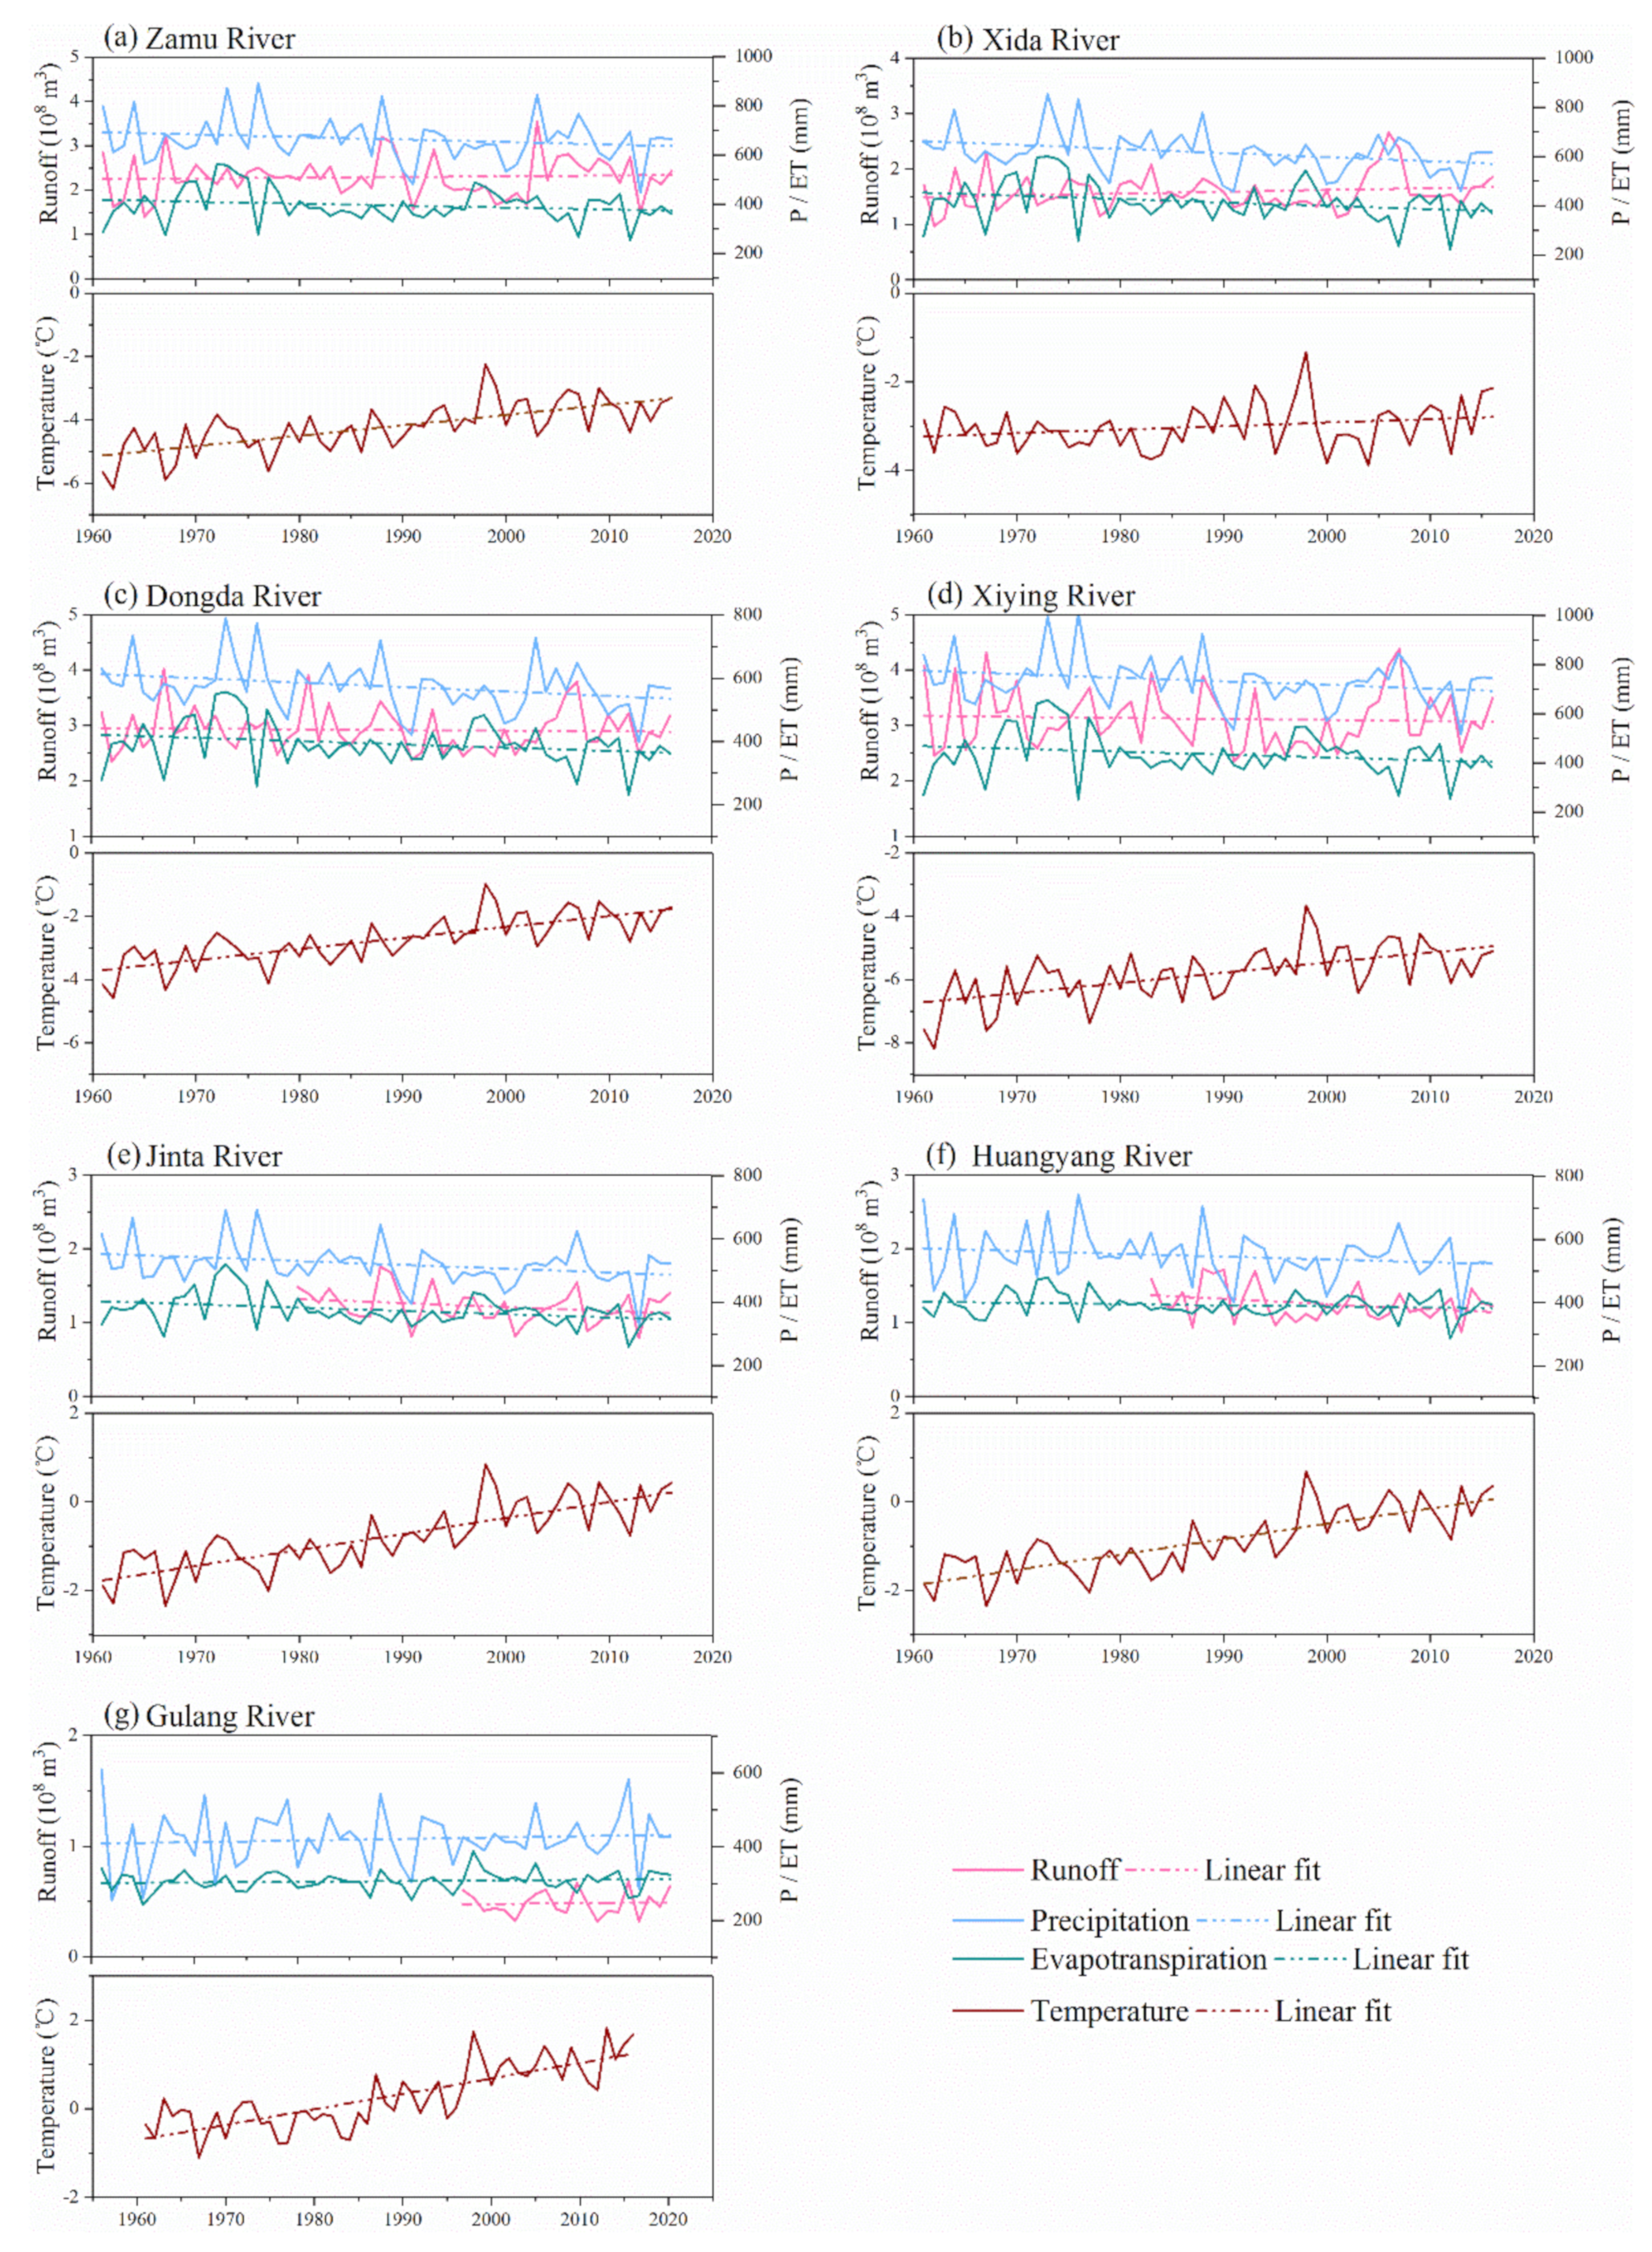
To analyze the impact of climate change in the Shiyang River Basin on mountain runoff, we calculated the average annual temperature, precipitation, ET, and annual average runoff of each small catchment (Figure 9) and a linear fitting was performed. From the graphs, we can see that the monthly average temperature in the Shiyang River runoff generation area has increased significantly since 1961. Except for the Gulang River Basin, the average annual precipitation in the other six basins has decreased, and annual evapotranspiration showed a downward trend. The annual runoff of each river basin had no obvious increase or decrease trend from 1961 to 2016.
In order to clarify the changes in temperature, precipitation, ET, and runoff, we carried out statistics on each element and tested the significance of their linear fitting equations. Table 3 illustrates the average and change rate of temperature during the simulation period in each small basin of the Shiyang River. Except for the Xida River Basin, the average annual temperature of the other six basins increased significantly (p < 0.05). The Aaerage temperature change rate of the seven basins was 0.3 °C/10 years. The average annual precipitation in the alpine watershed of the Shiyang River Basin was 582.6 mm; the annual precipitation in four watersheds (Xiying, Dongda, Xida, and Jinta River) had decreased significantly, and their linear equations were statistically significant. The average ET of each basin was 387.6 mm; the annual average ET of only three watersheds (Dongda, Xida, and Jinta River) showed a significant downward trend, while the changes in the other four watersheds were not significant. For runoff, the linear fitting equation of annual runoff in most watersheds was not statistically significant. Only the annual runoff of the Huangyang River Basin showed a significant downward trend (p < 0.1) from 1983 to 2016.
3.5. Annual Variation of Glacier and Snowmelt Runoff
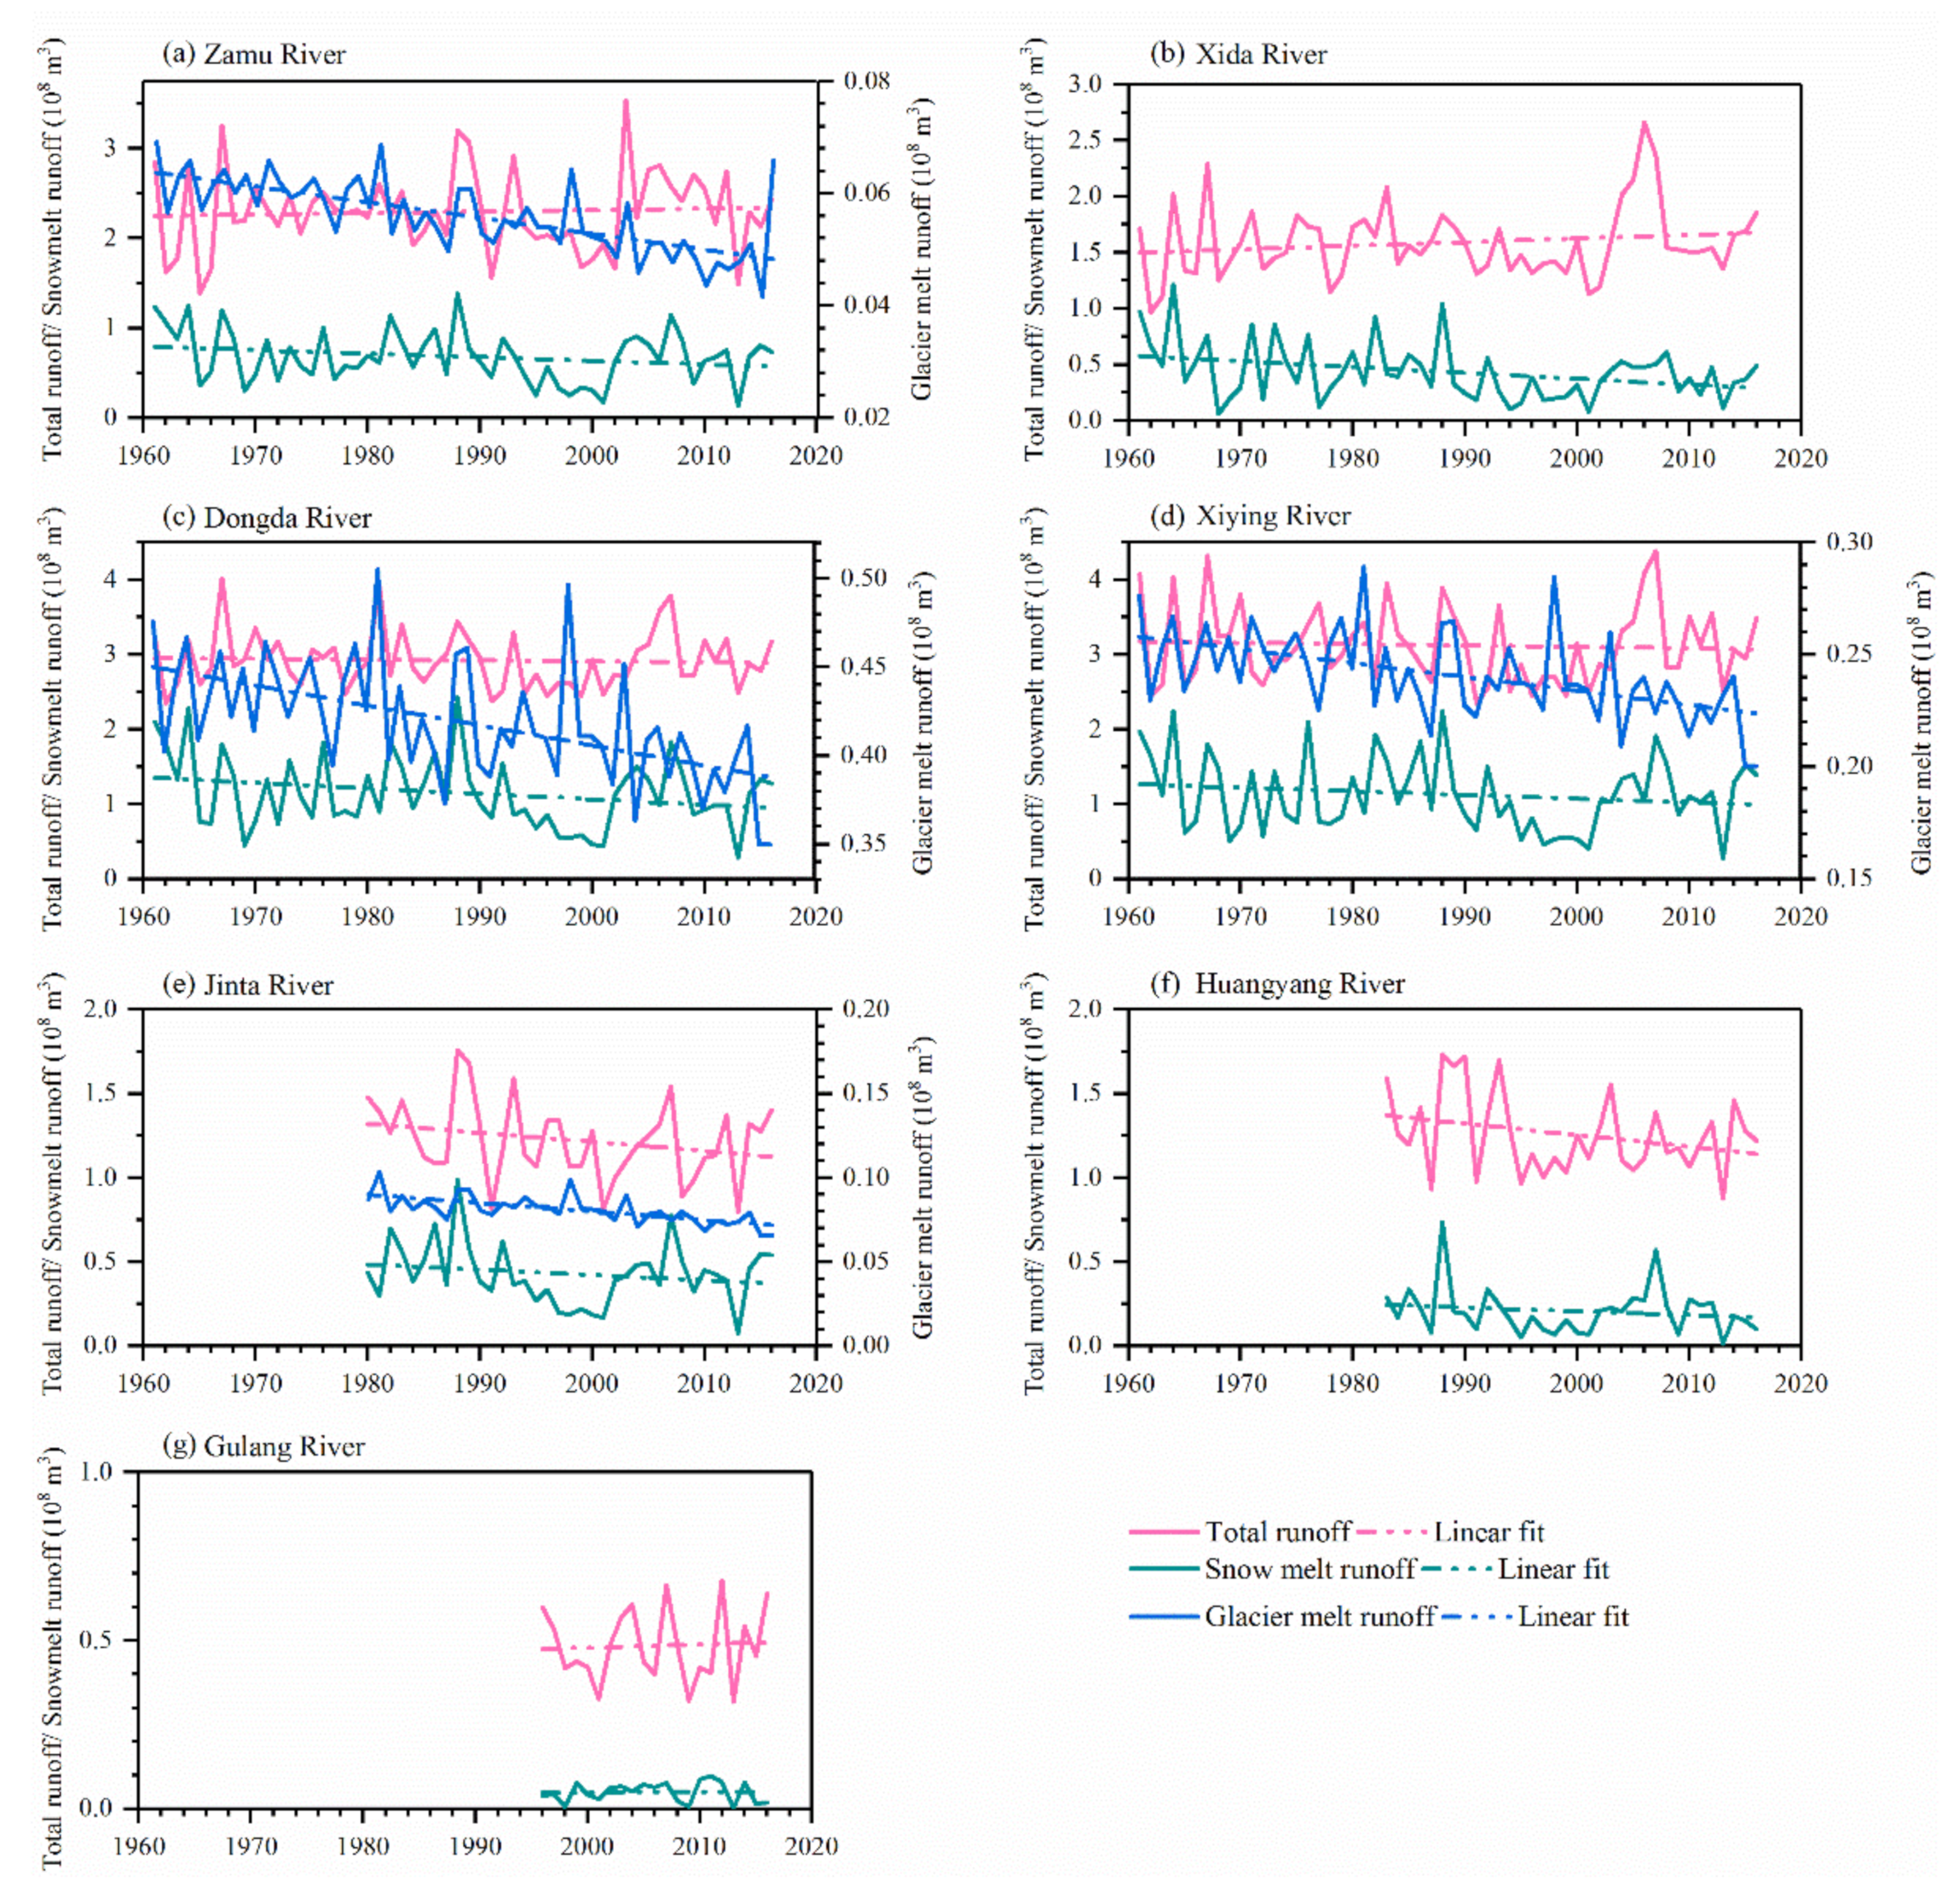
Glacier and snowmelt water are important supplies of runoff for inland rivers. Four tributaries have glaciers in the SRB, comprising the Zamu River Basin, Jinta River Basin, Xiying River Basin, and Dongda River Basin (Figure 10). The annual glacial meltwater in these four basins showed a significant decreasing trend (p < 0.05) from 1961 to 2016. The declining rate value of glacial meltwater in these four rivers from large to small is as follows: Dongda (0.011) > Xiying (0.006) > Jinta (0.005) > Zamu (0.003). It is notable from the data that the further west the river, the faster its glaciers’ meltwater decrease. In the Zamu River, the Dongda River, and the Xida River Basin, the annual snowmelt runoff showed a significant decreasing trend from 1961 to 2016. In the other four watersheds, there was no significant change in the annual snowmelt runoff.
Table 4 presents the summary statistics for annual average runoff and replenishment of glaciers and snow in the SRB. The sum of the average annual runoff of the seven rivers is 14.73 × 10⁸ m3. The total snowmelt of the seven rivers accounts for 31.83% of the total runoff. There are four rivers having glacial meltwater supply. The total average annual glacial meltwater supply is 0.80 × 10⁸ m3, which accounts for 5.41% of the total runoff of the seven rivers.
3.6. Evaluation of Cryosphere Water Resources Service Function
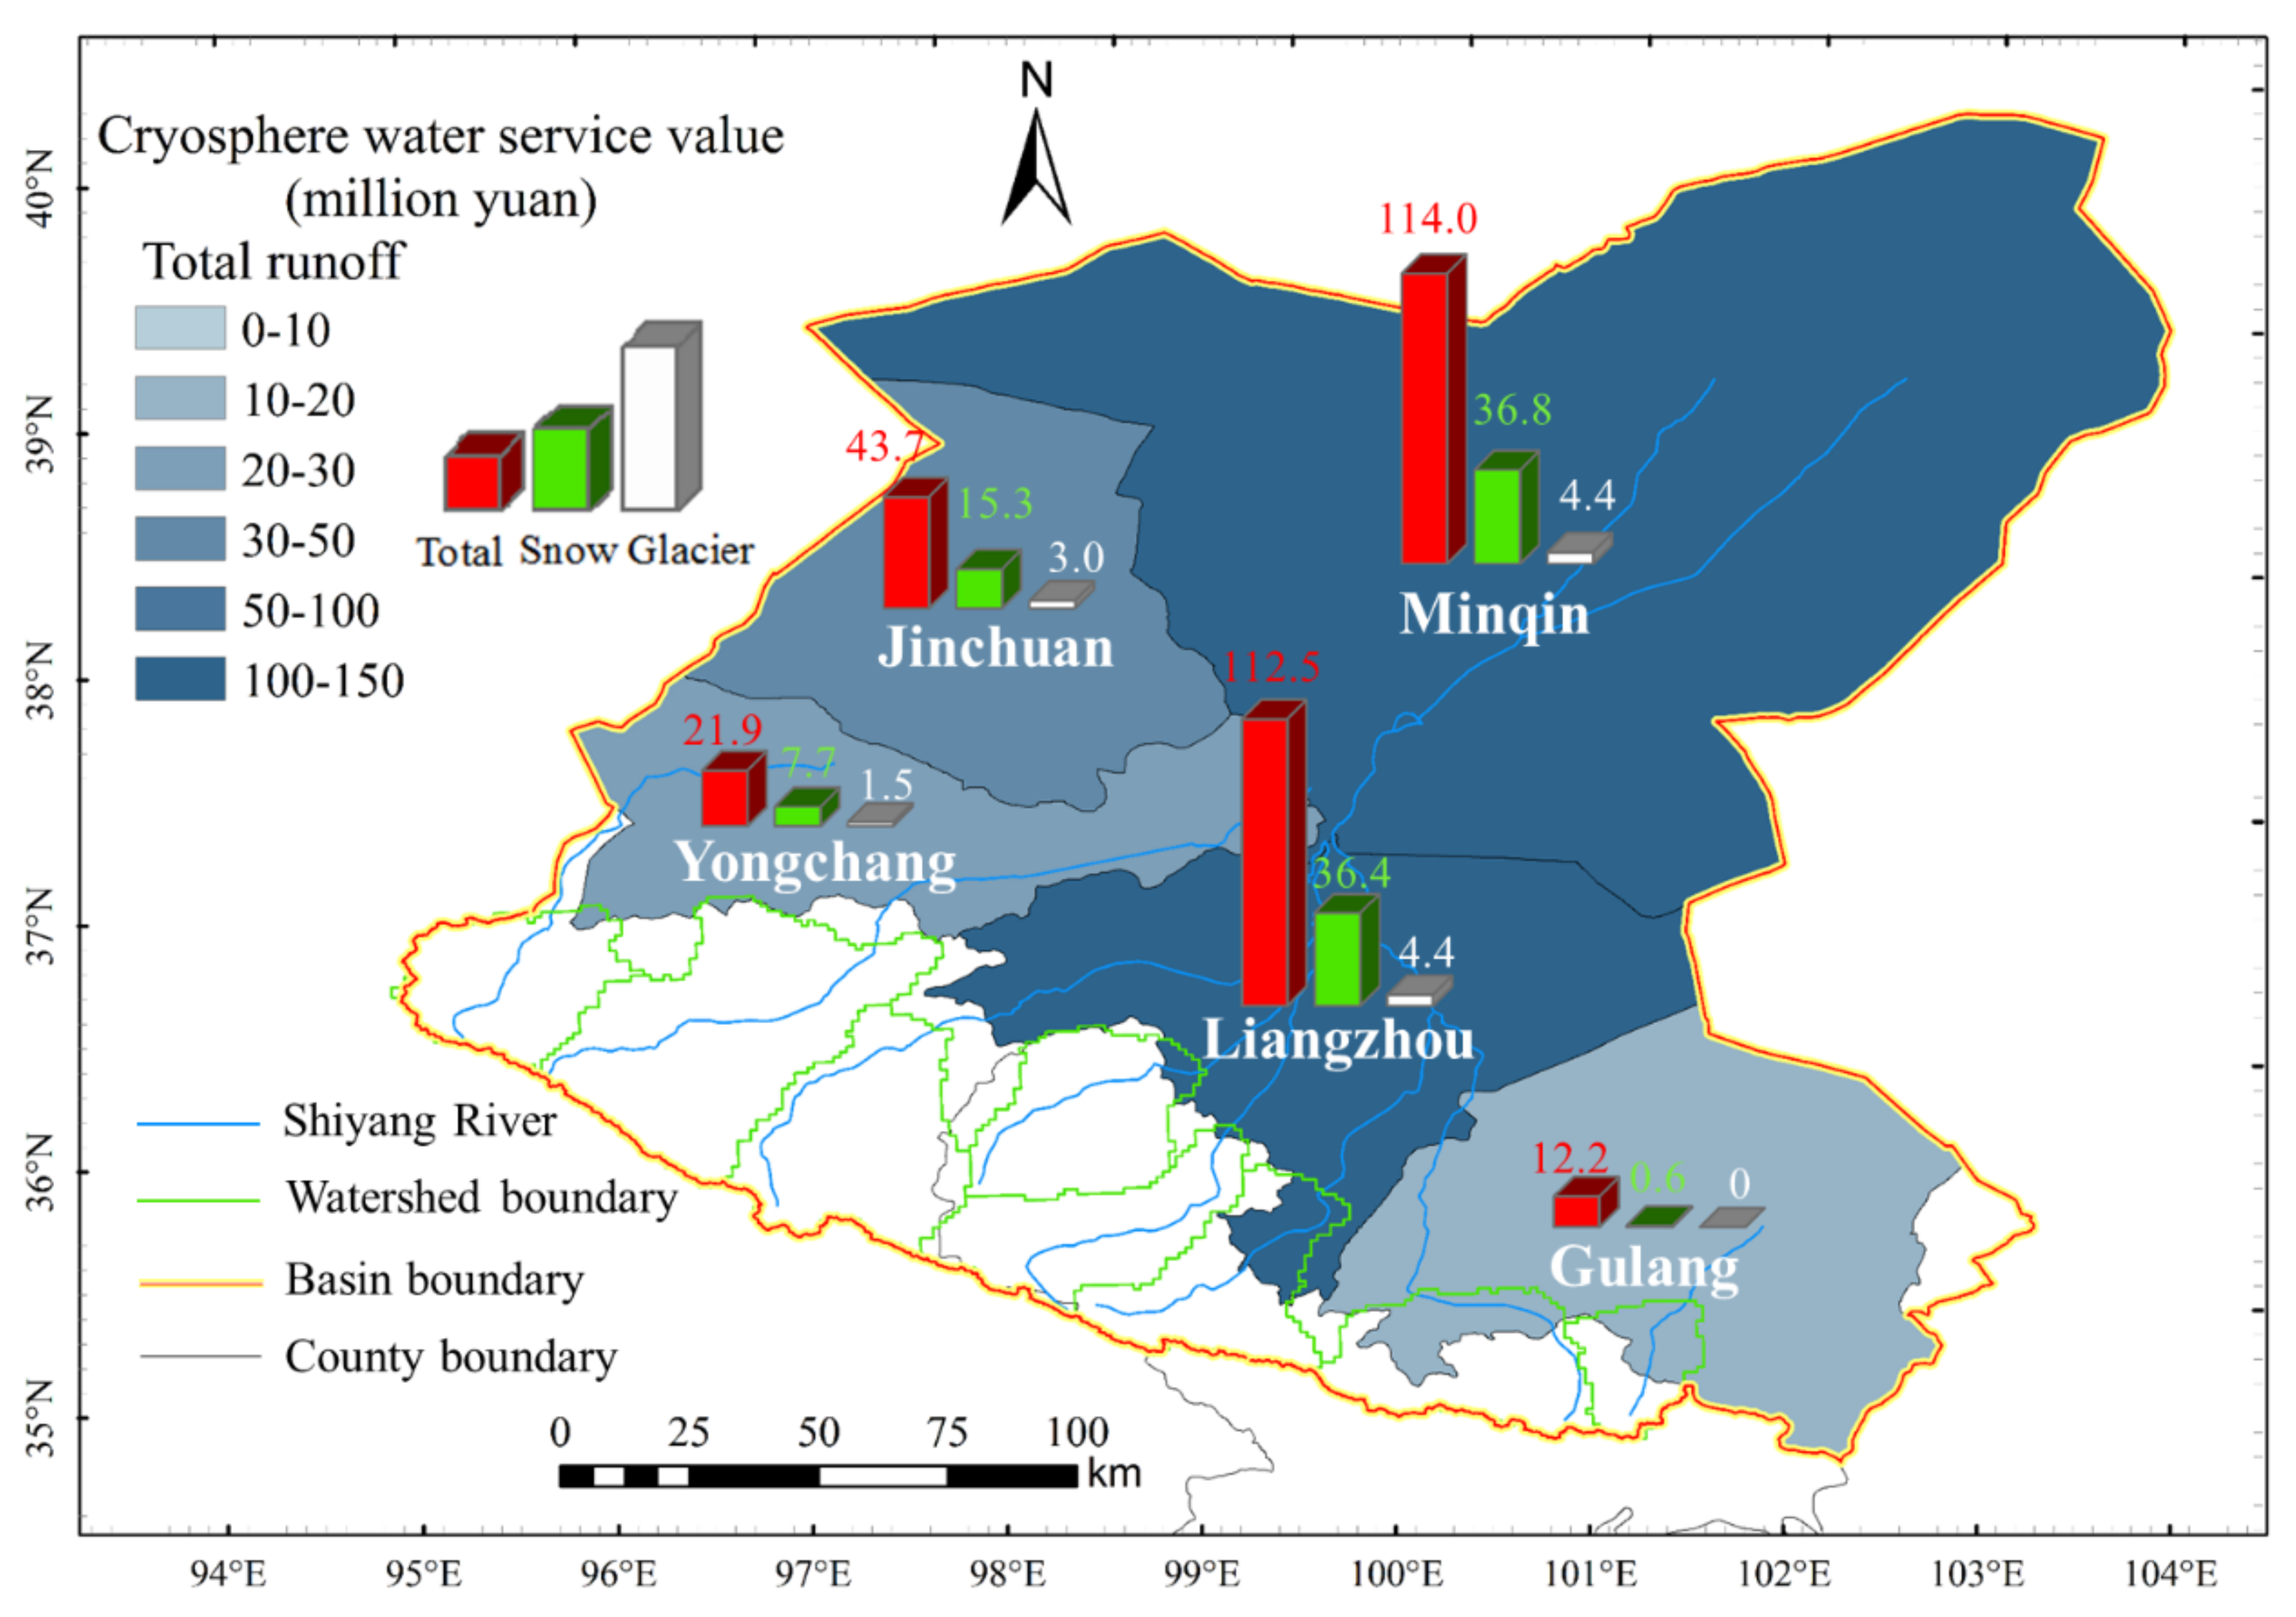
With the global warming trend, the variance of mountainous runoff imposes the direct and decisive impact on the downstream zone socioeconomic development and ecological environment shield. We got the annual cryosphere water resources through the model. To evaluate the service value of cryosphere water resources in the Shiyang River Basin, we used the 2016 Shiyang River Basin cryosphere water resources as input. Then, we combined the economic data of the counties in the Shiyang River Basin. Finally, through the calculation of the cryosphere water resources service evaluation model, we assessed the current value of cryosphere water resources services in the Shiyang River Basin. Figure 11 clearly shows the service value of cryosphere water resources in each county of the Shiyang River Basin. In addition, the service value of snowmelt water and glacier meltwater service values are displayed in the form of a bar graph in each county. Cryosphere water resources services show a higher value in Liangzhou and Minqin. Cryosphere water resources service has the lowest service value in Gulang County, and there is no glacier meltwater service. The service value of cryosphere water resources in the entire basin is 304.2 million yuan, in which the service value of snowmelt water is 96.8 and the service value of glacier meltwater is 13.4, and their respective proportions are 31.8% and 4.4%.
4. Discussion
We used CBHM to simulate the water resources of seven rivers in the Shiyang River Basin from 1961 to 2016. First, we analyzed the climate changes in the alpine runoff-producing area of the Shiyang River Basin in the past 56 years and the response of water resources in the basin. In particular, the replenishment of glacial meltwater and snowmelt water from seven rivers in the upper Shiyang River Basin to runoff was calculated. Finally, we evaluated the current status of the cryosphere water resources service function of the Shiyang River, based on the cryosphere water resources output by the model.
4.1. Response of Water Resources to Climate Warming in the Runoff Generation Area of the Upper Shiyang River
Using temperature data from several weather stations in the Shiyang River Basin, a multiple regression equation of temperature, latitude, longitude, and altitude was established to interpolate the temperature in the entire study area. We found that the average annual temperature in the mountainous area of the upper Shiyang River showed an upward trend from 1961 to 2016, and the rate of change was 0.3 °C/10 yaer. Wang (2007a) found that, from 1960 to 2005, the average temperature of the overall Shiyang River Basin increased at the rate of 0.32 °C/10 years, especially with the abrupt change in 1994. The temperature change in the upper mountainous area of the Shiyang River was consistent with the temperature change in the entire Shiyang River Basin.
For precipitation, the relationship between precipitation at meteorological stations and latitude, longitude, and altitude was also used in this study for spatial interpolation. We also verified the interpolation of precipitation (Figure 3a). The Shiyang River Basin spans three climatic zones from south to north, which includes the southern cold semi-arid and semi-humid zone at the highland of Qilian Mountain (altitude 2000–5000 m) with an annual precipitation of 300–600 mm [42]. Our research found that the average annual precipitation in the seven small watersheds in the upper mountainous area of the Shiyang River Basin ranged from 420.5 to 734.4 mm. The average precipitation in the seven watersheds was 582.6 mm. Precipitation in the upper reaches of the Shiyang River showed a decreasing trend from 1961 to 2016. Wang et al. [43] found that the annual precipitation in the entire Shiyang River Basin increased from 1960 to 2005, but the precipitation in the upper reaches of the Shiyang River decreased. In the study of Wuwei, in the Shiyang River Basin, Huo et al. [44] found that precipitation showed a decreasing trend in the mountainous region but an increasing trend in the plain region (1950–2003). This phenomenon of decreasing precipitation in mountainous areas and increasing precipitation in front of the mountains is very interesting, and, so far, there is no reasonable explanation.
We used the CBHM to simulate the evapotranspiration in each small catchment of the Shiyang River Basin. The mountainous evapotranspiration in the upper reaches of the Shiyang River showed a decreasing trend from 1961 to 2016. The average ET of each catchment was 387.6 mm. Liu et al. [45] analyzed the long-term ET data (MOD16, version 5) from 2002 to 2012, and found that the annual ET gradually declined from southwest to northeast, with the highest values in the upper Qilian Mountain area in the south (>450 mm year−1), followed by the middle plain area (250–400 mm year−1) and the lower reaches (<250 mm year−1). We compared the simulation ET results with MOD16/ET monthly product data (Figure 3b). However, the simulation results were not particularly consistent with the MODIS product results. Compared with actual ET in the basin, MOD16/ET has the characteristics of overestimation in low value areas (<20 mm/month) and underestimation in high value areas (>20 mm/month) on the monthly scale, which makes the seasonal fluctuation range of ET compressed [46].
4.2. Replenishment of Glacial Meltwater and Snowmelt Water to Runoff in the Shiyang River Basin
Many previous studies have found that the annual runoff of the Shiyang River Basin was on the decline. All five stream flows in the upper reach of Wuwei in the Shiyang river exhibited a decreasing trend (1958–2003) [44]. The annual runoff from Zamu, Huangyang and Gulang rivers showed statistically significant decreasing trends (1958–2003) [47]. Ma et al. [19] found five out of the eight catchments had significant downward trends (1950–2005) in annual streamflow. However, our model found that the annual runoff of the Shiyang River Basin did not change significantly from 1961 to 2016. Previous scholars have concluded that the trend of total runoff decrease was because the six years, from 1955 to 1961, were high flow year. The average annual runoff of the river basin tends to alternate between high and low levels (Figure 12). The five years from 1962 to 1966 were low flow year and the 34 years, from 1967 to 1990, were the normal flow year. The runoff was relatively stable during this period. From 1991 to 2002, runoff was significantly lower than average. The five years, from 2003 to 2007, were high flow years.
Using the data of NOAA and MODIS from 1997 to 2006, Wang et al. [48] found that the snow area decreased from 1997 to 2001, and, in 2002–2004, it fluctuated from 1000 to 1700 km2. This period of time corresponded to the period when the runoff of the Shiyang River Basin was significantly reduced.
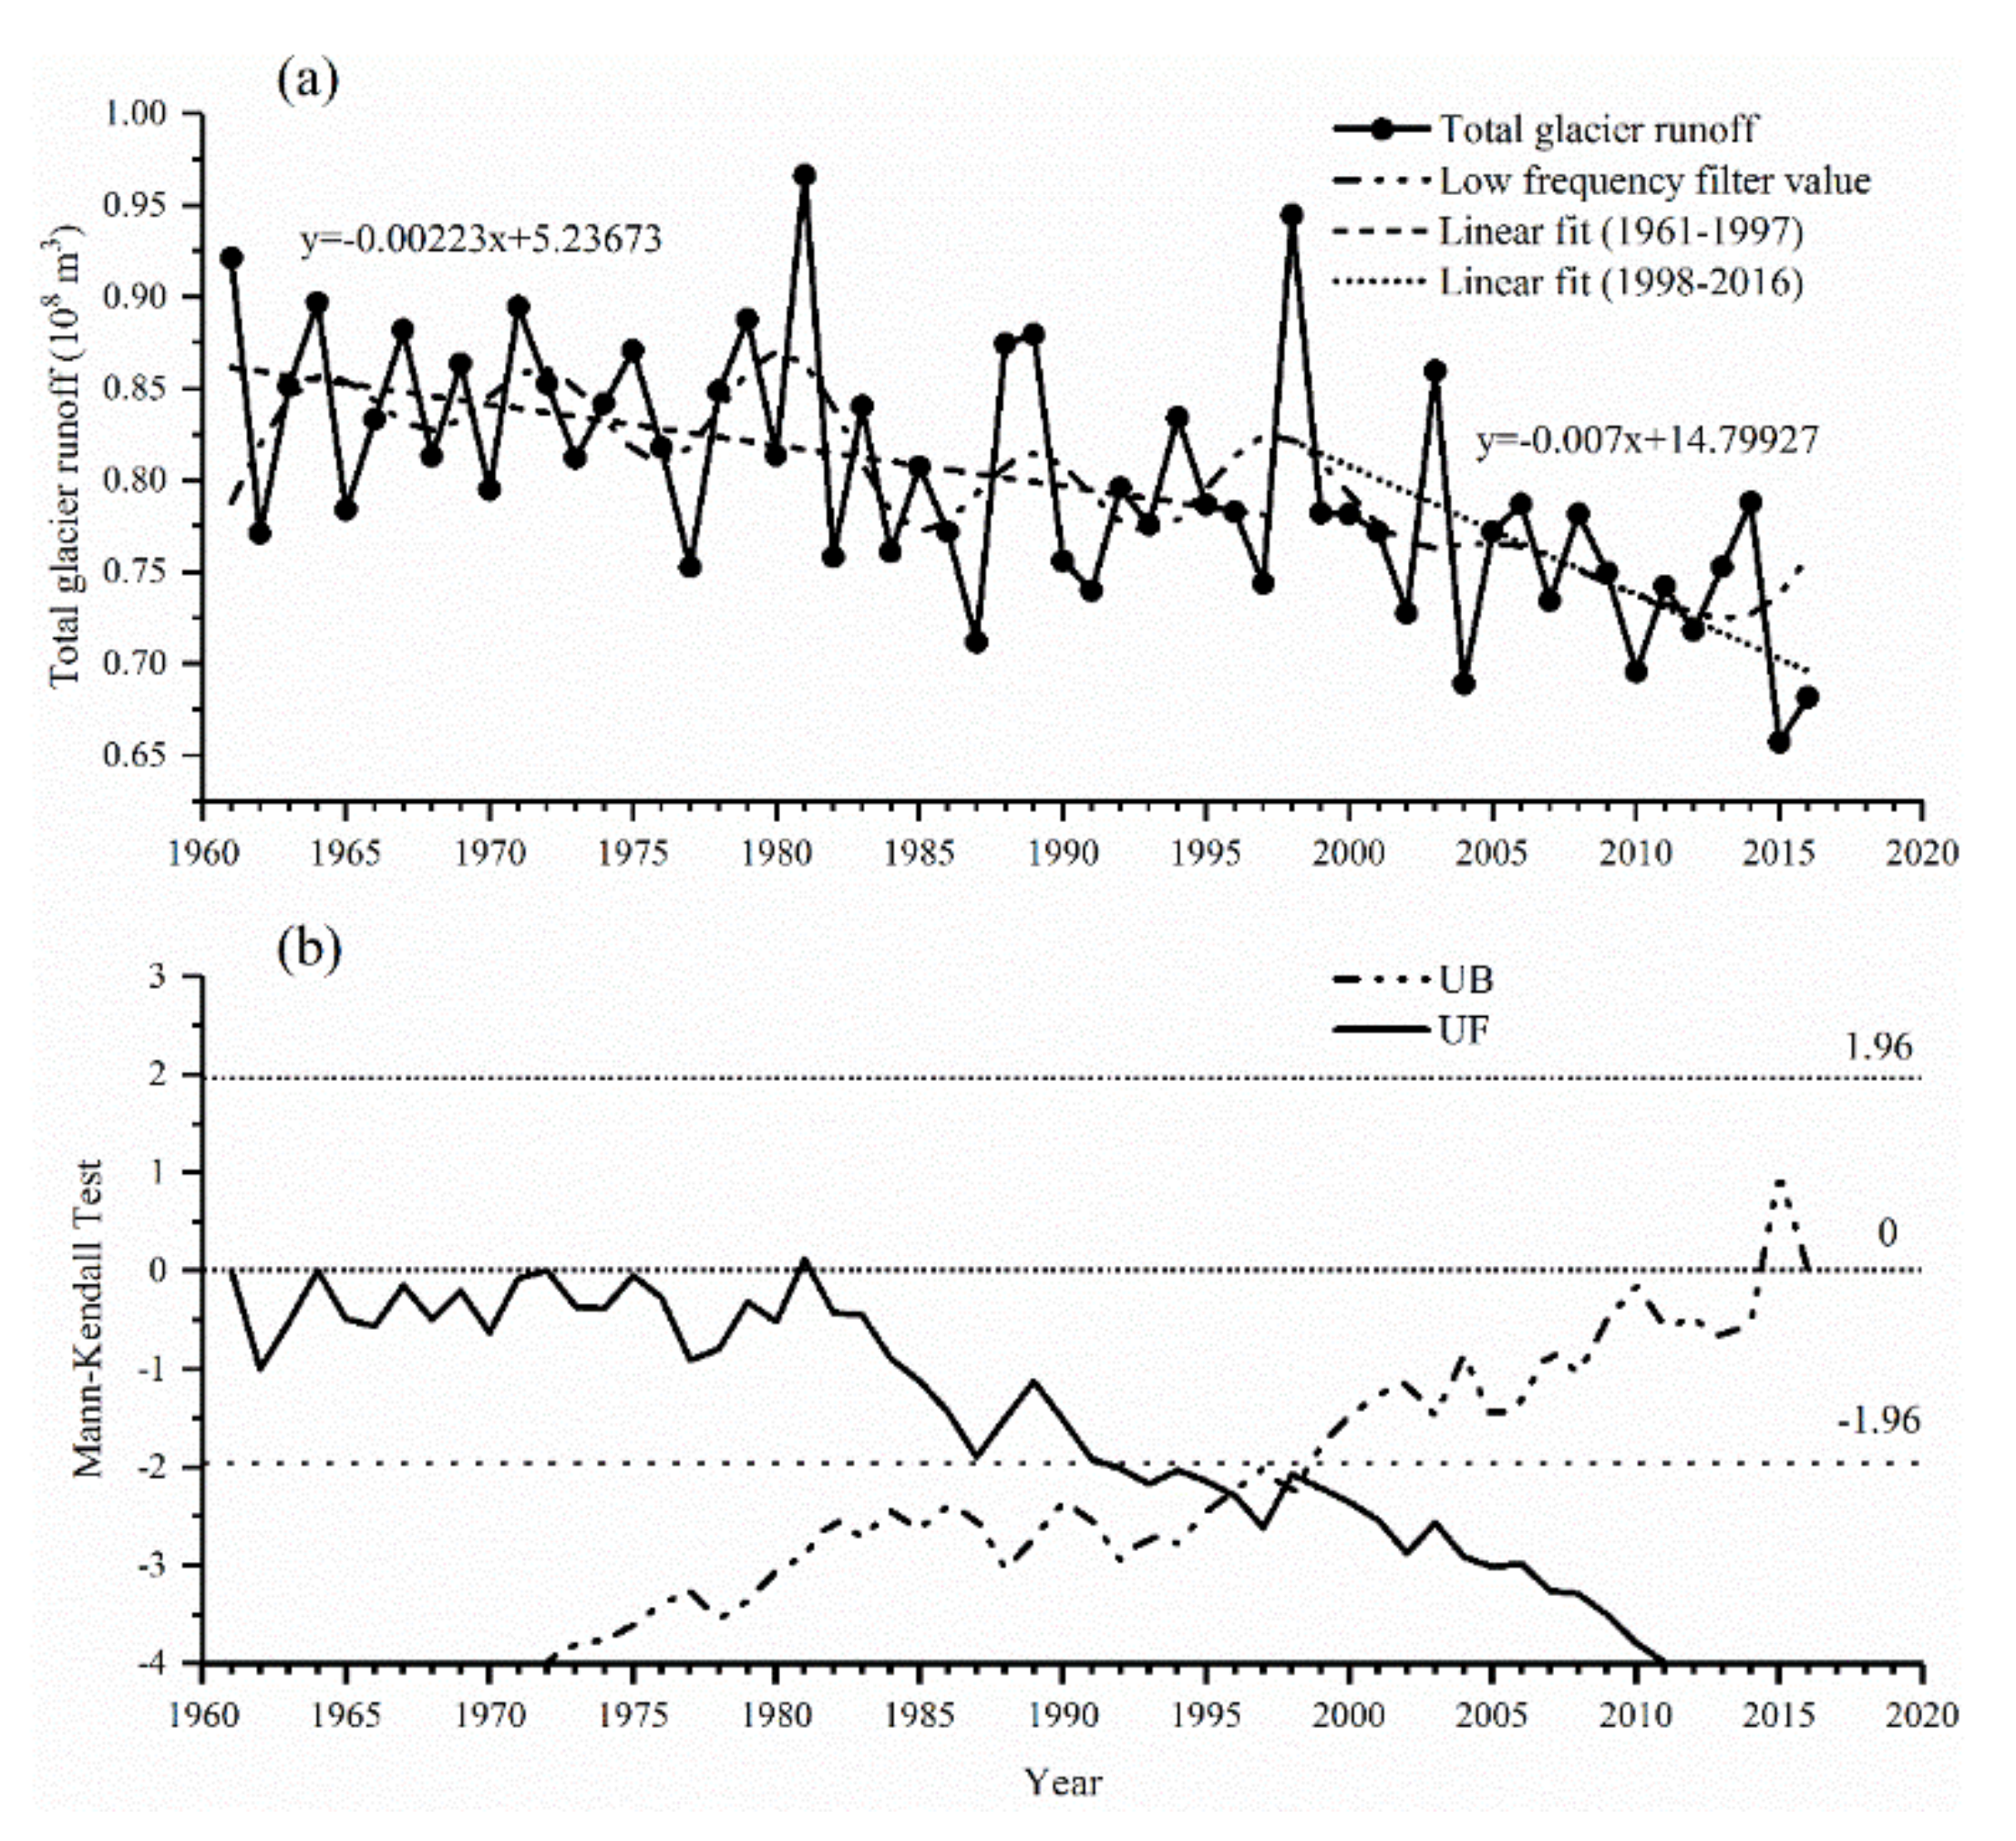
From the Chinese Glacier Inventory (CGI), there are 141 glaciers in the SRB with a total area of 64.8 km2, among which 87.9% of the glaciers are very small [49]. The total ice volume in the SRB is estimated to be 2.1 km3 [50]. By adding up the average annual glacial meltwater of the four small basins in the Shiyang River Basin that contain glacier recharge, we obtained the annual average change curve of the total glacier meltwater in the Shiyang River Basin from 1996 to 2016. Because the UF value was almost always less than zero, we believe that the annual average glacial meltwater in the Shiyang River Basin showed a downward trend from 1961 to 2016 (Figure 13). From 1961 to 1980, the amount of glacier meltwater was relatively stable. Beginning in 1981, the UF value gradually decreased, and the rate of decrease in glacier meltwater gradually accelerated. Even with a sudden change, in 1998, the amount of glacier meltwater began to decrease significantly (p < 0.05). However, Zhang’s research found that the glacier total runoff significantly (p < 0.05) increased by 0.079 × 10⁵ m3 from 1961 to 2008. This is completely contrary to our conclusion. Zhang et al. [49] also found that the annual total glacial runoff reached a peak in the 2000s and decreased afterwards. This is the same as our conclusion.
There are 42 glaciers in the Xiying River Basin [50]. Liu et al. [50] analyzed two aerial photos (acquired in 1956 and 1972) and three Landsat images (acquired in 1987, 1995, and 2008), and concluded that from 1956/1972 to 2008, in the Xiying River Basin, the glacier area reduced by 20.8%, but increased slightly around 1987. In our study, the annual glacial melt water in the Xiying River Basin showed a downward trend from 1961 to 2016, and a slight increase from 1961 to 1987, reaching a peak in 1987. The changing trend of glacier meltwater is consistent with the changing trend of the glacier area. Using GIS and RS technology combined with manual visual interpretation, Li et al. [51] extracted five glacier contours at different time periods in 1995, 2002, 2009, 2015, and 2016 from remote sensing images, and found that the melting of glaciers in the Shiyang River Basin from 2009 to 2015 accelerated as compared with from 1995 to 2002. The accelerated melting of glaciers has caused glacier recharge runoff to decrease year by year.
This research analyzed the climate change in the high mountain runoff-producing area of the upper Shiyang River from 1961 to 2016, and then calculated and verified the temperature, precipitation, and ET in seven small watersheds. The change in annual average runoff and the change of glacial and snow replenishment in the Shiyang River Basin were determined. After determining the total amount of water resources in the cryosphere and the components of the Shiyang River Basin, we assessed the current value of cryosphere water resources services. Our research could help people realize the seriousness of climate change and improves their understanding of cryosphere water resources for human well-being and maintenance of the ecological environment. In addition, it provides data support and a theoretical basis for the ecological security services of the cryosphere, as well as environmental protection and sustainable resource planning and management.
This article has some shortcomings. Due to a lack of data, this article did not conduct research on the Dajing River Basin. Moreover, the CBHM model is not applicable to rivers with small runoff, and the simulation results of the Gulang River Basin are poor. For glacier and snowmelt water, our results lack more reliable evidence. It is only based on a reduction in glacier and snow cover to prove the melt runoff reduction.
5. Conclusions
In this study, CBHM was used to simulate the water resources of seven rivers in the Shiyang River Basin from 1961 to 2016. The climate change in the Shiyang River Basin and the response of cryosphere water resources to the change are the key points of this paper. Finally, a value evaluation model was constructed to evaluate the current status of the cryosphere water resources service function of Shiyang River Basin.
The CBHM applied to the upper Shiyang River Basin has achieved very good results. The NSE of runoff simulation in the five small watersheds was above 0.7.
The monthly average temperature in the Shiyang River runoff generation area has increased significantly (p < 0.05) since 1961. The average temperature change rate of the seven basins was 0.3 °C/10 years. The annual average precipitation in the alpine watershed of the Shiyang River Basin was 582.6 mm, which in four watersheds (Xiying, Dongda, Xida, and Jinta) has decreased significantly from 1961 to 2016. The average ET of each basin was 387.6 mm, and three watersheds (Dongda, Xida, and Jinta) showed a significant downward trend.
The annual average runoff of the Shiyang River Basin showed alternating changes between high and low levels and did not decrease significantly from 1961 to 2016. In the Zamu River, Dongda River, and Xida River Basins, the annual snowmelt runoff showed a significant decreasing trend from 1961 to 2016. The annual average glacial meltwater in the Shiyang River Basin showed a downward trend from 1961 to 2016, and it has decreased significantly (p < 0.05) since 1998. In 1981 and 1998, there were two peaks of glacial meltwater.
In 2016, the service value of cryosphere water resources in the Shiyang River Basin was 304.2 million yuan, of which snowmelt water and glacier meltwater accounted for 31.8% and 4.4%, respectively.
In the future, we plan to consider adding the estimated results of the climate model to the CBHM to simulate future runoff changes in the Shiyang River and apply the model to the Heihe River Basin and Shule River Basin to analyze the changes in cryospheric water resources in the three inland river basins of the Hexi Corridor. The study of large-scale watershed water resources is the basis for the utilization and development of downstream water resources.
Author Contributions
K.L.: Conceptualization, Software, Validation, Formal analysis, Investigation, Writing—Original Draft, Visualization. R.C.: Methodology, Software, Resources, Supervision, Project administration, Funding acquisition. G.L.: Software, Validation. All authors have read and agreed to the published version of the manuscript.
Funding
This study was supported primarily by the National Natural Science Foundation of China (41690141, 41671029) and the National Key Research and Development Project of China (2019YFC1510505).
Informed Consent Statement
Informed consent was obtained from all subjects involved in the study.
Data Availability Statement
The raw/processed data required to reproduce these findings cannot be shared at this time as the data also forms part of an ongoing study.
Acknowledgments
This study was supported primarily by the National Key Research and Development Project of China (2019YFC1510505) and the National Natural Science Foundation of China (41690141, 41671029). The discharge, meteorological data, and most of the other measured data are available (register as a user) in the WESTDC (http://westdc.westgis.ac.cn/), China Meteorological Data Sharing Service System (http://data.cma.cn), and Qilian Alpine Ecology and Hydrology Research Station (http://hhsy.casnw.net/). The snow cover data are provided by NASA MODIS (https://modis.gsfc.nasa.gov/). The evapotranspiration data are download from NTSG’s public data repository (http://files.ntsg.umt.edu).
Conflicts of Interest
The authors declare no conflict of interest.
References
- Farmer, G.T.; Cook, J. Climate Change Science: A Modern Synthesis, 2nd ed.; Springer: Dordrecht, The Netherlands, 2014; pp. 277–317. [Google Scholar]
- Qin, D.; Ding, Y.; Xiao, C.; Kang, S.; Ren, J.; Yang, J.; Zhang, S. Cryospheric Science: Research framework and disciplinary system. Natl. Sci. Rev. 2018, 5, 255–268. [Google Scholar] [CrossRef] [Green Version]
- Stocker, T.F.; Qin, D.; Plattner, G.K.; Tignor, M.M.B.; Allen, S.K.; Boschung, J.; Nauels, A.; Xia, Y.; Bex, V.; Midgley, P.M.J. Climate Change 2013: The Physical Science Basis. In Contribution of Working Group I to the Fifth Assessment Report of IPCC the Intergovernmental Panel on Climate Change; Cambridge University Press: New York, NY, USA, 2014; Volume 18, pp. 95–123. [Google Scholar]
- Guo, W.; Liu, S.; Xu, J.; Wu, L.; Shangguan, D.; Yao, X.; Wei, J.; Bao, W.; Yu, P.; Liu, Q.; et al. The second Chinese glacier inventory: Data, methods and results. J. Glaciol. 2015, 61, 357–372. [Google Scholar] [CrossRef] [Green Version]
- Liu, S.; Yao, X.; Guo, W.; Xu, J.; Shangguan, D.; Wei, J.; Bao, W.; Wu, L. The contemporary glaciers in China based on the Second Chinese Glacier Inventory. Acta Geogr. Sin. 2015, 70, 3–16. [Google Scholar]
- Nan, Z.; Gao, Z.; Li, S.; Wu, T. Permafrost Changes in the Northern Limit of Permafrost on the Qinghai-Tibet Plateau in the Last 30 Years. Acta Geogr. Sin. 2003, 58, 817–823. [Google Scholar]
- Qin, D.; Liu, S.; Li, P. Snow cover distribution, variability, and response to climate change in western China. J. Clim. 2006, 19, 1820–1833. [Google Scholar]
- Li, Z.; Han, T.; Jin, Z.; Yang, H.; Jiao, K. A Sumary of 40-Year Observed Variation Facts of Climate and Glacier NO.1 at Headwater of of Urumqi River, Tianshan, China. J. Glaciol. Geocryol. 2003, 25, 117–123. [Google Scholar]
- Ma, Q.; Jin, H.; Bense, V.F.; Luo, D.; Marchenk, S.S.; Harris, S.A.; Lan, Y. Impacts of degrading permafrost on streamflow in the source area of Yellow River on the Qinghai-Tibet Plateau, China. Adv. Clim. Chang. Res. 2019, 10, 225–239. [Google Scholar] [CrossRef]
- Ma, X.; Yan, W.; Zhao, C.; Kundzewicz, Z.W. Snow-Cover Area and Runoff Variation under Climate Change in the West Kunlun Mountains. Water 2019, 11, 2246. [Google Scholar] [CrossRef] [Green Version]
- Shi, Y.F.; Shen, Y.P.; Li, D.L.; Zhang, G.W.; Kang, E.S. Discussion on the present climate change from warm-dry to warm wet in northwest china. Quat. Sci. 2003, 23, 152–164. [Google Scholar]
- Wortmann, M.; Bolch, T.; Buda, S.; Krysanova, V. An efficient representation of glacier dynamics in a semi-distributed hydrological model to bridge glacier and river catchment scales. J. Hydrol. 2019, 573, 136–152. [Google Scholar] [CrossRef] [Green Version]
- Xiao, C.; Su, B.; Wang, X.; Qin, D. Cascading risks to the deterioration in cryospheric functions and services. Chin. Sci. Bull. 2019, 64, 1975–1984. [Google Scholar]
- Kang, S.; Wang, X. Cryospheric functions and services. Adv. Clim. Chang. Res. 2019, 10, 69–70. [Google Scholar] [CrossRef]
- Lin, H.; Huang, J.; Fang, C.; Qi, X.; Chen, Y. A preliminary study on the theory and method of comprehensive regionalization of cryospheric services. Adv. Clim. Chang. Res. 2019, 10, 115–123. [Google Scholar] [CrossRef]
- Xiao, C.; Wang, S.; Qin, D. A Preliminary Study on Cryosphere Service Function and Its Value Estimation. Progress. Inquisitiones Mutat. Clim. 2016, 12, 45–52. [Google Scholar]
- Chen, Y.; Takeuchi, K.; Xu, C.; Chen, Y.; Xu, Z. Regional climate change and its effects on river runoff in the Tarim Basin, China. Hydrol. Process. 2006, 20, 2207–2216. [Google Scholar] [CrossRef]
- Lin, L.I.; Wang, Z.; Wang, Q. Inflence of Climatic Change on Flow over the Upper Reaches of Heihe River. Sci. Geogr. Sin. 2006, 26, 40–46. [Google Scholar]
- Ma, Z.; Kang, S.; Zhang, L.; Tong, L.; Su, X. Analysis of impacts of climate variability and human activity on streamflow for a river basin in arid region of northwest China. J. Hydrol. 2008, 352, 239–249. [Google Scholar] [CrossRef]
- Wang, Z.; Ficklin, D.L.; Zhang, Y.; Zhang, M. Impact of climate change on streamflow in the arid Shiyang River Basin of northwest China. Hydrol. Process. 2012, 26, 2733–2744. [Google Scholar] [CrossRef]
- Hock, R. Temperature index melt modelling in mountain areas. J. Hydrol. 2003, 282, 104–115. [Google Scholar] [CrossRef]
- Singh, P.; Arora, M.; Goel, N.K. Effiect of climate change on runoff of a glacierized Himalayan basin. Hydrol. Process. 2006, 20, 1979–1992. [Google Scholar] [CrossRef]
- Konz, M.; Uhlenbrook, S.; Braun, L.; Shrestha, A.; Demuth, S. Implementation of a process-based catchment model in a poorly gauged, highly glacierized Himalayan headwater. Hydrol. Earth Syst. Sci. 2007, 11, 1323–1339. [Google Scholar] [CrossRef] [Green Version]
- Chen, R.; Liu, S.; Kang, R.; Han, H.; Qin, W.; Wang, J. Daily Glacier Runoff Estimation Methods—A Case Study of Koxkar Glacier. Adv. Earth Sci. 2008, 23, 942–951. [Google Scholar]
- Zhao, Q.; Ye, B.; Ding, Y.; Zhang, S.; Wang., J.; Wang., Z. Hydrological Process of a Typical Catchment in Cold Region: Simulation and Analysis. J. Glaciol. Geocryol. 2011, 33, 595–605. [Google Scholar]
- Luo, Y.; Arnold, J.; Liu, S.; Wang, X.; Chen, X. Inclusion of glacier processes for distributed hydrological modeling at basin scale with application to a watershed in Tianshan Mountains, northwest China. J. Hydrol. 2013, 477, 72–85. [Google Scholar] [CrossRef]
- Chen, R.; Wang, G.; Yang, Y.; Liu, J.; Han, C.; Song, Y.; Liu, Z.; Kang, E. Effects of Cryospheric Change on Alpine Hydrology: Combining a Model with Observations in the Upper Reaches of the Hei River, China. J. Geophys. Res. Atmos. 2018, 123, 3414–3442. [Google Scholar] [CrossRef]
- Xiao, C.; Wang, S.; Qin, D. A preliminary study of cryosphere service function and value evaluation. Adv. Clim. Chang. Res. 2015, 6, 181–187. [Google Scholar] [CrossRef]
- Su, B.; Xiao, C.; Chen, D.; Qin, D.; Ding, Y. Cryosphere Services and Human Well-Being. Sustainability 2019, 11, 4365. [Google Scholar] [CrossRef] [Green Version]
- Lin, H.; Huang, J.; Fang, C.; Liu, J.; Qi, X.; Chen, Y. Regionalization of cryosphere water resource service. Desalin. Water Treat. 2019, 168, 394–404. [Google Scholar] [CrossRef]
- Zhang, Z.; Liu, L.; He, X.; Li, Z.; Wang, P. Evaluation on glaciers ecological services value in the Tianshan Mountains, Northwest China. J. Geogr. Sci. 2019, 29, 101–114. [Google Scholar] [CrossRef] [Green Version]
- Xu, L.; Yang, D.; Wu, T.; Yi, S.; Fang, Y.; Xiao, C.; Lin, H.; Huang, J.; Habimana Simbi, C. An ecosystem services zoning framework for the permafrost regions of China. Adv. Clim. Chang. Res. 2019, 10, 92–98. [Google Scholar] [CrossRef]
- Liu, J.; Huang, J.; Lin, H. A literature review on regionalization of water resource service function of cryosphere in China. Arid Land Geogr. 2018, 41, 751–760. [Google Scholar]
- Chen, R.; Kang, E.; Yang, J.; Zhang, J. A Distributed Runoff Model for Inland River Mountainous Basin of Northwest China. J. Desert Res. 2004, 24, 416–424. [Google Scholar]
- Chen, R.; Lu, S.; Kang, E.; Ji, X.; Zhang, Z.; Yang, Y.; Qing, W. A distributed water-heat coupled model for mountainous watershed of an inland river basin of Northwest China (I) model structure and equations. Eng. Geol. 2008, 53, 1299–1309. [Google Scholar] [CrossRef]
- Chen, R.; Kang, E.; Lu, S.; Ji, X.; Zhang, Z.; Yang, Y.; Qing, W. A distributed water-heat coupled model for mountainous watershed of an inland river basin in Northwest China (II) using meteorological and hydrological data. Eng. Geol. 2008, 55, 17–28. [Google Scholar] [CrossRef]
- Chen, R.; Gao, Y.; Lu, S.; Kang, E.; Ji, X.; Zhang, Z.; Yang, Y. A distributed water-heat coupled model for mountainous watershed of an inland river basin in Northwest China (III) using the outputs from Mesoscale model version 5. Eng. Geol. 2007, 53, 763–768. [Google Scholar] [CrossRef]
- Shi, Y.; Liu, C.; Kang, E. The Glacier Inventory of China. Ann. Glaciol. 2009, 50, 1–4. [Google Scholar] [CrossRef] [Green Version]
- Mu, Q.; Zhao, M.; Running, S.W. Improvements to a MODIS global terrestrial evapotranspiration algorithm. Remote Sens. Environ. 2011, 115, 1781–1800. [Google Scholar] [CrossRef]
- Nash, J.E.; Sutcliffe, J.V. River flow forecasting through conceptual models part I—A discussion of principles. J. Hydrol. 1970, 10, 282–290. [Google Scholar] [CrossRef]
- Loumagne, C.; Chkir, N.; Normand, M.; Ottle, C.; VidalMadjar, D. Introduction of the soil/vegetation/atmosphere continuum in a conceptual rainfall/runoff model. Hydrol. Sci. J. 1996, 41, 889–902. [Google Scholar] [CrossRef]
- Wang, H.; Zhang, M.; Zhu, H.; Dang, X.; Yang, Z.; Yin, L. Hydro-climatic trends in the last 50 years in the lower reach of the Shiyang River Basin, NW China. Catena 2012, 95, 33–41. [Google Scholar] [CrossRef]
- Wang, B.; Huang, Y. An analysis of impact of the climatic change on water resource and ecological environment over Shiyang River Basin. In Proceedings of the IEEE International Geoscience & Remote Sensing Symposium, Barcelona, Spain, 23–27 July 2007. [Google Scholar]
- Huo, Z.; Feng, S.; Kang, S.; Li, W.; Chen, S. Effect of climate changes and water-related human activities on annual stream flows of the Shiyang river basin in and north-west China. Hydrol. Process. 2008, 22, 3155–3167. [Google Scholar] [CrossRef]
- Liu, J.; Xiong, Y.; Tian, J.; Tan, Z. Spatiotemporal Changes in Evapotranspiration from an Overexploited Water Resources Basin in Arid Northern China and Their Implications for Ecosystem Management. Sustainability 2019, 11, 445. [Google Scholar] [CrossRef] [Green Version]
- Jiang, Y.; Wang, W.; Zhou, Z. Evaluation of MODIS MOD16 Evaportranspiration Product in Chinese River Basins. J. Nat. Resour. 2017, 32, 517–528. [Google Scholar]
- Li, Z.; Xu, Z.; Li, J.; Li, Z. Shift trend and step changes for runoff time series in the Shiyang River basin, northwest China. Hydrol. Process. 2008, 22, 4639–4646. [Google Scholar] [CrossRef]
- Wang, B.; Wang, X.; Song, L.; Huang, Y.; Sun, L.; Han, L. Shiyang river basin water resources to climate changing respond and to the ecological environmental impact. In Proceedings, Remote Sensing and Modeling of Ecosystems for Sustainability IV; International Society for Optics and Photonics: Bellingham, WA, USA, 2007; p. 6679. [Google Scholar]
- Zhang, S.; Gao, X.; Zhang, X. Glacial runoff likely reached peak in the mountainous areas of the Shiyang River Basin, China. J. Mt. Sci. 2015, 12, 382–395. [Google Scholar] [CrossRef]
- Liu, Y. Changes of glacier area in the Xiying River Basin, East Qilian Mountain, China. Sci. Cold Arid Reg. 2017, 9, 432–437. [Google Scholar]
- Li, L.; Li, K. Study on the relationship between glacier change and topographic factors in the Shiyang River basin. J. Glaciol. Geocryol. 2019, 41, 1026–1035. [Google Scholar]
Figure 1.
River distribution and county-level administrative divisions in the Shiyang River Basin.
Figure 2.
Precipitation interpolation and validation stations in the Shiyang River Basin. Red dots represent precipitation interpolation stations and blue dots represent precipitation verification stations. Due to the limitation of the map, all the precipitation interpolation stations are not shown. In the upper right corner, the relationship between precipitation interpolation points and the location of each river basin is shown.

Figure 3.
Comparison of calculated and measured values of precipitation stations in the Shiyang River Basin.
Figure 3.
Comparison of calculated and measured values of precipitation stations in the Shiyang River Basin.

Figure 4.
Comparison of the cryospheric basin hydrological model (CBHM) calculated monthly ET and MOD16/ET monthly product data in the Shiyang River Basin. CBHM, cryospheric basin hydrological model and MODIS, Moderate Resolution Imaging Spectroradiometer.
Figure 4.
Comparison of the cryospheric basin hydrological model (CBHM) calculated monthly ET and MOD16/ET monthly product data in the Shiyang River Basin. CBHM, cryospheric basin hydrological model and MODIS, Moderate Resolution Imaging Spectroradiometer.
Figure 5.
Comparison of CBHM simulated snow cover area and MODIS observation results in the Shiyang River Basin. CBHM, cryospheric basin hydrological model and MODIS, Moderate-Resolution Imaging Spectroradiometer.
Figure 5.
Comparison of CBHM simulated snow cover area and MODIS observation results in the Shiyang River Basin. CBHM, cryospheric basin hydrological model and MODIS, Moderate-Resolution Imaging Spectroradiometer.
Figure 6.
Validation of glacier area simulation results.
Figure 7.
Measured and simulated monthly streamflow of seven catchments in the Shiyang River Basin.

Figure 8.
Annual average water balance in the simulation period of seven catchments.

Figure 9.
Changes in temperature, precipitation (P), evapotranspiration (ET), and runoff of the seven catchments during the simulation period in the Shiyang River Basin.
Figure 9.
Changes in temperature, precipitation (P), evapotranspiration (ET), and runoff of the seven catchments during the simulation period in the Shiyang River Basin.

Figure 10.
Annual variation of total runoff, glacier and snowmelt runoff in the Shiyang River Basin.
Figure 10.
Annual variation of total runoff, glacier and snowmelt runoff in the Shiyang River Basin.

Figure 11.
Service value of cryosphere water resources in the Shiyang River Basin in 2016.

Figure 12.
Changes in the total runoff of the seven catchments of the Shiyang River Basin from 1961 to 2016. (a) Total Runoff (108 m3), (b) Mann-Kendall Test.
Figure 12.
Changes in the total runoff of the seven catchments of the Shiyang River Basin from 1961 to 2016. (a) Total Runoff (108 m3), (b) Mann-Kendall Test.
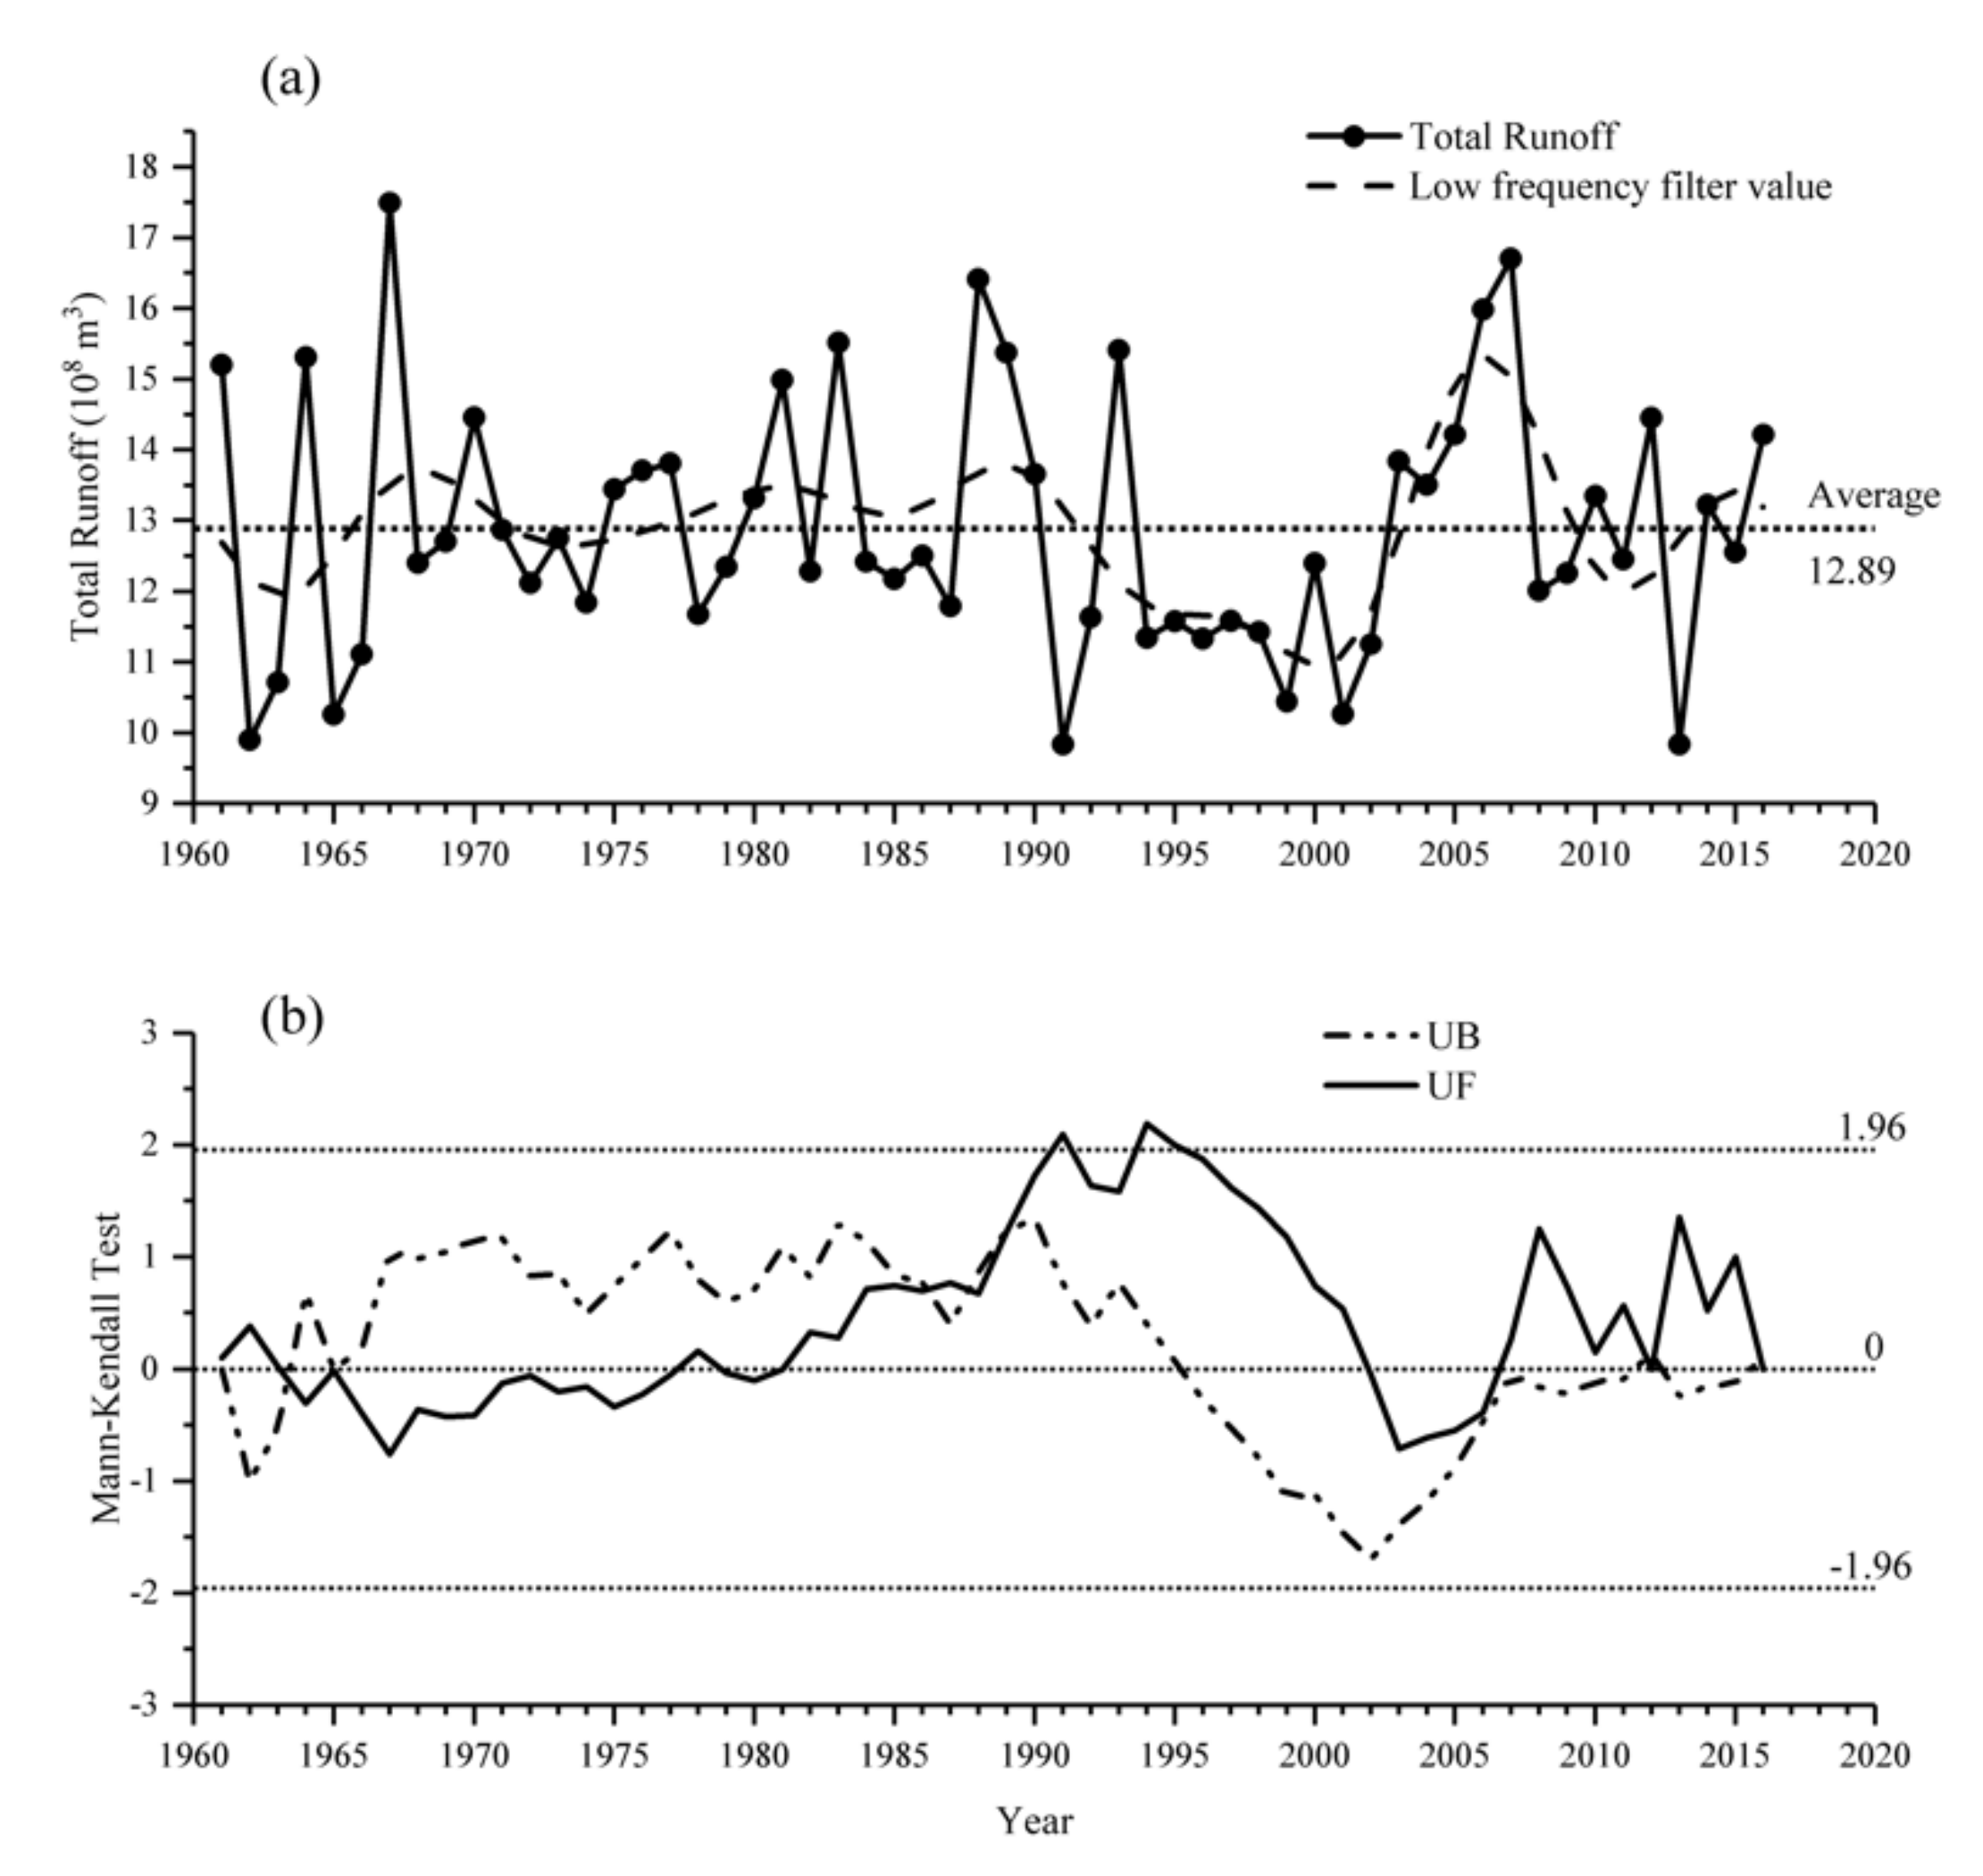
Figure 13.
Annual variation of glacial meltwater runoff in the Shiyang River Basin from 1961 to 2016. (a) Total glacier runoff (108 m3), (b) Mann-Kendall Test.
Figure 13.
Annual variation of glacial meltwater runoff in the Shiyang River Basin from 1961 to 2016. (a) Total glacier runoff (108 m3), (b) Mann-Kendall Test.


Table 1.
Characteristics of eight catchments in the Shiyang River Basin.
| Catchment | Control Station | Longitude (°E) | Latitude (°N) | Height (m) | Area (km2) | Mean Annual Runoff (million m3) * |
|---|---|---|---|---|---|---|
| Xida | Xidahe Reservoir | 101.38 | 38.05 | 2800 | 788 | 159.8 |
| Dongda | Shagousi | 101.93 | 37.98 | 2766 | 1546 | 304.6 |
| Xiying | Jiutiaolin | 102.05 | 37.87 | 2250 | 1077 | 315.5 |
| Jinta | Nanying Reservoir | 102.52 | 37.80 | 1888 | 841 | 131.4 |
| Zamu | Zamusi | 102.57 | 37.70 | 1985 | 851 | 234.2 |
| Huangyang | Huangyanghe Reservoir | 102.72 | 37.57 | 2000 | 828 | 128.2 |
| Gulang | Gulang | 102.90 | 37.45 | 2065 | 878 | 64.7 |
| Dajing | Dajingxia Reservoir | 103.36 | 37.39 | 2155 | 338 | 11.5 |
* Annual runoff was calculated from 1956 to 2016.
Table 2.
Evaluation of runoff simulation results.
| Zamu | Xiying | Dongda | Xida | Jinta | Huangyang | Gulang | |
|---|---|---|---|---|---|---|---|
| NSE | 0.80 | 0.74 | 0.78 | 0.61 | 0.72 | 0.73 | 0.30 |
| B | −0.01 | −2.53 | −0.04 | 0.12 | −0.98 | 6.67 | 20.60 |
NSE, revised Nash–Sutcliffe coefficient; B, balance error.
Table 3.
Average value and change rate of temperature, precipitation, evapotranspiration, and runoff in the Shiyang River Basin.
Table 3.
Average value and change rate of temperature, precipitation, evapotranspiration, and runoff in the Shiyang River Basin.
| Catchment | T (°C) | P (mm) | ET (mm) | R (108 m3) | |
|---|---|---|---|---|---|
| Zamu River | Average | −4.2 | 664.23 | 395.3 | 2.30 |
| Change rate/ 10 years | 0.3 * | −10.2 | −8.0 | 0.02 | |
| Xiying River | Average | −5.8 | 734.4 | 436.2 | 3.12 |
| Change rate/ 10 years | 0.3 * | −14.7 ** | −11.9 | −0.02 | |
| Dongda River | Average | −2.7 | 574.6 | 392.7 | 2.92 |
| Change rate/ 10 years | 0.4 * | −14.2 * | −10.5 ** | −0.01 | |
| Xida River | Average | −3.0 | 616.6 | 415.2 | 1.59 |
| Change rate/ 10 years | 0.1 | −16.5 * | −13.7 * | 0.03 | |
| Jinta River | Average | −0.8 | 520.6 | 374.5 | 1.22 |
| Change rate/ 10 years | 0.4 * | −12.1 * | −10.4 * | −0.05 | |
| Huangyang River | Average | −0.9 | 547.1 | 392.6 | 1.26 |
| Change rate/ 10 years | 0.4 * | −8.9 | −3.7 | −0.07 ** | |
| Gulang River | Average | 0.3 | 420.5 | 306.7 | 0.48 |
| Change rate/ 10 years | 0.4 * | 4.3 | 1.9 | 0.01 |
* indicates a significant (p < 0.05) trend and ** indicates a significant (p < 0.1) trend.
Table 4.
Glacier and snowmelt water supply in the Shiyang River Basin.
| Catchment | Runoff | Snowmelt | S/R | Glacier Melt | G/R |
|---|---|---|---|---|---|
| 108 m3 | 108 m3 | % | 108 m3 | % | |
| Zamu River | 2.30 | 0.68 | 29.68 | 0.06 | 2.44 |
| Xiying River | 3.12 | 1.13 | 36.16 | 0.24 | 7.71 |
| Dongda River | 2.92 | 1.15 | 39.31 | 0.42 | 14.34 |
| Xida River | 1.59 | 0.43 | 27.29 | 0 | 0 |
| Jinta River | 1.22 | 0.43 | 34.94 | 0.08 | 6.61 |
| Huangyang River | 1.26 | 0.21 | 16.48 | 0 | 0 |
| Gulang River | 2.32 | 0.66 | 28.50 | 0 | 0 |
| Subtotal | 14.73 | 4.69 | 31.83 | 0.80 | 5.41% |
S, snowmelt runoff; R, runoff; G, glacier melt runoff.
Publisher’s Note: MDPI stays neutral with regard to jurisdictional claims in published maps and institutional affiliations. |
© 2021 by the authors. Licensee MDPI, Basel, Switzerland. This article is an open access article distributed under the terms and conditions of the Creative Commons Attribution (CC BY) license (http://creativecommons.org/licenses/by/4.0/).
Share and Cite
MDPI and ACS Style
Li, K.; Chen, R.; Liu, G. Cryosphere Water Resources Simulation and Service Function Evaluation in the Shiyang River Basin of Northwest China. Water 2021, 13, 114. https://doi.org/10.3390/w13020114
AMA Style
Li K, Chen R, Liu G. Cryosphere Water Resources Simulation and Service Function Evaluation in the Shiyang River Basin of Northwest China. Water. 2021; 13(2):114. https://doi.org/10.3390/w13020114
Chicago/Turabian StyleLi, Kailu, Rensheng Chen, and Guohua Liu. 2021. "Cryosphere Water Resources Simulation and Service Function Evaluation in the Shiyang River Basin of Northwest China" Water 13, no. 2: 114. https://doi.org/10.3390/w13020114
Note that from the first issue of 2016, this journal uses article numbers instead of page numbers. See further details here.