
Wildfires as a Source of PAHs in Surface Waters of Background Areas (Lake Baikal, Russia)

 , ,
, ,
Abstract
:1. Introduction
2. Materials and Methods
3. Results and Discussion
3.1. PAHs in the Upper Layer of the Pelagic Zone of Lake Baikal
3.2. PAHs in the Baikal Aerosol
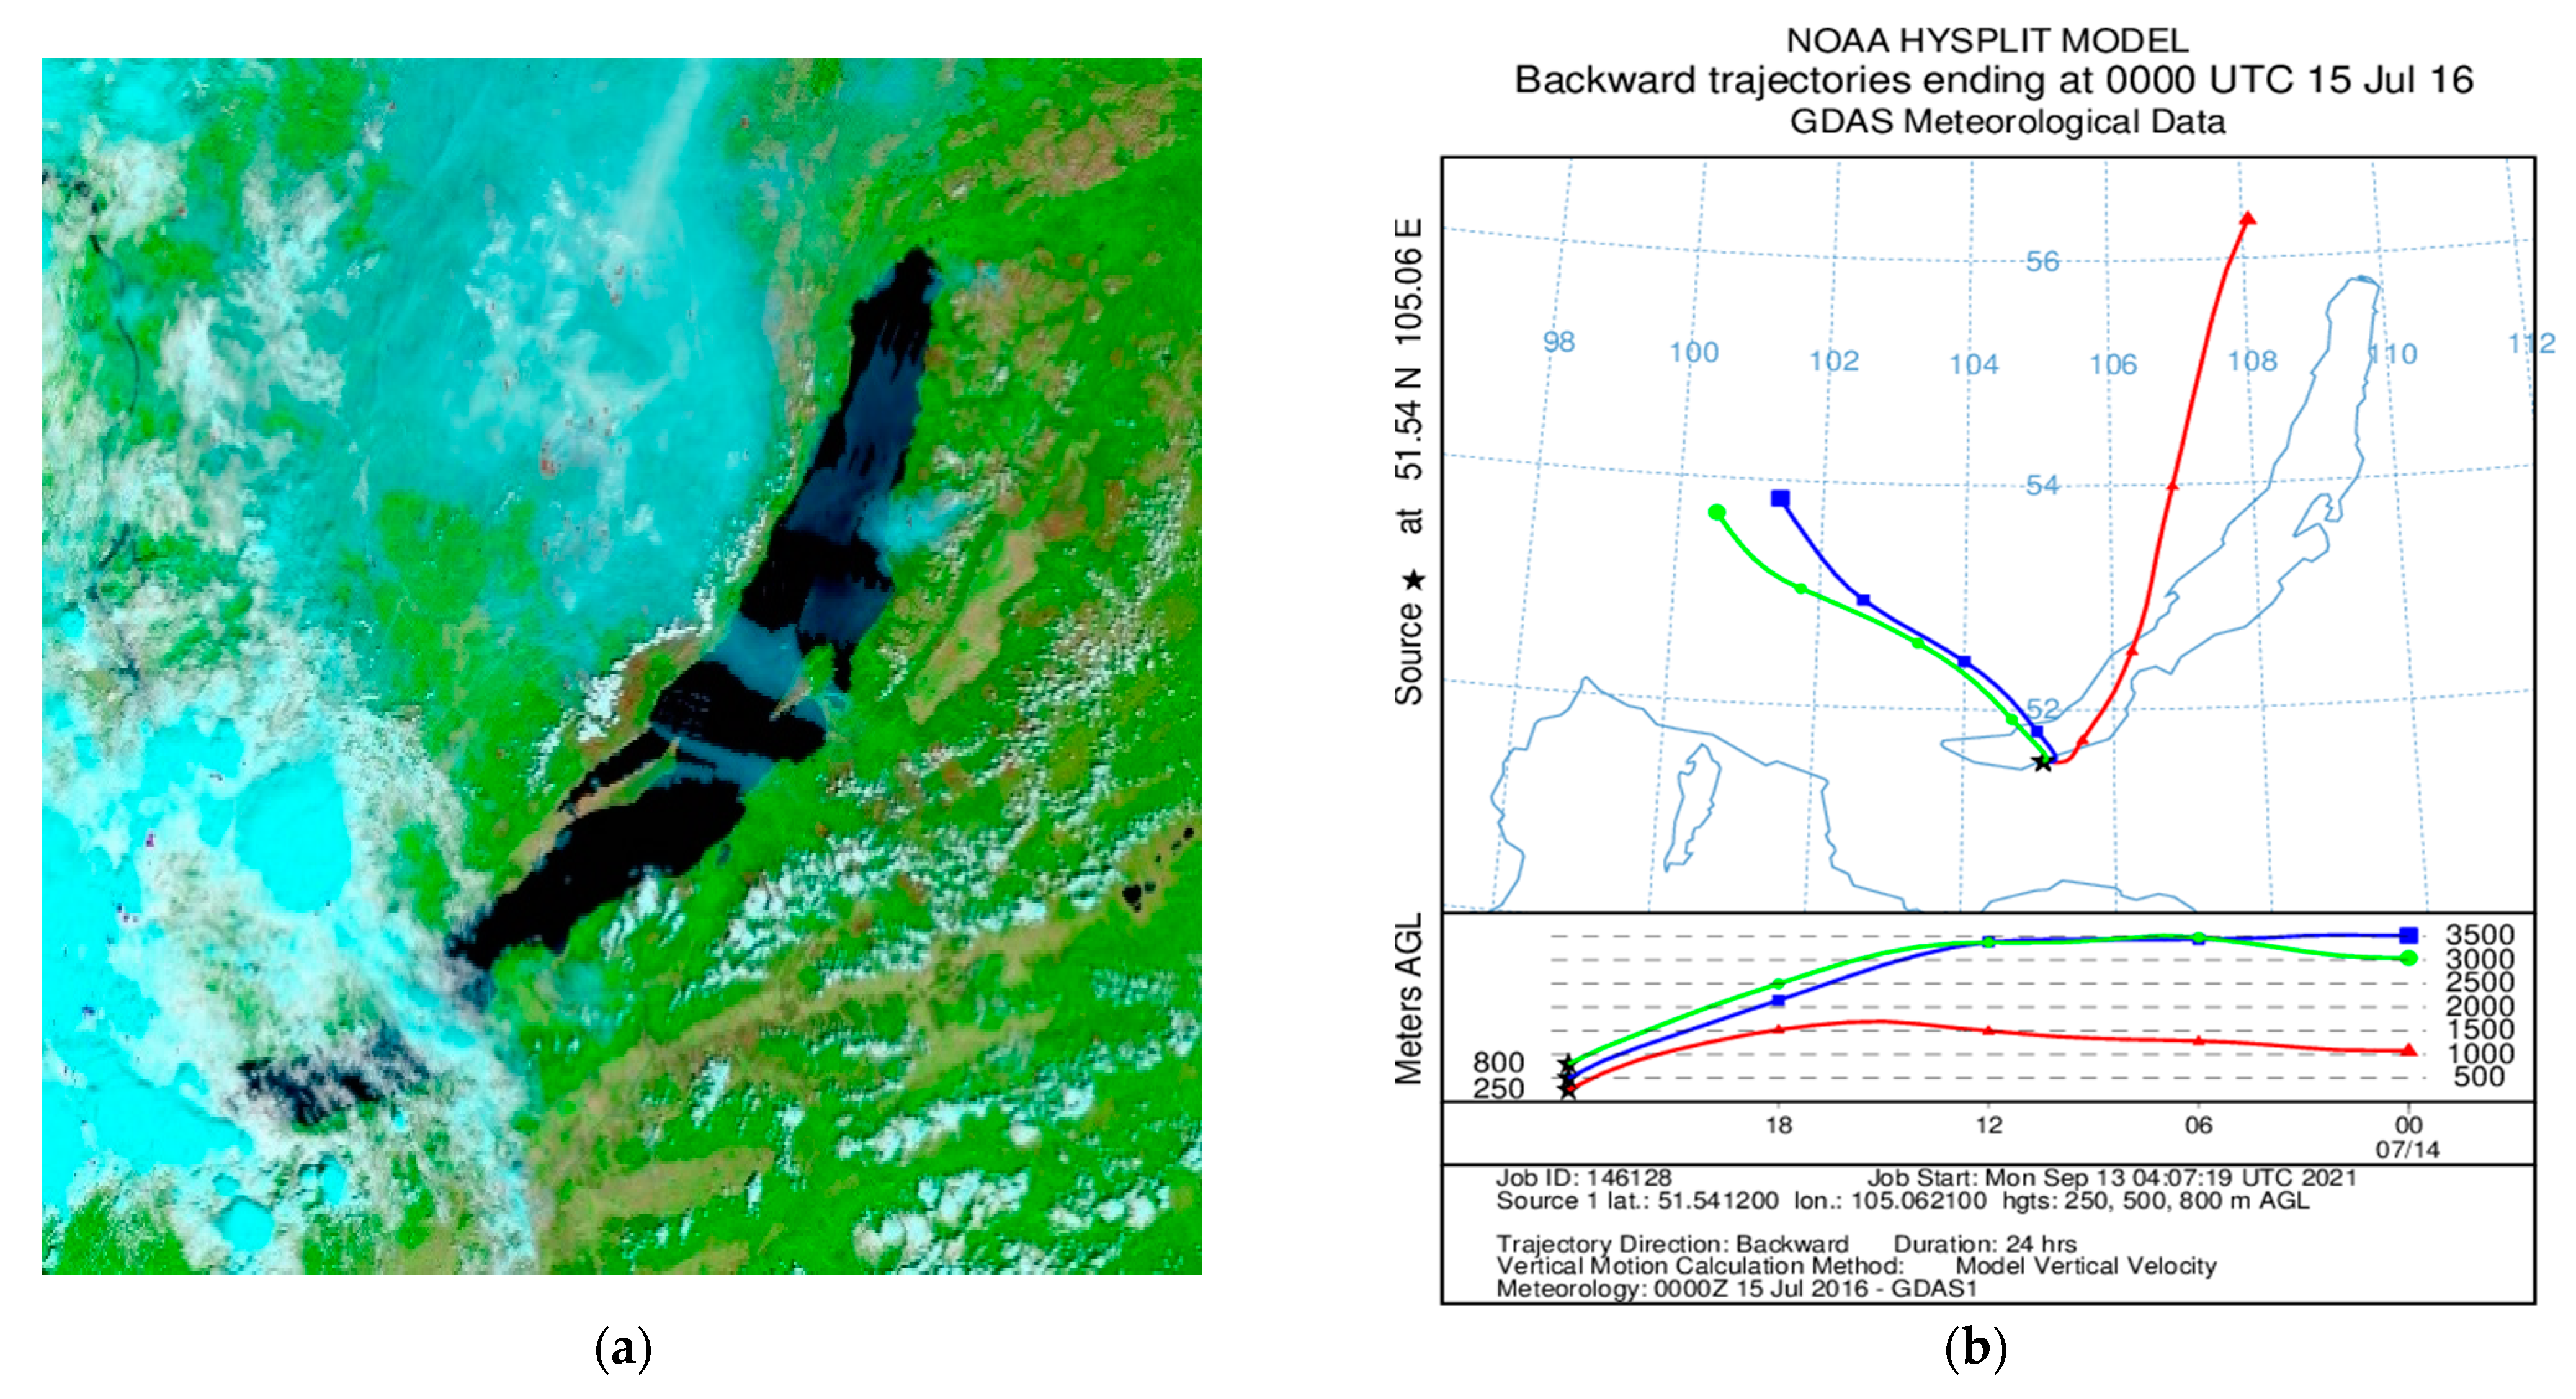
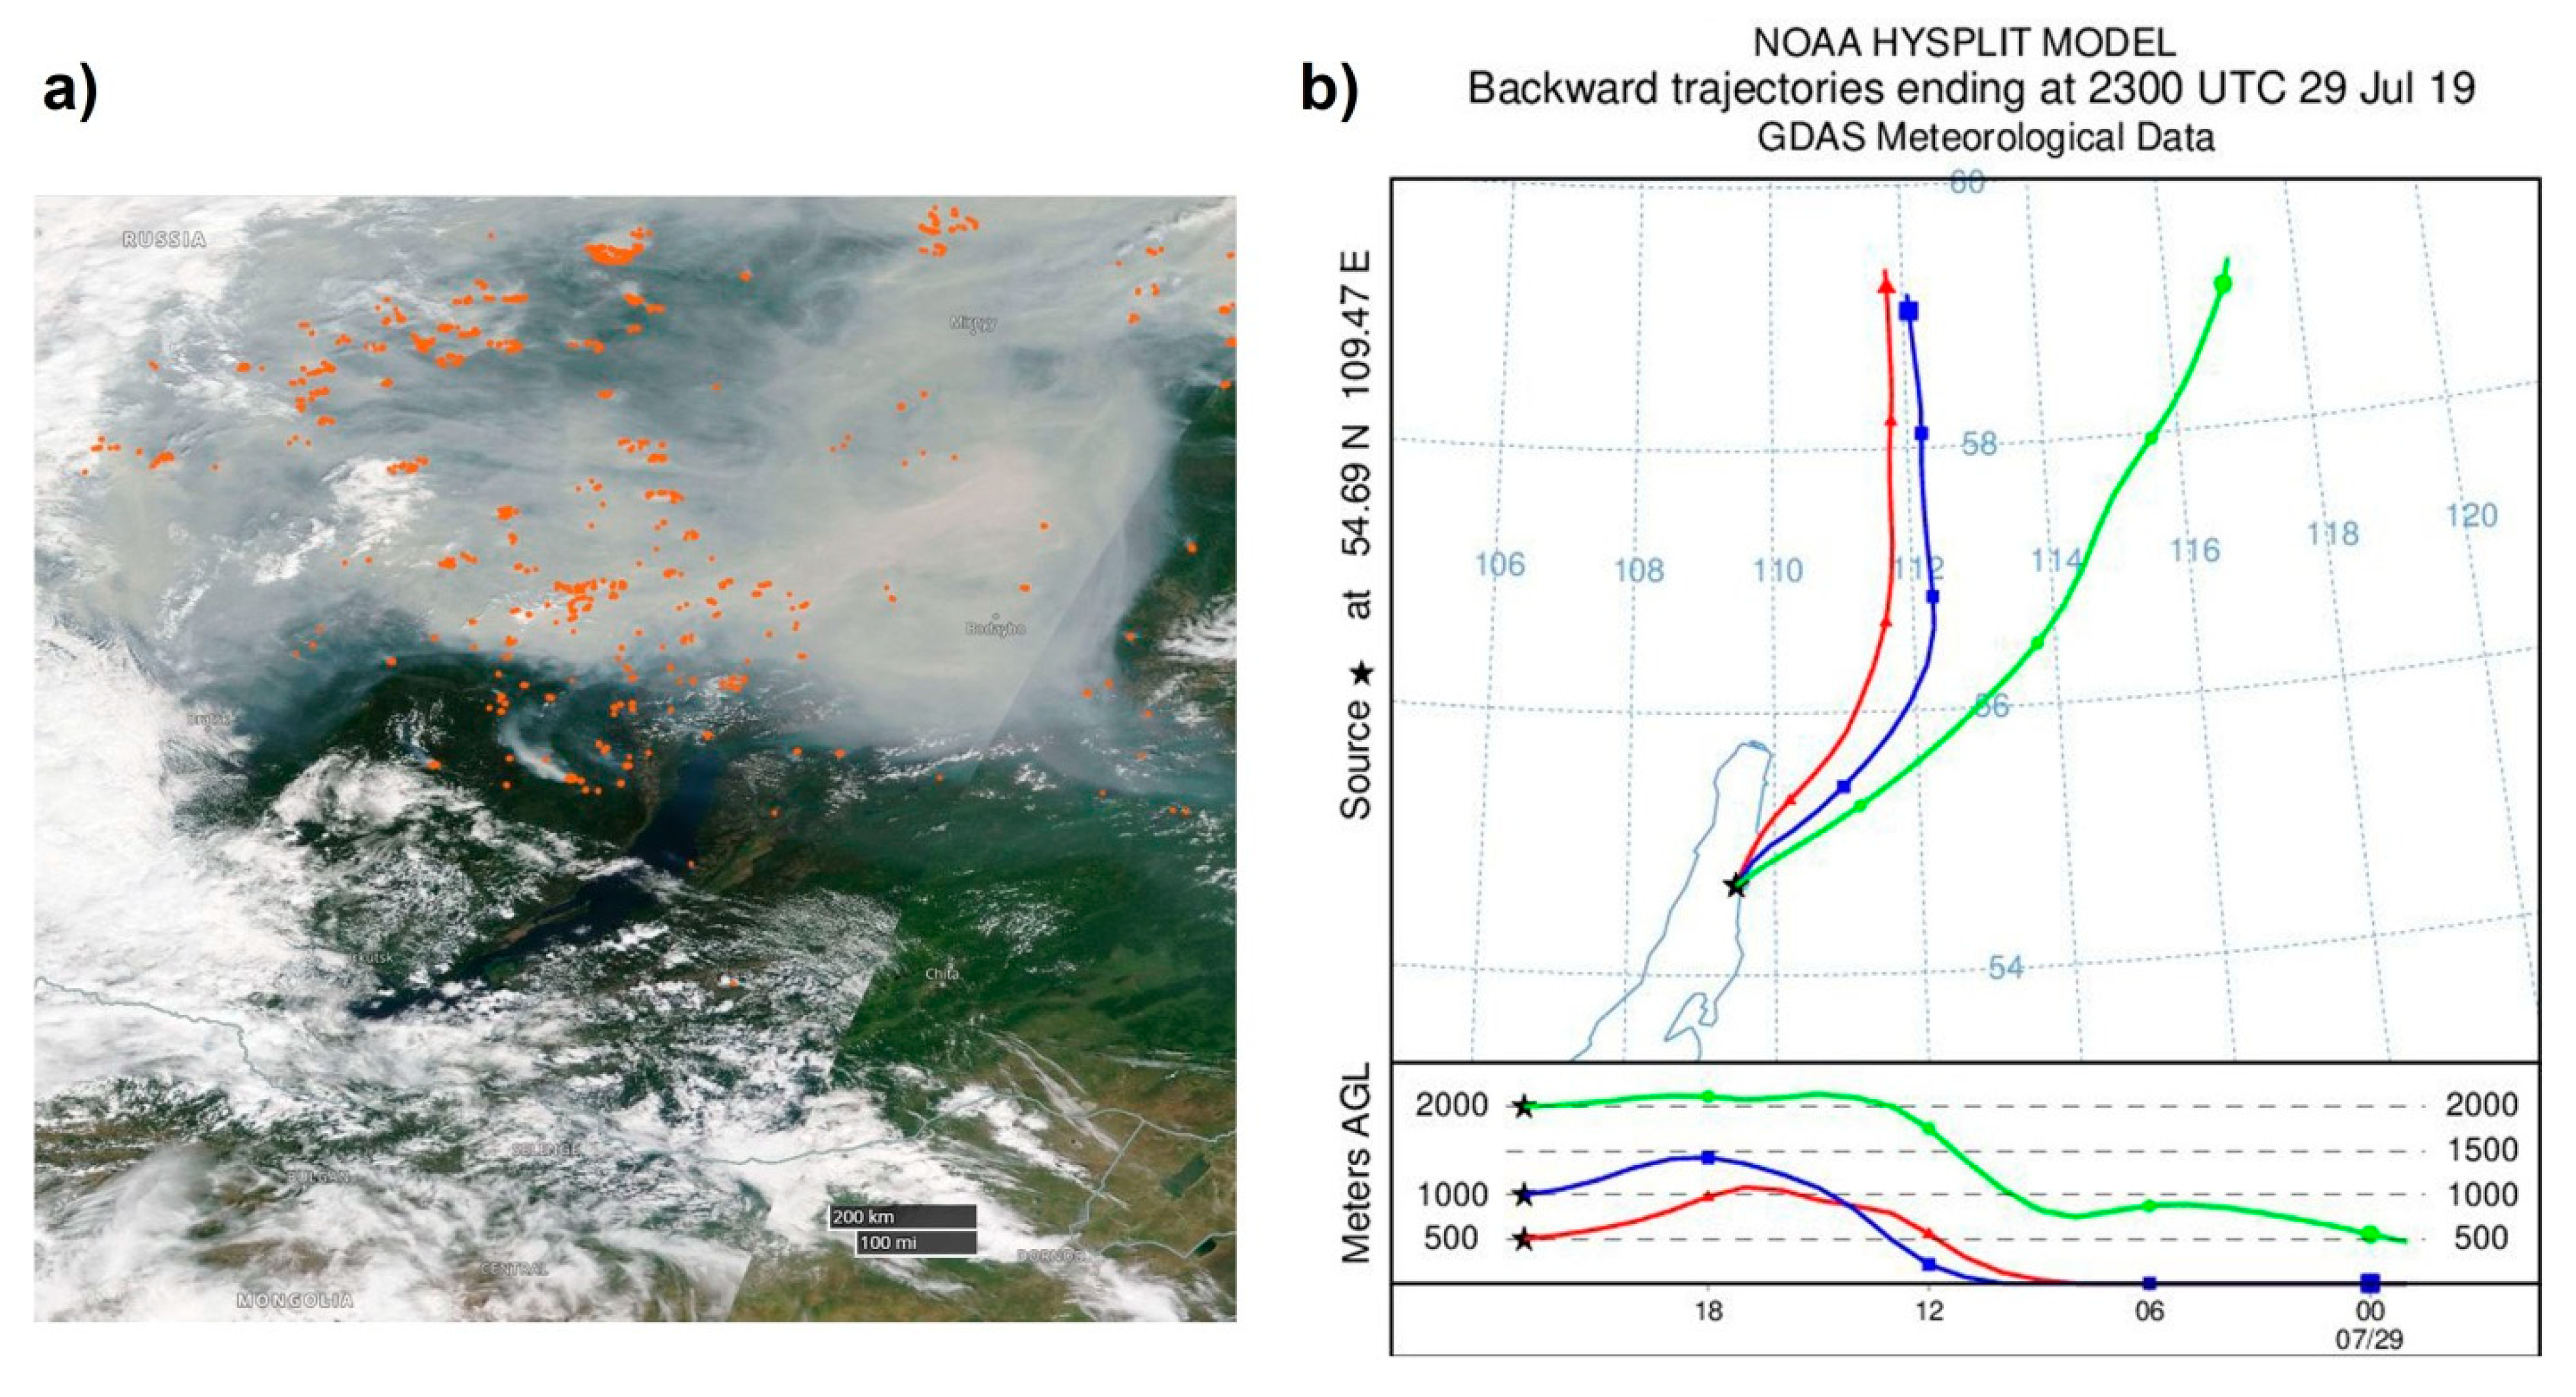
3.3. Wildfire Effects on the Surface and Watershed Basin of Lake Baikal

| Area | ƩPAHs, ng/L | Reference |
|---|---|---|
| Timor Sea, Australia | Ʃ1554,000–213,000, mean 100,000 | [66] |
| Jiulong River Estuary and west Xianmen Sea, China | Ʃ167000–27,000, mean 1700 | [67] |
| Poyng Lake, China | Ʃ165.6–270 | [68] |
| Hooghly and Brahmaputra Rivers, India | Ʃ164000–4800, mean | [69] |
| Sarno River, Italy | Ʃ1623–2700, mean 740 | [70] |
| Rivers in the north of France, Belgium | Ʃ161500–7800 | [71] |
| Daya Bay, China | Ʃ164200–29,000 | [72] |
| Langkawi Island, Malaysia | Ʃ186100–46,000, mean 25,600 | [73] |
| Сoastal streams, American Samoa | Ʃ930–380 | [74] |
| Ikpa River Basin, Niger | Ʃ16580–900 | [75] |
| Almendares River, Cuba | Ʃ14800–16,000 | [76] |
| Angara River, Russia | Ʃ1036–95 | [46] |
| Baltic Sea, Europe | Ʃ152.6–7.7 | [77] |
| Gerlache Inlet Sea, Antarctica | Ʃ135.3–9.4, mean 7.1 | [60] |
| Lake Baikal, Russia | Ʃ86.0–21, mean 12 | This study |
| Arctic (Barents Sea, East Siberian Sea), 2018 | Ʃ816–60, mean 32 | This study |
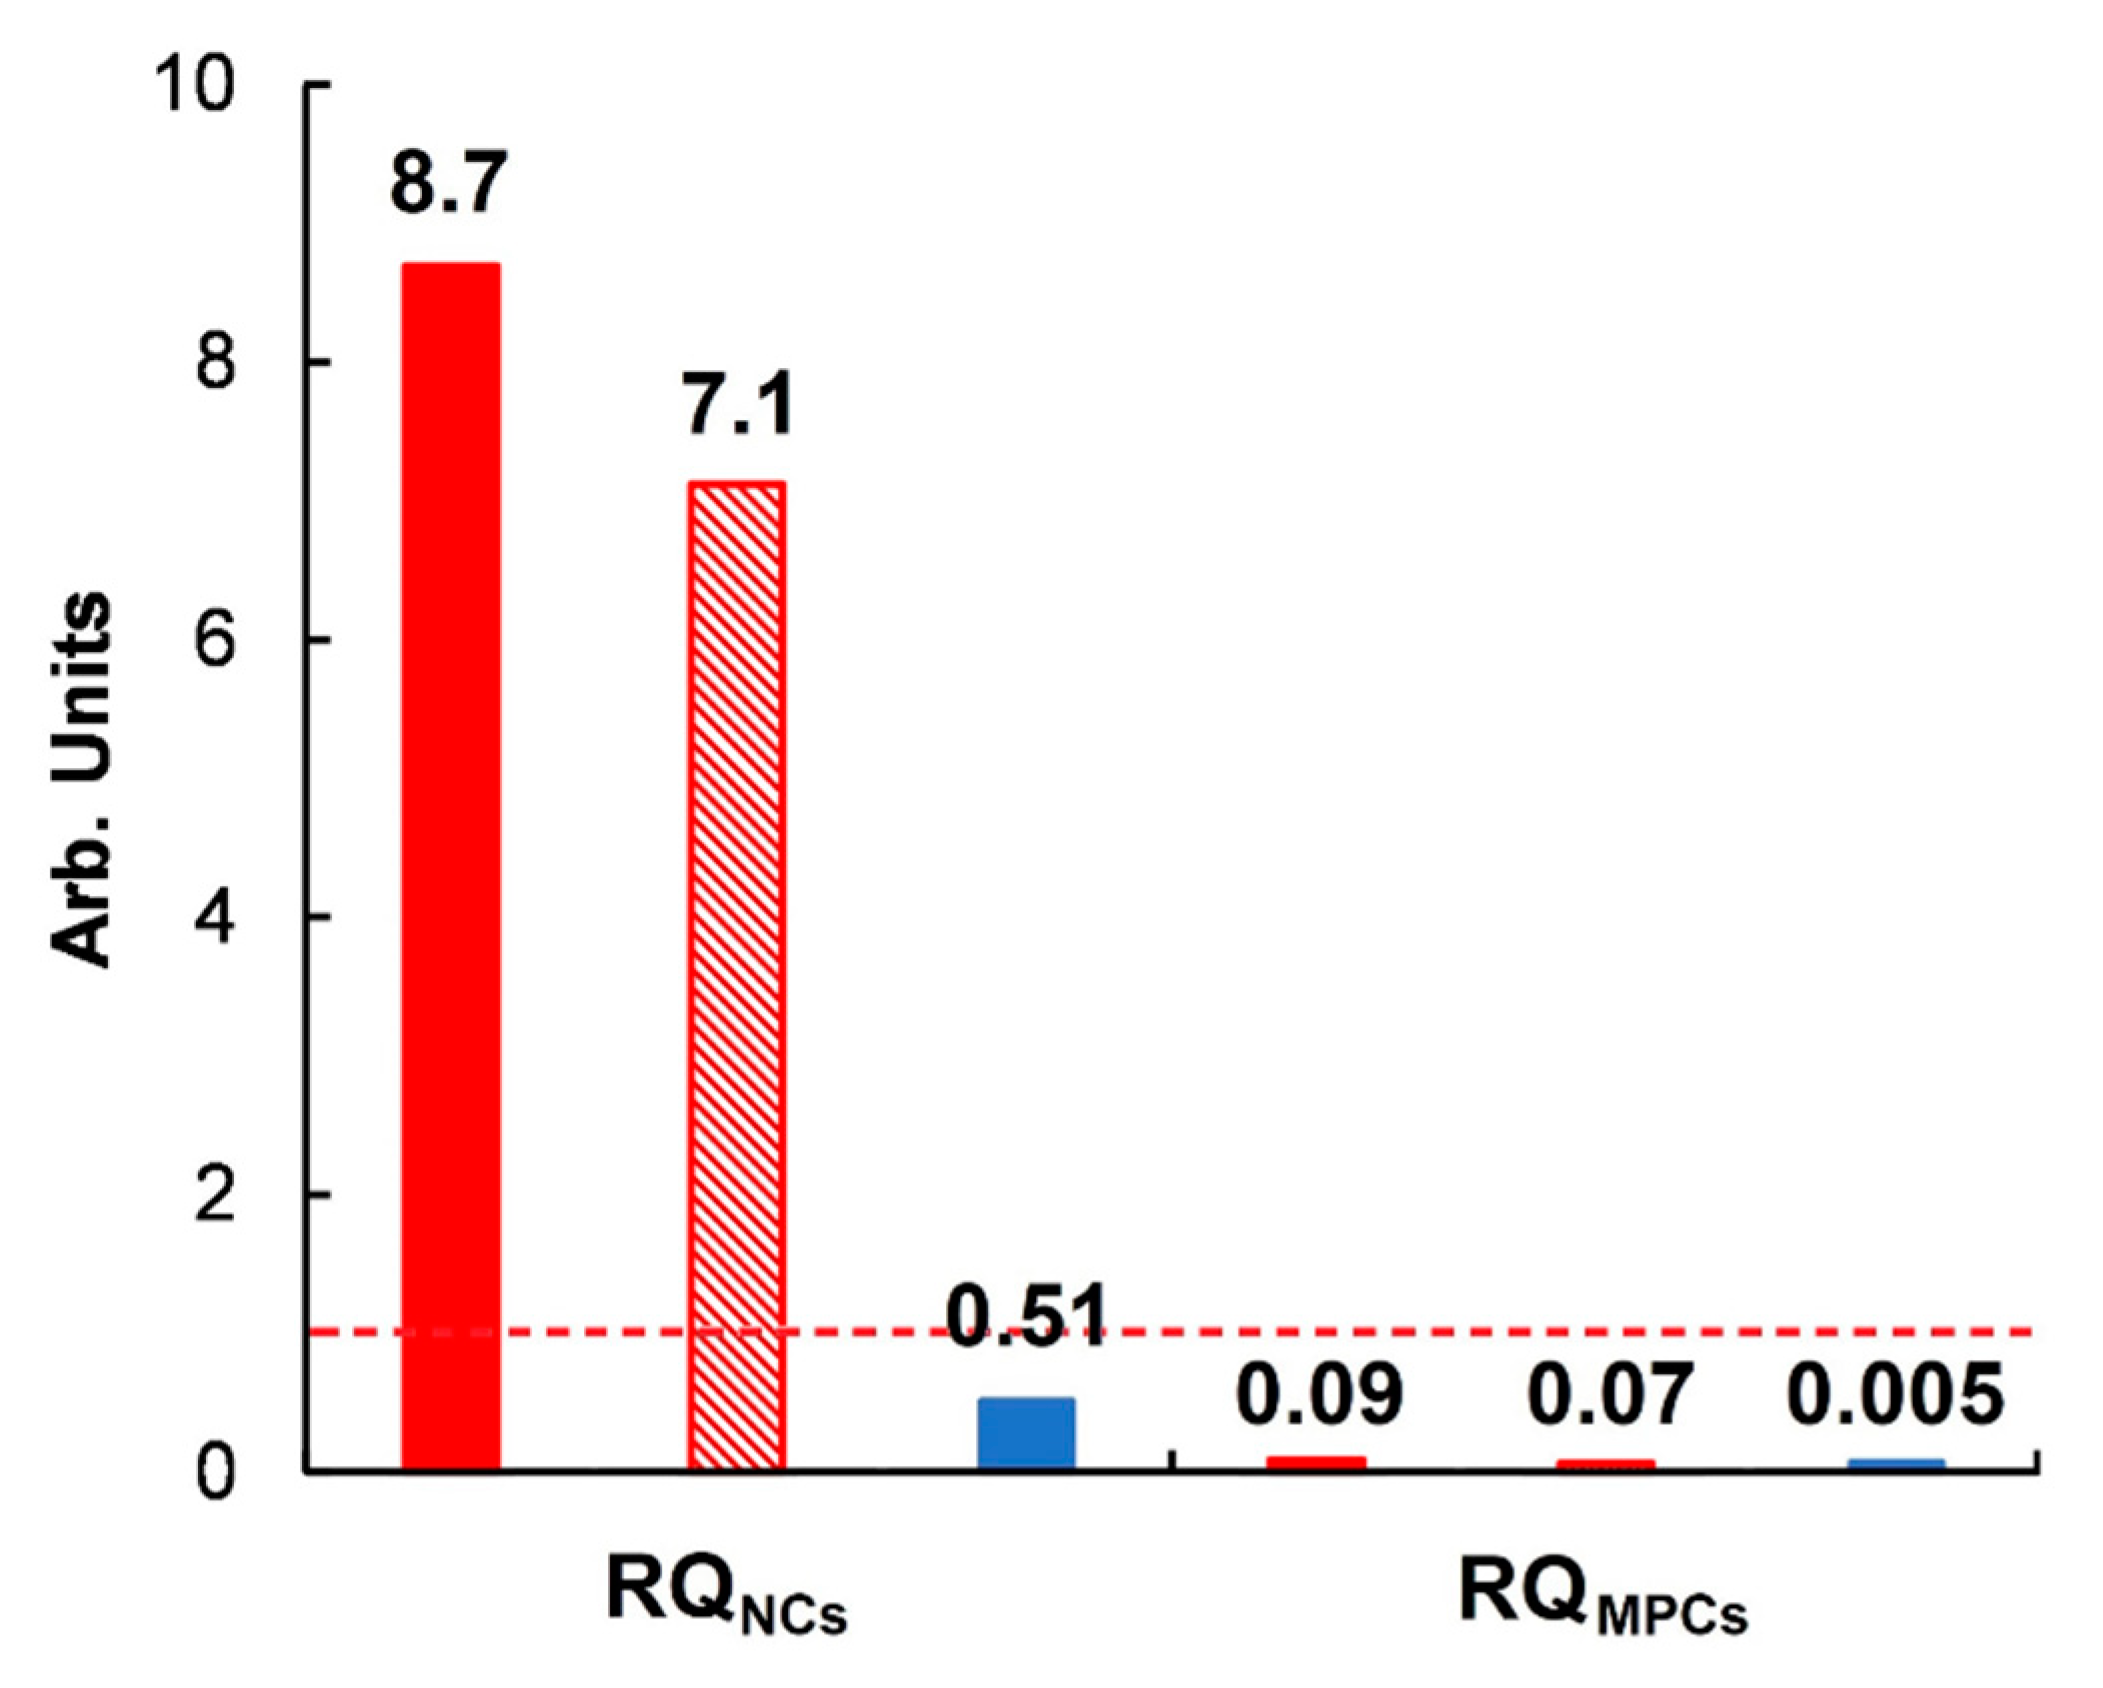
3.4. Toxicity and Risk Assessment
4. Conclusions
Supplementary Materials
Author Contributions
Funding
Institutional Review Board Statement
Informed Consent Statement
Data Availability Statement
Acknowledgments
Conflicts of Interest
References
- World Economic Forum. Global Risks 2015, 10th ed.; World Economic Forum: Geneva, Switzerland; Available online: https://www.weforum.org/reports/global-competitiveness-report-2015 (accessed on 24 September 2021).
- Bladon, K.D.; Emelko, M.B.; Silins, U.; Stone, M. Wildfire and the future of water supply. Environ. Sci. Technol. 2014, 48, 8936–8943. [Google Scholar] [CrossRef]
- Jolly, W.M.; Cochrane, M.A.; Freeborn, P.H.; Holden, Z.A.; Brown, T.J.; Williamson, G.J.; Bowman, D.M.J.S. Climate-induced variations in global wildfire danger from 1979 to 2013. Nature. Commun. 2015, 6, 7537. [Google Scholar] [CrossRef]
- Martin, D.A. At the nexus of fire, water and society. Philos. Trans. R. Soc. B Biol. Sci. 2016, 371, 20150172. [Google Scholar] [CrossRef] [PubMed] [Green Version]
- Robinne, F.N.; Miller, C.; Parisien, M.A.; Emelko, M.B.; Bladon, K.D.; Silins, U.; Flannigan, M. A global index for mapping the exposure of water resources to wildfire. Forests 2016, 7, 22. [Google Scholar] [CrossRef] [Green Version]
- White, I.; Wade, A.; Worthy, M.; Mueller, N.; Daniell, T.; Wasson, R. The vulnerability of water supply catchments to bushfires: Impacts of the January 2003 wildfires on the Australian Capital Territory. Austral. J. Water Resour. 2006, 10, 179–194. [Google Scholar] [CrossRef]
- Shakesby, R.A.; Doerr, S.H. Wildfire as a hydrological and geomorphological agent. Earth–Sci. Rev. 2006, 74, 269–307. [Google Scholar] [CrossRef]
- Smith, H.G.; Sheridan, G.J.; Lane, P.N.J.; Nyman, P.; Haydon, S. Wildfire Effects on water quality in forest catchments: A review with implications for water supply. J. Hydrol. 2011, 396, 170–192. [Google Scholar] [CrossRef]
- Mansilha, C.; Carvalho, A.; Guimaraes, P.; Marques, E. Water Quality Concerns Due to Forest Fires: Polycyclic Aromatic Hydrocarbons (PAH) Contamination of Groundwater from Mountain Areas. J. Toxicol Environ. Health A 2014, 77, 806–815. [Google Scholar] [CrossRef]
- Mansilha, C.; Duarte, C.G.; Melo, A.; Ribeiro, J.; Flores, D.; Marques, G.E. Impact of wildfire on water quality in Caramulo Mountain ridge (Central Portugal). Sustain. Water Resour. Manag. 2019, 5, 319–331. [Google Scholar] [CrossRef]
- Westerling, A.L.; Hidalgo, H.G.; Cayan, D.R.; Swetnam, T.W. Warming and Earlier Spring Increase Western U.S. Forest Wildfire Activity. Science 2006, 313, 940–943. [Google Scholar] [CrossRef] [Green Version]
- Emelko, M.B.; Silins, U.; Bladon, K.D.; Stone, M. Implications of land disturbance on drinking water treatability in a changing climate: Demonstrating the need for “source water supply and protection” strategies. Water Res. 2011, 45, 461–472. [Google Scholar] [CrossRef]
- Carvalho, A.; Monteiro, A.; Flannigan, M.; Solman, S.; Miranda, A.I.; Borrego, C. Forest fires in a changing climate and their impacts on air quality. Atmos. Environ. 2011, 45, 5545–5553. [Google Scholar] [CrossRef]
- Verkaik, I.; Rieradevall, M.S.; Cooper, D.; Melack, J.M.; Dudley, T.L.; Prat, N. Fire as a disturbance in mediterranean climate streams. Hydrobiologia 2013, 719, 353–382. [Google Scholar] [CrossRef]
- Doerr, S.H.; Santin, C. Global trends in wildfire and its impacts: Perceptions versus realities in a changing world. Philos. Trans. R. Soc. B Biol. Sci. 2016, 371, 20150345. [Google Scholar] [CrossRef]
- Sankey, J.B.; Kreitler, J.; Hawbaker, T.J.; McVay, J.L.; Miller, M.E.; Mueller, E.R.; Sankey, T.T. Climate, wildfire, and erosion ensemble foretells more sediment in western USA watersheds. Geophys. Res. Lett. 2017, 44, 8884–8892. [Google Scholar] [CrossRef] [Green Version]
- Nunes, J.P.; Doerr, S.H.; Sheridan, G.; Neris, J.; Santín, C.; Emelko, M.B.; Silins, U.; Robichaud, P.R.; Elliot, W.J.; Keizer, J. Assessing water contamination risk from vegetation fires: Challenges, opportunities and a framework for progress. Hydrol. Process. 2018, 32, 687–694. [Google Scholar] [CrossRef] [Green Version]
- Voronova, O.S.; Zima, A.L.; Kladov, V.L.; Cherepanova, E.V. Anomalous Wildfires in Siberia in Summer 2019. Izv. Atmos. Ocean. Phys. 2020, 56, 1042–1052. [Google Scholar] [CrossRef]
- García-Falcón, M.S.; Soto-González, B.; Simal-Gándara, J. Evolution of the Concentrations of Polycyclic Aromatic Hydrocarbons in Burnt Woodland Soils. Environ. Sci. Technol. 2006, 40, 759–763. [Google Scholar] [CrossRef] [PubMed]
- Kim, E.J.; Choi, S.D.; Chang, Y.S. Levels and patterns of polycyclic aromatic hydrocarbons (PAHs) in soils after forest fires in South Korea. Environ. Sci. Pollut. Res. 2011, 18, 1508–1517. [Google Scholar] [CrossRef] [PubMed]
- Vergnoux, A.; Malleret, L.; Asia, L.; Doumenq, P.; Theraulaz, F. Impact of forest fires on PAH level and distribution in soils. Environ. Res. 2011, 111, 193–198. [Google Scholar] [CrossRef] [PubMed]
- Vicente, A.; Alves, C.; Monteiro, C.; Nunes, T.; Mirante, F.; Evtyugina, M.; Cerqueira, M.; Pio, C. Measurement of trace gases and organic compounds in the smoke plume from a wildfire in Penedono (central Portugal). Atmos. Environ. 2011, 45, 5172–5182. [Google Scholar] [CrossRef]
- Choi, S.-D. Time trends in the levels and patterns of polycyclic aromatic hydrocarbons (PAHs) in pine bark, litter, and soil after a forest fire. Sci. Total Environ. 2014, 470–471, 1441–1449. [Google Scholar] [CrossRef]
- Campos, I.; Abrantes, N.; Keizer, J.J.; Vale, C.; Pereira, P. Major and trace elements in soils and ashes of eucalypt and pine forest plantations in Portugal following a wildfire. Sci. Total Environ. 2016, 572, 1363–1376. [Google Scholar] [CrossRef] [PubMed]
- Wentworth, G.R.; Aklilua, Y.-A.; Landisb, M.S.; Hsu, Y.-M. Impacts of a large boreal wildfire on ground level atmospheric concentrations of PAHs, VOCs and ozone. Atmos. Environ. 2018, 178, 19–30. [Google Scholar] [CrossRef]
- Berthiaume, A.; Galarneau, E.; Marson, G. Polycyclic aromatic compounds (PACs) in the Canadian environment: Sources and emissions. Environ. Pollut. 2021, 269, 116008. [Google Scholar] [CrossRef] [PubMed]
- Olivella, M.A.; Ribalta, T.G.; de Febrer, A.R.; Mollet, J.M.; de Las Heras, F.X.C. Distribution of polycyclic aromatic hydrocarbons in riverine waters after Mediterranean forest fires. Sci. Total Environ. 2006, 355, 156–166. [Google Scholar] [CrossRef] [PubMed]
- Domysheva, V.M.; Sorokovikova, L.M.; Sinyukovich, V.N.; Onishchuk, N.A.; Sakirko, M.V.; Tomberg, I.V.; Zhuchenko, N.A.; Golobokova, L.P.; Khodzher, T.V. Ionic Composition of Water in Lake Baikal, Its Tributaries, and the Angara River Source during the Modern Period. Russ. Meteorol. Hydrol. 2019, 44, 687–694. [Google Scholar] [CrossRef]
- Yoshioka, T.; Ueda, S.; Khodzher, T.; Bashenkaeva, N.; Korovyakova, I.; Sorokovikova, L.; Gorbunova, L. Distribution of dissolved organic carbon in Lake Baikal and its watershed. Limnology 2002, 3, 159–168. [Google Scholar]
- Gorshkov, A.G.; Kustova, O.V.; Izosimova, O.N.; Babenko, T.A. POPs Monitoring System in Lake Baikal—Impact of Time or the First Need? Limnol. Freshwater Biol. 2018, 1, 43–48. [Google Scholar] [CrossRef] [Green Version]
- Kucklik, J.R.; Bidleman, T.F.; McConnell, L.L.; Walla, M.D.; Ivanov, G.P. Organochlorines in the water and biota of Lake Baikal, Siberia. Environ. Sci. Technol. 1994, 28, 31–37. [Google Scholar] [CrossRef]
- Kucklik, J.R.; Harvey, Н.R.; Ostrom, P.H.; Ostrom, H.E.; Baker, J.E. Organochlorine dynamics in the pelagic food web of Lake Baikal. Environ. Toxicol. Chem. Int. J. 1996, 15, 1388–1400. [Google Scholar] [CrossRef]
- Iwata, H.; Tanabe, S.; Ueda, K.; Tatsukawa, R. Persistent Orgnochlorine Residues in Air, Water, Sediments, and Soils from the Lake Baikal Region, Russia. Environ. Sci. Technol. 1995, 29, 792–801. [Google Scholar] [CrossRef]
- Nakata, H.; Tanabe, S.; Tatsukawa, R.; Amano, M.; Miyazaki, N.; Petrov, E. Persistent organochlorine residues and their accumulation kinetics in Baikal seal (Phoca sibirica) from Lake Baikal, Russia. Environ. Sci. Technol. 1995, 29, 2877–2885. [Google Scholar] [CrossRef]
- Gorshkov, A.G.; Kustova, O.V.; Dzyuba, E.V.; Zakharova, Y.R.; Shishlyannikov, S.M.; Khutoryanskiy, V.A. Polychlorinated biphenyls in Lake Baikal ecosystem. Chem. Sustain. Dev. 2017, 25, 269–278. [Google Scholar] [CrossRef]
- Samsonov, D.P.; Kochetkov, A.I.; Pasynkova, E.M.; Zapevalov, M.A. Levels of Persistent Organic Pollutants in the Components of the Lake Baikal Unique Ecosystem. Russ. Meteorol. Hydrol. 2017, 42, 345–352. [Google Scholar] [CrossRef]
- Gorshkov, A.G.; Marinaite, I.I.; Zhamsueva, G.S.; Zayakhanov, A.S. Benzopyrene Isomer Ratio in Organic Fraction of Aerosols over Water Surface of Lake Baikal. J. Aerosol. Sci. 2004, 35 (Suppl. S2), 1059–1060. [Google Scholar] [CrossRef]
- Golobokova, L.P.; Filippova, U.G.; Marinaite, I.I.; Belozerova, O.Y.; Gorshkov, A.G.; Obolkin, V.A.; Potemkin, V.L.; Khodzher, T.V. Chemical composition of atmospheric aerosol above the Lake Baikal area. Atmos. Oceanic. Opt. 2011, 24, 236–241. (In Russian) [Google Scholar]
- Gorshkov, A.G.; Mikhailova, T.A.; Berezhnaya, N.S.; Vereshcagin, A.L. Needle of Scotch Pine (Pinus sylvestris L.) as Bioindicator for Atmospheric Pollution with Polycycle Aromatic Hydrocarbonce. Chem. Sustain. Dev. 2008, 16, 155–162. [Google Scholar]
- Semenov, M.Y.; Marinaite, I.I.; Golobokova, L.P.; Khuriganova, O.I.; Khodzher, T.V.; Semenov, Y.M. Source apportionment of polycycle aromatic hydrocarbons in Lake Baikal water and adjacent layer. Chem. Ecol. 2017, 33, 977–990. [Google Scholar] [CrossRef]
- Khlystov, O.M.; Gorshkov, A.G.; Egorov, A.V.; Zemskaya, T.I.; Granin, N.G.; Kalmychkov, G.V.; Vorob’eva, S.S.; Pavlova, O.V.; Yakup, M.A.; Makarov, M.M.; et al. Oil in the lake of world heritage. Dokl. Earth Sci. 2007, 415, 682–685. [Google Scholar] [CrossRef]
- Kontorovich, A.E.; Kashirtsev, V.A.; Moskvin, V.I.; Burshtein, L.M.; Zemskaya, T.I.; Kostyreva, E.A.; Kalmychkov, G.V.; Khlystov, O.M. Petroleum potential of Baikal deposits. Russ. Geol. Geophys. 2007, 48, 1046–1053. [Google Scholar] [CrossRef]
- Gorshkov, A.G.; Izosimova, O.N.; Pavlova, O.N.; Khlystov, O.M.; Zemskaya, T.I. Assessment of water pollution near the deep oil seep in Lake Baikal. Limnol. Freshwater Biol. 2020, 2, 397–404. [Google Scholar] [CrossRef]
- Gorshkov, A.; Pavlova, O.; Khlystov, O.; Zemskaya, T. Fractioning of petroleum hydrocarbons from seeped oil as a factor of purity preservation of water in Lake Baikal (Russia). J. Great Lakes Res. 2020, 46, 115–122. [Google Scholar] [CrossRef]
- Galachyants, A.D.; Suslova, M.Y.; Marinayte, I.I.; Izosimova, O.N.; Krasnopeev, A.Y.; Shtykova, Y.R.; Tikhonova, I.V.; Podlesnaya, G.V.; Belykh, O.I. Polycyclic Aromatic Hydrocarbons in the Surface Microlayer of Lake Baikal during Wildfires and Naphthalene-Degrading Strains from the Bacterioneuston. Microbiology 2020, 89, 609–615. [Google Scholar] [CrossRef]
- Gorshkov, A.G.; Izosimova, O.N.; Kustova, O.V. Determination of Priority Polycyclic Aromatic Hydrocarbons in Water at The Trace Level. J. Anal. Chem. 2019, 74, 771–777. [Google Scholar] [CrossRef]
- Kustova, O.V.; Stepanov, A.S.; Gorshkov, A.G. Determining the Indicator Congeners of Polychlorinated Biphenyls in Water at Ultratrace Concentration Level Using Gas Chromatography-Tandem Mass-Spectrometry. J. Anal. Chem. 2021, in press. [Google Scholar]
- Nisbet, I.C.T.; LaGoy, P.K. Toxic equivalency factors (TEFs) for polycyclic aromatic hydrocarbons (PAHs). Regul. Toxicol. Pharmacol. 1992, 16, 290–300. [Google Scholar] [CrossRef]
- Kalf, D.F.; Crommentuijn, T.; van de Plassche, E.J. Environmental quality objectives for 10 polycyclic aromatic hydrocarbons (PAHs). Ecotoxicol. Environ. Saf. 1997, 36, 89–97. [Google Scholar] [CrossRef]
- Cao, Z.; Liu, J.; Luan, Y.; Li, Y.; Ma, M.; Xu, J.; Han, S. Distribution and ecosystem risk assessment of polycyclic aromatic hydrocarbons in the Luan River, China. Ecotoxicology 2010, 19, 827–837. [Google Scholar] [CrossRef]
- Yu, Y.; Yu, Z.; Wang, Z.; Lin, B.; Li, L.; Chen, X.; Zhu, X.; Xiang, M.; Ma, R. Polycyclic aromatic hydrocarbons (PAHs) in multi-phases from the drinking water source area of the Pearl River Delta (PRD) in South China: Distribution, source apportionment, and risk assessment. Environ. Sci. Pollut. Res. 2018, 25, 12557–12569. [Google Scholar] [CrossRef]
- Oksanen, J.; Kindt, R.; Legendre, P.; O’Hara, B.; Simpson, G.L.; Solymos, P.R.; Stevens, M.H.H.; Wagner, H. The 2008 Vegan Package. Community Ecology Package Version 1.15–1; License GPL-2. Available online: https://cran.r-project.org/; https://vegan.r.-project.org/ (accessed on 24 September 2021).
- Roshydromet. Available online: https://Global-Climate-Change.RU/Index.PHP/EN/Roshydromet (accessed on 30 June 2021).
- Draxler, R.R. The calculation of low-level winds from the archived data of a regional primitive equation model. J. Appl. Meteorol. Pap. 1990, 29, 240–248. [Google Scholar] [CrossRef] [Green Version]
- Rusenek, O.T. Baicalogy; Rusenek, O.T., Ed.; Nauka: Novosibirsk, Russia, 2012; p. 466. (In Russian) [Google Scholar]
- Khodzher, T.V.; Zagaynov, V.A.; Lushnikov, A.A.; Chausov, V.D.; Zhamsueva, G.S.; Zayakhanov, A.S.; ·Tsydypov, V.V.; Potemkin, V.L.; Marinaite, I.I.; Maksimenko, V.V.; et al. Study of Aerosol Nano- and Submicron Particle Compositions in the Atmosphere of Lake Baikal During Natural Fire Events and Their Interaction with Water Surface. Water Air Soil Pollut. 2021, 232, 266. [Google Scholar] [CrossRef]
- Satellite Image. Available online: https://worldview.earthdata.nasa.gov/(Events–FilterEvents-Wildfires) (accessed on 18 December 2019).
- Grice, K.; Hong, L.; Atahan, P.; Asif, M.; Hallmann, C.; Greenwood, P.; Maslen, E.; Tulipani, S.; Williford, K.; Dodson, J. New insights into the origin of perylene in geological samples. Geochim. Cosmochim. Acta 2009, 73, 6531–6543. [Google Scholar] [CrossRef]
- Rogge, W.F.; Hildemann, L.M.; Mazurek, M.A.; Cass, G.R.; Simoneit, B.R.T. Sources of fine organic aerosol. Pine, oak, and synthetic log combustion in residential fireplaces. Environ. Sci. Technol. 1998, 32, 13–22. [Google Scholar] [CrossRef]
- Stortini, A.M.; Martellini, T.; Del Bubba, M.; Lepri, L.; Capodaglio, G.; Cincinelli, A. n-Alkanes, PAHs and surfactants in the sea surface microlayer and sea water samples of the Gerlache Inlet Sea (Antarctica). Microchem. J. 2009, 92, 37–43. [Google Scholar] [CrossRef] [Green Version]
- Hardy, J.T.; Crecelius, E.A.; Antrim, L.D.; Kiessere, S.L.; Broadhurst, V.L.; Bohem, P.D.; Steinhauer, W.G.; Coogan, T.H. Aquatic surface microlayer contamination in Chesapeake Bay. Mar. Chem. 1990, 28, 333–351. [Google Scholar] [CrossRef]
- Cross, J.N.; Hardy, J.T.; Hose, J.E.; Hershelamn, G.P.; Antrim, L.D.; Gossett, R.W.; Crecelius, E.A. Contaminant concentrations and toxicity of sea-surface microlayer near Los Angeles, California. Mar. Environ. Res. 1987, 23, 307–323. [Google Scholar] [CrossRef]
- Cincinelli, A.; Stortini, A.M.; Perugini, M.L.; Checchini, L.L. Organic pollutants in sea-surface microlayer and aerosol in the coastal environment of Leghorn (Tyrrhenian Sea). Mar. Chem. 2001, 76, 77–98. [Google Scholar] [CrossRef] [Green Version]
- Golobokova, L.P.; Khodzher, T.V.; Izosimova, O.N.; Zenkova, P.N.; Pochyufarov, A.O.; Khuriganowa, O.I.; Onishyuk, N.A.; Marinayte, I.I.; Polkin, V.V.; Radionov, V.F.; et al. Chemical composition of atmospheric aerosol in the Arctic region along the routes of the research cruises in 2018–2019. Atmos. Oceanic. Opt. 2020, 33, 421–429. [Google Scholar] [CrossRef]
- Estrellan, C.R.; Lino, F. Toxic emissions from open burning. Chemosphere 2010, 80, 193–207. [Google Scholar] [CrossRef]
- Falahudin, D.; Munawir, K.; Arifin, Z.; Wagey, G.A. Distribution and sources of polycyclic aromatic hydrocarbons (PAHs) in coastal waters of the Timor Sea. Coast. Mar. Sci. 2012, 35, 112–121. [Google Scholar]
- Maskaoui, K.; Zhou, J.L.; Hong, H.S.; Zhang, Z.L. Contamination by polycyclic aromatic hydrocarbons in the Jiulong River Estuary and Western Xiamen Sea, China. Environ. Pollut. 2002, 118, 109–122. [Google Scholar] [CrossRef]
- Zhi, H.; Zhao, Z.; Zhang, L. The fate of polycyclic aromatic hydrocarbons (PAHs) and organochlorine pesticides (OCPs) in water from Poyang Lake, the largest freshwater lake in China. Chemosphere 2015, 119, 1134–1140. [Google Scholar] [CrossRef] [PubMed]
- Khumam, S.N.; Chakraborty, P.; Cincinelli, A.; Snow, D.D.; Kumar, B. Polycyclic aromatic hydrocarbons in surface waters and riverine sediments of the Hooghly and Brahmaputra Rivers in the Eastern and Northeastern India. Sci. Total Environ. 2018, 636, 751–760. [Google Scholar] [CrossRef] [PubMed]
- Montuori, P.; Triassi, M. Polycyclic aromatic hydrocarbons load into the Mediterranean Sea: Estimate of Sarno River inputs. Mar. Pollut. Bull. 2012, 64, 512–520. [Google Scholar] [CrossRef] [PubMed] [Green Version]
- Rabodonirina, S.; Net, S.; Ouddane, B.; Merhaby, D.; Dumoulin, D.; Popescu, T.; Ravelonandro, P. Distribution of persistent organic pollutants (PAHs, Me-PAHs, PCBs) in dissolved, particulate and sedimentary phases in freshwater systems. Environ. Pollut. 2015, 206, 38–48. [Google Scholar] [CrossRef]
- Zhou, J.L.; Maskaoui, K. Distribution of polycyclic aromatic hydrocarbons in water and surface sediments from Daya Bay, China. Environ. Pollut. 2003, 121, 269–281. [Google Scholar] [CrossRef]
- Nasher, E.; Heng, L.Y.; Zakaria, Z.; Surif, S. Concentrations and sources of polycyclic aromatic hydrocarbons in the seawater around Langkawi Island, Malaysia. J. Chem. 2013, 2013, 975781. [Google Scholar] [CrossRef]
- Polidoro, B.A.; Comeros-Raynal, M.T.; Clement, C. Land-based sources of marine pollution: Pesticides, PAHs and phthalates in coastal stream water, and heavy metals in coastal stream sediments in American Samoa. Mar. Pollut. Bull. 2017, 116, 501–507. [Google Scholar] [CrossRef]
- Inam, E.; Offiong, N.-A.; Essien, J.; Kang, S.; Kang, S.-Y.; Antia, B. Polycyclic aromatic hydrocarbons loads and potential risks in freshwater ecosystem of the Ikpa River Basin, Niger Delta—Nigeria. Environ. Monit. Assess. 2016, 188, 49. [Google Scholar] [CrossRef]
- Santana, J.L.; Massone, C.G.; Valde´s, M.; Vazquez, R.; Lima, L.A.; Olivares-Rieumont, S. Occurrence and Source Appraisal of Polycyclic Aromatic Hydrocarbons (PAHs) in Surface Waters of the Almendares River, Cuba. Arch. Environ. Contam. Toxicol. 2015, 69, 143–152. [Google Scholar] [CrossRef]
- Witt, G. Occurrence and transport of polycyclic aromatic hydrocarbons in the water bodies of the Baltic Sea. Mar. Chem. 2002, 79, 49–66. [Google Scholar] [CrossRef]
- Directive 2013/39/EU of the European Parliament and of the Council of 12 August 2013. Available online: https://eur-lex.europa.eu/LexUriServ/LexUriServ.do?uri=OJ:L:2013:226:0001:0017:en:PDF (accessed on 24 September 2021).
- SanPiN (Sanitary Norms and Rules) 1.2.3685-21. Hygienic Standards and Requirements for Ensuring the Safety and (or) Harmlessness to Humans of Environmental Factors, Moscow, 2021. Available online: https://biotorg.com/upload/medialibrary/039/SanPiN-1.2.3685_21.pdf (accessed on 24 September 2021). (In Russian).
- Shishlyannikov, S.M.; Nikonova, A.A.; Klimenkov, I.V.; Gorshkov, A.G. Accumulation of petroleum hydrocarbons in intracellular lipid bodies of the freshwater diatom Synedra acus subsp. Radians. Environ. Sci. Pollut. Res. 2017, 24, 275–283. [Google Scholar] [CrossRef] [PubMed]
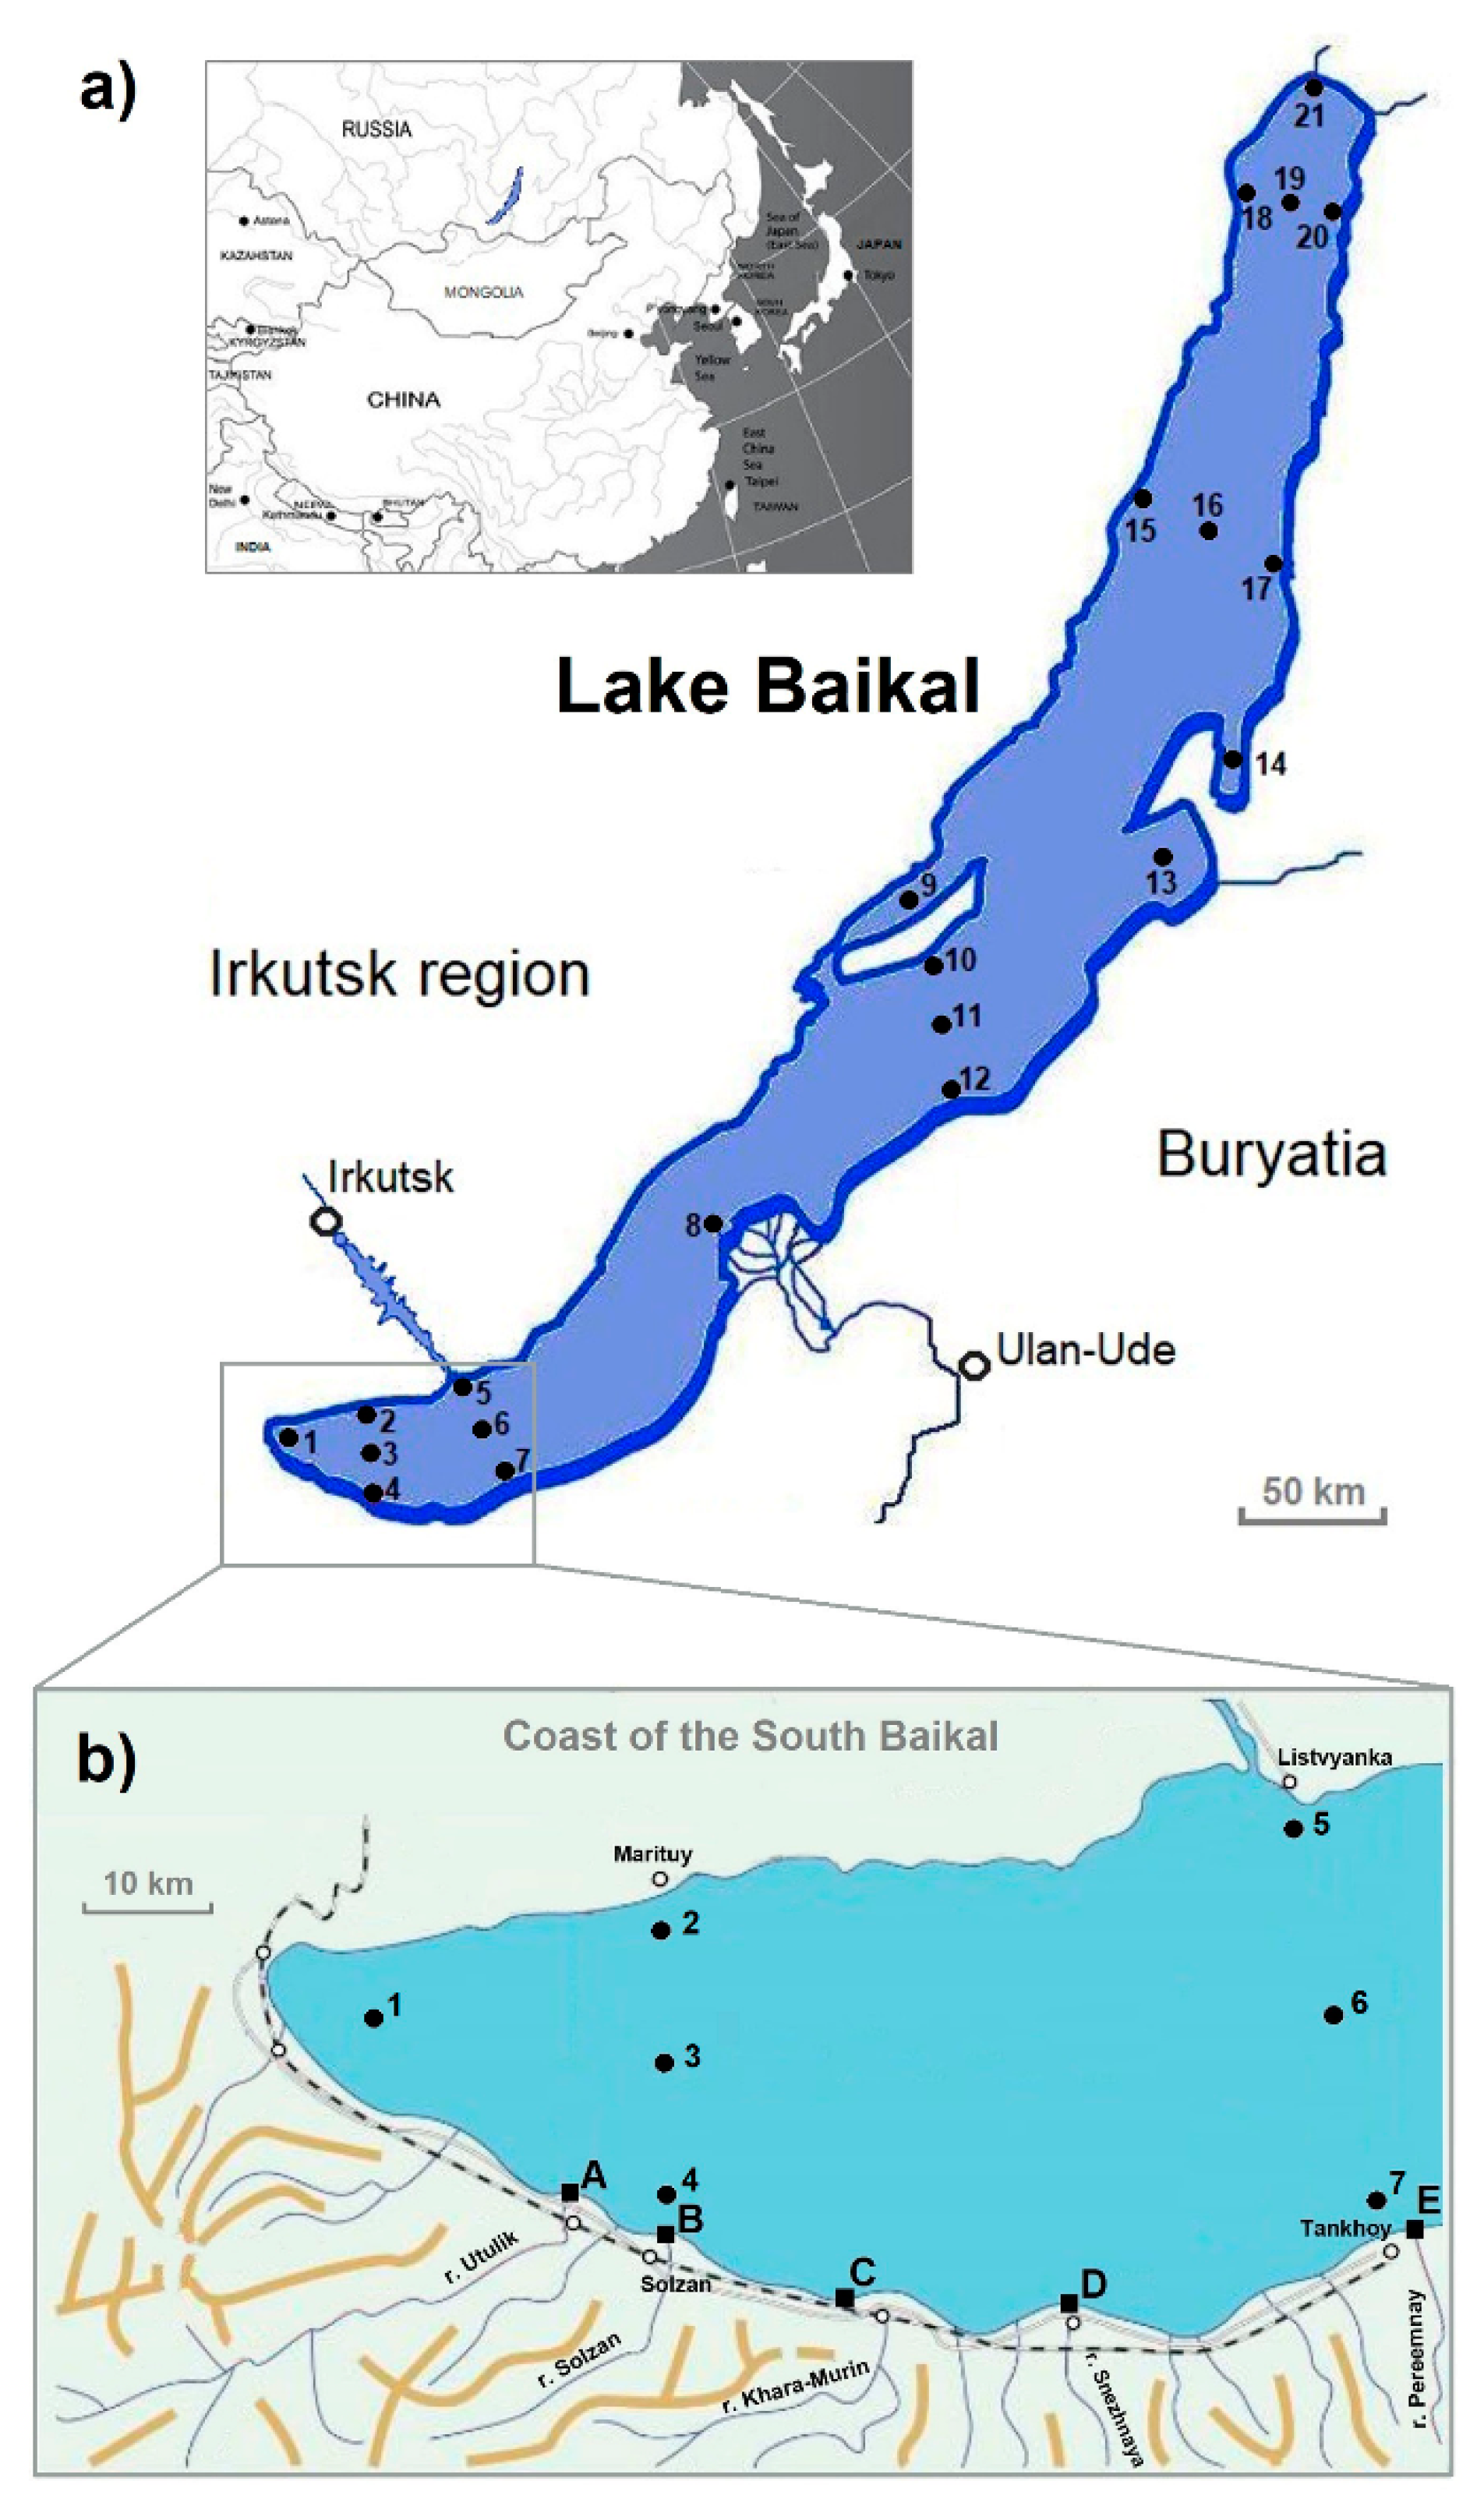
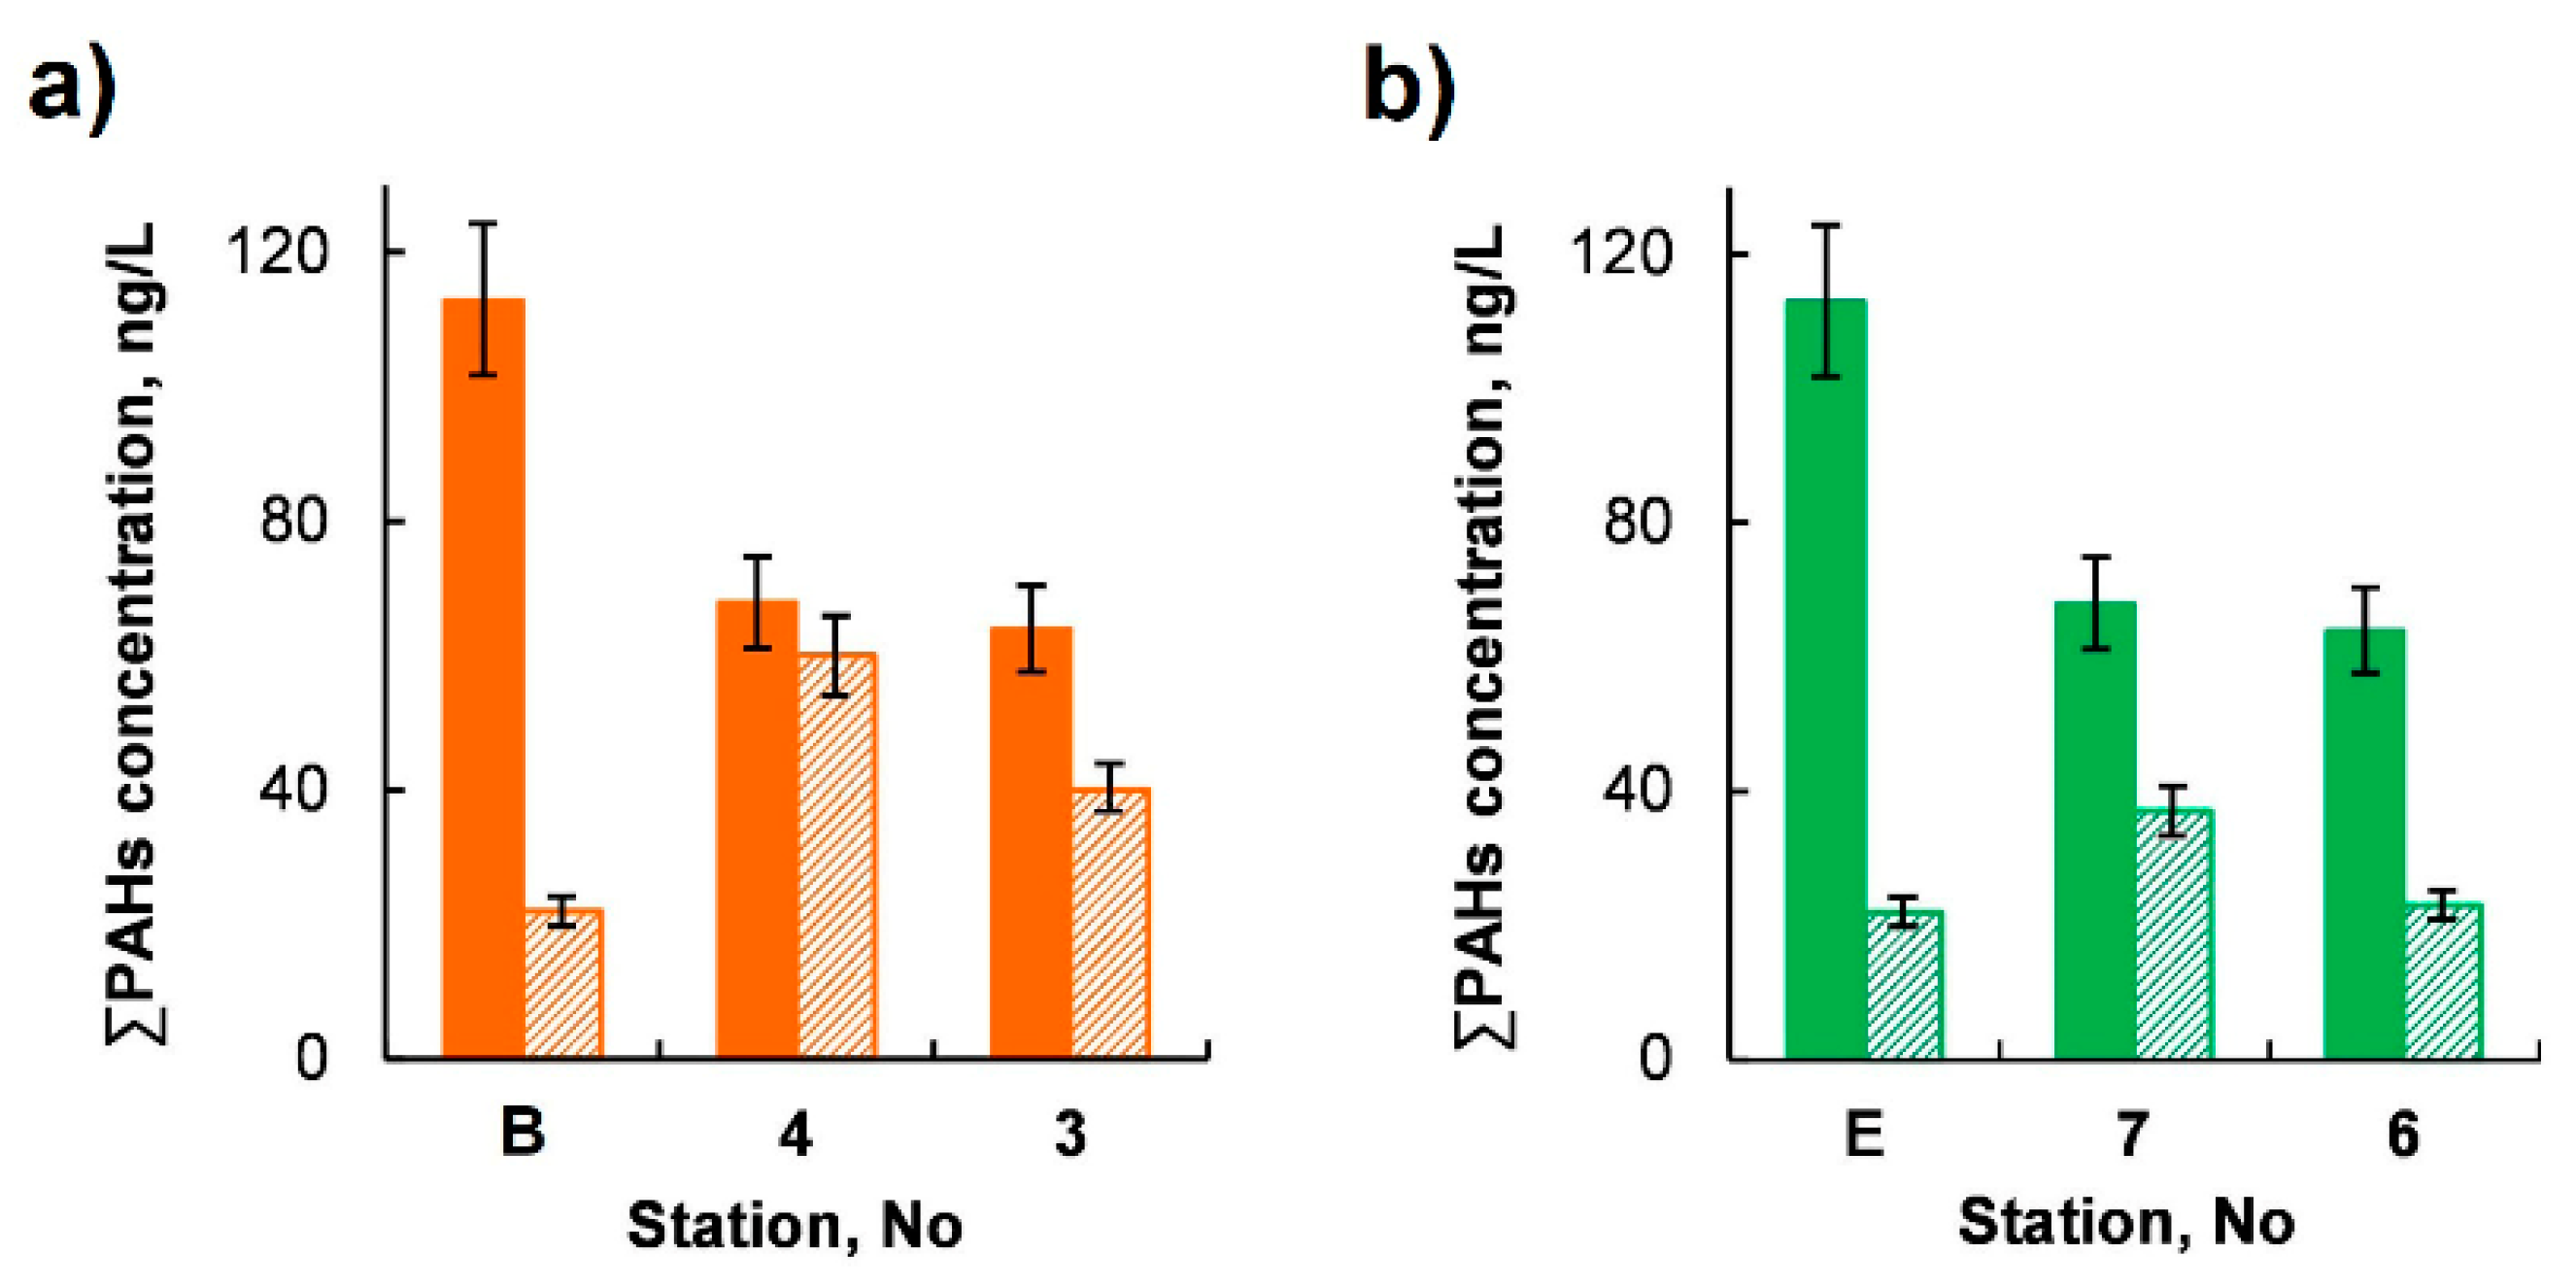
 —southern basin,
  —northern basin. The extreme concentrations of ƩPAHs recorded in September 2016
  , and June 2019
  .
—southern basin, —northern basin. The extreme concentrations of ƩPAHs recorded in September 2016 , and June 2019 .
.
—southern basin, —northern basin. The extreme concentrations of ƩPAHs recorded in September 2016 , and June 2019 .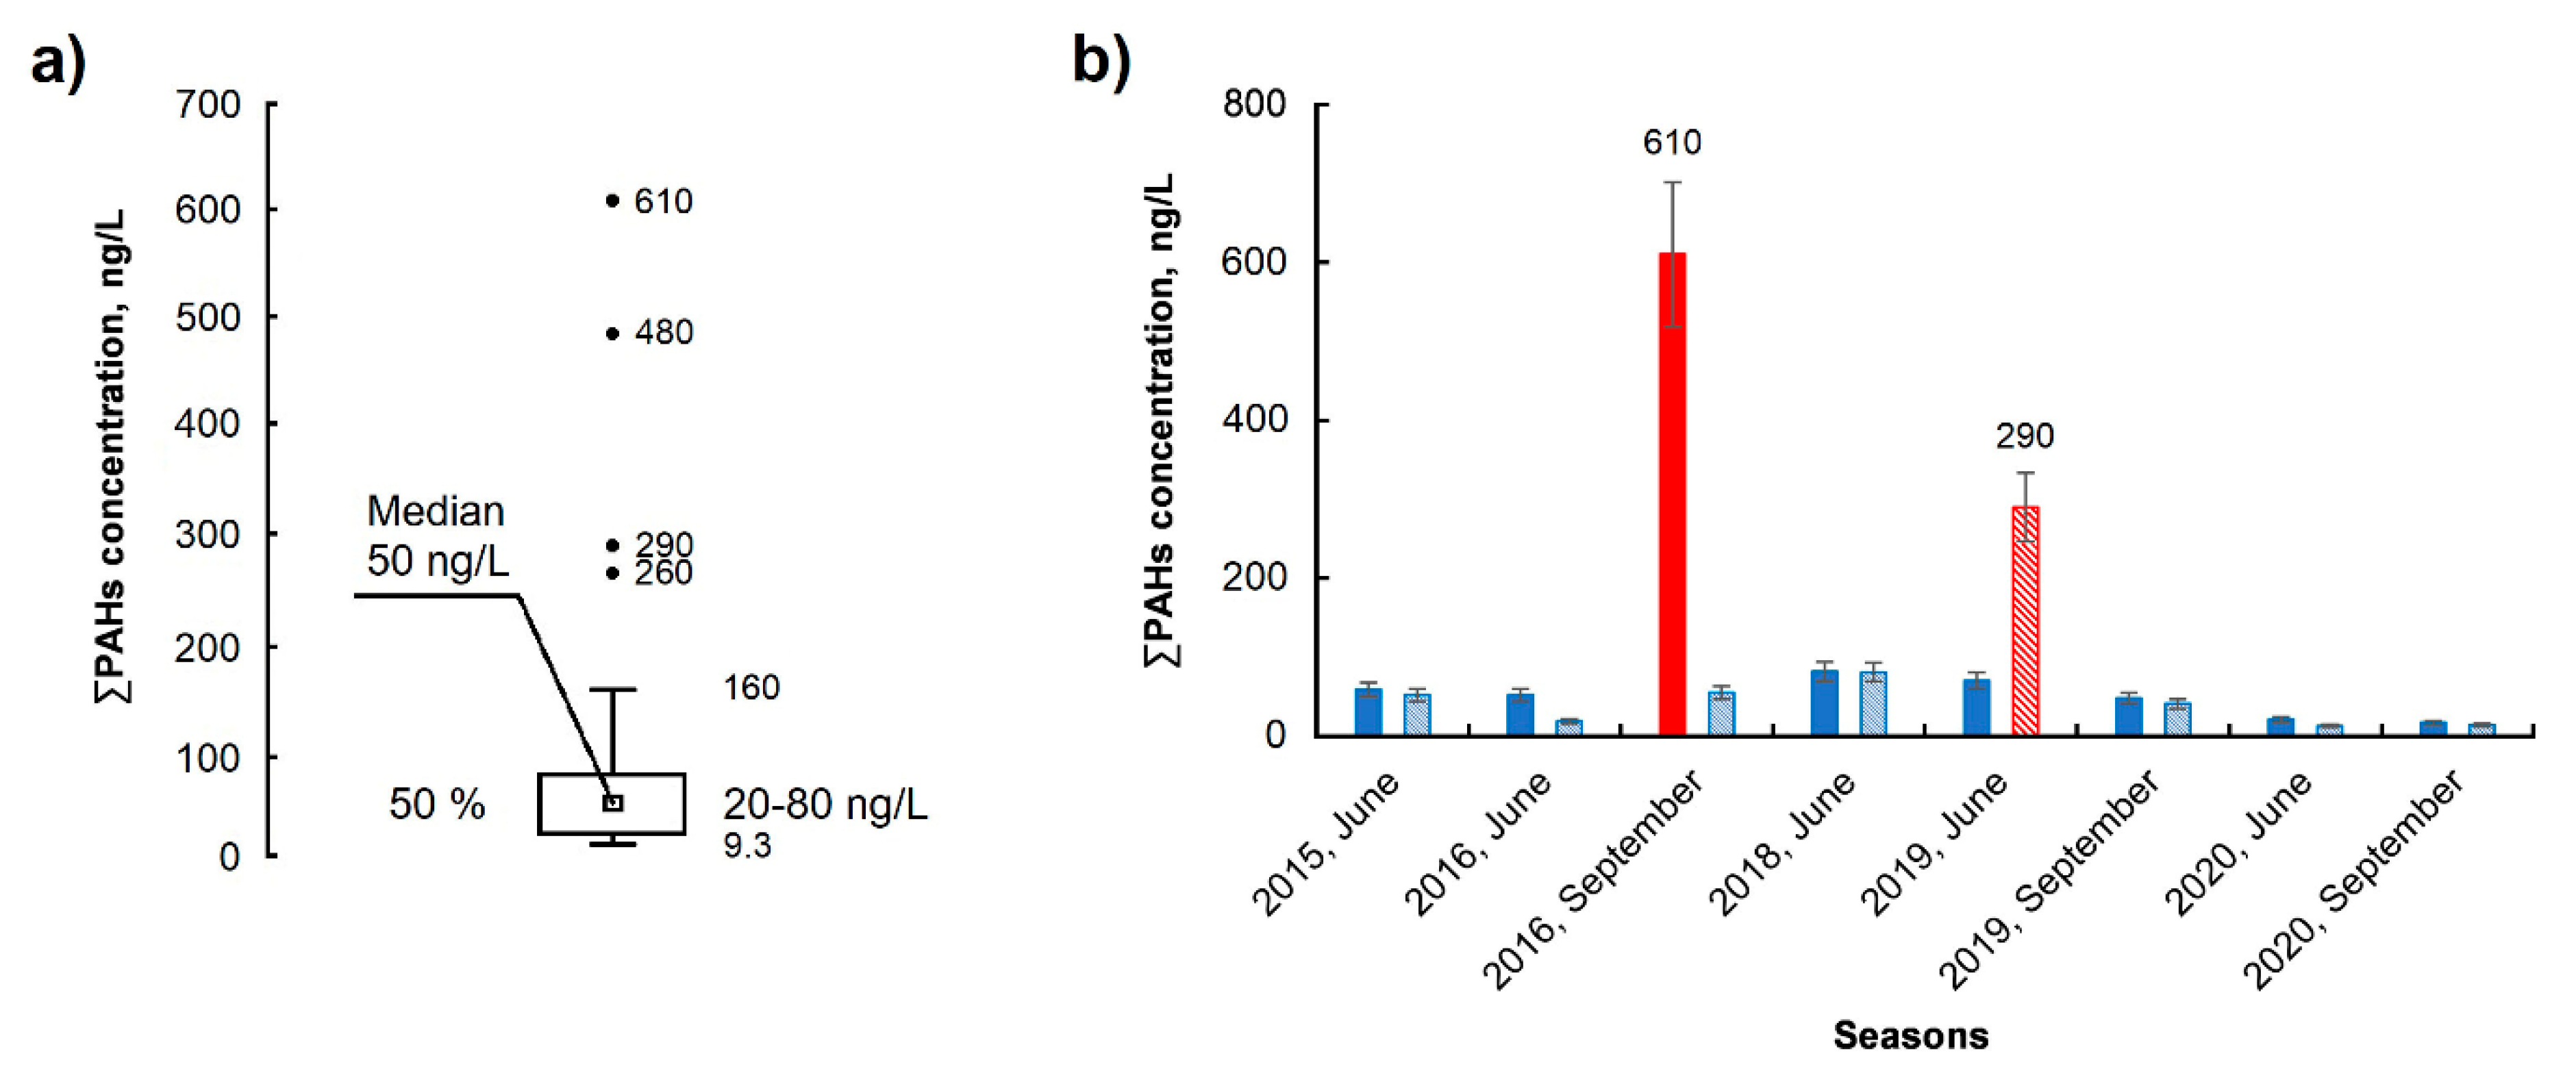


 and September
  2016; (b) in May
  and September
  2019.
and September 2016; (b) in May and September 2019.
2019.
and September 2016; (b) in May and September 2019.
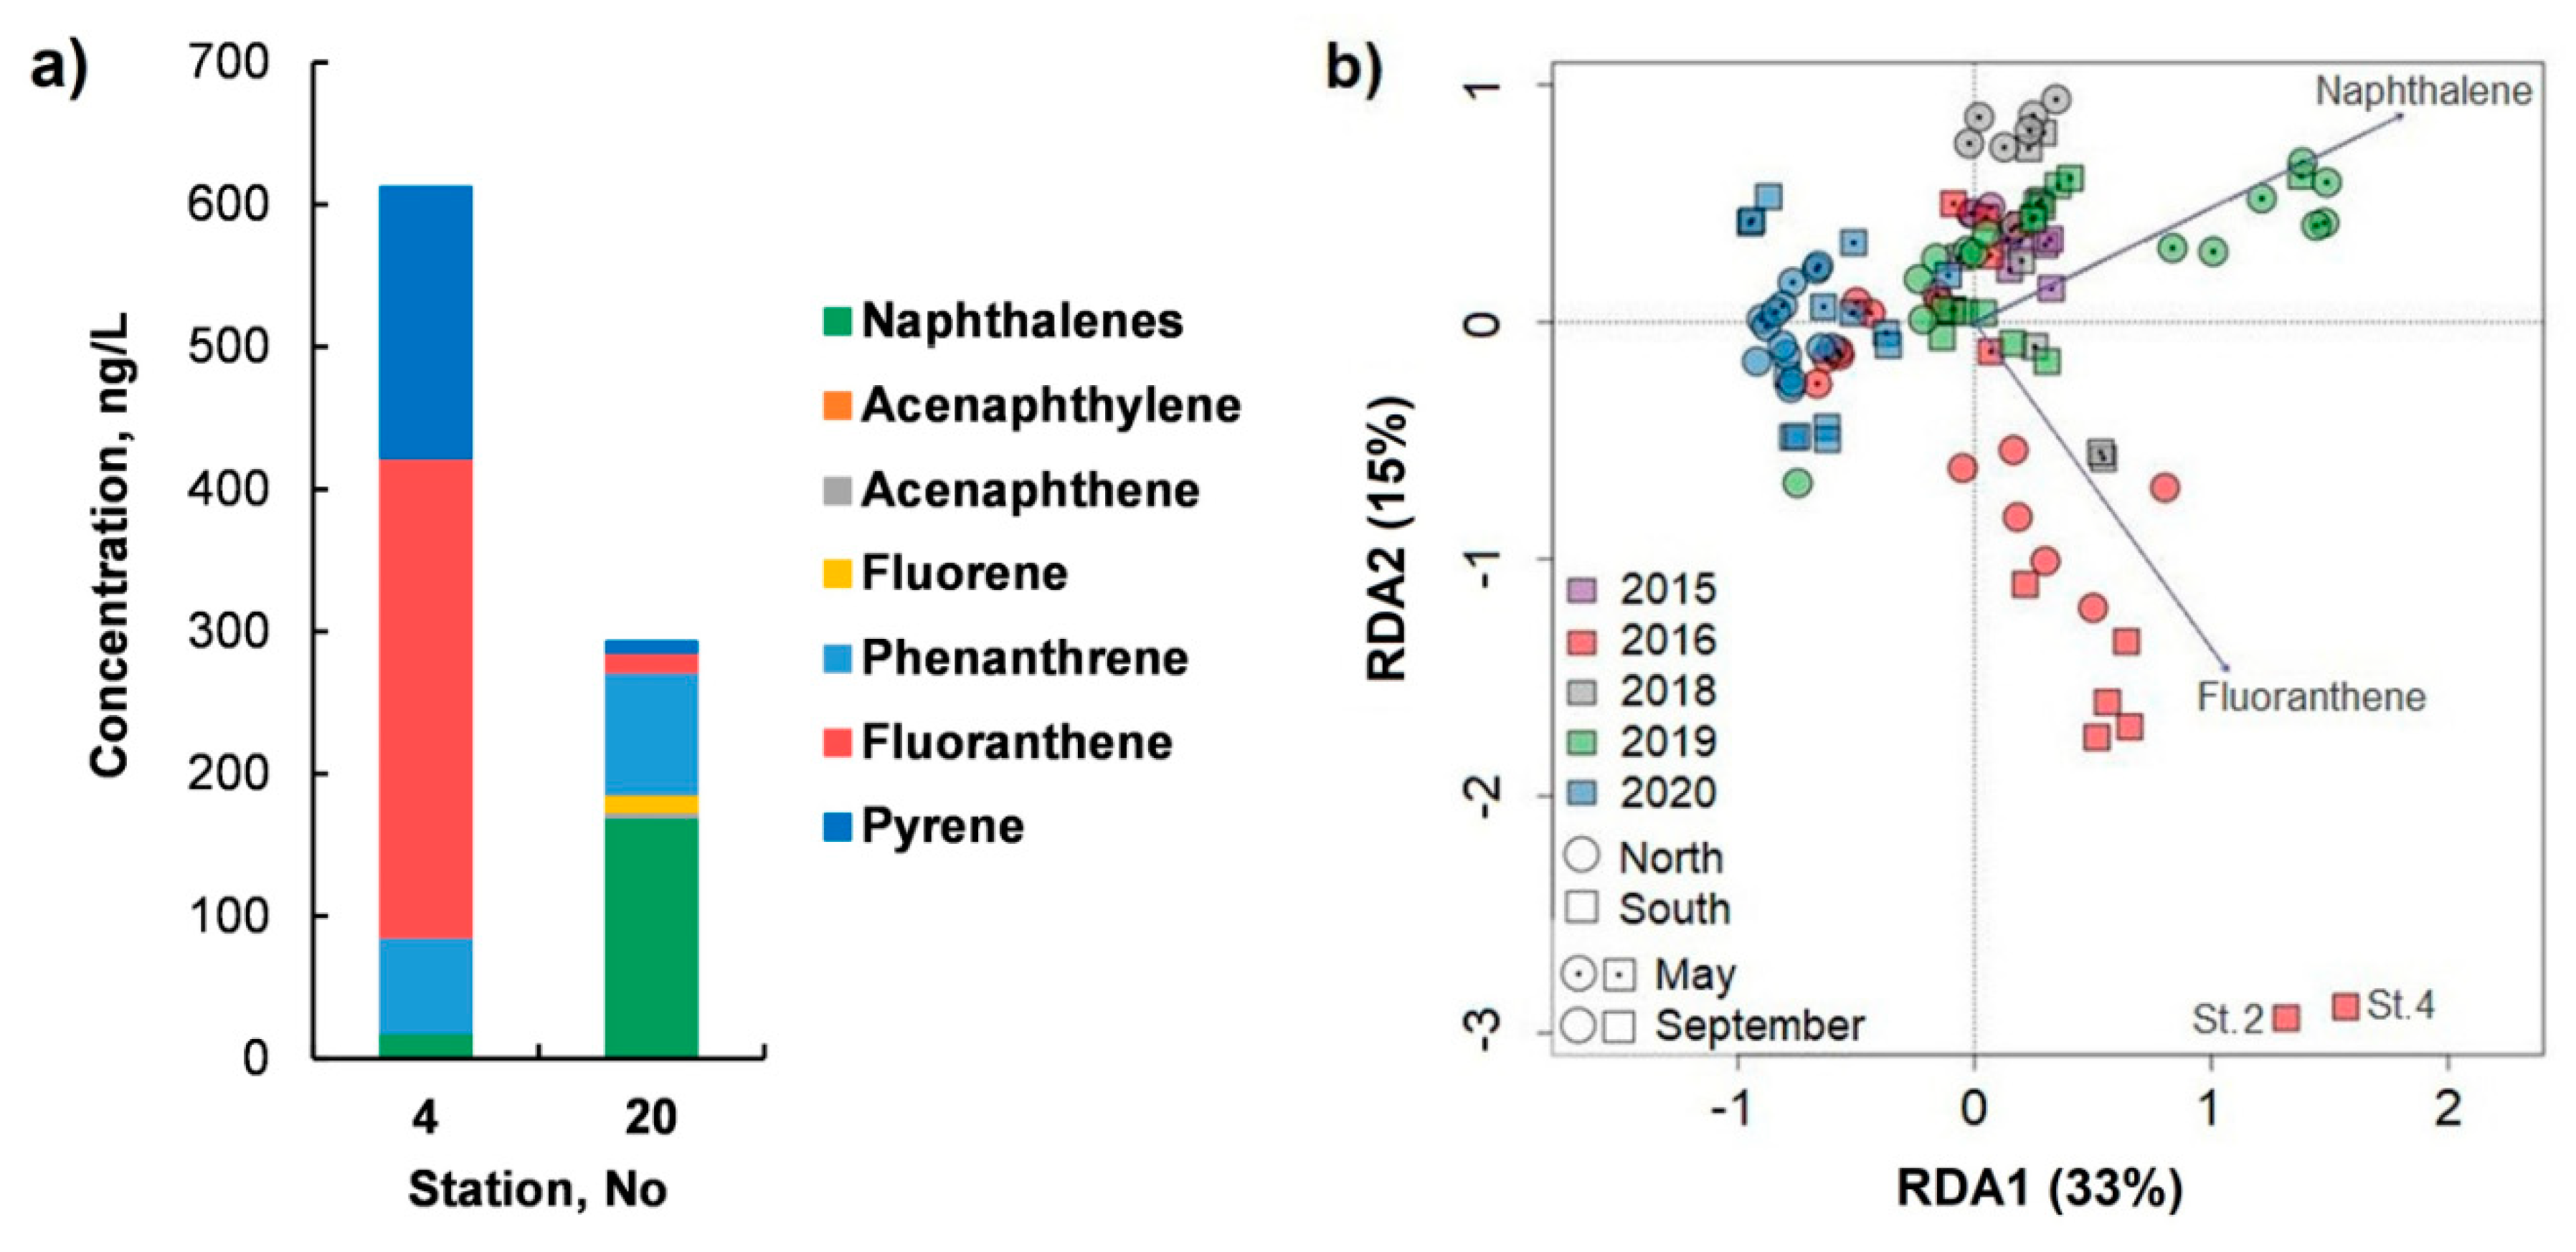
 , in the northern basin of Lake Baikal in September 2019—
  , and in the pelagic zone of Lake Baikal during the 2020 season—
  .
, in the northern basin of Lake Baikal in September 2019— , and in the pelagic zone of Lake Baikal during the 2020 season— .
.
, in the northern basin of Lake Baikal in September 2019— , and in the pelagic zone of Lake Baikal during the 2020 season— .
Publisher’s Note: MDPI stays neutral with regard to jurisdictional claims in published maps and institutional affiliations. |
© 2021 by the authors. Licensee MDPI, Basel, Switzerland. This article is an open access article distributed under the terms and conditions of the Creative Commons Attribution (CC BY) license (https://creativecommons.org/licenses/by/4.0/).
Share and Cite
Gorshkov, A.G.; Izosimova, O.N.; Kustova, O.V.; Marinaite, I.I.; Galachyants, Y.P.; Sinyukovich, V.N.; Khodzher, T.V. Wildfires as a Source of PAHs in Surface Waters of Background Areas (Lake Baikal, Russia). Water 2021, 13, 2636. https://doi.org/10.3390/w13192636
Gorshkov AG, Izosimova ON, Kustova OV, Marinaite II, Galachyants YP, Sinyukovich VN, Khodzher TV. Wildfires as a Source of PAHs in Surface Waters of Background Areas (Lake Baikal, Russia). Water. 2021; 13(19):2636. https://doi.org/10.3390/w13192636
Chicago/Turabian StyleGorshkov, Alexander G., Oksana N. Izosimova, Olga V. Kustova, Irina I. Marinaite, Yuri P. Galachyants, Valery N. Sinyukovich, and Tamara V. Khodzher. 2021. "Wildfires as a Source of PAHs in Surface Waters of Background Areas (Lake Baikal, Russia)" Water 13, no. 19: 2636. https://doi.org/10.3390/w13192636