
Hydrological Performance of Green Roofs in Mediterranean Climates: A Review and Evaluation of Patterns


1
Instituto Superior de Agronomia, Universidade de Lisboa, Tapada da Ajuda, 1349-017 Lisbon, Portugal
2
LEAF, Linking Landscape, Environment, Agriculture and Food Research Center, Associated Laboratory TERRA, Instituto Superior de Agronomia, Universidade de Lisboa, Tapada da Ajuda, 1349-017 Lisbon, Portugal
3
CERIS, Department of Civil Engineering, Architecture and Georesources (DECivil), Instituto Superior Técnico, Universidade de Lisboa, Av. Rovisco Pais, 1049-001 Lisbon, Portugal
*
Author to whom correspondence should be addressed.
Water 2021, 13(18), 2600; https://doi.org/10.3390/w13182600
Submission received: 15 July 2021
/
Revised: 5 September 2021
/
Accepted: 14 September 2021
/
Published: 21 September 2021
(This article belongs to the Special Issue Green Infrastructure as a Technology for Rainwater Retention)
Abstract
:The capacity of green roofs to intercept rainfall, and consequently store and slow runoff resulting in a reduction in flood risk, is one of their main advantages. In this review, previous research related to the influence of green roofs on the hydrological cycle is examined with a special focus on studies for Mediterranean climate conditions (Csa and Csb according to the Köppen–Geiger climate classification). This climate is characterized by short and intense rainfall occurrences which, along with the increased area of impervious surface on Mediterranean regions, intensify the risk of flooding, particularly in the cities. The analysis covers the variables rainfall retention (R, %), runoff delay (RD, min or h), peak delay (PD, min or h), peak attenuation (PA, %), and runoff coefficient (RC, −), in relation to physical features of the green roof such as layers, substrate depth, slope, and vegetation, as well as, weather conditions, such as monthly temperature and monthly precipitation. Following a statistical analysis, some patterns for the average rainfall retention (%) were found in the published literature for green roofs under Mediterranean climate conditions—namely, that the most significant variables are related to the substrate depth, the existence of certain layers (root barrier, drainage layer), the origin of the vegetation, the types of green roofs (extensive, semi-intensive, intensive), and the precipitation and temperature of the location. Moreover, a multivariate analysis was conducted using multiple linear regression to identify the set of green roof features and weather conditions that best explain the rainfall retention (%), taking into consideration not only the studies under Mediterranean conditions but all climates, and a similar pattern emerged. Recommendations for future research include addressing the effect of physical features and weather conditions on the other variables (RD, PD, PA, RC) since, although present in some studies, they still do not provide enough information to reach clear conclusions.
1. Introduction
By 2018, 55.3% of the world population lived in cities, and by 2030 it is predicted that globally 60% of people will live in urban settlements [1]. This growing urbanization influences the natural water cycle because it increases the proportion of impermeable surface, and consequently there is more surface runoff and a reduction in infiltration [2].
The hydrological behavior at Mediterranean cities has a large variability at different scales, from the multidecadal scale to the mesoscale. The complex geography of the Mediterranean region, which includes a nearly enclosed sea with high sea surface temperature during summer and fall, surrounded by urbanized littorals and mountains where various rivers originate, has a crucial role in steering airflow. This is the case of the Mediterranean Sea that “acts as a moisture and heat source for the atmosphere through air-sea fluxes, so that energetic mesoscale features are present in the atmospheric circulation, which can evolve to high-impact weather systems, such as heavy precipitation and flash flooding, cyclogenesis and wind storms” [3].
Green roofs are a strategy for increasing surface permeability by imitating the hydrologic functions of cities before the intense construction that results in the impermeability of the soil. Thus, green roofs can have the ability to mitigate flood risks in compact cities [4]. The hydrological behavior of a green roof is site specific, and it depends not only on the location but also on the substrate composition, substrate depth, and type of vegetation, among others [5]. For designing purposes, it is also crucial to properly assess the subsurface runoff coefficient of the green roof, expressed as the ratio between the runoff from vegetated roof and the rainfall. This ratio is a useful index to quantify the hydraulic efficiency of a green roof since the subsurface runoff coefficient of a given green roof is defined under specific climate conditions and its influencing factors [6].
The ability of green roofs to reduce stormwater runoff and contribute to prevent floods by retaining rainwater in the substrate and then returning it to the atmosphere through transpiration and evaporation is one of green roofs main advantages. Other benefits include (1) the reduction in the urban heat island effect by removing heat from the air through evapotranspiration, reducing temperatures of the surrounding air, and by absorbing around 80% of the emitted heat by human activities; (2) the reduction in energy use, since green roofs can absorb thermal energy and act as a thermal insulator, which reduces cooling and heating energy requirements; (3) the increase in water runoff quality by the filtration of pollutants and heavy metals out of rainwater; (4) the reduction in air pollution and greenhouse gas emissions because vegetation has the ability to filter the air; (5) the increased sound isolation, since the soil can block lower frequencies and the plants can block higher frequencies; (6) the improvement of aesthetic value; and (7) the increase in biodiversity, being a habitat for many species that otherwise would have a more limited natural space [6,7,8,9]. It is expected that different combined assemblies in green roof construction give different results. In this study, we focused on the following physical features of green roofs: (1) layers (number and types of layers); (2) system (complete green roof vs. module); (3) substrate depth; (4) vegetation (coverage, type, origin); (5) slope; (6) type of green roof (extensive, semi-intensive, intensive).
For the study of the hydrological performance of green roofs, the parameters found in the literature were rainfall retention, runoff coefficient, runoff delay, peak delay, peak attenuation, rainfall retention at peak rate, runoff flow rate, runoff duration, and CN (runoff curve number), among others. This review focuses on the variables of rainfall retention, runoff coefficient, runoff delay, peak delay, and peak attenuation because they are the most studied, and all of them are crucial for understanding the rainfall–runoff relationship of green roofs.
This study has a special focus on the Mediterranean climate; thus, it was very important to identify the corresponding climate for each publication that contained an experiment with results for the parameters mentioned above. To do so, we used the Köppen–Geiger climate classification, which classifies the Mediterranean climate as Csa (hot-summer Mediterranean climate) and Csb (warm-summer Mediterranean climate). This classification system has 30 types of climate classes, with the dominant climate class by land area being arid B (30.2%), followed by cold D (24.6%), tropical A (19.0%), temperate C (13.4%), and polar E (12.8%). The updated Köppen–Geiger climate type map is based on the climatology at stations over the whole period of recording, with each variable being individually interpolated [10].
2. Materials and Methods
2.1. Research Focus
This review focused on peer-reviewed journal papers that contained data about the hydrological performance of green roofs and that could be found using Web of Science (https://apps.webofknowledge.com. accessed on 15 June 2020). The keywords used for this research were “green roof water retention”, “ecological roof water retention”, “living roof water retention”, “green roof runoff”, “ecological roof runoff”, “living roof runoff”, “green roof hydrological”, “ecological roof hydrological”, “living roof hydrological”, “green roof Mediterranean”, “ecological roof Mediterranean”, and “living roof Mediterranean”. We defined the period under analysis as 2000 until 2019.
Based on the keywords, 1504 publications were found. These publications were screened using the methodology depicted in Figure 1, which entails four phases of exclusion: (1) non peer-reviewed articles; (2) non-English publications; (3) duplicate articles; and (4) different publications that relate to the same experiments during periods that overlap and articles that did not have observations for at least one of the variables under study.
From the selection, 63 publications were identified as relevant to the goals of the literature review. This review concentrated on the variables that are most representative of the hydrological cycle and are most studied in relation to the hydrological performance of green roofs:
- (a)
- Rainfall retention (R, %)
The difference between the total incoming rainfall depth and the total runoff depth, divided by the total rainfall depth.
- (b)
- Runoff delay (RD, min)
The time difference between the beginning of rainfall and the beginning of runoff.
- (c)
- Peak attenuation (PA, %)
The difference between rainfall and runoff peaks (maximum values registered for 10 min duration), divided by the rainfall peak.
- (d)
- Peak delay (PD, min)
The time difference between rainfall and runoff peaks.
- (e)
- Runoff coefficient (RC, −)
The total runoff depth divided by the total depth of precipitation.
As this parameter reflects the green roof capacity in the flow control quantity, low values of RC indicate that a greater amount of rainfall is retained in the roof (high efficiency), while high values show that practically all the precipitation is drained (low efficiency).
It is important to emphasize that some studies presented in this work considered rainfall retention (%) taking into consideration evapotranspiration, while some others only considered the total incoming rainfall depth and the total runoff depth to calculate R (%), as mentioned above.
The selected 63 articles included results from 281 different experiments, which varied according to physical features and weather conditions. Only 14 of the 63 articles were dedicated to the Mediterranean climate, providing data from 80 different experiments on green roofs/test beds divided by Mediterranean hot summer—Csa (45) and Mediterranean warm/cold Summer—Csb (35) climates. Accordingly, we had a sample of 14 studies describing the hydrological behavior of green roofs under Mediterranean conditions between 2010 and 2019; the countries where the experiments were conducted are presented in Table A8 of Appendix A. The climate for which we found the most studies was Cf, with 9 papers for humid subtropical climate (Cfa) and 13 works for oceanic climate (Cfb). The complete enumeration of articles under analysis as well as the corresponding number of experiments and associated climate according to the Köppen–Geiger climate classification is shown in Table 1.
The experiments for the same study were considered as independent observations because they were never multiple measures of a single test but were measurements of multiple different test subjects. We considered more than one experiment by article when the variables such as location, season, system (complete green roof vs. module), substrate depth, substrate components, type of vegetation, plant coverage, slope, type of green roof, etc. were different between experiments. Following this procedure, we collected information related to the rainfall retention, runoff delay, peak attenuation, peak delay, and runoff coefficient given by these studies, as well as the corresponding green roofs’ physical characteristics and climate conditions. Afterwards, through methods of statistical inference based on this sample, we obtained certain population tendencies.
Thus, we found 14 articles that had experiments for the hydrological behavior of green roofs under a Mediterranean climate, but we had 76 experiments with which to conduct the statistical analysis.
2.2. Methods of Analysis
The data were analyzed using a statistical approach including descriptive statistics, exploratory data analysis, and statistical modeling. In this study, we show the results of the descriptive statistics and statistical modeling. This analysis was performed using RStudio (Version 1.2.5042).
Descriptive statistics were used to quantitatively describe and summarize the basic features of the data, particularly the central tendency (location) and dispersion (scale). Thus, the mean (), minimum (Min), maximum (Max), standard deviation , median (Md), quartile 25 (Q1), quartile 75 (Q3), and median absolute deviation (MAD) were calculated for the average rainfall retention (%), runoff delay (min), peak attenuation (%), peak delay (min), and runoff coefficient (−). Next, according to the guidelines of the central limit theorem, we established which among the variables average rainfall retention (%), runoff delay (min), peak attenuation (%), peak delay (min), and runoff coefficient (−) were more significant and should be analyzed.
Exploratory data analysis (EDA) was then used to provide the context needed to develop an appropriate model for the rainfall retention of green roofs. However, the results from the EDA are not shown in this paper. Afterwards, with a univariate analysis, we determined which of the different physical features and weather conditions were significant for green roofs under Mediterranean climate. For this analysis, the statistical tests used for the categorical variables were the Student’s t-test, the analysis of variance (ANOVA test), the Wilcoxon rank sum test, and Kruskal–Wallis test, whereas for the continuous variables, the statistical test applied was Spearman’s rank correlation coefficient. A statistical test is a process used to decide between two complementary hypotheses based on formulating a statistical hypothesis and using a statistical method to decide between the hypotheses. The steps for this hypothesis testing are (1) an assumption is made about the value of the population parameter; (2) a sampling statistic is selected to perform the test; (3) the critical values of the test are determined; (4) a statistical decision is made. The parametric tests conducted in these analyses were two-sided tests:
Hypotheses 0 (H0).
Hypotheses 1 (H1).
We studied each one of the physical features and weather conditions variables separately, and consequently, for the categorical variables, we used the one-way analysis of variance (ANOVA), which is an extension of independent two-samples t-test for comparing means in a situation where there are more than two groups. In the one-way ANOVA, the data are organized into several groups based on one single grouping variable (also called a factor variable); when the variable under analysis only has two groups, we used the Student’s t-test. When the Student’s t-test/ANOVA test assumptions were violated, we applied the Wilcoxon rank sum test or the Kruskal–Wallis test to check if the k samples came from identical populations.
First, we checked the assumption of normality with the Shapiro–Wilk test and the homogeneity of variances with Levene’s test. When the assumptions were not violated, we used the parametric tests, Student’s t-test for categorical variables with two groups and the ANOVA test for categorical variables with more than two groups. When one of the assumptions was violated, we applied nonparametric tests: Wilcoxon rank sum test for categorical variables with two groups and the Kruskal–Wallis test for categorical variables with more than two groups. For the quantitative variables, we applied the Spearman’s rank-order correlation. We did not apply the Pearson correlation because any distribution of the continuous variables was normal, and thus we had to use the nonparametric version.
Finally, a multivariate analysis was done using multiple linear regression to identify the set of green roof features and weather conditions that best explained the rainfall retention (%). This part of the work was conducted taking into consideration not only studies of Mediterranean conditions but also studies of other climates. We considered the 63 articles that showed results for the hydrological performance of green roofs. The variables included in the model were chosen using the best-subsets method, the adjusted R2, and the Akaike Information Criterion (AICC). Regression outliers were identified based on Cook’s distance, considering an outlier the cases with a Cook’s distance greater than 4/n (n is the number of cases). Similar groups in categorical variables were merged whenever the relationship between the input and the target was not significantly different (p-value greater than 0.1). Interactions and non-linear relationships were not accounted for in the model.
We decided to generate the model based on all climates because we found a significant number of studies (n = 63) when compared with the number of studies for the Mediterranean climate only (n = 14).
3. Results and Discussion
3.1. Descriptive Statistics
The summary statistics for each variable—rainfall retention, runoff delay, peak attenuation, peak delay, runoff coefficient—and mean (), minimum (Min), maximum (Max), standard deviation (), median (Md), quartile 25 (Q1), quartile 75 (Q3), and median absolute deviation (MAD) are shown in Table 4.
Following the guidelines of the central limit theorem, we established which among the variables average rainfall retention (%), runoff delay (min), peak attenuation (%), peak delay (min), and runoff coefficient (−) were more significant for further studies. The central limit theorem establishes the following: (1) when the population is asymmetric and departs from the normal shape, the larger the sample must be; (2) the normal approximation is generally satisfactory when n is equal to or above 30; and (3) if inferior to 30, the approximation is satisfactory if the distribution of the population is similar to the normal distribution. Therefore, according to these guidelines we applied the Shapiro–Wilk normality test. The Shapiro–Wilks test hypotheses are:
Null Hypothesis (H0).
The distributions of the different groups are normal.
Alternate Hypothesis (H1).
At least one distribution is not normal.
Thus, we decided to study more deeply the peak attenuation and runoff coefficient because the samples had a normal distribution (Table 4). Furthermore, considering the size of each sample, the rainfall retention was also studied more closely.
3.2. Statistical Analysis
3.2.1. Univariate Analysis
- Categorical variables
First, we checked the Student’s t-test and ANOVA test assumptions to determine if we should use a parametric or a nonparametric test (Appendix A—Table A1). The results for the normality and homoscedasticity assumptions are shown in Appendix A (Table A2, Table A3, Table A4 and Table A5). We only tested the homogeneity of variances (Levene’s test hypotheses) when the null hypothesis was true for the Shapiro–Wilk test. The Shapiro–Wilks test hypotheses are mentioned in Section 3.1.
Levene’s test hypotheses:
Null Hypothesis (H0).
The Normal distributions of the different groups are homoscedastic.
Alternate Hypothesis (H1).
At least one of the distributions of the different groups has a different variance.
In Table 5, we can see the results for the categorical variables. The threshold for a minimum population size is n = 4. The categorical variables that presented a significant difference between groups were the rainfall retention (%) and runoff coefficient (−) according to the system, the rainfall retention (%) divided by the existence of a root barrier, the peak attenuation (%) and runoff coefficient (−) grouped by the presence of a waterproofing layer, the peak attenuation (%) according to the existence of a filtration layer, the rainfall retention (%) divided by class of the substrate depth, the rainfall retention (%) grouped by the origin of the vegetation, the runoff coefficient (−) divided by the slope class, and the rainfall retention (%) grouped by the type of green roof. Thus, according to the results, the presence of layers such as a root barrier and a waterproofing layer is very important for the hydrological performance of the green roof. Additionally, the class of the substrate depth and slope are apparently important for the rainfall retention (%) and runoff coefficient (−), respectively. The slope had initially three groups, but because there was only one article with class 3 slope we did not use it in the calculations. As expected, different results were found if the experiment took place in a complete green roof or in a module, and also the results were clearly different if the green roof was extensive, semi-intensive, or intensive.
The categorical variables that did not seem to influence the hydrological performance of the green roof were the climate (Köppen–Geiger) and the type of vegetation. Concerning the climate, it is important to highlight that the univariate analysis was only for the two types of Mediterranean climates (Csa and Csb). As for the types of vegetation, we should take into consideration that the only types of vegetation being considered were “sedums and other succulents”, “perennial herbaceous plants and grasses” and “both”; the other types of vegetation—namely, “shrubs” and “shrubs with perennial herbaceous plants” and “grasses”—were not included because there were not enough experiments.
It is important to highlight that since rainfall retention (%) was included in most experiments (n = 76), its results are the most reliable, followed by the runoff coefficient (−) (n = 46) and peak attenuation (%) (n = 11); therefore, variables such as the existence of a filtration layer and slope class, which were not relevant to the rainfall retention (%) but were significantly different for the peak attenuation (%) and runoff coefficient (−), respectively, may not be relevant to the hydrological performance of green roofs.
Analyzing by rainfall retention (%), we can say that the variables that showed a significant difference between them were the system (modules/complete green roof), the existence of a root barrier (Yes/No), the substrate depth (class 1, 2, or 3), the origin of the vegetation (native, not native, or both), and the type of green roof (extensive, semi-intensive, or intensive). According to the Kruskal–Wallis test, the difference between the groups’ medians R (%) is statistically significant for the substrate depth class (class 1, class 2, and class 3) and the type of green roof (extensive, semi-intensive, and intensive). Additionally, when performing the ANOVA test there was a statistically significant difference between groups’ mean R (%) for the origin of the vegetation (native, not native, both). Thus, it is important to understand between which groups there was a difference, and these calculations are shown in Table 6.
As stated in Table 6, for the relationship rainfall retention (%)–substrate depth class, the pairwise comparison shows that all classes are significantly different between them (p < 0.05). As for rainfall retention (%)–type of green roof, the results show that extensive–intensive and semi-intensive–extensive are significantly different (p < 0.05), whereas intensive–semi-intensive is not significantly different. Finally, the results of the Tukey multiple comparison of means applied to the relationship rainfall retention (%)–native show that only the difference between native–both and native–not native is significant with an adjusted p-value of 2 × 10⁻⁷ and 0.0133, respectively.
- Continuous variables
We started the analysis of the continuous variables by checking if any of the distributions were normal and to see if we could apply the Pearson’s correlation. These calculations were made using the Shapiro–Wilk test (Appendix A—Table A6). However, even if the distribution was normal for the peak attenuation (%) and runoff coefficient (−), none of the continuous variables under analysis had a normal distribution. Thus, we never had to calculate the correlation between two normal distributions. Therefore, the Spearman’s rank-order correlation was applied to all (Table 7).
According to the results given by Spearman’s correlation (Table 7), the continuous variables most relevant to the rainfall retention (%) are the average monthly precipitation (mm), with ρ = −0.4764; the average monthly temperature (°C), with ρ = 0.4837; and the substrate depth (mm), with ρ = 0.4883. The rainfall retention (%) decreases when the average monthly precipitation (mm) increases, and the opposite is verified for the average monthly temperature (°C). As for the substrate depth (mm), when its deeper, the rainfall retention (%) increases.
The average rainfall retention relation with the depth of substrate is shown in Figure 2a,b, confirming that a deeper substrate depth corresponds to a higher rainfall retention. Additionally, confirming the results given by Spearman’s correlation, according to Figure 2c, the higher the average monthly temperature, the higher the average rainfall retention, which is possibly because a higher temperature corresponds to higher evapotranspiration rate, resulting in a higher average rainfall retention. Finally, Figure 2d illustrates that the higher the average monthly precipitation, the lower the average rainfall retention, which is possibly because a higher temperature corresponds to higher evapotranspiration rate, resulting in a higher average rainfall retention.
As expected, when ρ was negative for rainfall retention (%), ρ was positive for runoff coefficient (−), and the opposite happens when ρ was positive for rainfall retention (%). The strongest correlation with runoff coefficient (−) is for the average monthly precipitation (mm), with ρ = 0.4889.
It is interesting to highlight that the average monthly precipitation and average monthly temperature are important for the hydrological performance of the green roof. However, the same cannot be said for the standard deviation of the monthly precipitation and the standard deviation of the monthly temperature.
Additionally, according to the results, the plant coverage (%) does not seem to be relevant, possibly because there are more important aspects to the vegetation than its coverage, such as the type and origin of the vegetation. As for the substrate depth (mm), when analyzed along with the result for the categorial variable substrate depth class, we can infer that substrate depth-related variables are important to predict the rainfall retention of a green roof under Mediterranean conditions.
It is important to emphasize that the continuous variables—average monthly precipitation (mm), standard deviation of the monthly precipitation (mm), average monthly temperature (°C), and standard deviation of the monthly temperature (°C)—refer to values of the locations of the experiments and are not site and time specific. If more detailed, the correlation would probably be even stronger.
3.2.2. Multivariate Analysis
The multivariate analysis took into consideration not only studies for the Mediterranean climate but also all the literature that was found and is mentioned in Figure 1. The studies of simulated rainfall were excluded from the sample used for linear regression modeling. Additionally, the variables for which only a few studies reported data (e.g., substrate porosity), or variables that were unique (e.g., location) or unrelated to the physics of the phenomena (e.g., measuring instrument), were not considered when developing the models.
The best multiple linear regression model achieved an R2 = 0.874 using the variables listed in Table 8. The model was obtained using the adjusted R2 as the criterion to include or exclude the variables in the model, obtaining an adjusted R2 of 0.863. The model fits a sample of 175 cases after excluding outliers based on the Cook’s distance. Using the Akaike Information Criterion led to a model with a slightly less explanatory capability.
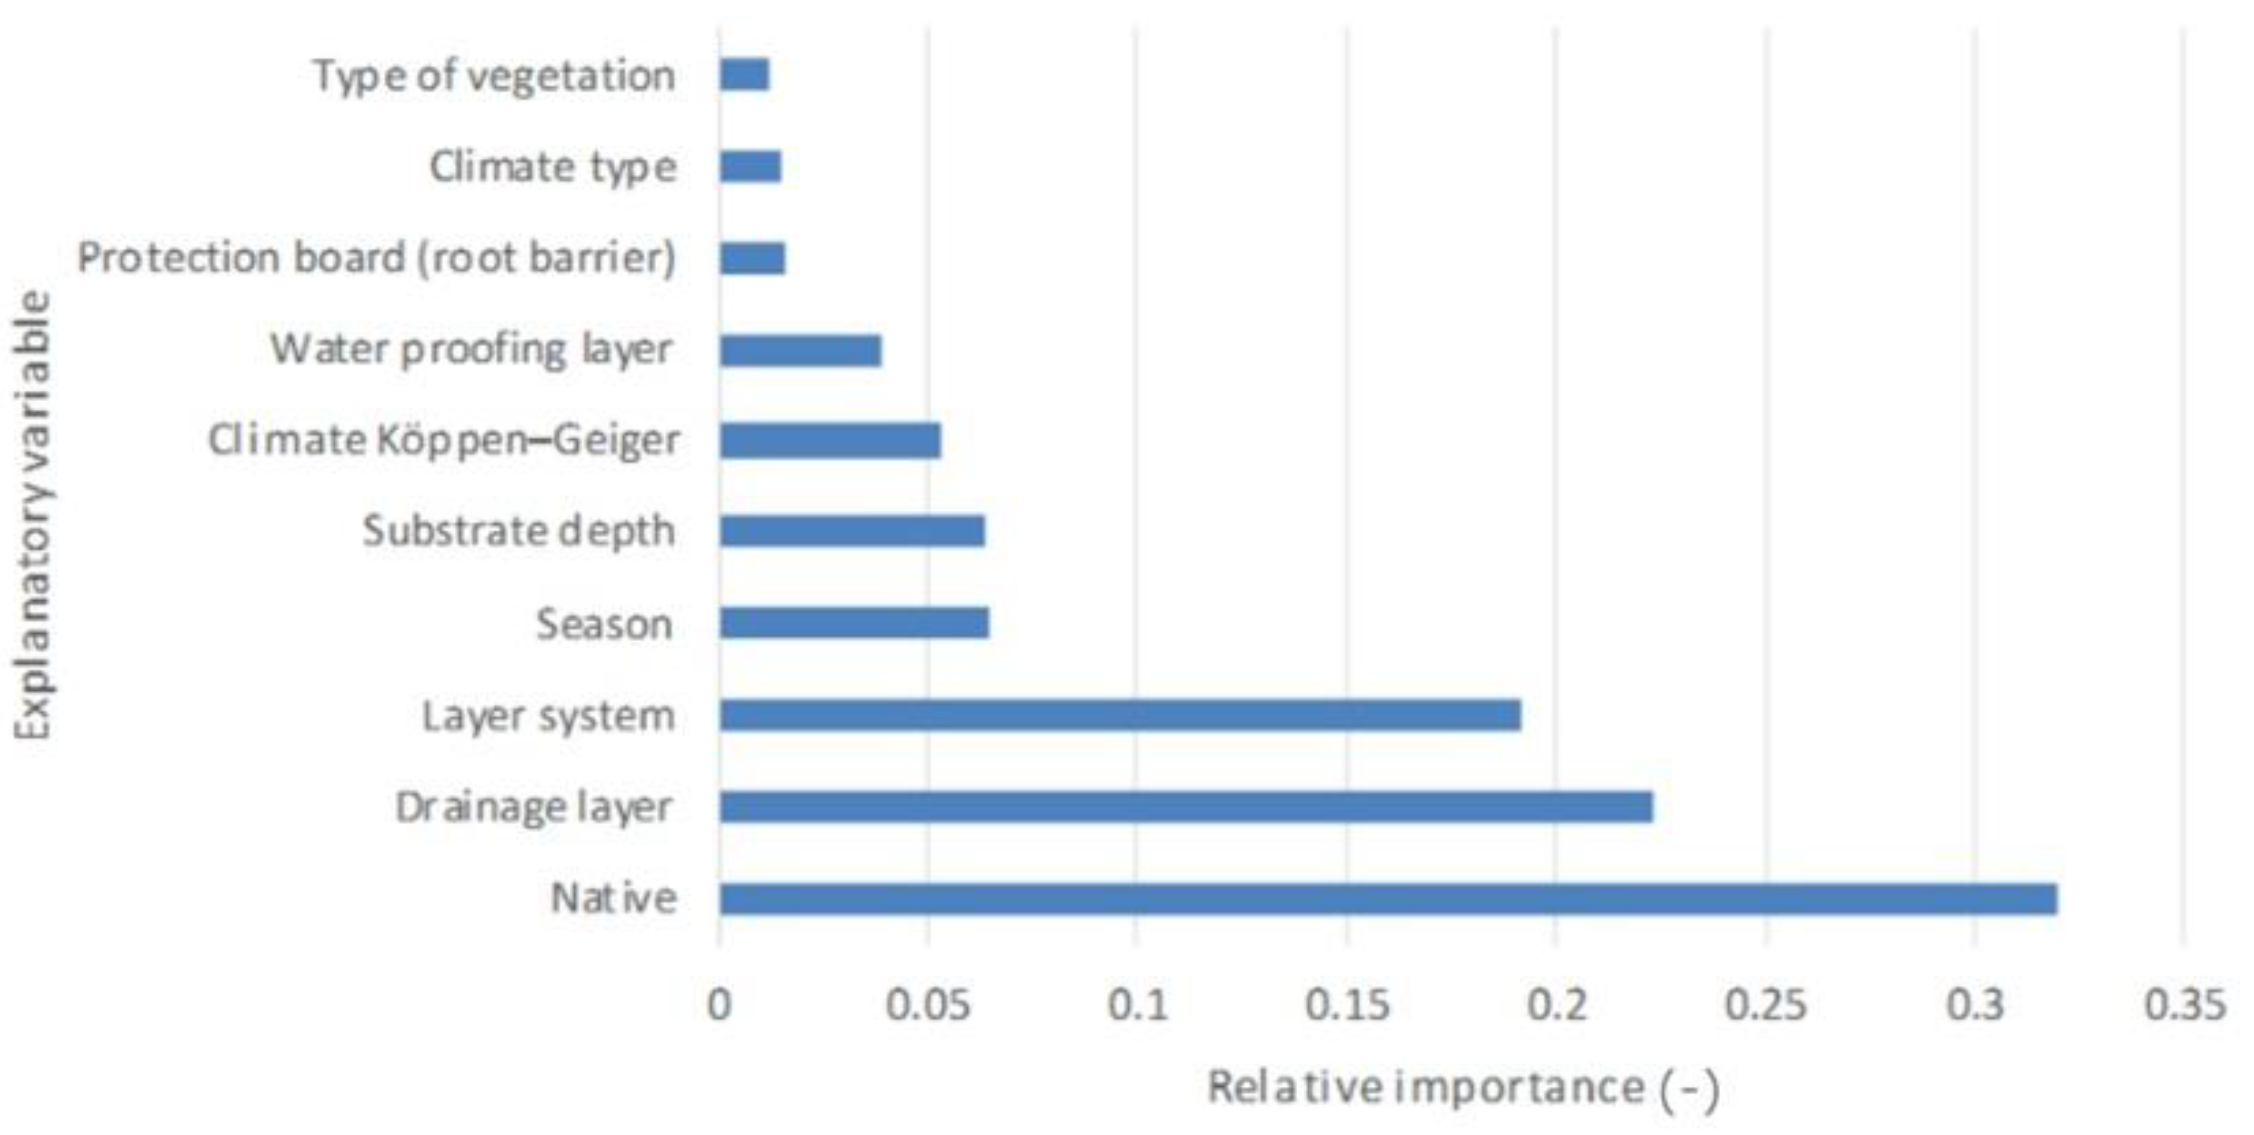
All the variables included in the model were statistically significant (p-value < 0.05) or, for the categorical variables, this happened for at least one of the categories. The relative importance of the statistically significant explanatory variables is listed in Figure 3. The native, drainage layer and layers system were found to be the most relevant variables, being responsible for explaining more than 63% of the variability of the rainfall retention. The remaining variability that the model was capable of explaining (86.30 – 63.00 = 23.30%) was provided by the remaining variables in the model.
Table 9 presents the coefficients of the model. Amongst the categorical variables, the native, the layer system, and the climate type remained unchanged, with all other variables in the model having categories merged since they were not statistically significant for explaining the rainfall retention. The only category that was not statistically significant was the type of vegetation = unknown, but this may be explained by the fact that there were only five cases in this condition. The substrate depth required filling one missing value with the average depth of the sample.
The reference model corresponds to the following equation:
where AR is the average rainfall retention (%), and SD the substrate depth (mm). This model reflects the performance of green roofs with vegetation other than sedums and other succulents and perennial herbaceous plants and grasses, unknown if they are native, with a drainage layer, a single layer, a waterproofing layer and without protection board outside the Mediterranean and Cwa (Dry-winter humid subtropical) climates. Additionally, this reference model predicts the average rainfall retention during all seasons including Spring/Summer, Fall, Winter, and Winter/Spring.
AR = 45.422 + 0.093 + SD
Most variables have a positive effect on the reference average rainfall retention, except for the drainage layer, layer system, and waterproofing layer. Some of the most compelling conclusions are that multilayer solutions and the nonexistence of a drainage layer or a waterproofing layer decrease the rainfall retention. Additionally, it is also possible to conclude that the rainfall retention is lower in the Mediterranean climate.
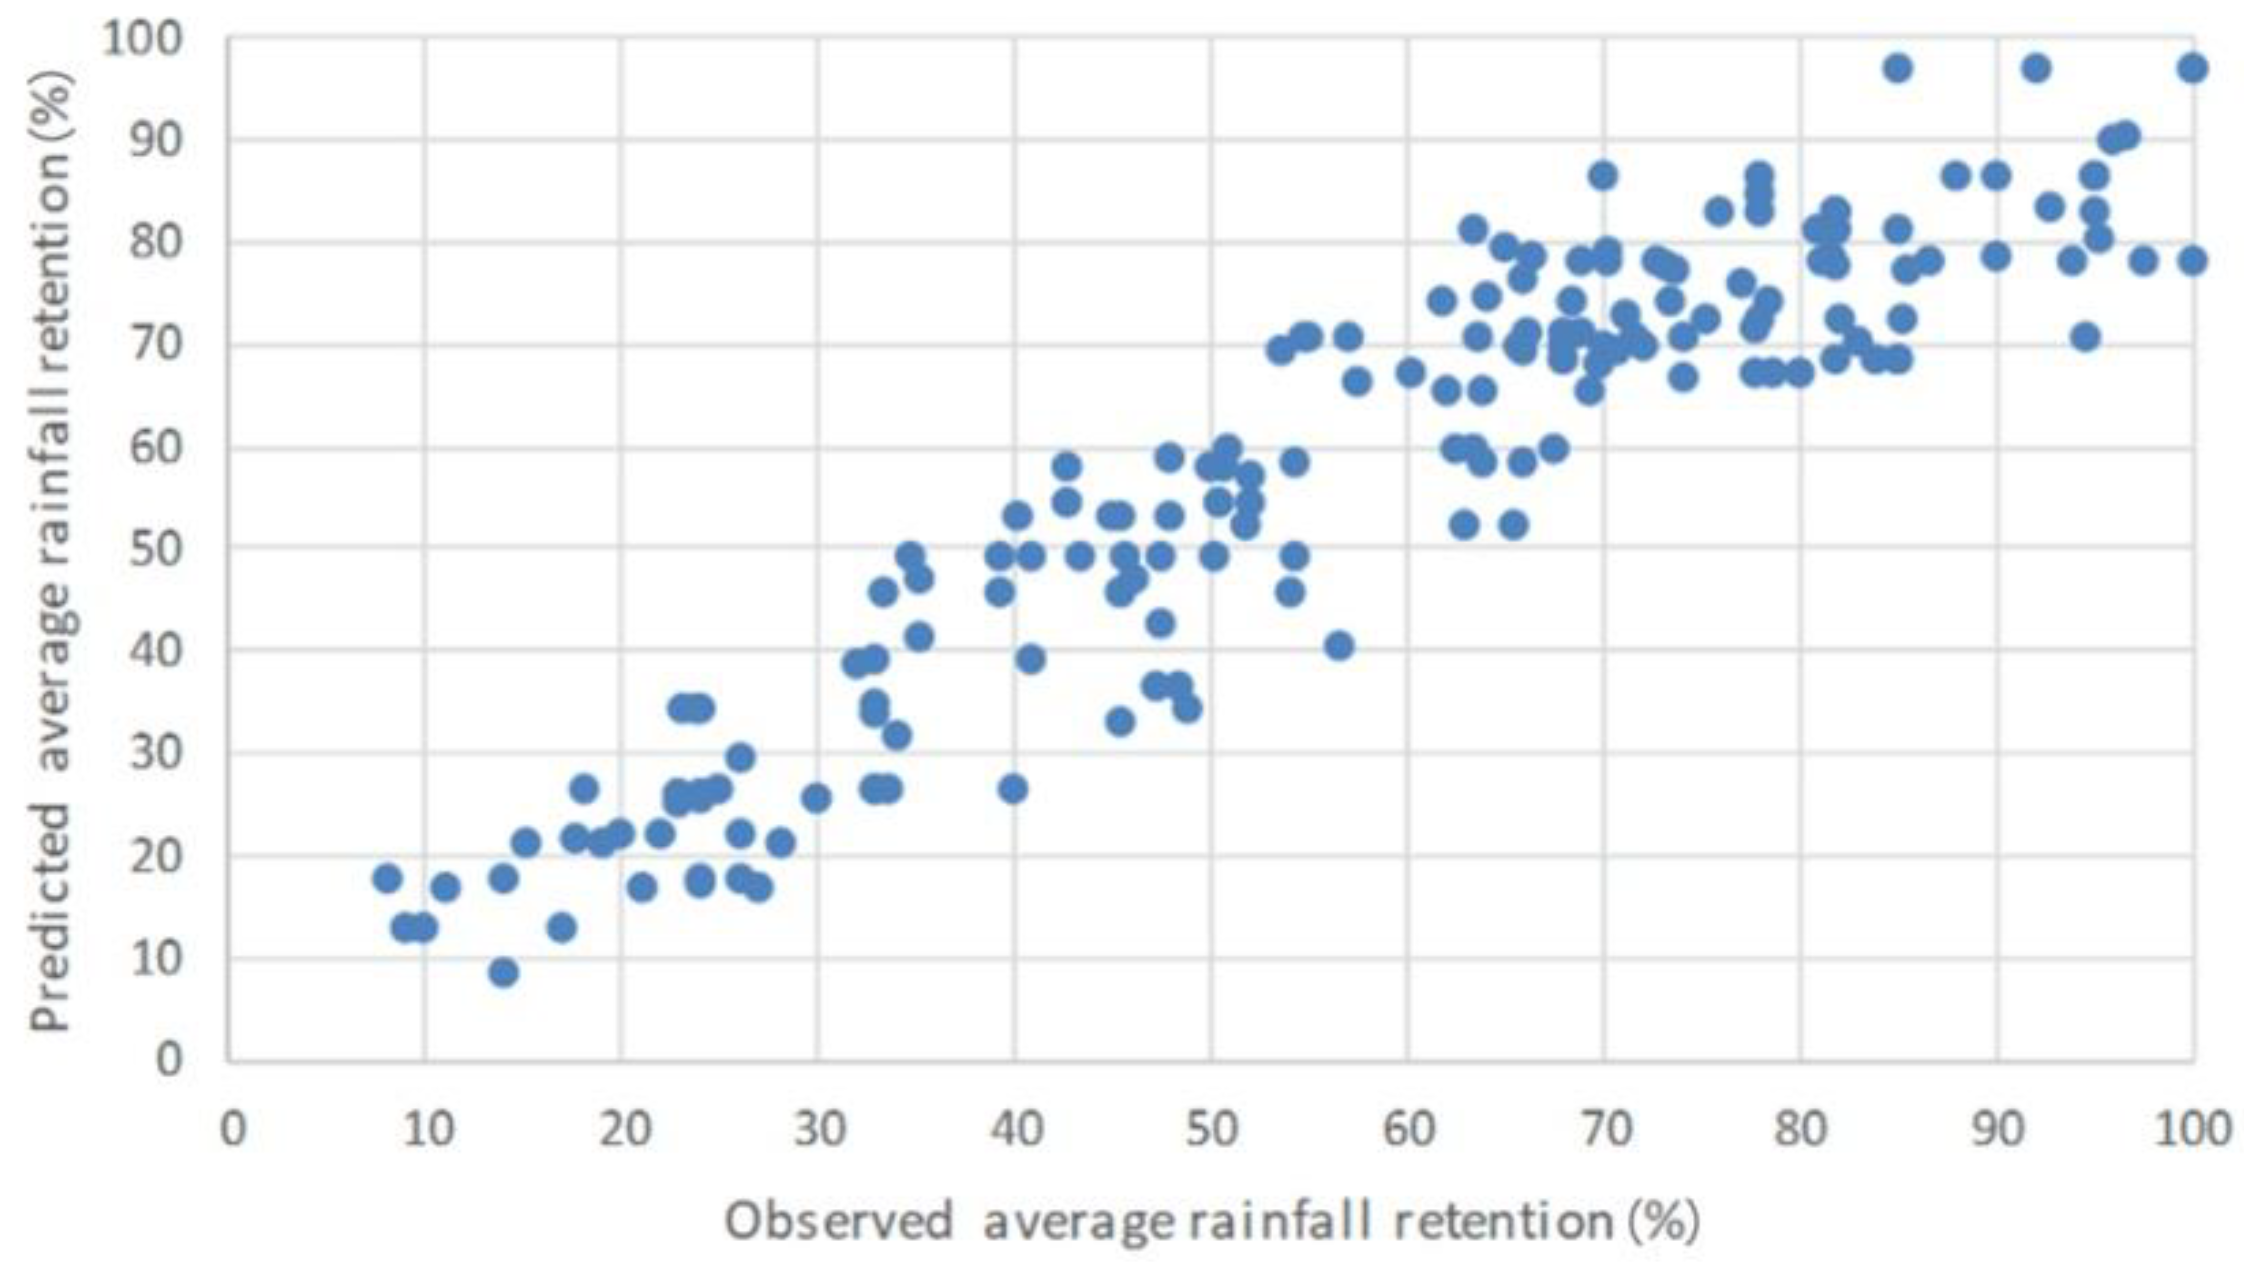
Overall, the accuracy of the model is quite high (Figure 4). The predicted average rainfall retention is close to the observed values.
4. Conclusions and Recommendations
In the framework of this research, we found 14 studies for the hydrological cycle under Mediterranean climate, Csa and Csb, 7 studies for each, which means that the subject is still little explored if, for example, we compare it to the number of studies for Cfa and Cfb, for which we found 22 publications.
In this study, we made a further analysis of the variables rainfall retention (%), peak attenuation (%), and runoff coefficient (−), and due to its importance for this research, some quantitative results must be pointed out here. The average R (%) for the 76 observations for complete green roofs/modules under Mediterranean climate and real rainfall conditions was 62.38%, the Min for the average R was 13.98%, and the Max for the average R was 100%. The mean for Csa and Csb for average PA was 75.29%, the Min registered for PA (%) was 44.30%, and the Max value for PA was 93.20%. The mean value for average RC under Mediterranean conditions was 0.39. The minimum registered for RC was 0.00, and the maximum value was 0.86.
The rainfall retention (%) is the most studied variable for the Mediterranean climate, with n = 76. Thus, all the results for the rainfall retention (%) are the most significant.
Some categorical variables seem to be very important when studying the hydrological performance of a green roof—namely, the system (module/complete green roof); the substrate depth class (class 1, 2, and 3); the origin of the vegetation (native/not native/both), and the type of green roof (extensive, semi-intensive, and intensive).
Concerning the continuous variables, the univariate analysis showed that the most significant variables for rainfall retention were the substrate depth (mm), the average monthly precipitation (mm), and the average monthly temperature (°C). The influence of temperature and precipitation on the average R through the combination of the observations for the Mediterranean climate showed that a higher average monthly temperature determines higher average rainfall retention, and a higher average monthly precipitation causes lower average rainfall retention. Variables such as slope and type of vegetation need deeper study.
The multivariate analysis that was conducted using multiple linear regression identified the set of green roof features and weather conditions that best explain rainfall retention (%). The results are in line with those of the univariate analysis—namely, the origin of the vegetation; the presence of layers, such as drainage layer; and layer system. It is important to note that the layer system was not considered in the univariate analysis because there were not enough results for single layer green roofs/modules under Mediterranean conditions. Additionally, according to this analysis, the seasonality is significant when predicting rainfall retention, and this aspect was not taken into consideration for the univariate analysis because there were not enough studies to reach robust conclusions.
Further experiments with intensive and semi-intensive green roofs/test beds need to be conducted since 73.75% of the selected literature for Mediterranean green roofs is related to extensive green roofs.
The effect of the categorical variables and continuous variables on the runoff delay (RD, min or h), peak delay (PD, min or h), peak attenuation (PA, %), and runoff coefficient (RC, (−)), still do not provide enough information to reach clear conclusions. Consequently, it is important that additional studies are focused on other variables.
The benefits of green roofs to stormwater management, alongside their other reported benefits, make these solutions auspicious when facing new urban challenges triggered by climate change and increasing urban populations.
Additionally, the variables that are measured and the quantitative results that are reported (units and intervals) should be uniform across the academic community, so that different studies could be more easily compared. This would help to raise awareness of the subject and produce more results-oriented studies.
Author Contributions
Conceptualization, J.S., T.A.P. and V.S.; methodology, J.S., T.A.P. and V.S.; software, J.S. and V.S.; validation, T.A.P. and C.M.S.; formal analysis, J.S. and V.S.; writing—original draft preparation, J.S., T.A.P. and V.S.; writing—review and editing, T.A.P., V.S. and C.M.S.; supervision, C.M.S.; project administration, C.M.S.; funding acquisition, C.M.S. All authors have read and agreed to the published version of the manuscript.
Funding
This work was supported by the FCT (Portuguese Foundation for Science and Technology) through the research project GENESIS (PTDC/GESURB/29444/2017) and the research unit UID/AGR/04129/LEAF.
Data Availability Statement
The data presented in this study are available on request from the corresponding author.
Conflicts of Interest
The authors declare no conflict of interest.
Appendix A

Table A1.
Most appropriate test according to the number of groups and the statistical test assumptions.
Table A1.
Most appropriate test according to the number of groups and the statistical test assumptions.
| Categorical Variables | No. of Groups | Groups | Parametric Statistical Test | Nonparametric Statistical Test |
|---|---|---|---|---|
| Climate (Köppen–Geiger) | 2 | Csa | t-test | Wilcoxon |
| Csb | ||||
| System | 2 | Modules | t-test | Wilcoxon |
| Complete green roof | ||||
| Protection board (root barrier) | 2 | Yes | t-test | Wilcoxon |
| No | ||||
| Waterproofing layer | 2 | Yes | t-test | Wilcoxon |
| No | ||||
| Filtration layer (Geotextile) | 2 | Yes | t-test | Wilcoxon |
| No | ||||
| Substrate depth class | 3 | Class 1 (0–149 mm) | ANOVA | Kruskal–Wallis |
| Class 2 (150–249 mm) | ||||
| Class 3 (≥250 mm) | ||||
| Type of vegetation | 3 | Sedums and other succulents | ANOVA | Kruskal–Wallis |
| Perennial herbaceous plants and grasses | ||||
| Both | ||||
| Native | 3 | Native | ANOVA | Kruskal–Wallis |
| Not native | ||||
| Both | ||||
| Slope class | 3 | Class 1 (0–1.50%) | ANOVA | Kruskal–Wallis |
| Class 2 (1.51–8.80%) | ||||
| Class 3 (>8.80%) | ||||
| Type of green roof | 3 | Extensive | ANOVA | Kruskal–Wallis |
| Semi-intensive | ||||
| Intensive |
Table A2.
Shapiro –Wilk test results for rainfall retention (%).
| Categorical Variables | Groups | w | p-Value | Hypothesis Testing |
|---|---|---|---|---|
| Climate (Köppen–Geiger) | Csa | 0.9663 | 0.2342 | H0 |
| Csb | 0.8798 | 0.0017 | H1 | |
| System | Modules | 0.9794 | 0.4247 | H0 |
| Complete green roof | 0.8068 | 0.0019 | H1 | |
| Root barrier | Yes | 0.9737 | 0.2383 | H0 |
| No | 0.8440 | 0.0068 | H1 | |
| Waterproofing layer | Yes | 0.9711 | 0.2150 | H0 |
| No | 0.8217 | 0.0011 | H1 | |
| Filtration layer (Geotextile) | Yes | 0.9486 | 0.0052 | H1 |
| No | 0.9588 | 0.7715 | H0 | |
| Substrate depth class | Class 1 | 0.9613 | 0.1457 | H0 |
| Class 2 | 0.9294 | 0.1064 | H0 | |
| Class 3 | 0.8891 | 0.2297 | H0 | |
| Type of vegetation | Perennial herbaceous plants and grasses | 0.9620 | 0.4323 | H0 |
| Sedums and other succulents | 0.9379 | 0.4307 | H0 | |
| Both | 0.8883 | 0.0037 | H1 | |
| Native | Native | 0.9712 | 0.3618 | H0 |
| Not native | 0.9348 | 0.4341 | H0 | |
| Both | 0.8899 | 0.0668 | H0 | |
| Slope class | Class 1 | 0.8922 | 0.0422 | H1 |
| Class 2 | 0.9763 | 0.6027 | H0 | |
| Type of green roof | Extensive | 0.9628 | 0.0870 | H0 |
| Semi-intensive | 0.9221 | 0.2674 | H0 | |
| Intensive | 0.8891 | 0.2297 | H0 |
Table A3.
Shapiro–Wilk test results for peak attenuation (%).
| Categorical Variables | Groups | w | p-Value | Hypothesis Testing |
|---|---|---|---|---|
| Climate (Köppen–Geiger) | Csa | 0.8175 | 0.1117 | H0 |
| Csb | 0.9305 | 0.5837 | H0 | |
| Waterproofing layer | Yes | 0.9211 | 0.5130 | H0 |
| No | 0.7144 | 0.0135 | H1 | |
| Filtration layer (Geotextile) | Yes | 0.9766 | 0.9412 | H0 |
| No | 0.7267 | 0.0228 | H1 |
Table A4.
Shapiro–Wilk test results for runoff coefficient (−).
| Categorical Variables | Groups | w | p-Value | Hypothesis Testing |
|---|---|---|---|---|
| Climate (Köppen–Geiger) | Csa | 0.9721 | 0.4030 | H0 |
| Csb | 0.9348 | 0.6294 | H0 | |
| System | Modules | 0.9813 | 0.7643 | H0 |
| Complete green roof | 0.8171 | 0.0435 | H1 | |
| Waterproofing layer | Yes | 0.9820 | 0.7639 | H0 |
| No | 0.8874 | 0.3048 | H0 | |
| Type of vegetation | Perennial herbaceous plants and grasses | 0.9618 | 0.4998 | H0 |
| Sedums and other succulents | 0.9220 | 0.2667 | H0 | |
| Both | 0.9828 | 0.9488 | H0 | |
| Slope class | Class 1 | 0.8909 | 0.2796 | H0 |
| Class 2 | 0.9697 | 0.4538 | H0 |
Table A5.
Levene’s test results for rainfall retention (%), peak attenuation (%), and runoff coefficient (−).
Table A5.
Levene’s test results for rainfall retention (%), peak attenuation (%), and runoff coefficient (−).
| Rainfall Retention (%) | |||
|---|---|---|---|
| Categorical Variables | F value | Pr(>F) | hypothesis testing |
| Substrate depth class | 4.7389 | 0.0117 | H1 |
| Native | 2.1371 | 0.1261 | H0 |
| Type of green roof | 6.5091 | 0.0025 | H1 |
| Peak Attenuation (%) | |||
| Categorical Variables | F value | Pr(>F) | hypothesis testing |
| Climate (Köppen–Geiger) | 0.0277 | 0.8715 | H0 |
| Runoff Coefficient (−) | |||
| Categorical Variables | F value | Pr(>F) | hypothesis testing |
| Climate (Köppen–Geiger) | 0.6624 | 0.4201 | H0 |
| Waterproofing layer | 3.7784 | 0.0583 | H0 |
| Type of vegetation | 0.5702 | 0.5702 | H0 |
| Slope class | 1.7115 | 0.1985 | H0 |
Table A6.
Shapiro –Wilk test results for the continuous variables.
| Continuous Variables | w | p-Value | Hypothesis Testing |
|---|---|---|---|
| Rainfall retention (%) | 0.9487 | 0.0039 | H1 |
| Peak attenuation (%) | 0.9207 | 0.3244 | H0 |
| Runoff coefficient (‒) | 0.9715 | 0.3153 | H0 |
| Avg monthly precipitation (mm) | 0.8326 | 2.68 × 10⁻⁶ | H1 |
| SD monthly precipitation (mm) | 0.8852 | 9.10 × 10⁻⁵ | H1 |
| Avg monthly temperature (°C) | 0.8789 | 5.73 × 10⁻⁵ | H1 |
| SD monthly temperature (°C) | 0.9322 | 0.004458 | H1 |
| Substrate depth (mm) | 0.7904 | 3.02 × 10⁻⁹ | H1 |
| Plant coverage (%) | 0.8296 | 5.44 × 10⁻⁵ | H1 |
| Slope (%) | 0.5603 | 1.17 × 10⁻¹² | H1 |
Table A7.
Variables considered for the multivariate analysis.
| Variables | Groups |
|---|---|
| Climate (Köppen–Geiger) | Am; BSh; BSk; Cfa; Cfb; Csa; Csb; Cwa; Dfa; Dfb; Dfc; Dwa; Dwb |
| System | Modules; complete green roof |
| Protection board (root barrier) | Yes; No |
| Waterproofing layer | Yes; No |
| Filtration layer (Geotextile) | Yes; No |
| Drainage layer | Yes; No |
| Substrate depth class | Class 1 (0–149 mm); class 2 (150–249 mm); class 3 (≥250 mm) |
| Type of vegetation | Sedums and other succulents; perennial herbaceous plants and grasses; both |
| Origin | Native; not native; both |
| Climate type | 1–real conditions; 2–simulated |
| Season | Spring; Summer; Fall; Winter; All; All except Winter; All except Summer; Spring/Summer; Summer/Fall; Fall/Winter; Winter/Spring; None |
Table A8.
Articles with data for the Mediterranean climate.
| Author (Year) | ALocation |
|---|---|
| Razzaghmanesh and Beecham (2014) [44] | Adelaide, Australia |
| Beecham and Razzaghmanesh (2015) [13] | Adelaide, Australia |
| Brandão et al. (2017) [14] | Lisbon, Portugal |
| Palermo et al. (2019) [8] | Rende, Italy |
| Palla et al. (2011) [39] | Genoa, Italy |
| Andrés-Doménech et al. (2018) [11] | Benaguasil, Valencia, Spain |
| Piro et al. (2018) [42] | Rende, Italy |
| Soulis et al. (2017a) [52] | Athens, Greece |
| Soulis et al. (2017b) [53] | Athens, Greece |
| Garofalo et al. (2016) [6] | Rende, Italy |
| Schultz et al. (2018) [46] | Portland, Oregon, USA |
| Buccola and Spolek (2010) [15] | Portland, Oregon, USA |
| Schroll et al. (2011) [45] | Corvallis, Oregon, USA |
| Gnecco et al. (2013) [21] | Genoa, Italy |
References
- United Nations, Department of Economic and Social Affairs, Population Division. The World’s Cities in 2018—Data Booklet (ST/ESA/ SER.A/417). 2018. Available online: https://digitallibrary.un.org/record/3799524 (accessed on 1 June 2020).
- Jha, A.K.; Bloch, R.; Lamond, J. World Bank. Cities and Flooding: A Guide to Integrated Urban Flood Risk Management for the 21st Century. 2012. Available online: https://openknowledge.worldbank.org/handle/10986/2241.
- Drobinski, P.; Ducrocq, V.; Alpert, P.; Anagnostou, E.; Béranger, K.; Borga, M.; Braud, I.; Chanzy, A.; Davolio, S.; Delrieu1, G.; et al. HYMEX, a 10-year Multidisciplinary Program on the mediterranean water cycle. Bull. Am. Meteorol. Soc. Am. Meteorol. Soc. 2014, 95, 1063–1082. [Google Scholar] [CrossRef]
- Yin, H.; Kong, F.; Dronova, I. Hydrological performance of extensive green roofs in response to different rain events in a subtropical monsoon climate. Landsc. Ecol. Eng. 2019, 15, 297–313. [Google Scholar] [CrossRef]
- Cipolla, S.S.; Maglionico, M.; Stojkov, I. A long-term hydrological modelling of an extensive green roof by means of SWMM. Ecol. Eng. 2016, 95, 876–887. [Google Scholar] [CrossRef]
- Garofalo, G.; Palermo, S.; Principato, F.; Theodosiou, T.; Piro, P. The Influence of Hydrologic Parameters on the Hydraulic Efficiency of an Extensive Green Roof in Mediterranean Area. Water 2016, 8, 44. [Google Scholar] [CrossRef]
- Gomes, M.G.; Silva, C.M.; Valadas, A.S. Impact of Vegetation, Substrate, and Irrigation on the Energy Performance of Green Roofs in a Mediterranean Climate. Water 2019, 11, 2016. [Google Scholar] [CrossRef] [Green Version]
- Palermo, S.A.; Turco, M.; Principato, F.; Piro, P. Hydrological Effectiveness of an Extensive Green Roof in Mediterranean Climate. Water 2019, 11, 1378. [Google Scholar] [CrossRef] [Green Version]
- Charalambous, K.; Bruggeman, A.; Eliades, M.; Camera, C.; Vassiliou, L. Stormwater Retention and Reuse at the Residential Plot Level—Green Roof Experiment and Water Balance Computations for Long-Term Use in Cyprus. Water 2019, 11, 1055. [Google Scholar] [CrossRef] [Green Version]
- Peel, M.C.; Finlayson, B.L.; McMahon, T.A. Updated world map of the Köppen-Geiger climate classification. Hydrol. Earth Syst. Sci. 2007, 11, 1633–1644. [Google Scholar] [CrossRef] [Green Version]
- Andrés-Doménech, I.; Perales-Momparler, S.; Morales-Torres, A.; Escuder-Bueno, I. Hydrological Performance of Green Roofs at Building and City Scales under Mediterranean Conditions. Sustainability 2018, 10, 3105. [Google Scholar] [CrossRef] [Green Version]
- Abualfaraj, N.; Cataldo, J.; Elborolosy, Y.; Fagan, D.; Woerdeman, S.; Carson, T.; Montalto, F.A. Monitoring and Modeling the Long-Term Rainfall-Runoff Response of the Jacob K. Javits Center Green Roof. Water 2018, 10, 1494. [Google Scholar] [CrossRef] [Green Version]
- Beecham, S.; Razzaghmanesh, M. Water quality and quantity investigation of green roofs in a dry climate. Water Res. 2015, 70, 370–384. [Google Scholar] [CrossRef]
- Brandão, C.; Cameira, M.D.R.; Valente, F.; de Carvalho, R.C.; Paço, T.A. Wet season hydrological performance of green roofs using native species under Mediterranean climate. Ecol. Eng. 2017, 102, 596–611. [Google Scholar] [CrossRef]
- Buccola, N.; Spolek, G. A Pilot-Scale Evaluation of Greenroof Runoff Retention, Detention, and Quality. Water Air Soil Pollut. 2011, 216, 83–92. [Google Scholar] [CrossRef]
- Burszta-Adamiak, E.; Mrowiec, M. Modelling of green roofs’ hydrologic performance using EPA’s SWMM. Water Sci. Technol. 2013, 68, 36–42. [Google Scholar] [CrossRef] [PubMed]
- Carson, T.B.; Marasco, D.E.; Culligan, P.J.; McGillis, W.R. Hydrological performance of extensive green roofs in New York City: Observations and multi-year modeling of three full-scale systems. Environ. Res. Lett. 2013, 8, 024036. [Google Scholar] [CrossRef]
- Carter, T.L.; Rasmussen, T.C. Hydrologic behavior of vegetated roofs. JAWRA J. Am. Water Resour. Assoc. 2006, 42, 1261–1274. [Google Scholar] [CrossRef]
- Ferrans, P.; Rey, C.; Pérez, G.; Sánchez, J.P.; Díaz-Granados, M. Effect of Green Roof Configuration and Hydrological Variables on Runoff Water Quantity and Quality. Water 2018, 10, 960. [Google Scholar] [CrossRef] [Green Version]
- Getter, K.L.; Rowe, D.B.; Andresen, J.A. Quantifying the effect of slope on extensive green roof stormwater retention. Ecol. Eng. 2007, 31, 225–231. [Google Scholar] [CrossRef]
- Gnecco, I.; Palla, A.; Lanza, L.G.; Barbera, P.L. A green roof experimental site in the Mediterranean climate: The storm water quality issue. Water Sci. Technol. 2013, 68, 1419–1424. [Google Scholar] [CrossRef] [PubMed]
- Gong, Y.; Yin, D.; Fang, X.; Zhai, D.; Li, J. Rainwater retention effect of extensive green roofs monitored under natural rain-fall events—A case study in Beijing. Hydrol. Res. 2018, 49, 1773–1787. [Google Scholar] [CrossRef]
- Gong, Y.; Yin, D.; Li, J.; Zhang, X.; Wang, W.; Fang, X.; Shi, H.; Wang, Q. Performance assessment of extensive green roof runoff flow and quality control capacity based on pilot experiments. Sci. Total. Environ. 2019, 687, 505–515. [Google Scholar] [CrossRef]
- Grard, B.J.; Chenu, C.; Manouchehri, N.; Houot, S.; Frascaria-Lacoste, N.; Aubry, C. Rooftop farming on urban waste provides many ecosystem services. Agron. Sustain. Dev. 2018, 38, 2. [Google Scholar] [CrossRef] [Green Version]
- Gregoire, B.G.; Clausen, J.C. Effect of a modular extensive green roof on stormwater runoff and water quality. Ecol. Eng. 2011, 37, 963–969. [Google Scholar] [CrossRef]
- Harper, G.E.; Limmer, M.A.; Showalter, W.E.; Burken, J.G. Nine-month evaluation of runoff quality and quantity from an experiential green roof in Missouri, USA. Ecol. Eng. 2015, 78, 127–133. [Google Scholar] [CrossRef]
- Hathaway, A.M.; Hunt, W.F.; Jennings, G.D. A Field Study of Green Roof Hydrologic and Water Quality Performance. Trans. ASABE 2008, 51, 37–44. [Google Scholar] [CrossRef]
- Hu, S.; Liu, L.; Cao, J.; Chen, N.; Wang, Z. Water Resilience by Centipedegrass Green Roof: A Case Study. Buildings 2019, 9, 141. [Google Scholar] [CrossRef] [Green Version]
- Jelinkova, V.; Dohnal, M.; Sacha, J. Thermal and water regime studied in a thin soil layer of green roof systems at early stage of pedogenesis. J. Soils Sediments 2016, 16, 2568–2579. [Google Scholar] [CrossRef]
- Johannessen, B.G.; Muthanna, T.M.; Braskerud, B.C. Detention and Retention Behavior of Four Extensive Green Roofs in Three Nordic Climate Zones. Water 2018, 10, 671. [Google Scholar] [CrossRef] [Green Version]
- Kemp, S.; Hadley, P.; Blanuša, T. The influence of plant type on green roof rainfall retention. Urban Ecosyst. 2019, 22, 355–366. [Google Scholar] [CrossRef] [Green Version]
- Ladani, H.J.; Park, J.-R.; Jang, Y.-S.; Shin, H.-S. Hydrological Performance Assessment for Green Roof with Various Substrate Depths and Compositions. KSCE J. Civ. Eng. 2019, 23, 1860–1871. [Google Scholar] [CrossRef]
- Lee, J.Y.; Lee, M.J.; Han, M. A pilot study to evaluate runoff quantity from green roofs. J. Environ. Manag. 2015, 152, 171–176. [Google Scholar] [CrossRef]
- Linden, K.V.; Stone, M. Treatment Performance of an Extensive Vegetated Roof in Waterloo, Ontario. Water Qual. Res. J. 2009, 44, 26–32. [Google Scholar] [CrossRef]
- Liu, W.; Feng, Q.; Chen, W.; Wei, W.; Deo, R.C. The influence of structural factors on stormwater runoff retention of exten-sive green roofs: New evidence from scale-based models and real experiments. J. Hydrol. 2019, 569, 230–238. [Google Scholar] [CrossRef]
- Loiola, C.; Mary, W.; Silva, L.P. Hydrological performance of modular-tray green roof systems forincreasing the resilience of mega-cities to climate change. J. Hydrol. 2019, 573, 1057–1066. [Google Scholar] [CrossRef]
- Mickovski, S.B.; Buss, K.; McKenzie, B.M.; Sökmener, B. Laboratory study on the potential use of recycled inert construction waste material in the substrate mix for extensive green roofs. Ecol. Eng. 2013, 61, 706–714. [Google Scholar] [CrossRef]
- Nawaz, R.; McDonald, A.; Postoyko, S. Hydrological performance of a full-scale extensive green roof located in a temperate climate. Ecol. Eng. 2015, 82, 66–80. [Google Scholar] [CrossRef]
- Palla, A.; Sansalone, J.J.; Gnecco, I.; Lanza, L. Storm water infiltration in a monitored green roof for hydrologic restoration. Water Sci. Technol. 2011, 64, 766–773. [Google Scholar] [CrossRef]
- Pęczkowski, G.; Kowalczyk, T.; Szawernoga, K.; Orzepowski, W.; Żmuda, R.; Pokładek, R. Hydrological Performance and Runoff Water Quality of Experimental Green Roofs. Water 2018, 10, 1185. [Google Scholar] [CrossRef] [Green Version]
- Perales-Momparler, S.; Andrés-Doménech, I.; Hernández-Crespo, C.; Vallés-Morán, F.; Martín, M.; Escuder-Bueno, I.; Andreu, J. The role of monitoring sustainable drainage systems for promoting transition towards regenerative urban built environments: A case study in the Valencian region, Spain. J. Clean. Prod. 2017, 163, S113–S124. [Google Scholar] [CrossRef]
- Piro, P.; Carbone, M.; De Simone, M.; Maiolo, M.; Bevilacqua, P.; Arcuri, N. Energy and Hydraulic Performance of a Vegetated Roof in Sub-Mediterranean Climate. Sustainability 2018, 10, 3473. [Google Scholar] [CrossRef] [Green Version]
- Qianqian, Z.; Liping, M.; Huiwei, W.; Long, W. Analysis of the effect of green roof substrate amended with biochar on water quality and quantity of rainfall runoff. Environ. Monit. Assess. 2019, 191, 304. [Google Scholar] [CrossRef]
- Razzaghmanesh, M.; Beecham, S. The hydrological behaviour of extensive and intensive green roofs in a dry climate. Sci. Total. Environ. 2014, 499, 284–296. [Google Scholar] [CrossRef]
- Schroll, E.; Lambrinos, J.; Righetti, T.; Sandrock, D. The role of vegetation in regulating stormwater runoff from green roofs in a winter rainfall climate. Ecol. Eng. 2011, 37, 595–600. [Google Scholar] [CrossRef]
- Schultz, I.; Sailor, D.J.; Starry, O. Effects of substrate depth and precipitation characteristics on stormwater retention by two green roofs in Portland OR. J. Hydrol. Reg. Stud. 2018, 18, 110–118. [Google Scholar] [CrossRef]
- Shafique, M.; Kim, R.; Kyung-Ho, K. Green Roof for Stormwater Management in a Highly Urbanized Area: The Case of Seoul, Korea. Sustainability 2018, 10, 584. [Google Scholar] [CrossRef] [Green Version]
- Sherrard, J.A.; Jacobs, J.M. Vegetated Roof Water-Balance Model: Experimental and Model Results. J. Hydrol. Eng. 2012, 17, 858–868. [Google Scholar] [CrossRef]
- Sims, A.W.; Robinson, C.E.; Smart, C.C.; Voogt, J.; Hay, G.J.; Lundholm, J.T.; Powers, B.; O’Carroll, D.M. Retention performance of green roofs in three different climate regions. J. Hydrol. 2016, 542, 115–124. [Google Scholar] [CrossRef]
- Sims, A.W.; Robinson, C.E.; Smart, C.C.; O’Carroll, D.M. Mechanisms controlling green roof peak flow rate attenuation. J. Hydrol. 2019, 577, 123972. [Google Scholar] [CrossRef]
- Skala, V.; Dohnal, M.; Votrubová, J.; Jelínková, V. The use of simple hydrological models to assess outflow of two green roofs systems. Soil Water Res. 2019, 14, 94–103. [Google Scholar] [CrossRef] [Green Version]
- Soulis, K.; Ntoulas, N.; Nektarios, P.A.; Kargas, G. Runoff reduction from extensive green roofs having different substrate depth and plant cover. Ecol. Eng. 2017, 102, 80–89. [Google Scholar] [CrossRef]
- Soulis, K.X.; Valiantzas, J.D.; Ntoulas, N.; Kargas, G.; Nektarios, P.A. Simulation of green roof runoff under different substrate depths and vegetation covers by coupling a simple conceptual and a physically based hydrological model. J. Environ. Manag. 2017, 200, 434–445. [Google Scholar] [CrossRef]
- Speak, A.; Rothwell, J.; Lindley, S.; Smith, C. Rainwater runoff retention on an aged intensive green roof. Sci. Total. Environ. 2013, 461–462, 28–38. [Google Scholar] [CrossRef]
- Stovin, V.; Vesuviano, G.; Kasmin, H. The hydrological performance of a green roof test bed under UK climatic conditions. J. Hydrol. 2012, 414-415, 148–161. [Google Scholar] [CrossRef]
- Stovin, V.; Poë, S.; De-Ville, S.; Berretta, C. The influence of substrate and vegetation configuration on green roof hydrological performance. Ecol. Eng. 2015, 85, 159–172. [Google Scholar] [CrossRef] [Green Version]
- Stovin, V. The potential of green roofs to manage Urban Stormwater. Water Environ. J. 2010, 24, 192–199. [Google Scholar] [CrossRef]
- Todorov, D.; Driscoll, C.T.; Todorova, S. Long-term and seasonal hydrologic performance of an extensive green roof. Hydrol. Process. 2018, 32, 2471–2482. [Google Scholar] [CrossRef]
- Van Seters, T.; Rocha, L.; Smith, D.; Macmillan, G. Evaluation of Green Roofs for Runoff Retention, Runoff Quality, and Leachability. Water Qual. Res. J. 2009, 44, 33–47. [Google Scholar] [CrossRef]
- VanWoert, N.D.; Rowe, D.B.; Andresen, J.A.; Rugh, C.L.; Fernandez, R.T.; Xiao, L. Green Roof Stormwater Retention. J. Environ. Qual. 2005, 34, 1036–1044. [Google Scholar] [CrossRef]
- Villarreal, E.L.; Bengtsson, L. Response of a Sedum green-roof to individual rain events. Ecol. Eng. 2005, 25, 1–7. [Google Scholar] [CrossRef]
- Voyde, E.; Fassman-Beck, E.; Simcock, R. Hydrology of an extensive living roof under sub-tropical climate conditions in Auckland, New Zealand. J. Hydrol. 2010, 394, 384–395. [Google Scholar] [CrossRef]
- Wang, X.; Tian, Y.; Zhao, X. The influence of dual-substrate-layer extensive green roofs on rainwater runoff quantity and quality. Sci. Total. Environ. 2017, 592, 465–476. [Google Scholar] [CrossRef] [PubMed]
- Whittinghill, L.J.; Rowe, D.B.; Andresen, J.A.; Cregg, B.M. Comparison of stormwater runoff from sedum, native prairie, and vegetable producing green roofs. Urban Ecosyst. 2015, 18, 13–29. [Google Scholar] [CrossRef]
- Wong, G.K.; Jim, C. Quantitative hydrologic performance of extensive green roof under humid-tropical rainfall regime. Ecol. Eng. 2014, 70, 366–378. [Google Scholar] [CrossRef]
- Zhang, Q.; Miao, L.; Wang, X.; Liu, D.; Zhu, L.; Zhou, B.; Sun, J.; Liu, J. The capacity of greening roof to reduce stormwater runoff and pollution. Landsc. Urban Plan. 2015, 144, 142–150. [Google Scholar] [CrossRef]
- Zhang, W.; Zhong, X.; Che, W.; Sun, H.; Zhang, H. A laboratory study to determine the use of polluted river sediment as a substrate for extensive green roofs. Water Sci. Technol. 2018, 78, 2247–2255. [Google Scholar] [CrossRef]
- Zhang, Z.; Szota, C.; Fletcher, T.D.; Williams, N.S.; Farrell, C. Green roof storage capacity can be more important than evapotranspiration for retention performance. J. Environ. Manag. 2019, 232, 404–412. [Google Scholar] [CrossRef]
Figure 1.
Flowchart of article selection process using the research tool Web of Science.
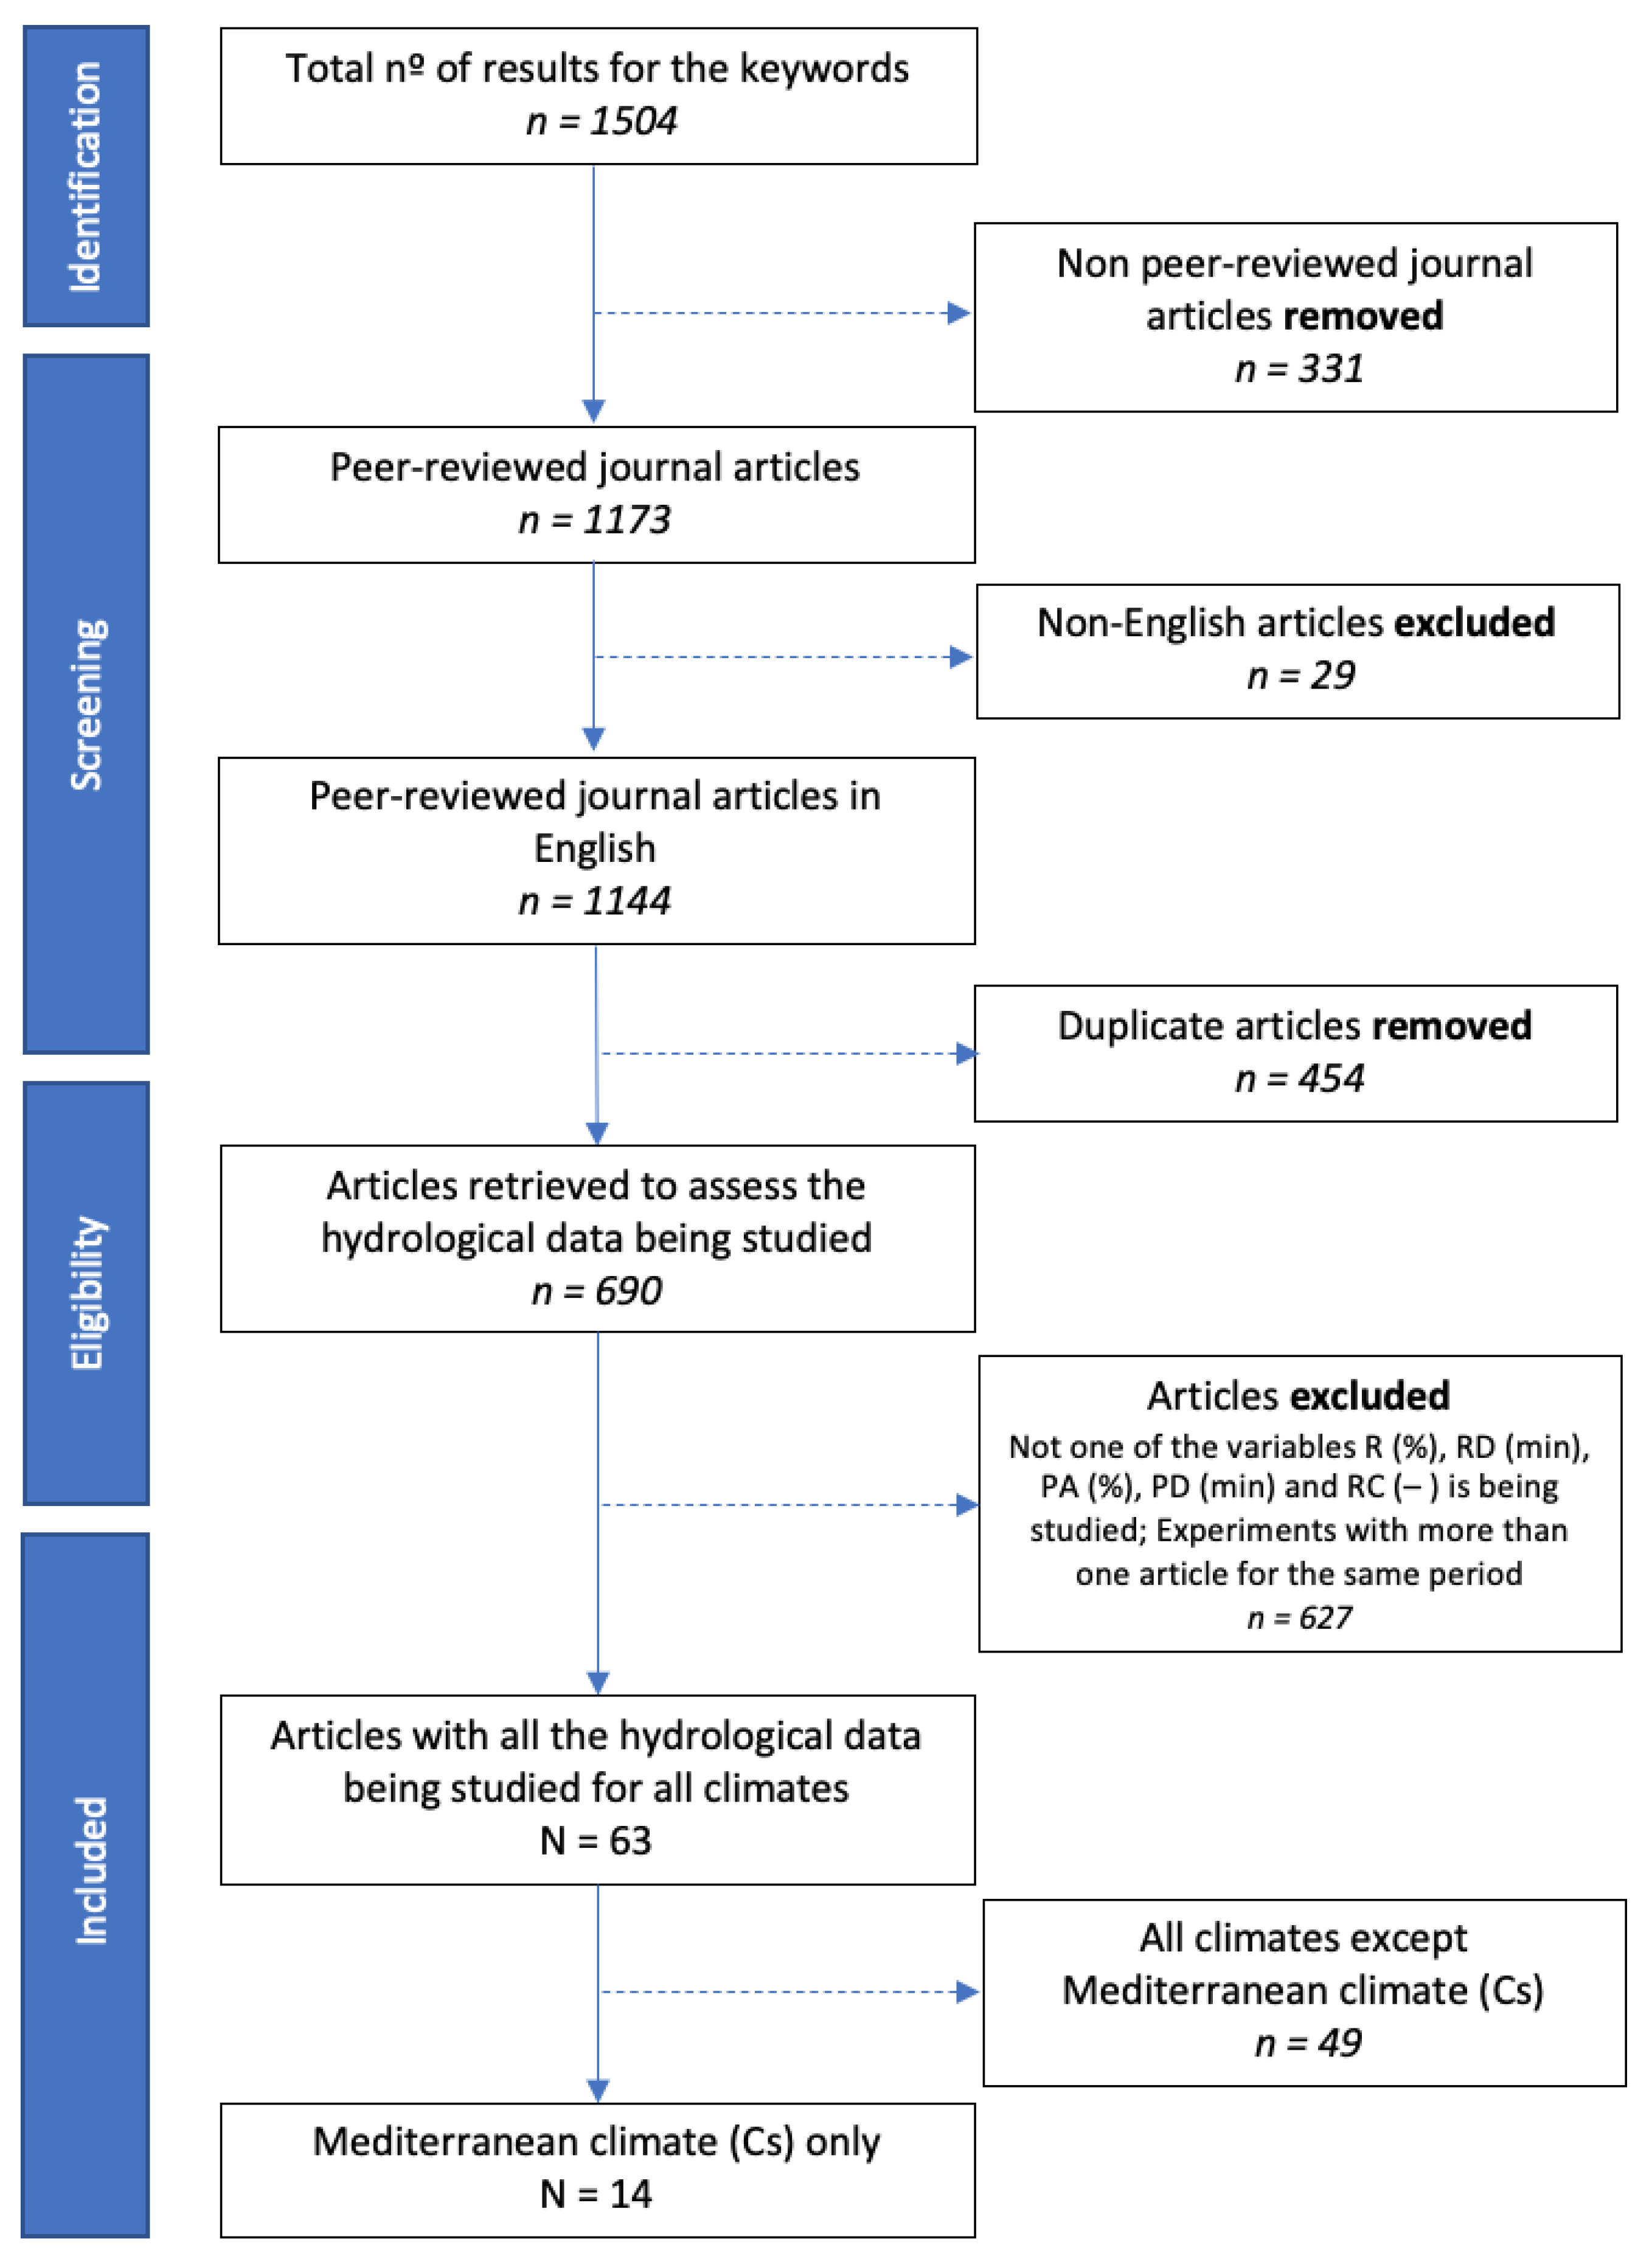
Figure 2.
(a) Box plot for the average rainfall retention (%) according to the substrate depth class (Sample size: nClass1 = 44; nClass2 = 23; nClass3 = 8); (b) scatter plot for the average rainfall retention (%) according to the substrate depth (n = 75); (c) scatter plot for the average rainfall retention (%) in relation to the monthly temperature (n = 52); (d) scatter plot for the average rainfall retention (%) in relation to the monthly precipitation (n = 52).
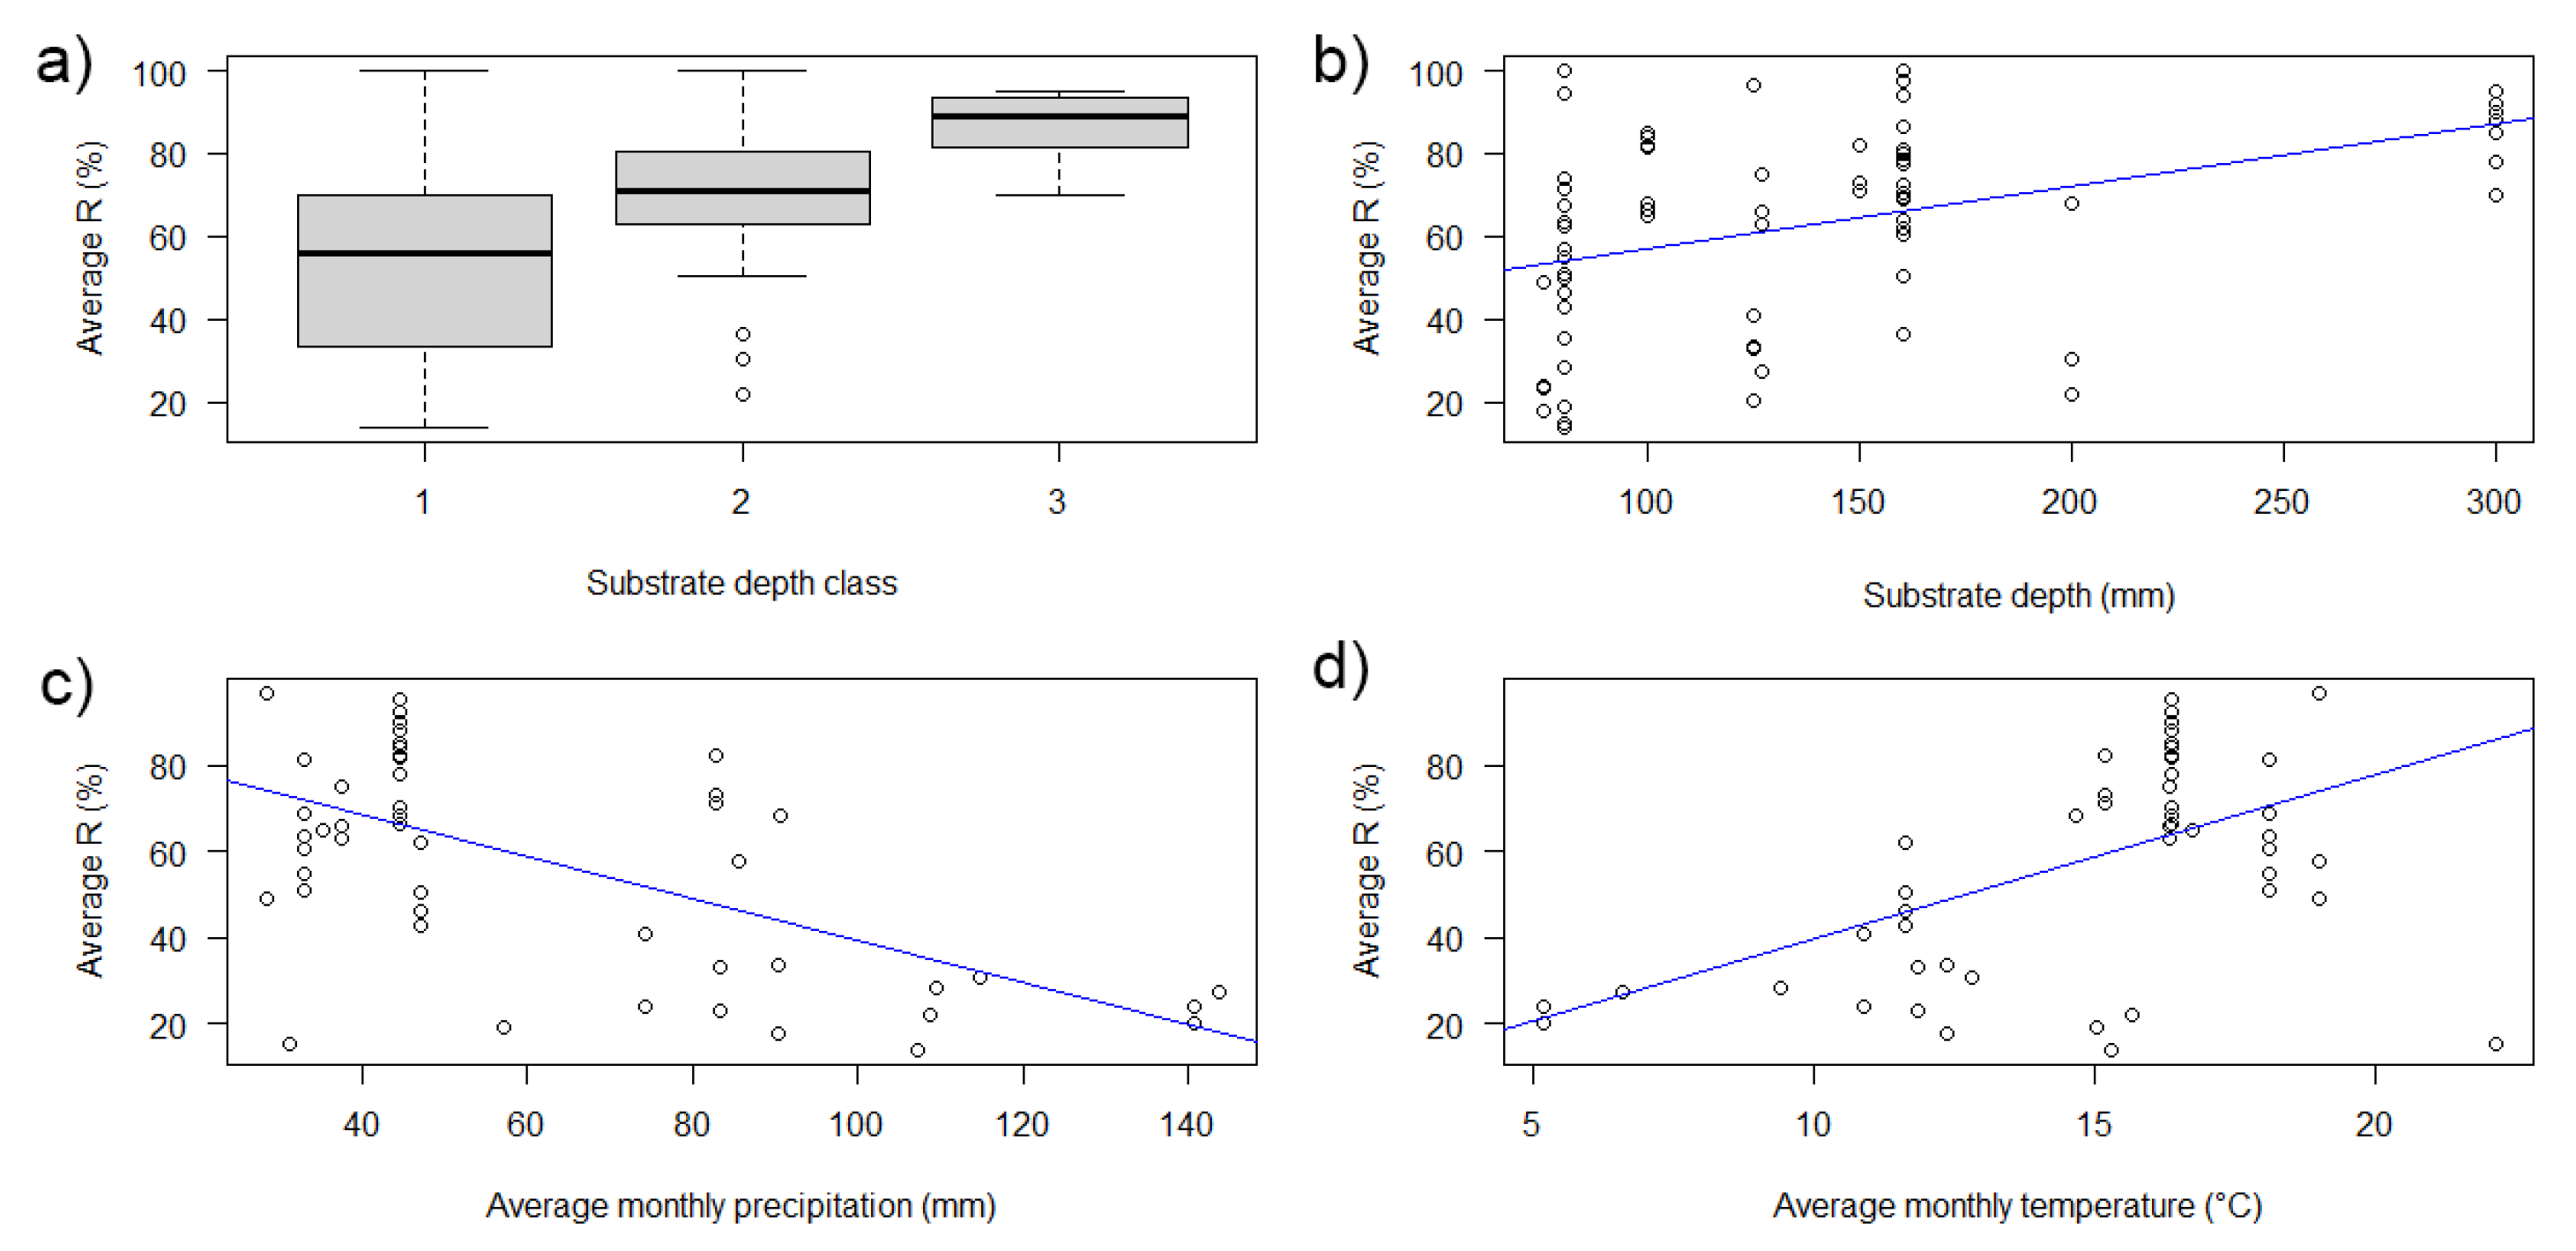
Figure 3.
Relative importance of the explanatory variables in the best regression model.

Figure 4.
Model Accuracy.

Table 1.
Articles describing the hydrological behavior of green roofs, with number of experiments by article and corresponding climate.
Table 1.
Articles describing the hydrological behavior of green roofs, with number of experiments by article and corresponding climate.
| Author (Year) | No. of Experiments | Climate |
|---|---|---|
| Andrés-Doménech et al. (2018) [11] | 1 | Csa |
| Abualfaraj et al. (2018) [12] | 1 | Cfa |
| Beecham, Razzaghmanesh (2015) [13] | 12 | Csb |
| Brandão et al. (2017) [14] | 3 | Csa |
| Buccola, Spolek (2010) [15] | 2 | Csb |
| Burszta-Adamiak, Mrowiec (2013) [16] | 3 | Dfb |
| Carson et al. (2013) [17] | 3 | Cfa |
| Carter, Rasmussen (2006) [18] | 1 | Cfa |
| Charalambous et al. (2019) [9] | 4 | BSh |
| Cipolla et al. (2016) [5] | 1 | Cfa |
| Ferrans et al. (2018) [19] | 6 | Cfb |
| Garofalo et al. (2016) [6] | 5 | Csa |
| Getter et al. (2007) [20] | 4 | Dfb |
| Gnecco et al. (2013) [21] | 1 | Csb |
| Gong et al. (2018) [22] | 7 | Dfa |
| Gong et al. (2019) [23] | 5 | Dfa |
| Grard et al. (2018) [24] | 2 | Cfb |
| Gregoire, Clausen (2011) [25] | 1 | Dfb |
| Harper et al. (2015) [26] | 2 | Cfa |
| Hathaway et al. (2008) [27] | 2 | Cfa |
| Hu et al. (2019) [28] | 1 | Cfa |
| Jelinkova et al. (2016) [29] | 2 | Dfb |
| Johannessen et al. (2018) [30] | 32 | Cfb; Dfb; Dfc |
| Kemp et al. (2018) [31] | 4 | Cfb |
| Ladani et al. (2019) [32] | 3 | Cfa |
| Lee et al. (2015) [33] | 2 | Dwa |
| Linden, Stone (2009) [34] | 1 | Dfb |
| Liu et al. (2019) [35] | 9 | Dwb |
| Loiola et al. (2019) [36] | 3 | Am |
| Mickovski et al. (2013) [37] | 3 | Cfb |
| Nawaz et al. (2015) [38] | 4 | Cfb |
| Palermo et al. (2019) [8] | 1 | Csa |
| Palla et al. (2011) [39] | 2 | Csb |
| Peczkowski et al. (2018) [40] | 2 | Dfb |
| Perales-Momparler et al. (2017) [41] | 1 | BSk |
| Piro et al. (2018) [42] | 1 | Csa |
| Qianqian et al. (2019) [43] | 2 | Dwa |
| Razzaghmanesh, Beecham (2014) [44] | 4 | Csb |
| Schroll et al. (2011) [45] | 4 | Csb |
| Schultz et al. (2018) [46] | 10 | Csb |
| Shafique et al. (2018) [47] | 1 | Dwa |
| Sherrard Jr., Jacobs (2012) [48] | 1 | Dfb |
| Sims et al. (2016) [49] | 3 | Dfb; Dfc |
| Sims et al. (2019) [50] | 2 | Dfb |
| Skala et al. (2019) [51] | 2 | Cfb |
| Soulis et al. (2017a) [52] | 30 | Csa |
| Soulis et al. (2017b) [53] | 4 | Csa |
| Speak et al. (2013) [54] | 5 | Cfb |
| Stovin et al. (2012) [55] | 5 | Cfb |
| Stovin et al. (2015) [56] | 2 | Cfb |
| Stovin, Virginia (2010) [57] | 1 | Cfb |
| Todorov et al. (2018) [58] | 1 | Dfb |
| Van Seters et al. (2009) [59] | 3 | Dfa |
| VanWoert et al. (2005) [60] | 4 | Dfb |
| Villarreal, Bengtsson (2005) [61] | 3 | Dfb |
| Voyde et al. (2010) [62] | 10 | Cfb |
| Wang et al. (2017) [63] | 7 | Dfa |
| Whittinghill et al. (2015) [64] | 3 | Dfb |
| Wong, Jim (2014) [65] | 20 | Cwa |
| Yin et al. (2019) [4] | 2 | Cfa |
| Zhang et al. (2015) [66] | 1 | Cwa |
| Zhang et al. (2018) [67] | 9 | Dfa |
| Zhang et al. (2019) [68] | 5 | Cfb |
Table 2.
Categorical variables under study and corresponding groups.
| Categorical Variables | Groups |
|---|---|
| Climate (Köppen–Geiger) | Csa |
| Csb | |
| System | Modules |
| Complete green roof | |
| Protection board (root-barrier) | Yes |
| No | |
| Waterproofing layer | Yes |
| No | |
| Filtration layer (geotextile) | Yes |
| No | |
| Substrate depth class | Class 1 (0–149 mm) |
| Class 2 (150–249 mm) | |
| Class 3 (≥250 mm) | |
| Type of vegetation | Sedums and other succulents |
| Perennial herbaceous plants and grasses | |
| Both | |
| Native | Native |
| Not native | |
| Both | |
| Slope class | Class 1 (0–1.50%) |
| Class 2 (1.51–8.80%) | |
| Class 3 (>8.80%) | |
| Type of green roof | Extensive |
| Semi-intensive | |
| Intensive |
Table 3.
Continuous variables under study and corresponding units.
| Continuous Variables | Units |
|---|---|
| Avg monthly precipitation | mm |
| SD monthly precipitation | mm |
| Avg monthly temperature | °C |
| SD monthly temperature | °C |
| Substrate depth | mm |
| Plant coverage | % |
| Slope | % |
Table 4.
Average rainfall retention (%), runoff delay (min), peak attenuation (%), peak delay (min), and runoff coefficient (−) summary statistics for the Mediterranean climate (rainfall simulations are not included in the results) and Shapiro–Wilk test results.
Table 4.
Average rainfall retention (%), runoff delay (min), peak attenuation (%), peak delay (min), and runoff coefficient (−) summary statistics for the Mediterranean climate (rainfall simulations are not included in the results) and Shapiro–Wilk test results.
| Statistics | R (%) | RD (Min) | PA (%) | PD (Min) | RC (−) | |
|---|---|---|---|---|---|---|
| 62.38% | 503.2 | 75.29% | 344.3 | 0.39 | ||
| Min | 13.98% | 52.10 | 44.30% | 29.4 | 0.00 | |
| Max | 100.00% | 1537.5 | 93.20% | 1132.0 | 0.86 | |
| 23.74% | 515.9 | 14.92% | 399.9 | 0.23 | ||
| Md | 66.99% | 184.1 | 74.40% | 143.7 | 0.37 | |
| Q1 | 46.85% | 141.9 | 66.30% | 45.2 | 0.22 | |
| Q3 | 81.52% | 1059.4 | 90.80% | 748.7 | 0.51 | |
| MAD | 21.66% | 453.1 | 12.08% | 335.9 | 0.19 | |
| Shapiro–Wilk test results | w | 0.9487 | 0.7694 | 0.9182 | 0.7509 | 0.9710 |
| p-value | 0.0040 | 0.0060 | 0.3035 | 0.0084 | 0.3013 | |
| hypothesis testing | H1 | H1 | H0 | H1 | H0 | |
| No. of articles | 12 | 4 | 5 | 3 | 7 | |
| No. of experiments | 76 | 10 | 11 | 8 | 46 | |
Table 5.
P-values obtained with the statistical tests for all the categorical variables.
| Categorical Variables | Test | Populations | p-Value | Analysis |
|---|---|---|---|---|
| Climate (Köppen–Geiger)–R (%) | Wilcoxon | nCsa = 43 | 0.8463 | The distributions of Csa R (%) and Csb R (%) are not significantly different |
| nCsb = 33 | ||||
| Climate (Köppen–Geiger)–PA (%) | t-test | nCsa = 5 | 0.3201 | There is not a statistically significant difference in mean PA (%) between groups |
| nCsb = 6 | ||||
| Climate (Köppen–Geiger)–RC (−) | t-test | nCsa = 41 | 0.6480 | There is not a statistically significant difference in mean RC (−) between groups |
| nCsb = 5 | ||||
| System–R (%) | Wilcoxon | nmodules = 58 | 5.28 × 10⁻⁷ | The distributions of modules R (%) and complete green roof R (%) are significantly different |
| ncomplete = 18 | ||||
| System–RC (−) | Wilcoxon | nmodules = 38 ncomplete = 8 | 0.0011 | The distributions of modules RC (−) and complete green roof RC (−) are significantly different |
| ncomplete = 8 | ||||
| Protection board (root barrier)–R (%) | Wilcoxon | nRTYes = 58 | 4.74 × 10⁻⁶ | The distributions of Yes R (%) and No R (%) are significantly different |
| nRTNo = 18 | ||||
| Waterproofing layer–R (%) | Wilcoxon | nWLYes = 54 | 0.3107 | The distributions of Yes R (%) and No R (%) are not significantly different |
| nWLNo = 22 | ||||
| Waterproofing layer–PA (%) | Wilcoxon | nWLYes = 6 | 0.0358 | The distributions of Yes PA (%) and No PA (%) are significantly different |
| nWLNo = 5 | ||||
| Waterproofing layer–RC (−) | t-test | nWLYes = 40 | 8.75 × 10⁻⁷ | There is a statistically significant difference in mean RC (−) between groups |
| nWLNo = 6 | ||||
| Filtration layer (Geotextile)–R (%) | Wilcoxon | nFLYes = 72 | 0.4852 | The distributions of Yes R (%) and No R (%) are not significantly different |
| nFLNo = 4 | ||||
| Filtration layer (Geotextile)–PA (%) | Wilcoxon | nFLYes = 7 | 0.0472 | The distributions of Yes PA (%) and are significantly different PA (%) are significantly different |
| nFLNo = 4 | ||||
| Substrate depth Class–R (%) | Kruskal–Wallis | nSubClass1 = 44 | 0.0002 | The difference between the groups medians R (%) is statistically significant |
| nSubClass2 = 23 | ||||
| nSubClass3 = 8 | ||||
| Type of vegetation–R (%) | Kruskal–Wallis | nSedums = 13 | 0.5482 | The difference between the groups medians R (%) is not statistically significant |
| nPerennial = 26 | ||||
| nBoth = 31 | ||||
| Type of vegetation–RC (−) | ANOVA | nSedums = 13 | 0.3010 | There is not a statistically significant difference between groups mean RC (−) |
| nPerennial = 23 | ||||
| nBoth = 5 | ||||
| Native–R (%) | ANOVA | nNative = 42 | 1.96 × 10⁻⁷ | There is a statistically significant difference between groups mean R (%) |
| nNotnative = 12 | ||||
| nBoth = 15 | ||||
| Slope Class–R (%) | Wilcoxon | nSlopeClass1 = 18 | 0.1996 | The distributions of class 1 R (%) and class 2 R (%) are not significantly different |
| nSlopeClass2 = 37 | ||||
| Slope Class–RC (−) | t-test | nSlopeClass1 = 7 | 9.04 × 10⁻⁷ | There is a statistically significant difference in mean RC (−) between groups |
| nSlopeClass2 = 34 | ||||
| Type of Green roof–R (%) | Kruskal–Wallis | nSExtensive = 55 | 1.61 × 10⁻⁵ | The difference between the groups medians R (%) is statistically significant |
| nSemi = 13 | ||||
| nIntensive = 8 |
Table 6.
p-values for the multiple pairwise comparison between groups test applied to the results of Kruskal–Wallis test and p-values for the Tukey multiple comparisons of means test applied to the results of ANOVA test.
Table 6.
p-values for the multiple pairwise comparison between groups test applied to the results of Kruskal–Wallis test and p-values for the Tukey multiple comparisons of means test applied to the results of ANOVA test.
| Variables | Test | Results | ||
|---|---|---|---|---|
| Rainfall retention (%) − Substrate depth class | Multiple pairwise comparison between groups | Class 1 | Class 2 | |
| Class 2 | 0.0153 | - | ||
| Class 3 | 0.0011 | 0.0157 | ||
| Rainfall retention (%) − Type of green roof | Multiple pairwise comparison between groups | Extensive | Intensive | |
| Intensive | 0.0007 | - | ||
| Semi-intensive | 0.0011 | 0.1578 | ||
| Rainfall retention (%) − Native | Tukey multiple comparisons of means | Native | Both | |
| Both | 2.00 × 10⁻⁷ | - | ||
| Not native | 0.0133 | 0.0670 | ||
Table 7.
Spearman’s rank-order correlation test results.
| Continuous Variables | R (%) | PA (%) | RC (−) |
|---|---|---|---|
| Avg monthly precipitation (mm) | −0.4764 | 0.3335 | 0.4889 |
| SD monthly precipitation (mm) | −0.2843 | 0.04228 | 0.1767 |
| Avg monthly temperature (°C) | 0.4837 | −0.6060 | −0.3649 |
| SD monthly temperature (°C) | 0.2645 | −0.4181 | −0.4395 |
| Substrate depth (mm) | 0.4883 | 0.1301 | −0.4020 |
| Plant coverage (%) | 0.2587 | - | −0.2875 |
| Slope (%) | 0.2824 | - | - |
Table 8.
ANOVA of the best regression model.
| Model | Sum of Squares | df | Mean Square | F | Sig. |
|---|---|---|---|---|---|
| Regression | 88,339.074 | 14 | 6309.934 | 79.115 | 0.000 |
| Native | 16,727.339 | 3 | 5575.780 | 69.910 | 0.000 |
| Drainage layer | 11,665.995 | 1 | 11,665.995 | 146.270 | 0.000 |
| Layer system | 10,042.667 | 1 | 10,042.667 | 125.916 | 0.000 |
| Season | 3390.489 | 2 | 1695.244 | 21.255 | 0.000 |
| Substrate depth | 3365.394 | 1 | 3365.394 | 42.196 | 0.000 |
| Climate Köppen–Geiger | 2773.797 | 1 | 2773.797 | 34.778 | 0.000 |
| Waterproofing layer | 2052.609 | 1 | 2052.609 | 25.736 | 0.000 |
| Protection board (root barrier) | 819.601 | 1 | 819.601 | 10.276 | 0.002 |
| Climate type | 765.462 | 1 | 765.462 | 9.597 | 0.002 |
| Type of vegetation | 615.326 | 2 | 307.663 | 3.858 | 0.023 |
| Residual | 12,761.051 | 160 | 79.757 | ||
| Total | 101,100.124 | 174 |
Table 9.
Coefficients of the best regression model.
| Variable | Coefficient | Std. Error | t | Sig. | 95% Confidence Interval | |
|---|---|---|---|---|---|---|
| Upper | Lower | |||||
| Intercept | 45.422 | 4.341 | 10.464 | 0.000 | 53.995 | 36.849 |
| Native = Both | 34.186 | 2.660 | 12.850 | 0.000 | 39.440 | 28.932 |
| Native = Native | 37.878 | 3.035 | 12.482 | 0.000 | 43.871 | 31.885 |
| Native = Not native | 22.350 | 3.132 | 7.137 | 0.000 | 28.534 | 16.165 |
| Native = Unknown | 0.000 | |||||
| Drainage layer = No | −32.152 | 2.658 | −12.094 | 0.000 | −26.901 | −37.402 |
| Drainage layer = Unknown, Yes | 0.000 | |||||
| Layer system = Multilayer | −32.967 | 2.938 | −11.221 | 0.000 | −27.165 | −38.769 |
| Layer system = Single layer | 0.000 | |||||
| Season = Spring/Summer | 8.967 | 3.171 | 2.828 | 0.005 | 15.230 | 2.704 |
| Season = Fall, Winter, Winter/Spring | −12.756 | 2.197 | −5.806 | 0.000 | −8.417 | −17.095 |
| Season = remaining options | 0.000 | |||||
| Substrate depth | 0.093 | 0.014 | 6.496 | 0.000 | 0.122 | 0.065 |
| Climate Köppen–Geiger = Cwa–dry-winter humid subtropical climate | 12.951 | 2.196 | 5.897 | 0.000 | 17.288 | 8.614 |
| Climate Köppen–Geiger = remaining options | 0.000 | |||||
| Waterproofing layer = No | −10.282 | 2.027 | −5.073 | 0.000 | −6.280 | −14.285 |
| Waterproofing layer = Unknown, Yes | 0.000 | |||||
| Protection board (root barrier) = Yes | 6.099 | 1.902 | 3.206 | 0.002 | 9.856 | 2.341 |
| Protection board (root barrier) = Unknown, No | 0.000 | |||||
| Climate type = 1 | 7.204 | 2.325 | 3.098 | 0.002 | 11.796 | 2.611 |
| Climate type = 2 | 0.000 | |||||
| Type of vegetation = Unknown | −1.090 | 5.273 | −0.207 | 0.836 | 9.322 | −11.503 |
| Type of vegetation = Sedums and other succulents; Perennial herbaceous plants and grasses | 4.541 | 1.665 | 2.728 | 0.007 | 7.828 | 1.253 |
| Type of vegetation = remaining options | 0.000 | |||||
Publisher’s Note: MDPI stays neutral with regard to jurisdictional claims in published maps and institutional affiliations. |
© 2021 by the authors. Licensee MDPI, Basel, Switzerland. This article is an open access article distributed under the terms and conditions of the Creative Commons Attribution (CC BY) license (https://creativecommons.org/licenses/by/4.0/).
Share and Cite
MDPI and ACS Style
Silva, J.; Paço, T.A.; Sousa, V.; Silva, C.M. Hydrological Performance of Green Roofs in Mediterranean Climates: A Review and Evaluation of Patterns. Water 2021, 13, 2600. https://doi.org/10.3390/w13182600
AMA Style
Silva J, Paço TA, Sousa V, Silva CM. Hydrological Performance of Green Roofs in Mediterranean Climates: A Review and Evaluation of Patterns. Water. 2021; 13(18):2600. https://doi.org/10.3390/w13182600
Chicago/Turabian StyleSilva, Joana, Teresa A. Paço, Vítor Sousa, and Cristina M. Silva. 2021. "Hydrological Performance of Green Roofs in Mediterranean Climates: A Review and Evaluation of Patterns" Water 13, no. 18: 2600. https://doi.org/10.3390/w13182600
Note that from the first issue of 2016, this journal uses article numbers instead of page numbers. See further details here.