
Scientometric Analysis-Based Review for Drought Modelling, Indices, Types, and Forecasting Especially in Asia
by
Dan Wu
1,2,3,*, 
Yanan Li
1,2,3,4,
Hui Kong
1,2,3,
Tingting Meng
1,2,3,
Zenghui Sun
1,2,3 and
Han Gao
4 1
Shaanxi Provincial Land Engineering Construction Group Co., Ltd., Xi’an 710075, China
2
Institute of Land Engineering and Technology, Shaanxi Provincial Land Engineering Construction Group Co., Ltd., Xi’an 710021, China
3
Shaanxi Provincial Land Consolidation Engineering Technology Research Center, Xi’an 710075, China
4
Xi’an Railway Engineering Co., Ltd. of China Railway Seventh Group, Xi’an 710032, China
*
Author to whom correspondence should be addressed.
Water 2021, 13(18), 2593; https://doi.org/10.3390/w13182593
Submission received: 12 July 2021
/
Revised: 2 September 2021
/
Accepted: 15 September 2021
/
Published: 20 September 2021
(This article belongs to the Special Issue Advances in Flood Forecasting and Hydrological Modeling)
Abstract
:An extended drought period with low precipitation can result in low water availability and issues for humans, animals, and plants. Drought forecasting is critical for water resource development and management as it helps to reduce negative consequences. In this study, scientometric analysis and manual comprehensive analysis on drought modelling and forecasting are used. A scientometric analysis is used to determine the current research trend using bibliometric data and to identify relevant publication field sources with the most publications, the most frequently used keywords, the most cited articles and authors, and the countries that have made the greatest contributions to the field of water resources. This paper also tries to provide an overview of water issues, such as drought classification, drought indices, historical droughts, and their impact on Asian countries such as China, Pakistan, India, and Iran. There have been many models established for this purpose and choosing the appropriate model for study is a long procedure for researchers. An appropriate, comprehensive, pedagogical study of model ideas and historical implementations would benefit researchers by helping them to avoid overlooking viable model options, thus reducing their time spent on the topic. As a result, the goal of this paper is to review drought-forecasting approaches and recommend the best models for the Asian region. The models are divided into four categories based on their mechanisms: Regression analysis, stochastic modelling, machine learning, and dynamic modelling. The basic concepts of each approach in terms of the model’s historical use, benefits, and limitations are explained. Finally, prospects for future drought research in Asia are discussed as well as potential modelling techniques.
1. Introduction
Drought is the one climatic event that is linked to desertification. A natural hazard caused by a lack of precipitation is called drought. Drought can lead to water shortages in activities or groups. Sometimes, it is accompanied by other weather factors such as heat, strong winds, and low humidity. Drought is distinguished from aridity because it is generally located in regions with limited rainfall and is a constant feature of the climate. There are droughts that occur in all climatic regions [1]. A severe drought in Latin America, Asia, and the Caribbean in 2000 increased global concerns about future water shortages due to long droughts. More than half of the total land area in south-eastern Europe, the Middle East, and central Asia was affected by severe drought in 2000. Afghanistan, Bulgaria, Iraq and the Islamic Republic of Iran, and some parts of China bore the brunt of the violence. Northern Mexico and the southwestern regions of the United States had over six months of abnormally hot weather, resulting in the worst wildfire in the past 50 years [2].
Droughts are common in China, and the country is severely affected. The balance of water accessible via surface evapotranspiration and plant transpiration is being influenced by global warming. Drought risk, as well as the uncertainty and risk inherent with agricultural production, are all increased as a result of this global warming. The stratosphere and troposphere air circulation over East Asia, which affects most of China, has shifted significantly since the 1970s. Extreme weather occurs, making China more susceptible to droughts while also making it more susceptible to floods. Every year, large-scale drought hazards are observed. Drought affects about 20.9 million hectares of agriculture each year, peaking at 40.54 million hectares in some years. Reductions in food output vary from 1 to 30 million tonnes per year, causing a direct economic loss of about 44 billion yuan per year [3]. In Pakistan, the climate varies greatly due to distinct climates across the country. While in the northeast, the region is covered with glaciers and snow, the southwest experiences severe drought. Agriculture, hydropower, drinking water, industry, culture, and the overall economy of the country are all affected by this climate variability [4]. Five well-defined geographic regions, namely the northwestern, southwestern, southeastern, northern, and central/eastern regions, were revealed in Iran due to the area’s dry season variability. Investigations indicate that there have been significant negative trends in surface water balance across the country, especially over the past two decades (1998–2017). However, the western area, which contains the greatest risk of drought, has experienced prolonged and more severe droughts [5]. With a high degree of variation, rainfall over India is prone to meteorological droughts and floods. Monsoonal rainfall exhibits high spatial variability, which means there are occasions where some regions get flooded while others experience a severe rainfall shortage, leading to drought [6]. Drought propagation at the catchment scale is investigated using a lumped, simple, yet physically based hydrologic model under various climate conditions. Because of their simple representations, conceptual models are well suited for understanding the roles of the various processes governing drought propagation. Simple conceptual models have fewer parameters, making it easier to track the impact of each hydrologic process on the final result [7].
Drought is a serious threat to food, and it has become one of the most important factors impeding a socioeconomic system’s long-term development. Crop and animal productivity decrease as a result of decreased soil moisture, causing a reduction in the food supply at the top of the food chain. In dry periods lasting a long time with river stream flows or when storage levels fall below average, drought develops. Due to the fact that it encompasses both depletion and replenishment processes, it grows at a slower rate than the two previous categories. If water demand is not being met, a socio-economic drought occurs. Droughts can be classified based on precipitation anomaly timescales. For example, a common approach to determining droughts based on time scales is to use the Standardized Precipitation Index (SPI), which defines droughts from SPI-1 to SPI-6. From one to six on the SPI scale, droughts resulting from climatic changes are described as agricultural droughts, and from SPI-6 to SPI-24, as hydrological droughts [8]. According to this definition, the accuracy of forecasting drought events is vitally important to water resources’ planning and management. A number of drought-predicting models have been created to aid with drought forecasting. These methods have been built using sound methodologies, such as regression analysis, Autoregressive integrated moving average (ARIMA), Markov chain, Artificial neural network (ANN), fuzzy logic (FL), and support vector regression (SVR).
In order to gain a better understanding of the current and potential future state of drought across Asia, it is necessary to investigate different drought modelling techniques, indices, and different types of droughts in that area. Writing comprehensive literature reviews from scratch will not provide sufficient depth and consistency in all sections of the literature. For difficult tasks, complexity and a small dataset are crucial. For modern research, the difficulties include a lot of mapping and visualization that needs to be done using a small dataset. A scientometric review does not add to the complexity of analyzing existing data, but it handles large amounts of data without increasing the overall challenge of responding to fundamental limitations of previous manual evaluations. While traditional reviews are being used, scientometric analysis is employed in conjunction with those reviews to remedy the issues that traditional reviews are burdened with. The specific methodology employed is more concerned with the keywords co-occurrence, co-authorship, bibliographic coupling of sources, articles, and countries contributing to the topic of the application of drought in Asia rather than just using the few most commonly used keywords. For the manual review section, the purpose is to investigate different drought indices and methods. An in-depth look is provided on the issues posed by drought in Asian countries such as China, India, Pakistan, and Iran. In addition to identifying various limitations associated with drought monitoring, this analysis suggests possible solutions to those problems. To accomplish the following objectives in the current study, a quantitative method for measuring science production known as scientometric analysis is combined with a qualitative method for formulating scientific research questions and solving problems. To find the most relevant publication field, publication sources, most frequently used keywords, most cited authors and works, and nations with the greatest influence in the field of waste materials’ utilization for sustainability, the publication fields, keywords, and most cited authors and works, as well as nations with influence in the drought modelling must be considered. To examine the current level of research and how it has focused on numerous elements throughout the last two decades, the key to identifying gaps in the research is identifying research priorities so that future research can be pointed in the proper direction.
In recent decades, extensive research has been conducted to examine the drought condition and various mitigation strategies, yielding some useful results. Additionally, review studies were conducted, but these were primarily manual reviews. This review is based on scientometric analysis and a detailed discussion of drought modelling techniques, indices, and the drought situation in Asia. The novelty of this study is based on scientometeric analysis, which is different from the traditional manual reviews and is more authentic as data are collected from the Scopus database. Researchers from diverse geographical locations may benefit from the graphical representation based on scientometric evaluation when forming research alliances, forming joint ventures, and sharing breakthrough technologies and ideas as a result of this research. Despite past efforts, the lack of drought quantification studies in China, India, Pakistan, and Iran is cause for worry. Future research is needed to create a unified drought severity map for the Asian region. This study will be helpful for creating drought severity maps in most Asian nations utilizing drought indicators or indices studied in this review article to make drought mitigation and preparation easier. Finally, Asian countries offer a plethora of possibilities for drought research, including drought measurement using novel techniques, drought prediction and projection, and atmospheric oscillation teleconnections. Additionally, this article explores potential drought modelling directions. As the global sensitivity to drought has increased, considerable focus has been paid to mitigating risks associated with its occurrence via the implementation of planning to strengthen operational capacities (i.e., climate and water supply monitoring, as well as the building of institutional capability), and, historically, when a natural disaster or hazard event occurred, governments responded with impact assessment, response, recovery, and reconstruction activities to restore the region or locality to its pre-disaster state. Preparation, mitigation, and prediction/early warning actions (i.e., risk management) that could mitigate future impacts and reduce the need for future government intervention have received scant attention. There is a need for mitigation measures pointed at mitigating the drought impacts.
2. Methodology
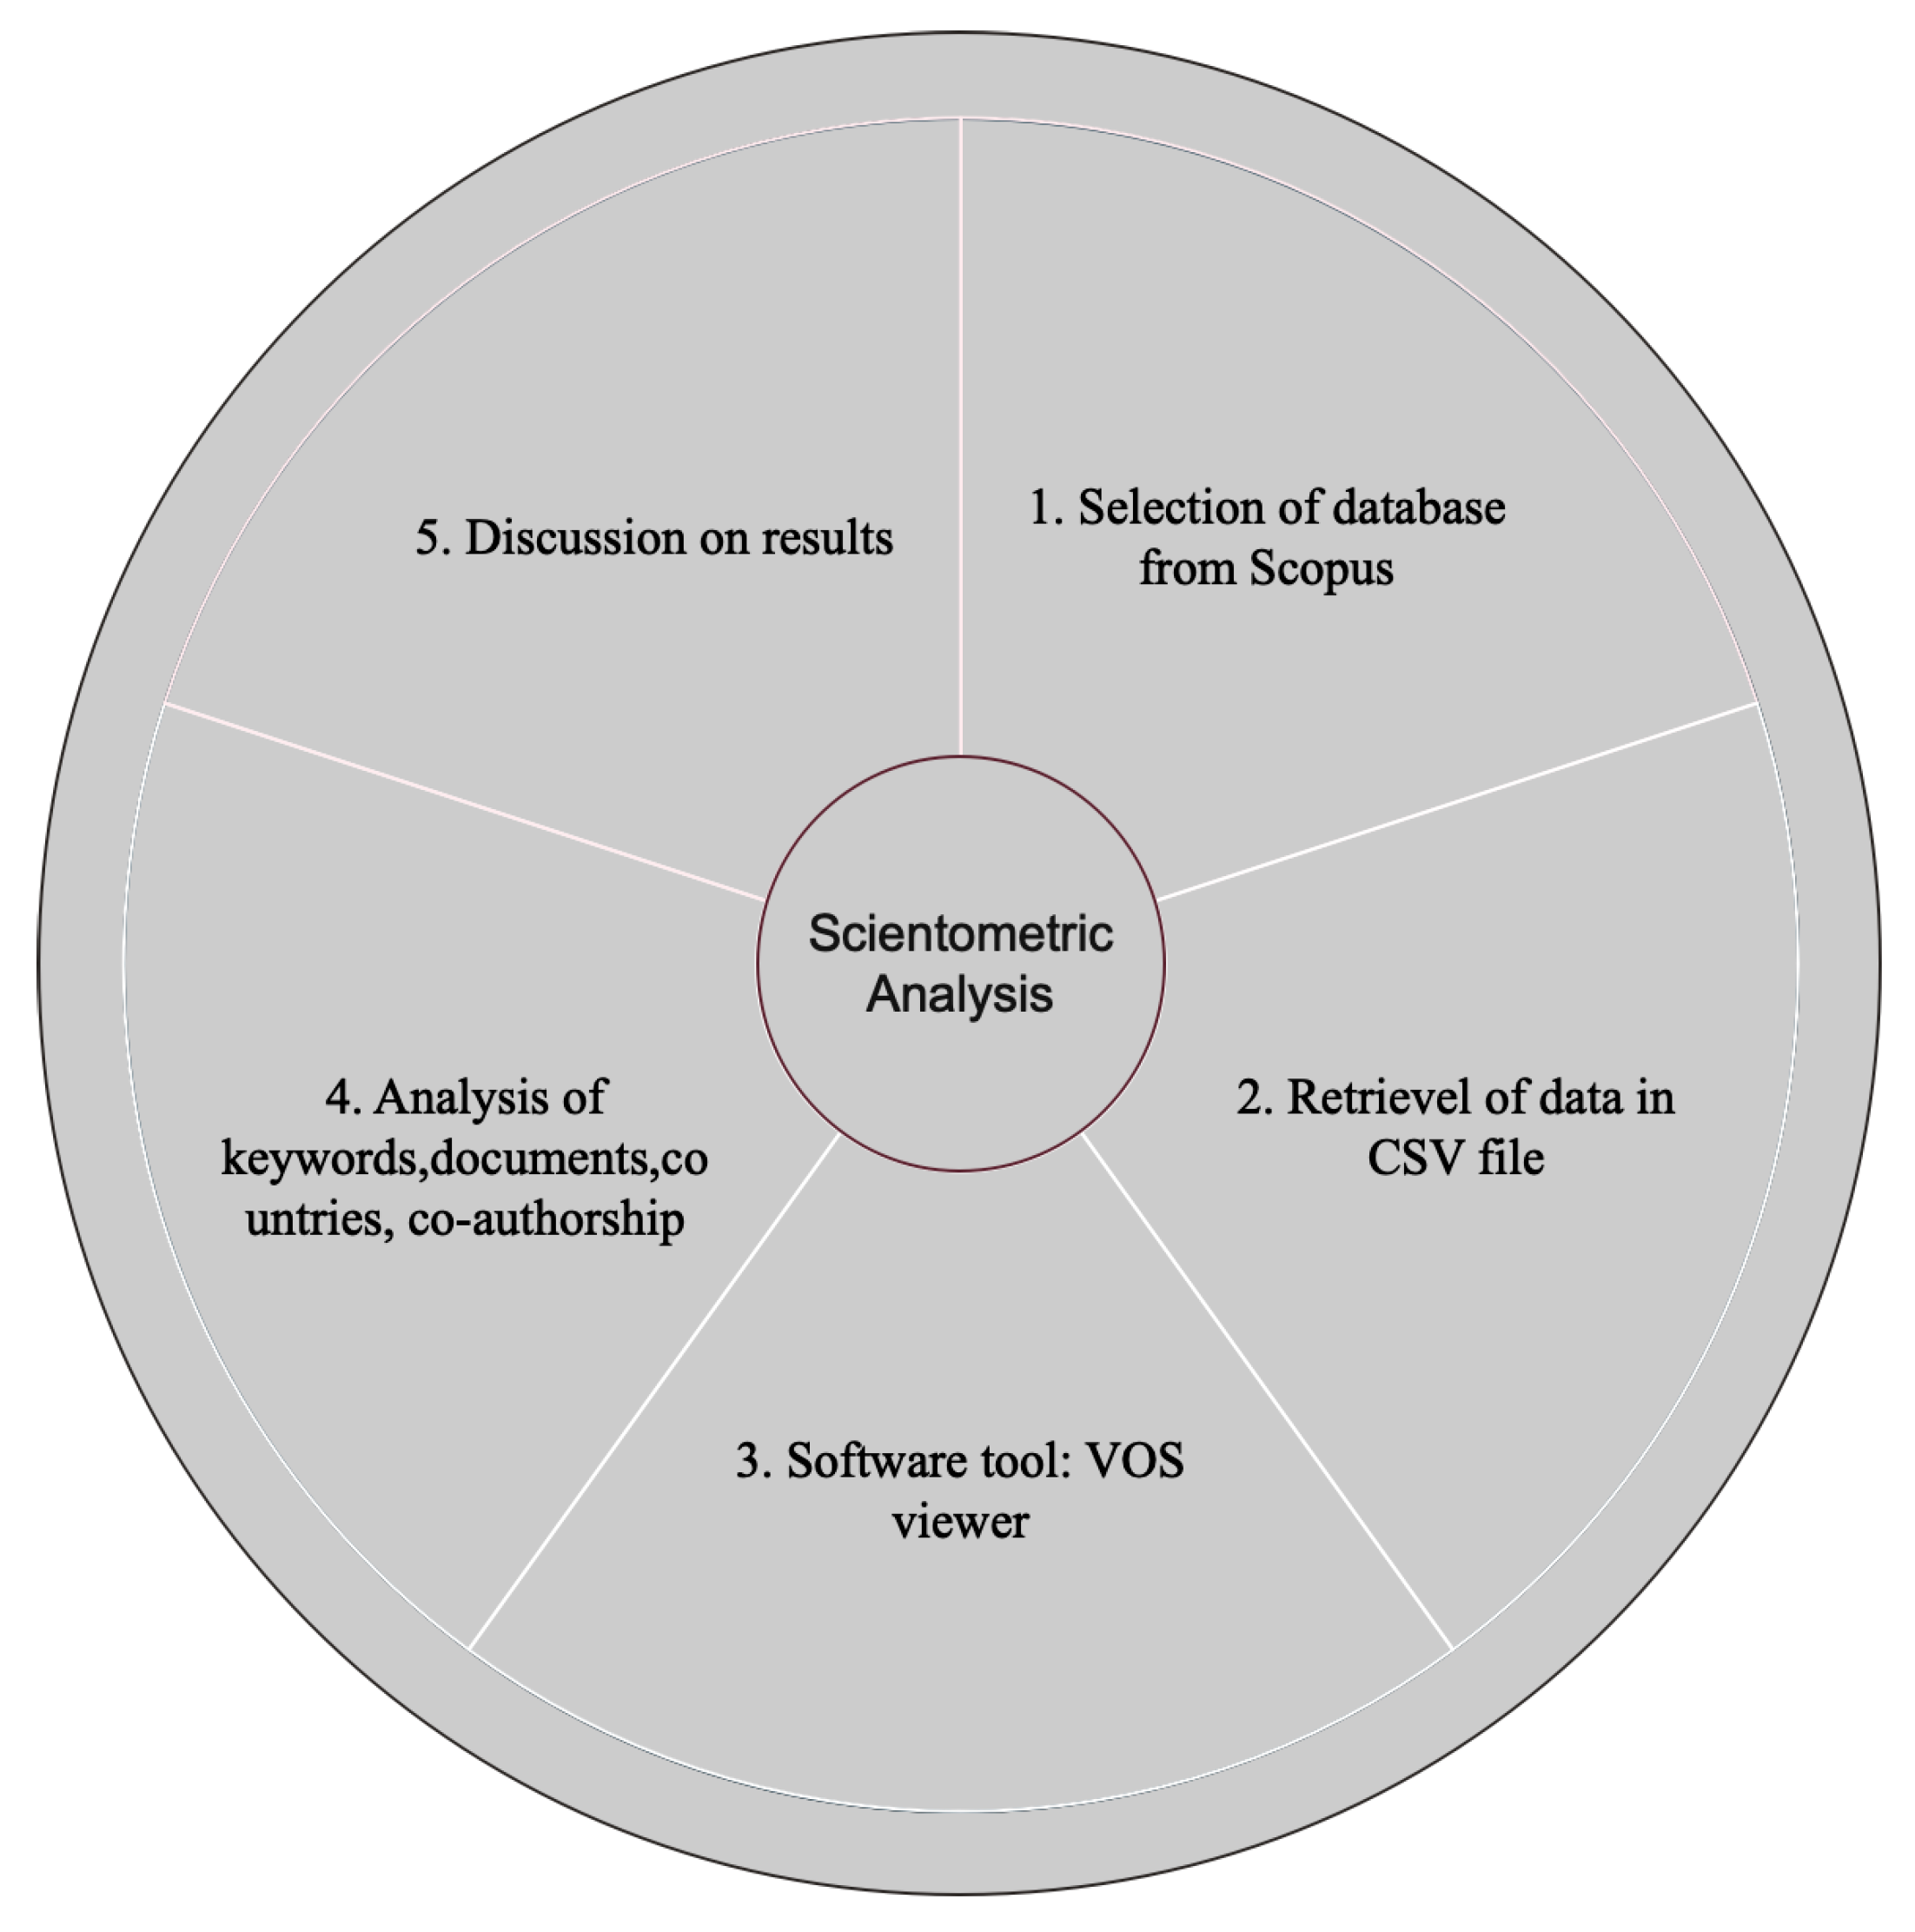
This study employed two approaches: Scientometric analysis review on drought modelling and forecasting. The methodologies used in this research were quantitative (e.g., using bibliometric mapping methods) for producing visually interesting information, i.e., scientific data analysis was carried out using bibliometric mapping methods. The use of a visualization of similarities (VOS) viewer to construct the visual representation of bibliometric network maps was implemented (i.e., VOS viewer: Visualization of Similarities) [9]. In this research, the bibliometric analysis focused on the general intellectual structure of drought monitoring and prediction, and the deployment of methods such as dynamic modelling, stochastic modelling, and machine learning over the chosen study period. The analyses that were completed covered the yearly output of scientific papers, the most prolific nations, and the cooperation of both groups, as well as a lot of different keyword occurrences, plus the development of research from topic to theme.
The literature in this field is extensive and locating the most authoritative database is essential. As found by Aghaei et al. [10], the two most thorough, inclusive, and fact-based literature search databases are Scopus and Web of Science. Web of Science contains outdated bibliometric data and a less extensive coverage than Scopus [10,11]. The Scopus bibliometric data for the present investigation on the application of drought modelling was utilized in compiling the bibliometric data. “Droughts in Asia” was the searched phrase in Scopus, which returned 3443 documents. To screen out the irrelevant papers, options for data refining were utilized. Only “article” and “review” were chosen from the “document type”. As opposed to “no language specified,” the source type was set to “journal”, while the language was set to “English”. Beginning in 2000, the “publication year” was restricted to 2021. With these restricting filters applied, the final number of papers ended up being 2000. To our knowledge, prior researchers have used comparable strategies. The methodology of scientific visualization, created by researchers for a variety of objectives, is also used in scientometric studies. The main purpose of the essay is to outline the difficulties researchers have while performing manual reviews, as well as to show how keywords, authors, papers, and nations are connected in a certain study topic.
A tool was used to analyze the Scopus data, which were stored in the Comma Separated Values (CSV) format for future reference. The mapping and visualization tools used the VOS viewer to construct the science (version 1.6.16). The VOS viewer is a frequently used visualization tool that is well regarded in literature. The VOS viewer was utilized to meet the present study’s aims, as is shown in the results. A new study was conducted in the VOS viewer, which was set up to obtain a map using data found in bibliographic database files. While maintaining data integrity and dependability, the CSV file acquired from Scopus was imported into the VOS viewer and evaluated in a few easy steps. Keyword co-occurrence, citation network, co-authorship, publications, bibliometric overlaps, and country contributions were assessed as part of the scientific mapping review. To this end, we calculated the total number of citations to the publications. Other nations were included on the map to show the relationships between writers and publications. Tables were utilized to describe the quantitative values of numerous factors, while maps were employed to show their relationships and their co-occurrence. We included keyword reviews and a summary of debate points in the study findings to produce important findings. It is depicted in Figure 1.
3. Results and Discussion on Scientometric Analysis
3.1. Subject Area and Annual Publication Pattern of Articles
The Scopus analyzer was used to conduct a search in the Scopus database in order to find the most important research topics. The data revealed that the top four fields based on the number of documents were environmental science, agriculture, and biological science, with 28% of the total documents, followed by social science with 7%, earth and planetary sciences with 27%, multidisciplinary with 2%, and engineering, which accounted for 4% of the total documents, as in Figure 2. About 70.3% of the total number of papers searched in the Scopus database were accounted for by these fields. Journal papers and review articles were both compared to see how often the various types of papers are used in an overall document. In fact, 87.5% of the papers published in journals were ongoing or preliminary research, whereas 12.5% were written to assess existing work. Figure 3 represents the research field publishing trend from 2010 to 2021, which is shown by the model in Figure 3. From 2018 to 2020, there was a minor rise in the number of publications on the use of drought monitoring, and then in 2021, publication levels decreased. Although a large growth was noticed in the previous two years, the actual value may be a little lower. While experts now concentrate their efforts on drought simulation methodologies, it is nevertheless exciting to see how new and intriguing approaches to the topic have been discovered.
3.2. Keywords Mapping
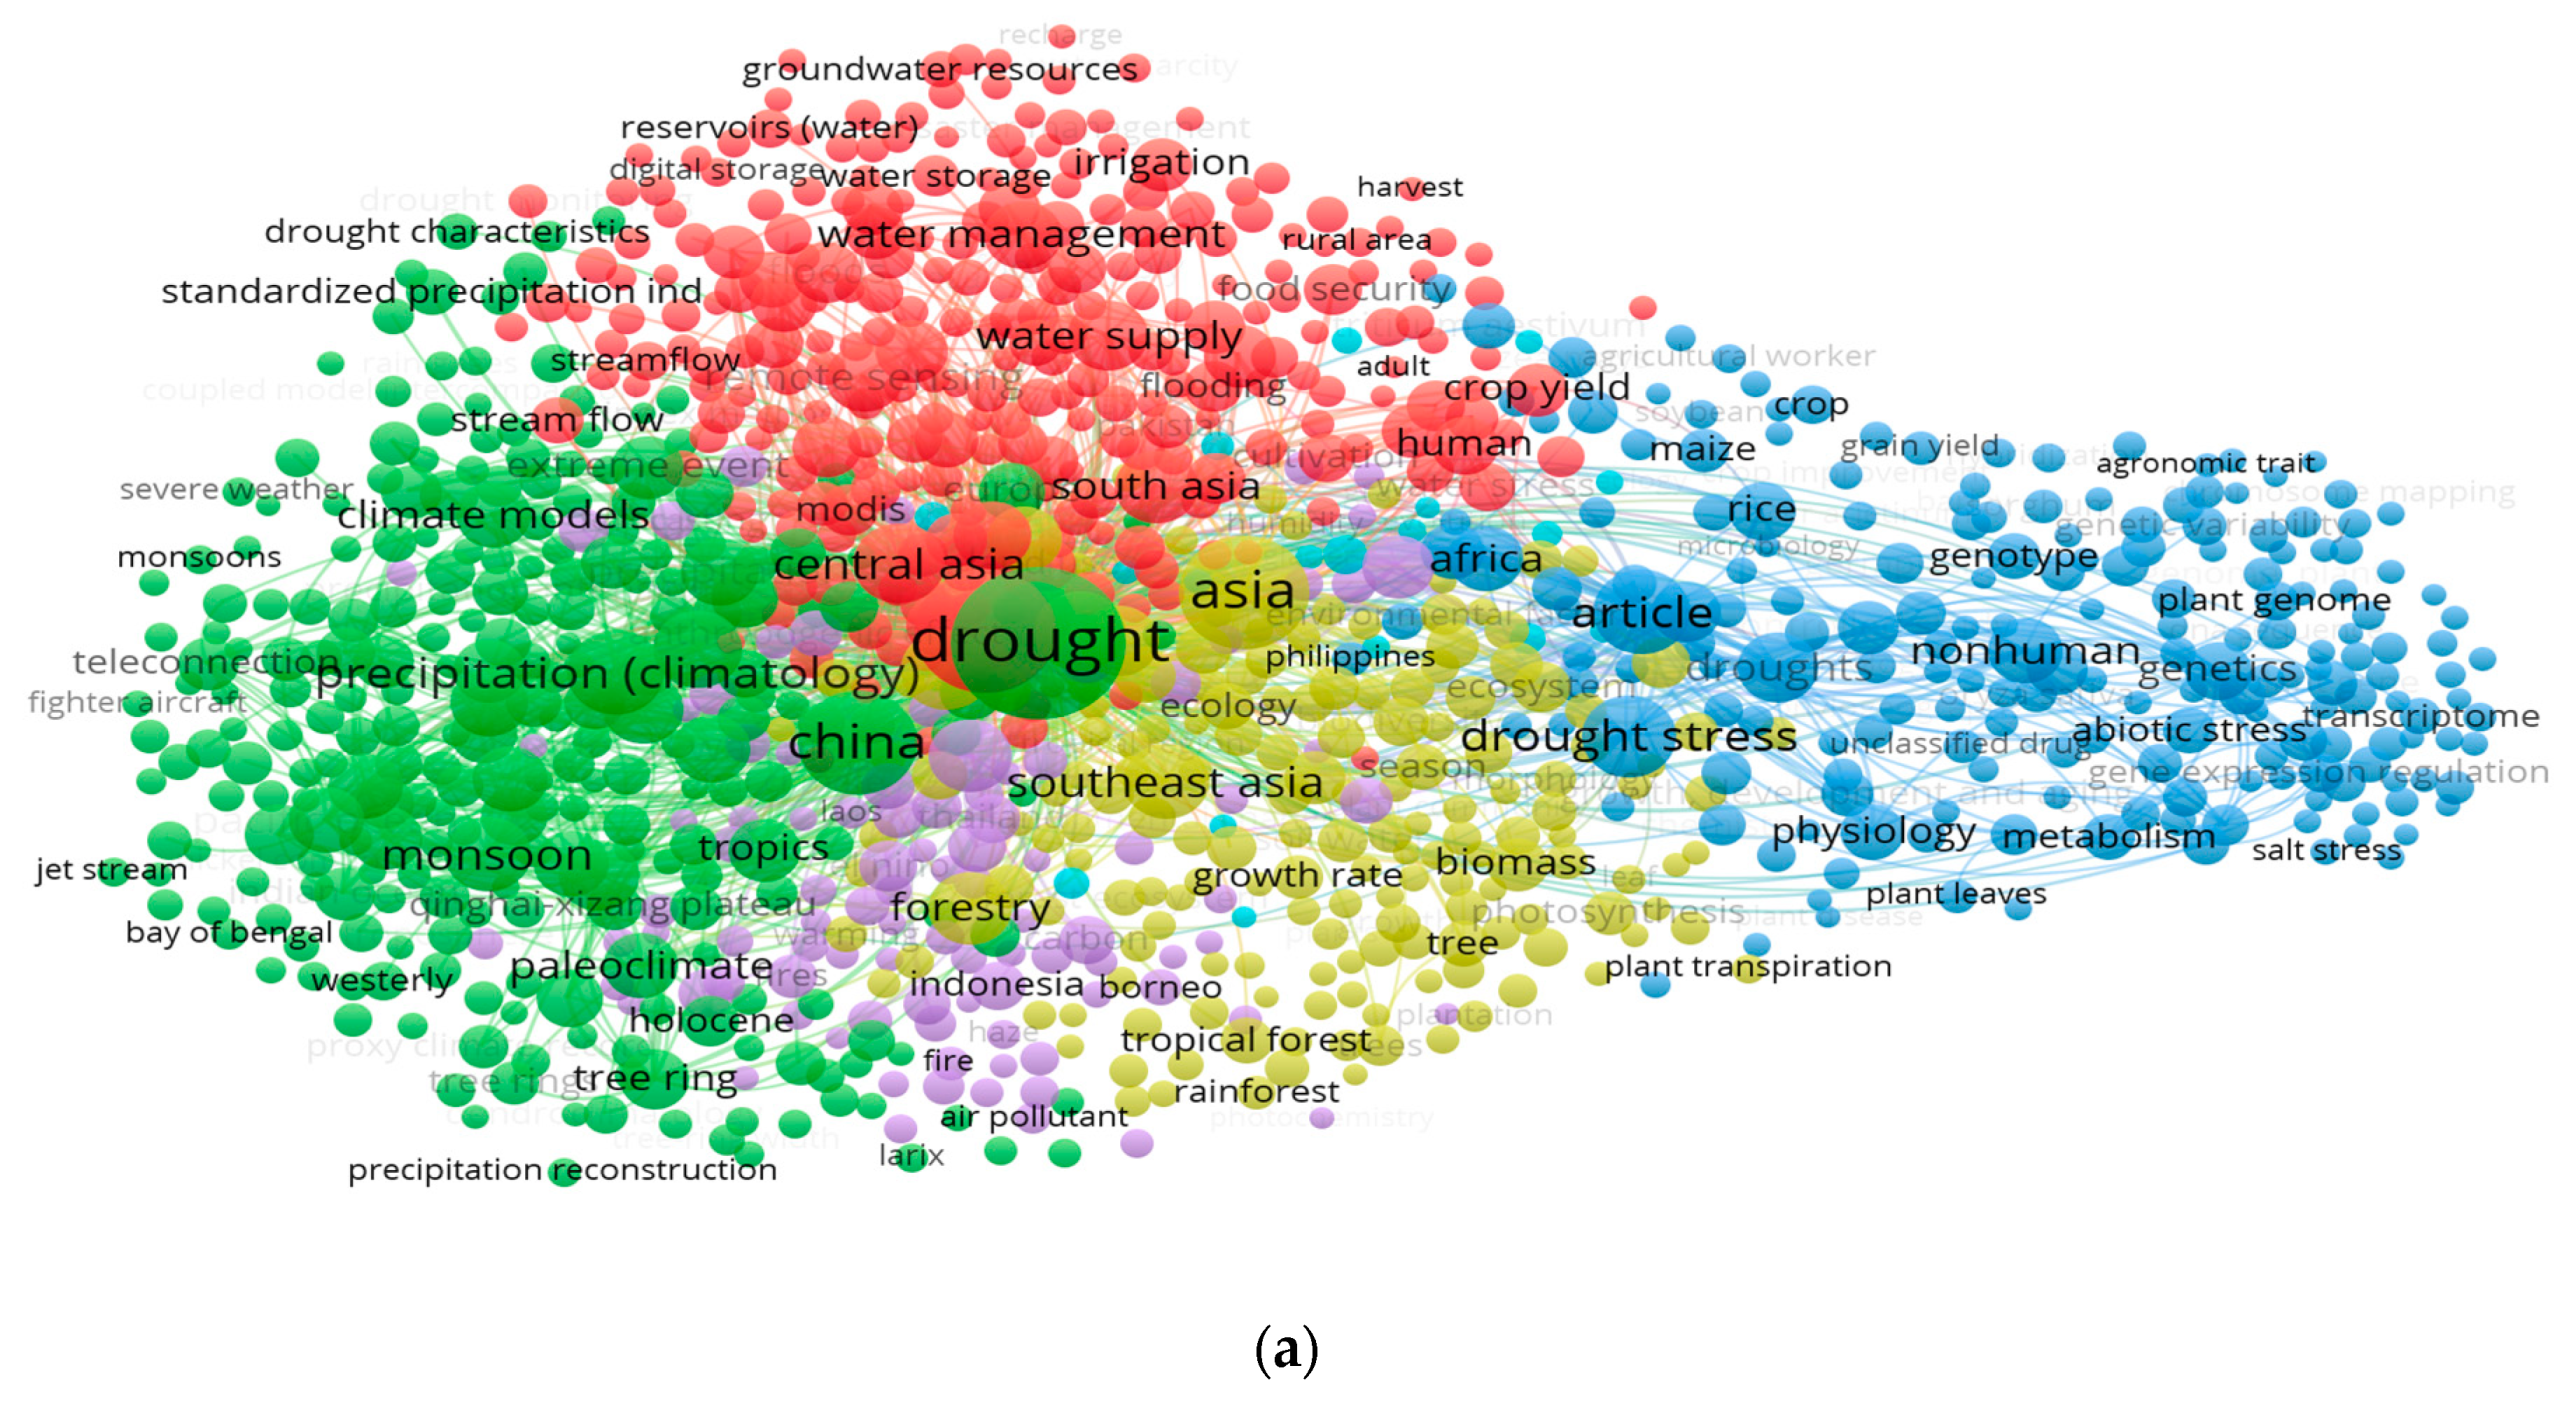
The keywords are an important research resource since they help identify and reflect the topic of study under research. In order to conduct the study, the “type of analysis” was selected as “co-occurrence” and the “unit of analysis” as “all keywords”. To ensure that no term was ever used less than 50 times, the minimum occurrence of a term was set at 50. As indicated in Figure 4b, the density concentration of keywords is marked by distinctive colors Because of these limits, it was determined that only 109 terms from 12,368 fit the criterion. Table 1 shows the top 20 search terms with the highest use in the current investigation that were employed in the research papers in the study. According to the researcher’s analysis, the most regularly appearing terms are drought, climate change, Asia, China, and Eurasia. The top five most regularly happening keywords include drought, climate change, Asia, China, and Eurasia. This image (Figure 5) depicts the co-occurrence of keywords in the network, their visualization, their connections to one another, and the density of their correlation frequency. The position of the keyword node in Figure 4a reflects the frequency of the keyword, while the size of the keyword node reflects the density of the term in published works. Additionally, the visualization illustrates that the aforementioned keywords have larger nodes than the others, which indicates that they are the most relevant keywords in the research of drought modelling. Multiple keywords have been visually distinguished in the network for the purpose of indicating their co-occurrence in diverse publications. A total of four clusters were detected, with each group represented by green, red, blue, and yellow. As an example, a cluster that is green in hue comprises the words south Asia, central Asia, irrigation, climate change, water supply, and so on. The colors of the rainbow in increasing order of density are red, yellow, green, and blue. In this way, droughts, precipitation, monsoons, and rainfall all have red markings in the density representation, signifying a greater density. This discovery will be beneficial to authors in the future since it will assist them in picking keywords that help in locating published material in a certain field.
3.3. Co-Authorship Mapping
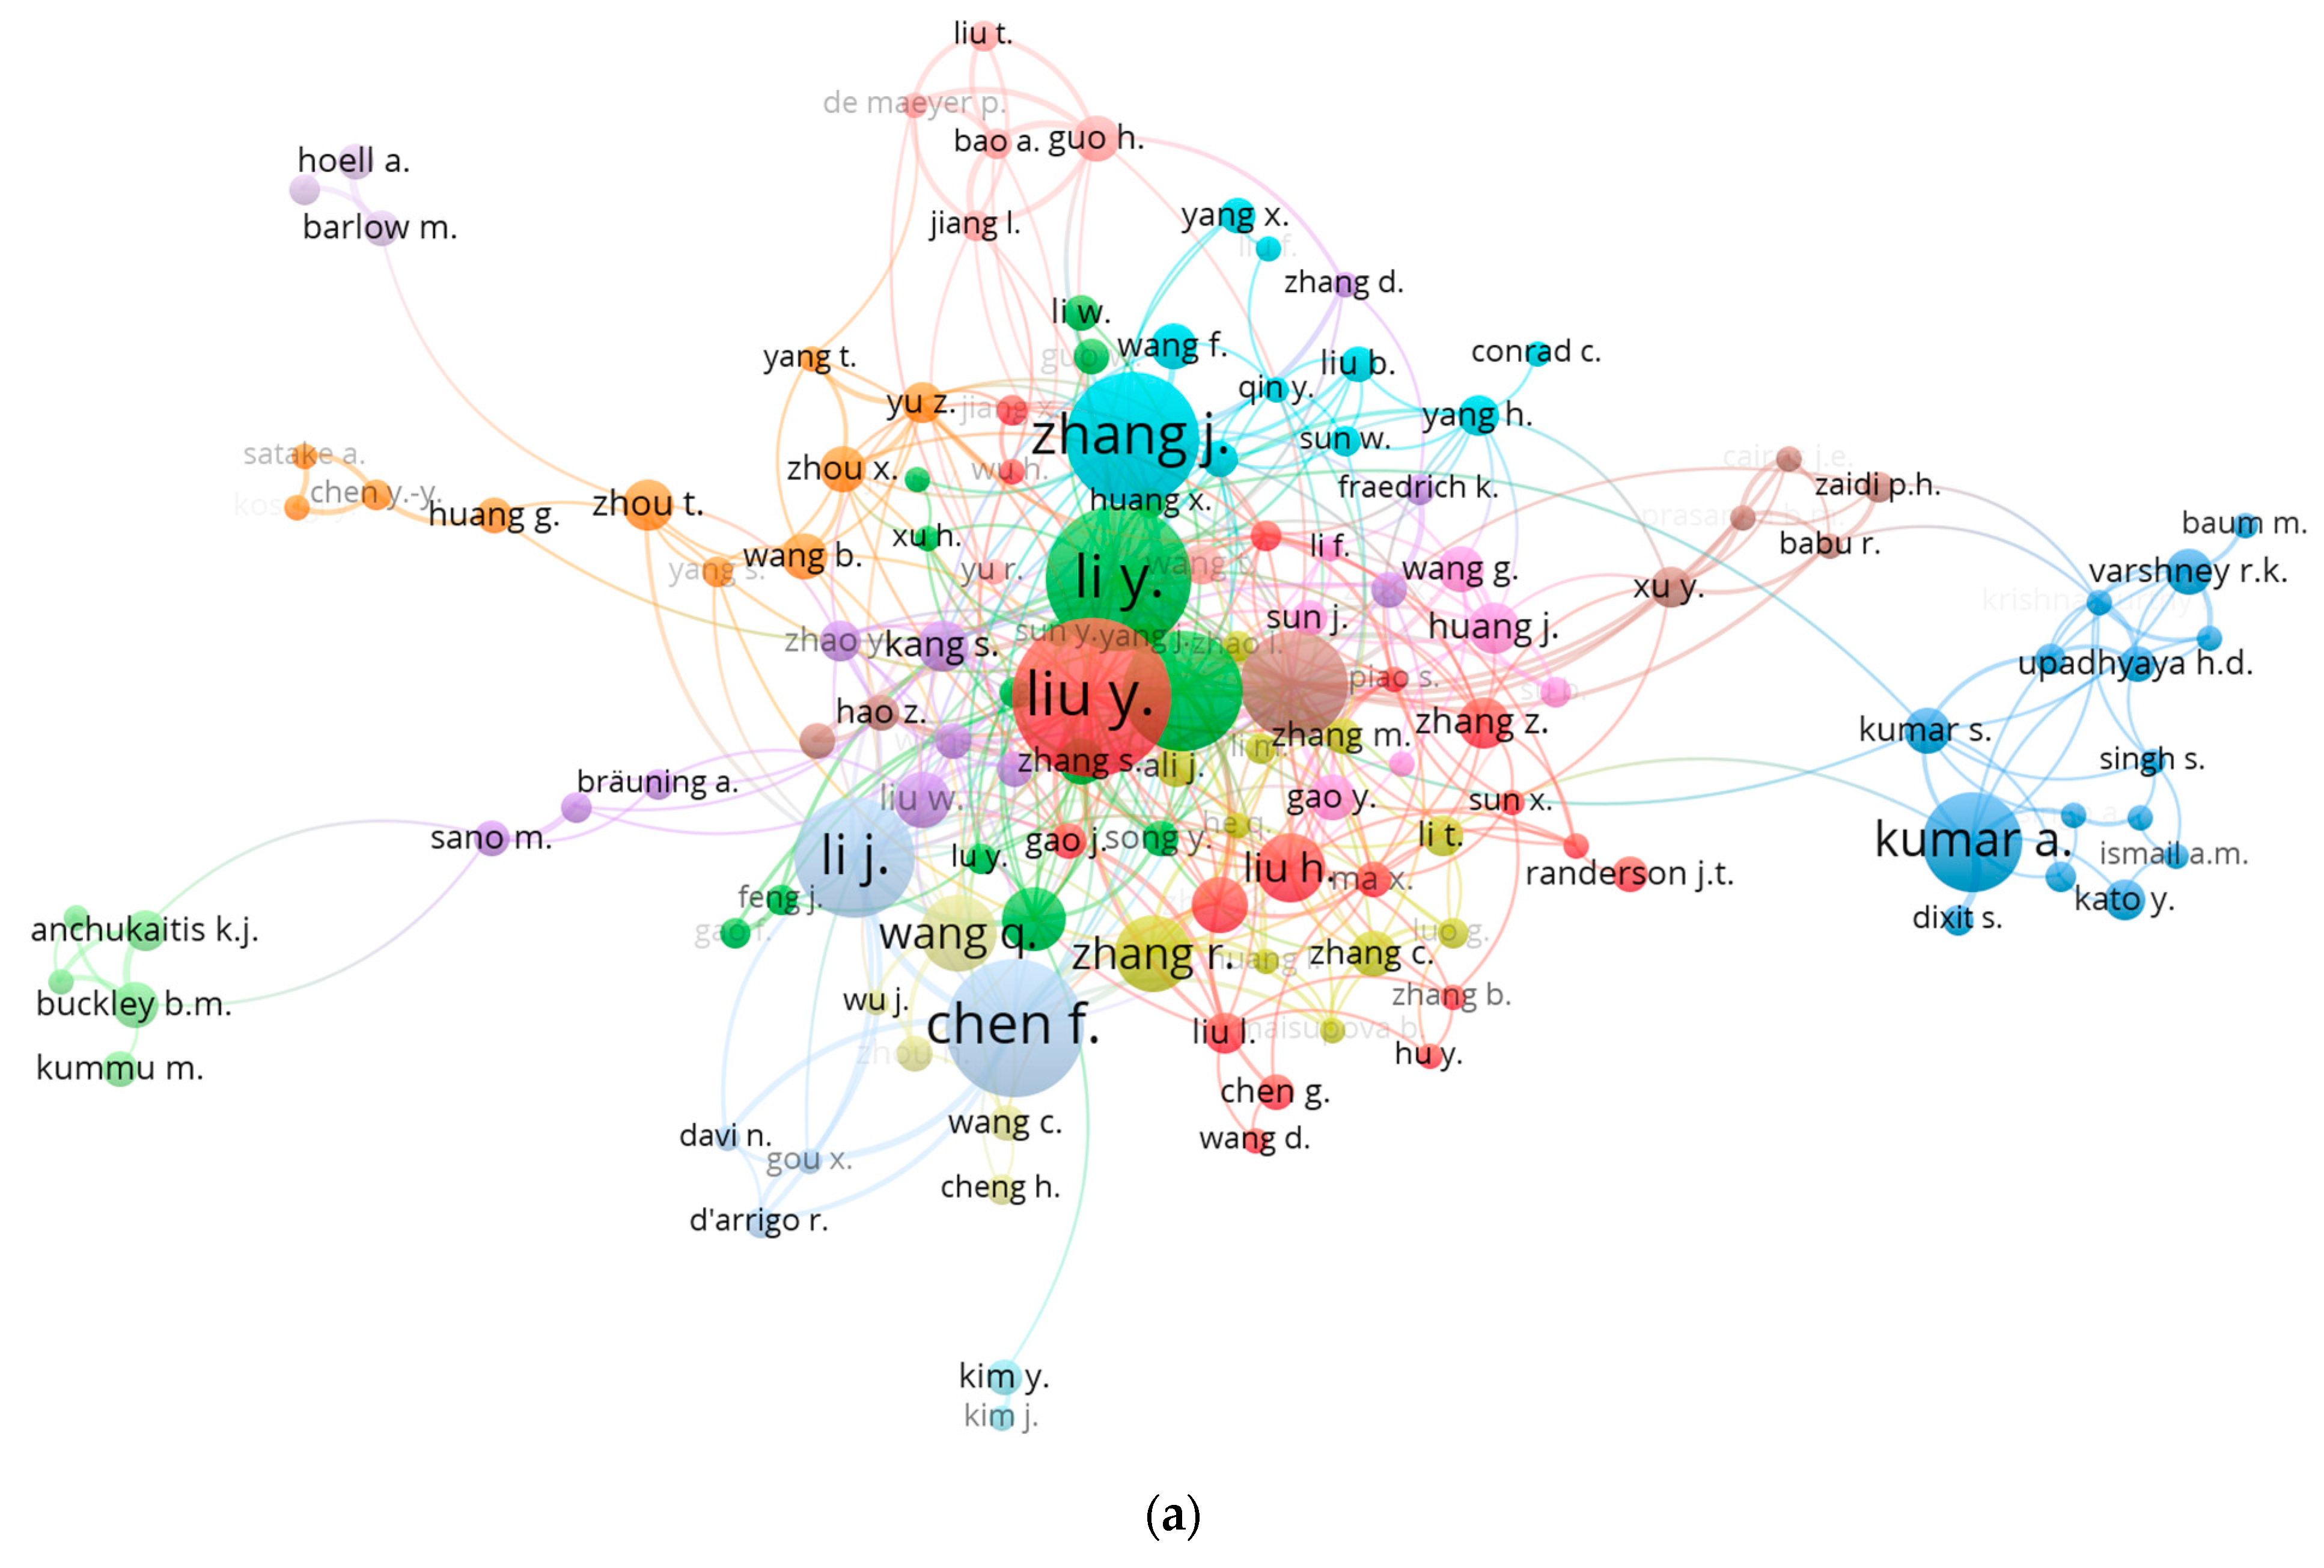
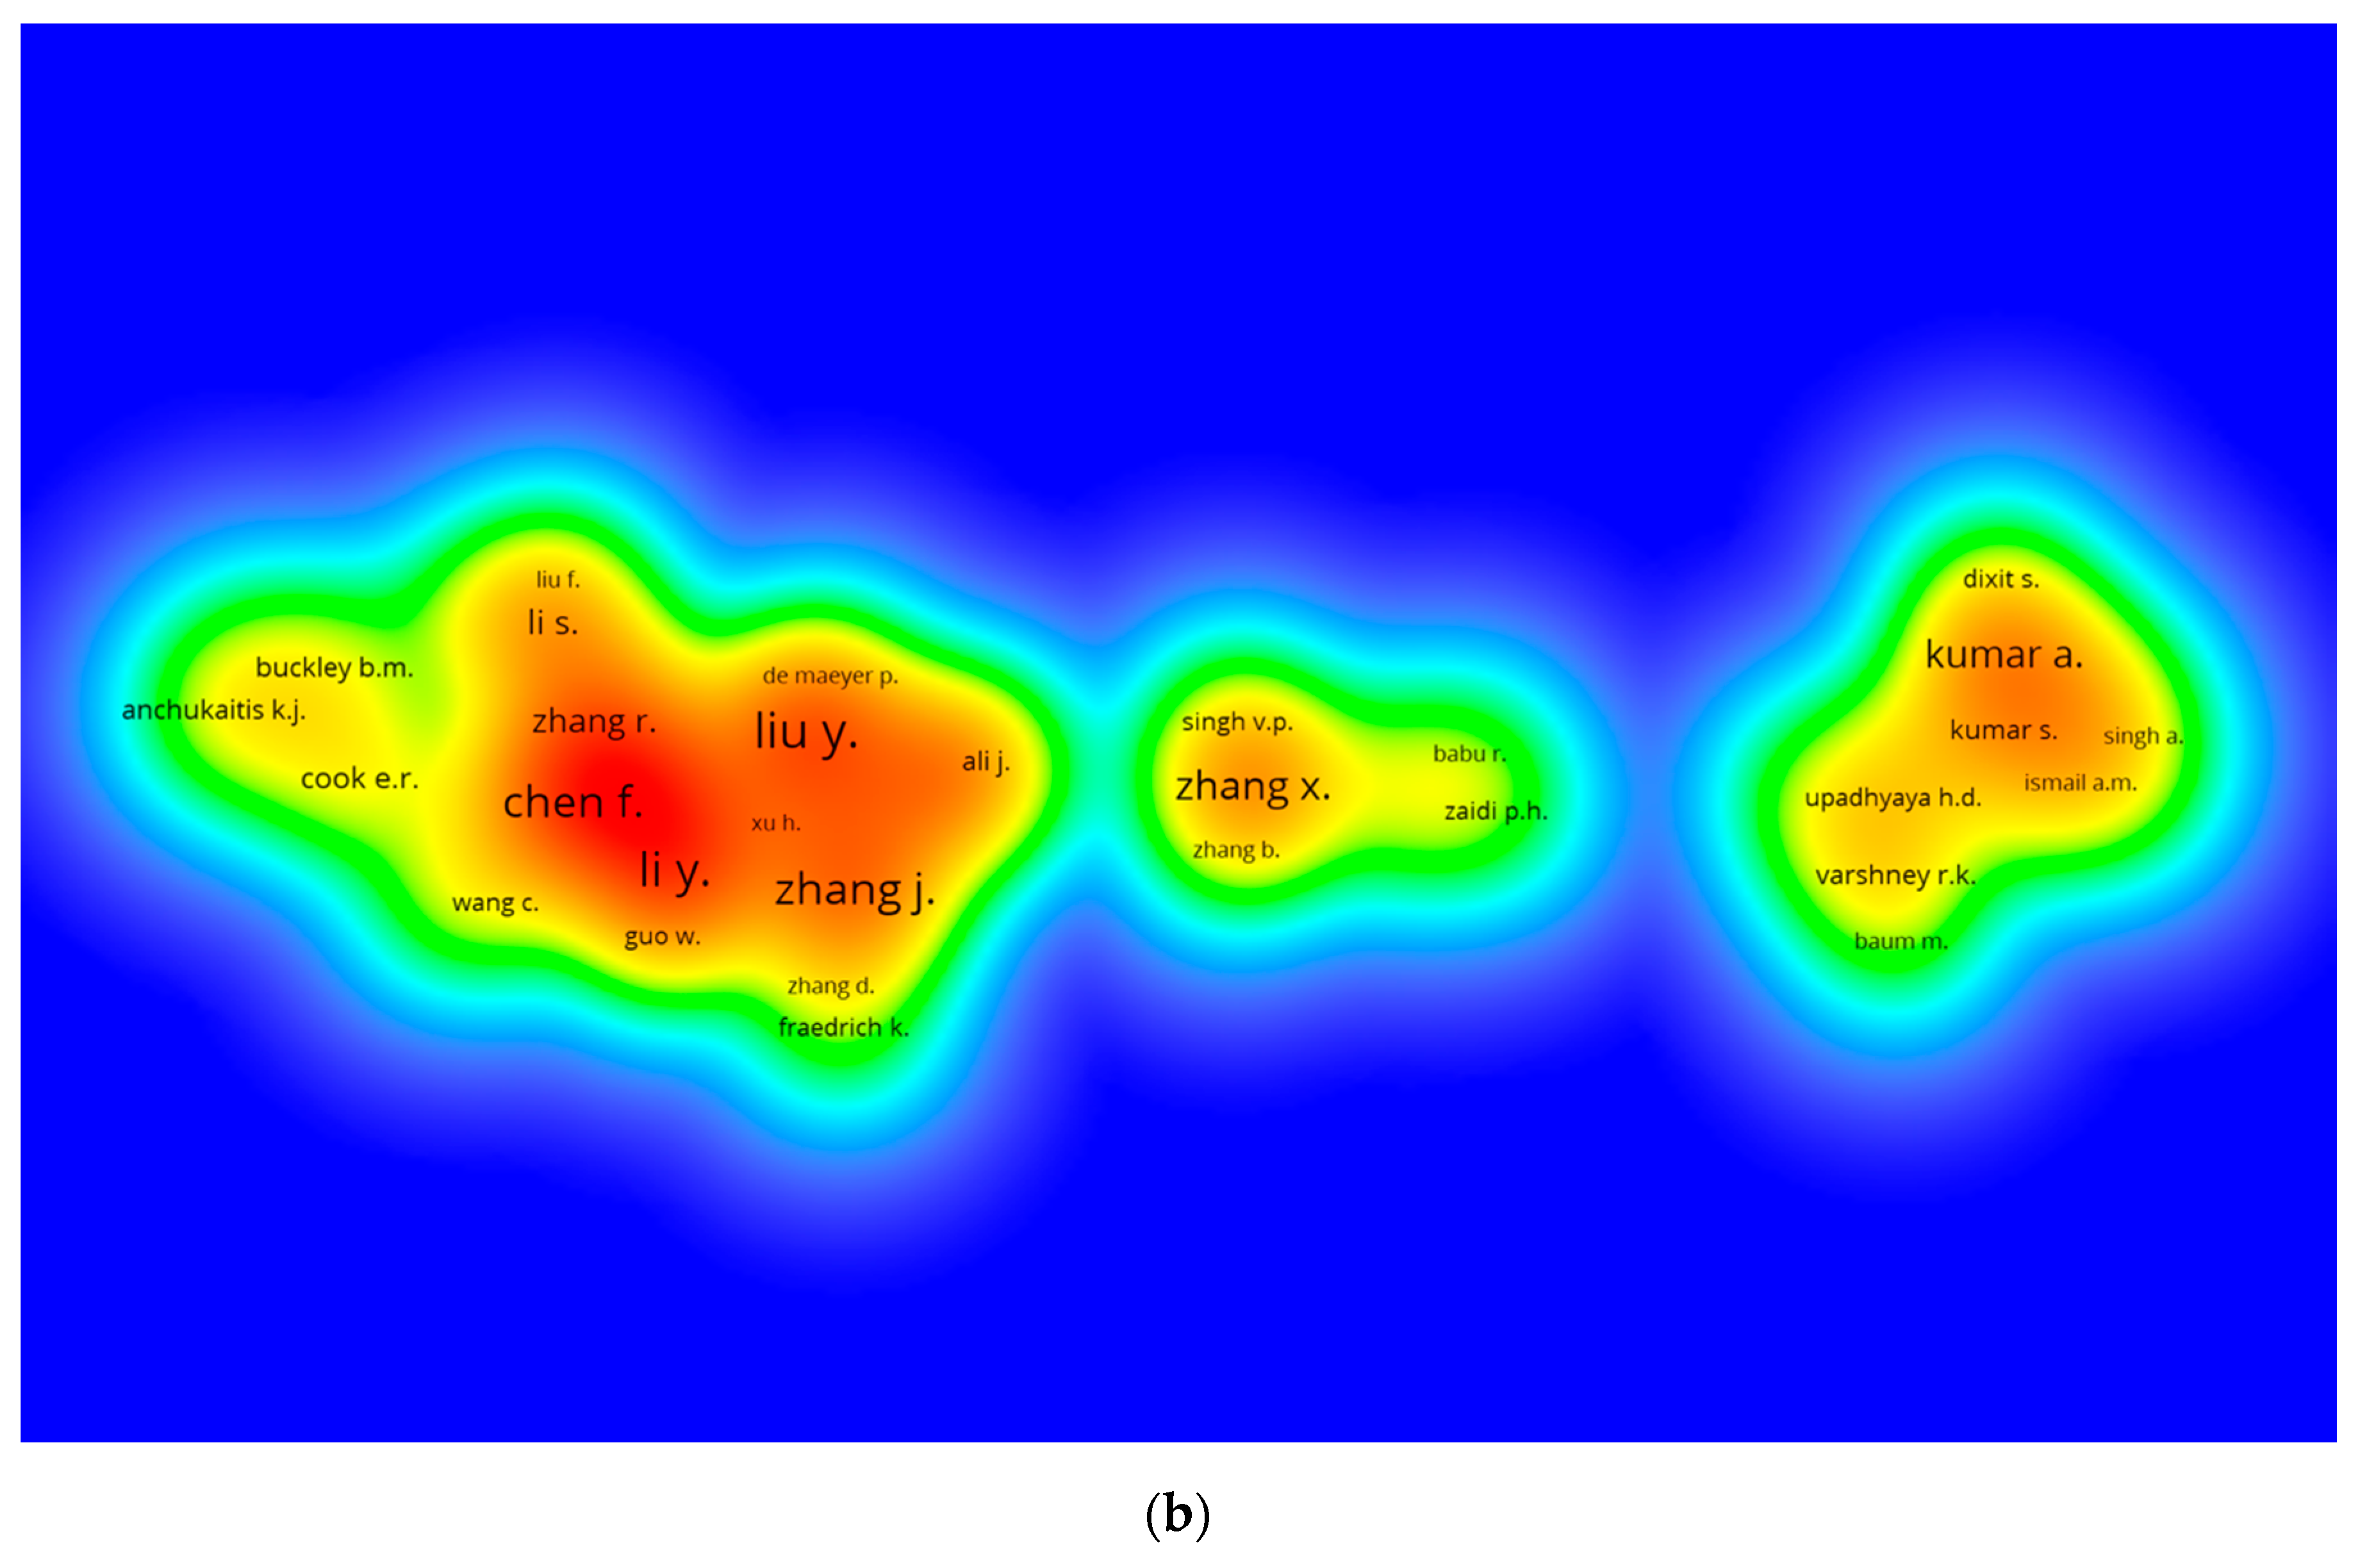
When citation numbers reflect an author’s impact in a given subject, that researcher’s name will appear. Selecting “co-authorship” as the “kind of analysis” and “authors” as the “unit of analysis” in the VOS viewer yields a great result. Approximately 188 of 6832 authors met the requirements since the minimal number of papers was 5. The results of our study are given in Table 2, as shown by the data obtained from the Scopus database. The total number of citations divided by the number of publications by each author was used to get the average citation count. Liu y. has 35 published papers, whereas Dai a. had the most citations (2527). It will be difficult to measure a researcher’s performance as an individual. However, the author’s grade will be based on whether or not all factors are being considered separately or when they are all included into one. The figures reveal that the most prolific writers are Chen F., with 30 publications, Li y., with 28 publications, and Zhang J., with 29 publications. Comparing the number of citations, Cook e.r and Anchukaitis k.j. rank second and third with 1384 and 1383 citations, respectively, Buckley b.m. ranks fourth with 1311, and randerson j.t. ranks fifth with (1010) citations. In Figure 5a,b, authors with five or more papers are shown, along with the density visualization.
3.4. Countries
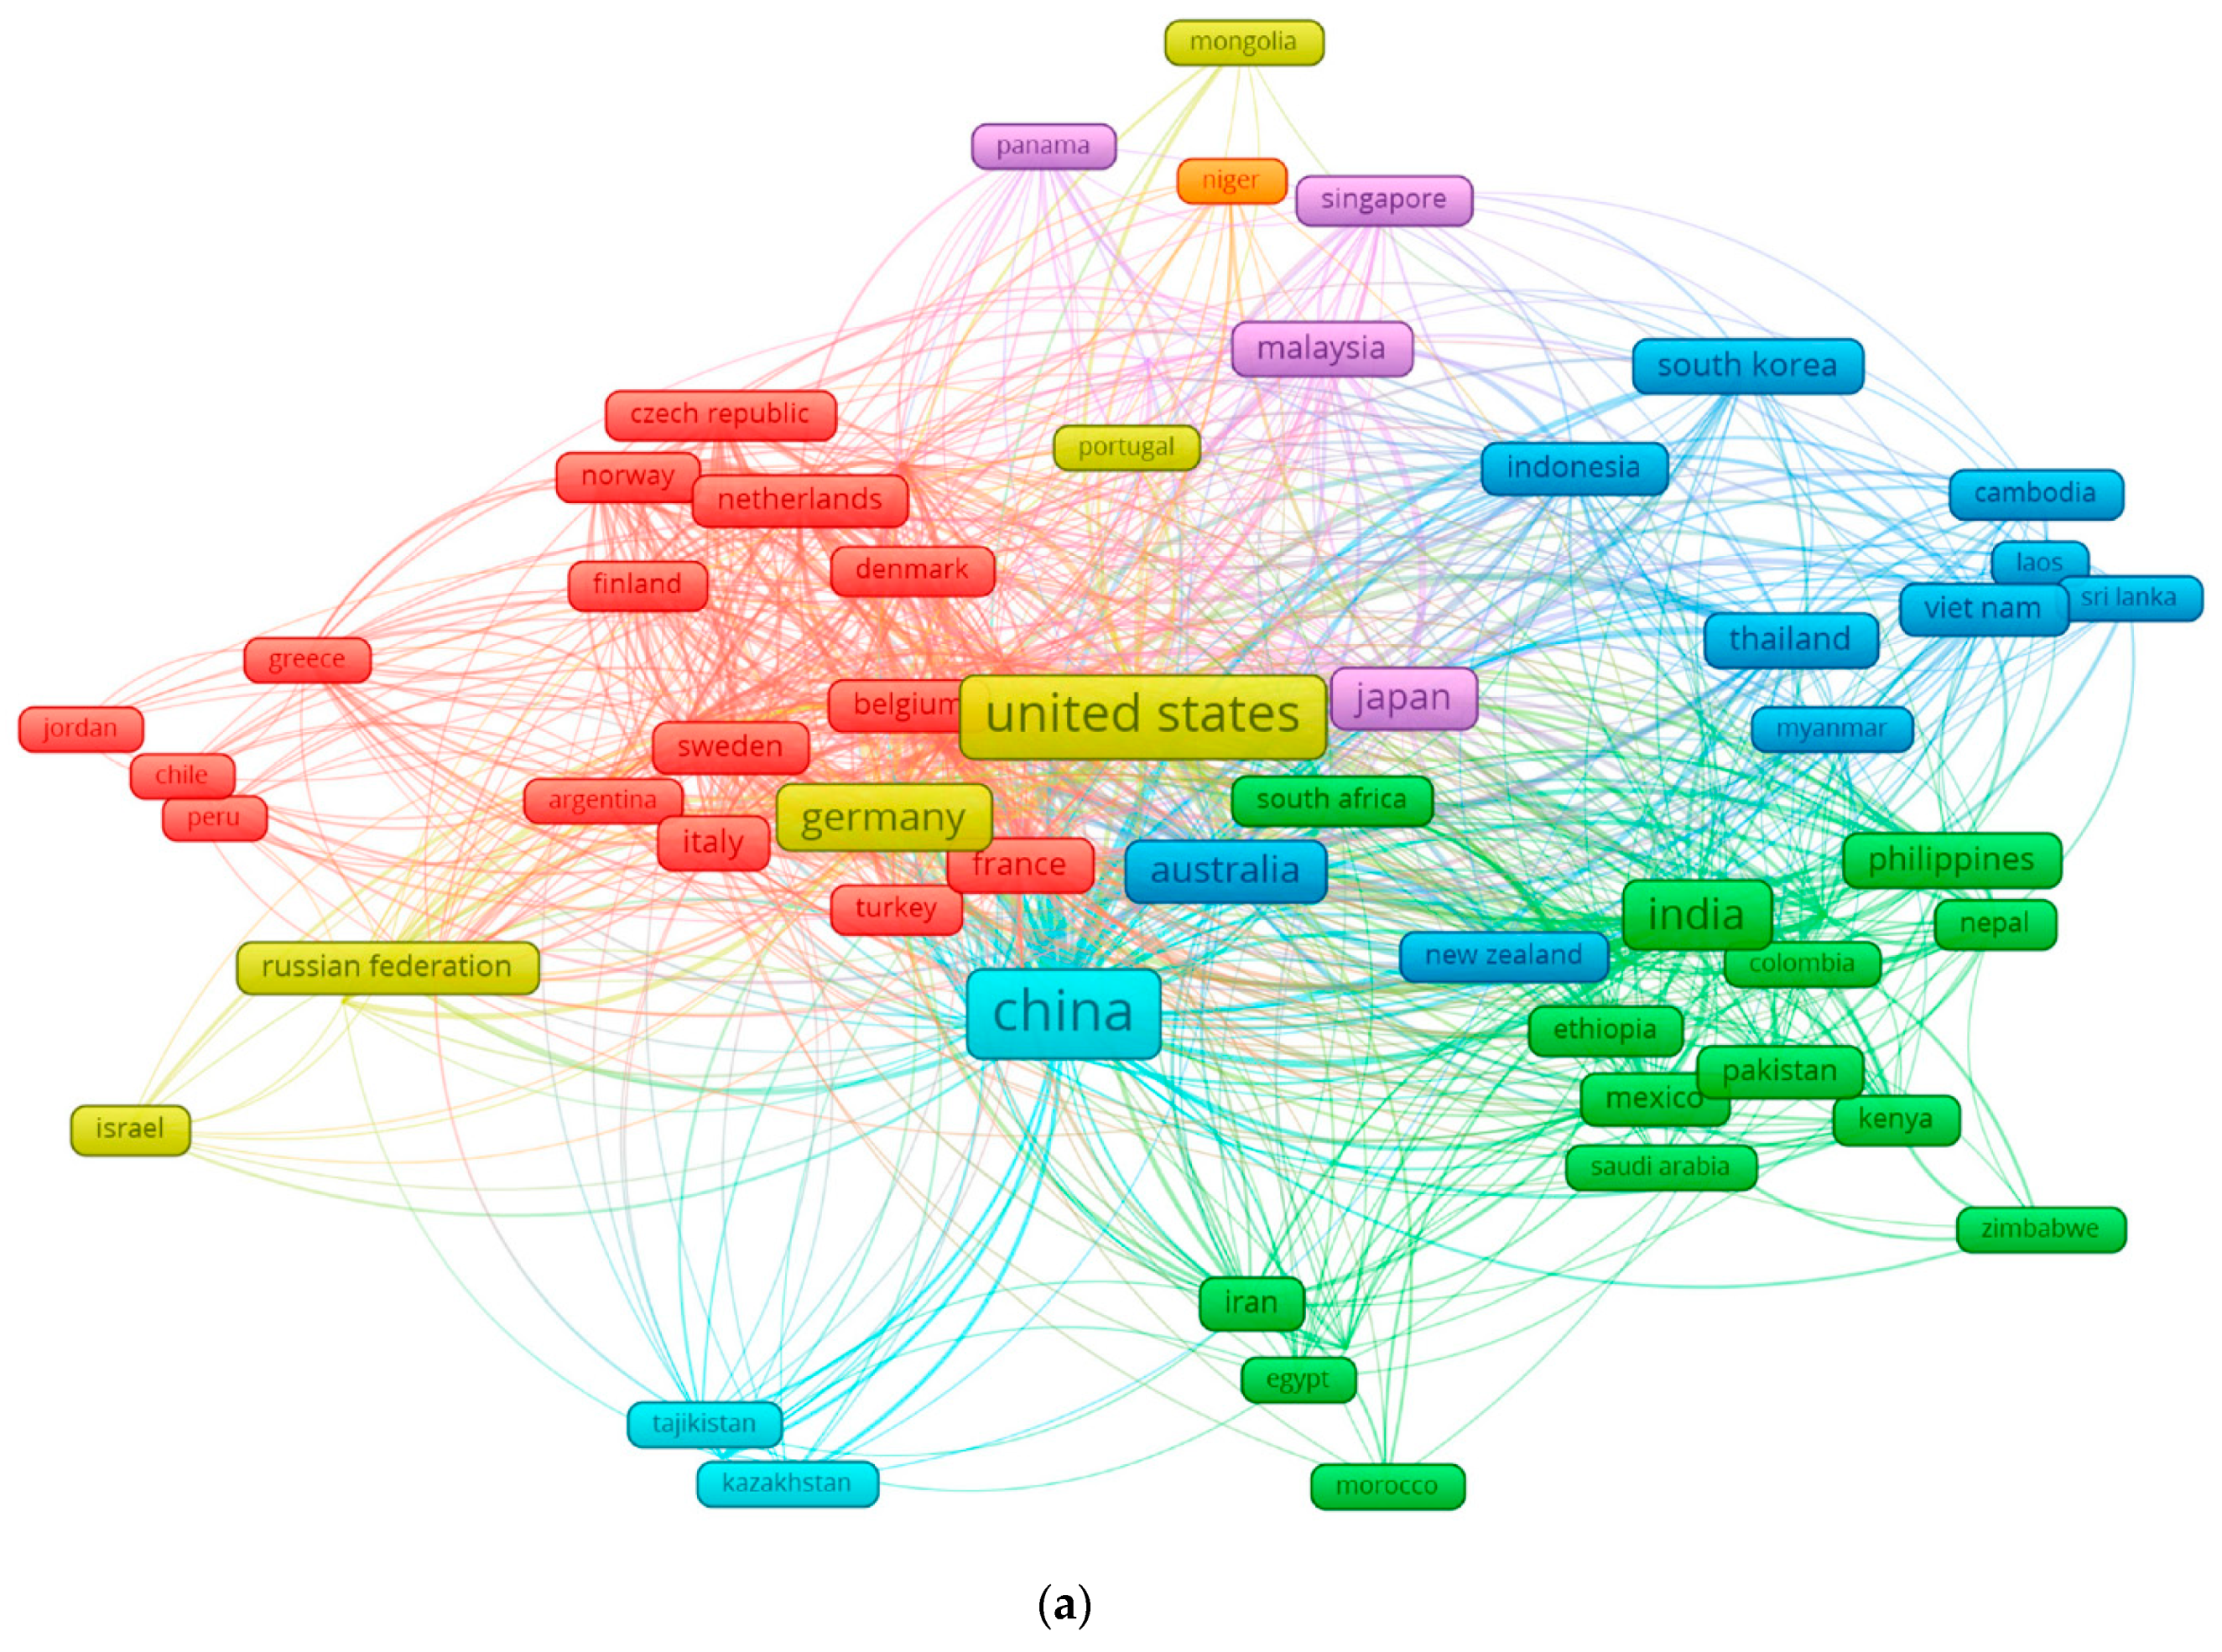
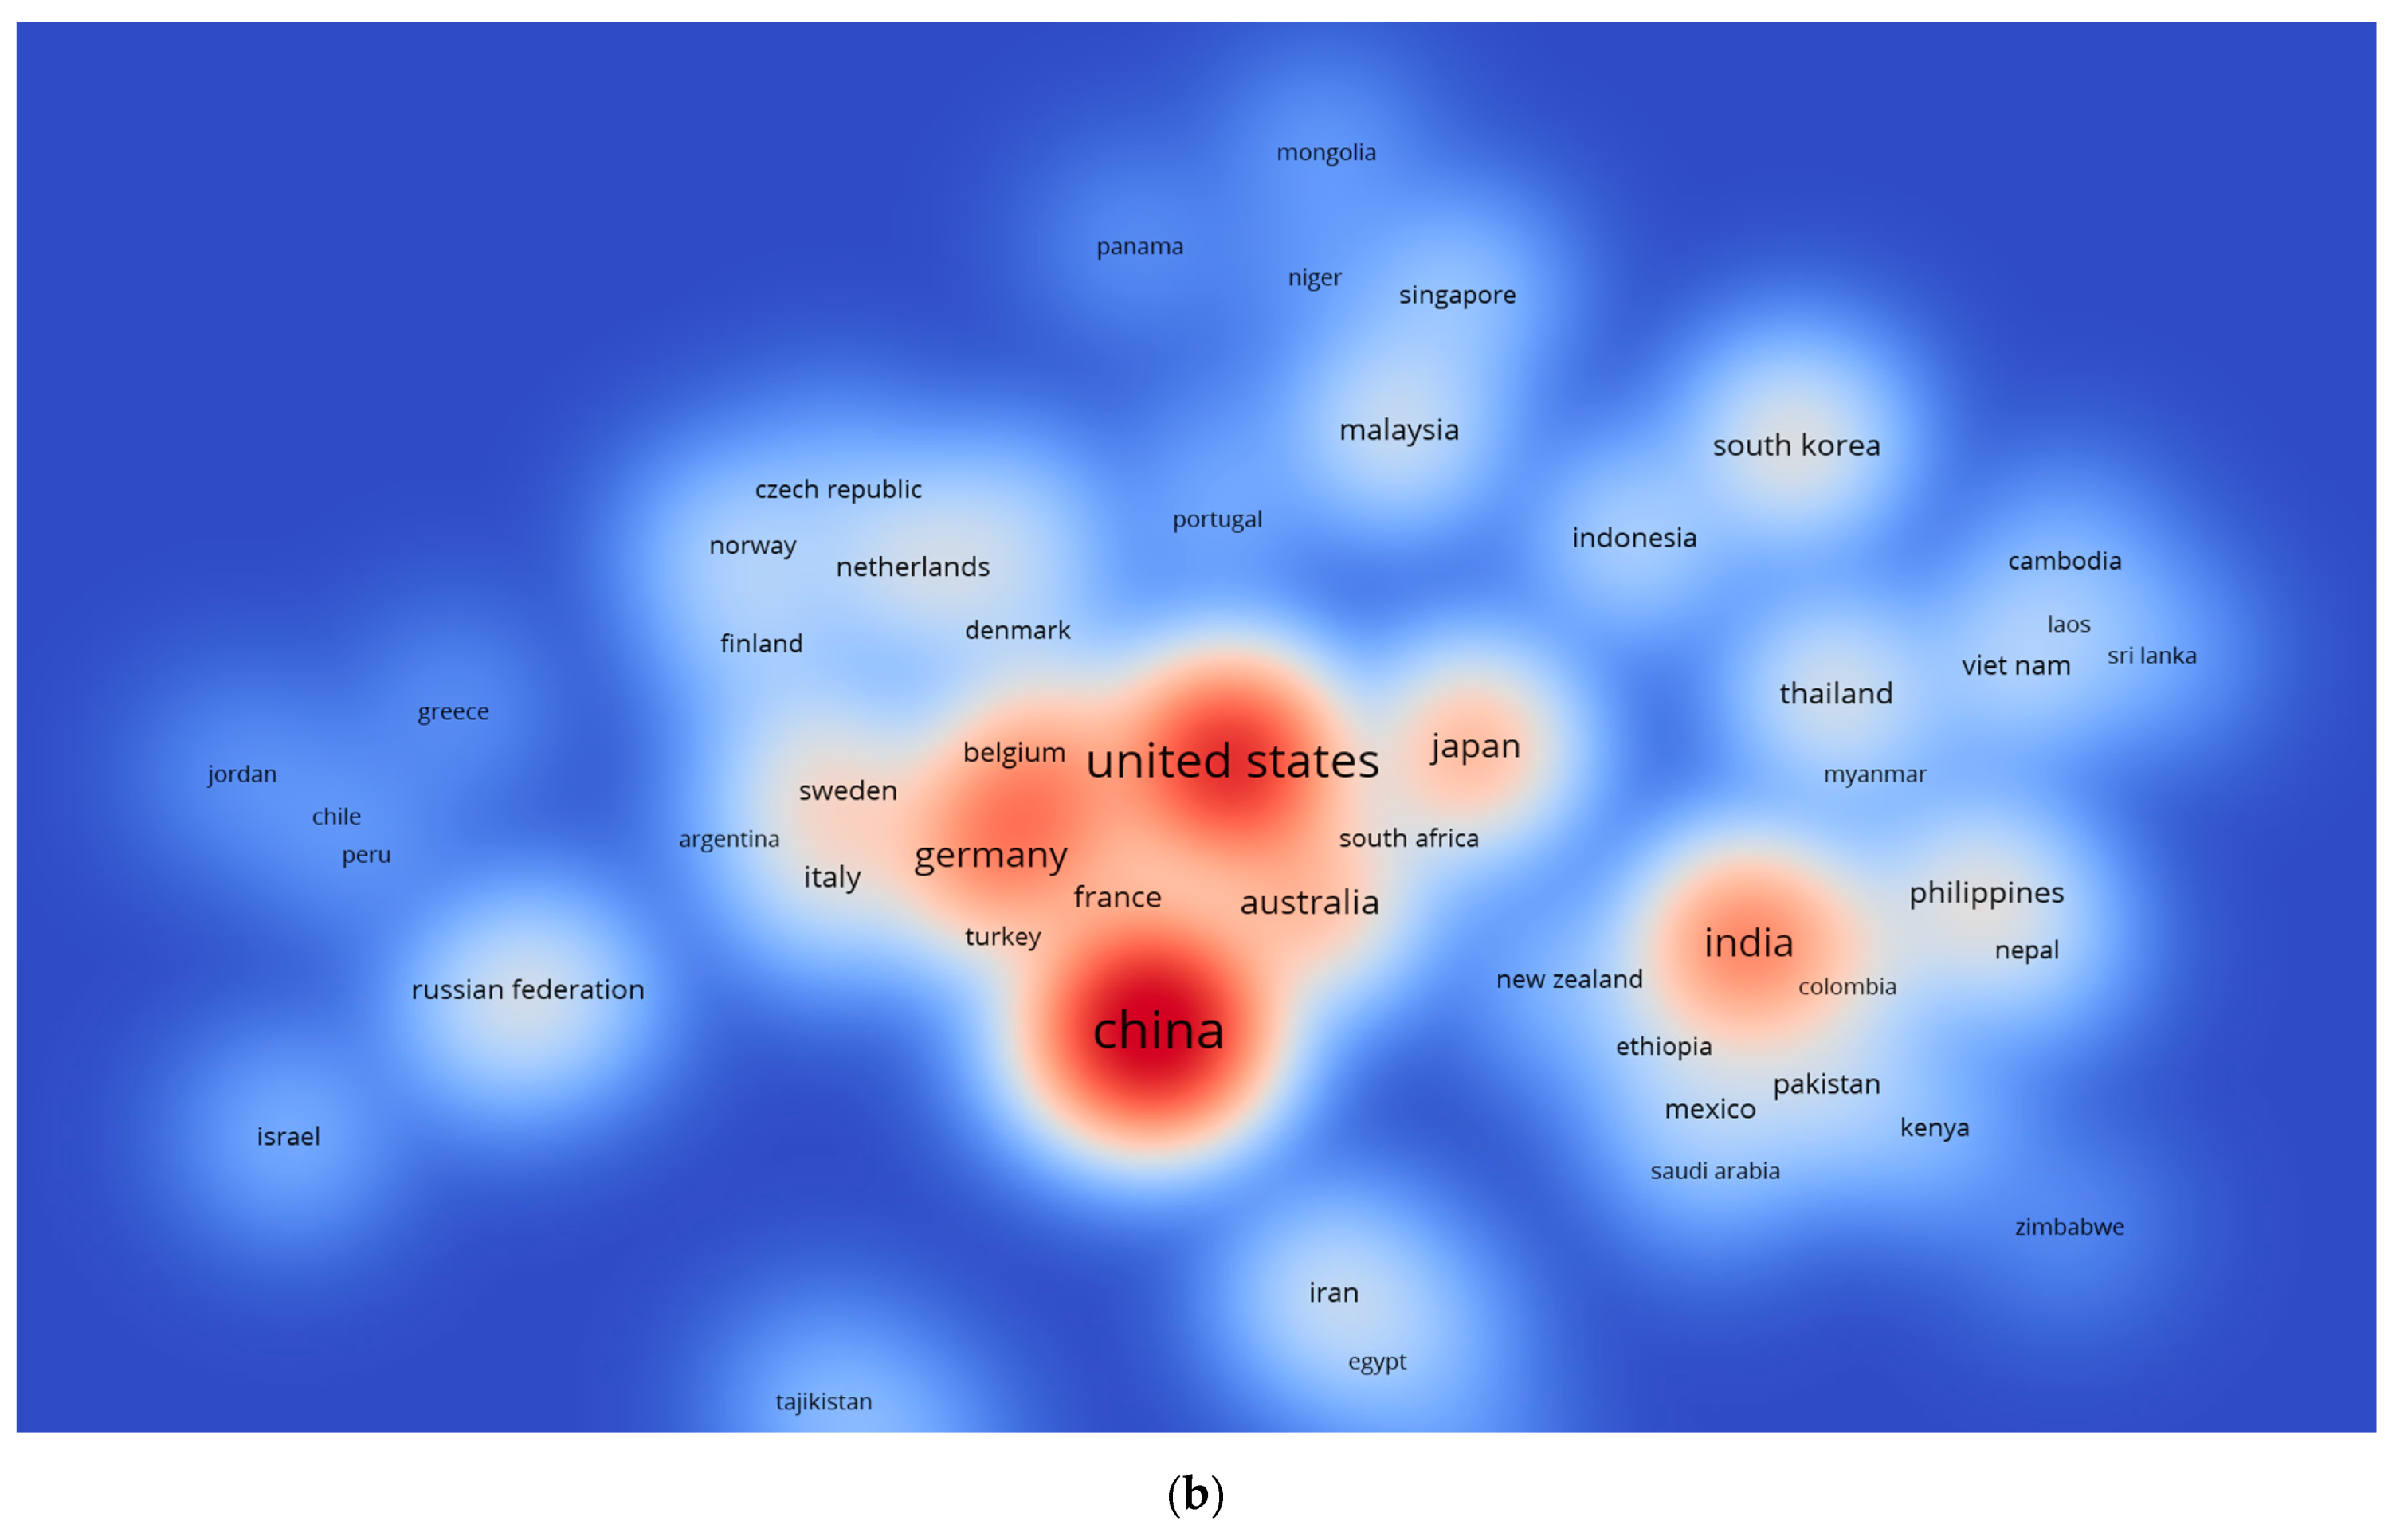
Certain countries have made and continue to make more contributions to contemporary research than others. The visualization network was created to assist readers in visualizing places that are devoted to environmentally friendly construction. “Bibliographic coupling” was the “kind of analysis,” and “countries” was the “unit of analysis.” The minimum number of papers required for a nation was set at 5, and 68 of the 133 nations satisfied the requirement. Table 3 lists the top 20 active nations based on the number of documents and citations related to the current study area. With 482, 668, and 192 papers, respectively, the United States, China, and Germany donated the most papers overall. The top four participating countries in terms of citation count were the United States, China, the United Kingdom, and Germany, with 19625, 14369, 5555, and 5693 citations, respectively. The number of papers, citations, and overall link strength demonstrate a country’s impact on the present research domain’s development. The overall connection strength reveals how much the papers of one nation have impacted the papers of the other nations included in this research. As a result, it was determined that the aforementioned countries would have the greatest impact on drought monitoring. Figure 6a,b depicts the nations’ connectedness and density visualization of nations linked by citations. The size of the frame denotes the country’s contribution to the field. Furthermore, the density graphic shows that the nations with the most participants had a greater density. The graphical depiction of participating nations will enable future academics to form scientific partnerships, create joint venture reports, and exchange new methodologies.
4. Types of Drought
4.1. Agricultural Drought
Drought in agriculture is often defined as a period of decreased soil humidity and the resulting plant failure, regardless of water surface. A decrease in soil moisture is dependent on a number of variables, including climatic and hydrological droughts, as well as the gap between actual and prospective evapotranspiration. The quantity of water that plants need to survive is influenced by climatic circumstances, specific attributes of a plant and its growth stage, as well as soil attributes. Numerous drought indices have been developed to investigate agricultural droughts. The temperatures, precipitation, and soil moisture levels for a successful plant combination are all included in this study [12,13,14].
4.2. Hydrological Drought
A period of hydrological drought has been characterized as a water deficit that impedes established water use. For hydrologic drought analysis, streamflow data have been frequently used. Geology is one of the most important factors driving hydrological droughts, according to regression analyses connecting droughts in streamflow to watershed features [15]. Wu. J et al. studied the effects of reservoir operating regulations during dry times on multi-scale Hydrological drought–Meteorological drought correlations. The pre- and post-reservoir eras were compared using two standardized drought indicators (SSI and SPI) with varying timeframes (1, 3, 6, 12, and 24 months) [16].
4.3. Meteorological Drought
Drought may be described as a lack of precipitation across a certain geographic area for a certain amount of time. Precipitation has historically been used to determine the severity of drought. A number of studies have investigated droughts using a period of one month’s worth of monthly precipitation data. Another alternative looks at how long droughts have persisted in proportion to how much rain has fallen [17,18].
4.4. Socio-Economic Drought
Droughts happen when water supply systems cannot keep up with demand, and hence affect the supply and demand for an economic benefit (water). As a result of weather-induced water scarcity, demand for a valued commodity (water) exceeds supply.
Socioeconomic drought is a consequence of spatial-temporal supply–demand mechanisms and arises when the economic requirement of a product surpasses the available supply as a consequence of a weather-related water supply shortage [19,20]. Certain products, such as water, wheat, fish, and hydroelectric electricity, are weather-dependent. Socioeconomic definitions of drought include components of meteorological, hydrological, and agricultural drought.
According to some academics, this categorization should be expanded to include edaphic drought. This form of drought is characterized by low soil penetration and a strong emphasis on quality. Edaphic drought makes soils more susceptible to aeolian erosion; as a consequence, vegetation suffers from moisture deficiency, nutrients on the soil surface are depleted, and the plant dries up [15].
Drought in urban regions is characterized by reduced natural water availability, which makes it difficult to fulfil the water requirements of sensitive socio-economic sectors and ecosystems. Drought and drought-related risks are expected to affect several city components. The vulnerability of a city component is a measure of the implications of the studied natural hazard for that component, as well as its capacity to deal with its repercussions. Drought conditions are expected to have an effect on the city’s water supply system by altering the quality and number of raw materials used. The quantity of bacteria in the network and reservoirs increases as the temperature rises, necessitating the use of stronger water disinfection techniques. Dry spells continue for a long time, increasing water consumption, including watering of residential gardens, and posing a danger due to low water pressure in taps in peripheral housing complexes. High temperatures lead to an increase in odor nuisance at sewage treatment plants in sewage and wastewater management [21].
5. Drought Indices
An index based on the indicators of a specific drought reflects the severity and duration of that drought. An index is a numerical number or formula that integrates several meteorological and hydrological parameters, such as runoff, temperature, evapotranspiration, precipitation, and water supply indicators, to provide a holistic picture of decision-making. This kind of indicator is more practical and intelligible than raw data, and it is often presented as a numerical figure to provide planners and politicians with more decision-making power. The government, as well as public and private organizations, analyze and react to drought using these indicators [22].
5.1. Palmer Drought Severity Index
In 1965, Palmer came up with the concept whereby drought is characterized as a mix of temperature, precipitation, and soil moisture, according to palmer drought severity index PDSI [23]. This indicator is produced monthly using a complex formula that takes into account four key factors: Precipitation, temperature, soil moisture, and evapotranspiration. PDSI is a technique for calculating soil moisture in typically homogenous regions. It is one of the most sophisticated and precise drought-forecasting systems in the market.
5.2. Surface Water Supply Index
The Palmer index is an algorithm that is meant for surfaces that have substantial topographic variability, and it is not intended for areas with homogeneous soil moisture. Additionally, PDSI has not included the impact of snowfall in the results. SWSI is the index used to describe surface water status in high terrains with snowfall as the principal water supply as well as an indicator of surface water status in mountain areas with heavy rainfall [24].
5.3. Percent of Normal Precipitation Index (PNPI)
PNPI is an advantageous tool for the general population, and the simplicity of its method for detecting precipitation allows it to be the most powerful and effective drought-monitoring index in Iran. The best results are obtained by using this index for a single area or season. PNPI, however, displays variable conditions according to the geographical location and season. When a regular distribution of precipitation is present, this indicator is appropriate. This index is constrained by seasonal and monthly precipitations having no special feature [25].
5.4. Crop Moisture Index
This indicator is based on a meteorological methodology to display typical planting conditions for each week. Palmer created this approach in the same manner that he created PDSI. While the PDSI was used to depict drought and wetness, the CMI was created to assess short-term moisture levels in the major areas of agricultural crops under production. This indicator adjusts to climate change in real time. It is assessed in terms of both time and space. As a result, the maps of moisture conditions may be compared using the CMI (Constant Moisture Index) in the U.S. in various locations [26].
5.5. Standard Precipitation Index
Using the required time period as a baseline, the standardized precipitation index (SPI) is computed for any location [27,28]. The normal distribution is used to calculate the mean SPI, which is then converted to a standard normal distribution to compensate for the lack of normality in the long-term data. SPI basic strength is its ability to be computed across a wide range of time periods. This adaptability enables SPI to monitor both immediate water supplies, such as soil moisture, which is critical for agricultural output, and long-term water resources, such as groundwater supplies, streamflow, and lake and reservoir levels.
5.6. Evaporative Stress Index
In terms of the time and size of peak correlations with geographically dispersed yield data, the Evaporative Stress Index (ESI) serves as an indicator of agricultural drought. The energy balance scheme includes important meteorological factors that contribute to flash drought. In the United States, the ESI has been proven to give an early warning of worsening crop moisture conditions. The research focuses on the ESI’s usefulness in explaining regional yield variability in key crops produced in Brazil, an area designated for substantial agricultural production improvements in terms of growth and intensification. Brazil’s northeastern area, in particular, demonstrates a critical need for enhanced drought preparation in the most climate-vulnerable regions. The study expands previous research in which cross-correlations between ESI and satellite-based precipitation were examined, further leaf area index (LAI)retrievals and anomalies across Brazil, as well as their relative behaviors across rainforest and agricultural (farm and pasture) land cover classes. Here, these same satellite metrics are compared with a decade’s worth of Brazilian yield data gathered between 2003 and 2013 [29]. The evaporative stress index interacts with the US land surface that has a strong control over the moisture of soil found in the summer season in northern and pacific northwest regions and the southern Great Plains in the spring season [30].
5.7. Vegetation Drought Response Index
The Vegetation drought response index (VegDRI) is a novel, large-area drought-monitoring method that combines climate data, vegetation satellite observations, and other biophysical environmental variables. It is possible to monitor drought occurrences at a finer geographic scale than with conventional climate-based drought indicators. The goal of VegDRI was to fill a need in the market for a tool that could map and monitor spatially precise drought patterns over broad geographic regions while also providing small-scale drought data for better planning, mitigation, and response. This offers more detailed drought information, which is presently only available at the county and sub-county level. VegDRI also offers an objective and reproducible method to drought monitoring that may be applied in near real-time and regionally extended to encompass the whole United States. The goal of this pilot research was to introduce this novel drought-monitoring technique and show the VegDRI’s capabilities for a single drought year in a restricted seven-state area. This study should be regarded as the first step towards VegDR’s assessment and development. Mesonets’ time-series soil moisture measurements will also be compared to the VegDRI’s multi-temporal response. In addition, a network of scientific specialists (such as state climatologists, rangeland scientists, and USDM writers), policymakers, and agricultural producers has been created to give periodic input on the VegDRI’s accuracy for their local region [31]
5.8. Process-Based Accumulated Drought Index
Plant conditions, soil moisture, precipitation, and crop development phases were all included in the process-based accumulated drought index (PADI) model. The authors make a strong case for the use of univariate and bivariate analyses in the drought system.
Because both analyses had flaws, PADI was created using a multivariate approach. PADI was compared to PDSI and SPI and found to have a good connection. PADI was also shown to have a strong connection with wheat yield decrease [32].
6. Drought Modelling and Forecasting
6.1. Dynamic Modelling
Real-world data are used to demonstrate a phenomenon over a period using the perception of dynamic modelling. This is why more and more dynamic drought prediction studies are being conducted. Dynamic drought simulations rely heavily on real-time remote-sensing data. A methodology for acquiring accurate information about items, places, or phenomena from afar or without direct contact with the ground is known as remote sensing [33,34,35,36]. Drought-related climatological variables may be monitored using remote-sensing measurements, and it is possible to utilize these to research the effect of drought on ecosystems. In addition to monitoring and assessing the impacts of drought, remote-sensing data have seen increasing usage in drought forecasting. Based on the basis of remote-sensing information like the NDVI scatter plot, this land surface temperature (VTCI series) falls into a triangle pattern as the input for the forecasting model (1). The research effort’s main focus was not just on tracking changes in a value of a single pixel with time, but also tracking spatial variations that apply to all 36 equally allocated pixel values inside the geographical area [37]. The Castile and Leon forests’ short-term reaction in Spain, with remotely sensed NOAA-AVHRR photos (from 1993 to 1997), has also been investigated. The findings demonstrate that NDVI series models can be created for different conifer species according to their needs, and climatic variables can be used as regressors to obtain MVC-NDVI time-series forecasts for these species that are put under summer water stress [38]. Climate Forecast System projections are downscaled through dynamical downscaling and statistical downscaling. A more detailed evaluation of the various RCRM methods has shown that dynamic multi-RCM ensemble downscaling produces improved results than statistical downscaling. Only in the northwest and north-central areas did major disparities exist. The use of thorough model selection is critical for dynamical downscaling. The technology for real-time data observation made it possible for novel modelling methods to be used for drought predictions. However, because a limited amount of data is accessible, other data fusion strategies should be further studied in order to provide more reliable model projections. A study was also carried out to address the issue of data continuousness (due to gauges or satellite failure) by conducting dynamic modelling [39]. It simulated hindcast weather conditions in the contiguous United States using WRF, employing dynamical downscaling. In this case, we discovered that smaller-scale or dynamically downscaled fields are better for water resource applications than large-scale ones. With WRF, moderate to severe wet and dry weather and intensity were improved, and we concluded that dynamically downscaled fields are the better option [40]. During the years 2002 to 2008, drought forecasting was accomplished via satellite-based GFS (temperature and wind speed) and TMPA (precipitation) data. Bias correction was applied to these data before they were utilized as the input for the NCEP CFS. The projections revealed that talent in early predictions was there, but the effectiveness of the predictions dropped as advance time rose [41].
Logistical Regression has been projected to be the standard precipitation evaporative index SPEI and the Standard (SPI) in Europe. This type of evaluation is being included in order to examine the influence the five European nations have on the sectors of agriculture, energy, and industry, as well as on public water supply and freshwater ecosystems. In the case of two highly correlated predictors interacting in two dimensions (SPI and SPEI), the Generalized additive models (GAMs) were investigated. The pseudo-R2 and the Area under curve (AUC) revealed an acceptable forecast with regard to the logistic regression’s ability [42].
6.2. Probabilistic Modelling
The efficacy of a nonuniform Markov chain model formulation was examined. Using monthly SPI data from southern Portugal, the models were built on the foundation of 67 years of monthly data. Results of the study demonstrated that the heterogenous Markov chain model has the advantage of better differentiating across months while calculating drought, particularly when compared to the homogeneous Markov chain model [43,44,45]. Markov chains were used to anticipate the length of hydrological droughts in the Canadian prairies. The stochastic hydrating index SHI series were generated using weekly, monthly, and yearly streamflow data. The first-order Markov chain was shown to be capable of correctly predicting the duration of the yearly drought, but the second-order Markov chain performed well on monthly and weekly time scales [46]. Using a weighted Markov chain model, a region-wide drought forecast using the SPI was completed. Using data from China’s Anhui Province, the monthly precipitation for the Huaihe River in that region was utilized to generate the SPI series, which was then utilized for the creation of a model. According to the results, the model was shown to be a viable tool for drought prediction, which may be beneficial for disaster management of an area [47].
6.3. Stochastic Modelling
Stochastic models are frequently employed in science, particularly the analysis and modelling of hydrologic time series. Stochastic models have a number of benefits, such as a more accurate representation of time-series serial linear correlations; the ability to search for identification in a systematic manner; model estimation and diagnostic checks; and stochastic autoregressive moving average SARIMA deals with the properties of both stationary and non-stationary time series. ARIMA and SARIMA are two widely used and significant types of stochastic models [48]. In the Büyük Menderes River basin, ARIMA and SARIMA were employed to predict the SPI. The findings demonstrated that linear stochastic models may be used to forecast SPI time series for the Büyük Menderes River basin and other hydro meteorologically linked basins across a wide variety of time periods [49].
7. Case Study of Asia
7.1. Case Study of China
The Yunnan Province is representative of China’s dry, drought-stricken regions. Drought has occurred frequently in the Yunnan Province during the last twelve years, and this has become the primary issue impeding local economic growth, as well as the productivity and living circumstances of the local population. With difficult circumstances such as rocky terrain, a complex natural ecosystem, and significant regional fluctuation, these places are especially vulnerable to drought [50]. Regional droughts occur on a regular yearly basis and have a significant effect. While large-scale droughts do not occur on a regular basis, they are devastating in times of crisis. The greatest drought in Chinese history occurred during Emperor Chongzhen’s reign in the Ming Dynasty. The drought broke out in northern Shaanxi in the Emperor’s first year of rule (1628), and the danger spread over the following decade across Shanxi, Shandong, Henan, Hebei, and Jiangsu provinces. For 17 years, the land in the impacted area remained arid. Vast swaths of land became barren, barely sustaining the local population. This finally culminated in the peasant insurrection that brought the dynasty to an end. In the 20th century, large-scale droughts occurred with an annual frequency of 11% in 1900, 1928–1929, 1934, 1956–1961, and 1972 [51]. Droughts are more common in the northern region, although droughts have become more common in the southern region in recent years. In China, the geographic distribution of drought shows clear regional variation. In the western portion of Northeast China, the eastern part of Northwest China, Southwest China, and the central and eastern regions of Inner Mongolia, the average number of dry days per year surpasses 40 days. Arid days surpass 60 days a year in the southern and central portions of North China, Northeast China, and the western section of thee Jilin Province and the northeastern portion of the Huanghuai Region [52,53]. Drought frequency has increased significantly in South China, and Southwest China in particular is notorious for its infamously bad weather as well as the western part of the Guizhou Province. Between 2011 and 2014, the number of drought occurrences each year increased to 50, and severe drought events have become frequent [54].
7.2. Case Study of India
Drought has an impact on many aspects of ecosystems and the environment. Some of the environmental indicators of drought include the availability of water in reservoirs, rainfall, soil moisture, and ground water depths [55]. Not only is the Himalayas in northern India a significant supply of water, but they also manage India’s climate. As a water tower endowed with a large number of glaciers, it serves as a unique drought-resistant entity by establishing a regional buffer against drought [56]. Glaciers in the Himalayas melt in the summer and give water to rivers and aquifers. Most glacier melt happens in the summer, which exacerbates drought conditions. Glacial melt is increasing, hence the size of glaciers is diminishing, therefore reducing the quantity of water that can be supplied to river basins over time [57]. Changes in environmental elements in one location may have an impact on the environment in another. During droughts, dust and chloride levels have been known to rise dramatically [58]. The drought causes a food shortage, which has a variety of social and economic consequences. It has an impact on people’s health and safety, as well as causing water resource disputes. Due to the high density of dust molecules in the atmosphere as a result of the extended drought, it may eventually impair people’s respiratory systems and cause allergies.
The dry conditions may allow for additional forest fires, endangering the lives of those who live in the woods and forest margins. The fear and despair over the economy’s loss as a result of the drought may exacerbate tensions and disrupt mental tranquilly. According to some accounts, individuals travel from villages to towns and cities in search of work, exacerbating the issue of unemployment. Due to the drying up of their water sources, 600 inhabitants out of 800 in a hamlet in Madhya Pradesh’s Damoh district opted to relocate to the adjacent Jabalpur city and district headquarters [59]. The majority of people in India continue to live in rural regions, where agriculture is a primary source of income. Around 70% of rural India’s population is dependent on agriculture, either directly or indirectly. They do, however, have a rain-fed agricultural system that is very susceptible to drought. Drought affects around 70% of the agricultural crop output. Drought has a direct influence on India’s gross domestic product GDP, as research indicates that the GDP has declined, owing to a significant reduction in food grain output, which correlates to a substantial shortfall in monsoon rainfall [60].
7.3. Case Study of Pakistan
Pakistan is located in the temperate zone and experiences considerable variety due to the country’s varied climate conditions. The northeastern region of the nation has an exceptionally rainy environment, with glaciers and snow, whilst the southwest suffers from severe drought. Climate variability has an effect on agriculture, hydropower, drinking water, industry, and culture, as well as the country’s economy. According to the United Nations Development Programme, this South Asian country would most likely dry up by 2025 [61]. Pakistan is also experiencing a major problem in the energy industry, which is heavily reliant on the supply and management of water. Water management, on the other hand, is significantly impacted by climate change, which includes an increasing frequency of droughts and floods. These and several other issues underscore the critical need of understanding climate variability in order to improve the country’s water management. Between 1960 and 2007, researchers looked at the spatio-temporal variability of droughts using the SPI index at various time scales and the PCA approach based on gridded precipitation data and classified the overall drought pattern in the nation [62]. This particular study focuses on agriculture over a three-month period and lacks an appropriate geographical spread of research locations. There is, however, no research covering the whole nation that discusses regionalization and reinforced firefly algorithm RFA applications, with respect to drought risk, for varying return durations. The return period is the average length of time that it takes a certain level of drought to have an identifiable impact on the ongoing capability of drought performance [63]. The concept of utilizing the SPI to monitor drought is well accepted in Pakistan. The SPI may be insufficient to adequately depict drought conditions (particularly their initiation) in dry and rainfed locations, which often have a naturally drier environment. Additionally, the SPI on a one-month basis does not provide trustworthy findings when compared to the ground reality [64].
7.4. Case Study Iran
Using the SPI approach, researchers conducted a geographic analysis of long-term droughts in Iran and determined that there was a severe drought across the country’s east, southwest, west, and center for several months [65,66]. The researchers conducted a drought-monitoring study in the Ardabil province using the standard evaporative precipitation index SEPI fuzzy index established on the basis of fuzzy logic and concluded that drought studies using the SEPI index show that the drought trend in Ardebil province is increasing. Additionally, the temperature is growing more rapidly. The researchers assessed the feasibility of drought prediction in Erazcose using the SPI approach and discovered that yearly drought is forecast using spring rainfall with a correlation coefficient of 0.89 and a square root of a projected error of 5.7° [67]. The researchers conducted an assessment of the hydrological and hydrological drought conditions in the south-eastern part of Lake Urmia. They concluded that there is a statistically significant association between meteorological and hydrological drought at the 99 percent level, which is associated concurrently and then becomes stronger with one Moon lag [68]. According to a 2008 assessment published by the “Food and Agriculture Organization (FAO),” the Islamic Republic of Iran incurred the greatest drought costs of any country in the Near East.” Between 1998 and 2001, more than 37 million people (more than 50% of the country’s population) faced food and water insecurity as a result of severe drought. Between 2000 and 2001, drought impacts exposed the country’s fragility, with a 12% decline in agriculture and animal gross domestic product, resulting in US$ 4.2 billion in agricultural losses. Iran imported 7 million tons of wheat in 2000 due to drought, making it the world’s largest importer of grain. Extreme drought conditions also contributed to extensive migration and the spread of disease (e.g., cholera, diphtheria, typhoid, etc.) across the country [69].
8. Summary and Future Recommendation
This research conducted a scientometric review of drought vulnerability in the Asian area. Scientometric analysis was used to determine the pertinent research topics, the publishing trend of papers, the co-occurrence of keywords, the most prolific authors, and the active nations in the subject of drought. Additionally, the many forms, indices, and modelling approaches associated with drought were studied, as well as the impact of drought on Asian countries like China, Pakistan, Iran, and India. The impact of drought and several forecast strategies were investigated in particular. Conclusions have been drawn as follows:
- Scientometric analysis of data retrieved from the Scopus database revealed that the top three fields in terms of document count were Environmental Science, Agriculture and Biological Science, and Earth and Planetary Science, accounting for 28 percent, 28 percent, and 27 percent, respectively, of total documents. Up until 2019–2020, a small rise in the number of articles about drought was seen. Moreover, for 2021, data were collected from January -June, which indicate a significant decline in the publications. However, it may be improved in the remaining months of 2021.
- Drought, Asia, climate change, and China are the top four most-occurring terms. Additionally, China, Germany, and the United States supplied the greatest number of papers to the present subject of research. Additionally, with 856 citations, Li j. was the most referenced author.
- Meteorological droughts occur when there is a cumulative deficit of atmospheric precipitation, followed by agricultural droughts, social economic droughts, and hydrological droughts.
- The drought index categorizes droughts based on their meteorological, agricultural, socioeconomic, and hydrological characteristics. It is critical to establish a clear connection between agricultural, meteorological, social economic droughts, and hydrological droughts to reveal transmission patterns and threshold criteria. Additionally, it is critical to carefully monitor droughts and provide early notice when one occurs.
- There is a never-ending endeavor to create resourceful drought indices with the goal of enhancing drought monitoring and creating more accurate drought metrics. Drought indices can only characterize drought conditions using hydrometeorological variables and cannot quantify economic damages, according to the authors.
- Drought research in China continues to confront many obstacles. Drought creation is unique in China, and global warming and fast societal change have exacerbated the issue’s complexity. Drought monitoring using the SPI is widely recognized in Pakistan. In arid and rainfed areas, the SPI frequently does not sufficiently represent drought conditions (such as their onset). Research shows that the GDP has been reduced in India due to a large decrease in food grain production, which corresponds to a large deficit in monsoon rainfall. The geographic analysis of Iran showed that there was a severe drought in the country’s east, southwest, west, and center for many months.
- Three types of modelling techniques, dynamic, probabilistic, and stochastic, are discussed in this study. In drought forecasting, dynamic modelling for real-time forecasting is well-known. Remote-sensing data are often used as an input for dynamic modelling. Another method used probabilistic modelling and Markov chains to predict future drought occurrences based on the likelihood. Similarly, the ARIMA model was discovered for forecasting time series with short lead periods with reasonable accuracy.
Future Recommendations
- Future drought predictions should strive to include the benefits of dynamic modelling, probabilistic, and stochastic forecasting techniques. Due to its ability to identify direct drought effects while filtering out indirect drought effects and their consequences, big data systems are expected to be a future trend in drought modelling.
- In the long run, there should be an emphasis on the relationship between hydrological and meteorological factors, not the time lag between them, which needs further study.
- The method employed and the models used do not take into account the important details of local climates, watershed features, and human influences that are typically needed for drought forecasting in Asia.
- The connection between meteorological, hydrological, soil moisture, and vegetation drought will be investigated in the future with additional quantitative characteristics.
- A basic agent-based drought risk model for smallholder farmers in semi-arid areas will be established.
Author Contributions
Conceptualization, D.W. and Y.L.; methodology, T.M.; software, H.K.; validation, H.G., D.W. and T.M.; formal analysis, D.W.; investigation, T.M.; resources, H.G.; data curation, D.W.; writing—original draft preparation, D.W.; writing—review and editing, Y.L.; visualization, Z.S.; supervision, D.W.; project administration, Z.S.; funding acquisition, D.W. All authors have read and agreed to the published version of the manuscript.
Funding
This research was funded by Xi’an Jiaotong University (2021WHZ0091),” and “The APC was funded by Project of Shaanxi Provincial Land Engineering Construction Group (No. DJNY2021-32)”.
Acknowledgments
This work was sponsored in part and funded by the Technology Innovation Center for Land Engineering and Human Settlements, the Shaanxi Land Engineering Construction Group Co., Ltd., Xi’an Jiaotong University (2021WHZ0091), and the Project of Shaanxi Provincial Land Engineering Construction Group.
Conflicts of Interest
The authors declare no conflict of interest.
References
- Dai, A. Drought under global warming: A review. Wiley Interdiscip. Rev. Clim. Chang. 2011, 2, 45–65. [Google Scholar]
- Sivakumar, M.; Wilhite, D. Drought preparedness and drought management. In Drought Mitigation and Prevention of Land Desertification; University of Ljubljana: Ljubljana, Slovenia, 2002; pp. 21–25. [Google Scholar]
- Su, B.; Huang, J.; Fischer, T.; Wang, Y.; Kundzewicz, Z.W.; Zhai, J.; Sun, H.; Wang, A.; Zeng, X.; Wang, G. Drought losses in China might double between the 1.5 C and 2.0 C warming. Proc. Natl. Acad. Sci. USA 2018, 115, 10600–10605. [Google Scholar] [CrossRef] [PubMed] [Green Version]
- Ullah, H.; Akbar, M.; Khan, F. Droughts’ projections in homogeneous climatic regions using Standardized Precipitation Index in Pakistan. Theor. Appl. Climatol. 2020, 140, 787–803. [Google Scholar] [CrossRef]
- Ghamghami, M.; Irannejad, P. An analysis of droughts in Iran during 1988–2017. SN Appl. Sci. 2019, 1, 1–21. [Google Scholar] [CrossRef] [Green Version]
- Pal, I.; Al-Tabbaa, A. Regional changes of the severities of meteorological droughts and floods in India. J. Geogr. Sci. 2011, 21, 195–206. [Google Scholar] [CrossRef]
- Apurv, T.; Sivapalan, M.; Cai, X. Understanding the role of climate characteristics in drought propagation. Water Resour. Res. 2017, 53, 9304–9329. [Google Scholar] [CrossRef] [Green Version]
- Svoboda, M.; Hayes, M.; Wood, D. Standardized Precipitation Index User Guide; World Meteorological Organization: Geneva, Switzerland, 2012; 900p. [Google Scholar]
- Van Eck, N.J.; Waltman, L. Software survey: VOSviewer, a computer program for bibliometric mapping. Scientometrics 2010, 84, 523–538. [Google Scholar] [CrossRef] [Green Version]
- Aghaei Chadegani, A.; Salehi, H.; Yunus, M.; Farhadi, H.; Fooladi, M.; Farhadi, M.; Ale Ebrahim, N. A comparison between two main academic literature collections: Web of Science and Scopus databases. Asian Soc. Sci. 2013, 9, 18–26. [Google Scholar] [CrossRef] [Green Version]
- Meho, L.I. Using scopus’s citescore for assessing the quality of computer science conferences. J. Informetr. 2019, 13, 419–433. [Google Scholar] [CrossRef]
- Bo, Y.; Su, M.; Jing, L.; Yufang, L.; Bin, Z.; Kuenzer, C. Agricultural drought monitoring in Dongting Lake Basin by MODIS data. In Proceedings of the 2012 First International Conference on Agro-Geoinformatics (Agro-Geoinformatics), Shanghai, China, 2–4 August 2012; pp. 1–7. [Google Scholar]
- Sepulcre-Canto, G.; Horion, S.; Singleton, A.; Carrao, H.; Vogt, J. Development of a combined drought indicator to detect agricultural drought in Europe. Nat. Hazards Earth Syst. Sci. 2012, 12, 3519–3531. [Google Scholar] [CrossRef] [Green Version]
- Li, R.; Chen, N.; Zhang, X.; Zeng, L.; Wang, X.; Tang, S.; Li, D.; Niyogi, D. Quantitative analysis of agricultural drought propagation process in the Yangtze River Basin by using cross wavelet analysis and spatial autocorrelation. Agric. For. Meteorol. 2020, 280, 107809. [Google Scholar] [CrossRef]
- Mishra, A.K.; Singh, V.P. A review of drought concepts. J. Hydrol. 2010, 391, 202–216. [Google Scholar] [CrossRef]
- Wu, J.; Liu, Z.; Yao, H.; Chen, X.; Chen, X.; Zheng, Y.; He, Y. Impacts of reservoir operations on multi-scale correlations between hydrological drought and meteorological drought. J. Hydrol. 2018, 563, 726–736. [Google Scholar] [CrossRef]
- Estrela, M.; Peñarrocha, D.; Millán, M. Multi-annual drought episodes in the Mediterranean (Valencia region) from 1950–1996. A spatio-temporal analysis. Int. J. Climatol. J. R. Meteorol. Soc. 2000, 20, 1599–1618. [Google Scholar] [CrossRef]
- Hayes, M.; Svoboda, M.; Wall, N.; Widhalm, M. The Lincoln declaration on drought indices: Universal meteorological drought index recommended. Bull. Am. Meteorol. Soc. 2011, 92, 485–488. [Google Scholar] [CrossRef] [Green Version]
- Guo, Y.; Huang, S.; Huang, Q.; Wang, H.; Fang, W.; Yang, Y.; Wang, L. Assessing socioeconomic drought based on an improved multivariate standardized reliability and resilience index. J. Hydrol. 2019, 568, 904–918. [Google Scholar] [CrossRef]
- Huang, S.; Huang, Q.; Leng, G.; Liu, S. A nonparametric multivariate standardized drought index for characterizing socioeconomic drought: A case study in the Heihe River Basin. J. Hydrol. 2016, 542, 875–883. [Google Scholar] [CrossRef]
- Zhang, X.; Chen, N.; Sheng, H.; Ip, C.; Yang, L.; Chen, Y.; Sang, Z.; Tadesse, T.; Lim, T.P.Y.; Rajabifard, A. Urban drought challenge to 2030 sustainable development goals. Sci. Total Environ. 2019, 693, 133536. [Google Scholar] [CrossRef] [PubMed]
- Waseem, M.; Ajmal, M.; Kim, T.-W. Development of a new composite drought index for multivariate drought assessment. J. Hydrol. 2015, 527, 30–37. [Google Scholar] [CrossRef]
- Ozger, M.; Mishra, A.K.; Singh, V.P. Estimating palmer drought severity index using a wavelet fuzzy logic model based on meteorological variables. Int. J. Climatol. 2011, 31, 2021–2032. [Google Scholar] [CrossRef]
- Raziei, T.; Daneshkar Arasteh, P.; Akhtari, R.; Saghafian, B. Investigation of meteorological droughts in the Sistan and Balouchestan province, using the standardized precipitation index and Markov chain model. Iran.-Water Resour. Res. 2007, 3, 25–35. [Google Scholar]
- Wu, H.; Hubbard, K.G.; Wilhite, D.A. An agricultural drought risk-assessment model for corn and soybeans. Int. J. Climatol. J. R. Meteorol. Soc. 2004, 24, 723–741. [Google Scholar] [CrossRef] [Green Version]
- Eslamian, S.; Ostad-Ali-Askari, K.; Singh, V.P.; Dalezios, N.R.; Ghane, M.; Yihdego, Y.; Matouq, M. A review of drought indices. Int. J. Constr. Res. Civ. Eng. 2017, 3, 48–66. [Google Scholar]
- Maca, P.; Pech, P. Forecasting SPEI and SPI drought indices using the integrated artificial neural networks. Comput. Intell. Neurosci. 2016, 2016. [Google Scholar] [CrossRef] [Green Version]
- Pai, D.; Sridhar, L.; Guhathakurta, P.; Hatwar, H. District-wide drought climatology of the southwest monsoon season over India based on standardized precipitation index (SPI). Nat. Hazards 2011, 59, 1797–1813. [Google Scholar] [CrossRef]
- Anderson, M.C.; Zolin, C.A.; Sentelhas, P.C.; Hain, C.R.; Semmens, K.; Yilmaz, M.T.; Gao, F.; Otkin, J.A.; Tetrault, R. The evaporative stress index as an indicator of agricultural drought in Brazil: An assessment based on crop yield impacts. Remote Sens. Environ. 2016, 174, 82–99. [Google Scholar] [CrossRef]
- Zhong, Y.; Otkin, J.A.; Anderson, M.C.; Hain, C. Investigating the relationship between the evaporative stress index and land surface conditions in the contiguous United States. J. Hydrometeorol. 2020, 21, 1469–1484. [Google Scholar] [CrossRef]
- Brown, J.F.; Wardlow, B.D.; Tadesse, T.; Hayes, M.J.; Reed, B.C. The vegetation drought response index (VegDRI): A new integrated approach for monitoring drought stress in vegetation. GIScience Remote Sens. 2008, 45, 16–46. [Google Scholar] [CrossRef]
- Faiz, M.A.; Zhang, Y.; Ma, N.; Baig, F.; Naz, F.; Niaz, Y. Drought indices: Aggregation is necessary or it is only the researcher’s choice. Water Supply 2021. [Google Scholar] [CrossRef]
- Soubry, I.; Guo, X. Monitoring and Modeling Rangeland Health with Remote Sensing; University of Saskatchewan: Saskatoon, SK, Canada, 2020. [Google Scholar]
- Deo, R.C.; Tiwari, M.K.; Adamowski, J.F.; Quilty, J.M. Forecasting effective drought index using a wavelet extreme learning machine (W-ELM) model. Stoch. Environ. Res. Risk Assess. 2017, 31, 1211–1240. [Google Scholar] [CrossRef]
- Dehghani, M.; Saghafian, B.; Rivaz, F.; Khodadadi, A. Evaluation of dynamic regression and artificial neural networks models for real-time hydrological drought forecasting. Arab. J. Geosci. 2017, 10, 1–13. [Google Scholar] [CrossRef]
- Memarian, H.; Bilondi, M.P.; Rezaei, M. Drought prediction using co-active neuro-fuzzy inference system, validation, and uncertainty analysis (case study: Birjand, Iran). Theor. Appl. Climatol. 2016, 125, 541–554. [Google Scholar] [CrossRef]
- Han, P.; Wang, P.X.; Zhang, S.Y. Drought forecasting based on the remote sensing data using ARIMA models. Math. Comput. Model. 2010, 51, 1398–1403. [Google Scholar] [CrossRef]
- Fernández-Manso, A.; Quintano, C.; Fernández-Manso, O. Forecast of NDVI in coniferous areas using temporal ARIMA analysis and climatic data at a regional scale. Int. J. Remote Sens. 2011, 32, 1595–1617. [Google Scholar] [CrossRef]
- Shukla, S.; Lettenmaier, D.P. Multi-RCM ensemble downscaling of NCEP CFS winter season forecasts: Implications for seasonal hydrologic forecast skill. J. Geophys. Res. Atmos. 2013, 118, 10770–10790. [Google Scholar] [CrossRef]
- Bowden, J.H.; Talgo, K.D.; Spero, T.L.; Nolte, C.G. Assessing the added value of dynamical downscaling using the standardized precipitation index. Adv. Meteorol. 2016, 2016, 8432064. [Google Scholar] [CrossRef] [Green Version]
- Sheffield, J.; Wood, E.F.; Chaney, N.; Guan, K.; Sadri, S.; Yuan, X.; Olang, L.; Amani, A.; Ali, A.; Demuth, S. A drought monitoring and forecasting system for sub-Sahara African water resources and food security. Bull. Am. Meteorol. Soc. 2014, 95, 861–882. [Google Scholar] [CrossRef]
- Stagge, J.H.; Kohn, I.; Tallaksen, L.M.; Stahl, K. Modeling drought impact occurrence based on meteorological drought indices in Europe. J. Hydrol. 2015, 530, 37–50. [Google Scholar] [CrossRef]
- Paulo, A.A.; Pereira, L.S. Prediction of SPI drought class transitions using Markov chains. Water Resour. Manag. 2007, 21, 1813–1827. [Google Scholar] [CrossRef]
- Zhang, T.; Li, J.; Hu, R.; Wang, Y.; Feng, P. Drought class transition analysis through different models: A case study in North China. Water Sci. Technol. Water Supply 2017, 17, 138–150. [Google Scholar] [CrossRef]
- Sun, P.; Zhang, Q.; Singh, V.P.; Xiao, M.; Zhang, X. Transitional variations and risk of hydro-meteorological droughts in the Tarim River basin, China. Stoch. Environ. Res. Risk Assess. 2017, 31, 1515–1526. [Google Scholar] [CrossRef]
- Sharma, T.; Panu, U. Prediction of hydrological drought durations based on Markov chains: Case of the Canadian prairies. Hydrol. Sci. J. 2012, 57, 705–722. [Google Scholar] [CrossRef] [Green Version]
- Chen, J.; Yang, Y. SPI-based regional drought prediction using weighted Markov chain model. Res. J. Appl. Sci. Eng. Technol. 2012, 4, 4293–4298. [Google Scholar]
- Mishra, A.; Desai, V.; Singh, V. Drought forecasting using a hybrid stochastic and neural network model. J. Hydrol. Eng. 2007, 12, 626–638. [Google Scholar] [CrossRef]
- Durdu, Ö.F. Application of linear stochastic models for drought forecasting in the Büyük Menderes river basin, western Turkey. Stoch. Environ. Res. Risk Assess. 2010, 24, 1145–1162. [Google Scholar] [CrossRef]
- Wu, J.; Lin, X.; Wang, M.; Peng, J.; Tu, Y. Assessing agricultural drought vulnerability by a VSD model: A case study in Yunnan Province, China. Sustainability 2017, 9, 918. [Google Scholar] [CrossRef] [Green Version]
- Zhexian, R.J.L. Dry climatological Feature on the Loess plateau in view of Rainfall in China. Agric. Res. Arid Areas 1989, 2. Available online: https://en.cnki.com.cn/Article_en/CJFDTotal-GHDQ198902004.htm (accessed on 1 September 2021).
- Wang, C.; Yang, K.; Li, Y.; Wu, D.; Bo, Y. Impacts of spatiotemporal anomalies of Tibetan Plateau snow cover on summer precipitation in eastern China. J. Clim. 2017, 30, 885–903. [Google Scholar] [CrossRef]
- Zhang, Q.; Qi, T.; Singh, V.P.; Chen, Y.D.; Xiao, M. Regional frequency analysis of droughts in China: A multivariate perspective. Water Resour. Manag. 2015, 29, 1767–1787. [Google Scholar] [CrossRef]
- Han, L.; Zhang, Q.; Yao, Y.; Li, Y.; Jia, J.; Wang, J. Characteristics and origins of drought disasters in Southwest China in nearly 60 years. Acta Geogr. Sin. 2014, 69, 632–639. [Google Scholar]
- Avadi, S.; Seth, R. Positing Indian military for disaster response: Comparative analysis of military involvement pre-and post-adoption of National Disaster Management Framework 2005. Def. Stud. 2020, 20, 123–142. [Google Scholar] [CrossRef]
- Pritchard, H.D. Asia’s glaciers are a regionally important buffer against drought. Nature 2017, 545, 169–174. [Google Scholar] [CrossRef]
- Kala, C.P. Save Ganga campaign and hydroelectric projects in Uttarakhand. Curr. Sci. 2011, 101, 596. [Google Scholar]
- Thompson, L.G.; Yao, T.; Mosley-Thompson, E.; Davis, M.; Henderson, K.; Lin, P.-N. A high-resolution millennial record of the South Asian monsoon from Himalayan ice cores. Science 2000, 289, 1916–1919. [Google Scholar] [CrossRef] [Green Version]
- Kala, C.P. Environmental and socioeconomic impacts of drought in India: Lessons for drought management. Sci. Educ. 2017, 5, 43–48. [Google Scholar]
- Gadgil, S.; Gadgil, S. The Indian monsoon, GDP and agriculture. Econ. Political Wkly. 2006, 41, 4887–4895. [Google Scholar]
- Hassan, M. Water security in Pakistan: Issues and challenges. United Nations Dev. Programme Pak. 2016, 3, 1–34. [Google Scholar]
- Xie, H.; Ringler, C.; Zhu, T.; Waqas, A. Droughts in Pakistan: A spatiotemporal variability analysis using the Standardized Precipitation Index. Water Int. 2013, 38, 620–631. [Google Scholar] [CrossRef]
- Ibrahim, K.; Zin, W.Z.W.; Jemain, A.A. Evaluating the dry conditions in Peninsular Malaysia using bivariate copula. Anziam J. 2009, 51, C555–C569. [Google Scholar] [CrossRef] [Green Version]
- Leasor, Z.T.; Quiring, S.M.; Svoboda, M.D. Utilizing objective drought severity thresholds to improve drought monitoring. J. Appl. Meteorol. Climatol. 2020, 59, 455–475. [Google Scholar] [CrossRef]
- Zengir, V.S.; Sobhani, B.; Asghari, S. Monitoring and investigating the possibility of forecasting drought in the western part of Iran. Arab. J. Geosci. 2020, 13, 1–12. [Google Scholar]
- Yazdani, M.; Sobhani, B.; Zengir, V.S.; Gilandeh, A.G. Analysis, monitoring and simulation of dust hazard phenomenon in the northern Persian Gulf, Iran, Middle East. Arab. J. Geosci. 2020, 13, 1–13. [Google Scholar] [CrossRef]
- hasan Yazdani, M.; Amininia, K.; Safarianzengir, V.; Soltani, N. Analyzing climate change and its effects on drought and water scarcity (case study: Ardabil, Northwestern Province of Iran, Iran). Sustain. Water Resour. Manag. 2021, 7, 1–10. [Google Scholar]
- Sari-Saraf, B.; Vaezihir, A.; Valaei, A.; Abtahi, V. Detection of meteorological and hydrological droughts in the south east of Lake Urmia. J. Environ. Risks 2017, 5, 42-25. [Google Scholar]
- Marj, A.F.; Abadi, F.H.H. A nine-step approach for developing and implementing an “agricultural drought risk management plan”; case study: Alamut River basin in Qazvin, Iran. Nat. Hazards 2020, 102, 1187–1205. [Google Scholar] [CrossRef]
Figure 1.
Sequence of scientometric analysis for drought. CSV: Cmma-separated values.

Figure 2.
Subject areas that contribute to drought analysis.
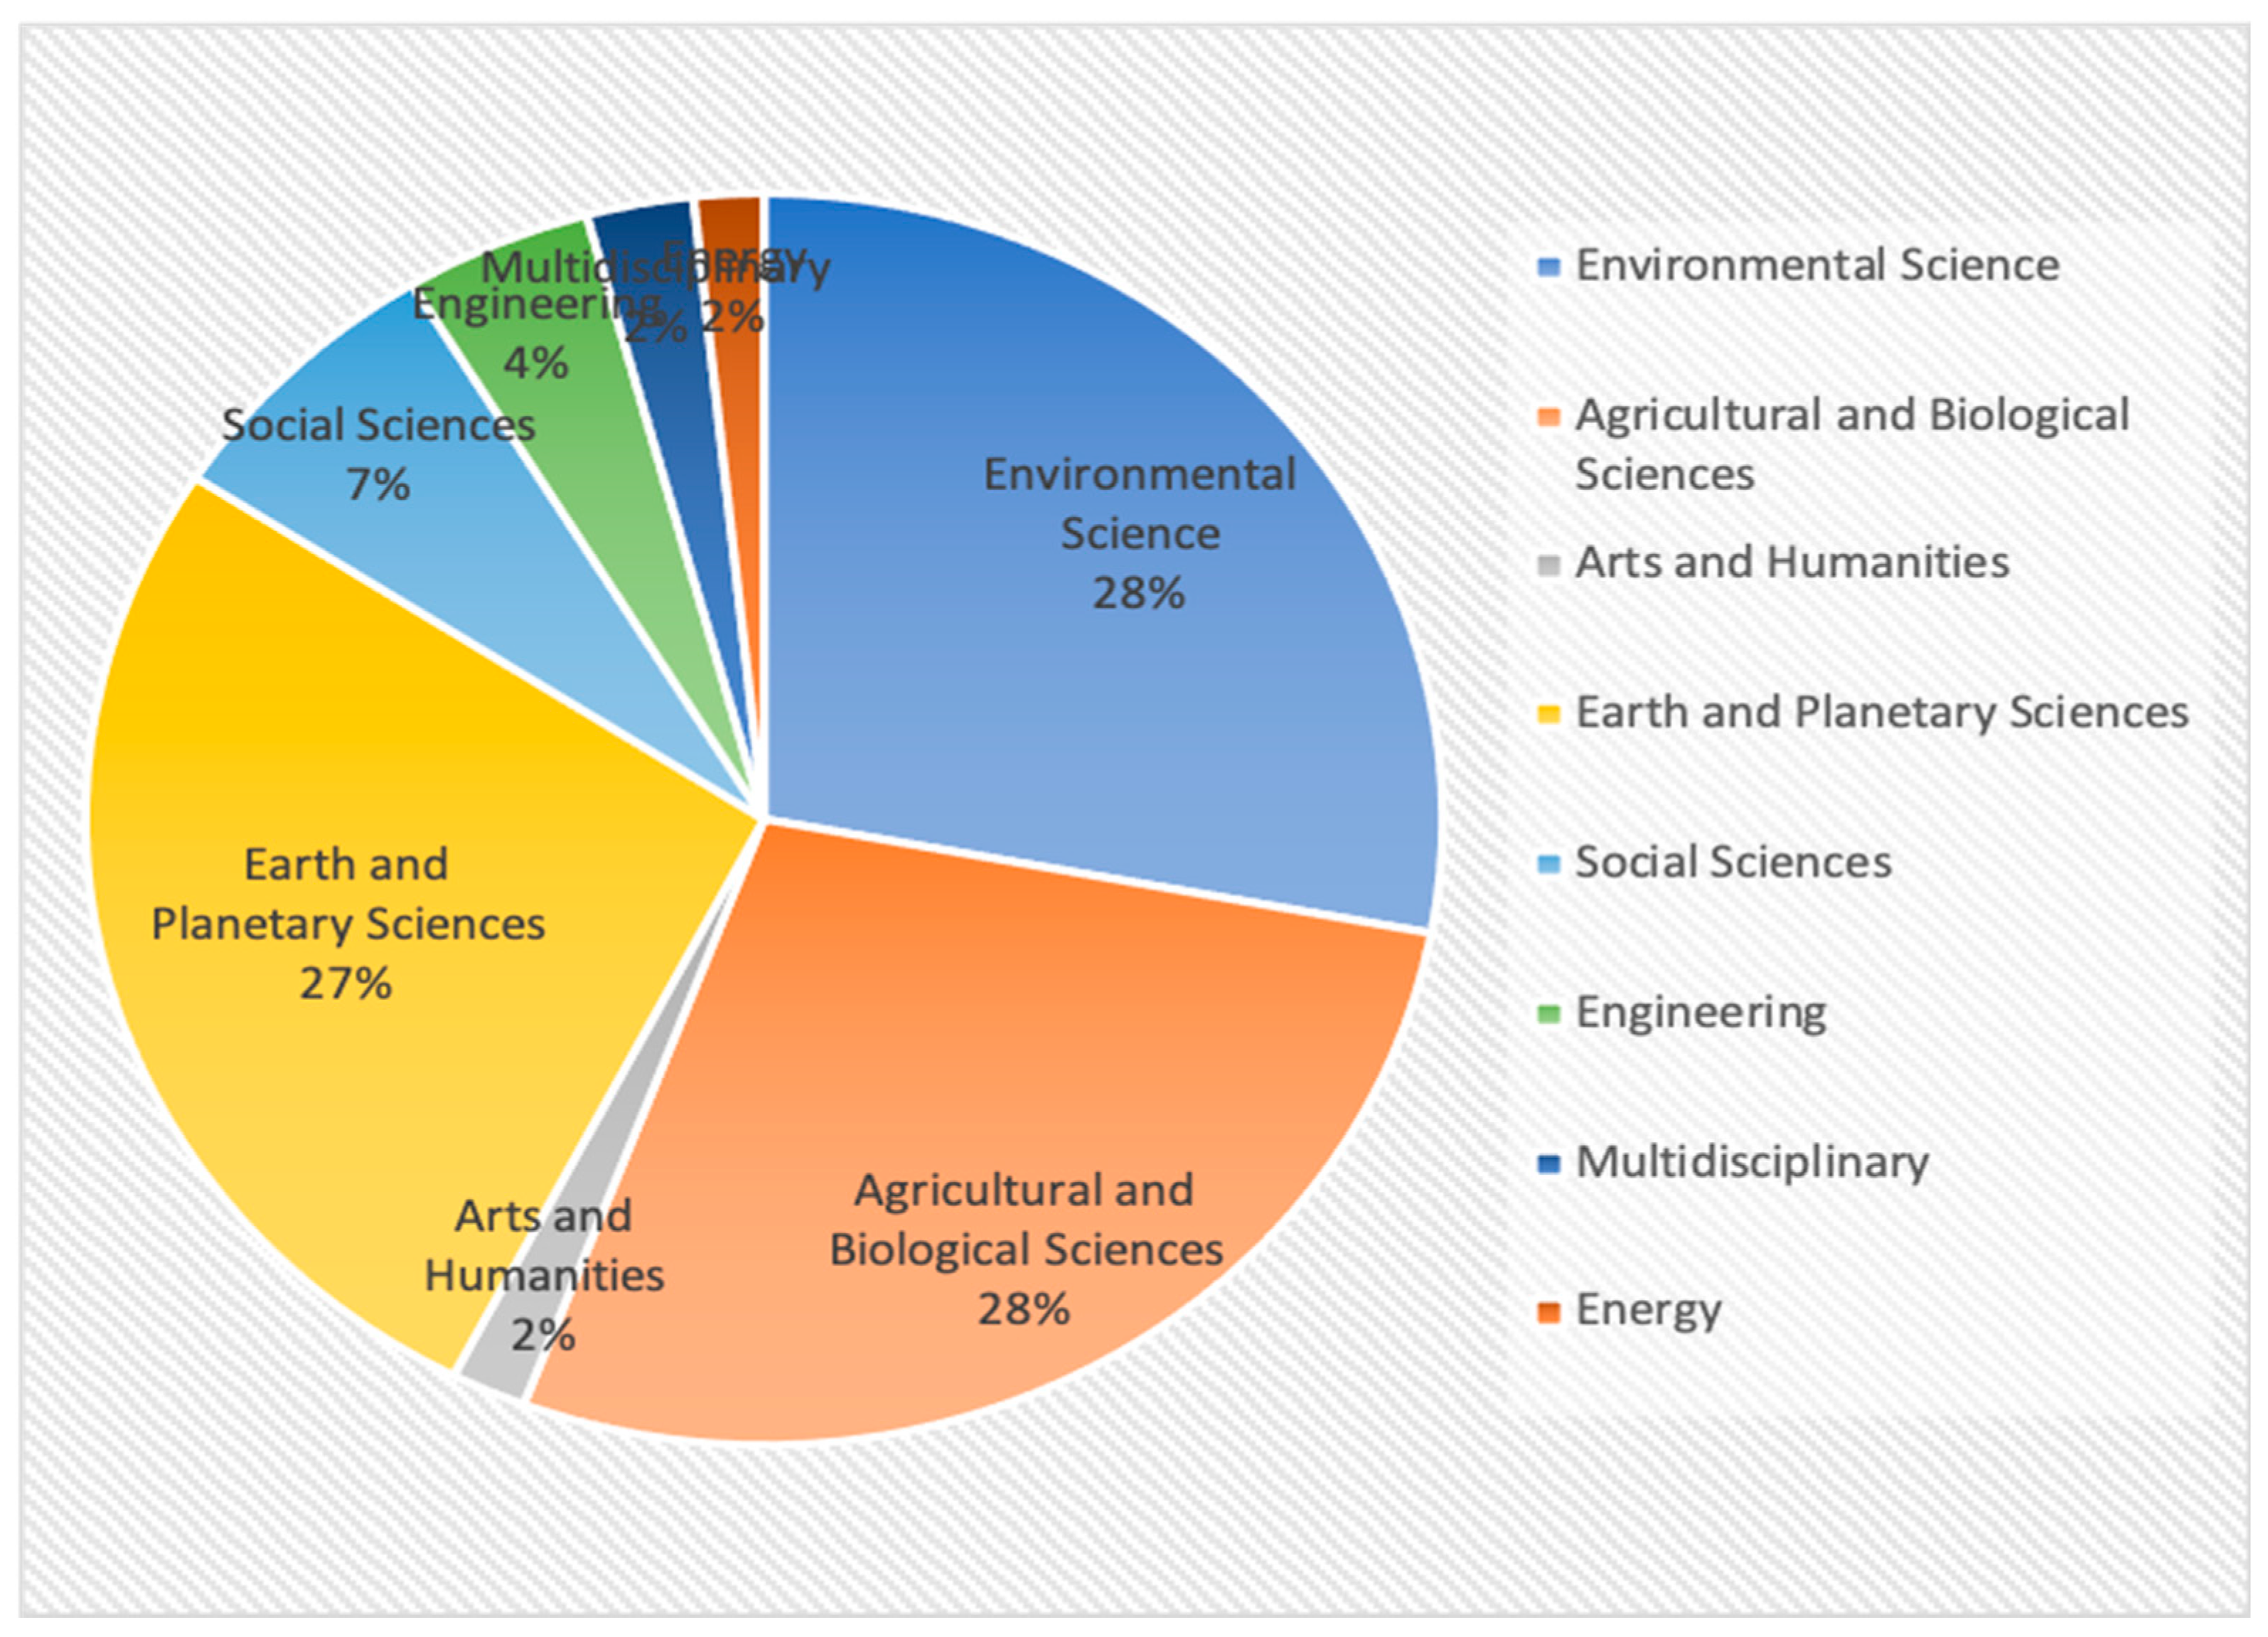
Figure 3.
Number of publications for drought analysis per year.
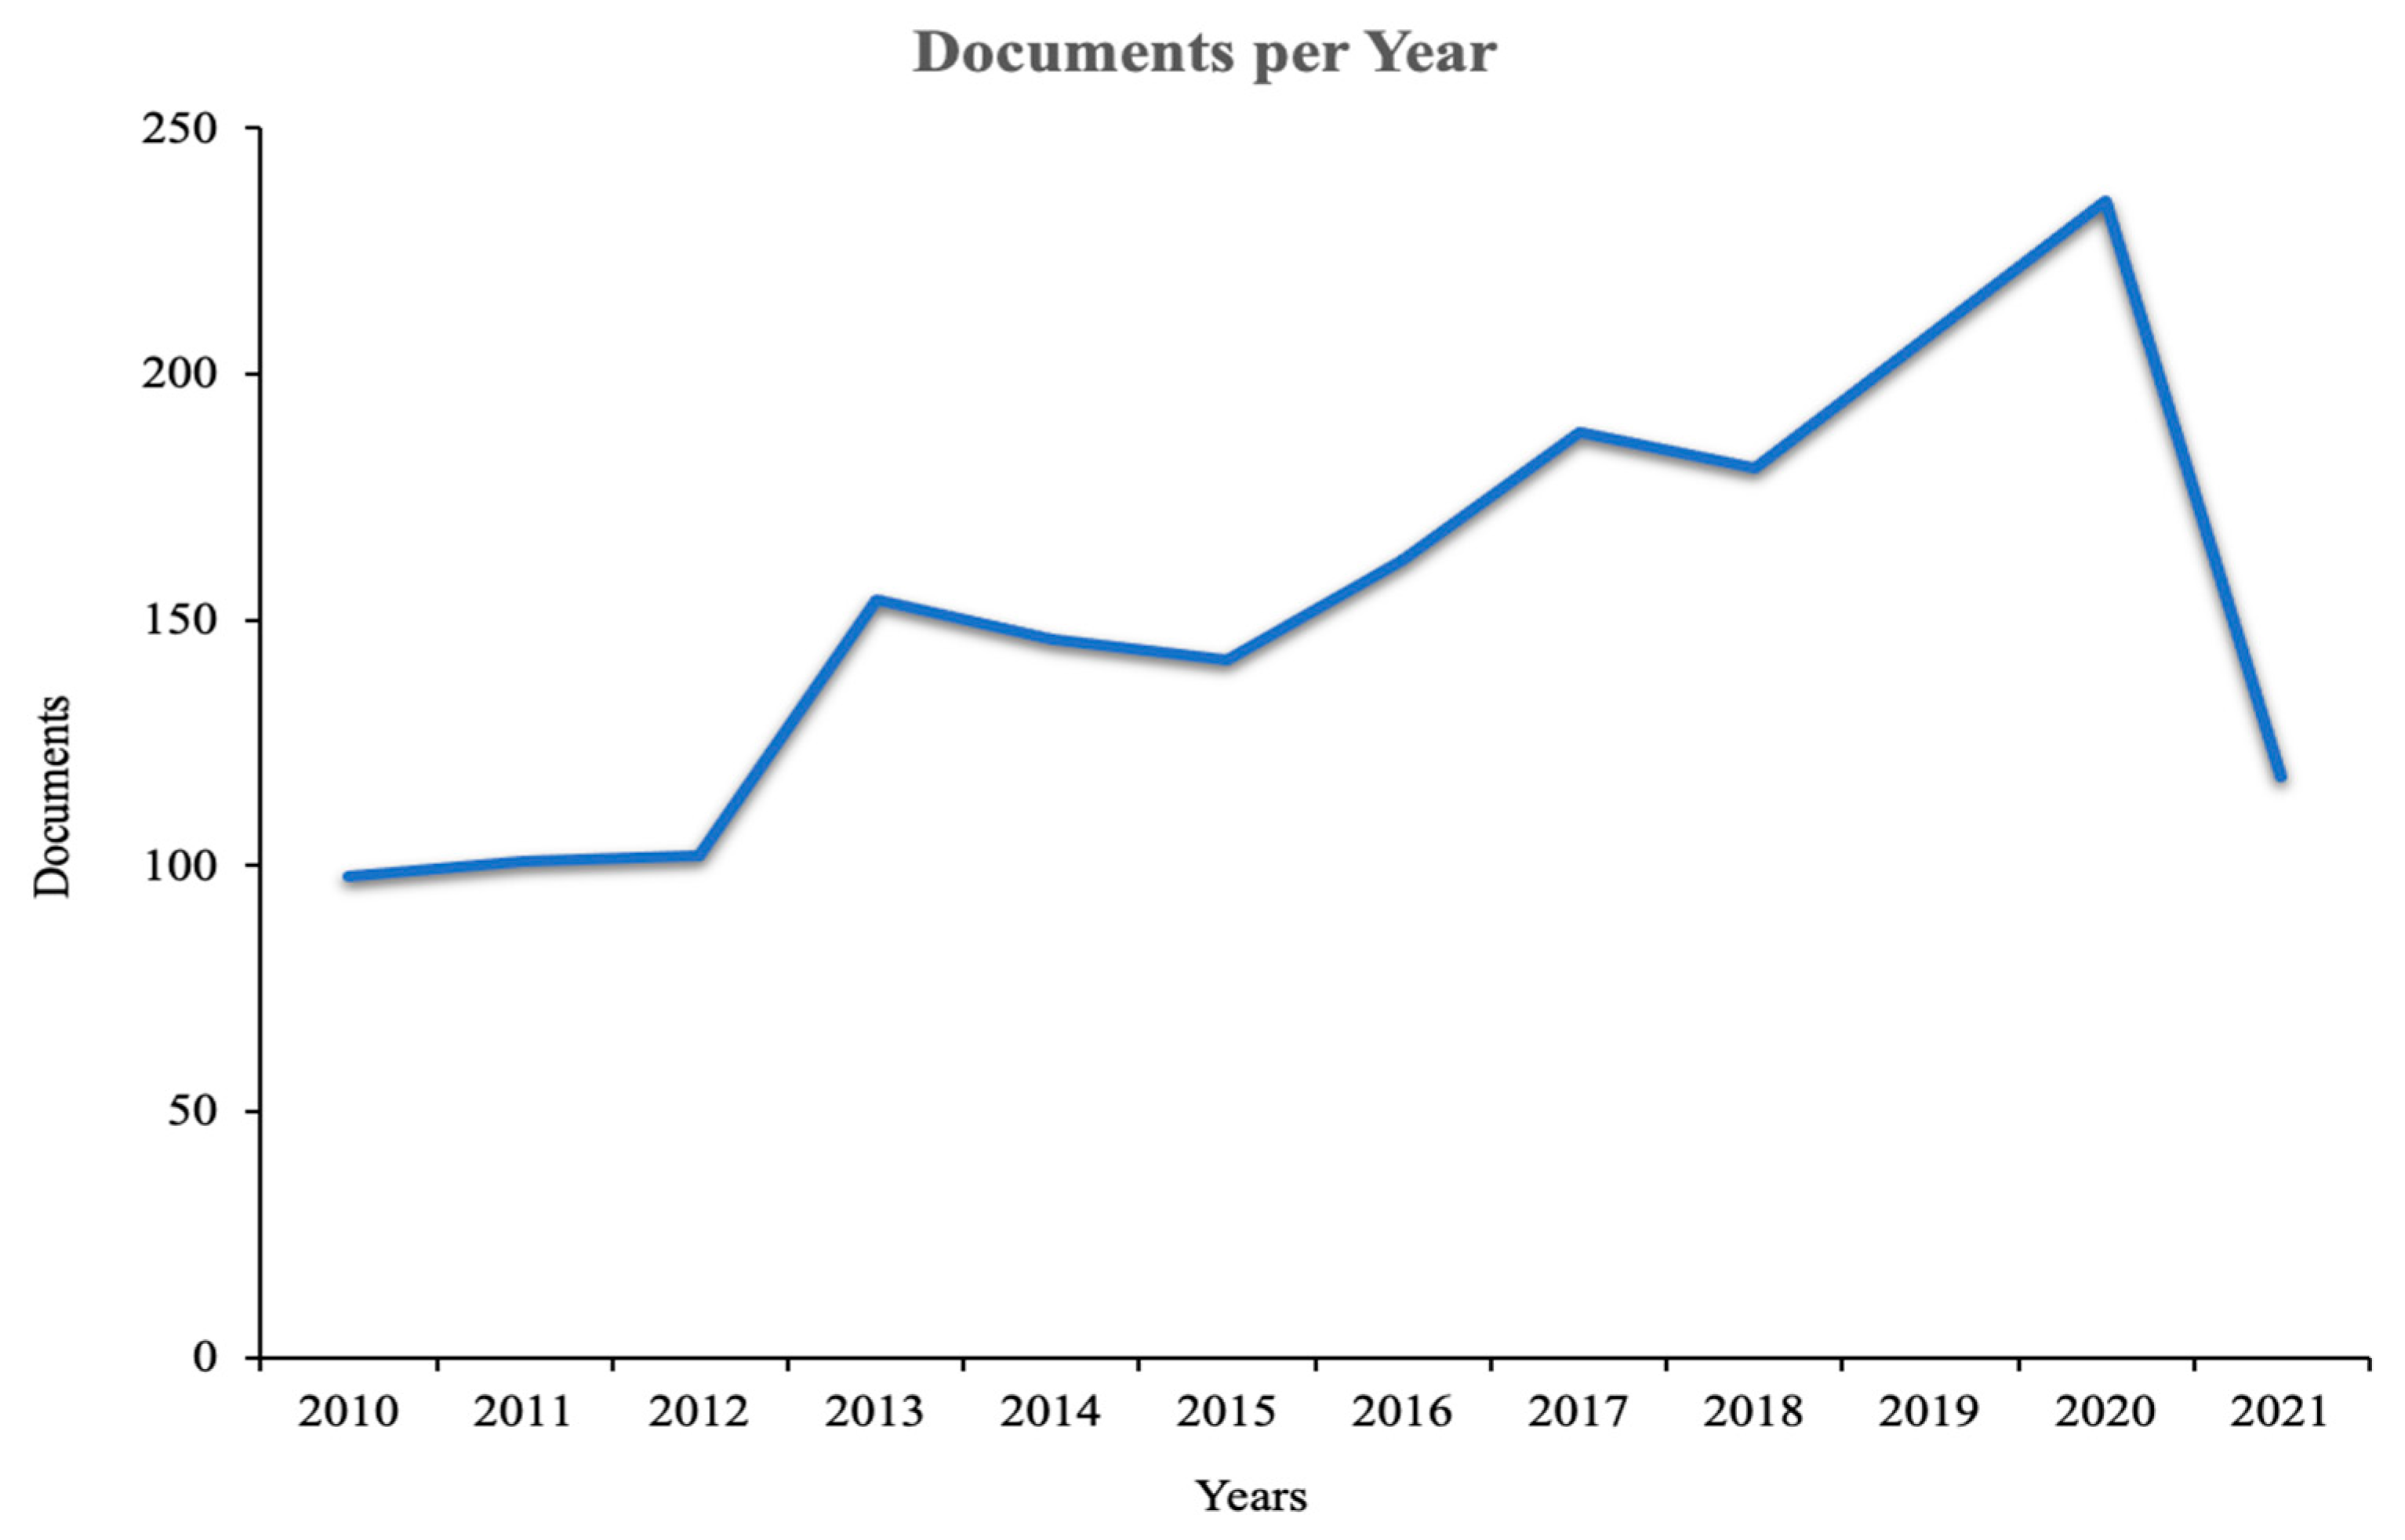
Figure 4.
(a). Mapping of keywords for drought analysis: Co-occurrence visualization. Green: Drought, precipitation, climate models. Red: Water management, water supply. Blue: Drought stress, crop, grain yield. Yellow: Rainforest, Asia, biomass. (b). Density visualization for drought analysis.
Figure 4.
(a). Mapping of keywords for drought analysis: Co-occurrence visualization. Green: Drought, precipitation, climate models. Red: Water management, water supply. Blue: Drought stress, crop, grain yield. Yellow: Rainforest, Asia, biomass. (b). Density visualization for drought analysis.

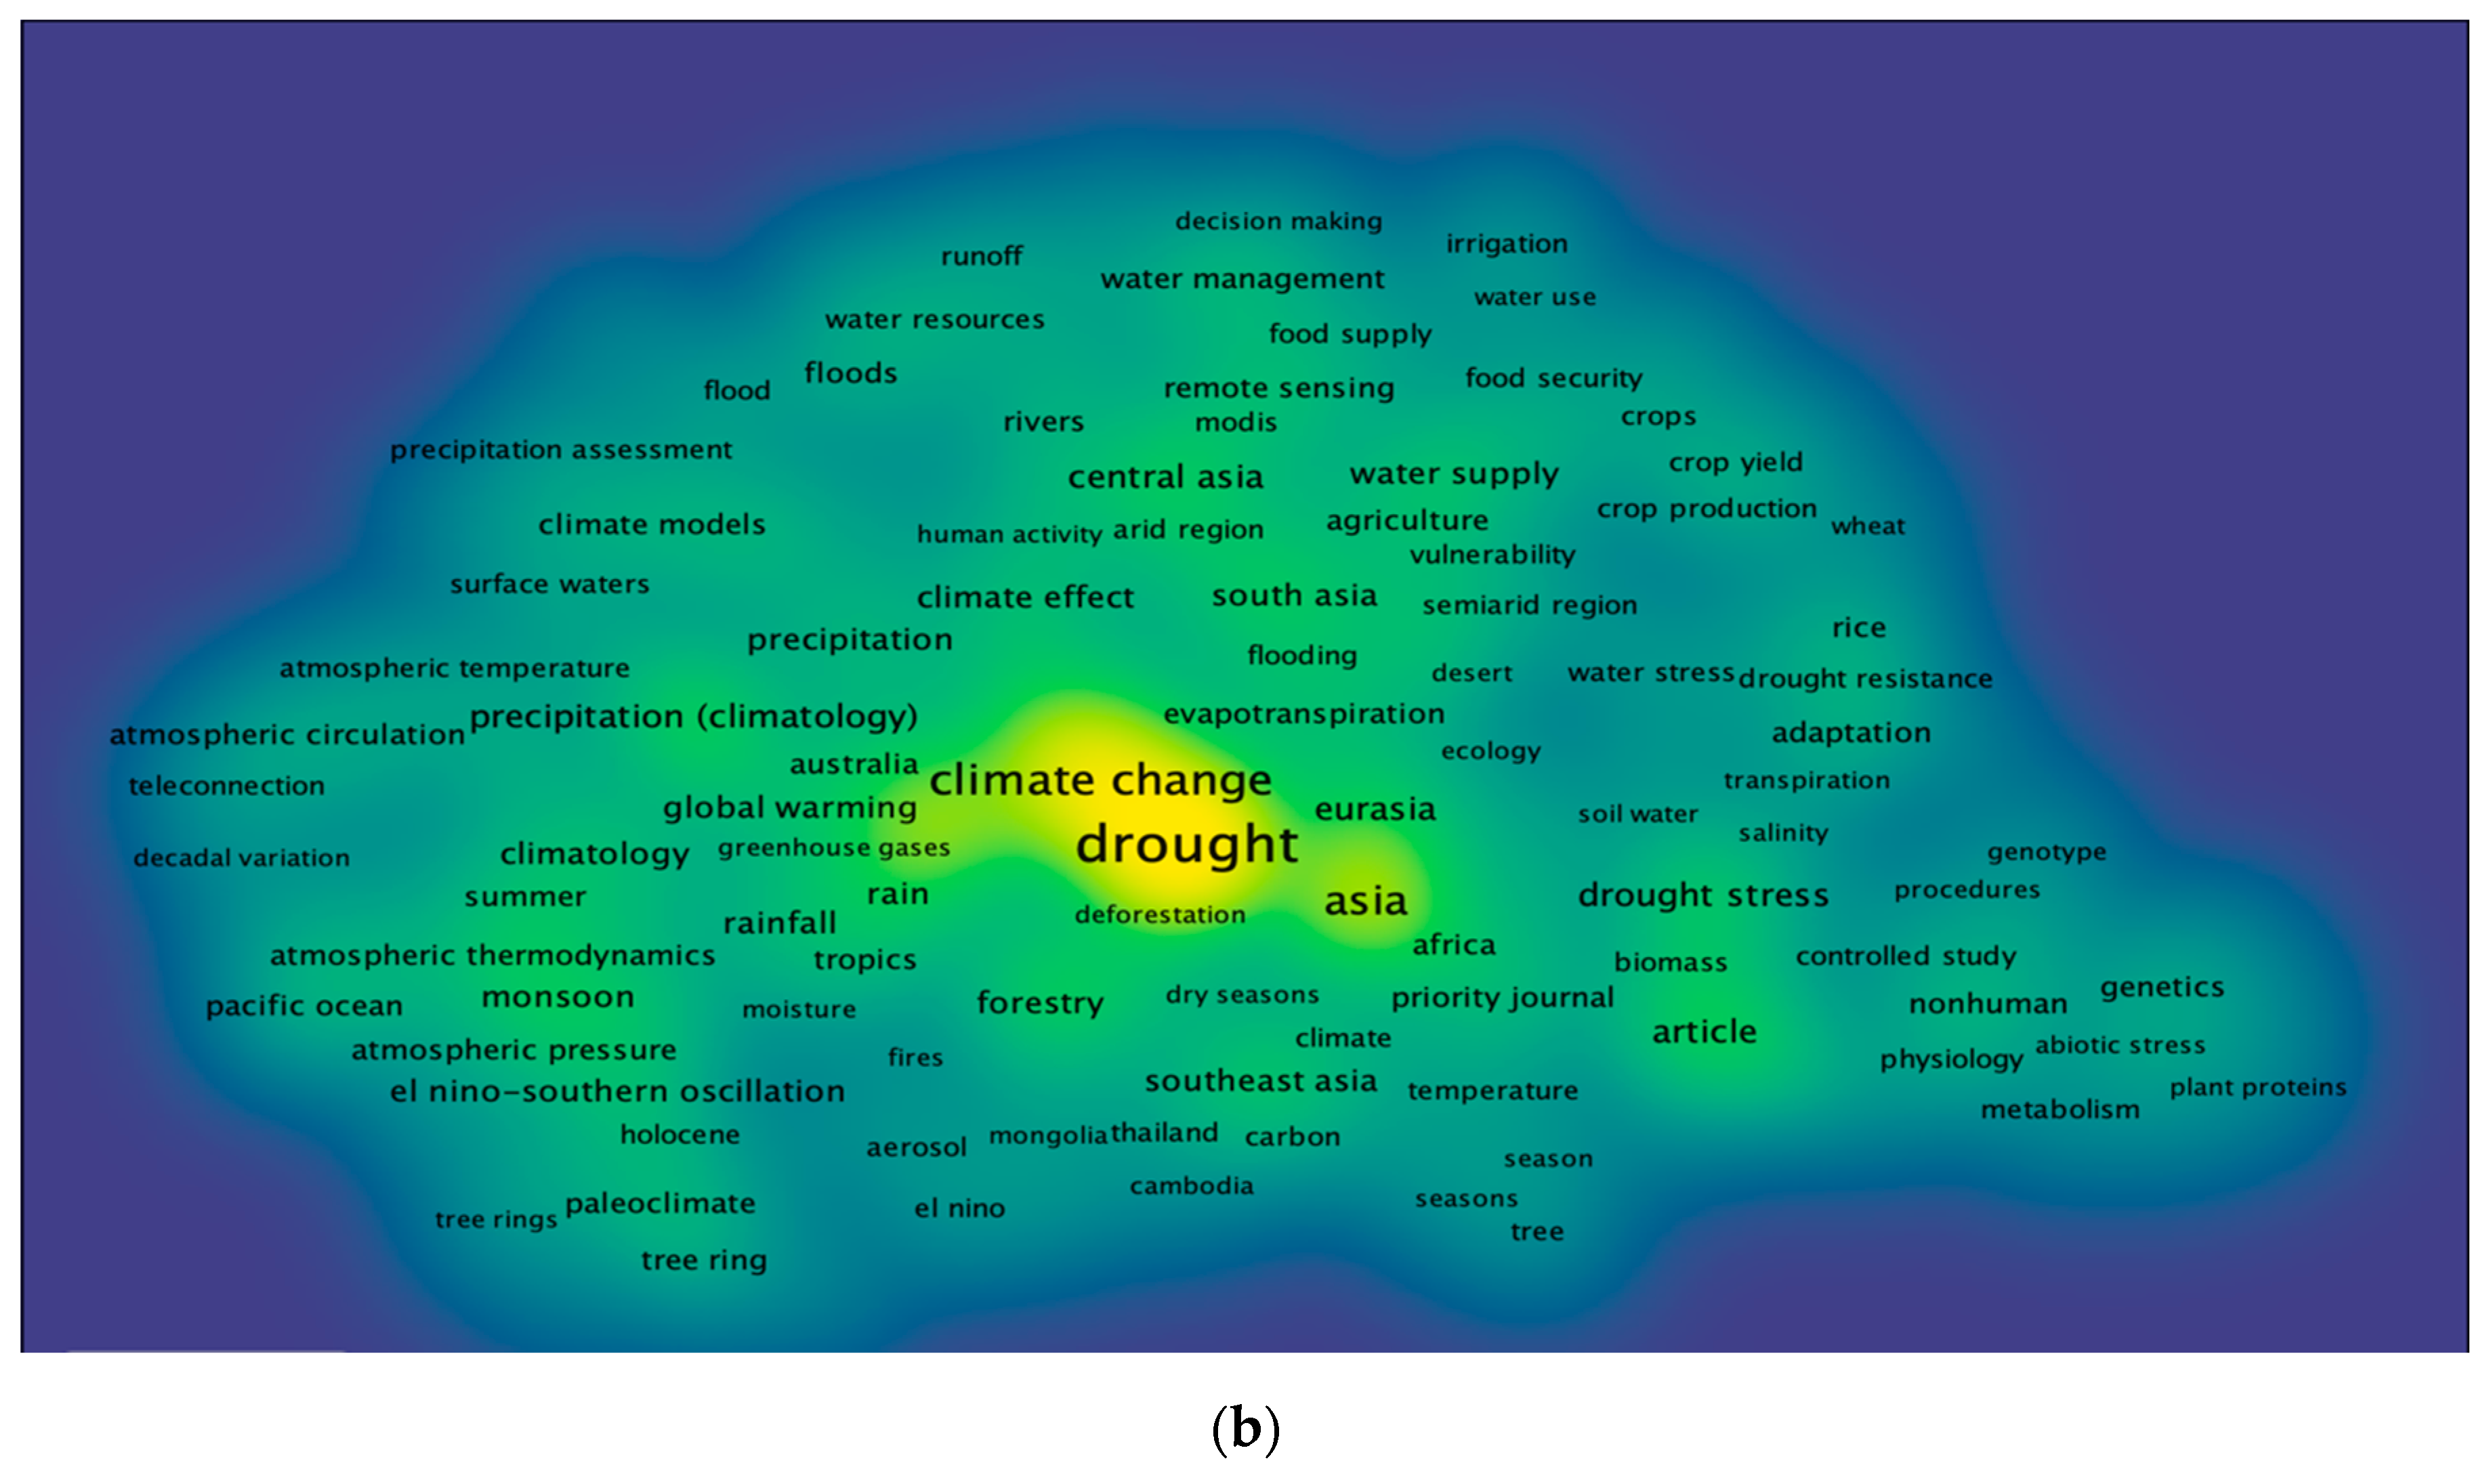
Figure 5.
(a). Visualization of co-authorship for drought analysis; authors with minimum five documents. Green: Li y, Red: Randerson j.t, Blue: Kumar a, Varshney r.k, Sky blue: zhang j. (b). Density Visualization of co-authorship for drought analysis.
Figure 5.
(a). Visualization of co-authorship for drought analysis; authors with minimum five documents. Green: Li y, Red: Randerson j.t, Blue: Kumar a, Varshney r.k, Sky blue: zhang j. (b). Density Visualization of co-authorship for drought analysis.


Figure 6.
(a). Countries visualization with maximum contributions to drought analysis; green: India, Nepal, Kenya. Yellow: Israel, USA, Germany. Blue: Indonesia, Thailand, Myanmar. (b). Density visualization with maximum contributions to drought analysis.
Figure 6.
(a). Countries visualization with maximum contributions to drought analysis; green: India, Nepal, Kenya. Yellow: Israel, USA, Germany. Blue: Indonesia, Thailand, Myanmar. (b). Density visualization with maximum contributions to drought analysis.


Table 1.
Top twenty keywords.
| Keyword | Occurrences | Total Link Strength |
|---|---|---|
| Drought | 920 | 2257 |
| Asia | 398 | 1310 |
| Climate change | 513 | 1263 |
| China | 320 | 978 |
| Eurasia | 153 | 648 |
| Article | 189 | 629 |
| Precipitation | 187 | 621 |
| Far east | 151 | 586 |
| Rain | 137 | 496 |
| Seasonal variation | 115 | 450 |
| Monsoon | 132 | 435 |
| Drought stress | 173 | 412 |
| Southeast Asia | 136 | 403 |
| Droughts | 111 | 398 |
| Rainfall | 109 | 396 |
| Forestry | 120 | 380 |
| Water supply | 110 | 369 |
| El Nino-southern oscillation | 111 | 363 |
| South Asia | 119 | 338 |
| Central Asia | 154 | 330 |
Table 2.
Top twenty authors.
| Author | Documents | Citations | Total Link Strength |
|---|---|---|---|
| dai a | 5 | 2527 | 19 |
| cook e.r. | 11 | 1384 | 27 |
| anchukaitis k.j. | 9 | 1383 | 18 |
| buckley b.m. | 9 | 1311 | 17 |
| randerson j.t. | 7 | 1010 | 5 |
| darrigo r.d | 5 | 1009 | 10 |
| liu y. | 35 | 906 | 67 |
| li j. | 26 | 856 | 72 |
| chen j. | 17 | 855 | 32 |
| li y. | 32 | 846 | 71 |
| chen y. | 21 | 837 | 28 |
| kumar a. | 21 | 809 | 15 |
| zhou t. | 10 | 798 | 61 |
| zhang j. | 29 | 783 | 15 |
| li s. | 17 | 633 | 32 |
| zhang q. | 15 | 610 | 27 |
| li x. | 27 | 560 | 57 |
| chen x. | 21 | 600 | 43 |
Table 3.
Countries mapping.
| Country | Documents | Citations | Total Link Strength |
|---|---|---|---|
| China | 668 | 14,396 | 227,494 |
| United states | 482 | 19,625 | 203,129 |
| Germany | 192 | 5693 | 103,144 |
| United Kingdom | 161 | 5555 | 78,391 |
| Australia | 140 | 3795 | 66,910 |
| India | 242 | 5152 | 58,147 |
| Japan | 153 | 3494 | 55,803 |
| Sweden | 49 | 1521 | 44,583 |
| South Korea | 82 | 940 | 34,951 |
| France | 65 | 2206 | 33,035 |
| Italy | 54 | 3676 | 32,569 |
| Spain | 37 | 1426 | 32,306 |
| Netherlands | 52 | 2598 | 30,520 |
Publisher’s Note: MDPI stays neutral with regard to jurisdictional claims in published maps and institutional affiliations. |
© 2021 by the authors. Licensee MDPI, Basel, Switzerland. This article is an open access article distributed under the terms and conditions of the Creative Commons Attribution (CC BY) license (https://creativecommons.org/licenses/by/4.0/).
Share and Cite
MDPI and ACS Style
Wu, D.; Li, Y.; Kong, H.; Meng, T.; Sun, Z.; Gao, H. Scientometric Analysis-Based Review for Drought Modelling, Indices, Types, and Forecasting Especially in Asia. Water 2021, 13, 2593. https://doi.org/10.3390/w13182593
AMA Style
Wu D, Li Y, Kong H, Meng T, Sun Z, Gao H. Scientometric Analysis-Based Review for Drought Modelling, Indices, Types, and Forecasting Especially in Asia. Water. 2021; 13(18):2593. https://doi.org/10.3390/w13182593
Chicago/Turabian StyleWu, Dan, Yanan Li, Hui Kong, Tingting Meng, Zenghui Sun, and Han Gao. 2021. "Scientometric Analysis-Based Review for Drought Modelling, Indices, Types, and Forecasting Especially in Asia" Water 13, no. 18: 2593. https://doi.org/10.3390/w13182593
Note that from the first issue of 2016, this journal uses article numbers instead of page numbers. See further details here.