Article

Spoiled for Choice during Cold Season? Habitat Use and Potential Impacts of the Invasive Silurus glanis L. in a Deep, Large, and Oligotrophic Lake (Lake Maggiore, North Italy)

CNR Water Research Institute, Largo Tonolli 50, 28922 Verbania, Italy
*
Author to whom correspondence should be addressed.
Water 2021, 13(18), 2549; https://doi.org/10.3390/w13182549
Submission received: 21 August 2021 / Revised: 11 September 2021 / Accepted: 15 September 2021 / Published: 17 September 2021
(This article belongs to the Special Issue Impacts of Human Activities and Climate Change on Freshwater Fish)

Abstract

:
The ecological features of invasive alien species are crucial for their effective management. However, they are often lacking in newly invaded ecosystems. This is the case of the European catfish Silurus glanis L. in Lake Maggiore, where the species is present since 1990, but no scientific information is available on its ecology. To start filling this knowledge gap, 236 catfish (67 cm to 150 cm of total length) were collected, measured, and dissected for stomach content analyses from three localities and in two habitats (littoral vs. pelagic) in late autumn/early winter. The NPUE and BPUE (individuals (N) and biomass (B, in grams) per unit effort (m2), respectively) of catfish were generally higher in littoral (NPUE > 0.01; BPUE > 96) than in pelagic habitats (NPUE < 0.009; BPUE < 114), but the catfish had, on average, larger sizes in pelagic habitats. Overall, 581 individual prey items were recorded, belonging to 12 taxa. Pelagic catfish specialized their diet exclusively on three prey fish (coregonids, shad, and roach), whilst the diet of littoral catfish was more variable and dominated by crayfish, perch, and roach. These results highlighted for the first time the interaction of larger catfish with the lake’s pelagic food web, and thus possible consequences are discussed, including the potential contrasting role S. glanis may have for the lake’s fishery.

1. Introduction

Invasive alien species (IAS) are nowadays recognized as a major component of the global decline in biodiversity. Great efforts have been spent to find general patterns able to predict the invasiveness, introduction paths, and impacts [1,2,3,4,5,6], with the aim to better allocate resources toward the management of the most problematic IAS [7]. Nevertheless, the impacts of biological invasions are highly context-dependent [8,9,10], triggering the predictions of the consequences of successful invasions [11]. This may be particularly true when the invader colonizes habitats that are different than those that are usually occupied both in the native and invaded ranges (i.e., novel habitats). As such, studies aimed to gain ecological information on invasive populations in novel environments are of great value to create data on which theoretical frameworks and hypotheses may then be developed and tested [8], to extend our understanding of IAS impacts and plan their management.
An example of a successful invader in freshwaters able to establish into novel habitat types is represented by the European catfish Silurus glanis L., a large-bodied fish naturally distributed in large freshwater ecosystems of eastern Europe and western Asia [12]. Thanks to its fast growth and the large body size reached, S. glanis is highly appreciated among anglers [13] and is an important resource in aquaculture [14], and this has led to its voluntary introduction into different areas, both within and outside Europe [12,15]. In western and southern Europe, it has established self-sustained populations, raising conservation concerns due to its top-predator position and opportunistic feeding behavior [12,15]. Although a relatively limited number of studies have addressed the impacts of European catfish within the receiving communities [16], there have been studies documenting the extirpation or significant reduction of some indigenous fish species through predation [17,18] and the potential alteration of energy fluxes between freshwater-marine or freshwater-terrestrial environments via the predation of anadromous species [19] or terrestrial prey (e.g., pigeons, frogs, rodents [15,16]), respectively. As a top-predator, concerns have arisen over the potential competition with other native top-predators such as pike Esox lucius L. [20]. However, the extreme trophic plasticity typical of the species seemed to prevent this [15,20,21]. Among other impacts associated with catfish invasion there is also the potential for the introduction of new pathogens [22,23].
The ability of S. glanis to colonize non-native ecosystems seems to be driven by its trophic plasticity [20,21,24]. European catfish is a top-predator, but, compared to other piscivorous fishes, it has a wider trophic niche [20,21,25] and its diet is unpredictable, especially in the invaded range, where the species adapts its diet to novel and available resources. For example, it has developed a new feeding behavior (i.e., “beaching behavior” [24]) to prey upon semiaquatic or terrestrial organisms, or it tends to feed upon other exotic species such as the invasive shrimp Dikerogammarus villosus (Sowinsky, 1894) or the invasive red swamp crayfish Procambarus clarkii Girard, 1852 [25,26]. Moreover, the diet of invasive catfish populations can vary from the earliest to the latest stages of the invasion [16] and with seasons [27]. Catfish diet may be dominated by cyprinid fishes in the early stages of the invasion [16] or in winter and autumn [27], whilst crayfishes and other macroinvertebrates may dominate S. glanis’ diet in the latest stages of the invasion or during spring and summer [16,27]. However, information is particularly scarce for the winter season, when the species is considered least active [15]. The trophic ecology of S. glanis is thus variable in its invasive range, with information mainly limited to riverine or reservoir populations where the fish is more easily captured [12] and to seasons of higher activity (i.e., spring and summer). Furthermore, little is known about the trophic ecology of the European catfish in oligotrophic and deep lakes.
In Italy, European catfish was first detected in 1937 in the Adda River [28], but the event was considered occasional and probably related to a stocking event [28], with no subsequent reports. In the second half of the 1970s, the first established S. glanis population was reported in the Po River, where the species was likely introduced in the 1950s [29]. Its introduction occurred mainly via stocking, often in put and take lakes, to enhance fishery for recreational angling [15,17,30] or, in some cases (e.g., Isonzo River), as a biocontrol agent to control other invasive species [31]. The species has now spread in all the major basins of northern and central Italy and in some large rivers of southern Italy (i.e., Aterno-Pescara and Volturno catchments; Supplementary Figure S1), where it has flourished in many environments, typically represented by the eutrophic, turbid, and still waters of canals, shallow lakes, and large rivers [17,25], also taking advantage of the degraded environment [32] and of climate change [33]. The remarkable ecological plasticity of European catfish is demonstrated by its ability to successfully colonize deep and oligotrophic Italian subalpine lakes such as Lake Maggiore [34].
Lake Maggiore is the second largest and deepest lake in Italy, with a surface of 212 km2, a maximum depth of 376 m, and a mean depth of 176.5 m. It is located in north-west Italy, south of the Alps, and comprised in the Po River basin [35]. It is an oligomictic and oligotrophic lake. Lake Maggiore and other deep subalpine lakes (Como, Garda, Iseo, and Lugano) account for 80% of the Italian freshwater reservoirs [34]. Being in the most densely populated area of Italy, L. Maggiore has suffered severe impacts deriving from anthropogenic activities [35,36]. It underwent cultural eutrophication in the 1970s, and its natural oligotrophic conditions were re-established in the 1990s [37]. Lake Maggiore has also faced serious chemical pollution due to the presence of different classes of contaminants [38,39,40,41,42]. On top of these environmental issues, the introduction of non-native fauna has deeply altered the pristine communities of the lake, to the point that fish catches are now dominated by non-native species [34].
Fish introductions were mainly intentional, to enhance commercial and recreational fisheries with European and north American species, reaching a total of at least 13 recognized non-native taxa [34]. Seven of these species have been introduced and established before 1960, among which at least two species of coregonids (both now recognized as hybrids of several Coregonus species native to different Swiss lakes [43,44], locally called “lavarello” and “bondella” and hereafter referred to as Coregonus sp.); Alpine charr Salvelinus umbla (L.); rainbow trout Oncorhynchus mykiss (Walbaum 1792); largemouth bass Micropterus salmoides (Lacepède 1802); pumpkinseed Lepomis gibbosus (L.); and black bullhead Ameiurus melas (Rafinesque 1820). Additionally, six species have been introduced after 1960 and became abundant mostly during the 1990s, including roach Rutilus rutilus L.; crucian carp Carassius carassius L.; bitterling Rhodeus amarus (Bloch 1782); pikeperch Sander lucioperca (L.); ruffe Gymnocephalus cernua (L.); and European catfish.
Data from the standardized fish sampling carried out in the summer showed that non-native species of recent introduction (i.e., introduced after 1960) dominate the littoral zone (i.e., a nearshore habitat where the whole water column receives light; [45]) of the lake, whilst the pelagic compartment (i.e., the open water—offshore zone) is dominated by non-native species, particularly coregonids [46]. In the littoral compartment, fish biomass decreases with depth and is the highest within the first 6 m, being dominated by the omnivorous roach and perch, or Perca fluviatilis L. [46]. In contrast, in the pelagic zone, the highest fish biomass is recorded between 30 and 40 m [46], and planktivorous species are predominant. Among the top-predators, only southern pike Esox cisalpinus Bianco & Delmastro 2011, and lake trout Salmo spp., are native, and they occur as rare species mainly in the littoral and pelagic zones, respectively [34,36]. Other than European catfish, another non-native top-predator present is pikeperch [47], which occurs both in the littoral and in the pelagic zones [46].
Since oligotrophic deep lakes like L. Maggiore constitute a novel environment for S. glanis, there are many knowledge gaps on the ecology and potential impacts of the species in these ecosystems, especially in Italy [48]. To start to fill these gaps, we explored the diet of the species captured by commercial fishermen during the late autumn/early winter period at three sites and two environments (littoral and pelagic) of Lake Maggiore. Interestingly, despite its benthic morphology, fishermen are increasingly reporting catches of S. glanis in the pelagic zone of the lake, especially in late autumn and winter, with these raising questions over the reasons for its presence in this compartment of the lake and the possible impacts on the pelagic food web. We analyzed the catfish harvest variation at the three sites and between habitats and tested for differences in diet composition, prey abundance, estimated biomass, and size of the prey among sites and environments. Due to the important role of L. Maggiore in providing fish for commercial purposes, to supply preliminary qualitative data on the role of S. glanis for this valuable service, changes in fish harvest since the introduction of catfish in L. Maggiore (i.e., 1990 [49]) were analyzed and discussed. Finally, since this work has benefited from the active contribution of professional fishermen, who captured the fish and recorded the stomach’s content data, it contributes to demonstrating the remarkable importance of anglers’ collaboration in monitoring invasive fish species and their impacts in large lakes.

2. Materials and Methods

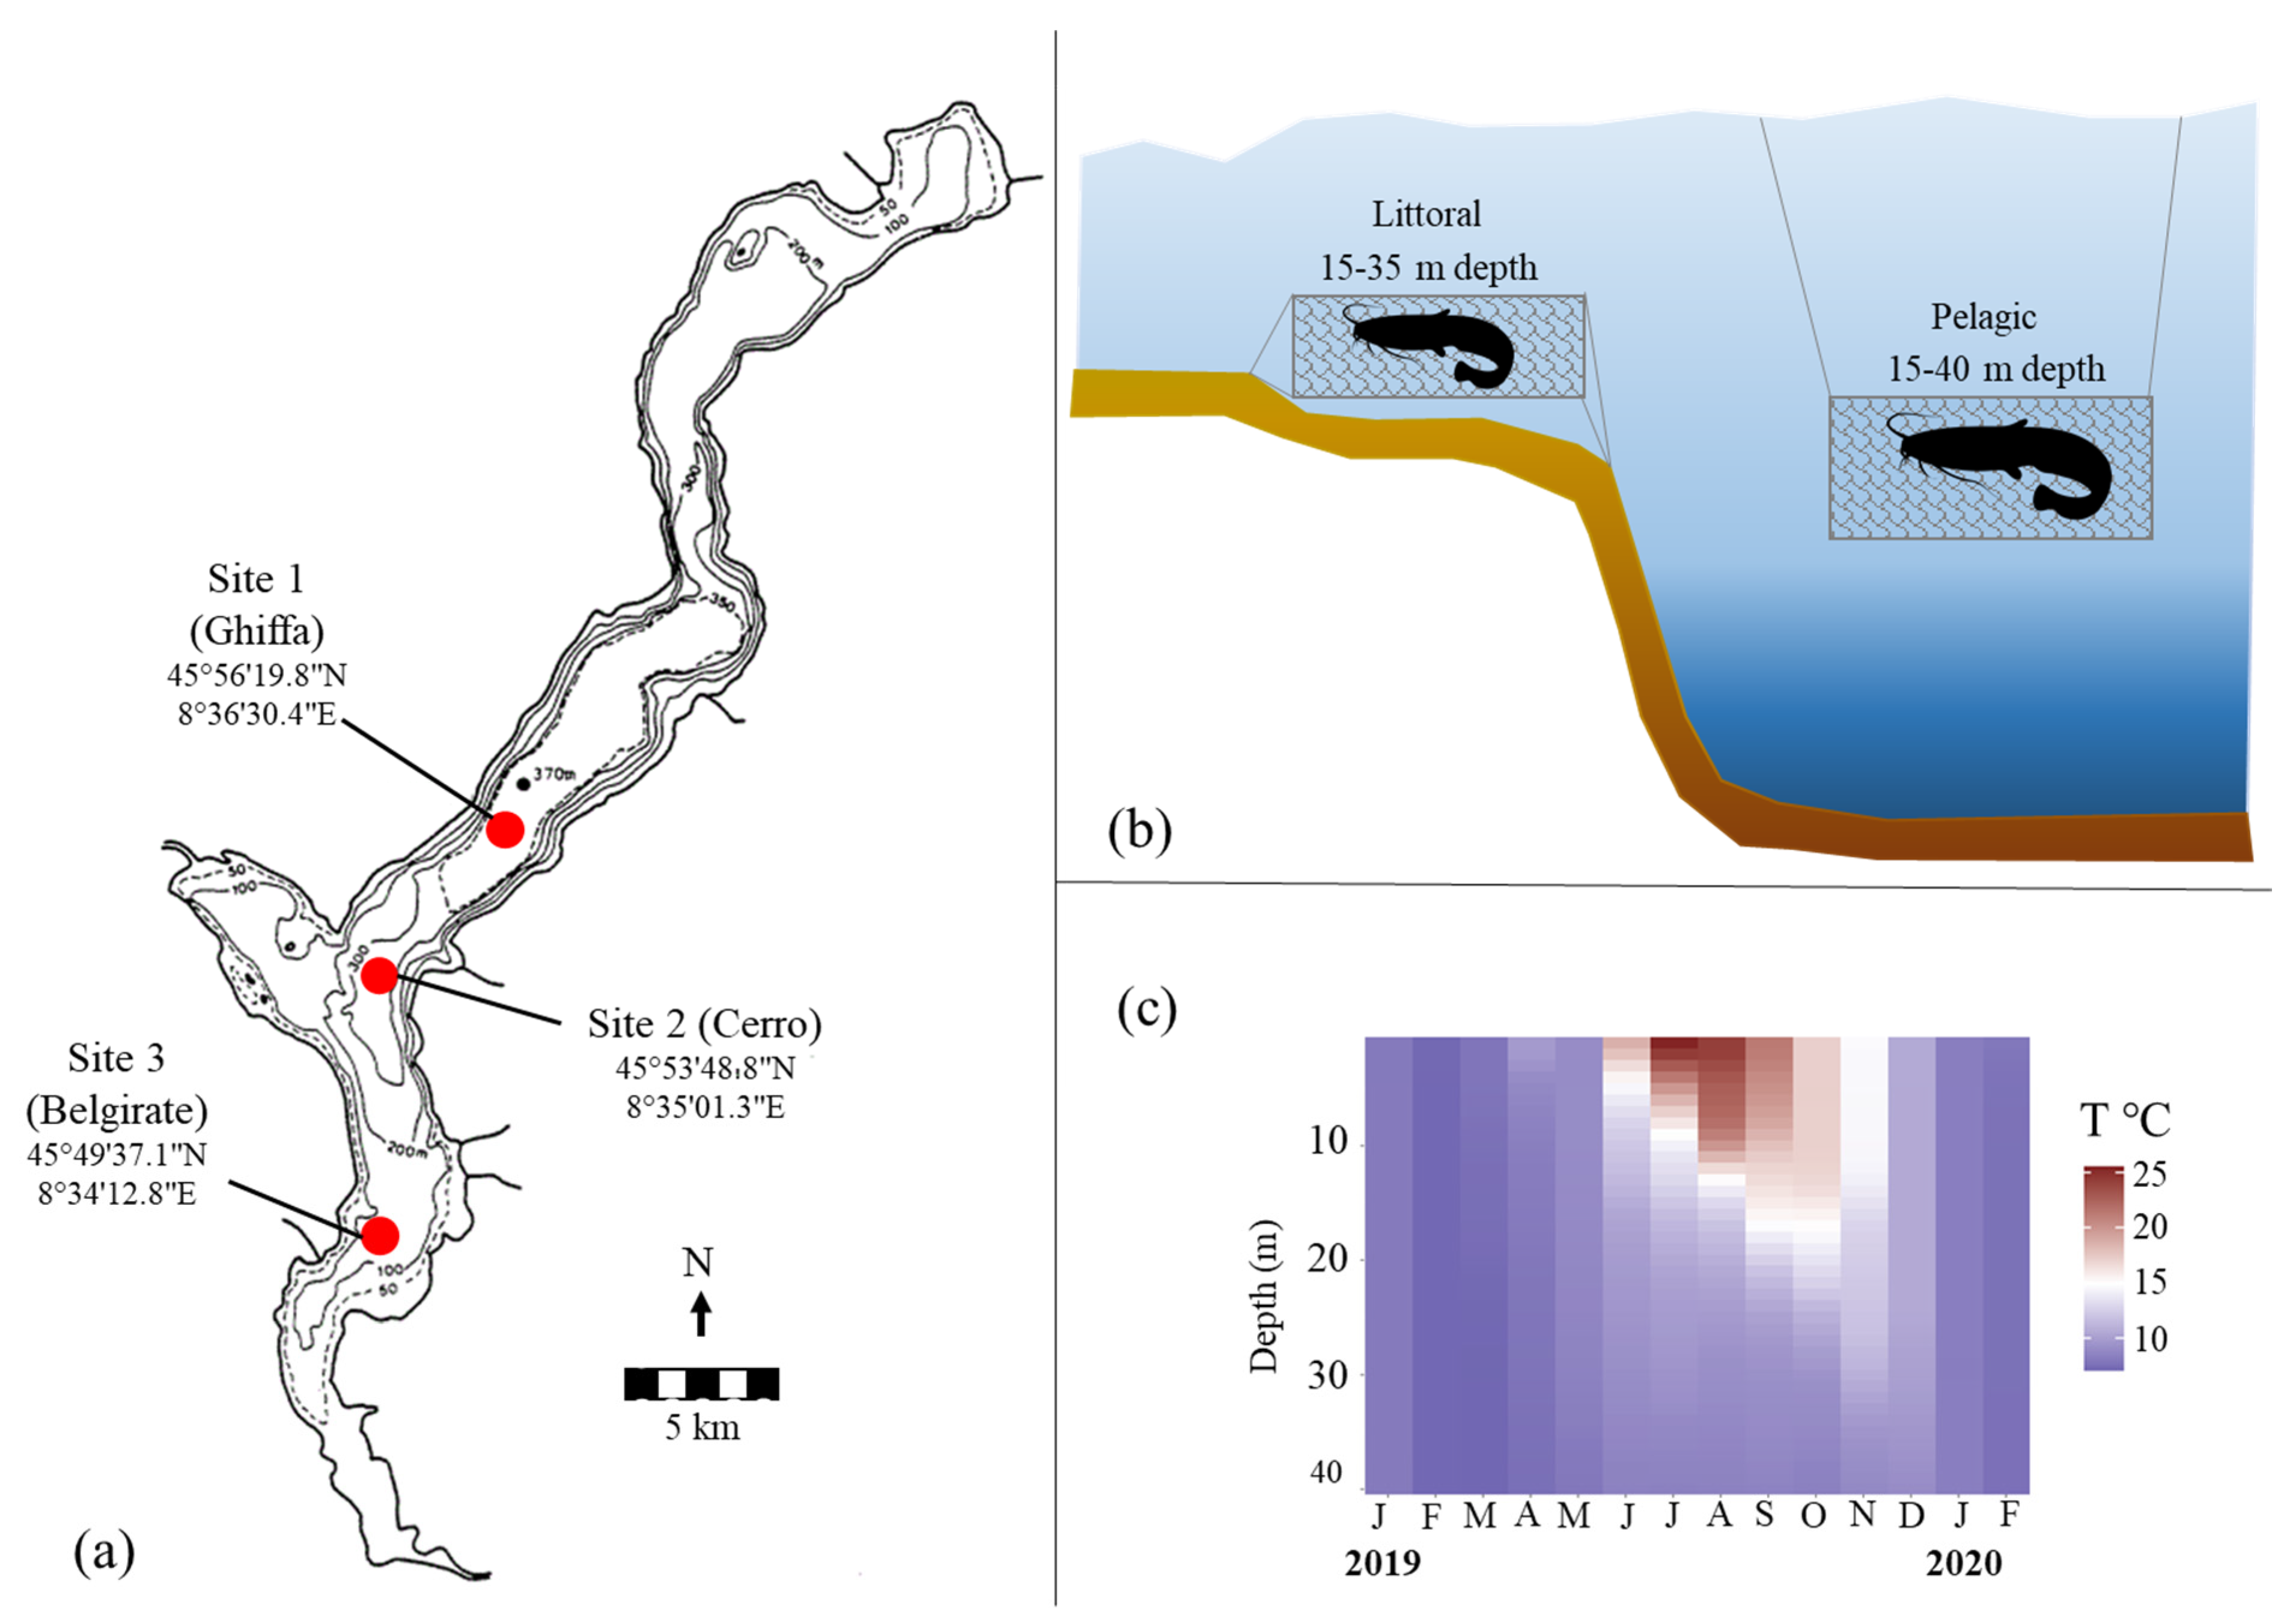
2.1. Sampling Locations and Fishing Gears

Fishing was carried out at three sites located in the central/southern part of Lake Maggiore (Figure 1a). At each site, fishermen set benthic (60 mm mesh size, 500 m length, and 5 m height) and pelagic gill nets (80 mm mesh size, 750 m length, and 10 m height) at depths of 15 to 35 m and 15 to 40 m, for the littoral and pelagic zone, respectively (Figure 1b). Nets were set at dusk and withdrawn the following morning. The sampling activity for the study’s purpose was done in late autumn/early winter, from November 2019 to January 2020, in the occasion of a special permit released by the fishing authorities in favor of professional fishermen, which provided the experimental use of large mesh gillnets during a fishing stop period corresponding to the spawning season of coregonids. The study period, however, is also the time of the year in which anglers report major catches of S. glanis in open water habitats (i.e., pelagic). Thus, it allowed us to test potential differences in total length, diet, and feeding behavior between littoral and pelagic catfish.
Since the distribution and feeding activity of catfish may have been influenced by water temperature, the temperature distribution along the water column in 2019 and January–February 2020 was obtained from the deepest point of the lake (Ghiffa station; Figure 1a), as made available by the International Commission for the Protection of Italian-Swiss waters (CIPAIS). The data were collected with a Idronaut CDC304 temperature probe, with data registered across multiple depths, at a speed of 1 m/s, and a frequency of 200 milliseconds. The depth was obtained from hydrostatic pressure, and the data were then interpolated for each meter depth using the Idronaut REDAS5 software (Idronaut Srl). The temperature-depth profile showed that in June to November 2019 there was a considerable stratification, with water temperatures >15 °C (and up to 25 °C in July) within the first 5 m (June) to 20 m (October) (Figure 1c). Considering the three months of the study, November was the warmest and still showed a subtle stratification, with temperatures around 15 °C within the first 10 m, progressively decreasing down to 9 °C at a depth of 40 m. By December, the temperature decreased to <10 °C, with no stratification apparent (less than 1 °C of difference between the temperature at the surface and at 40 m) in both December and January (Figure 1c).

2.2. Stomach Content and Prey Detection

The fish were eviscerated as soon as the commercial fishermen reached their own laboratory. The stomachs were opened and prey items were recognized up to the species level, counted, and tape-measured for their total length (1 cm). The prey items that were not possible to recognize were discarded and were not processed further, and the empty stomachs were recorded. The data were registered day by day and were sent to CNR at the end of January 2020. The correct identification of food items was double-checked by the authors, by analyzing independently a subsample of 10 full stomachs per fisherman and testing the coincidence in prey determination with that given by the individual fisherman.

2.3. Data Analyses

The lengths of both catfish and their prey were used to back-calculate the weight, using the length–weight relationships (LWRs) obtained from an internal database of LWRs in different Italian lakes for fish (see supplementary material Tables S1 and S2 for LWR parameters calculated for each species), while for crayfish, the LWRs available in the literature were used [50,51]. Even if LWRs can vary considerably among seasons and locations, this enabled us to obtain a gross estimation of the biomass of catfish and their prey at each site and within each habitat.
To compare catfish catches between habitats per month, the relative biomass (grams; BPUE) and number (individuals; NPUE) per unit effort (m2; as gillnets area) of catfish were calculated, and a multifactorial ANOVA followed by a Tukey post hoc test was used to test for differences in total length according to the sampling site, month of capture, and habitat.
For the stomach content analysis, the catfish were divided into two size classes (Class I < 100 cm; Class II > 100 cm) following a previous work on catfish diet and corresponding to possible diet transitions according to body size [26]. To compare the feeding intensity and the amount of food ingested by catfish of different size classes and caught at different sites and habitats, the vacuity index (VI) and fullness index (FI) were calculated, where: VI is the proportion of empty stomach found with respect to the number of stomachs analyzed and is expressed as a percentage [52]; FI is the percent ratio between the total weight of a certain prey and the total weight of the predator [53]. A multifactorial ANOVA was then applied to test for the possible influences of fish size, site, and habitat on these dietary metrics and on the amount and biomass of food ingested.
To assess the diet composition variation between habitat and size classes, the following three common metrics were calculated. The first was the frequency of occurrence (FO%), which describes the proportion of non-empty stomachs in which a certain prey is found compared to the total of analyzed stomachs. The other two metrics were the numerical abundance (N%) and the biomass contribution of prey (W%), which are calculated as the proportional contribution in number/weight over the total number/weight recorded, respectively [54].
The numerical proportion of a given prey with respect to the total number of prey found in a single individual was calculated for each catfish, and an arcsin square root transformation was used to build a Bray-Curtis distance matrix, which served as the input to the non-metric multidimensional scaling (nMDS). This ordination method was used to visualize variations in the core dietary niches (as 40% standard ellipse areas; [55]) of catfish caught at different sites and habitats and belonging to different size classes. A three-way PERMANOVA was then used to test whether the diet composition significantly differed between sites, habitat, and size classes with statistical significance evaluated after 9999 permutations.
Finally, the feeding strategy of catfish in different habitats was investigated using the Costello modified plot [56,57]. In this graphical interpretation, the frequency of occurrence is plotted against prey-specific abundances, calculated as the proportion between the numerical abundance of a certain prey over the total number of prey found in those stomachs comprising that specific prey [57]. This method allows us to visualize whether the diet of a predator is composed of dominant or rare species and thus if the predator is a generalist or a specialist, and it can also help to distinguish between the inter vs. intra individual’s contribution to the trophic niche width.
All statistical analyses were performed in R v. 4.0.5. [58] and used a significant threshold p < 0.05. nMDS and PERMANOVA were performed using the community ecology R package “vegan” v. 2.5-7 [59].

2.4. Additional Information: L. Maggiore’s Fish Commercial Harvest

Species-specific data of the fish commercial harvest since the introduction of catfish in L. Maggiore [49] were provided by the Italian Swiss committee for fisheries (CISPP) and analyzed to assess the potential role of catfish on the lake’s fishery.

3. Results

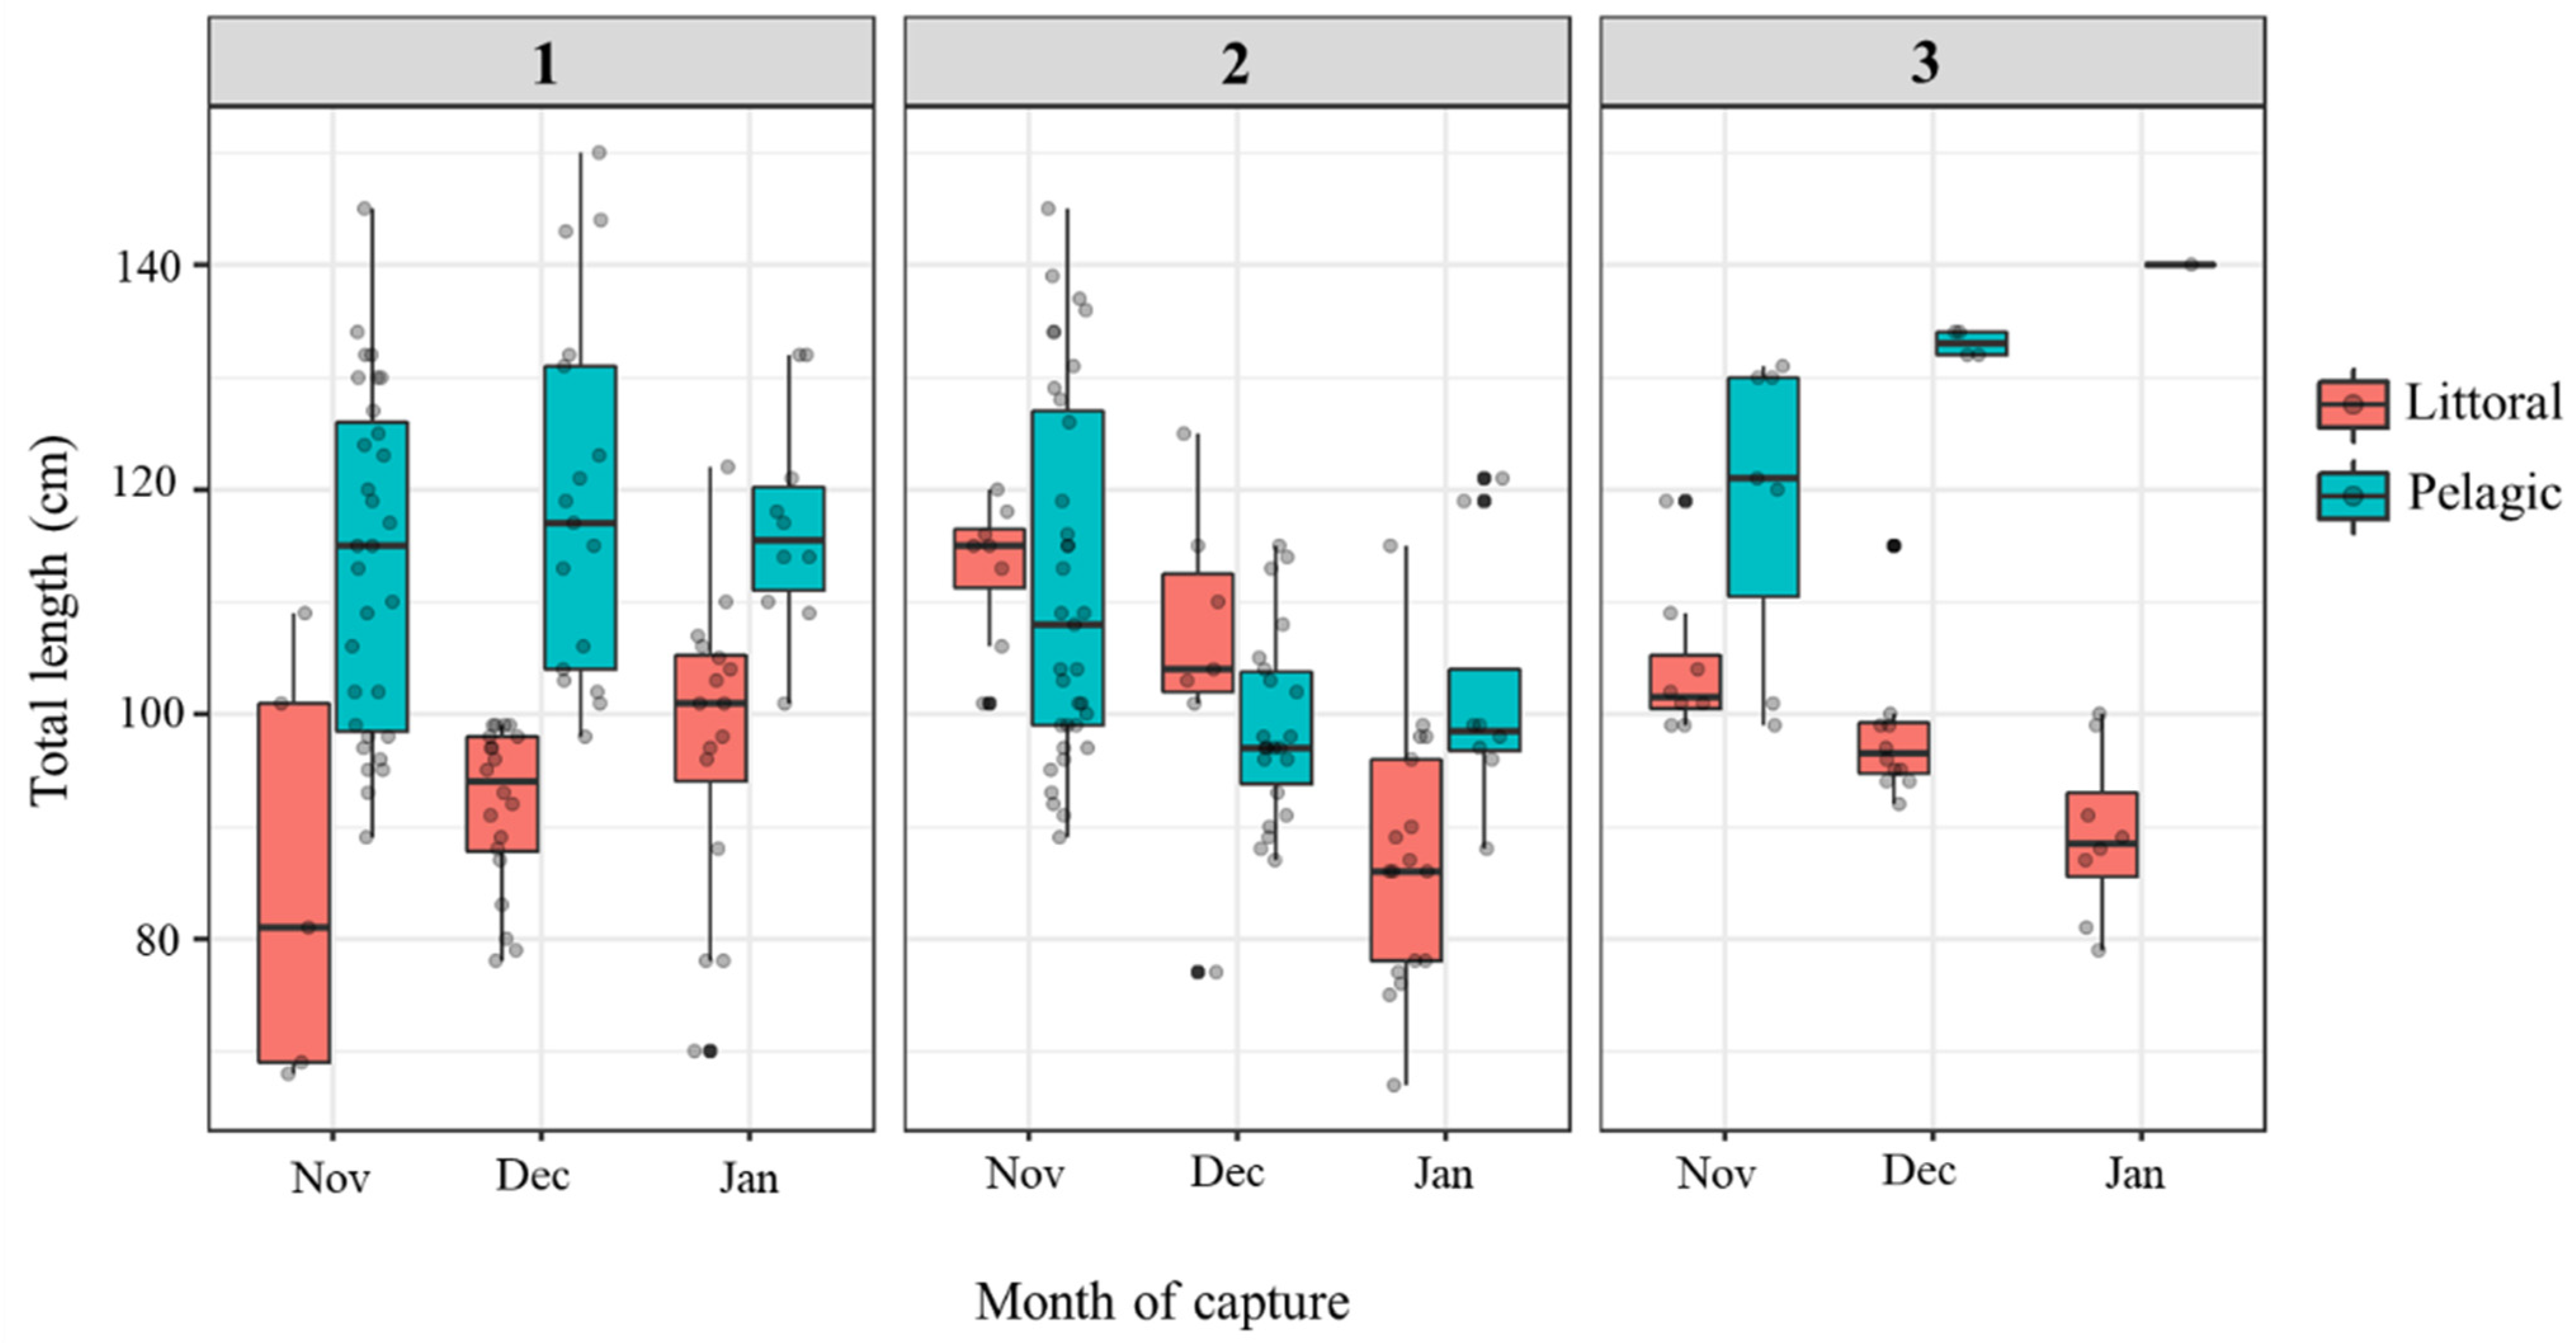
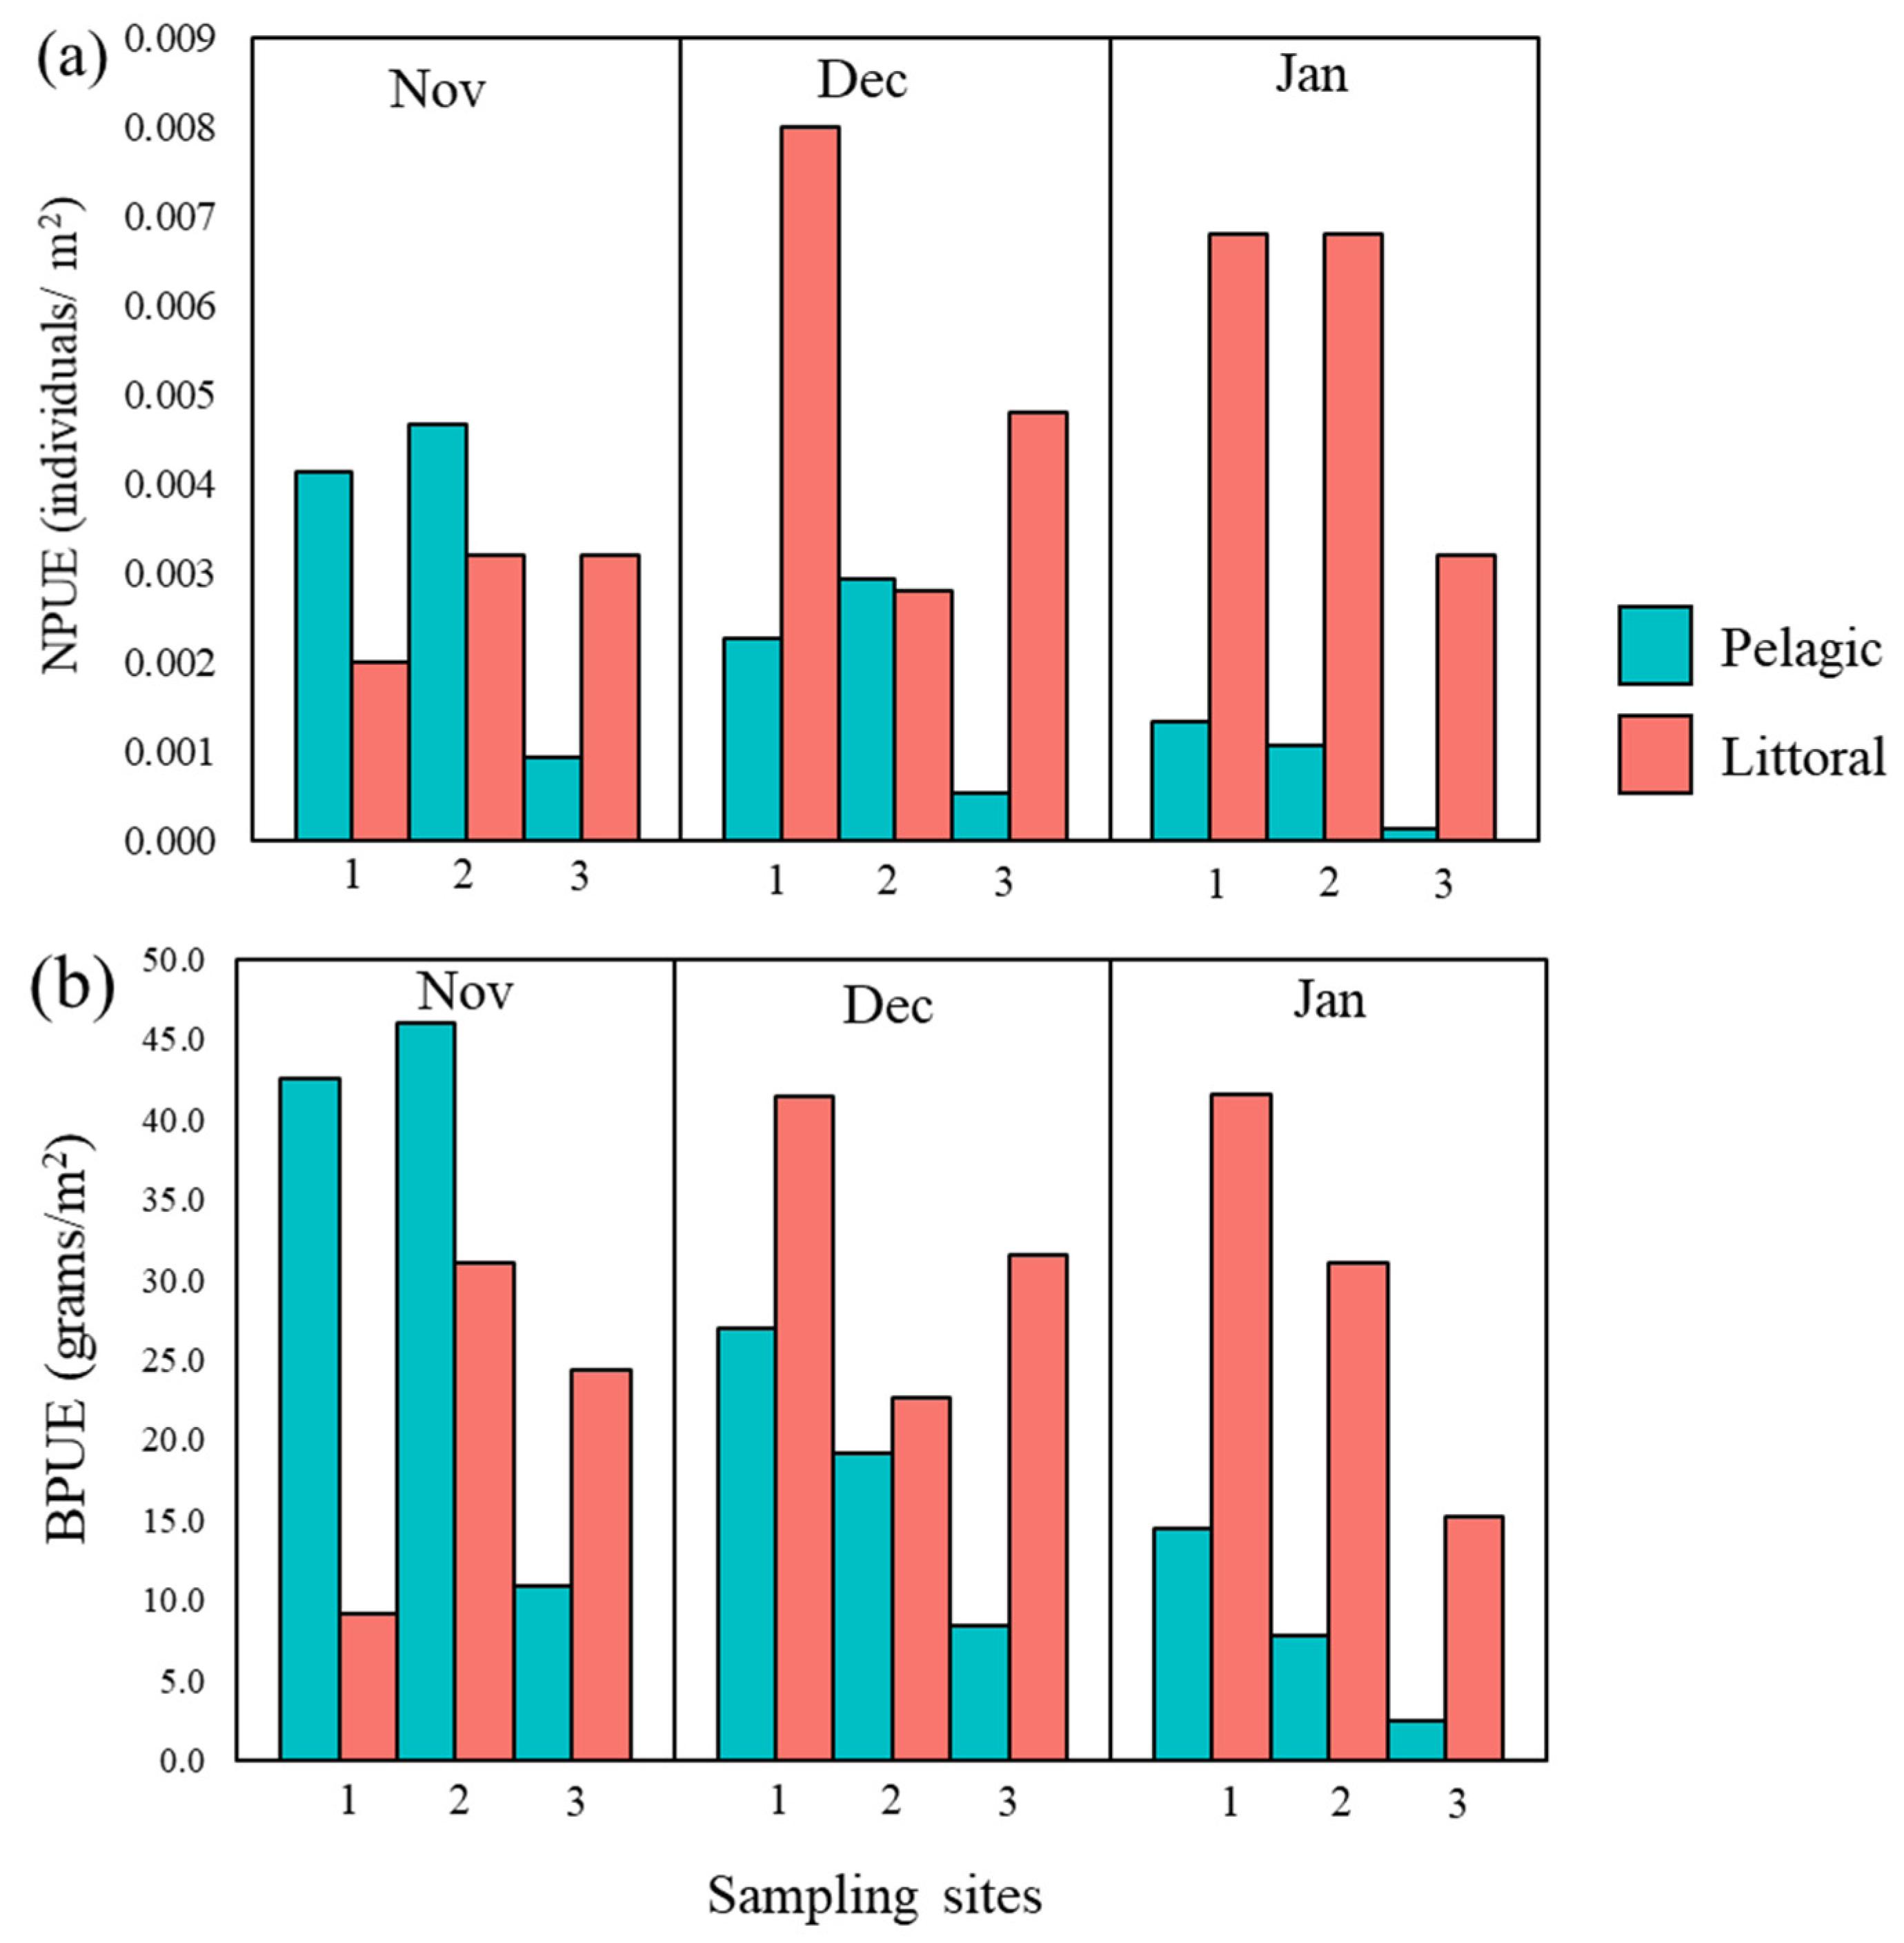
3.1. Catfish Harvest in Late Autumn/Early Winter 2019/2020 at Three Sampling Sites

A total of 236 catfish were caught from the three localities, 101 in the littoral zone and 135 in the pelagic zone (Table 1). The fish ranged in total length between 67 cm and 150 cm and in estimated weight between 1932 and 22,940 g, with the largest fish found in the pelagic habitats and the smallest in the littoral one (Table 1).
Catfish total length varied significantly across habitats, sites, and months of capture (Habitat × Site × Month: F1, 218 = 3.7, p = 0.006), with the post hoc test revealing that these differences were mainly between littoral and pelagic habitats among and within all sites and months (p adjusted < 0.05; Figure 2). This, however, was not observed at site 2, where pelagic catfish were significantly smaller than pelagic catfish caught at the other sites, particularly in December and January (Figure 2), but did not significantly differ in TL from the littoral catfish caught at the same site.
The relative biomass (BPUE) and number (NPUE) of catfish varied between sites, habitats, and month of capture as well. However, it was possible to recognize some general patterns, such as generally lower NPUE and BPUE in pelagic than in littoral habitats, except at site 1 (Table 1; Figure 3), and a substantial decrease in both pelagic catfish NPUE and BPUE in December and January, while both increased in most cases for littoral catfish (Figure 3).

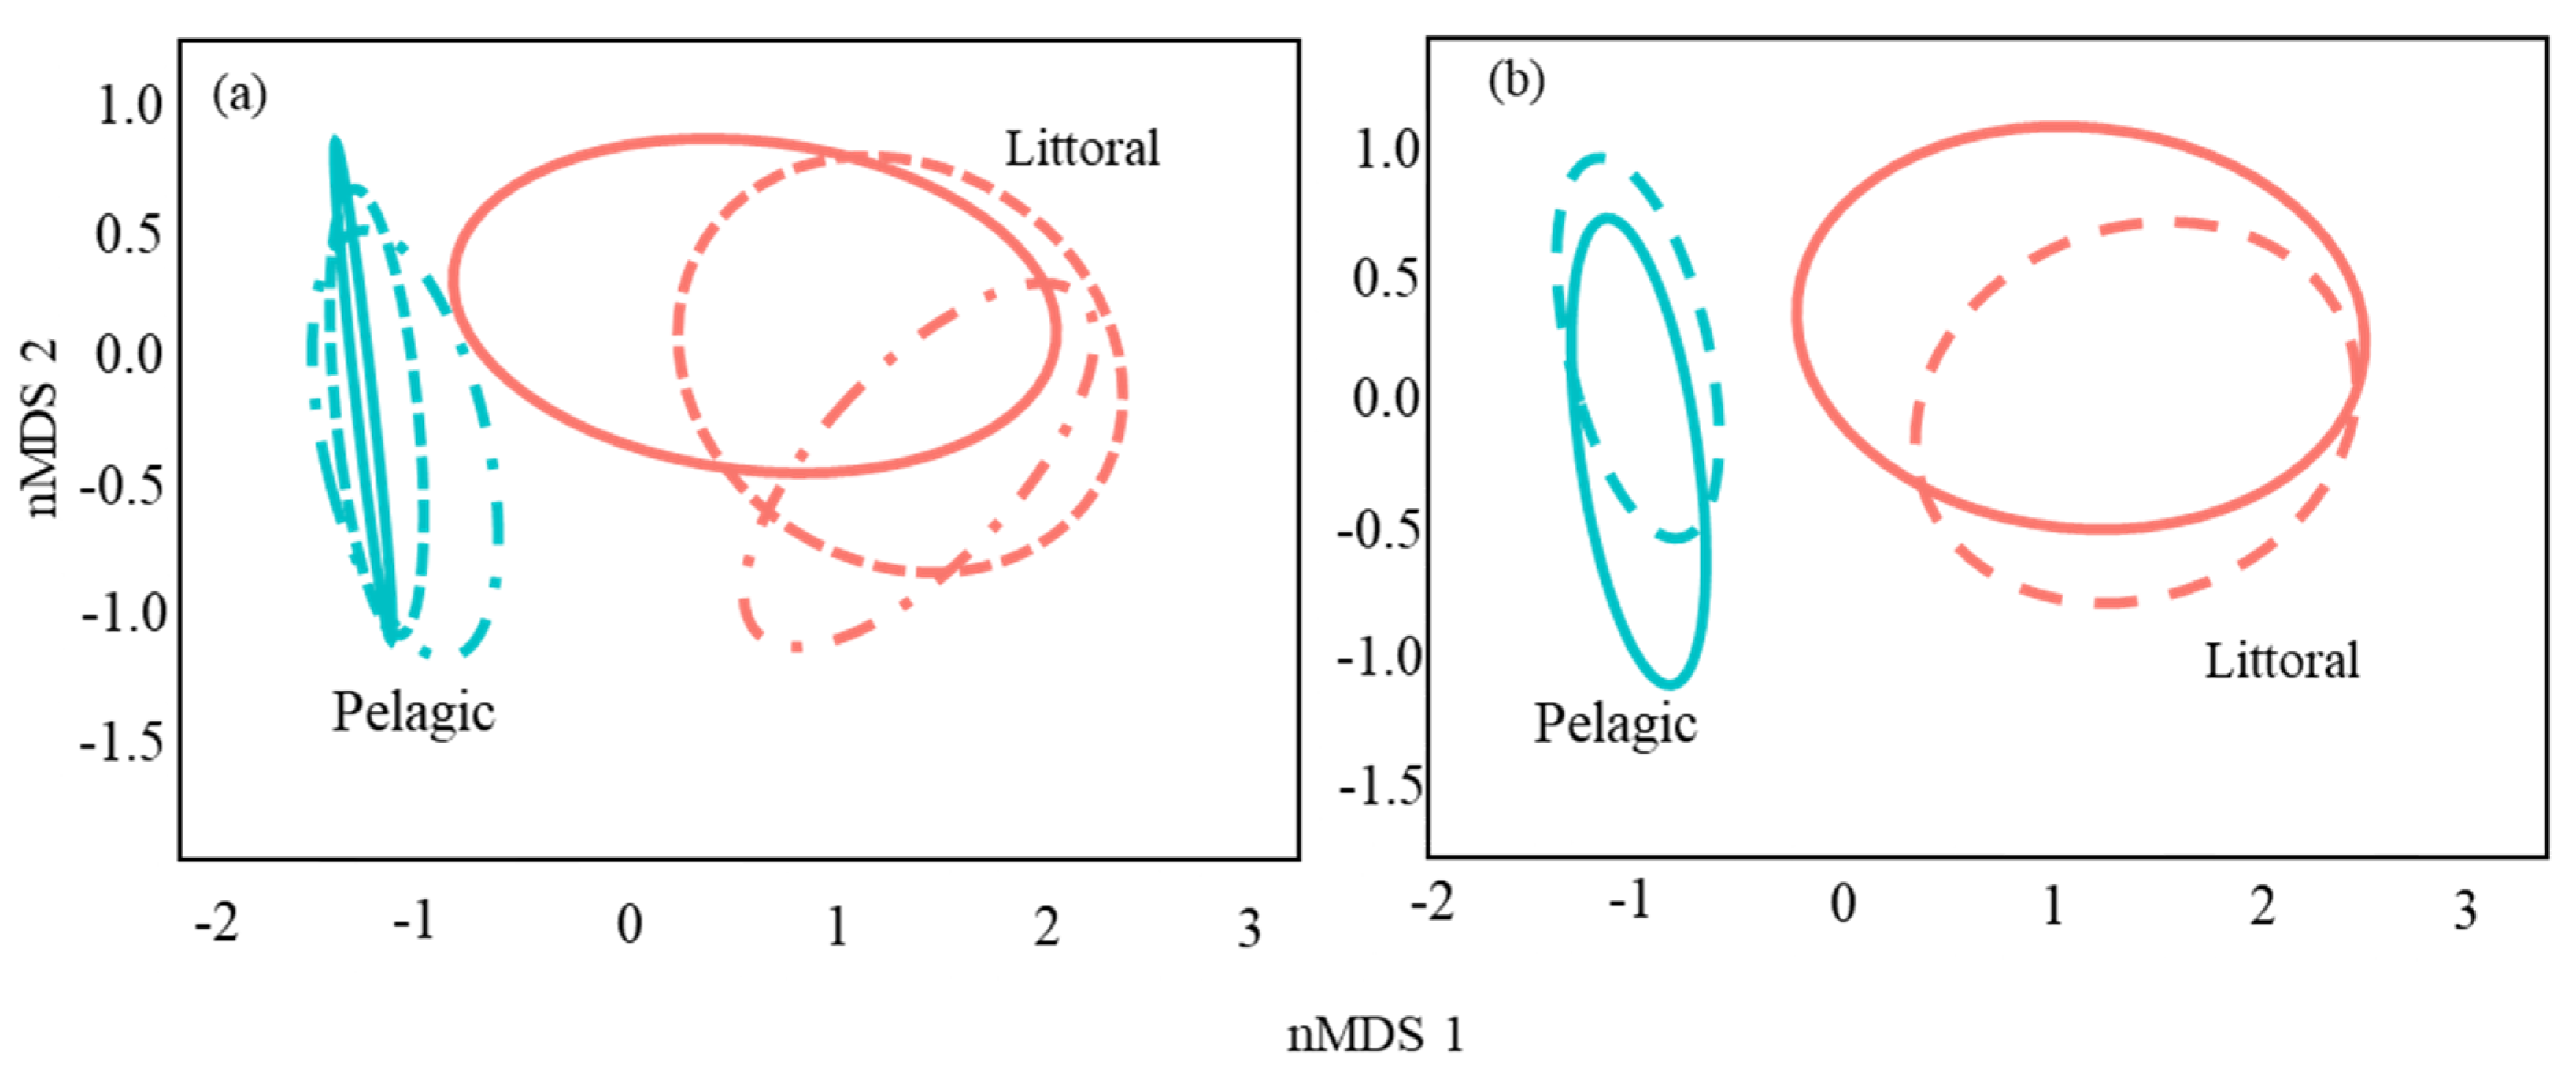
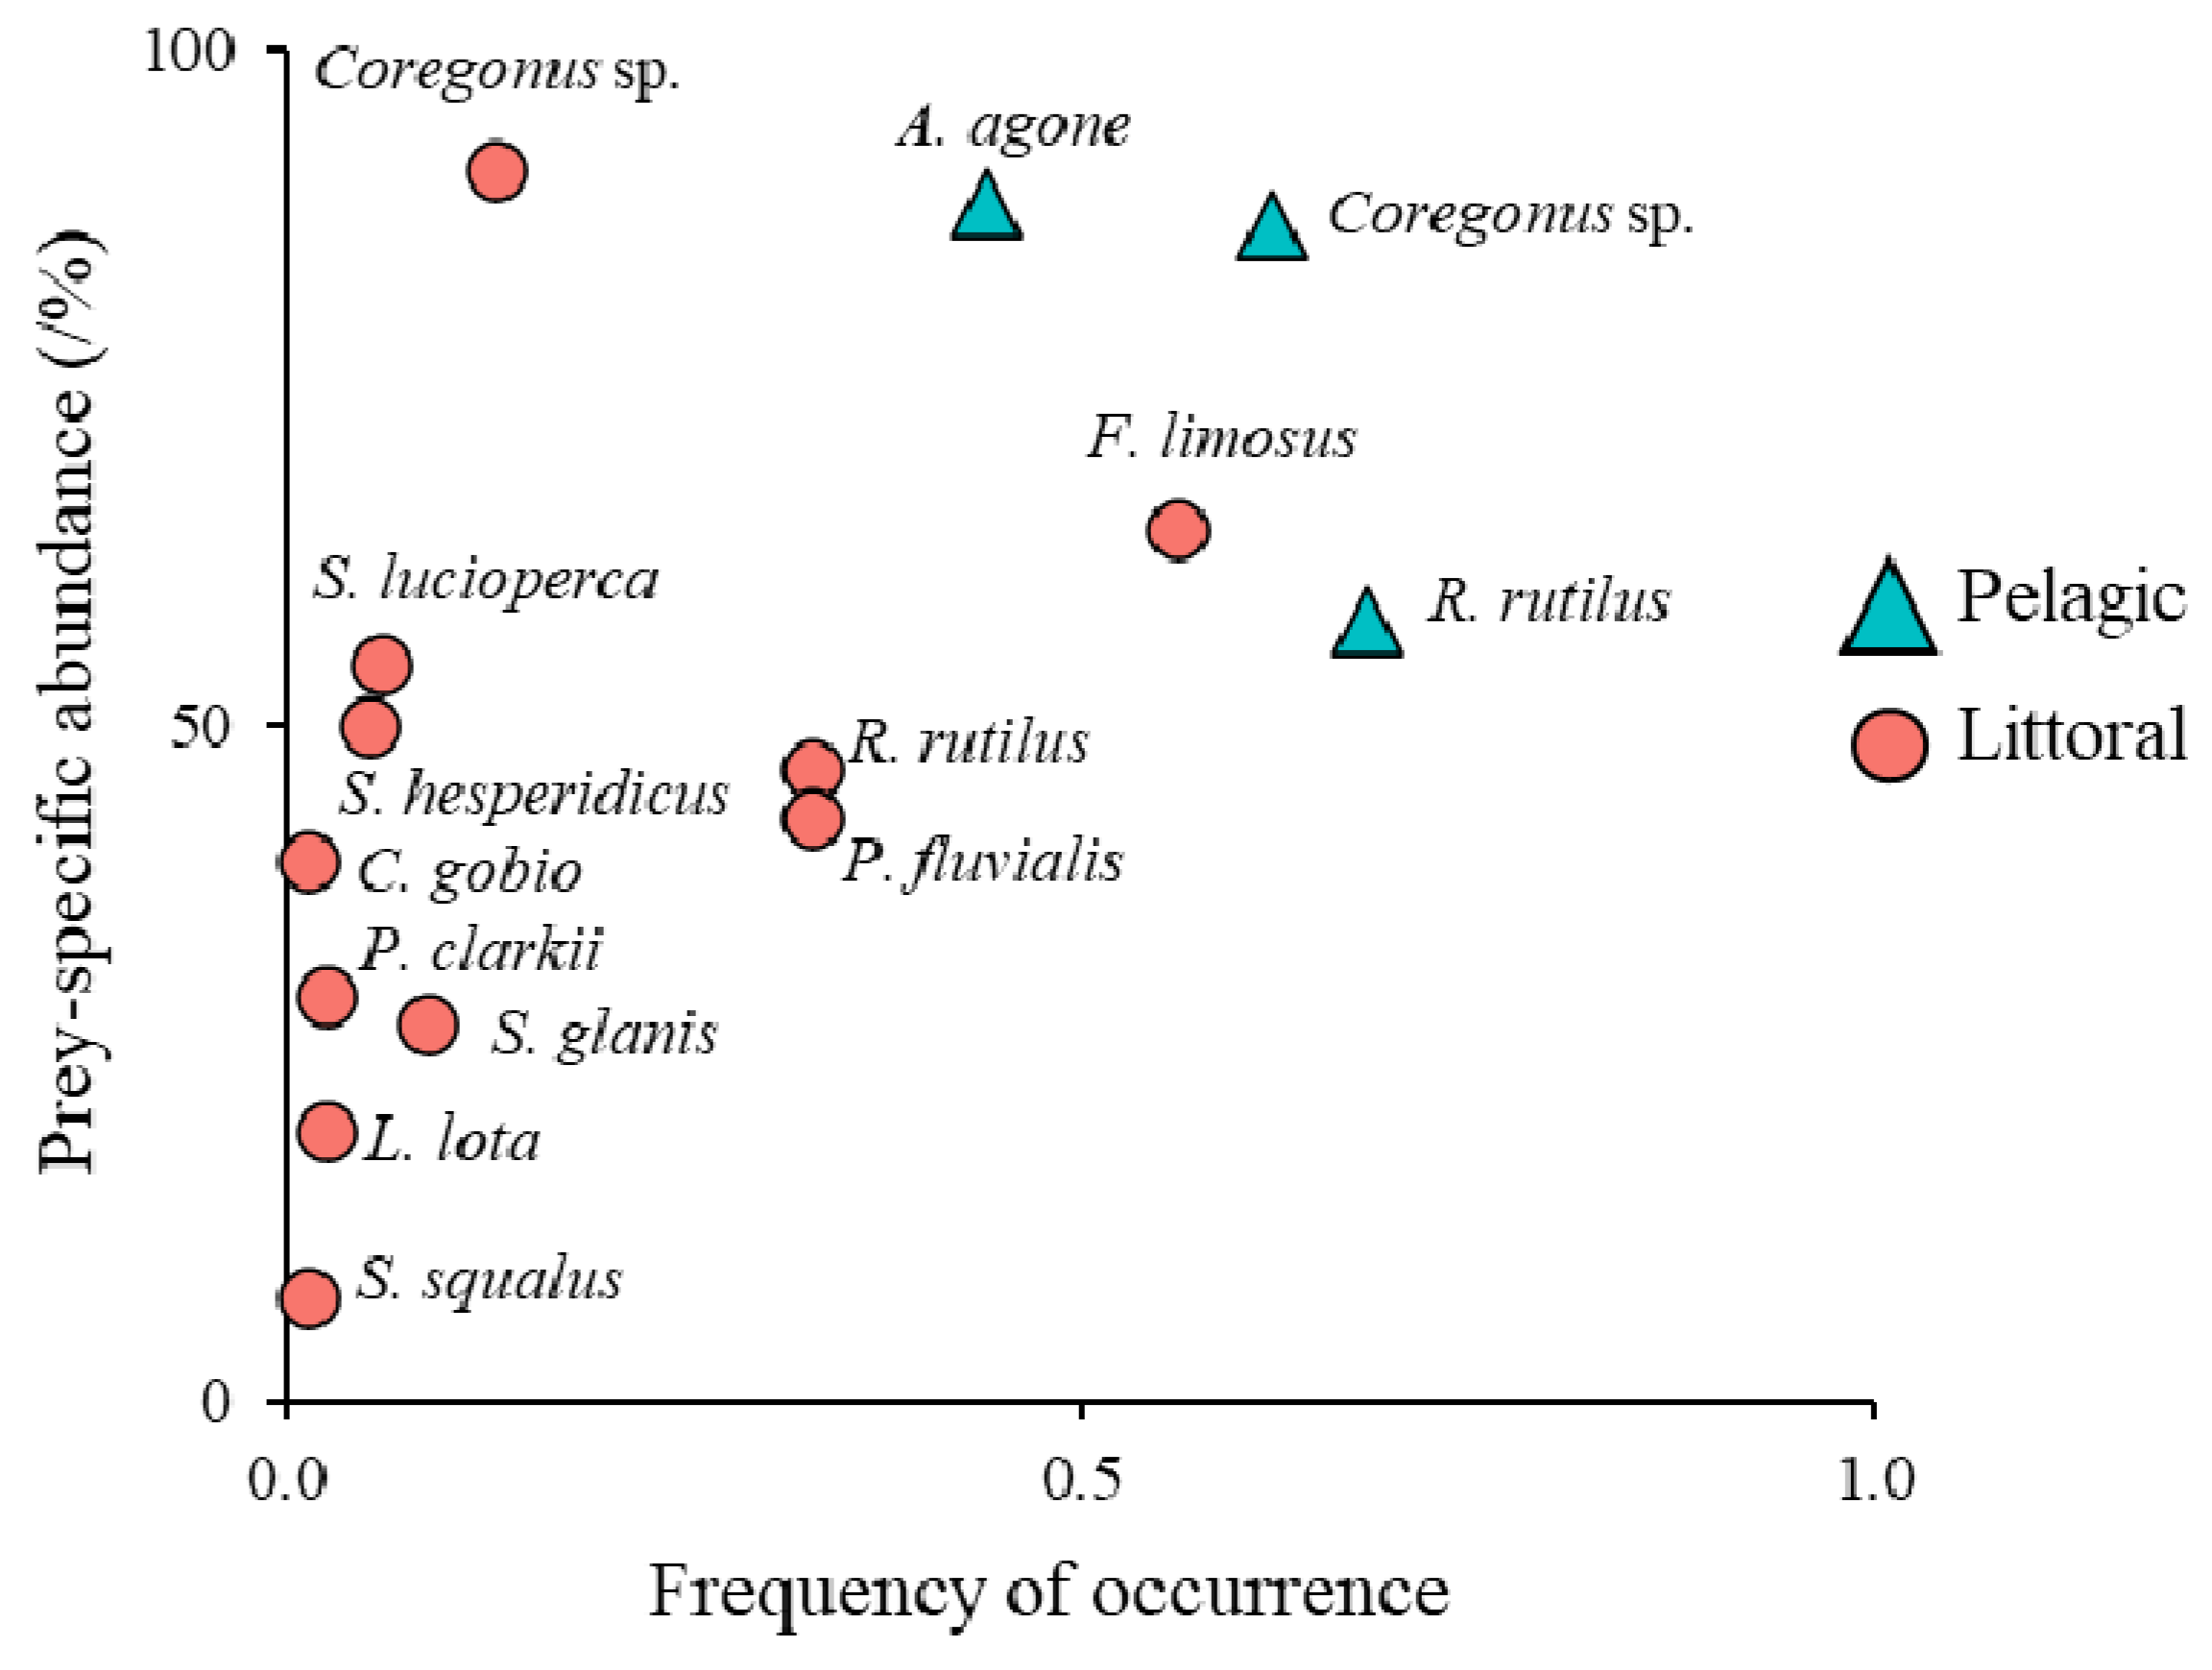
3.2. Catfish Diet Composition in Pelagic and Littoral Habitats

Of the 236 harvested catfish, 54 (VI = 22.8%) had their stomach empty and were thus discarded from further analyses. All the other fish had at least one identifiable food item in their stomach and were then considered in the analyses. Overall, a total of 581 prey items were counted, with a total estimated weight of 63 kg. The overall mean fulness index (FI) was 4.63%, with a minimum of 0.30% and a maximum of 35.0%. VI, FI, weight, and number of prey varied across sampling sites and months of capture, but the effect of these two variables was always negligible (p > 0.05) and therefore only comparisons between habitats and catfish size classes are presented (see supplementary material Table S3 for detailed dietary metrics for each habitat within each sampling site per month). VI was the lowest for Class I catfish caught in the littoral zone and the highest for Class 2 pelagic catfish (Table 2). FI was significantly lower in the pelagic habitat (F1, 178 = 11.48, p < 0.001) but did not vary significantly between size classes, both between (size class p = 0.37) and within (habitat × size class p = 0.67) habitats. Similarly, the average number of prey consumed by catfish was lower in pelagic than in littoral habitats (F1, 178 = 9.06, p = 0.002), with no differences according to catfish size (p = 0.51) and habitat × size class (p = 0.24). In contrast, the biomass of prey was significantly influenced by size class (F1, 178 = 14.38, p = 0.002) and did not vary significantly between or within habitats (habitat p = 0.83 and habitat × size class p = 0.86), indicating that, on average, larger catfish consumed less, yet larger, prey than littoral catfish.
The consumed prey belonged to 12 different species, two of which were exotic crayfish (Table 3). The remaining prey were fishes, with four of these being non-native species and also comprising other S. glanis (Table 3). The most frequent and abundant (both in terms of number and biomass) prey were coregonids Coregonus sp., followed by the land-locked shad Alosa agone (Scopoli, 1786) and the spiny-cheek crayfish Faxonius (formerly Onconectes) limosus (Rafinesque, 1817) (Table 3), with perch P. fluviatilis and roach R. rutilus also quite frequent and abundant, while the remaining species occurred only occasionally (%FO < 3.8%; Table 3) and were less abundant (%N < 1%; %W < 8.5%; Table 3). When considering these metrics per habitat type, a considerable difference was apparent, with only three prey species recorded in pelagic catfish, one of which (A. agone) was exclusively detected in these catfish (Table 3). Only two species were shared in both habitats, namely Coregonus sp. and R. rutilus, but with the first being predominant in the diet of pelagic catfish and the second in the diet of littoral catfish (Table 3). While the diet of pelagic catfish was also dominated by a high numeric and biomass abundance of A. agone, the diet of littoral catfish was dominated by a high number and frequency of F. limosus, P. fluviatilis, and R. rutilus. In terms of biomass, the diet of littoral catfish was more variable than that of pelagic catfish, with conspecific prey, for example, having a high contribution (%W = 19%; Table 3) despite being the least abundant in terms of number (%N = 2.3%). Subtle differences were instead apparent between size classes, where only a remarkably high frequency and biomass contribution of cannibalism (%F = 19% and %W = 33%) in class II littoral catfish were noted (see supplementary material Table S2).
This has resulted in a substantial differentiation of diet between the two habitat types, which was clearly visible in the nMDS graphs (Figure 4a,b). A multifactorial PERMANOVA confirmed that, although site, month of capture, and size class (and relative interactions) had a significant contribution to the observed variation in catfish diet, habitat type was the most informative variable (R2 = 0.25; Table 4).
The differences in the diet composition were reflective of contrasting feeding strategies between pelagic and littoral catfish (Figure 5). Examining the feeding strategy plot, it can be observed that the pelagic catfish were characterized by a high degree of population specialization, which suggests a restricted trophic niche. In contrast, the feeding strategy of littoral catfish appeared to be more mixed and suggests a wider trophic niche, with an individual contribution (i.e., individual predators specialized in the consumption of some rare species, such as Coregonus sp. and S. lucioperca) and a population specialization in F. limosus (Figure 5).

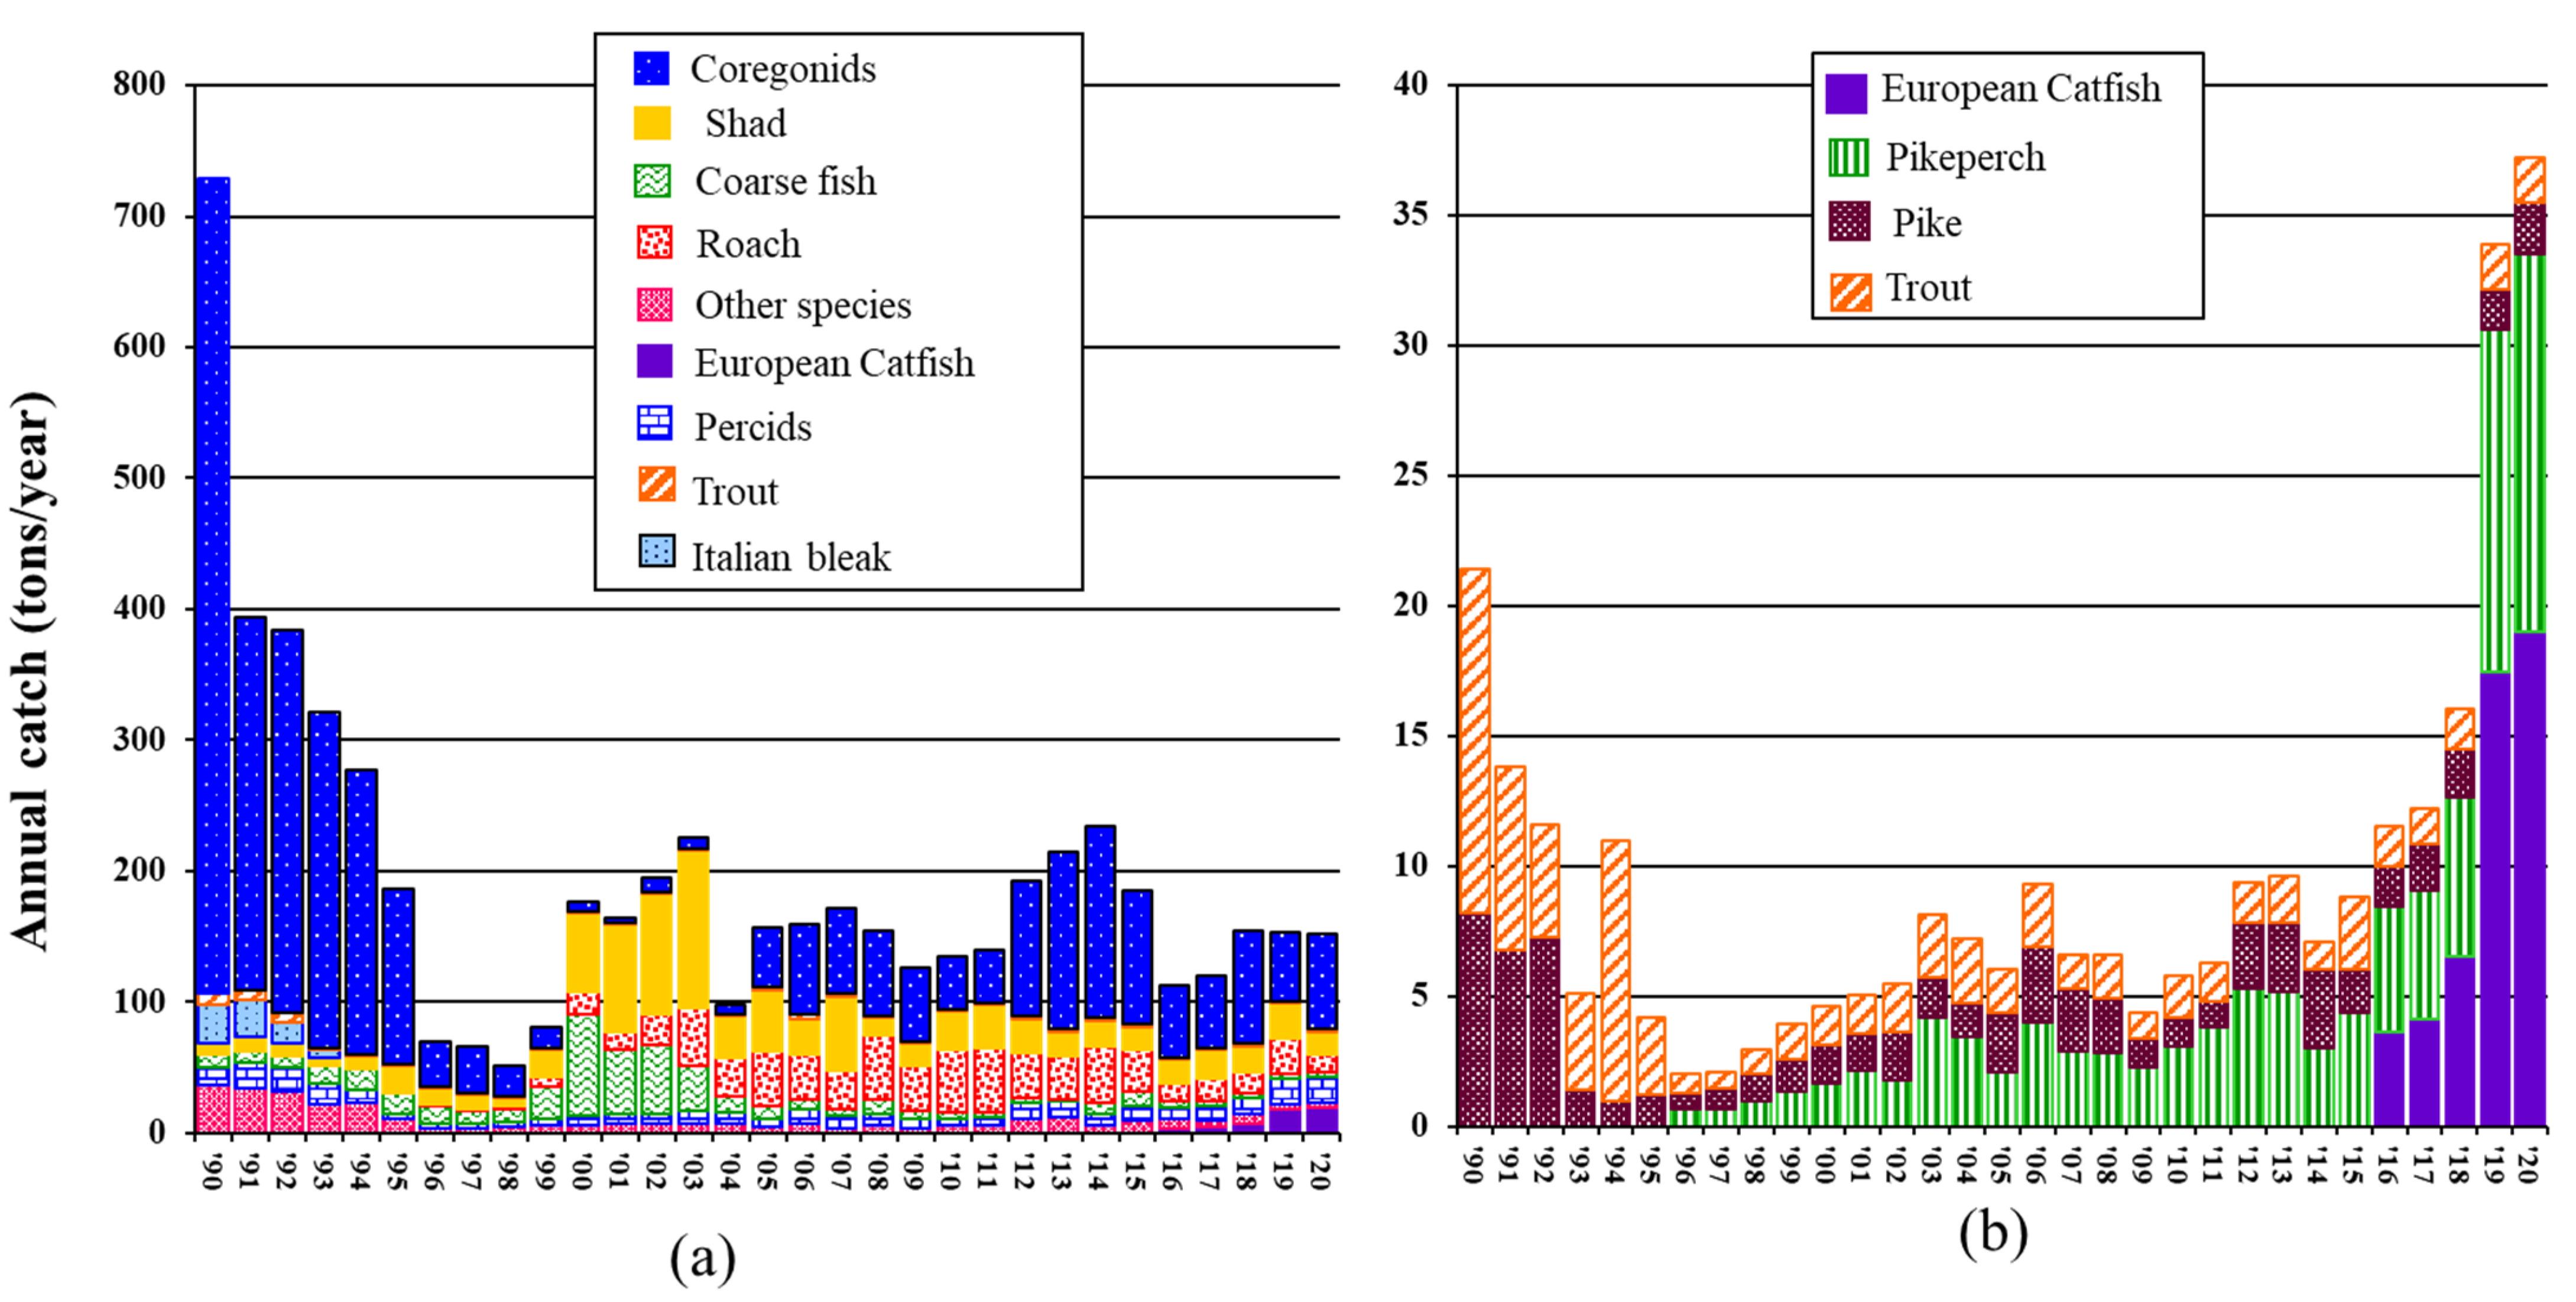
3.3. Trends in L. Maggiore’s Fishing Harvest during the 20 Years of Catfish Invasion

The total commercial fishing harvest in L. Maggiore declined markedly between 1995 and 1999, reaching the lowest amount of total catch in 1998 (52 tons; Figure 6a). Since the 2000s, catches increased again, but without reaching the high level of harvest observed in the beginning of the 1990s (>266 tons/year; Figure 6a). Across the 30 years examined, coregonids, shad, and roach dominated the catches. Changes were observed also in the composition of the catches, with coregonids dominating the catches until 1998 but then decreasing sharply between 1999 and 2004, when shad and coarse fish became dominant. Since 2005, coregonid catches started to increase again and kept dominating the harvest together with shad and roach (Figure 6a).
Notably, although S. glanis was first detected in 1990, it started to be significantly targeted by commercial fishermen only since 2016. Over only five years, the total annual harvest of catfish has quintuplicated, being 3.6 tons in 2016 and 19 tons in 2020 (Figure 6a,b). Similarly, the contribution of catfish to the total annual catch increased from 3.2–4.2% in 2016–2018 to 11.7% in 2019 and 12.5% in 2020.
Considering the total annual catches of predators only (Figure 6b), almost the same trend of the total catch was observed, except for the last four years, when the contribution of S. glanis reached a peak, particularly in 2019 and 2020 (Figure 6b). As for the other predators, pike and trout were the only two predators dominating the commercial harvest until 1995. In 1996, pikeperch started to become targeted by commercial fishermen, and its contribution has increased continuously since then. In contrast, trout and pike catches, after an initial decline, remained quite constant (Figure 6b).

4. Discussion

The trophic ecology of S. glanis has been studied mostly in eutrophic lakes and reservoirs or large rivers, and this is the first work addressing the diet of catfish in a deep oligotrophic and large lake such as L. Maggiore, particularly during winter, when the species is thought to be least active [60,61]. Despite its bottom-dweller aspect, our data showed that catfish in L. Maggiore can utilize both pelagic and littoral habitats and rely, at least in the short term, on the distinct resources available in the two compartments. Moreover, the largest catfish are more likely to migrate in pelagic habitats for feeding where their opportunistic top-predator behavior may alter ecological equilibria and associated ecosystem services.
In late autumn/early winter 2019, the relative abundance and biomass of pelagic catfish were lower than that of littoral catfish (except at one site), and generally higher in November than in December and January. These results suggest that there is a potential segregation in habitat occupation between size classes, with larger individuals (>100 cm) prevailing in the open waters (pelagic habitats) and medium-sized ones (<100 cm) occurring more evenly in the littoral zone. However, this segregation is seasonal. This is in agreement with previous studies on depth and temperature migrations of European catfish, which found that the species’ movement varies with seasons [32,62] and between juveniles and adults [60]. The higher abundance of catfish in the pelagic zone observed in November may be consistent with Capra et al. [32], reporting movements of catfish being frequent when the temperature is comprised between 15 and 24 °C, while decreasing at lower temperatures. In the studied period, the temperature data of the deepest point of the lake showed that the temperature in November 2019 was around 15 °C within the first 10 m (Figure 1c), while it decreased to <10 °C along the entire water column in December and January. The dispersal of larger individuals into the pelagic zone found in this study, instead, is in contrast with previous studies in which smaller individuals were found to be more prone to dispersion [60,63]. However, different factors may influence S. glanis’ movements [63], including social interactions with conspecifics which were not considered in this study. In addition, the different average size of catfish caught in the two habitats may have been influenced by the mesh size of the used gillnets, larger in pelagic (80 mm) than in littoral (60 mm) habitats. Nevertheless, as per their body shape, catfish tend to remain tangled in the gillnets by the ray of the pectoral fins rather than gilled or wedged, potentially reducing the selectivity of the mesh size [64]. Furthermore, this habitat segregation was not observed at all study sites, and, even where it was observed, some overlaps in total length between littoral and pelagic catfish were present. This highlights that the complex behavioral ecology of catfish needs to be further investigated, particularly in the invaded range [12].
The segregation into pelagic and littoral habitats was also reflected in the distinct diet and feeding strategy of catfish caught in the two compartments, investigated through stomach content analyses. Among the different variables considered, such as size class, site, and month of capture, habitat type seemed to be the best explanatory variable. Although many studies reported difficulties in studying European catfish diet through stomach content analyses due to a high rate of stomach emptiness [21,25], and despite considering the season of least activity of the species, the percentage of empty stomachs was lower than in other studies and comparable to periods of high activity [20,21,27,65] with the fulness index, used as a proxy of fish activity, also having a ratio similar to that observed in the Arno River in spring [25]. Thus, even though there was a likely effect of temperature (considered as month of capture) on the dispersal of catfish, it did not affect the diet composition nor the feeding activity of the fish, at least in the study period. Diet is known to change with ontogeny in S. glanis, but we observed little variation in diet composition between size classes, with catfish body size influencing mainly the biomass (%W) and therefore the size of the prey ingested, with larger individuals consuming larger prey, as observed elsewhere [26]. Some differences were, however, apparent in the littoral catfish, with a decrease in the importance of F. limosus in Class II individuals coupled with an increase in the frequency and biomass contribution of prey fish (i.e., pikeperch, rudd) and cannibalism, with the latter potentially indicating a paucity of resources available for Class II individuals in the littoral habitat [15]. However, the size of the analyzed catfish lacking smaller individuals (total lengths <67 cm) and the unbalanced sample number per size class in each habitat have probably prevented us to detect any significant effect of ontogeny on the diet. Therefore, habitat type emerged as the most important variable explaining the difference in the diet of pelagic vs. littoral catfish, with the diet of the former being constituted by only three items (coregonids, shad, and roach), toward which the population has specialized. Littoral catfish had instead a more diverse diet, with 11 prey species detected, although with a high degree of specialization toward the invasive crayfish F. limosus. As no measures of prey availability were done in this study, it was not possible to evaluate whether this specialization was a case of prey selection, but it is likely that catfish consumed, opportunistically, the most common prey. In fact, there is a good correspondence between the most abundant prey fish found in pelagic and littoral catfish with pelagic and littoral fish assemblages detected in a previous survey in Lake Maggiore [46]. Moreover, the invasive crayfish, which dominated the diet of littoral catfish, can have a locally abundant population, contributing substantially to the diet of littoral fishes [66], besides being a staple prey of S. glanis also in its native range [67]. Although these results are thus plausible, caution should be applied since some biases may have affected diet composition inferences. In particular, during the long permanence of catfish in the nets (from dusk to dawn), some prey items might have been already digested and thus missed. Similarly, the discard of highly digested material may have led to some underestimation of prey abundance and presence.
Considering that larger individuals were more likely to occur in the pelagic zone and that diet was composed of resources distinct from those of littoral catfish, our results suggest that these catfish likely migrate into the pelagic zone to feed, at least in late autumn/early winter. European catfish movements are mainly associated with the search for prey and spawning or pre-spawning needs [62,68,69]. As the spawning of S. glanis takes place in vegetated waters [70] and when temperature reaches 18–22 °C [71], then, considering the temperature of the study period, spawning should have been in June, and thus we can exclude that the observed movements were associated to reproduction. The search for food is thus a valid explanation of the movement of catfish into the pelagic compartment. This interpretation is also consistent with previous studies documenting, through stable isotope analysis, a resource use shift (as the primary production sources indicated by the stable isotope ratio of carbon) in large-bodied catfish [21,23].
Although our sampling strategy did not allow us to test for vertical migrations (i.e., gillnets were set to similar depth in both habitats), it is also possible that catfish caught in the pelagic habitat actually live in the profundal benthic zone and ascend to the top for feeding. In fact, fish vertical migrations that couple benthic and pelagic food webs are common both in freshwater [72] and in marine benthic species [73].
The reason for this behavior may be a context-dependent response of catfish to higher prey availability in the pelagic compartment, or it may be an adaptive behavior that has contributed to the successful invasion of L. Maggiore. Due to the limited spatial (only 3 sites in the central part of the lake) and temporal (3 months) coverage of this study, it was not possible to speculate further on which of the two processes may have been involved, but the study has settled the basis for future studies able to address this important question.
Another important finding that emerged in this study is the potential new predation pressure that S. glanis may pose, especially to the pelagic habitat of L. Maggiore. In fact, the native pelagic compartment of the lake has few native predators, with large lake trout being the only native pelagic predator but migrating for reproduction in rivers at the beginning of autumn, and pike being predominantly a littoral species. The top-predator nature of S. glanis has often been questioned due to its high trophic plasticity [15,16,74], but our data suggest that, in L. Maggiore, pelagic catfish are exploiting mainly planktivorous fish species (coregonids and shads), thus potentially raising a new top-down pressure which may add to that of pikeperch and trout [75], especially on relatively large fish. Although in the native range, the predation pressure of S. glanis is considered to be limited [76], and in most invaded areas the species feeds mainly on non-native species, limiting its impact on native communities [15]. The low abundance of native pelagic predators in L. Maggiore suggests that S. glanis has the potential to alter fish population dynamics and, possibly, cause consequent cascade effects on pelagic food webs that need to be further investigated. However, our data were only limited to a short period of time, and thus, for a more comprehensive understanding of the invasion mechanism of S. glanis in oligotrophic and deep lakes, it is necessary to extend the study of its trophic ecology to a wider spatial and temporal scale, potentially including also trophic interactions with the other top-predators and with measures of prey availability.
Besides the ecological impacts, the species may also have an impact on the lakes’ ecosystem services, deriving from professional fisheries. Our preliminary data on the role of catfish harvest on catches in the 30 years of S. glanis invasion showed that the species started to become a fishery target only recently (i.e., in the last five years). However, in a few years, the total catfish harvest quintuplicated, and so did its proportional contribution to the total fish harvest (from 3.2% in 2016 to 12.5% in 2020), indicating that commercial fisheries may benefit from harvesting catfish. This is not surprising given that the importance of S. glanis for both recreational and professional angling is increasingly recognized [13] and that catfish populations in their native range cannot reach a carrying capacity due to the high angling pressure [15,48]. However, our data showed that the fish harvest in Lake Maggiore is dominated by those species that were also most consumed by catfish, like coregonids. Since catfish is sold at a considerably lower raw price than coregonids (1 euro kg−1 vs. 6 euro kg−1), our results highlight a possible contrasting role of catfish for professional angling in Lake Maggiore which should be investigated further through a more comprehensive and quantitative study on catfish trophic ecology and economic balances.
Commercial fisheries’ data must be interpreted with caution, as they do not strictly reflect the natural variations in abundances and population dynamics of fishes in the ecosystem. The trends of the commercial harvest observed in this study also reflected, in fact, socio-political and economic events. For example, the decline in the total annual catches of coregonids between 1996 and 2004 is the consequence of a fishing ban due to DDT pollution [39,77] that led to the dramatic decrease of the number of professional fishermen [34]. The fact that catfish have started to be targeted only since 2016 may be itself a consequence of market interests rather than a proxy of its abundance. This has thus prevented us to make any further investigation on the impacts of catfish on the total harvest of fish in L. Maggiore. Nevertheless, these data are still of value, as they provide, in most cases, the only long-term information available for fish populations in large ecosystems like L. Maggiore. Moreover, this work has allowed us to underline the contrasting role that S. glanis may have on fisheries, highlighting the need of further investigations for a better management of the lake’s fishery.
The ecological and economic impacts of European catfish may be more intense in the future, due to global warming. One of the latest climatic predictions on the Lake Maggiore basin [78] forecasted an increase of the average air temperature from 1.7° (best scenario) to 4 °C (worst scenario) by the end of the century. While the effect of rising air temperatures may be dampened with depth, there is evidence that in the first 70 m of depth, water temperatures follow the trend of air temperatures, with a predicted warming up to >3 °C by 2085, which is variable according to the considered scenario [79]. Warmer temperatures may boost the invasion potential of alien species [11] by increasing their feeding, growth, and reproduction rates [80,81]. Signs of this have been already detected for some species in Lake Maggiore and adjacent lakes in the past three decades [47,49,82]. This may be particularly true for European catfish, whose optimal growth temperature is comprised between 25 and 28 °C [15] and whose highest feeding activity is meant to be at temperatures >17 °C [83]. Thus, at the actual temperature, the optimal growth and foraging activity of S. glanis are likely to be restricted to the warmest season (July to October), but the rising of water temperatures may extend this period, leading to a faster growth of the species and a potential higher foraging activity. The warming temperatures in L. Maggiore’s basin may also allow the species to colonize habitats previously inaccessible due to low temperatures [33], such as some major tributaries of the lake (e.g., Toce River). Therefore, the quantification and monitoring of the impacts of predators such as European catfish are also fundamental in view of global warming.

5. Conclusions

Thanks to the collaboration of commercial fishermen, this study has provided novel important information on the ecology of the invasive S. glanis in Lake Maggiore, highlighting how catfish of different size classes can make a different use of the different habitats of the invaded ecosystem. Moreover, it underlines the need to further investigate the potential top-down pressure of the species, especially on the pelagic food web and the possible contrasting role of the species for commercial fishery. Although some biases may have influenced the results (e.g., the lack of catfish of smaller size and potential missing information on stomach content data), the study has strongly benefited from the involvement of fishermen as citizen scientists, without whom it would not have been possible to obtain such information due to logistic (i.e., difficulties in catching catfish in such a big ecosystem) constraints. This confirms that the involvement of fishermen, and citizen scientists in general, in biological invasions studies [84,85] is crucial, and it has a double outcome: raising awareness about the impacts of fish introduction and, on the other side, extend scientific knowledge. In the future, more fishermen should be involved, to extend the spatial and temporal scale covered in this study.

Supplementary Materials

The following are available online at https://www.mdpi.com/article/10.3390/w13182549/s1, Figure S1: Distribution of Silurus glanis in the main Italian hydrological basins. Highlighted in red, where the species is established: 1 = Po; 2 = Adige; 3 = Tagliamento; 4 = Isonzo; 5 = Sile; 6 =Brenta; 7 =Canalbianco; 8 = Serchio; 9 = Reno; 10 = Arno; 11 = Ombrone; 12 = Tevere; 13 = Aterno-Pescara; 14 = Volturno.; Table S1: Linear regression parameters of length–weight relations (LWRs) of prey fish species calculated from an internal database of length and weight of fish species sampled in different Italian lakes from 2007 to 2014; Table S2: Feeding intensity (as Vacuity index, VI%) and amount of food ingested (as Fullness index, FI %) together with the number and biomass of prey at each sampling site and for each of the two size classes (Class I < 100 cm and Class II > 100 cm) per month of capture of catfish caught in littoral and pelagic habitats of L. Maggiore; Table S3: List of the 12 prey species composing catfish diet and relative frequency of occurrence (FO%), numeric (N%), and biomass (W%) abundance for each catfish size class in each habitat.

Author Contributions

Conceptualization, P.V. and V.D.S.; methodology, P.V. and V.D.S.; formal analysis, V.D.S.; resources, P.V. and V.D.S.; data curation, V.D.S. and P.V.; writing—original draft preparation, V.D.S.; writing—review and editing, P.V.; supervision, P.V.; project administration, P.V.; funding acquisition, P.V. All authors have read and agreed to the published version of the manuscript.

Funding

V.D.S. and P.V. were supported by LIFE15 NAT/IT/000823 IdroLIFE Project and Interreg ITA-CH SHARESALMO (Grant no. 599030).

Institutional Review Board Statement

Ethical review and approval were waived for this study because the fish analyzed were from professional fishery.

Data Availability Statement

Data can be made available upon request from the corresponding author.

Acknowledgments

We are particularly thankful to the professional fishermen who caught catfish and collected stomach content data for the dietary analyses. We also wish to thank the CIPAIS and the CISPP for providing water temperature and fish harvest data.

Conflicts of Interest

The authors declare no conflict of interest.

References

  1. Conser, C.; Seebacher, L.; Fujino, D.W.; Reichard, S.; DiTomaso, J.M. The development of a plant risk evaluation (PRE) tool for assessing the invasive potential of ornamental plants. PLoS ONE 2015, 10, e0121053. [Google Scholar] [CrossRef]
  2. Copp, G.H.; Vilizzi, L.; Tidbury, H.; Stebbing, P.D.; Tarkan, A.S.; Miossec, L.; Goulletquer, P. Development of a generic decision-support tool for identifying potentially invasive aquatic taxa: AS-ISK. Manag. Biol. Invasions 2016, 7, 343–350. [Google Scholar] [CrossRef] [Green Version]
  3. Dick, J.T.; Laverty, C.; Lennon, J.J.; Barrios-O’Neill, D.; Mensink, P.J.; Robert Britton, J.; Médoc, V.; Boets, P.; Alexander, M.E.; Taylor, N.G.; et al. Invader Relative Impact Potential: A new metric to understand and predict the ecological impacts of existing, emerging and future invasive alien species. J. Appl. Ecol. 2017, 54, 1259–1267. [Google Scholar] [CrossRef]
  4. Matthews, J.; Beringen, R.; Creemers, R.; Hollander, H.D.; Kessel, N.V.; Kleef, H.V.; van de Koppel, S.; Lemaire, A.J.J.; Baudewijn, O.; Verbrugge, L.N.H.; et al. A new approach to horizon-scanning: Identifying potentially invasive alien species and their introduction pathways. Manag. Biol. Invasions 2017, 8, 37–52. [Google Scholar] [CrossRef] [Green Version]
  5. Britton, J.R.; Gutmann Roberts, C.; Amat Trigo, F.; Nolan, E.T.; De Santis, V. Predicting the ecological impacts of an alien invader: Experimental approaches reveal the trophic consequences of competition. J. Anim. Ecol. 2019, 88, 1066–1078. [Google Scholar] [CrossRef]
  6. Vilizzi, L.; Copp, G.H.; Hill, J.E.; Adamovich, B.; Aislabie, L.; Akin, D.; Al-Faisal, A.J.; Almeida, D.; Azmai, M.A.; Bakiu, R.; et al. A global-scale screening of non-native aquatic organisms to identify potentially invasive species under current and future climate conditions. Sci. Total Environ. 2021, 788, 147868. [Google Scholar] [CrossRef] [PubMed]
  7. Copp, G.H.; Garthwaite, R.; Gozlan, R.E. Risk identification and assessment of non-native freshwater fishes: A summary of concepts and perspectives on protocols for the UK. J. Appl. Ichthyol. 2005, 21, 371–373. [Google Scholar] [CrossRef]
  8. Ricciardi, A.; Hoopes, M.F.; Marchetti, M.P.; Lockwood, J.L. Progress toward understanding the ecological impacts of nonnative species. Ecol. Monogr. 2013, 83, 263–282. [Google Scholar] [CrossRef] [Green Version]
  9. Boets, P.; Laverty, C.; Fukuda, S.; Verreycken, H.; Green, K.; Britton, R.J.; Caffrey, J.; Goethals, P.L.M.; Pegg, J.; Médoc, V.; et al. Intra-and intercontinental variation in the functional responses of a high impact alien invasive fish. Biol. Invasions 2019, 21, 1751–1762. [Google Scholar] [CrossRef]
  10. Grimm, J.; Dick, J.T.; Verreycken, H.; Jeschke, J.M.; Linzmaier, S.; Ricciardi, A. Context-dependent differences in the functional responses of conspecific native and non-native crayfishes. NeoBiota 2020, 54, 71–88. [Google Scholar] [CrossRef]
  11. Ricciardi, A.; Iacarella, J.C.; Aldridge, D.C.; Blackburn, T.M.; Carlton, J.T.; Catfors, J.A.; Dick, J.T.A.; Hulme, P.E.; Jeschke, J.M.; Liebhold, A.M.; et al. Four priority areas to advance invasion science in the face of rapid environmental change. Environ. Rev. 2021, 29, 119–141. [Google Scholar] [CrossRef]
  12. Cucherousset, J.; Horky, P.; Slavík, O.; Ovidio, M.; Arlinghaus, R.; Boulêtreau, S.; Britton, R.; García-Berthou, E.; Santoul, F. Ecology, behaviour, and management of the European catfish. Rev. Fish Biol. Fish. 2018, 28, 177–190. [Google Scholar] [CrossRef] [Green Version]
  13. Lyach, R.; Remr, J. Changes in recreational catfish Silurus glanis harvest rates between years 1986–2017 in Central Europe. J. Appl. Ichthyol. 2019, 35, 1094–1104. [Google Scholar] [CrossRef]
  14. Proteau, J.-P.; Hilge, V.; Linhart, O. État actuel et perspectives de la production aquacole des poissons-chats (Siluroidei) en Europe. Aquat. Living Res. 1996, 9, 229–235. [Google Scholar] [CrossRef]
  15. Copp, G.H.; Robert Britton, J.; Cucherousset, J.; García-Berthou, E.; Kirk, R.; Peeler, E.; Stakėnas, S. Voracious invader or benign feline? A review of the environmental biology of European catfish Silurus glanis in its native and introduced ranges. Fish Fish. 2009, 10, 252–282. [Google Scholar] [CrossRef]
  16. Carol, J.; Benejam, L.; Benito, J.; García-Berthou, E. Growth and diet of European catfish (Silurus glanis) in early and late invasion stages. Fundam. Appl. Limnol. 2009, 174, 317–328. [Google Scholar] [CrossRef]
  17. Castaldelli, G.; Pluchinotta, A.; Milardi, M.; Lanzoni, M.; Giari, L.; Rossi, R.; Fano, E.A. Introduction of exotic fish species and decline of native species in the lower Po basin, north-eastern Italy: The decline of native fish species in the lower Po basin. Aquat. Conserv. 2013, 23, 405–417. [Google Scholar] [CrossRef]
  18. Vejřík, L.; Vejříková, I.; Kočvara, L.; Sajdlová, Z.; Hoang The, S.C.; Šmejkal, M.; Peterka, J.; Čech, M. Thirty-year-old paradigm about unpalatable perch egg strands disclaimed by the freshwater top-predator, the European Catfish (Silurus glanis). PLoS ONE 2017, 12, e0169000. [Google Scholar] [CrossRef] [PubMed] [Green Version]
  19. Guillerault, N.; Bouletreau, S.; Iribar, A.; Valentini, A.; Santoul, F. Application of DNA metabarcoding on faeces to identify European catfish Silurus glanis diet: DNA metabarcoding of S. glanis faeces. J. Fish Biol. 2017, 90, 2214–2219. [Google Scholar] [CrossRef] [PubMed]
  20. Vejřík, L.; Vejříková, I.; Blabolil, P.; Eloranta, A.P.; Kočvara, L.; Peterka, J.; Sajdlová, Z.; Chung, S.H.T.; Šmejkal, M.; Kiljunen, M.; et al. European catfish (Silurus glanis) as a freshwater apex predator drives ecosystem via its diet adaptability. Sci. Rep. 2017, 7, 15970. [Google Scholar] [CrossRef] [PubMed]
  21. Syväranta, J.; Cucherousset, J.; Kopp, D.; Crivelli, A.; Céréghino, R.; Santoul, F. Dietary breadth and trophic position of introduced European catfish Silurus glanis in the River Tarn (Garonne River basin), southwest France. Aquat. Biol. 2010, 8, 137–144. [Google Scholar] [CrossRef]
  22. Reading, A.J.; Britton, J.R.; Davies, G.D.; Shinn, A.P.; Williams, C.F. Introduction and spread of non-native parasites with Silurus glanis L. (Teleostei: Siluridae) in UK fisheries. J. Helminthol. 2012, 86, 510–513. [Google Scholar] [CrossRef] [PubMed]
  23. Rees, A. The Impact of Introduced European Catfish (Silurus glanis L.) in UK Waters: A Three Pond Study. Ph.D. Thesis, University of Hertfordshire, Hatfield, UK, May 2020. [Google Scholar]
  24. Cucherousset, J.; Boulêtreau, S.; Azémar, F.; Compin, A.; Guillaume, M.; Santoul, F. “Freshwater killer whales”: Beaching behavior of an alien fish to hunt land birds. PLoS ONE 2012, 7, e50840. [Google Scholar] [CrossRef] [PubMed] [Green Version]
  25. Haubrock, P.J.; Azzini, M.; Balzani, P.; Inghilesi, A.F.; Tricarico, E. When alien catfish meet—Resource overlap between the North American Ictalurus punctatus and immature European Silurus glanis in the Arno River (Italy). Ecol. Freshw. Fish 2020, 29, 4–17. [Google Scholar] [CrossRef] [Green Version]
  26. Ferreira, M.; Gago, J.; Ribeiro, F. Diet of European Catfish in a newly invaded region. Fishes 2019, 4, 58. [Google Scholar] [CrossRef] [Green Version]
  27. Alp, A. Diet shift and prey selection of the native European catfish, Silurus glanis, in a Turkish reservoir. J. Limnol. Freshw. Fish. Res. 2017, 3, 15–23. [Google Scholar] [CrossRef]
  28. Manfredi, P. Cattura di un Silurus glanis nell’Adda Presso Lecco; Natura, Società Italiana Scienze Naturali e del Museo Civico di Storia Naturale, Acquario Civico Milano: Milano, Italy, 1957; pp. 28–30. [Google Scholar]
  29. Gandolfi, G.; Giannini, M. La Presenza del Silurus glanis nel Fiume Po (Osteichthyes, Siluridae); Natura, Società Italiana Scienze Naturali e del Museo Civico di Storia Naturale, Acquario Civico Milano: Milano, Italy, 1979; pp. 3–6. [Google Scholar]
  30. Cerri, J.; Ciappelli, A.; Lenuzza, A.; Zaccaroni, M.; Nocita, A. Recreational angling as a vector of freshwater invasions in Central Italy: Perceptions and prevalence of illegal fish restocking. Knowl. Manag. Aquat. Ecosyst. 2018, 419, 38. [Google Scholar] [CrossRef]
  31. Specchi, M.; Pizzul, E. First observations of Silurus glanis (L. 1758) in the streams of the Isonzo basin (North-eastern Italy) (Osteichthyes, Siluridae). In Gortania; Atti del Museo Friulano di Storia Naturale di Udine: Udine, Italy, 1994; pp. 213–216. [Google Scholar]
  32. Capra, H.; Pella, H.; Ovidio, M. Individual movements, home ranges and habitat use by native rheophilic cyprinids and non-native catfish in a large regulated river. Fish. Manag. Ecol. 2018, 25, 136–149. [Google Scholar] [CrossRef] [Green Version]
  33. Britton, J.R.; Cucherousset, J.; Davies, G.D.; Godard, M.J.; Copp, G.H. Non-native fishes and climate change: Predicting species responses to warming temperatures in a temperate region. Freshw. Biol. 2010, 55, 1130–1141. [Google Scholar] [CrossRef]
  34. Volta, P.; Jeppesen, E.; Sala, P.; Galafassi, S.; Foglini, C.; Puzzi, C.; Winfield, I.J. Fish assemblages in deep Italian subalpine lakes: History and present status with an emphasis on non-native species. Hydrobiologia 2018, 824, 255–270. [Google Scholar] [CrossRef]
  35. Salmaso, N.; Mosello, R. Limnological research in the deep southern subalpine lakes: Synthesis, directions and perspectives. Adv. Oceanogr. Limnol. 2010, 1, 29–66. [Google Scholar] [CrossRef]
  36. Grimaldi, E. Lago Maggiore: Effects of exploitation and introductions on the salmonid community. J. Fish. Res. Board Can. 1972, 29, 777–785. [Google Scholar] [CrossRef]
  37. De Bernardi, R.; Calderoni, A.; Mosello, R. Environmental problems in Italian lakes, and lakes Maggiore and Orta as successful examples of correct management leading to restoration. Int. Ver. Theor. Angew. Limnol. Verh. 1996, 26, 123–138. [Google Scholar] [CrossRef]
  38. Galassi, S.; Volta, P.; Calderoni, A.; Guzzella, L. Cycling pp’DDT and pp’DDE at a watershed scale: The case of Lago Maggiore (Italy). J. Limnol. 2006, 65, 100–106. [Google Scholar] [CrossRef]
  39. Volta, P.; Tremolada, P.; Neri, M.C.; Giussani, G.; Galassi, S. Age-dependent bioaccumulation of organochlorine compounds in fish and their selective biotransformation in top predators from Lake Maggiore (Italy). Water Air Soil Pollut. 2009, 197, 193–209. [Google Scholar] [CrossRef]
  40. Guzzella, L.M.; Novati, S.; Casatta, N.; Roscioli, C.; Valsecchi, L.; Binelli, A.; Parolini, M.; Solcà, N.; Bettinetti, R.; Manca, M.; et al. Spatial and temporal trends of target organic and inorganic micropollutants in Lake Maggiore and Lake Lugano (Italian-Swiss water bodies): Contamination in sediments and biota. Hydrobiologia 2018, 824, 271–290. [Google Scholar] [CrossRef]
  41. Mazzoni, M.; Buffo, A.; Cappelli, F.; Pascariello, S.; Polesello, S.; Valsecchi, S.; Volta, P.; Bettinetti, R. Perfluoroalkyl acids in fish of Italian deep lakes: Environmental and human risk assessment. Sci. Total Environ. 2019, 653, 351–358. [Google Scholar] [CrossRef]
  42. Galafassi, S.; Sighicelli, M.; Pusceddu, A.; Bettinetti, R.; Cau, A.; Temperini, M.E.; Gilliber, R.; Ortolani, M.; Pietrelli, L.; Zaupa, S.; et al. Microplastic pollution in perch (Perca fluviatilis, Linnaeus 1758) from Italian south-alpine lakes. Environ. Pollut. 2021, 288, 117782. [Google Scholar] [CrossRef]
  43. Douglas, M.R.; Brunner, P.C. Biodiversity of central alpine Coregonus (Salmoniformes): Impact of one-hundred years of management. Ecol. Appl. 2002, 12, 154–172. [Google Scholar] [CrossRef]
  44. Hudson, A.; Vonlanthen, P.; Lundsgaard-Hansen, B.; Denis, R.; Seehausen, O. Untersuchungen zur Verwandtschaft der Felchen aus dem Lago di Como, di Lugano und Maggiore; Rapporto Tecnico per il Dipartimento del Territorio; Servizio Cantonale della Caccia e Pesca: Bellinzona, Switzerland, 2008. [Google Scholar]
  45. Schindler, D.E.; Scheuerell, M.D. Habitat coupling in lake ecosystems. Oikos 2002, 98, 177–189. [Google Scholar] [CrossRef] [Green Version]
  46. Volta, P.; Sala, P.; Campi, B.; Cerutti, I. Caratterizzazione tassonomica e funzionale della comunità ittica nel Lago Maggiore con particolare riferimento alle specie alloctone invasive di recente comparsa e alla sovrapposizione della nicchia trofica. In Ricerche Sull’Evoluzione del Lago Maggiore: Aspetti Limnologici; CIPAIS—Consiglio Nazionale delle Ricerche: Verbania, Italy, 2013; pp. 82–98. [Google Scholar]
  47. Jeppesen, E.; Mehner, T.; Winfield, I.J.; Kangur, K.; Sarvala, J.; Gerdeaux, D.; Rask, M.; Malmquist, H.J.; Holmgren, K.; Volta, P.; et al. Impacts of climate warming on lake fish assemblages: Evidence from 24 European long-term data series. Hydrobiologia 2012, 694, 1–39. [Google Scholar] [CrossRef] [Green Version]
  48. Vejřík, L.; Vejříková, I.; Kočvara, L.; Blabolil, P.; Peterka, J.; Sajdlová, Z.; Jůza, T.; Šmejkal, M.; Kolařík, T.; Bartoň, D.; et al. The pros and cons of the invasive freshwater apex predator, European catfish Silurus glanis, and powerful angling technique for its population control. J. Environ. Manag. 2019, 241, 374–382. [Google Scholar] [CrossRef]
  49. Volta, P.; Jepsen, N. The recent invasion of Rutilus rutilus (L.) (Pisces: Cyprinidae) in a large South-Alpine Lake: Lago Maggiore. J. Limnol. 2008, 67, 163–170. [Google Scholar] [CrossRef]
  50. Dörr, A.J.M.; La Porta, G.; Pedicillo, G.; Lorenzoni, M. Biology of Procambarus clarkii (Girard, 1852) in Lake Trasimeno. Bull. Français Pêche Piscic. 2006, 380–381, 1155–1168. [Google Scholar] [CrossRef] [Green Version]
  51. Endrizzi, S.; Bruno, M.C.; Maiolini, B. Distribution and biometry of native and alien crayfish in Trentino (Italian Alps). J. Limnol. 2013, 72, 343–360. [Google Scholar] [CrossRef] [Green Version]
  52. Batistić, M.; Tutman, P.; Bojanić, D.; Skaramuca, B.; Kŏzul, V.; Glavić, N.; Bartulović, V. Diet and diel feeding activity of juvenile pompano (Trachinotus ovatus) (Teleostei: Carangidae) from the southern Adriatic, Croatia. J. Mar. Biol. Assoc. 2005, 85, 1533–1534. [Google Scholar] [CrossRef]
  53. Hureau, J.C. Biologie compare de quelques poisons antarctiques Nothotheniidae. Bulletin De L’institut Océanographique Monaco 1969, 68, 1–44. [Google Scholar]
  54. Hyslop, E.J. Stomach contents analysis—A review of methods and their application. J. Fish Biol. 1980, 17, 411–429. [Google Scholar] [CrossRef] [Green Version]
  55. De Santis, V.; Quadroni, S.; Britton, R.J.; Carosi, A.; Roberts, C.G.; Lorenzoni, M.; Crosa, G.; Zaccara, S. Biological and trophic consequences of genetic introgression between endemic and invasive Barbus fishes. Biol. Invasions 2021, 1–18. [Google Scholar] [CrossRef]
  56. Costello, M.J. Predator feeding strategy and prey importance: A new graphical analysis. J. Fish Biol. 1990, 36, 261–263. [Google Scholar] [CrossRef]
  57. Amundsen, P.A.; Gabler, H.M.; Staldvik, F.J. A new approach to graphical analysis of feeding strategy from stomach contents data—Modification of the Costello (1990) method. J. Fish Biol. 1996, 48, 607–614. [Google Scholar] [CrossRef]
  58. R Core Team. R: A Language and Environment for Statistical Computing; R Foundation for Statistical Computing: Vienna, Austria, 2021. [Google Scholar]
  59. Oksanen, J.; Blanchet, F.G.; Friendly, M.; Kindt, R.; Legendre, P.; McGlinn, D.; Minchin, P.R.; O’Hara, R.B.; Simpson, G.L.; Solymos, P.; et al. Vegan: Community Ecology Package. R Package Version 2.5-6. 2019. Available online: https://CRAN.R-project.org/package=vegan (accessed on 10 August 2021).
  60. Slavík, O.; Horký, P.; Bartoš, L.; Kolářová, J.; Randák, T. Diurnal and seasonal behaviour of adult and juvenile European catfish as determined by radio-telemetry in the River Berounka, Czech Republic. J. Fish Biol. 2007, 71, 101–114. [Google Scholar] [CrossRef]
  61. Daněk, T.; Horký, P.; Kalous, L.; Filinger, K.; Břicháček, V.; Slavík, O. Seasonal changes in diel activity of juvenile European catfish Silurus glanis (Linnaeus, 1758) in Byšická Lake, Central Bohemia. J. Appl. Ichthyol. 2016, 32, 1093–1098. [Google Scholar] [CrossRef]
  62. Lenhardt, M.B.; Smederevac-Lalić, M.M.; Spasić, S.Z.; Honţ, Ş.; Paraschiv, M.; Iani, M.I.; Nikčević, M.V.; Klimley, P.A.; Suciu, R. Seasonal changes in depth position and temperature of European catfish (Silurus glanis) tracked by acoustic telemetry in the Danube River. Int. Rev. Hydrobiol. 2021, 106, 191–201. [Google Scholar] [CrossRef]
  63. Slavík, O.; Horký, P.; Maciak, M.; Wackermannová, M. Familiarity, prior residency, resource availability and body mass as predictors of the movement activity of the European catfish. J. Ethol. 2016, 34, 23–30. [Google Scholar] [CrossRef]
  64. Portt, C.B.; Coker, G.A.; Ming, D.L.; Randall, R.G. A Review of Fish Sampling Methods Commonly Used in Canadian Freshwater Habitats; Canadian Technical Report of Fisheries and Aquatic Sciences 2604; Fisheries and Oceans: Ottawa, ON, Canada, 2006.
  65. Haubrock, P.J. Seasonal variability in the diet of juvenile European catfish, Silurus glanis, in the Arno River (Italy) in Florence. Fish. Aquat. Life 2021, 29, 54–61. [Google Scholar] [CrossRef]
  66. Haertel-Borer, S.S.; Zak, D.; Eckmann, R.; Baade, U.; Hölker, F. Population density of the crayfish, Orconectes limosus, in relation to fish and macroinvertebrate densities in a small mesotrophic lake—Implications for the lake’s food web. Int. Rev. Hydrobiol. 2005, 90, 523–533. [Google Scholar] [CrossRef]
  67. Czarnecki, M.; Andrzejewski, W.; Mastyñski, J. The feeding selectivity of wels (Silurus glanis L.) In lake Góreckie. Archiv. Pol. Fish. 2003, 11, 141–147. [Google Scholar]
  68. Pohlmann, K.; Grasso, F.W.; Breithaupt, T. Tracking wakes: The nocturnal predatory strategy of piscivorous catfish. Proc. Natl. Acad. Sci. USA 2001, 98, 7371–7374. [Google Scholar] [CrossRef] [PubMed] [Green Version]
  69. Carol, J.; Zamora, L.; García-Berthou, E. Preliminary telemetry data on the movement patterns and habitat use of European catfish (Silurus glanis) in a reservoir of the River Ebro, Spain. Ecol. Freshw. Fish 2007, 16, 450–456. [Google Scholar] [CrossRef]
  70. Wheeler, A. The Fishes of the British Isles and North West Europe; Macmillan and Co.: London, UK, 1969. [Google Scholar]
  71. Lever, C. The Naturalised Animals of the British Isles; Hutchinson and Company, Limited: London, UK, 2007; 600p. [Google Scholar]
  72. Gorman, O.T.; Yule, D.L.; Stockwell, J.D. Habitat use by fishes of Lake Superior. II. Consequences of diel habitat use for habitat linkages and habitat coupling in nearshore and offshore waters. Aquat. Ecosyst. Health Manag. 2012, 15, 355–368. [Google Scholar] [CrossRef]
  73. Agnetta, D.; Badalamenti, F.; Colloca, F.; D’Anna, G.; Di Lorenzo, M.; Fiorentino, F.; Garofalo, G.; Gristina, M.; Labanchi, L.; Patti, B.; et al. Benthic-pelagic coupling mediates interactions in Mediterranean mixed fisheries: An ecosystem modeling approach. PLoS ONE 2019, 14, e0210659. [Google Scholar] [CrossRef] [Green Version]
  74. Guillerault, N.; Delmotte, S.; Boulêtreau, S.; Lauzeral, C.; Poulet, N.; Santoul, F. Does the non-native European catfish Silurus glanis threaten French river fish populations? Freshw. Biol. 2015, 60, 922–928. [Google Scholar] [CrossRef] [Green Version]
  75. Wasserman, J.R.; Alexander, M.E.; Dalu, T.; Ellender, B.L.; Kaiser, H.; Weyl, O.L. Using functional responses to quantify interaction effects among predators. Funct. Ecol. 2016, 30, 1988–1998. [Google Scholar] [CrossRef]
  76. Wysujack, K.; Mehner, T. Can feeding of European catfish prevent cyprinids from reaching a size refuge? Ecol. Freshw. Fish 2005, 14, 87–95. [Google Scholar] [CrossRef]
  77. Bettinetti, R.; Croce, V.; Galassi, S.; Volta, P. pp´DDT and pp´DDE accumulation in a food chain of Lake Maggiore (Northern Italy): Testing steady-state condition. Environ. Sci. Pollut. Res. Int. 2006, 13, 59–66. [Google Scholar] [CrossRef]
  78. Saidi, H.; Dresti, C.; Manca, D.; Ciampittiello, M. Climate projections in Lake Maggiore watershed using statistical downscaling model. Clim. Res. 2020, 81, 113–130. [Google Scholar] [CrossRef]
  79. Fenocchi, A.; Rogora, M.; Sibilla, S.; Ciampittiello, M.; Dresti, C. Forecasting the evolution in the mixing regime of a deep subalpine lake under climate change scenarios through numerical modelling (Lake Maggiore, Northern Italy/Southern Switzerland). Clim. Dyn. 2018, 51, 3521–3536. [Google Scholar] [CrossRef]
  80. Iacarella, J.C.; Dick, J.T.A.; Alexander, M.E.; Ricciardi, A. Ecological impacts of invasive alien species along temperature gradients: Testing the role of environmental matching. Ecol. Appl. 2015, 25, 706–716. [Google Scholar] [CrossRef] [PubMed] [Green Version]
  81. Denley, D.; Metaxas, A.; Fennel, K. Community composition influences the population growth and ecological impact of invasive species in response to climate change. Oecologia 2019, 189, 537–548. [Google Scholar]
  82. Volta, P.; Jeppesen, E.; Campi, B.; Sala, P.; Matthias, E.; Winfield, I.J. The population biology and life history traits of Eurasian ruffe [Gymnocephalus cernuus (L.), Pisces: Percidae] introduced into eutrophic and oligotrophic lakes in Northern Italy. J. Limnol. 2013, 72, 280–290. [Google Scholar] [CrossRef] [Green Version]
  83. Muscalu, R.; Muscalu, C.; Nagy, M.; Bura, M.; Szelei, Z.T. Studies on wels catfish (Silurus glanis) development during cold season as an auxiliary species in sturgeon recirculated aquaculture systems. Aquac. Aquar. Conserv. Legis. 2010, 3, 362–366. [Google Scholar]
  84. Larson, E.R.; Graham, B.M.; Achury, R.; Coon, J.J.; Daniels, M.K.; Gambrell, D.K.; Jonasen, K.L.; King, G.D.; LaRacuente, N.; Perrin-Stowe, T.I.; et al. From eDNA to citizen science: Emerging tools for the early detection of invasive species. Front. Ecol. Environ. 2020, 18, 194–202. [Google Scholar] [CrossRef]
  85. Martelo, J.; da Costa, L.; Ribeiro, D.; Gago, J.; Magalhães, M.; Gante, H.; Alves, M.; Cheoo, G.; Gkenas, C.; Banha, F.; et al. Evaluating the range expansion of recreational non-native fishes in Portuguese freshwaters using scientific and citizen science data. BioInvasions Rec. 2021, 10, 378–389. [Google Scholar] [CrossRef]
Figure 1. (a) Bathymetric map of Lake Maggiore (retrieved from https://wldb.ilec.or.jp/Search/listdata, (accessed on 18 August 2021)) and location of sampling sites with (b) schematic representation of the location of pelagic and littoral gillnets and (c) heatmap of temperature with depth measured for each month from January 2019 to February 2020 at the deepest point of the Lake (Ghiffa station, site 1).
Water 13 02549 g001
Figure 2. Box and whisker plots of catfish total lengths across sampling month (November 2019 to January 2020) and between pelagic and littoral habitats at each sampling site (Figure 1). Grey points represent each individual catfish, while black points are outliers.
Water 13 02549 g002
Figure 3. Distribution of (a) Number (NPUE) and (b) Biomass (BPUE) of catfish across site and divided per habitat type (bar color) and each month of capture.
Water 13 02549 g003
Figure 4. nMDS graphs built on arcisin square rooted numerical abundances and a Bray-Curtis dissimilarities matrix of the 12 prey species detected in the 182 analyzed catfish stomachs displaying (a) dietary niches as 40% standard ellipse area per sampling site (dashed line = site 1; dot-dashed line = site 2; solid line = site 3) and (b) dietary niches as 40% standard ellipse area per size class (solid line = Cass I < 100 cm and dashed line = Class > 100 cm). Stress was = 0.04, indicating two dimensions, and the ordination was sufficiently described.
Water 13 02549 g004
Figure 5. Feeding strategy plot (modified Costello graph; [56,57]) of pelagic and littoral catfish diet displaying the frequency of occurrence and prey-specific abundance of each prey (circles = prey item of littoral catfish; triangles = prey items of pelagic catfish).
Water 13 02549 g005
Figure 6. Species-specific (a) and predators-only (b) fish harvest composition (tons/year) in L. Maggiore since the invasion of S. glanis (1990–2020), where Coregonids = “lavarello” and “bondella” Coregonus sp.; Percids = S. lucioperca, P. fluviatilis and G. cernua; Trout = Salmo spp.; Italian bleak = Alburnus alborella (Bonaparte, 1841); other species = S. umbla, L. lota, E. cisalpinus, Anguilla anguilla (L.), Tinca tinca (L.) and Cyprinus carpio L.
Water 13 02549 g006
Table 1. Number (NPUE), biomass (BPUE), total length (TL in centimeters) with min–max values, and estimated weight (W in grams) with min–max values of European catfish harvested at each sampling site between the pelagic and littoral compartments. NPUE = number per unit effort (individual/m2); BPUE = biomass per unit effort (grams/m2).
Site123
HabitatPelagicLittoralPelagicLittoralPelagicLittoral
N584165321228
TL (cm)115.7
(89–150)
93.4
(68–122)
106.1
(87–145)
97.5
(67–125)
125.3
(99–140)
97.8
(79–119)
W (g)10,861.4
(4619.8–22,940.4)
5623.9
(2022.1–12,165.4)
8421.3
(4308.5–20,672.8)
6617.9
(1932.2–13,107.3)
13,612.5
(6406.2–18,561.5)
6346.1
(3204.2–11,270.1)
NPUE0.0080.0160.0090.0130.0020.011
BPUE113.995.973.0120.221.8177.0
Table 2. Feeding intensity (as Vacuity index, VI%) and amount of food ingested (as Fullness index, FI %) together with the number and biomass of prey of the two size classes (Class I < 100 cm and Class II > 100 cm) of catfish caught in littoral and pelagic habitats of L. Maggiore.
HabitatLittoralPelagic
Size ClassClass IClass IIClass IClass II
Nstomach53263172
VI (%)20.923.527.921.7
Mean FI (%) ± 95% CI5.81 ± 1.555.56 ± 1.464.32 ± 0.943.53 ± 0.61
Total Nprey2208679196
Mean Nprey4.15 ± 1.113.31 ± 0.992.55 ± 0.572.72 ± 0.40
Total W (kg)11.815.37.6228.6
Mean W (g) ± 95% CI289 ± 78.9454.7 ± 108.6245.8 ± 57.1397.3 ± 64
Table 3. List of the 12 prey species composing catfish diet and their relative frequency of occurrence (FO%) and numeric (N%) and biomass (W%) abundance in the total sample and for each habitat type. The native (N) vs. non-native (NN) status of species is also reported, together with the total number (N), mean total length (TL) in centimeters with min-max values in brackets, mean estimated weight in grams with min-max values in brackets, and total weight (Wtot) in kilograms for each prey found in the analyzed fish.
TotalPelagicLittoral
SpeciesStatusNTL (cm)W (g)Wtot (Kg)FO%N%W%FO%N%W%FO%N%W%
Coregonus sp.NN15626.1 (15–45)169.5 (23.9–789.2)26.4540.726.942.062.149.165.712.76.910.0
Alosa agoneN12521.9 (15–31)86 (26.2–242.7)10.7525.321.517.144.745.530.2000
Rutilus rutilusNN6718 (13–31)79.9 (13–373.2)5.3518.711.58.56.85.54.532.917.013.8
Perca fluviatilisN5814.2 (8–24)38.7 (5.7–160.6)2.4514.810.03.900032.919.09.1
Sander luciopercaNN634.8 (25–45)428.5 (126.9–808.4)2.572.71.04.10006.32.09.6
Scardinius hesperidicusN626.3 (23–31.4)296.3 (202–412)1.782.21.02.80005.12.06.6
Squalius squalusN1354500.450.50.20.70001.30.31.7
Silurus glanisNN748.1 (49–59)584.2 (396.6–786.7)5.113.81.28.10008.92.319.0
Cottus gobioN210.5 (9–12)11.9 (7.6–16.1)0.020.50.30.00001.30.70.1
Lota lotaN228.5 (28–29)170.7 (161.2–180.2)0.341.10.30.50002.50.71.3
Faxonius limosusNN1488 (5–13)52 (25.5–93.5)7.724.225.512.200055.748.428.6
Procambarus clarkiiNN313.6 (13–14)60 (50–65)0.181.10.50.30002.51.00.7
Table 4. PERMANOVA partition of the diet composition variation of the 182 analyzed catfish harvested in Lake Maggiore (12 prey species) based on arcsin square rooted numerical abundances and Bray-Curtis dissimilarities with p-value calculated after 9999 permutations.
SourcedfSSMSPseudo FR2p-Value
Habitat116.0216.0275.650.250.0001
Size class10.620.622.940.010.025
Site21.400.703.310.020.002
Month23.771.898.910.060.0001
Habitat × Month22.301.155.450.040.0001
Size class × Month20.900.452.130.010.04
Site × Month41.780.452.100.030.01
Habitat × Size class11.291.296.100.020.0006
Habitat × Site20.380.190.730.0060.49
Size class × Site21.910.964.510.030.0002
Habitat × Size class × Site20.670.341.580.010.12
Habitat × Size class × Month21.150.572.700.020.009
Habitat × Site × Month20.340.170.810.0050.58
Size class × Site × Month10.100.100.460.0010.79
Residuals17032.830.22 0.50
Total18165.48 1.00
Publisher’s Note: MDPI stays neutral with regard to jurisdictional claims in published maps and institutional affiliations.

