
Hydro-Morphological Assessment of Dittaino River, Eastern Sicily, Italy
by
 ,
,
Feliciana Licciardello
1,*, 
Salvatore Barbagallo
1,
Salvatore M. Muratore
1,
Attilio Toscano
2,
Emanuela R. Giuffrida
1 and
Giuseppe L. Cirelli
1
1
Dipartimento di Agricoltura, Alimentazione e Ambiente (Di3A), Università di Catania, Via S. Sofia 100, 95123 Catania, Italy
2
Dipartimento di Scienze e Tecnologie Agro-Alimentari, Università di Bologna, Viale Fanin 50, 40127 Bologna, Italy
*
Author to whom correspondence should be addressed.
Water 2021, 13(18), 2499; https://doi.org/10.3390/w13182499
Submission received: 30 June 2021
/
Revised: 1 September 2021
/
Accepted: 8 September 2021
/
Published: 11 September 2021
(This article belongs to the Special Issue Advances in River Hydraulic Characterization)
Abstract
:The present conditions of the Dittaino River were investigated by using tools addressing different components of the IDRAIM (stream hydro-morphological evaluation, analysis, and monitoring system) procedure. After the segmentation of the river, the Morphological Quality Index (MQI) and the Morphological Dynamic Index (MDI) were assessed to analyze its morphological quality and to classify the degree of channel dynamics related to progressive changes occurring in the relative long-term (i.e., 50–100 years), respectively. The results show that 45% and 22% of the analyzed reaches (mainly located in highest zones of the hydrographic network) were, respectively, of high and good quality. The MQI class decreased to good and then to moderate in the downstream direction, and two reaches were of poor class. The highest MDI classes were also mainly identified in the highest zones of the hydrographic network. Some limitations (i.e., the elevated number of indicators, as well as their simplification) and strengths (i.e., the easy applicability to a large number of reaches) were identified during the application of the MQI method to the Dittaino River.
1. Introduction
Rivers are dynamic natural systems that evolve in terms of their longitudinal and lateral sediment and morphological continuum through ongoing reworking processes [1]. The resulting morphological changes can occur at the reach scale over short periods of time and limited spatial extents, or over long time intervals (from tens to thousands of years) and involve the entire river system [2]. Moreover, the alterations may be of natural origin, or they may be anthropogenic [3]. As a response to these alterations, the river adjusts its channel geometry in order to re-establish a dynamic equilibrium between sediment supply and available transport capacity by changing the characteristic channel variables [4,5].
Sediment production and delivery to the typically confined and steep drainage network prevail in the upper catchment [6,7,8,9,10], while the large variability in terms of morphological configuration and bed roughness depends on confinement, the channel slope, and the specific boundary conditions. This variability is also reflected in the presence of bars and vegetated islands, which offer favorable conditions for the establishment of wetlands. Riparian wetlands can provide an important ecological function, including habitat provision for vegetation and other species, as well as regulation in the case of flooding [11,12].
In European countries, the integration of information on hydrology and fluvial geomorphology, called hydro-morphology, has been accelerated by the implementation of the EU Water Framework Directive WFD, ref. [13]. Hydro-morphology requires an interface among different topics concerning the physical processes of river management actions and strategies [14]. Since the establishment of the WFD, several methods have been adopted in European countries [15,16], which, in most cases, coincide with physical habitat assessment procedures [17] and do not take into account physical processes [18]. This may be because the methods are limited by the minimal understanding of physical processes and river alterations, related to the small scale of investigation, the limited use of geomorphological methods, and the use of a static temporal domain [17]. Although some methods have been developed that make stronger considerations of physical processes at appropriate spatial and temporal scales, none are suitable for the Italian context [17].
In general, methods that are not based on physical processes remain the most widely applied for assessing hydro-morphology [19], given that morphology alone is not a sufficient field sampling methodology, and it requires integration with remote sensing (GIS) [20].
In the last 200 years, most Italian and European rivers have suffered considerable human pressures at both the basin and channel scales, often involving river fragmentation [21]. The phases of deforestation and reforestation, channelization, sediment mining, urbanization, dam building, torrent-control works, water diversion for agriculture and hydroelectric power generation, and many other interventions have modified natural water and sediment fluxes and boundary conditions [22]. On the other hand, given the high level of urbanization, flood safety is a priority, as reported in the EU Flood Directive (WFD; [23]).
Even though integrative approaches for river management with different objectives are desired by public agencies, EU directives often have conflicting objectives [24]. This is specifically the case for the WFD and the FD, the former aiming to improve the ecological quality of water bodies, and the latter to identify measures to mitigate flood risk. Following this, the Italian National Institute for Environmental Protection and Research (ISPRA) developed a methodology for stream hydro-morphological evaluation, analysis, and monitoring, named IDRAIM (stream hydro-morphological evaluation, analysis, and monitoring system, [24]). This procedure consists of an integrated analysis of morphological quality and channel dynamic hazards, aspiring to a harmonized implementation of both the WFD and FD directives. The IDRAIM framework is built on existing geomorphological approaches developed in other countries [25], but it also accounts for the specific Italian context in terms of channel adjustments and human pressures and includes a component addressing fluvial dynamics. It is recognized that classification systems work best as guides to river management when developed for specific physiographic regions [11].
The method, distinct from physical habitat assessment procedures, is characterized by a catchment-wide perspective, and the temporal component is explicitly accounted for in the analysis. Moreover, channel dynamics and the possible implications in terms of fluvial hazards are included in the analysis.
The structure of IDRAIM includes four phases [24], as shown in Figure 1. The characterization of the fluvial system (phase 1), based on a catchment-wide hierarchical framework, provides an initial characterization of the river system in its present conditions, and a segmentation into homogeneous reaches. Assessing the past evolution and present river conditions (phase 2) demands a reconstruction of evolutionary trajectories based on a series of key parameters (channel pattern and width and bed-level changes), as well as the assessment of present river conditions. These are investigated using the Morphological Quality Index (MQI), the Morphological Dynamic Index (MDI), as well as the Event Dynamic Classification (EDC) and the fluvial morphological dynamics corridors [24]. The assessment of future trends (phase 3) considers potential future trajectories of the channel’s morphology in response to existing factors or to different management scenarios. The identification of management options (phase 4) focuses on the establishment of an integrative river management strategy that should take into account the results of the whole analysis.
The procedure has already been applied to some extend to several case studies. In particular, the MQI, aiming at an assessment, classification, and monitoring of the current morphological state, was tested on the Cordevole river in northeastern Italy [26]. Since the index is the standard hydro-morphological assessment method for WFD classification and monitoring [27], it was also applied to 102 river reaches representing a wide range of the physical conditions and human pressures that affect Italian streams. This application of the method enabled the testing of the overall methodology, the refinement of the indicators and scores, as well as the evaluation of limitations and strengths. The MQI was successfully applied to eight case studies across Europe to assess the hydro-morphological response to various restoration measures, as well as to evaluate the index as a morphological assessment method applied at the reach scale, combined with a conventional site-scale physical habitat assessment method. Despite the fact that these reaches were selected to represent a sufficiently wide range of conditions, most of them are localized in central and northern Italy [17]. During the European FP7 project Restoring Rivers for Effective Catchment Management (REFORM), the MQI was extended and tested on a number of European streams [28].
The MDI was applied in some Italian rivers for testing [29] and, more recently, to modify the left embankment of the Secchia river (running through the Emilia-Romagna and Lombardia regions in Italy), so as to guarantee the bank’s stability and the hydraulic section’s suitability [30].
Moreover, the hierarchical nested approach followed in IDRAIM was also used for the morphological characterization of the River Baker, located in Chilean Patagonia [31].
In most cases, the IDRAIM procedure (or at least phase 1 and/or phase 2 thereof, Figure 1) was tested and applied to rivers that had been characterized by their physical conditions (physiographic units, hydrological and climatic conditions) and morphological types, as well as by dynamic processes different from those observed in the Dittaino River and in the Mediterranean in general.
In this paper, the present conditions of the Dittaino River (Enna, eastern Sicily, Italy), one of the main tributaries of the Simeto River, are investigated via tools corresponding to different components of the IDRAIM procedure (morphological quality and dynamics). In particular, after the segmentation of the River, the MQI and the MDI are used to respectively analyze its morphological quality and classified the channel dynamics in relation to progressive changes occurring in the relative long-term (i.e., 50–100 years). The limitations, strengths, and the applicability of the procedure to the Dittaino River are also discussed.
2. Materials and Methods
2.1. Methodological Overview
Following the studies in [17,32,33], phase 1 of the analysis was divided into four steps (Table 1): the general setting and identification of the physiographic units and segments (step 1), the definition of the confinement typologies (step 2), the identification of morphological typologies (step 3), and reach delineation (step 4).
In the step 1, a basic investigation of geology, geomorphology, climate, and land use in the whole catchment was carried out. An initial segmentation (editing of lines) was then constructed based on physiographic units, hydrological discontinuities, significant geometric changes, and variations in geolithology. The subdivision was performed through the software Arc Hydro Tools (ArcGIS 10.3, ESRI®) using orthophotos (flight ATA 708 of 2008), provided by the Sicily Region Department of Territory and Environment, the Digital Terrain Model (DTM) (format ASCII), Technical and Geolithological Maps of Sicily (both available on the Regional Geoportal), and the Map of Regional Physiographic Units (available on the website of the Italian National Institute for the Environmental Search and Protection, I.S.P.R.A.) [34]. Slope and exposure maps were derived from the DTM. The Dittaino catchment was then divided into physiographic units and its fluvial system was divided into distinct segments, also taking into account the main confluences of its tributaries.
This geospatial information, together with the 2008 orthophotos, were used for photo-interpretation and active channel and alluvial plain editing. This editing was carried out across the river network from the seventh to the tenth order (following the Horton–Strahler classification; [35]), based on the graphical representation scale.
In step 2, the river confinement was defined in detail, and the confinement degree and index were calculated using a semiautomatic procedure (based on a Geographic Information System). The confinement degree expresses the lateral confinement longitudinally, independently of the width of the alluvial plain. It corresponds to the percentage of banks in direct contact with the slopes (identified as terrain with a slope greater than 20°). The confinement index is defined as the ratio between alluvial plain width (including the channel) and channel width. Based on the confinement degree and index values [32], a class of confinement (confined, C, partly confined, PC, and unconfined, UC) was assigned to each identified reach (Table 2).
In the step 3 the channel morphology of the Dittaino River was analyzed in detail by calculating sinuosity, braiding, and anabranching indexes (calculated as in [2]), and by considering the river typology (Table 1), according to traditional classifications of river morphologies (e.g., [6,9,36,37]), but taking into account the specific Italian context (e.g., [3,38,39]).
The PC and UC reaches are classified based on their planimetric pattern, and are divided into seven river morphologies (straight, sinuous, meandering, sinuous with alternate bars, wandering, braided, anastomosed). C reaches are classified at the first level based on their planform only, into single-thread, wandering, braided, and anastomosed [33].
In step 4, additional discontinuities were considered to further subdivide the stream reaches, including hydrological discontinuities (e.g., tributaries, dams), bed slope (particularly for C reaches), and relevant changes in channel and alluvial plain width or bed sediment [32]. The final product of this first phase was the subdivision of the Dittaino River network into relatively homogeneous reaches that represent elementary spatial units for the assessment of its morphological conditions.
In order to characterize the Dittaino’s watershed stage, regressions, including linear, exponential logarithmic, and power of the longitudinal river pattern profile, were established. The coefficient of determination (R2) calculation determines the degree of fit. The curve with the highest R2 value is the best curve. If the sediment is too coarse to be transported by the river, the longitudinal profile shows a low degree of concavity and hence a better linear function fit [40]. If the transport capacity is saturated, as postulated by [41], the channel sediment grain size will reduce downstream, and the longitudinal profile will be more suitable for the logarithmic function. With further increases in profile concavity, the power function becomes more appropriate. Thus, the temporal evolution sequence should be as follows: linear–exponential–logarithmic–power.
2.2. Morphological Quality Index
After the segmentation phase, the data and information needed to evaluate the MQI were acquired for each identified reach. Field surveys were carried out in the period July–December 2014. In total, 53 reaches of the Dittaino River’s network (37 in the upper part and 16 in the downstream area) were analyzed. As required by the IDRAIM procedure, the following three components of morphological analysis were considered: (i) geomorphological functionality, based on the comparison of forms and processes under the present conditions with those normally associated with that river typology; (ii) artificiality, based on the presence, frequency, and continuity of artificial structures and interventions; (iii) channel adjustments, addressing relatively recent morphological changes (i.e., about the last 100 years) indicating systemic instability related to human factors (with particular reference, as regards the planimetric changes, to the last 50–60 years). The evaluation of the 28 indicators was completed with the application of two types of MQI evaluation forms: (i) one for C channels and (ii) one for PC and UC channels (Table 2) [17]. Three classes were defined for each indicator. A score of 0 was assigned in the case of the absence or insignificant presence of alteration (answer A), 2 to 3 was assigned to the intermediate class of alteration (answer B), and 5 to 6 was assigned to the highest alteration class (answer C). When artificial elements are present at extreme densities and dominate the environment, additional points of alteration can be assigned. The final score was calculated as the ratio between the total alteration score (assigned to all indicators applied in the reach), Stot, and the maximum possible total alteration score, Smax. As such, the Morphological Alteration Index (MAI) was defined as follows:
Therefore, the MAI ranges from 0 (no alteration) to 1 (maximum alteration). Given the index structure (considering various aspects and categories), it is possible to calculate a series of sub-indexes that divide the MAI into its components. This can be useful for identifying the negative and positive points of each reach. The sub-indexes of geomorphological functionality, artificiality, and channel adjustments, named the Functionality Morphological Alteration Index (MAIF), the Artificiality Morphological Alteration Index (MAIA), and the Channel Adjustment Morphological Alteration Index (MAICA), respectively, can be defined as follows:
where SF tot = F1 + … + F13 (sum of scores of applied F indicators); SA tot = A1 + … + A12 (sum of scores of applied A indicators); SCA tot = CA1 + … + CA3 (sum of scores of applied CA indicators).
Consequently,
MAIF + MAIA + MAICA = MAI
The Morphological Quality Index (MQI) is then defined as
Based on this formula, MQI describes the quality, defined as the relative absence of alteration, since MAI indicates the relative degree of alteration. The MQI index varies from 0 (minimum quality) to 1 (maximum quality).
Similar to MAI, MQI can be divided into the sub-indexes of functionality, artificiality, and channel adjustments, named the Functionality Morphological Quality Index (MQIF), the Artificiality Morphological Quality Index (MQIA), and the Channel Adjustment Morphological Quality Index (MQICA).
According to this structure, the reference conditions (i.e., class A for each indicator, corresponding to MQI = 1) are characterized by: (i) the full functionality of geomorphic processes along the reach; (ii) the absence or negligible presence of artificial elements along the reach and in the catchment (in terms of flow and sediment fluxes); and (iii) the absence of significant channel adjustments (configuration, width, bed elevation) over a temporal frame of about 100 years.
During the assessment and compilation of the evaluation forms, some indicators may be affected by a lack of data or information or may require a certain degree of subjective interpretation. To help in assessing how certain the user feels concerning their answer, a degree of confidence (low, medium, high) and a second (alternative) choice in the classes can be expressed. This is calculated by taking the scores associated with the second choice (with low or medium confidence in the answer) and obtaining a range of variability rather than a single final value of the MQI.
The three components (geomorphological functionality, artificiality, and channel adjustments) do not have the same weight in the final score of the MAI, and consequently in the MQI, with artificiality having the highest weight in the overall scoring, followed by functionality and channel adjustments. This is because past conditions are important, and may affect the morphological quality, but the artificial constraints and the functioning of processes in the present condition are the two major components of the evaluation. For example, considering C medium–big channels, the geomorphological functionality, artificiality, and channel adjustments have a maximum score of 37, 63, and 14, respectively (with a total score of 114); for C small channels, the adjustment is zero and the initial total score is equal to 100 (114–14). Then, considering PC and UC medium–big channels, the maximum scores are 46, 72, and 24, respectively (with a total score of 142); for small channels, the adjustment is zero, and the initial total score is equal to 118 (142–24).
Based on the MQI, five classes of morphological quality were defined (Table 3).
2.3. Morphological Dynamic Index
The Morphological Dynamics Index (MDI) classifies the degree of channel dynamics related to progressive changes occurring over a relatively long time frame (i.e., 50–100 years), not including the possible responses to extreme flood events. The index is applied only to PC or UC reaches. MDI identifies reaches characterized by high riverbed dynamism [2].
The structure is similar to the MQI and is based on a set of 11 indicators assessing the main factors controlling channel dynamics (e.g., river typology, bed and bank erodibility, past changes, and present trends of adjustment). The indicators are grouped into three main categories: morphology and processes, artificiality, and morphological changes (Table 4). In particular, morphology and processes refer to general natural issues (such as the bed typology and material that constitutes the banks and bed), considering bank retreat processes as well as current. Artificiality indicators consider the obstacles that mostly influence morphological dynamic processes (such as transversal and longitudinal barriers). During the artificiality assessment, anthropic elements are considered, assessing their potential effects on dynamic processes (e.g., bank defenses as an impediment of bank retreat processes). Morphological change indicators refer to changes occurring in the last 50 years, related to various types of hazards, as well as instability conditions that can evolve during flood events.
Each indicator can be linked to the vertical dynamic (related to all aspects connected to the bed morphological dynamic) or the lateral dynamic (related to all aspects connected to the retreat of banks and width changes).
For each indicator, it is possible to provide different answers for classes (D-, C-, B-, A, B, C, D, E), and the score attributed to each indicator must be a whole number and not negative. The score is directly proportional to the dynamic degree—high scores refer to major morphological dynamics exhibiting naturalness as well as low artificial control. On the basis of the values of MDI, the classes of morphological dynamics with scores ranging from 0 to 1 are defined (Table 5).
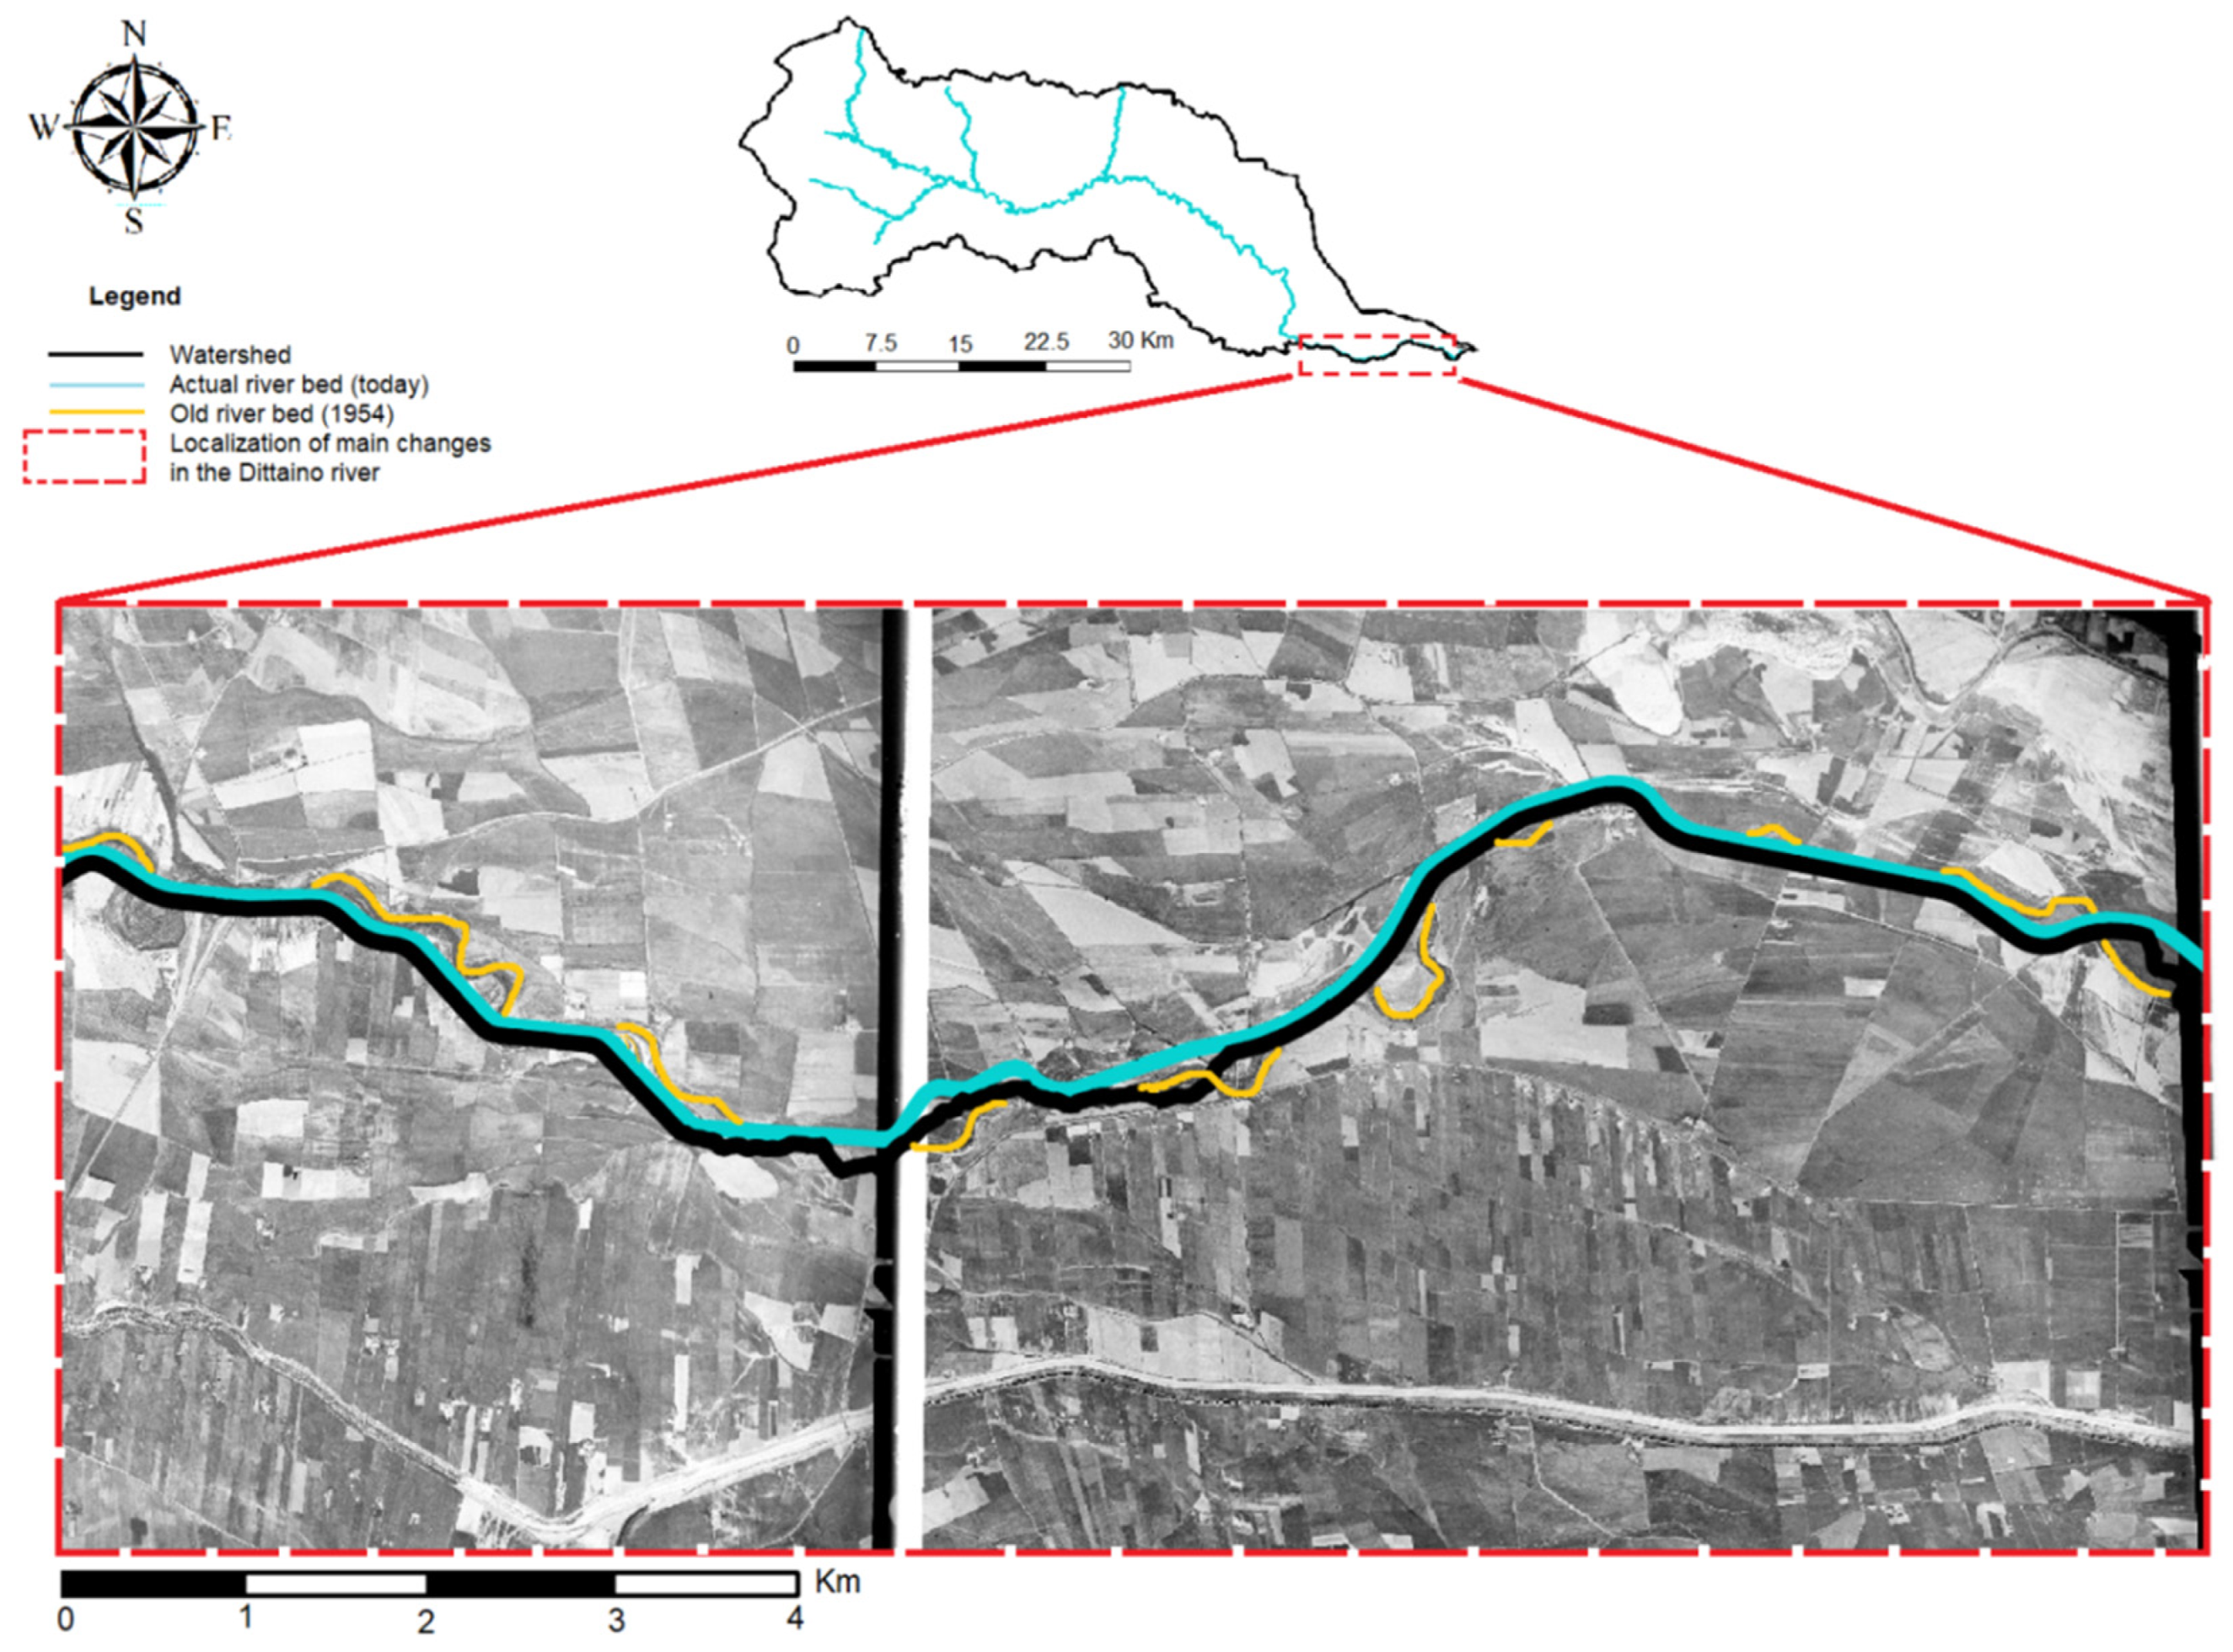
For the Dittaino River network, the MDI was evaluated for each PC/UC reach. The indicators of the categories of morphology and processes and artificiality were evaluated using maps and field survey analysis. The analysis of the indicators V1 (morphological configuration changes) and V2 (width changes), in particular, was carried out by comparing between remote sensing images (Orthophotos 2008) and maps of the flight IGM GAE of 1954/55, provided by the Military Geographical Institute (Figure 2). The poor definition of the maps led to some difficulties during the interpretation of the results.
The MDI was evaluated for 37 reaches out of the total of 53 identified in the catchment during August–November 2015.
3. Results
3.1. Dittaino River Characterization
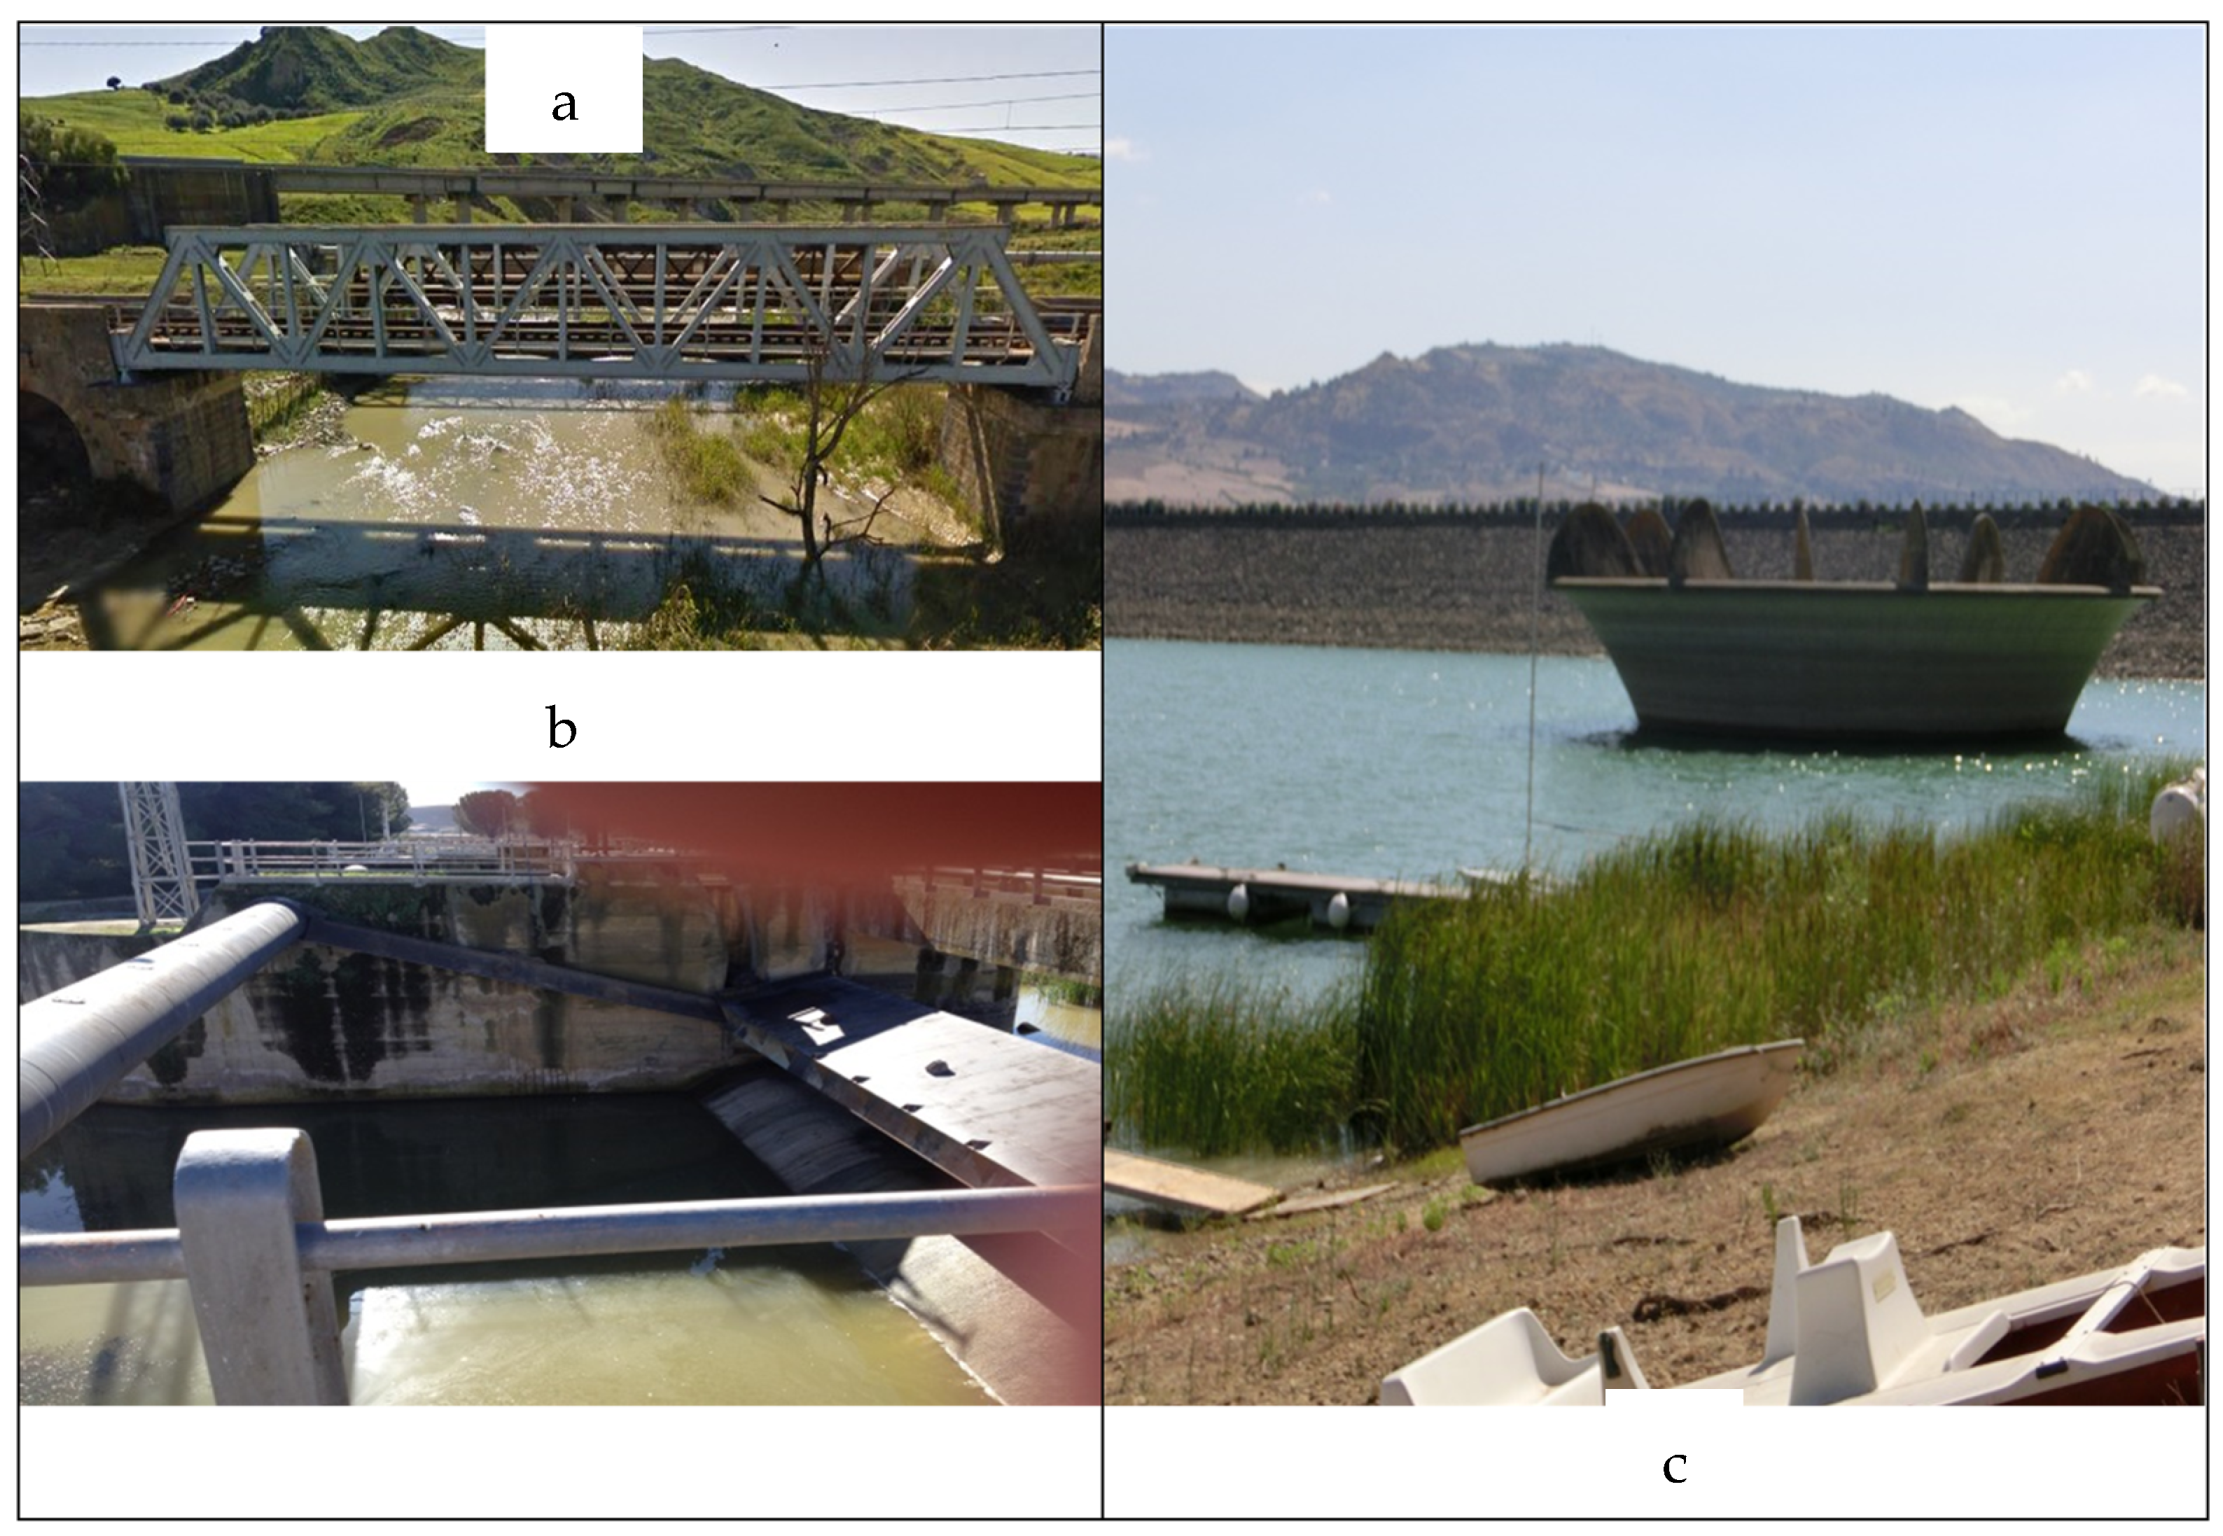
The Dittaino River basin (Figure 3) covers an area of 980 km2 in the Province of Enna (Eastern Sicily). The predominant soil types in the basin are clay and marl, which exhibit very low permeability. Moreover, due to the presence of chalky–sulfurous series outcrops, the salinity of the surface runoff reaching the main river and its tributaries is quite high. The Dittaino’s main path (Figure 3), named the Bozzetta stream, is approximately 104 km long, starting from the eastern slopes of the Erei mountains (925 m asl) and then flowing into the Simeto river near the Sigonella district (10 m asl). Its main tributaries are the Crisa (near Leonforte village), Calderari (near Enna city), Salito (near Assoro village), and Tenutella (near Regalbuto village) streams. The hydrographic network branches in the upper part of the basin, with a meandering or sinuous trend in the medium and lower areas. Two important infrastructures were built for irrigation along the Dittaino River—the Nicoletti dam, draining an area of about 50 km2, and the abstraction weir, created to transfer water to the Ogliastro dam (Figure 3) and located along the Gornalunga river. The Nicoletti dam, built between 1973 and 1981, is about 31 m high, with a crest length of 635 m and a maximum capacity of about 24 mio m3 (20 mio m3 is the effective capacity of the reservoir, and about 4 mio m3 is assigned for peak flow reduction and sediment storage). In the upper part of the fluvial system, mainly characterized by a torrential regime, the hydraulic sections differ significantly from each other due to the presence of transversal and longitudinal stream structures. In particular, upstream of the abstraction weir, we find the Salito (containing some transversal and longitudinal stream structures) and Crisa streams (tributary of the Bozzetta stream) on the left, and the Calderari and Mulinello streams on the right. There are 59 transversal stream structures (weirs) along the Crisa and Salito streams. Moreover, the natural sinuosity of the upper part of the river is reduced by artificial longitudinal stream structures, including concrete embankments (mainly found along the Calderari and Bozzetta streams). Occasional bank protection stream structures can also be found along the main pathway (Bozzetta stream) up to the Nicoletti dam. In the upper part of the basin, we find traces of riparian forests. Along the river banks, spontaneous vegetation belonging to Salicetum albo-purpureae, with the presence of Salix purpurea, Salix alba, and Populus nigra, can be found. In the lower part of the basin, Tamarix africana and other species of Salix can be identified. The river banks are also rich in Arundo donax and Phragmites australis, belonging to the association of Phragmitetum communis. The predominant land use in the basin is non-irrigated arable land (66%, CLC 2018). During the lean period, upstream of the confluence with the Simeto River, the Dittaino is dominated by natural vegetation, while the floodplains are used to cultivate citrus and wheat.
3.2. Segmentation
Following step 4 of the first phase of IDRAIM, the fluvial system of the Dittaino River was subdivided into nine segments and 53 homogeneous reaches, identified by a code. Each segment contains between 3 and 11 reaches. The first six segments were subdivided by considering their confluences with major tributaries, in the form of hydrological up- and downstream nodes, while the last three segments are found in the downstream section of the Dittaino River. For each of these, reach length (m), mean width of the active channel (m), river morphology, confinement degree, index and class, average channel slope (m/km), and drainage area (km2) were calculated in a GIS environment. Statistic distribution (1st, 2nd, and 3rd) quartiles, as well as the minimum and maximum values of the main numeric parameters of reaches of the same order identified in the Dittaino River, are reported in Figure 4. The median values of the main numeric parameters (2nd quartile), and the most predominant river morphologies and confinement typologies in different reaches (of the same order), are reported in Table 6.
As expected, all the parameters showed increasing values and variability (difference between quartiles) with increasing reach order, with the exception of the confinement degree and the mean channel slope (Figure 5). Very high variability in the confinement degree and mean channel slope was observed for the seventh and eighth reach orders compared with the ninth and tenth reach orders. On the other hand, very low variability in the confinement index and the drainage area was observed for seventh, eighth and ninth reach orders compared with the tenth reach order. Moreover, the maximum value of the mean width of the active channel (calculated for each reach and equal to 328 m) was very different from the second highest value (equal to 153 m). The highest value of the mean width of the active channel was found in ID reach 107 of the Bozzetta river and it is the only anabranching channel (data not shown). The maximum mean channel slope value (equal to 11.90 m/km) was found for ID reach 101 of the Salito stream (data not shown). The maximum confinement index value (equal to 34.2) was found for ID reach 103 of the Dittaino stream (data not shown). The maximum drainage area (equal to 882 km2) was found for ID reach 202 of the Dittaino stream (data not shown).
The confinement degree of all reaches was correlated (by a logarithmic equation) negatively with the drainage area and the mean width of the active channel (R2 = 0.55 and 0.54, respectively), while it was positively correlated with the mean channel slope (R2 = 0.41). On the other hand, the confinement index of all reaches was correlated (by a potential equation) positively with the drainage area and the mean width of the active channel (R2 = 0.51 and 0.40), and negatively with the mean channel slope (R2 = 0.41) (Figure 6).
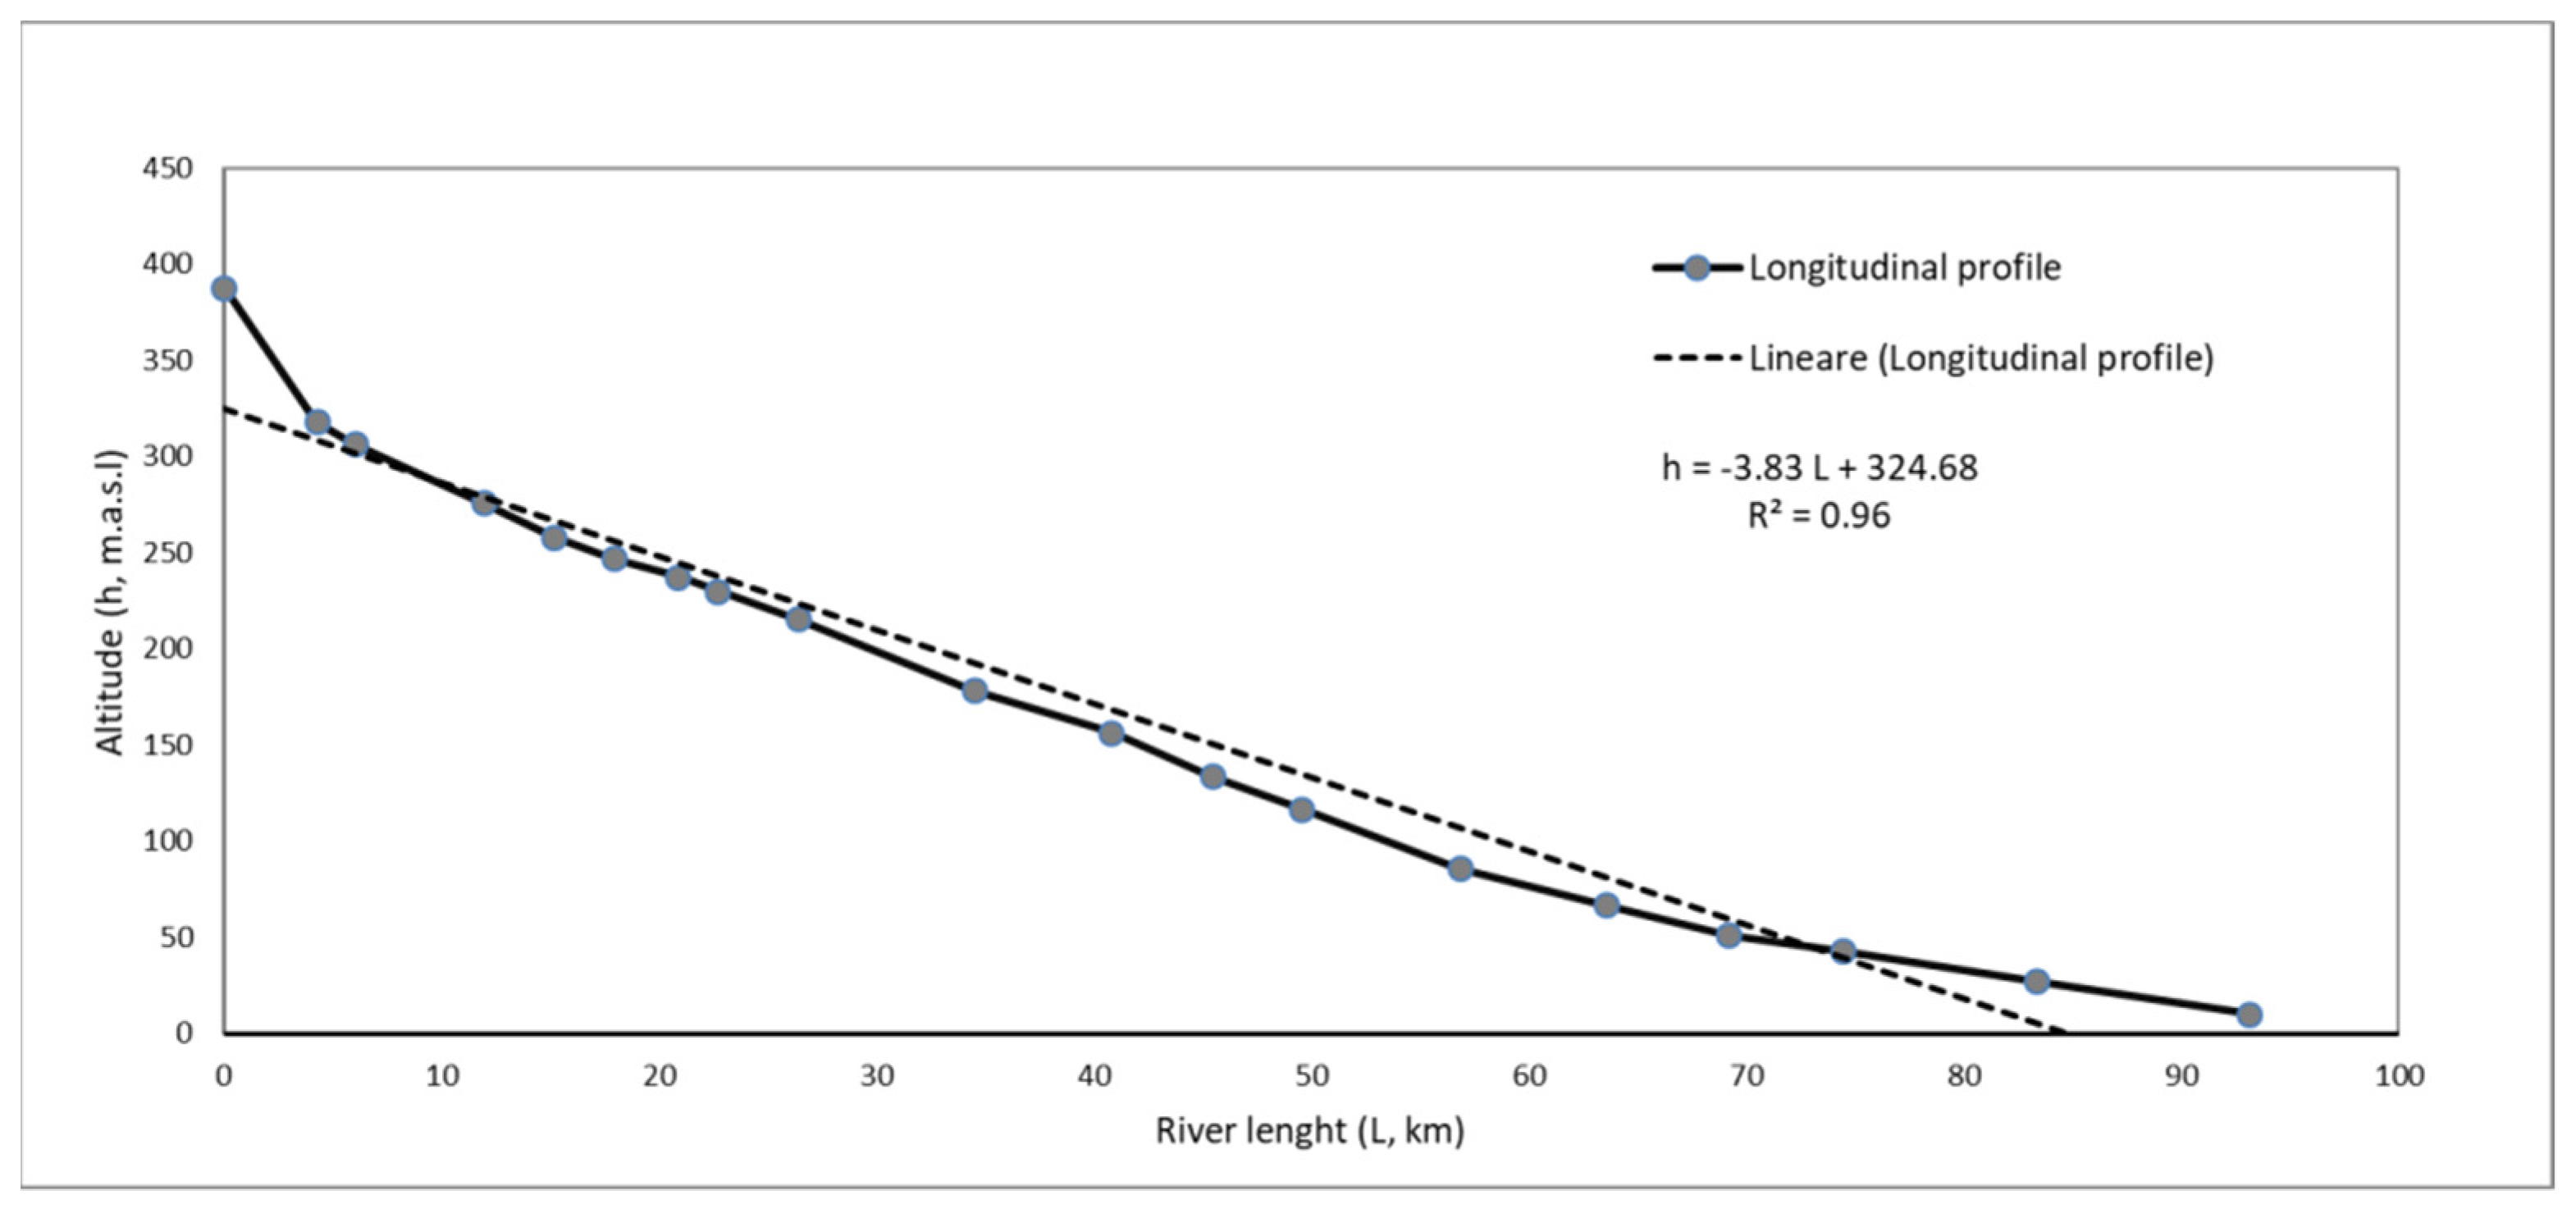
The fact that the median length values for the seventh and eighth reach orders were very similar (Table 6) may be due to the presence of small areas with homogeneous morphological and physiographical characteristics. In the seventh-order reach, the predominant (15 out of 22 reaches belong to Tenutella, Salito, Caldeari, Mulinello, and Crisa) morphological and confinement typology parameters were single-tread and C (with a confinement degree higher than 0.88, and a confinement index in the range of 1–1.2) (data not shown). The rest of the fluvial system (eighth, ninth, and tenth reach orders) displays a single-thread, sinuous, and meandering morphological typology, and a PC- and UC-predominant confinement typology as one moves downstream (Table 6). Figure 7 shows the longitudinal profile of the Dittaino River and the segments into which the main path was divided. The river descends 388 m over 93 km. The mean slope of the river segments ranges from 0.64% (R1909420 Bozzetta) to 0.21% (R1909415 Dittaino), while the reach slope ranges from 1.63% to 0.15%. The best-fit curve is linear (R2 = 0.96), indicating a low degree of concavity in the long profile, and showing that the grain size of the river is greater than its transportation capacity [40].
3.3. Morphological Quality Index
The statistical distributions (1st, 2nd, and 3rd quartiles), as well as the minimum and maximum values of MQI and its sub-indexes MQIF, MQIA and MQICA, for reaches of the same order identified in the Dittaino River are reported in Figure 8. The median values of the same indexes calculated for each of the nine identified segments are reported in Table 7; the MQI value of each reach is highlighted in the hydrological network reported in Figure 9 using different colors, to help in identifying the variation in the quality class along the segments. The results show that 45% and 22% of the analyzed segments were, respectively, of high and good quality. These were mainly located in the high hydrographical network (seventh–eighth), with some exceptions (Table 7). The segments with high MQI values were Tenutella (MQI = 0.97), Salito (MQI = 0.95), Mulinello (MQI = 0.92) and Caldeari (MQI = 0.89). Notwithstanding the high quality of the Salito stream, reach 402 (eighth order), immediately upstream of the confluence with the Bozzetta stream, was poor (MQI = 0.44), due to the continuous presence of bank protections and check-dams (Figure 9). Additionally, reach 101 of the Bozzetta stream (ninth order) was of poor quality (MQI = 0.48) because of the artificial structures (mainly the Nicoletti dam) located just upstream of the reach. These two reaches exhibited the lowest MQI values in the eighth and ninth reach orders, respectively (Figure 8). The Salito stream had the highest MQI variability of the eighth order reaches, as well as the highest MQI (0.95) and an MQI of 0.98 for the seventh-order reaches (Figure 8). The variability in MQI was lower for ninth-order reaches (with the maximum of 0.88, achieved by the Caldeari stream), followed by the tenth- (0.60 < MQI < 0.77) and seventh-order reaches (0.88 < MQI < 1) (Figure 9). Bozzetta (ninth- to tenth-order) and Crisa (seventh- to eighth-order) achieved only good MQI status. For the latter, this was mainly due to the high variability in the quality of its reaches (0.51 < MQI < 0.95), notwithstanding its position in the high part of the fluvial system. The MQI of the Dittaino River (representing 33% of the total fluvial system and 85% of the tenth-order reaches) was moderate due to the significant artificial changes (cutting off of a meander, bank protection) and adjustments made to channel pattern and width, as highlighted in Figure 3. In particular, the lowest MQI median values were found in the Dittaino R1909416 and R1909418 (MQI = 0.65) segments, followed by Dittaino R1909415 (MQI = 0.68).
Considering the statistical distribution of MQI and its sub-indices MQIF and MQIA, the values were shown to decrease with increasing order (Figure 8), with the exception of the ninth-order reaches, which attained higher values than the eighth-order reaches on average. Contrarily, the statistical distribution of the sub-index MQICA did not show a clear trend, with the minimum value being attained by the ninth-order reaches (Figure 8). In particular, the lowest values of MQICA were found for Caldeari (considering both seventh- and ninth-order reaches), while the highest values were found for the Dittaino River (Table 7). This may be because MQICA has been defined for channels with widths greater than 30 m [20].
3.4. Morphological Dynamic Index
The PC and UC reaches respectively constituted 40% and 32% of the whole Dittaino fluvial system. The MDI was calculated for 38 of the 53 reaches identified in the Dittaino River, over a length of 137,193 m (Table 8).
As regards the morphological changes indicator (V1), 50% of the reaches were characterized by configuration changes between contiguous morphologies, while the rest of the reaches displayed no changes (Table 9). As regards the width changes indicator (V2) (particularly the current status as compared to the morphological status from 1954), 32% of the reaches showed no width changes, while the rest displayed both narrowing and enlargement (Table 9).
Table 10 shows the minimum and maximum MDI values for each segment, and MDI class for each analyzed reach of the Dittaino fluvial system.
The MDI class was found to be high for 48% of the reaches (while still showing high morphological instability and predominant natural conditions), while it was medium for 47% and low for 5% of the reaches (mainly due to the artificial control). The classes with the highest MDI scores were mainly identified in the highest zones of the hydrographic network, where the MQI values were also found to be between good and high. In particular, four of the five analyzed reaches of the Salito deep valley (R1909419) showed high values of MDI, and one reach (named 402, and located immediately upstream of the confluence with the Bozzetta stream) showed a medium value, due to the continuous presence of bank protections and check-dams.
Four of the seven analyzed reaches of the Bozzetta (R1909420) showed high values of MDI, and three showed medium values due to the presence of artificial structures, such as the Nicoletti Dam, located upstream. The reaches of the Calderari (R1909421), Mulinello (R1909422), and Crisa (R1909435) attained both high and medium MDI values. Two of the five analyzed reaches of Dittaino R1909415 showed low MDI values, while the rest of the analyzed Dittaino reaches (R1909415, R1909416 and R1909418) fell into the medium MDI and MQI classes (Figure 10). For all of these reaches, the MQI class was moderate (Table 7). Similar limitations as those discussed for the MQI assessment were encountered during the application of the MDI procedure to the Dittaino River. Some of the limitations to the MDI index could be due to the fact that some of the testing was carried out in Italian Rivers (Aurino, Rienza, Tagliamento, Fella, Magra) characterized by physiographic and fluvial morphologies different from those observed in the Dittaino River [29].
4. Discussion
Although the characterization of the current morphological condition of the Dittaino River is the first step towards a thorough comprehension of the functioning of the hydro-morphological system, it represents a necessary starting point, and can be taken as a basis to plan future investigations aiming at safeguarding natural resources and ensuring sustainable river management. Hydro-morphological assessment is increasingly being recognized as fundamental to classifying and monitoring the ecological status of streams, and to supporting the identification of possible and sustainable management actions. Hydro-morphological assessment needs to be process-based, and to provide an overall evaluation of river conditions (i.e., pressure and response).
During the fluvial characterization of the Dittaino River, the confinement degree of all reaches was found to be correlated negatively with the drainage area and the mean width of the active channel, while it was positively correlated with the mean channel slope. This behavior, already detected in other rivers [31], could be related to tectonic and geologic legacy, and its effect on the geomorphological configuration of the reaches [42]. In particular, the negative correlation of the confinement degree with both the drainage area and the mean width of the active channel can be explained by the fact that reaches located in the upper part of the basin (characterized by a small drainage area) generally display high slopes and high degrees of confinement degree. The confinement index displays the opposite behavior, due to the fact that it is inversely proportional to the confinement degree; the minimum value of 1 indicates that the floodplain and channel coincide (i.e., there is no floodplain), while the index increases when the floodplain’s width increases relative to the channel’s width [29,31].
Despite all this, 45% and 22% of the analyzed reaches (belonging mainly to the seventh and eighth orders) were, respectively, of high and good quality; the MQI class decreased to good, and then to moderate in the downstream direction, and two reaches were of a poor class. Based on the details of Italian rivers characterized by moderate and medium values of MQI and MDI, respectively, partial restoration could be achieved by removing bank protections and by converting the old interception structures into new constructions designed based on the criteria of river restoration engineering. The moderate values of MQI (equal to 0.54) calculated for the Ahr/Aurino River increased to 0.73 following a restoration project, including the removal of river bank protections [20]. Reaches characterized by moderate values of MQI generally received greater restoration benefits compared with reaches of good or high quality [43].
As also highlighted by other authors [17], a series of limitations were identified during the application of the MQI method to the Dittaino River. First of all, some of the indicators were extremely simplified, and there was a strong degree of subjectivity in the scoring of the indexes, in relation to the experience and training of the operators. In general, the reaches with the greatest degree of morphological alteration showed: (i) poor connectivity between hill slopes and river corridor (mainly caused by the presence of roads), which is very important for the natural input of sediment; (ii) the absence of vegetation in the river corridor, which is intrinsic to a range of geomorphic processes, due to human alteration; and (iii) the presence of artificial elements, such as bed-load interception structures in the basin, bank protections along the reach, and the removal of sediment, wood, and vegetation, as already highlighted in [26]. Moreover, MQI assessment necessitated the definition of numerous indicators, and sometimes the coded answers were not suitable for the hydrological and geomorphological conditions of the Dittaino River, given that most of the streams used in the testing phase of the procedure are localized in central and Northern Italy [17], and some of the characteristics of rivers under Mediterranean weather conditions were not adequately considered. In the Mediterranean region, streams are characterized by irregular water flow and harsh hydrological fluctuations, the typical pattern involving floods in autumn–winter, and droughts developing gradually and continuously over the summer. Therefore, most rivers and streams, especially in the semi-arid regions of the southern Mediterranean, present a mixture of permanent flow (perennial) and natural intermittent flow (low flow that completely dries out in the summer) regimes. This can influence the development of macrophite communities, primarily by increasing the competition for space and resources, since habitats shrink, and the water quality deteriorates during low flow conditions [44].
5. Conclusions
In this fluvial system (subdivided in 53 reaches), the mean values of length, width of the active channel, and the confinement index increased with the reach order, and the mean values of confinement degree and channel slope decreased with the reach order. The predominant morphological typologies were single-thread, sinuous, and meandering in the downstream direction. The predominant confinement typologies were C, PC, and UC in the downstream direction. The variability in confinement degree and mean channel slope was greater for reaches of a lower order, while the variability in confinement index, length, mean width of the active channel, and drainage area was greater for reaches of a higher order. That being said, 45% and 22% of the analyzed reaches (mainly belonging to the seventh and eighth orders) were, respectively, of high and good quality; the MQI class decreased to good, and then to moderate in the downstream direction, and two reaches were of a poor class. In particular, reach 402 of the Salito, immediately upstream of the confluence with the Bozzetta stream, was poor due to the continuous presence of bank protections and check-dams, and reach 101 of the Bozzetta stream was poor because of the Nicoletti dam, located just upstream. To assess the existing risks from a dynamic morphological perspective, the MDI was assessed for PC and UC reaches. The MDI class was high for 48% of the reaches, medium for 47%, and low for just 5% of the reaches. The highest MDI classes were primarily identified in the highest zones of the hydrographic network, where the MQI classes were between good and high. Again, reaches 402 of the Salito and 101 of the Bozzetta showed medium MDI values due to the presence of artificial control structures.
Some limitations and strengths were identified during the application of the MQI method to the Dittaino River. Both the high number of indicators required by the MQI procedure and the simplification of some mean that the method should be carried out by trained personnel with appropriate backgrounds and sufficient skills in fluvial geomorphology, GIS/remote sensing analysis, and field survey interpretation, in order to reduce bias and derive repeatable results. On the other hand, the simplification of some indicators makes the method easily applicable to a large number of reaches in a relatively short time. Moreover, the results were often unsuitable for the hydrological and geomorphological conditions of the Dittaino River. Moreover, the need to compare present conditions with those of the past necessitated the use of poorly defined historical IGM maps from 1954, producing some difficulties in the interpretation of results.
Although, in general, the IDRAIM procedure does not seem to be able to provide precise design indications that can improve the dynamic morphological conditions of the river, it constitutes a suitable tool for assessing the present geomorphological conditions of a given stream reach (by MQI class), and specifically, the deviation of such conditions from a given point. It also supports the assessment of the dynamic morphological risk (by MDI classes). The application of the IDRAIM procedure to the whole hydrological network of large basins can help prioritize necessary areas of intervention.
Moreover, the novelty of using the IDRAIM procedure to combine the WFD and FD directives is plain, achieved through an integrated analysis of morphological quality and channel dynamic hazards specific to the Italian context.
This is very important because the assessment of a river’s ecological status, including its hydro-morphological and morphological dynamics, which can be used for the implementation of design models and interventions integrating protection and environmental requalification, requires the evaluation of hydro-morphological state changes. As such, the IDRAIM procedure could help in sustainable river management.
Author Contributions
Conceptualization, F.L., A.T., G.L.C.; data curation, S.M.M., E.R.G.; formal analysis, F.L., G.L.C.; investigation, S.M.M.; methodology, F.L., A.T., G.L.C.; supervision, S.B.; validation, F.L., A.T., G.L.C.; writing—original draft, F.L., S.M.M., E.R.G.; writing—review and editing, F.L., S.B., A.T., G.L.C. All authors have read and agreed to the published version of the manuscript.
Funding
This research was funded by the University of Catania-PIAno di inCEntivi per la RIcerca di Ateneo 2020/2022—Linea di Intervento 3 “Starting Grant” and by the University of Catania-Piano per la ricerca 2016-2018—Linea di intervento 2 “Dotazione ordinaria”—P2/WP1.
Institutional Review Board Statement
Not applicable.
Informed Consent Statement
Not applicable.
Data Availability Statement
Data supporting reported results can be found at the Dipartimento di Agricoltura, Alimentazione e Ambiente (Di3A), Università di Catania.
Acknowledgments
The authors thank their former students, Caggegi Adriano, Greco Francesco, and Lazzaro Bruna Concetta, for their invaluable contributions during field surveys and their collaboration in the data analysis, which was included in their Masters’ theses.
Conflicts of Interest
The authors declare no conflict of interest.
References
- de Musso, N.M.; Capolongo, D.; Caldara, M.; Surian, N.; Pennetta, L. Channel Changes and Controlling Factors over the Past 150 Years in the Basento River (Southern Italy). Water 2020, 12, 307. [Google Scholar] [CrossRef] [Green Version]
- Rinaldi, M.; Surian, N.; Comiti, F.; Bussettini, M. IDRAIM—Sistema di Valutazione Idro-Morfologica, Analisi e Monitoraggio dei Corsi D’acqua—ISPRA. 2014. Available online: https://www.isprambiente.gov.it/en/publications/handbooks-and-guidelines/idraim-system-of-hydromorphological-assessment-analysis-and-monitoring-of-water-courses (accessed on 9 September 2021).
- Surian, N.; Mao, L.; Giacomin, M.; Ziliani, L. Morphological effects of different channel forming discharges in a gravel-bed river. Earth Surf. Process. Landf. 2009, 34, 1093–1107. [Google Scholar] [CrossRef]
- Preciso, E.; Salemi, E.; Billi, P. Land use changes, torrent control works and sediment mining: E_ects on channel morphology and sediment flux, case study of the Reno River (Northern Italy). Hydrol. Process. 2012, 26, 1134–1148. [Google Scholar] [CrossRef]
- Stecca, G.; Zolezzi, G.; Hicksa, D.M.; Surian, N. Reduced braiding of rivers in human-modified landscapes: Converging trajectories and diversity of causes. Earth-Sci. Rev. 2019, 188, 291–311. [Google Scholar] [CrossRef] [Green Version]
- Montgomery, D.R.; Buffington, J.M. Channel-reach morphology in mountain drainage basins. Geol. Soc. Am. Bull. 1997, 109, 596–611. [Google Scholar] [CrossRef]
- Montgomery, D.R.; Gran, K.B. Downstream variations in the width of bedrock channels. Water Resour. Res. 2001, 37, 1841–1846. [Google Scholar] [CrossRef]
- Garde, R.J. River Morphology; New Age International Ltd.: New Delhi, India, 2006; p. 502. [Google Scholar]
- Rosgen, D.L. A classification of natural rivers. Catena 1994, 22, 169–199. [Google Scholar] [CrossRef] [Green Version]
- Gurnell, A.M.; Corenblit, D.; García de Jalón, D.; González del Tánago, M.; Grabowski, R.C.; O’Hare, M.T.; Szewczyk, M. A conceptual model of vegetation–hydrogeomorphology interactions within river corridors. River Res. Appl. 2016, 32, 142–163. [Google Scholar] [CrossRef]
- Palmer, M.A.; Bernhardt, E.S.; Allan, J.D.; Lake, P.S.; Alexander, G.; Brooks, S.; Carr, J.; Clayton, S.; Dahm, C.N.; Shah, J.F.; et al. Standard for ecologically successful river restoration. J. Appl. Ecol. 2005, 42, 208–217. [Google Scholar] [CrossRef]
- Schneider, C.; Flörke, M.; De Stefano, L.; Petersen-Perlman, J.D. Hydrological threats to riparian wetlands of international importance—A global quantitative and qualitative analysis. Hydrol. Earth Syst. Sci. 2017, 21, 2799–2815. [Google Scholar] [CrossRef] [Green Version]
- European Commission. Directive 2000/60/EC of the European Parliament and of the Council of 23 October 2000 Establishing a Framework for Community Action in the Field of Water Policy. Available online: https://eur-lex.europa.eu/resource.html?uri=cellar:5c835afb-2ec6-4577-bdf8-756d3d694eeb.0006.02/DOC_1&format=PDF (accessed on 9 September 2021).
- Vaughan, I.P.; Diamond, M.; Gurnell, A.M.; Hall, K.A.; Jenkins, A.; Milner, N.J.; Naylor, L.A.; Sear, D.A.; Woodward, G.; Ormerod, S.J. Integrating ecology with hydromorphology: A priority for river science and management. Aquat. Conserv. Mar. Freshwater Ecosyst. 2009, 19, 113–125. [Google Scholar] [CrossRef] [Green Version]
- Szoszkiewicz, K.; Jusik, S.; Gebler, D.; Achtenberg, K.; Adynkiewicz-Piragas, M.; Radecki-Pawlik, A.; Okruszko, T.; Giełczewski, M.; Marcinkowski, P.; Pietruczuk, K.; et al. Hydromorphological Index for Rivers (HIR): A New Method for Hydromorphological Assessment and Classification for Flowing Waters in Poland. J. Ecol. Eng. 2020, 21, 261–271. [Google Scholar] [CrossRef]
- Bechter, T.; Baumann, K.; Birk, S.; Bolik, F.; Graf, W.; Pletterbauer, F. LaRiMo—A simple and efficient GIS-based approach for large-scale morphological assessment of large European river. Sci. Total Environ. 2018, 628–629, 1191–1199. [Google Scholar] [CrossRef] [PubMed]
- Rinaldi, M.; Surian, N.; Comiti, F.; Bussettini, M. A method for the assessment and analysis of the hydro-morphological condition of Italian streams: The Morphological Quality Index (MQI). Geomorphology 2013, 180–181, 96–108. [Google Scholar]
- Bellini, E. Boden und Bauen. Stand der Technik und Praktiken (Soil and Construction. State of the Knowledge); Umwelt-Wissen Nr. 1508; BAFU Bundesamt für Umwelt: Bern, Switzerland, 2015. [Google Scholar]
- Belletti, B.; Rinaldi, M.; Buijse, A.D.; Gurnell, A.M.; Mosselman, E. A review of assessment methods for river hydromorphology. Environ. Earth Sci. 2015, 73, 2079–2100. [Google Scholar] [CrossRef]
- Rinaldi, M.; Belletti, B.; Bussettini, M.; Comiti, F.; Golfieri, B.; Lastoria, B.; Marchese, E.; Nardi, L.; Surian, N. New tools for the hydromorphological assessment and monitoring of European streams. J. Environ. Manag. 2017, 202, 363–378. [Google Scholar] [CrossRef]
- Belletti, B.; de Leaniz, C.G.; Jones, J.; Bizzi, S.; Börger, L.; Segura, G.; Castelletti, A.; van de Bund, W.; Aarestrup, K.; Barry, J.; et al. More than one million barriers fragment Europe’s rivers. Nature 2020, 588, 436–454. [Google Scholar] [CrossRef] [PubMed]
- Moretto, J. Linking River Channel Forms and Processes in Gravel Bed Rivers: Time, Space, Remote Sensing and Uncertainty. Ph.D. Thesis, University of Padua, Padua, Italy, 2014. [Google Scholar]
- European Commission. Directive 2007/60/EC of the European Parliament and of the Council of 23 October 2007 on the Assessment and Management of Flood Risks. Available online: https://eur-lex.europa.eu/legal-content/EN/TXT/PDF/?uri=CELEX:52015DC0120&from=EN (accessed on 9 September 2021).
- Rinaldi, M.; Surian, N.; Comiti, F.; Bussettini, M.; Nardi, L.; Lastoria, B. IDRAIM: A Methodological Framework for Hydro-morphological Analysis and Integrated River Management of Italian Streams. Eng. Geol. Soc. Territ. 2015, 3, 301–304. [Google Scholar] [CrossRef]
- Brierley, G.J.; Fryirs, K.A. Geomorphology and River Management: Applications of the River Style Framework; Blackwell: Oxford, UK, 2005. [Google Scholar]
- Rigon, E.; Moretto, J.; Rainato, R.; Lenzi, M.A.; Zorzi, A. Evaluation of the morphological quality index in the Cordevole river (Bl, Italy). J. Agric. Eng. 2013, 44, e15. [Google Scholar] [CrossRef]
- Cencetti, C.; De Rosa, P.; Fredduzzi, A. L’indice di qualità morfologica (IQM) dei corsi d’acqua: Applicazione del metodo di valutazione al F. Chiani (Italia centrale). In Atti 14° Conf. Naz; ASITA: Brescia, Italy, 2010; pp. 553–559. [Google Scholar]
- Nardi, L.; Rinaldi, M. The Magra River (Italy). In Effects of the 25th October 2011 Flood Event and a Preliminary Application of the IDRAIM Framework; Springer International Publishing: Cham, Switzerland, 2015. [Google Scholar]
- Rinaldi, M.; Surian, N.; Comiti, F.; Bussettini, M. IDRAIM—Sistema di Valutazione Idromorfologica, Analisi e Monitoraggio dei corsi D’acqua—Versione Aggiornata 2016—ISPRA—Manuali e Linee Guida 131/2016. Roma, Gennaio. 2016. Available online: https://www.cirf.org/it/idraim-sistema-di-valutazione-idromorfologica-analisi-e-monitoraggio-dei-corsi-dacqua/ (accessed on 9 September 2021).
- Agenzia Interregionale per il Fiume Po. Adeguamento Strutturale e Funzionale del Sistema Arginale Difensivo Tramite Interventi di Adeguamento in Quota e in Sagoma a Valle Della Cassa Fino al Confine Regionale per Garantire il Franco di 1 Metro, Rispetto Alla Piena di TR20 Anni Nello Stato Attuale, e la Stabilità e Resistenza dei Rilevati. 2018. Available online: https://serviziambiente.regione.emilia-romagna.it (accessed on 9 September 2021).
- Ulloa, H.; Mazzorana, B.; Batalla, R.J.; Jullian, C.; Iribarren-Anacona, P.; Barrientos, G.; Reid, B.; Oyarzun, C.; Schaefer, M.; Iroumé, A. Morphological characterization of a highly-dynamic fluvial landscape: The River Baker (Chilean Patagonia). J. S. Am. Earth Sci. 2018, 86, 1–14. [Google Scholar] [CrossRef]
- Rinaldi, M.; Surian, N.; Comiti, F.; Bussettini, M. Guidebook for the Evaluation of Stream Morphological Conditions by the Morphological Quality Index (MQI). Istituto Superiore per la Protezione e la Ricerca Ambientale: Roma, Italic, 2016; p. 90. [Google Scholar]
- Loreggian, M. Applicazione Dell’indice di Qualità Morfologica (IQM) a Tredici Tratti dei Torrenti Fiorentina e Cordevole; Relatore Lenzi, M.A., Correlatore Rigon, E., Eds.; Dipartimento Territorio e Sistemi Agro-forestali, Facoltà di Agraria, Università degli Studi di Padova: Legnaro, Italy, 2013; Available online: http://tesi.cab.unipd.it/42972/1/Loreggian_Matteo.pdf (accessed on 9 September 2021).
- Lazzaro, B. “La valutazione della qualità morfologica dei corsi d’acqua: Il caso studio del Fiume Dittaino (Sicilia Orientale)”. Relatore Prof. Ing. Attilio Toscano. Dipartimento di Agricoltura, Alimentazione e Ambiente (Di3A), Catania. 2015. Available online: https://www.unict.it/ (accessed on 9 September 2021).
- Strahler, A. Quantitative Geomorphology of Drainage Basins and Channel Networks. In Handbook of Applied Hydrology; Chow, V., Ed.; McGraw Hill: New York, NY, USA, 1964; pp. 439–476. [Google Scholar]
- Schumm, S.A. The Fluvial System; Wiley: New York, NY, USA, 1977; p. 338. [Google Scholar]
- Church, M.A. Channel Morphology and Typology. In The Rivers Handbook; Callow, P., Petts, E.G., Eds.; Blackwell: Oxford, UK, 1992; pp. 126–143. [Google Scholar]
- Rinaldi, M. Recent channel adjustment in alluvial rivers of Tuscany, Central Italy. Earth Surf. Process. Landf. 2003, 28, 587–608. [Google Scholar] [CrossRef]
- Surian, N.; Rinaldi, M. Morphological response to river engineering and management in alluvial channels in Italy. Geomorphology 2003, 50, 307–326. [Google Scholar] [CrossRef]
- Lee, C.; Tsai, L.L. A quantitative analysis for geomorphic indices of longitudinal river profile: A case study of the Choushui River, Central Taiwan. Environ. Earth Sci. 2009, 59, 1549–1558. [Google Scholar] [CrossRef]
- Hack, J.T. Stream profile analysis and stream gradient index. J. Res. Us Geol. Surv. 1973, 1, 421–429. [Google Scholar]
- Georgieva, V.; Melnick, D.; Schildgen, F.; Ehlers, A.T.; Lagabrielle, Y.; Enkelmann, E.; Trecker, M.R. Tectonic Control on Rock Uplift, Exhumation, and Topography Above an Oceanic Ridge Collision: Southern Patagonian Andes (47°s), Chile. Tectonics 2016, 35, 1317–1341. [Google Scholar] [CrossRef] [Green Version]
- Belletti, B.; Nardi, L.; Rinaldi, M.; Poppe, M.; Brabec, K.; Bussettini, M.; Comiti, F.; Gielczewski, M.; Golfieri, B.; Hellsten, S.; et al. Assessing Restoration Effects on River Hydromorphology Using the Process-based Morphological Quality Index in Eight European River Reaches. Environ. Manag. 2018, 61, 69–84. [Google Scholar] [CrossRef] [PubMed]
- Manolaki, P.; Guo, K.; Vieira, C.; Papastergiadou, E.; Riis, T. Hydromorphology as a controlling factor of macrophytes assemblage structure and functional traits in the semi-arid European Mediterranean streams. Sci. Total Environ. 2020, 703, 134658. [Google Scholar] [CrossRef]
Figure 1.
Workflow of the IDRAIM procedure (as modified by [22]).
Figure 1.
Workflow of the IDRAIM procedure (as modified by [22]).
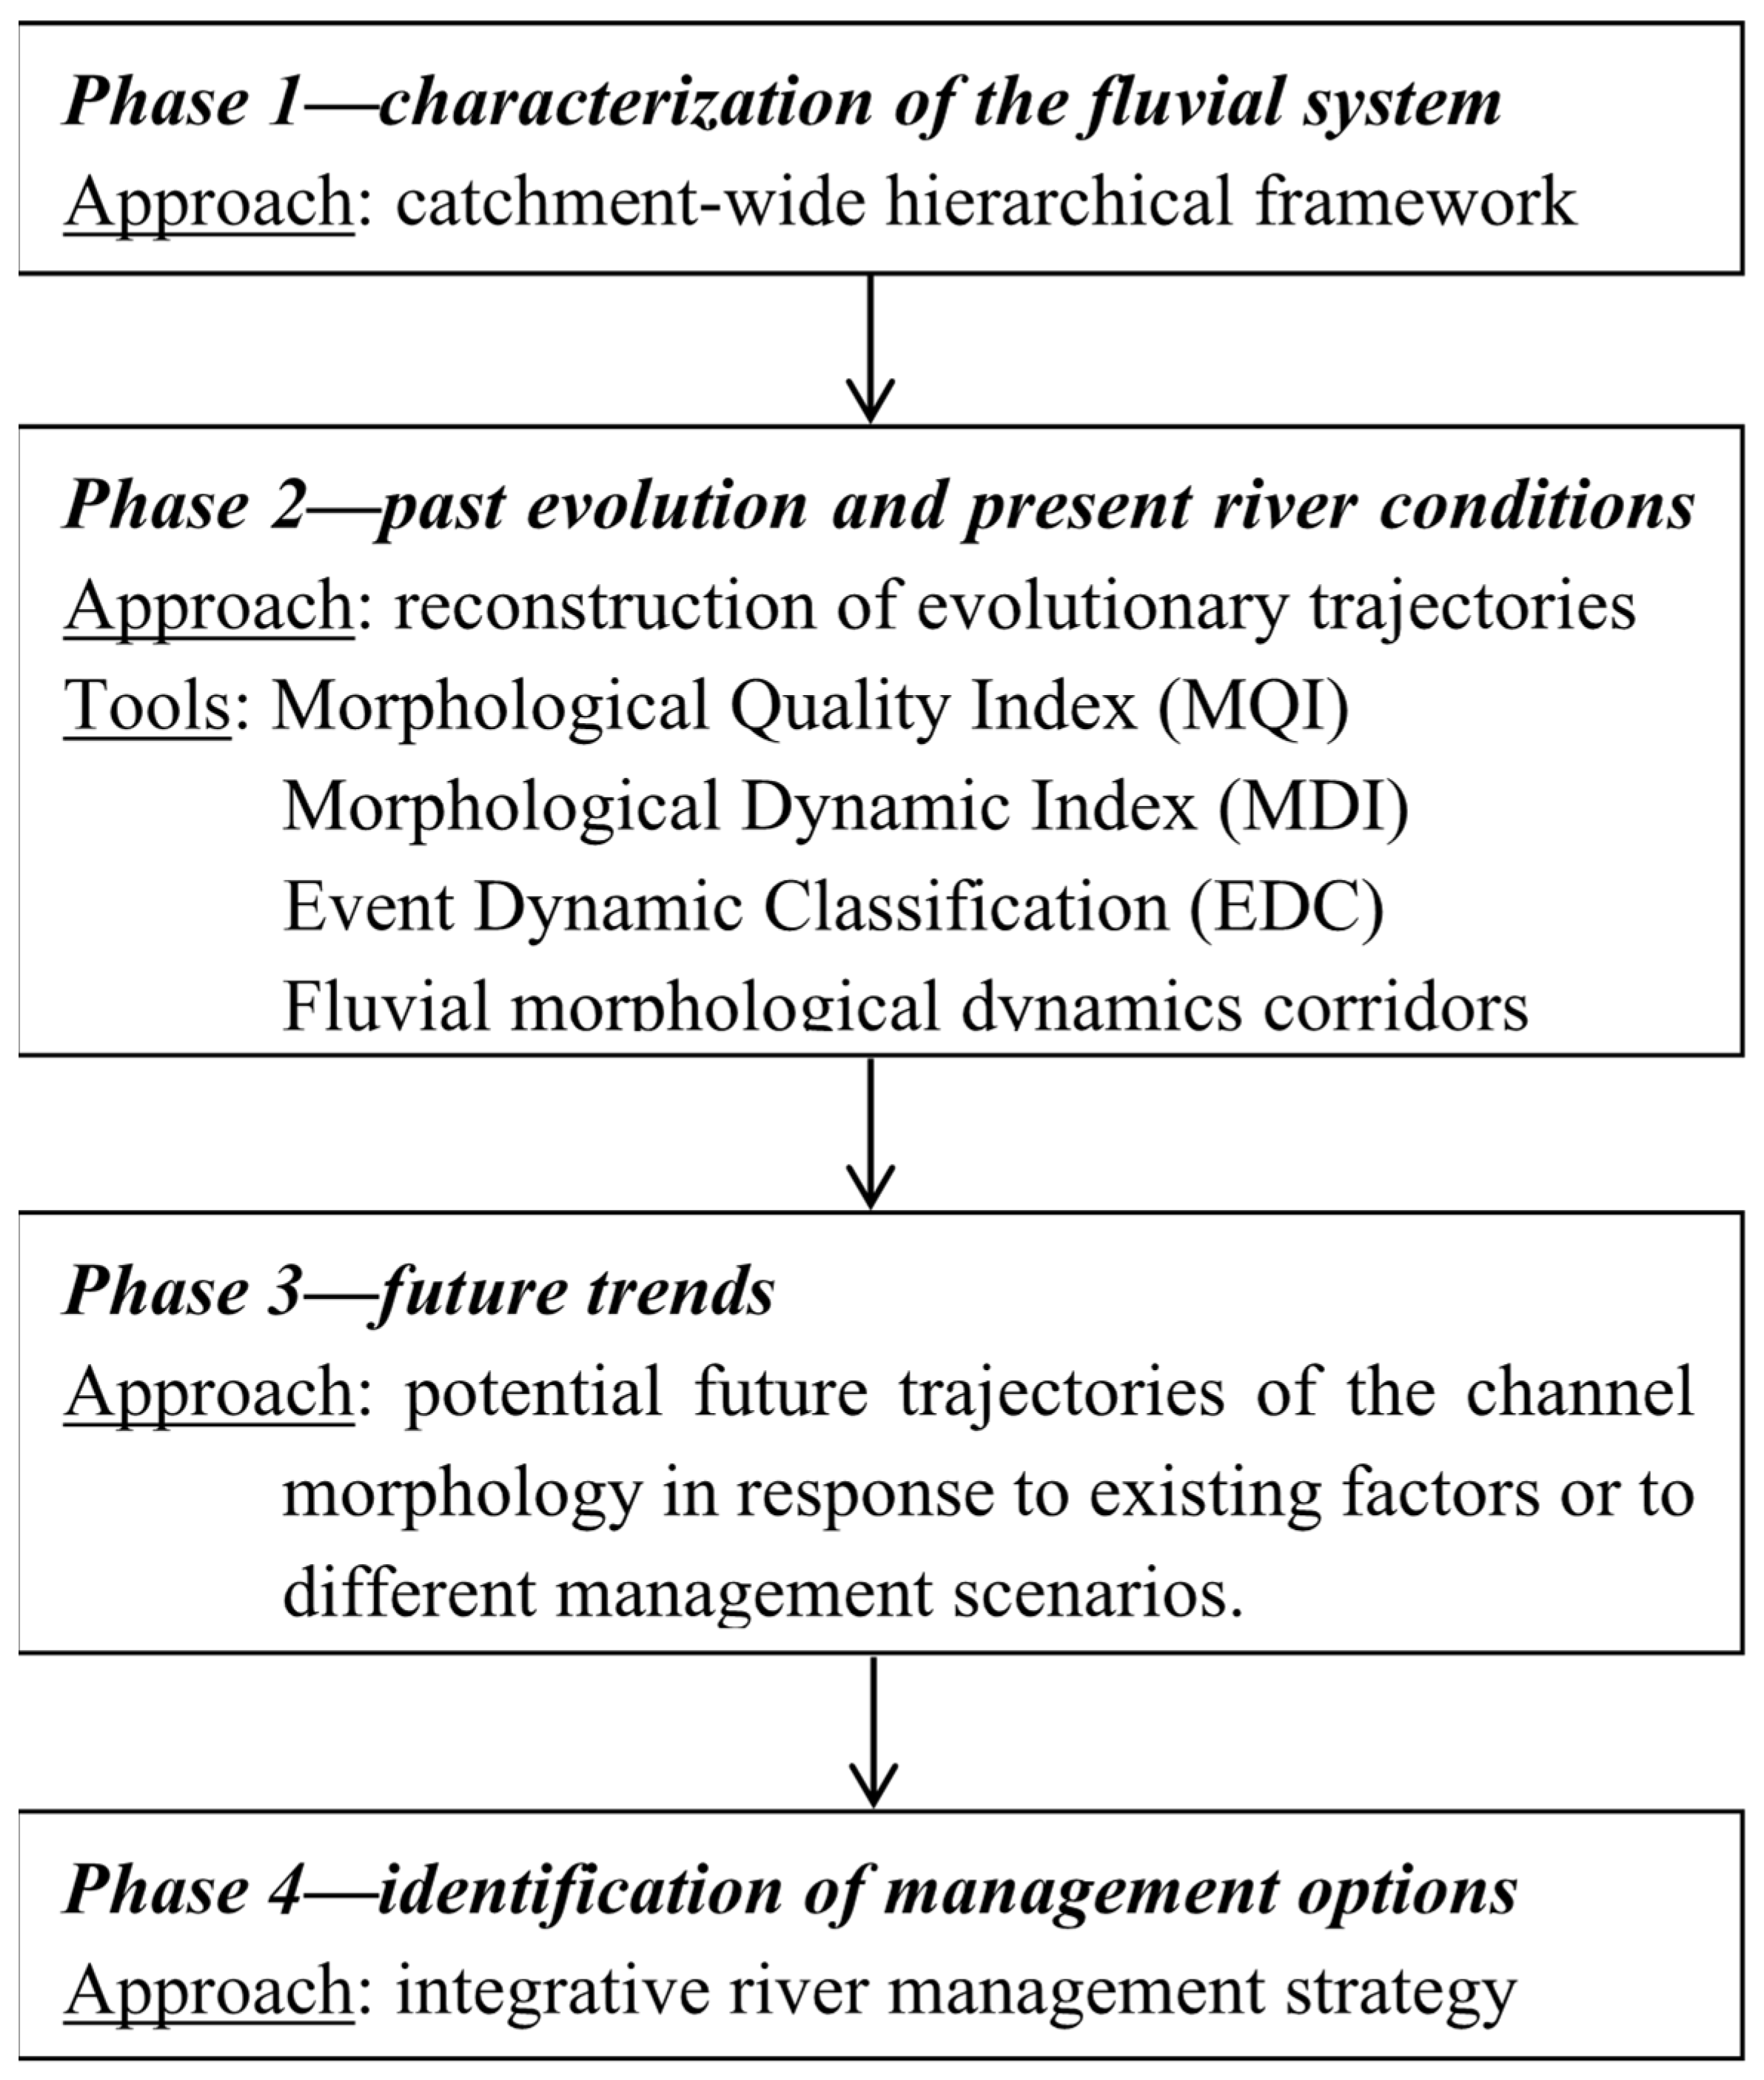
Figure 2.
Comparison between remote sensing images (Orthophotos 2008) and maps of the flight IGM GAE of 1954/55.
Figure 2.
Comparison between remote sensing images (Orthophotos 2008) and maps of the flight IGM GAE of 1954/55.

Figure 3.
Map of the Dittaino River basin, with stream order and elevation.
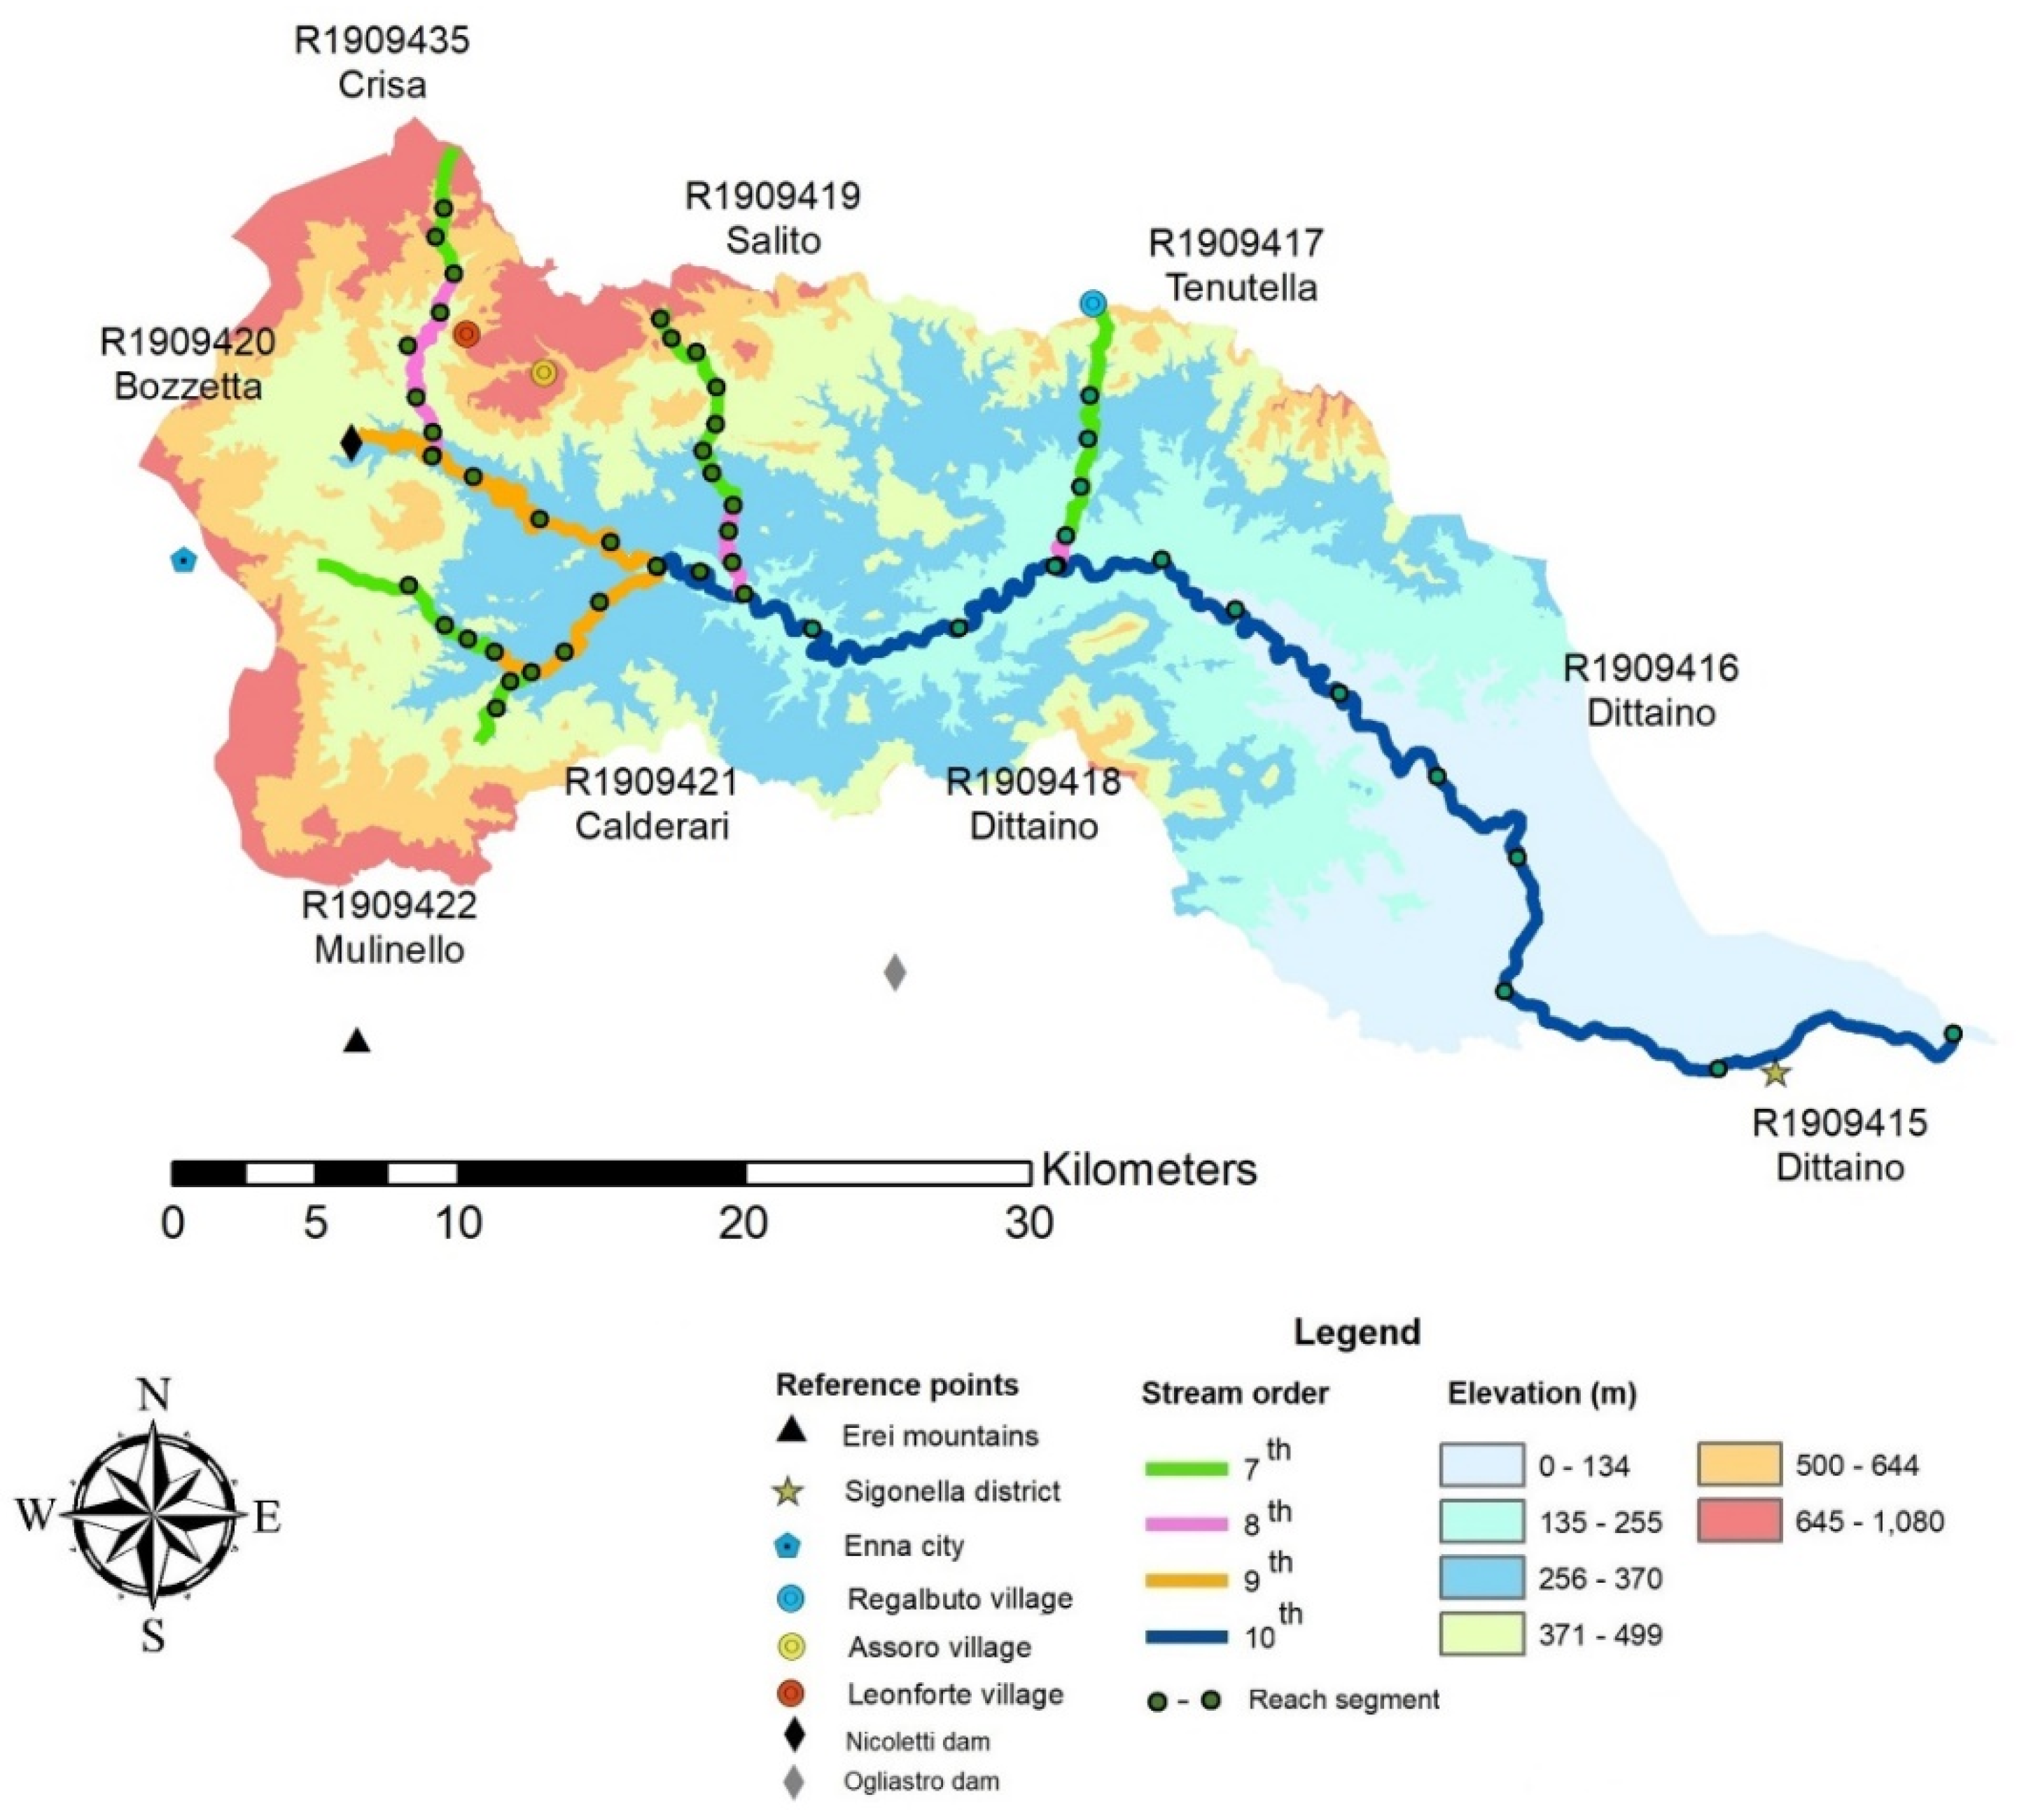
Figure 4.
The study area. (a) Dittaino River; (b) abstraction weirs; (c) Nicoletti dam.

Figure 5.
Statistical distributions (1st, 2nd, and 3rd quartiles) as well as minimum and maximum values of the main numeric parameters for reaches of the same order identified in the Dittaino River. Maximum values are given in text boxes to make the figure more readable.
Figure 5.
Statistical distributions (1st, 2nd, and 3rd quartiles) as well as minimum and maximum values of the main numeric parameters for reaches of the same order identified in the Dittaino River. Maximum values are given in text boxes to make the figure more readable.
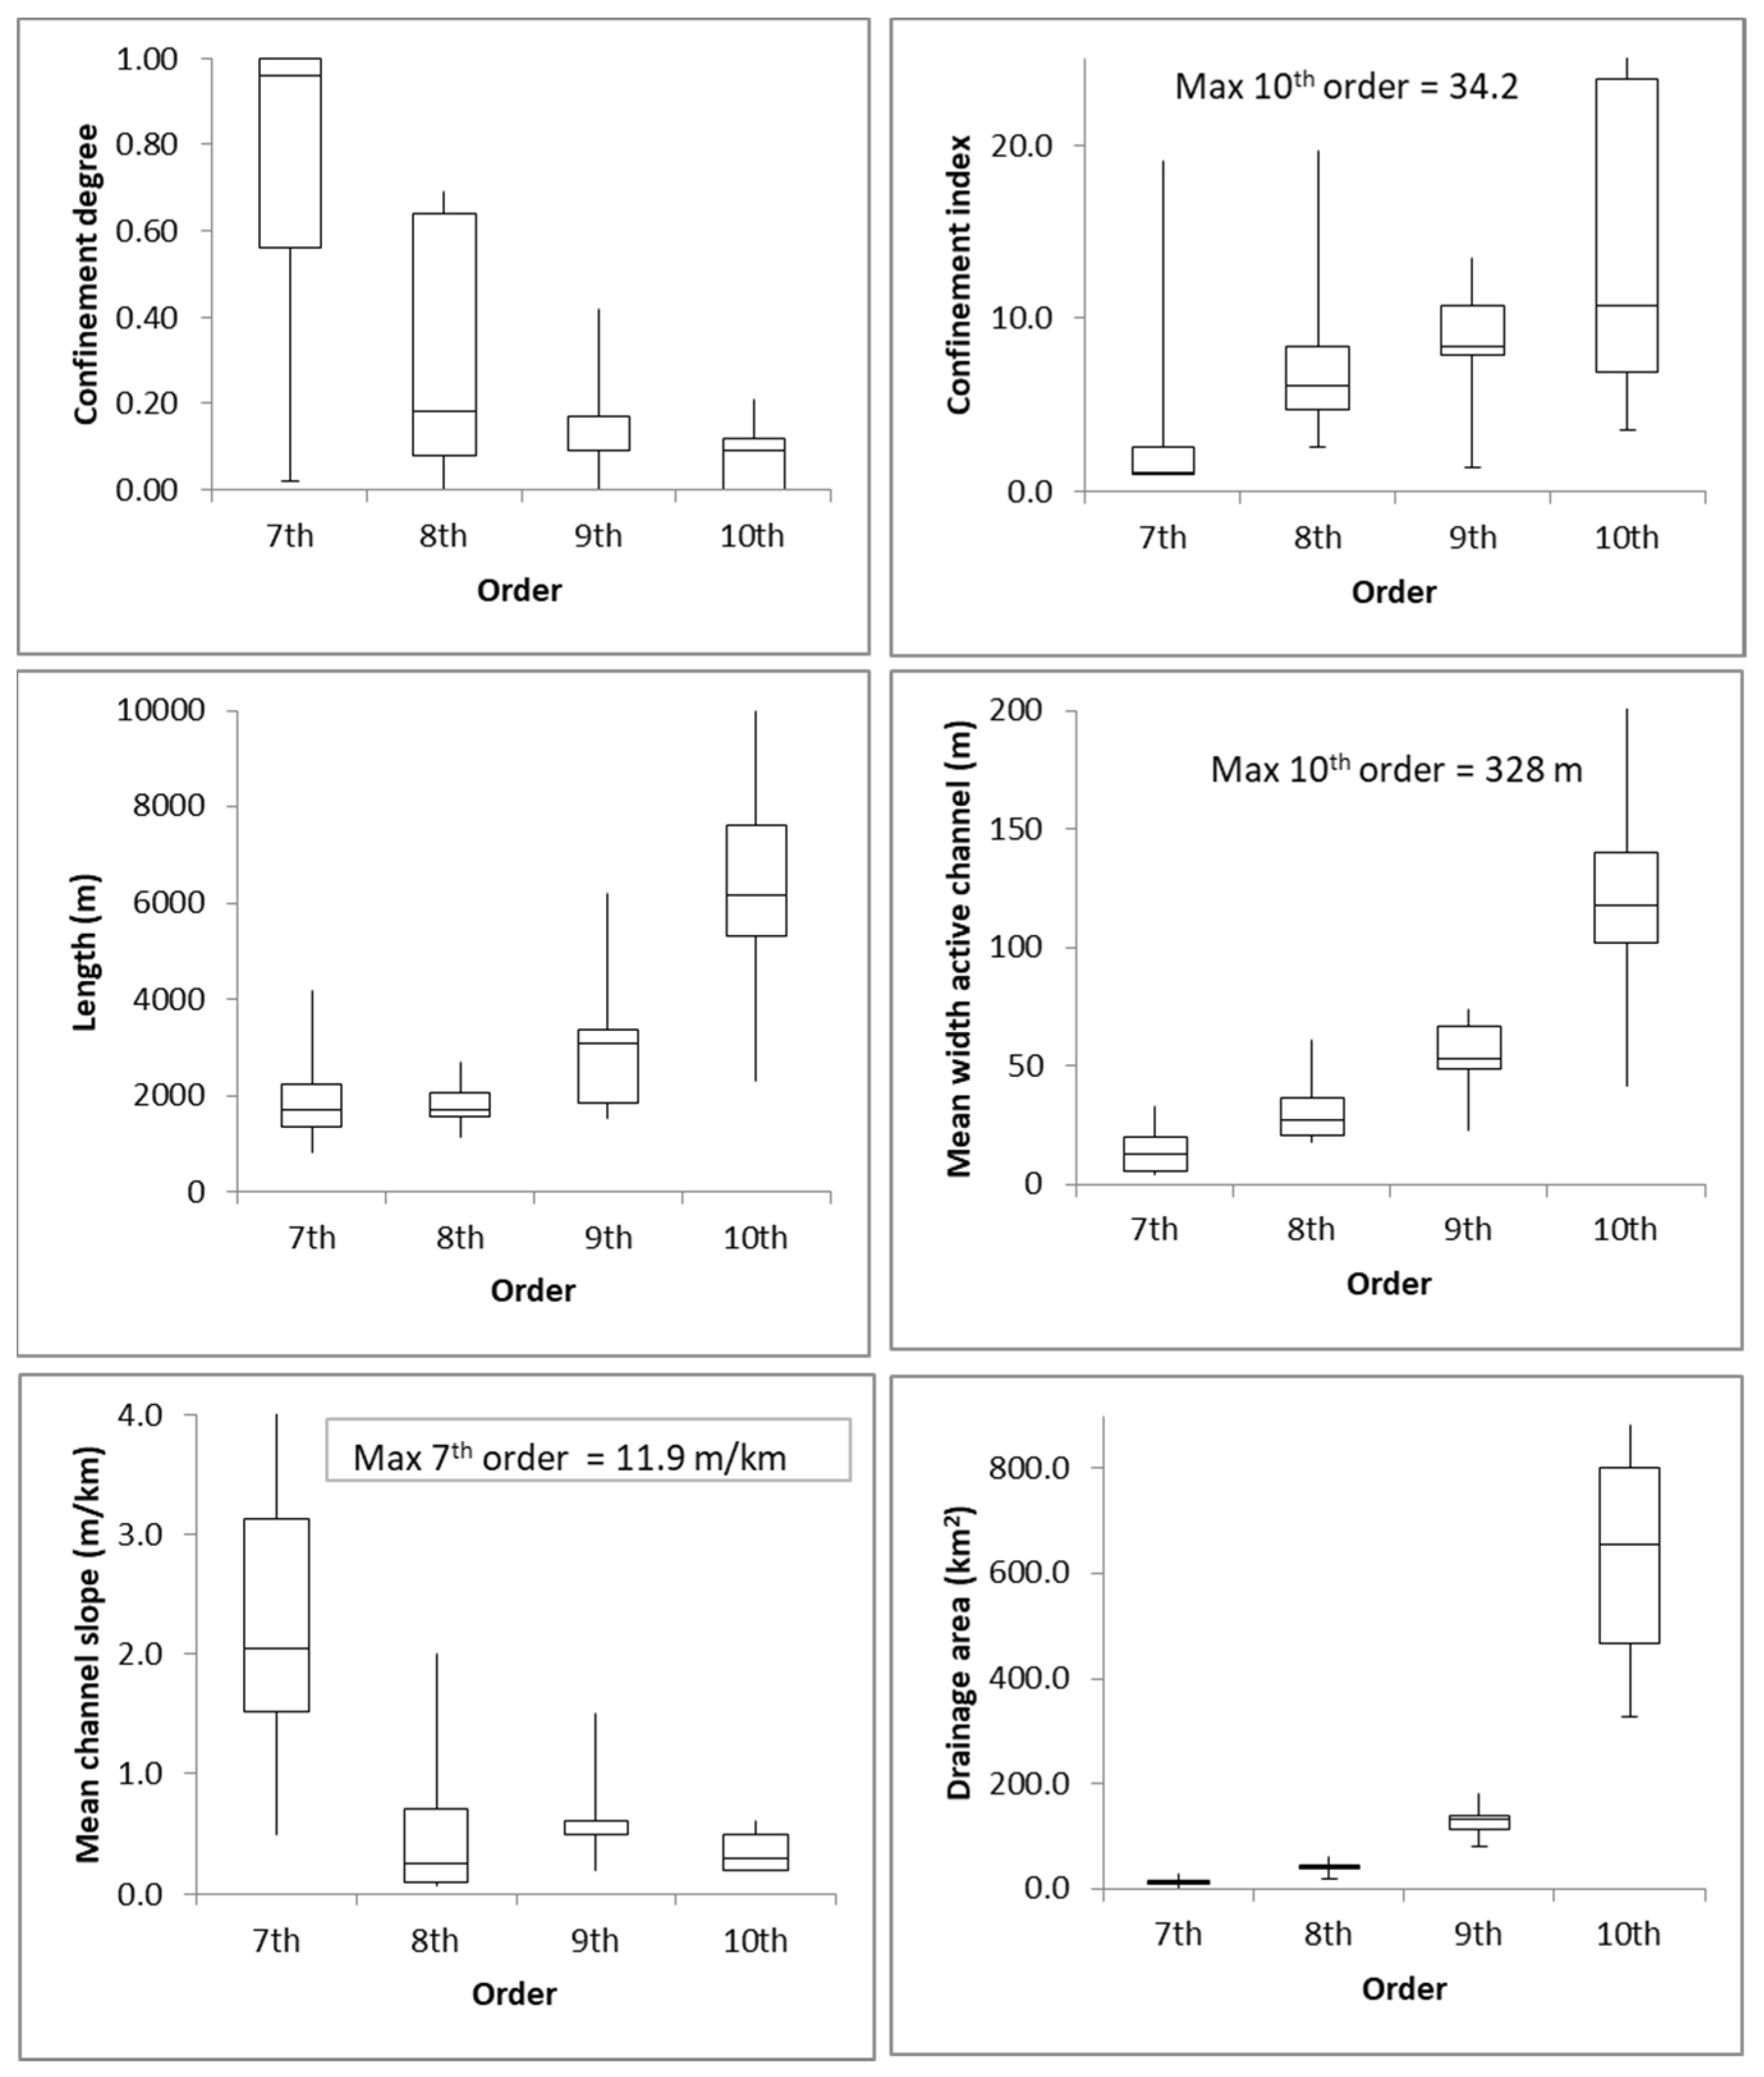
Figure 6.
Confinement degree and index vs. drainage area, mean width of the active channel and mean channel slope for all reaches identified in the Dittaino River.
Figure 6.
Confinement degree and index vs. drainage area, mean width of the active channel and mean channel slope for all reaches identified in the Dittaino River.
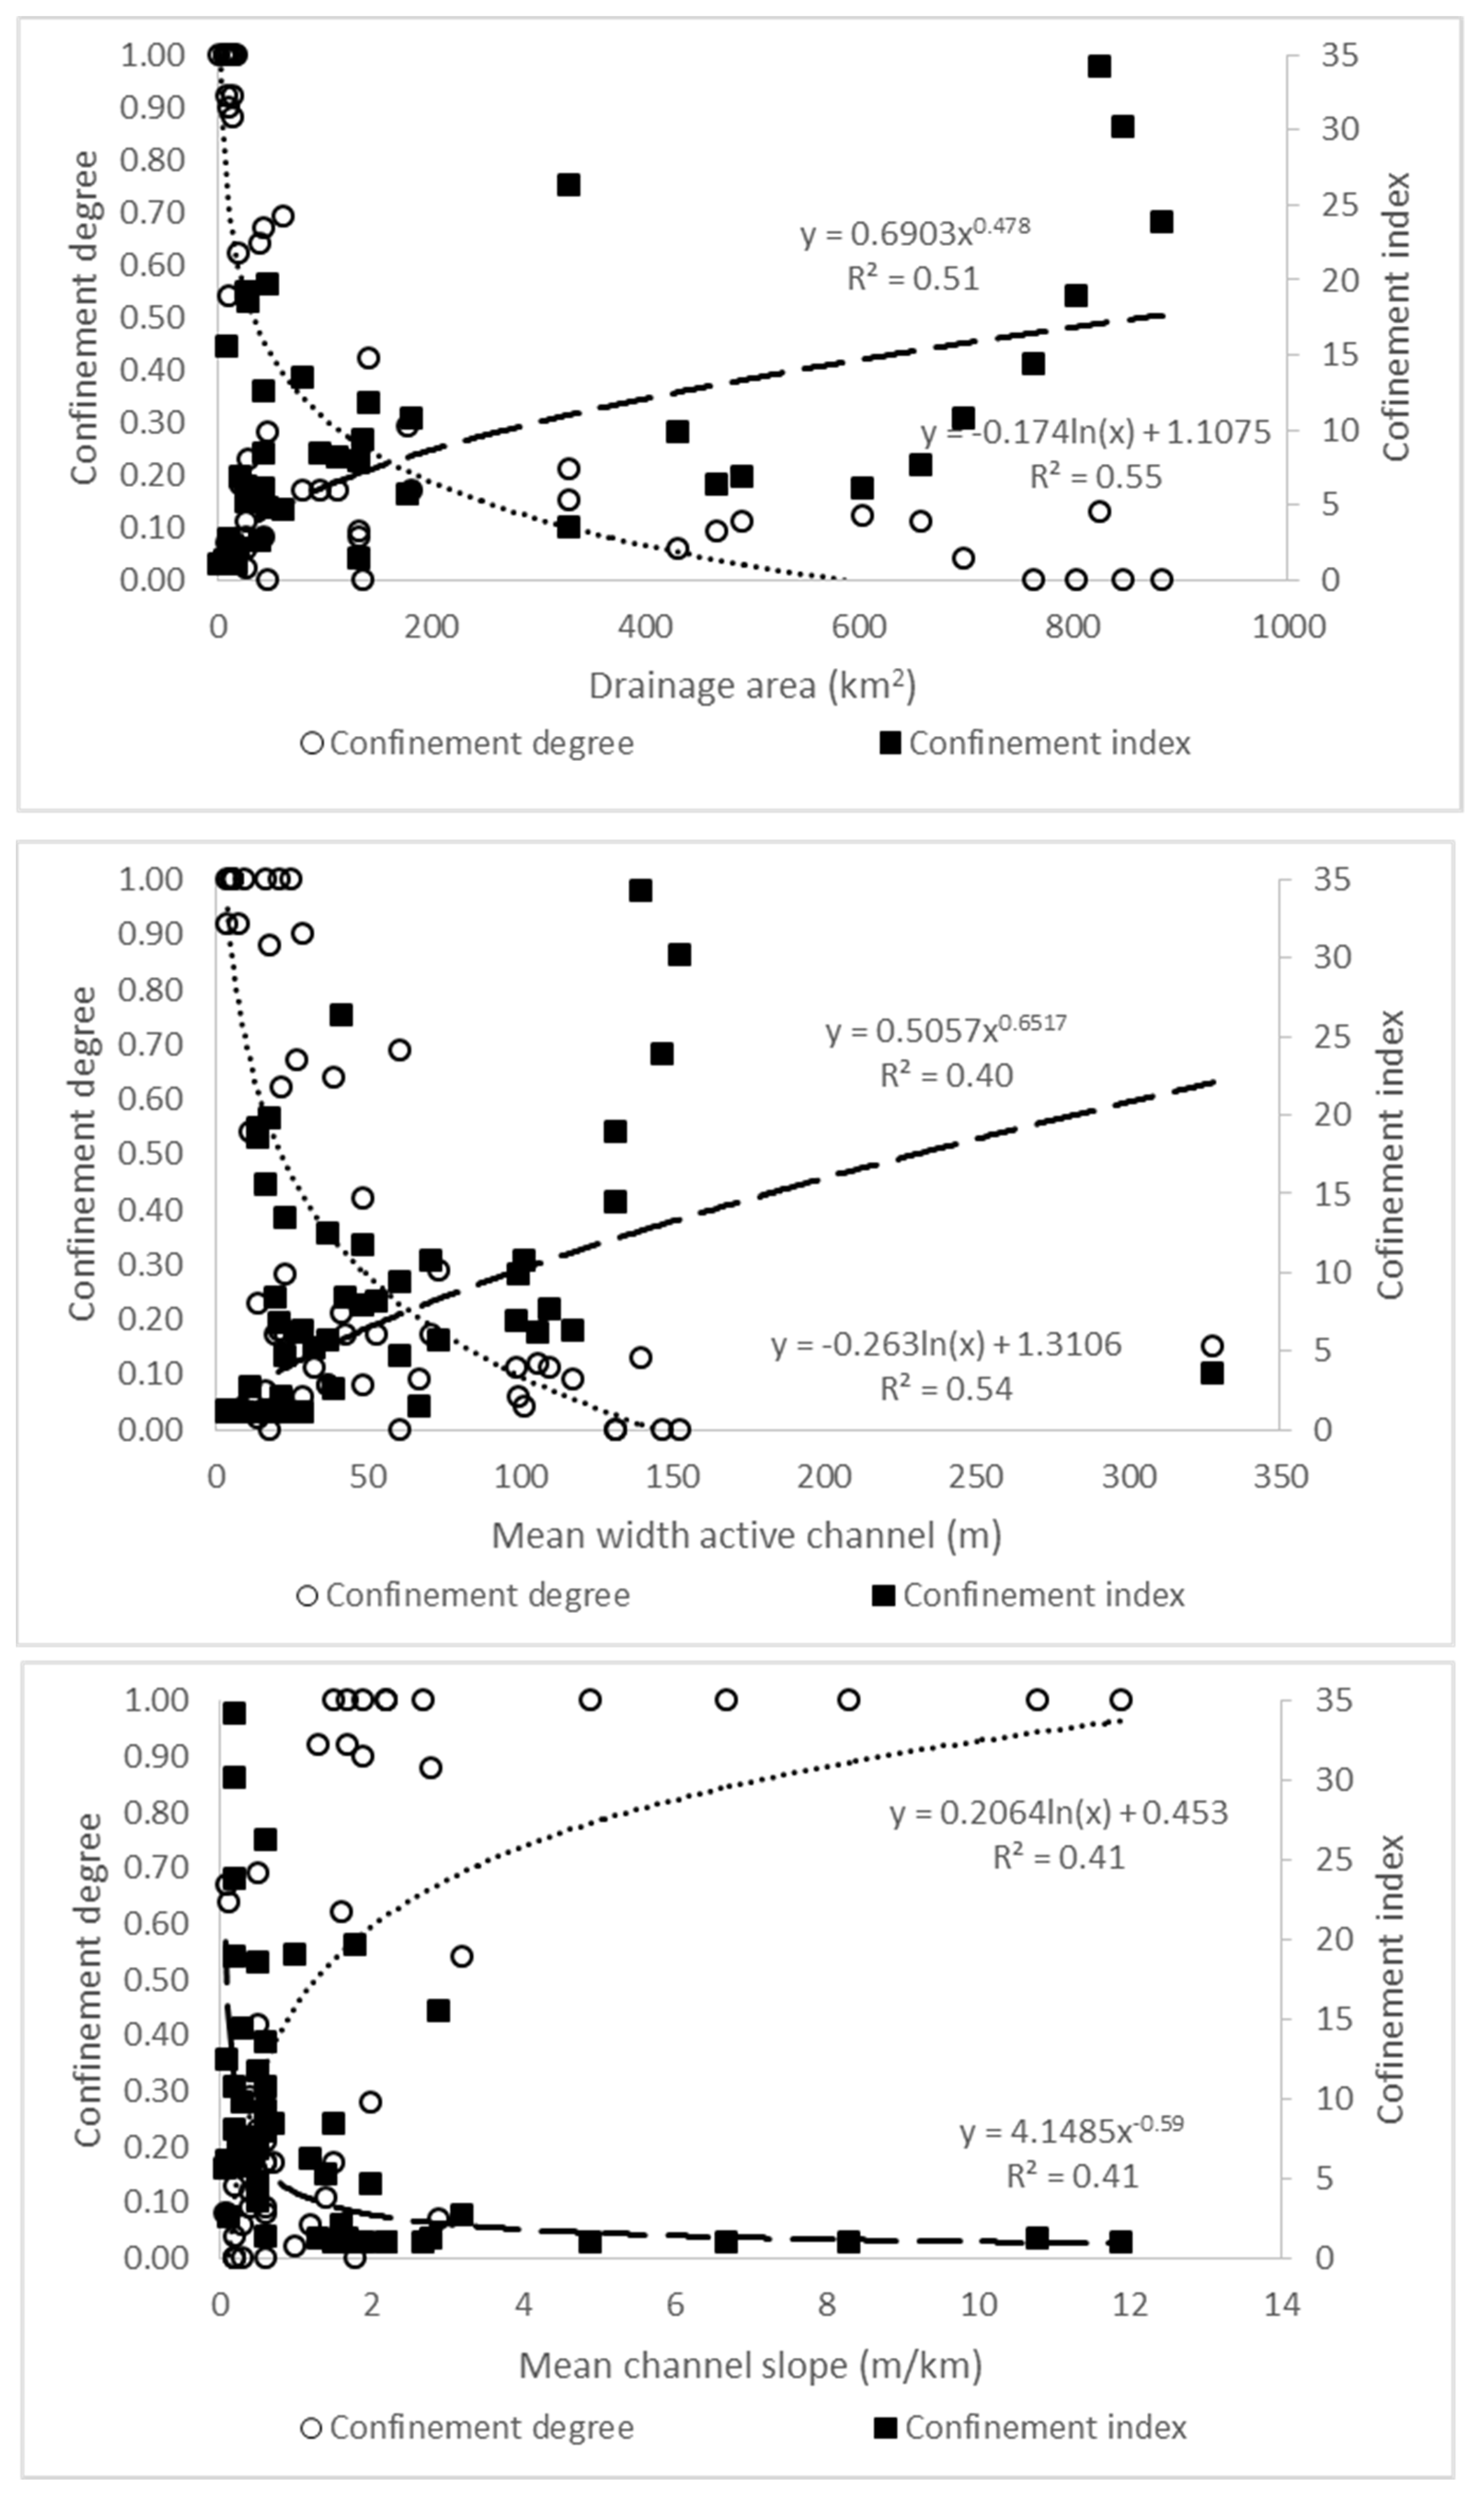
Figure 7.
Longitudinal profile of the Dittaino River showing the main segments of the main path.

Figure 8.
Statistic distributions (1st, 2nd,and 3rd quartiles) as well as minimum and maximum values of functionality MQI (MQIF), artificiality MQI (MQIA), channel adjustment MQI (MQICA), and MQI for each reach of the same order identified in the Dittaino River.
Figure 8.
Statistic distributions (1st, 2nd,and 3rd quartiles) as well as minimum and maximum values of functionality MQI (MQIF), artificiality MQI (MQIA), channel adjustment MQI (MQICA), and MQI for each reach of the same order identified in the Dittaino River.
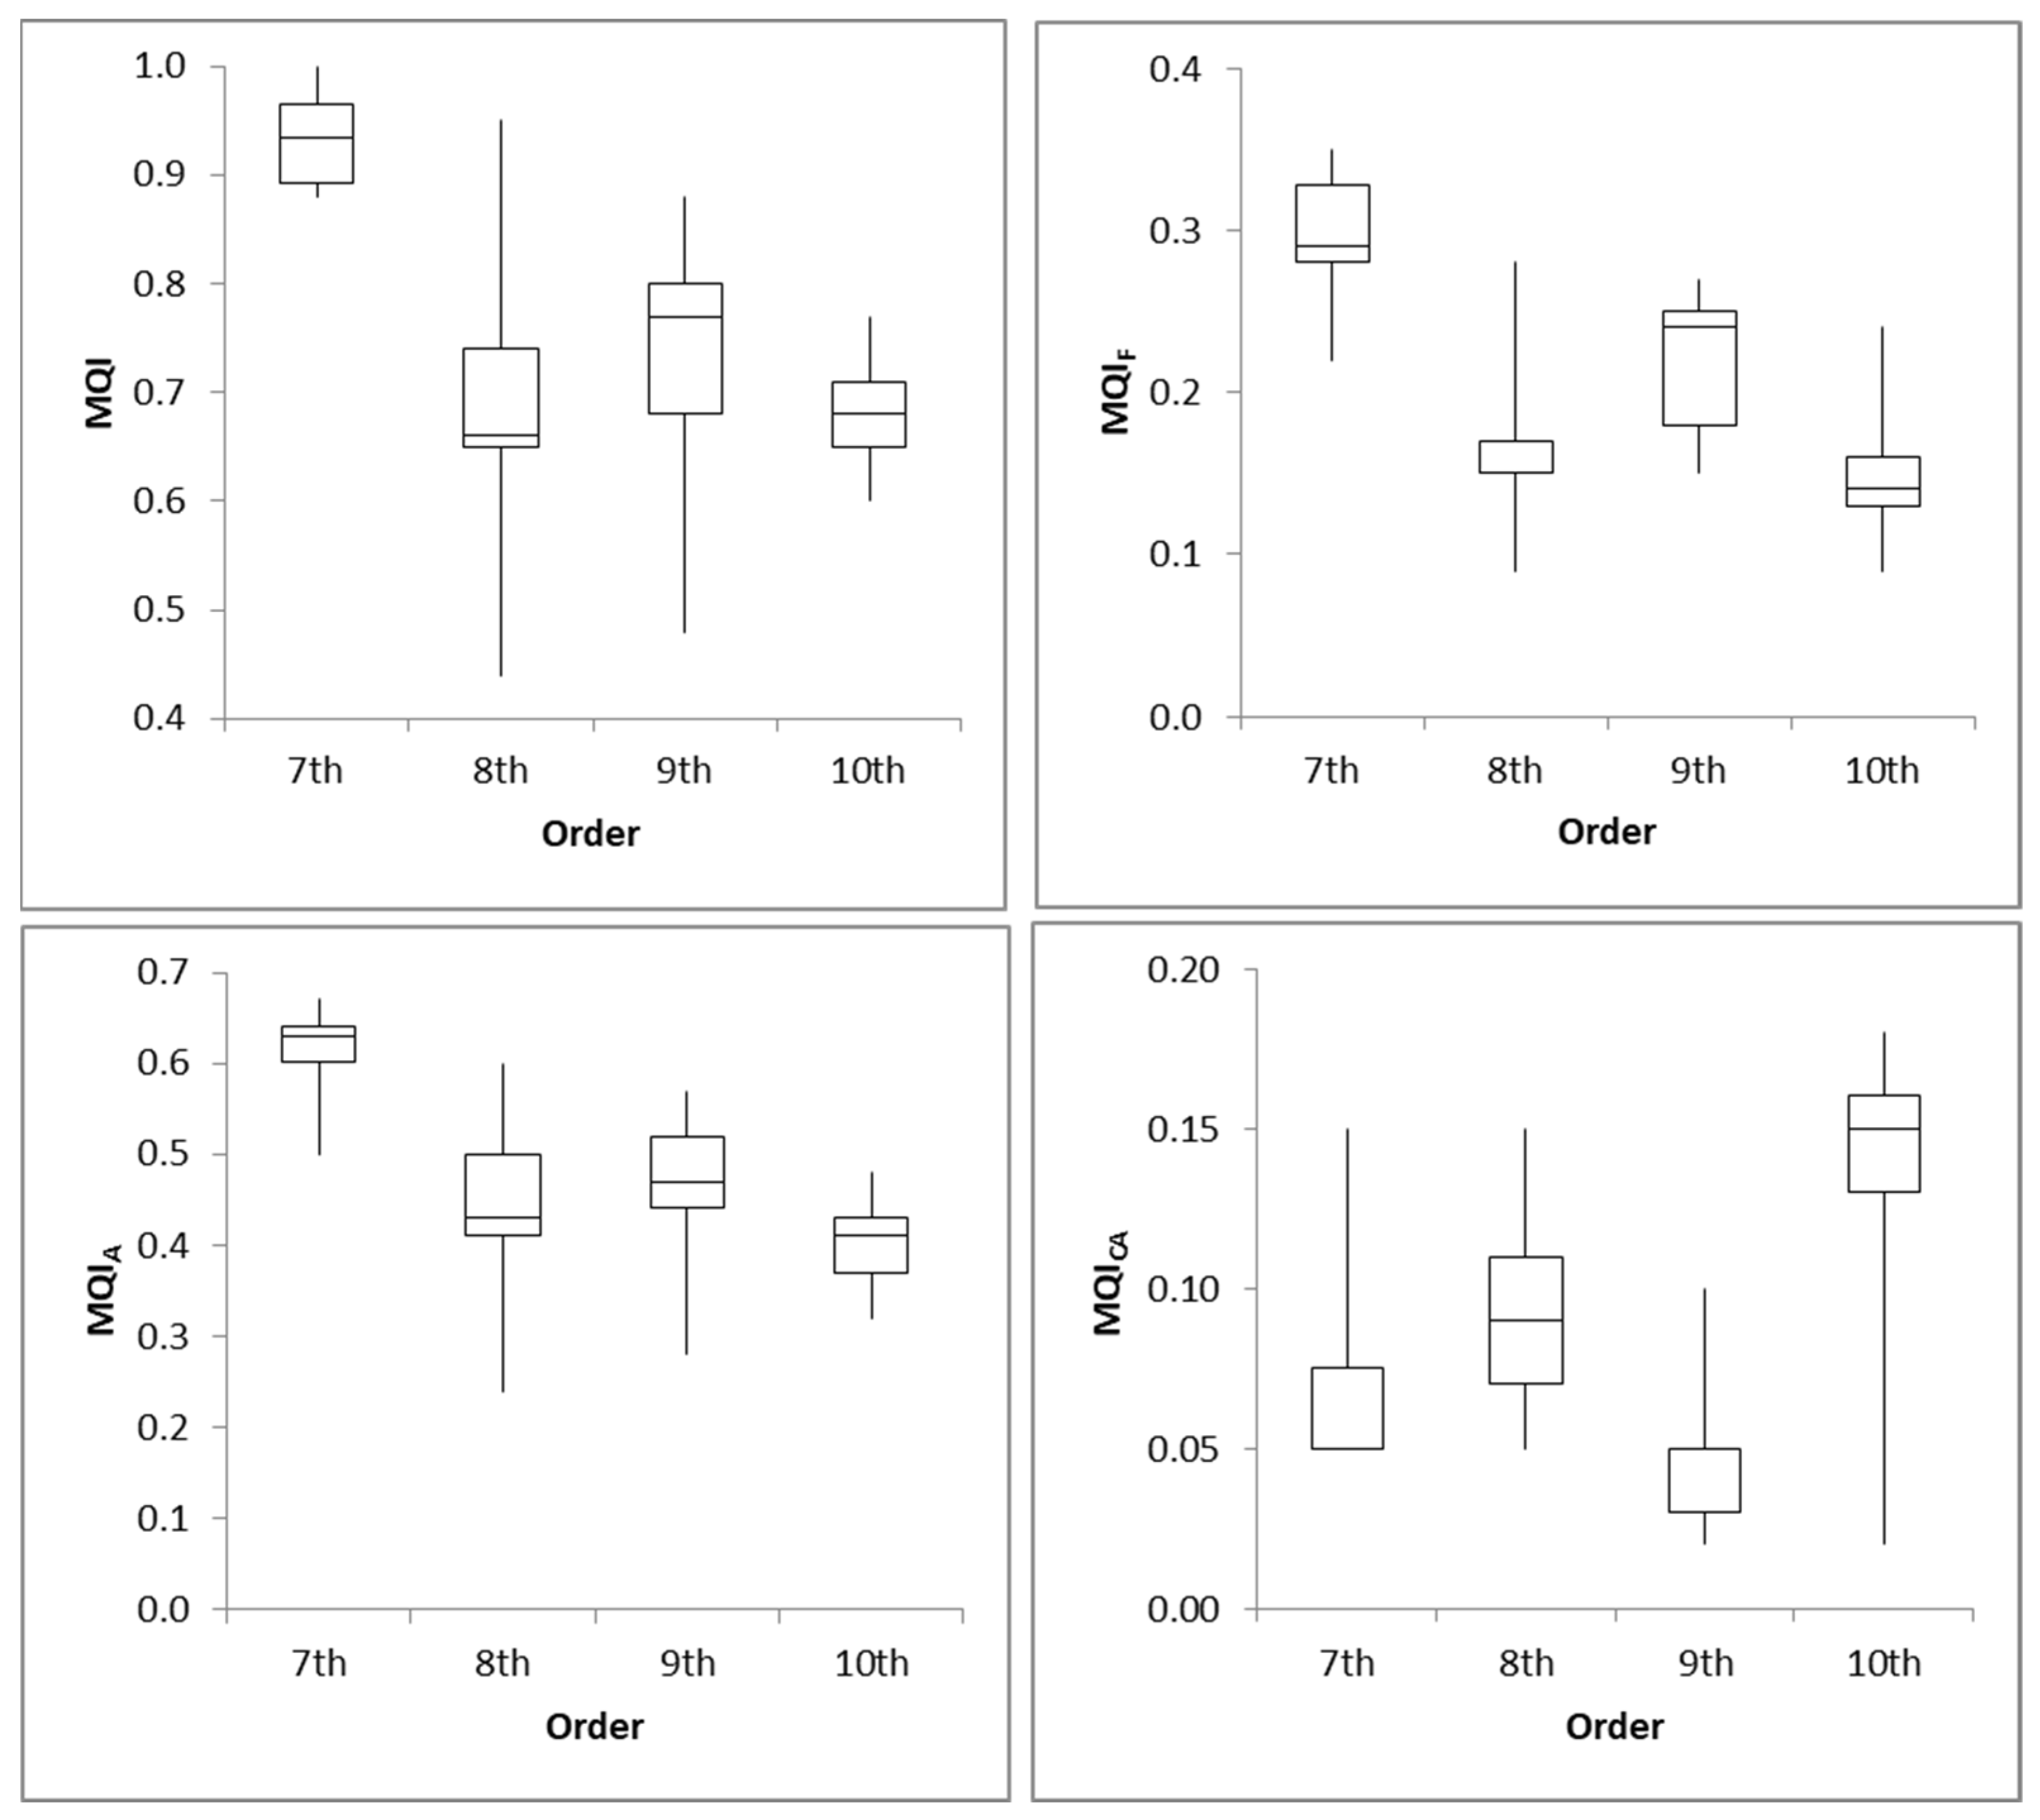
Figure 9.
Elevation of the Dittaino basin, hydrograph segmentation and MQI evaluation results, and poor MQI reach number identification.
Figure 9.
Elevation of the Dittaino basin, hydrograph segmentation and MQI evaluation results, and poor MQI reach number identification.
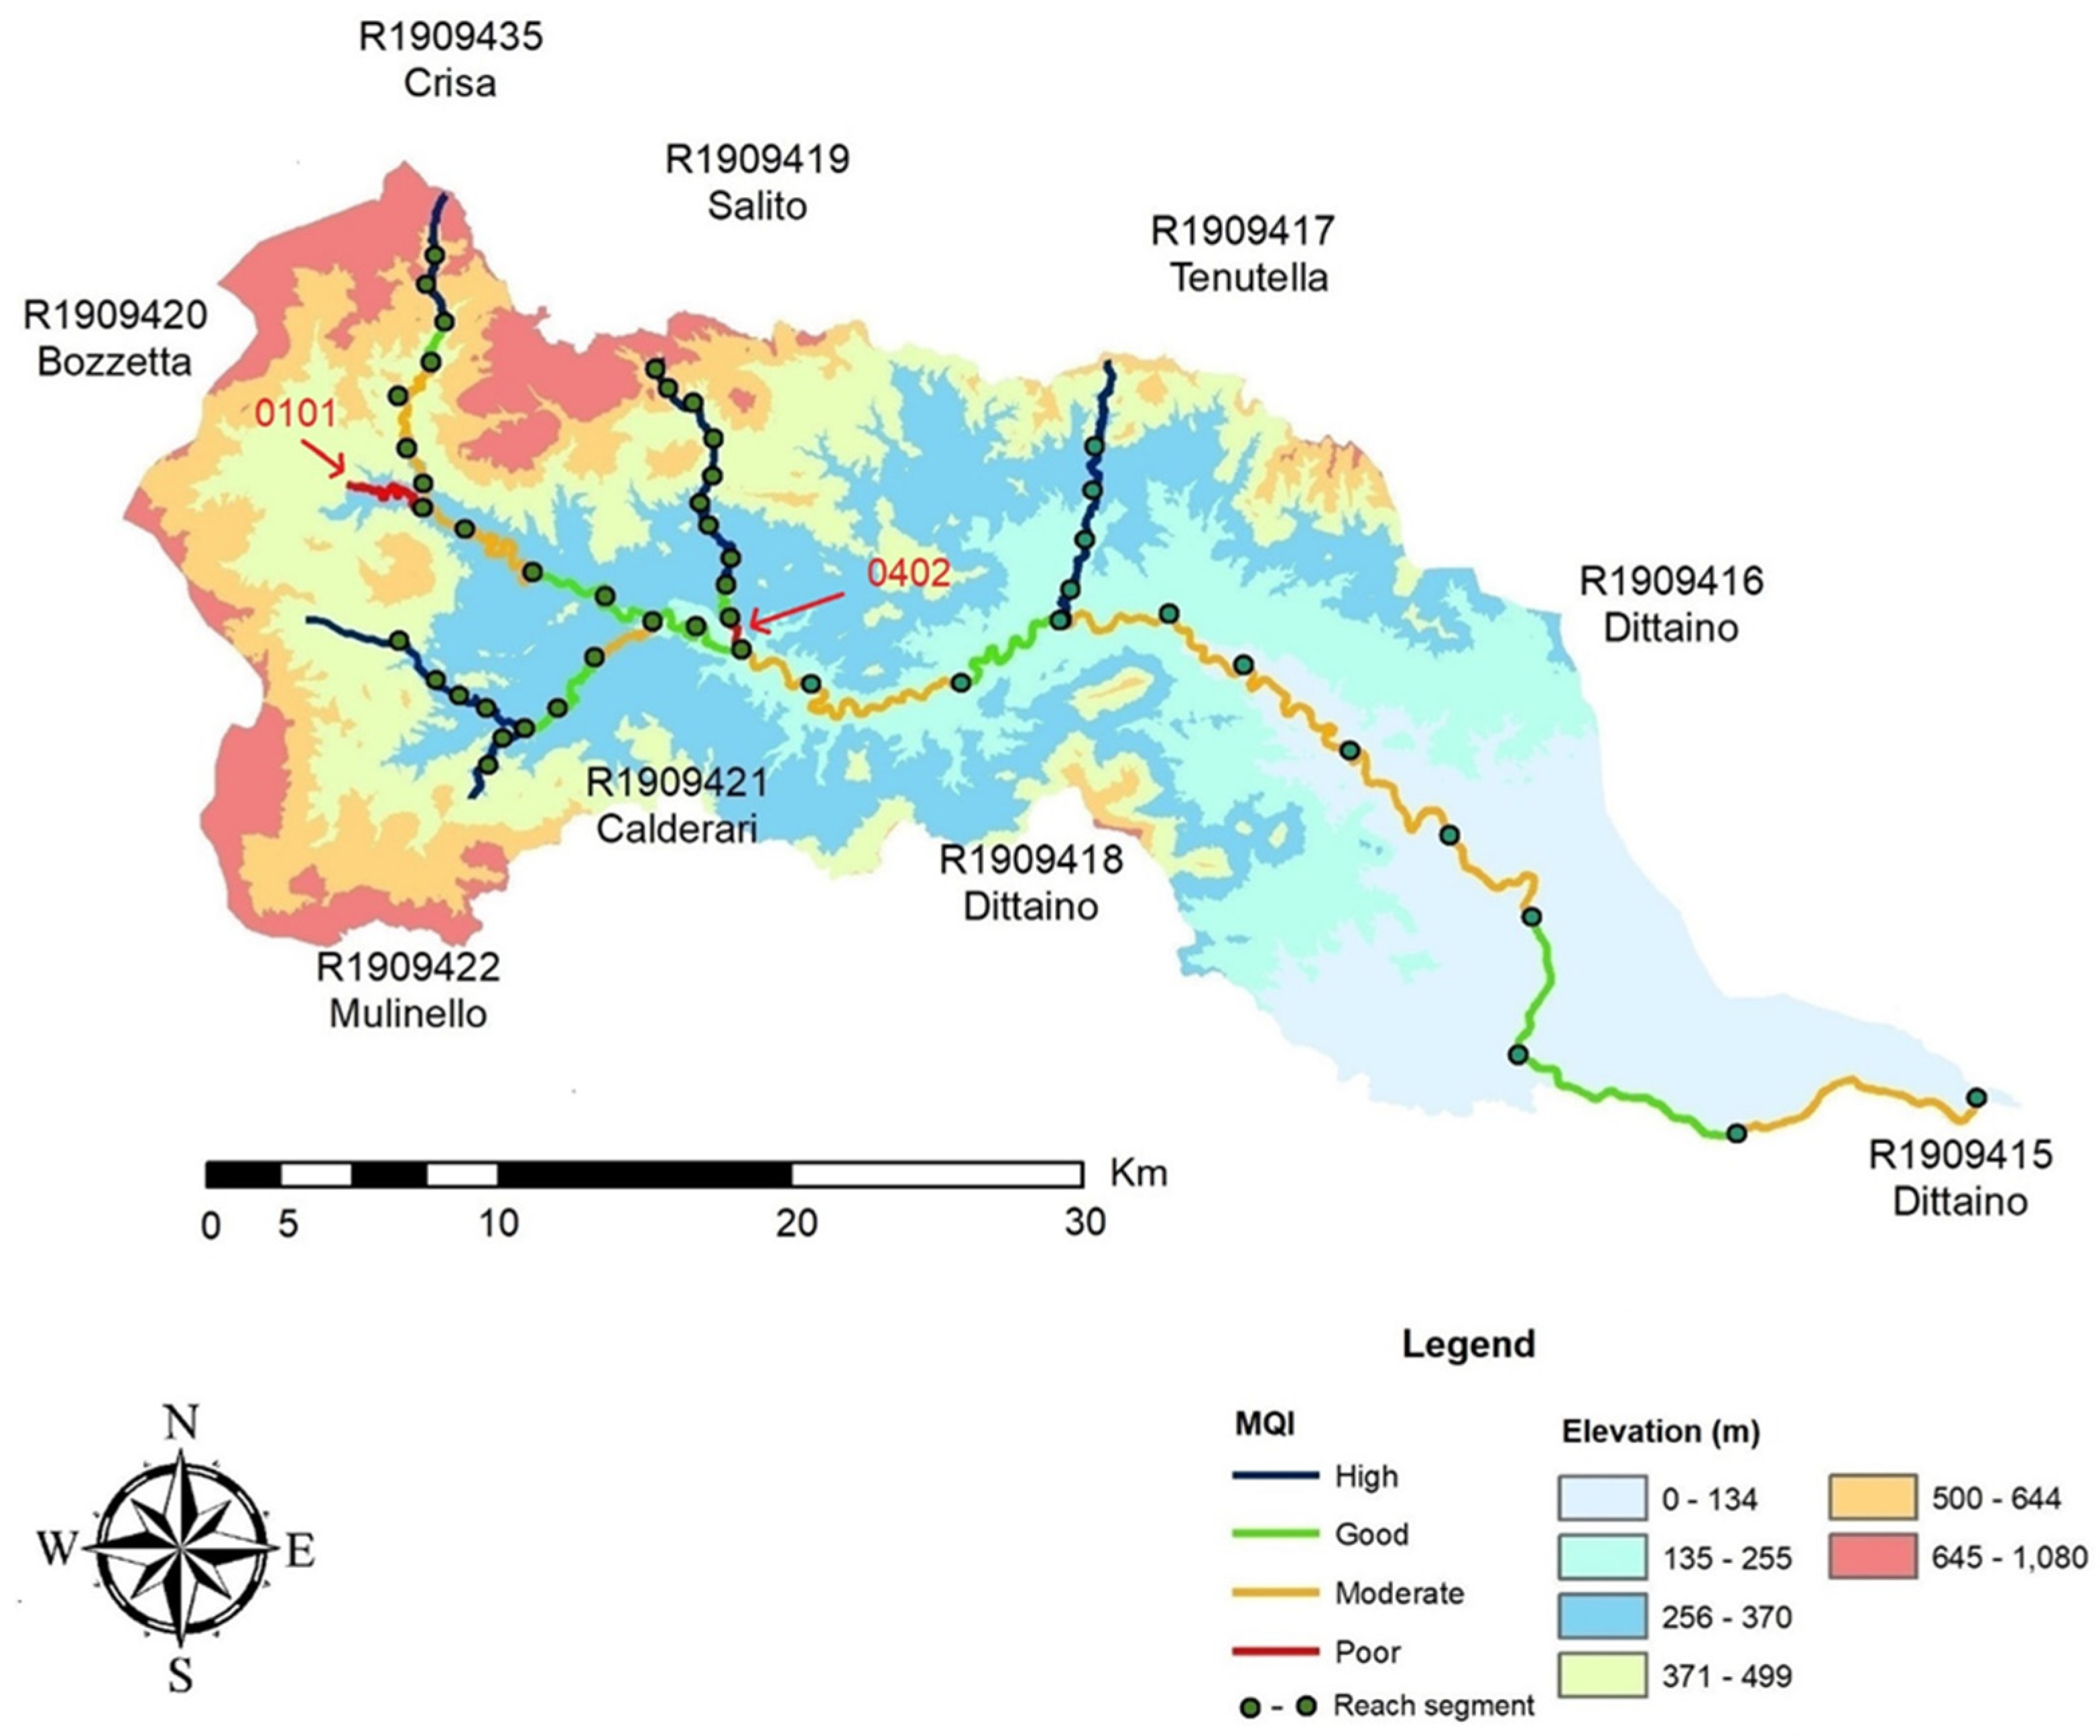
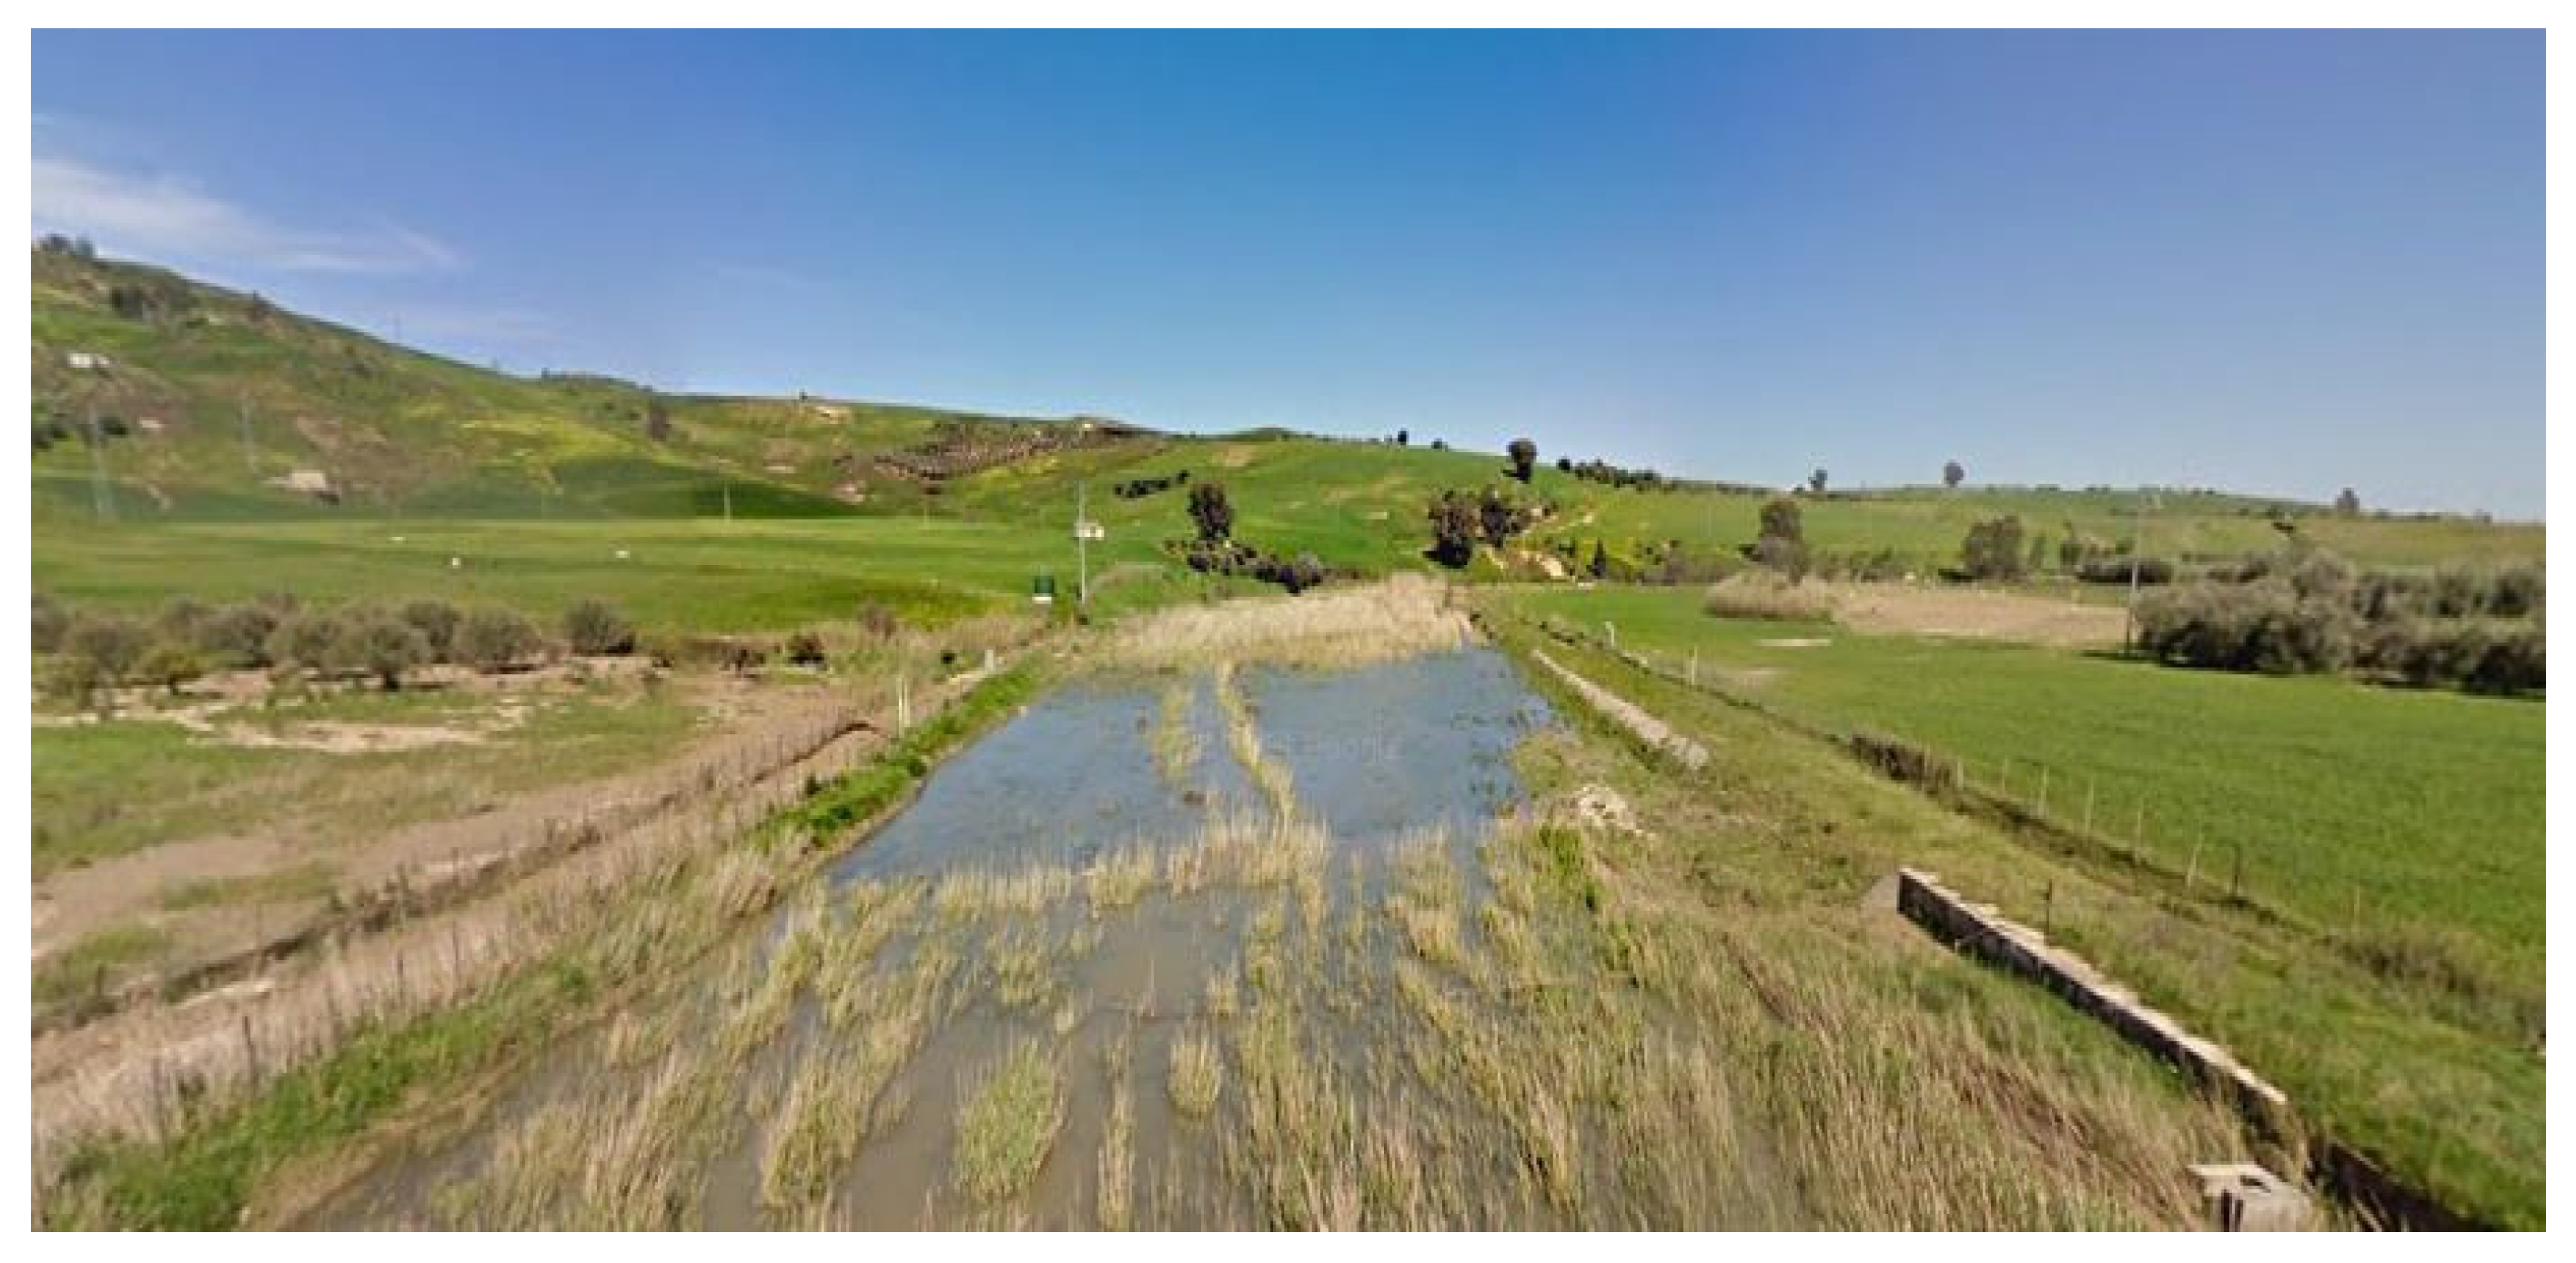
Figure 10.
Dittaino River (eastern Sicily).


Table 1.
Summary of the general setting and segmentation procedure (modified from [15]).
Table 1.
Summary of the general setting and segmentation procedure (modified from [15]).
| Steps | Criteria | Outputs |
|---|---|---|
| Step 1: general setting and identification of physiographic units and segments | Geological and geomorphological characteristics | Physiographic units Segments |
| Step 2: definition of confinement typologies | Lateral confinement | Confinement typologies: |
| confined (C) | ||
| partly confined (PC) | ||
| unconfined (U) | ||
| Step 3: identification of morphological typologies | Planimetric characteristics (sinuosity, braiding and anabranching indexes) | Morphological typologies: |
| Confined—single thread, wandering, braided, anamostosed | ||
| Partly confined—unconfined straight, sinuous, meandering, sinuous with alternate bars, wandering, braided, anastomosed | ||
| Step 4: reach delineation | Further discontinuities in hydrology, bed slope, channel width, alluvial plain width, bed sediment | Reaches |
Table 2.
Classes of confinement.
| Class of Confinement | Description |
|---|---|
| Confined (C) | All cases with confinement degree >90% |
| Confinement degree from 10% to 90% and confinement index ≤1.5 | |
| Partly confined (PC) | Confinement degree from 10% to 90% and confinement index >1.5 |
| Confinement degree <10% and confinement index ≤n * | |
| Unconfined (UC) | Confinement degree <10% and confinement index >n * |
* n = 5 for single-thread channels (including sinuous with alternate bars), and n = 2 for multi-thread or transitional morphologies.
Table 3.
MQI values and corresponding classes.
| MQI | Classes of Morphological Quality |
|---|---|
| 0.0 ≤ MQI < 0.3 | Very poor or bad |
| 0.3 ≤ MQI < 0.5 | Poor |
| 0.5 ≤ MQI < 0.7 | Moderate |
| 0.7 ≤ MQI < 0.85 | Good |
| 0.85 ≤ MQI ≤ 1.0 | Very good or high |
Table 4.
Indicator classes for MDI determination.
| Morphology and Processes | Description |
|---|---|
| M1 | Typology of the river bed |
| M2 | Erodibility of river banks |
| M3 | Erodibility of river bed |
| M4 | Processes of retreat of river banks |
| M5 | Width trends |
| M6 | Altimetry trends |
| Artificiality | Description |
| A1 | Defenses of river banks |
| A2 | Covering and consolidation works of the river bed |
| Morphological changes | Description |
| V1 | Morphological configuration changes |
| V2 | Width changes |
| V3 | Altimetry changes |
Table 5.
MDI values and corresponding classes.
| MDI | Classes of Morphological Dynamics |
|---|---|
| 0.0 ≤ MDI < 0.2 | Very low (for high stability or artificial control) |
| 0.2 ≤ MDI < 0.4 | Low |
| 0.4 ≤ MDI < 0.6 | Medium |
| 0.6 ≤ MDI < 0.8 | High |
| 0.8 ≤ MDI < 1.0 | Very high (for outstanding instability) |
Table 6.
Median value of the main numeric parameters (2nd quartile) and predominant river morphology and confinement typology for reaches (of the same order) obtained during the segmentation phase of MQI in the Dittaino River.
Table 6.
Median value of the main numeric parameters (2nd quartile) and predominant river morphology and confinement typology for reaches (of the same order) obtained during the segmentation phase of MQI in the Dittaino River.
| Stream Order | Reaches Number | Length (m) | Mean Width of the Active Channel (m) | Predominant Morphological Typology * | Confinement | Predominant Confinement Typology ** | Mean Channel Slope (m/km) | Drainage Area (km²) | |
|---|---|---|---|---|---|---|---|---|---|
| Degree | Index | ||||||||
| 7th | 22 | 1705 | 13 | ST (68%) | 0.96 | 1.10 | C (68%) | 2.05 | 12.50 |
| 8th | 9 | 1711 | 27 | S (56%) | 0.18 | 6.10 | PC (67%) | 0.25 | 43.00 |
| 9th | 9 | 3093 | 53 | S (56%) | 0.17 | 8.40 | PC (67%) | 0.60 | 133.00 |
| 10th | 13 | 6152 | 118 | S (46%) M (46%) | 0.09 | 10.70 | U (62%) | 0.30 | 657.00 |
* Single-thread (ST), sinuous (S), meandering (M), ** confined (C), partly confined (PC) and unconfined (UC) in the downstream direction.
Table 7.
Median values of functionality MQI (MQIF), artificiality MQI (MQIA), channel adjustment MQI (MQICA) and MQI for each segment identified in the Dittaino River.
Table 7.
Median values of functionality MQI (MQIF), artificiality MQI (MQIA), channel adjustment MQI (MQICA) and MQI for each segment identified in the Dittaino River.
| ID | Segment | Stream Order | MQIF | MQIA | MQICA | MQI | MQI CLASS |
|---|---|---|---|---|---|---|---|
| R1909422 | Mulinello | 7 | 0.22 | 0.62 | 0.05 | 0.92 | High |
| R1909417 | Tenutella | 8 | 0.33 | 0.64 | 0.00 | 0.97 | High |
| R1909419 | Salito | 8 | 0.28 | 0.61 | 0.00 | 0.95 | High |
| R1909435 | Crisa | 8 | 0.16 | 0.49 | 0.06 | 0.70 | Good |
| R1909421 | Calderari | 9 | 0.26 | 0.58 | 0.05 | 0.89 | High |
| R1909420 | Bozzetta | 10 | 0.19 | 0.46 | 0.05 | 0.70 | Good |
| R1909415 | Dittaino | 10 | 0.14 | 0.41 | 0.15 | 0.68 | Moderate |
| R1909416 | Dittaino | 10 | 0.13 | 0.37 | 0.16 | 0.65 | Moderate |
| R1909418 | Dittaino | 10 | 0.15 | 0.37 | 0.13 | 0.65 | Moderate |
Table 8.
Number of reaches (and their lengths) used for the calculation of MDI in the Dittaino River.
Table 8.
Number of reaches (and their lengths) used for the calculation of MDI in the Dittaino River.
| ID | Segment | Reaches | Total Length (m) | Medium Length Reaches (m) | Application Reaches MDI | Length MDI Reaches (m) |
|---|---|---|---|---|---|---|
| R1909417 | Tenutella | 5 | 13,017 | 2603 | 1 | 2046 |
| R1909422 | Mulinello | 3 | 3886 | 1295 | 2 | 2186 |
| R1909419 | Salito | 11 | 15,416 | 1401 | 5 | 8012 |
| R1909435 | Crisa | 8 | 16,162 | 2020 | 5 | 9932 |
| R1909421 | Calderari | 8 | 19,380 | 2423 | 7 | 15,495 |
| R1909420 | Bozzetta | 7 | 22,583 | 3226 | 7 | 22,583 |
| R1909415 | Dittaino | 5 | 36,380 | 7276 | 5 | 36,380 |
| R1909416 | Dittaino | 3 | 17,766 | 5922 | 3 | 17,766 |
| R1909418 | Dittaino | 3 | 22,793 | 7598 | 3 | 22,793 |
| 53 | 167,383 | 38 | 137,193 |
Table 9.
Percentages of reaches that displayed morphological configuration changes in the Dittaino River (from 1954 to 2014).
Table 9.
Percentages of reaches that displayed morphological configuration changes in the Dittaino River (from 1954 to 2014).
| Morphological Configuration Changes | |||
|---|---|---|---|
| Morphological configuration changes (V1) | % | Width changes (V2) | % |
| None | 50 | Intense narrowing | 12 |
| Between contiguous morphologies | 50 | Moderate narrowing | 18 |
| Between non-contiguous morphologies | 0 | None or limited variation | 32 |
| Moderate enlargement | 23 | ||
| Intense enlargement | 15 | ||
Table 10.
Minimum and maximum MDI values for each segment and MDI class for each analyzed reach of the Dittaino’s fluvial system.
Table 10.
Minimum and maximum MDI values for each segment and MDI class for each analyzed reach of the Dittaino’s fluvial system.
| ID | Segment | Stream | MDI | MDI CLASS | |||||
|---|---|---|---|---|---|---|---|---|---|
| Order | Min. | Max. | Very Low | Low | Medium | High | Very High | ||
| R1909417 | Tenutella | 7–8 | 0.34 | 0.54 | - | - | 1 | - | - |
| R1909422 | Mulinello | 7 | 0.63 | 0.67 | - | - | - | 2 | - |
| R1909419 | Salito | 7–8 | 0.43 | 0.68 | - | - | 1 | 4 | - |
| R1909435 | Crisa | 7–8 | 0.48 | 0.63 | - | - | 2 | 3 | - |
| R1909421 | Calderari | 7–9 | 0.51 | 0.70 | - | - | 2 | 5 | - |
| R1909420 | Bozzetta | 9–10 | 0.47 | 0.67 | - | - | 3 | 4 | - |
| R1909415 | Dittaino | 10 | 0.31 | 0.51 | - | 2 | 3 | - | - |
| R1909416 | Dittaino | 10 | 0.43 | 0.54 | - | - | 3 | - | - |
| R1909418 | Dittaino | 10 | 0.40 | 0.49 | - | - | 3 | - | - |
Publisher’s Note: MDPI stays neutral with regard to jurisdictional claims in published maps and institutional affiliations. |
© 2021 by the authors. Licensee MDPI, Basel, Switzerland. This article is an open access article distributed under the terms and conditions of the Creative Commons Attribution (CC BY) license (https://creativecommons.org/licenses/by/4.0/).
Share and Cite
MDPI and ACS Style
Licciardello, F.; Barbagallo, S.; Muratore, S.M.; Toscano, A.; Giuffrida, E.R.; Cirelli, G.L. Hydro-Morphological Assessment of Dittaino River, Eastern Sicily, Italy. Water 2021, 13, 2499. https://doi.org/10.3390/w13182499
AMA Style
Licciardello F, Barbagallo S, Muratore SM, Toscano A, Giuffrida ER, Cirelli GL. Hydro-Morphological Assessment of Dittaino River, Eastern Sicily, Italy. Water. 2021; 13(18):2499. https://doi.org/10.3390/w13182499
Chicago/Turabian StyleLicciardello, Feliciana, Salvatore Barbagallo, Salvatore M. Muratore, Attilio Toscano, Emanuela R. Giuffrida, and Giuseppe L. Cirelli. 2021. "Hydro-Morphological Assessment of Dittaino River, Eastern Sicily, Italy" Water 13, no. 18: 2499. https://doi.org/10.3390/w13182499
Note that from the first issue of 2016, this journal uses article numbers instead of page numbers. See further details here.