Article

Effects of Climate Change on Water Quality in the Jucar River Basin (Spain)

by
Gabriel Gómez-Martínez
1,2,*,
Lorena Galiano
3,
Toni Rubio
3,
Carlos Prado-López
3,
Darío Redolat
3,
César Paradinas Blázquez
3,
Emma Gaitán
3,
María Pedro-Monzonís
1,
Sergio Ferriz-Sánchez
1,4,
Miguel Añó Soto
1,4,
Robert Monjo
3,5,
Miguel Ángel Pérez-Martín
2,
Pura Almenar Llorens
1,4 and
Javier Macián Cervera
1,4
1
Global Omnium-Aguas de Valencia S.A., Gran Vía Marqués del Túria, 19, 46005 València, Spain
2
IIAMA—Instituto de Ingeniería del Agua y Medio Ambiente, Universitat Politècnica de València, Camino de Vera s/n, 46022 València, Spain
3
Climate Research Foundation, C/Gran Vía 22, 7° dcha, 28040 Madrid, Spain
4
Empresa Mixta Valenciana de Aguas, S.A., (EMIVASA) Reino de Valencia n° 28, 46005 València, Spain
5
Department of Algebra, Geometry and Topology, Complutense University of Madrid, Plaza de Ciencias 3, Ciudad Universitaria, 28040 Madrid, Spain
*
Author to whom correspondence should be addressed.
Water 2021, 13(17), 2424; https://doi.org/10.3390/w13172424
Submission received: 26 July 2021 / Revised: 28 August 2021 / Accepted: 30 August 2021 / Published: 3 September 2021
(This article belongs to the Section Water Quality and Contamination)

Abstract

:
The Mediterranean region is a climate change hotspot, especially concerning issues of hydrological planning and urban water supply systems. In this context, the Jucar River Basin (Spain) presents an increase of frequency, intensity and duration of extreme meteorological phenomena, such as torrential rains, droughts or heat waves, which directly affect the quantity and quality of raw water available for drinking. This paper aims to analyze the effects of climate change on the raw water quality of the Jucar River Basin District, which mainly supplies the city of Valencia and its metropolitan area, in order to adapt drinking water treatments to new conditions and opportunities. For this purpose, we used observed data of water quality parameters from four stations and climate drivers from seven Earth system models of the latest Coupled Model Intercomparison Project—Phase 6. To model water quality (turbidity and conductivity) in the past and future scenarios, this study employs a backward stepwise regression taking into account daily values of mean temperature, maximum temperature, total rainfall and minimum and maximum relative humidity. Results showed that the model performance of the water quality simulation is more adequate for short moving-average windows (about 2–7 days) for turbidity and longer windows (about 30–60 days) for conductivity. Concerning the future scenarios, the most significant change was found in the projected increase of conductivity for the station of the Júcar river, between 4 and 11% by 2100, respectively, under the medium (SSP2–4.5) and pessimistic (SSP5–8.5) emission scenarios. The joint use of these types of management and monitoring tools may help the managers in charge of carrying out the different water treatments needed to apply a better plan to raw water and may help them identify future threats and investment needs to adapt the urban water supply systems to the changing conditions of raw water, such as turbidity or conductivity, as a consequence of climate change.

1. Introduction

Traditionally, urban growth has been accompanied by the search for new water resources to meet drinking water needs in new settlements. These additional volumes could come from conventional resources (either by increasing the exploitation of surface and groundwater) or from unconventional resources (by resorting to water transfers from other basins or the desalination of seawater). For this reason, it is necessary to promote the use of integrated resources management and the use of decision making-tools and simulation models, for a better management under uncertainty scenarios and more resilient resources allocation [1,2,3,4].
Many regions in the world suffer from structural water stress and scarcity problems when managing and allocating water resources. Regions such as those localized in the Mediterranean area, such as the city of Valencia and its metropolitan area, can be considered as an example of this situation [5,6,7,8,9].
Problems linked to water scarcity and droughts have been getting worse during the last decades because of the effects of climate change, which have increased their magnitude and frequency [10]. In Mediterranean regions, such as the Jucar River Basin District, where the city of Valencia is located, the effects of climate change over water scarcity and the reduction of water resources availability are definitely being exacerbated [11] and they have been assessed in a range going from 8 to 28% of flow reduction by the end of the century [12,13,14].
Moreover, numerous studies have also found an influence of climate on water quality [15,16,17,18,19,20], which is of great importance for ecosystems and societies, as many sectors (e.g., human health, industry, water supply and sanitation, or tourism) depend on water resources and their availability in good condition. However, the quality of surface and groundwater has generally declined in recent decades as a consequence of the growth of agricultural and industrial activities, coupled with changes in hydrological regimes associated with climate change having important socio-economic impacts [21,22].
Water quality in freshwater systems is the result of a delicate and complex interaction of climatic variability and hydrological, biogeochemical and anthropogenic influences operating at different temporal and spatial scales [16]. It is therefore difficult to clearly pinpoint the role of climate. Water pollution is directly related to human activities of urban, industrial and agricultural origin (as well as land use changes). On the other hand, climate change could lead to the degradation of surface water quality as an indirect consequence of these activities, mainly through increased temperatures and changing precipitation patterns. In association with heavy rainfall events, nutrient runoff from croplands is triggered and increasingly warm temperatures accelerate the growth of bacteria and phytoplankton. Floods and droughts also change water quality through direct dilution or concentration effects of dissolved substances [15,16,17,21].
Taking into account the current and projected climate change scenarios, it is necessary to incorporate information on climate-related risks and impacts into operational and strategic decision-making processes in order to reduce the deterioration of water quality [20,23]. This is a major effort, as it is necessary to assess specific climatic conditions and the extent to which they are capable of modifying water quality, while taking into account land use and management, population distribution and other factors [17]. Along this line, numerous studies have confirmed that temperature and precipitation have important effects on water quality (e.g., [19]) and are used as climate predictors with lag times, using their predictive character. Even so, it should be considered that depending on the location and the river feature in question, the climatic influence may be changing, and may include other variables in addition to those mentioned.
In general terms, significant modifications of local and global climate patterns are projected at very different time scales, especially affecting temperature and rainfall, either in terms of average values or in terms of the frequency, intensity or duration of extreme events [24,25]. The impacts caused by these extreme phenomena directly affect water bodies (both, surface water and groundwater) and as a consequence, the quantity and quality of raw water available for drinking water [13,26,27]. Moreover, it should be highlighted that the Mediterranean region is a hotspot for changes in the hydrological cycle, especially for the winter rainfall regimes [28].
For the Mediterranean region, some of the most consensual effects of climate change on water resources are, on the one hand, a considerable decrease over water availability and incomes, produced by reduction in precipitation patterns and changes in hydrological temporal distribution and, on the other hand, a progressive rise of average temperatures that increments the potential evapotranspiration [12,27]. These impacts also indirectly affect water resources treatments, so in the case of necessary treatments carried out at drinking water treatment plants (DWTPs), adjustments are needed to maintain water quality standards and requirements. Therefore, the impact of some parameters, for instance, water temperature, play an important role in these necessary modifications in water treatment to ensure the process’ resilience [29].
Officially, the adaptation planning in Spain is supported by the Exchange of Information on Adaptation to the Climate Change (AdapteCCa) platform [30]. However, its application scale is regional because the spatial resolution of the outputs is approximately 11 km × 11 km. Moreover, it does not currently consider the latest climate projections of the Coupled Model Intercomparison Project—Phase 6 (CMIP6) but it is based on CMIP5 model outputs. Therefore, it is necessary to consider local climate scenarios by using CMIP6 outputs.
For this purpose, the European project named Climate Risk Information for SupportIng ADAptation Planning and Operation—Phase II (CRISI-ADAPT-II) was co-designed to analyze climate change effects in several pilot cases of the Mediterranean region. In the case of the city of Valencia, CRISI-ADAPT-II was focused on climate change’s impact on water quality. CRISI-ADAPTII developed local climate scenarios by using CMIP6 outputs downscaled at a 1 km × 1 km resolution grid.
Using these scenarios, the main objective of this study is to analyze the impact of climate change on water quality in the city of Valencia in order to increase the resilience of urban supplies according to these impacts on water resources. Thus, the paper shows how several parameters conditioning water quality, such as turbidity and conductivity, behave, analyzing its evolution and providing probable future scenarios, by the use of statistical decision-making tools, in order to improve the Valencia water supply system’s resilience and better plan future actions and investments.

2. Application Scope

2.1. Study Area

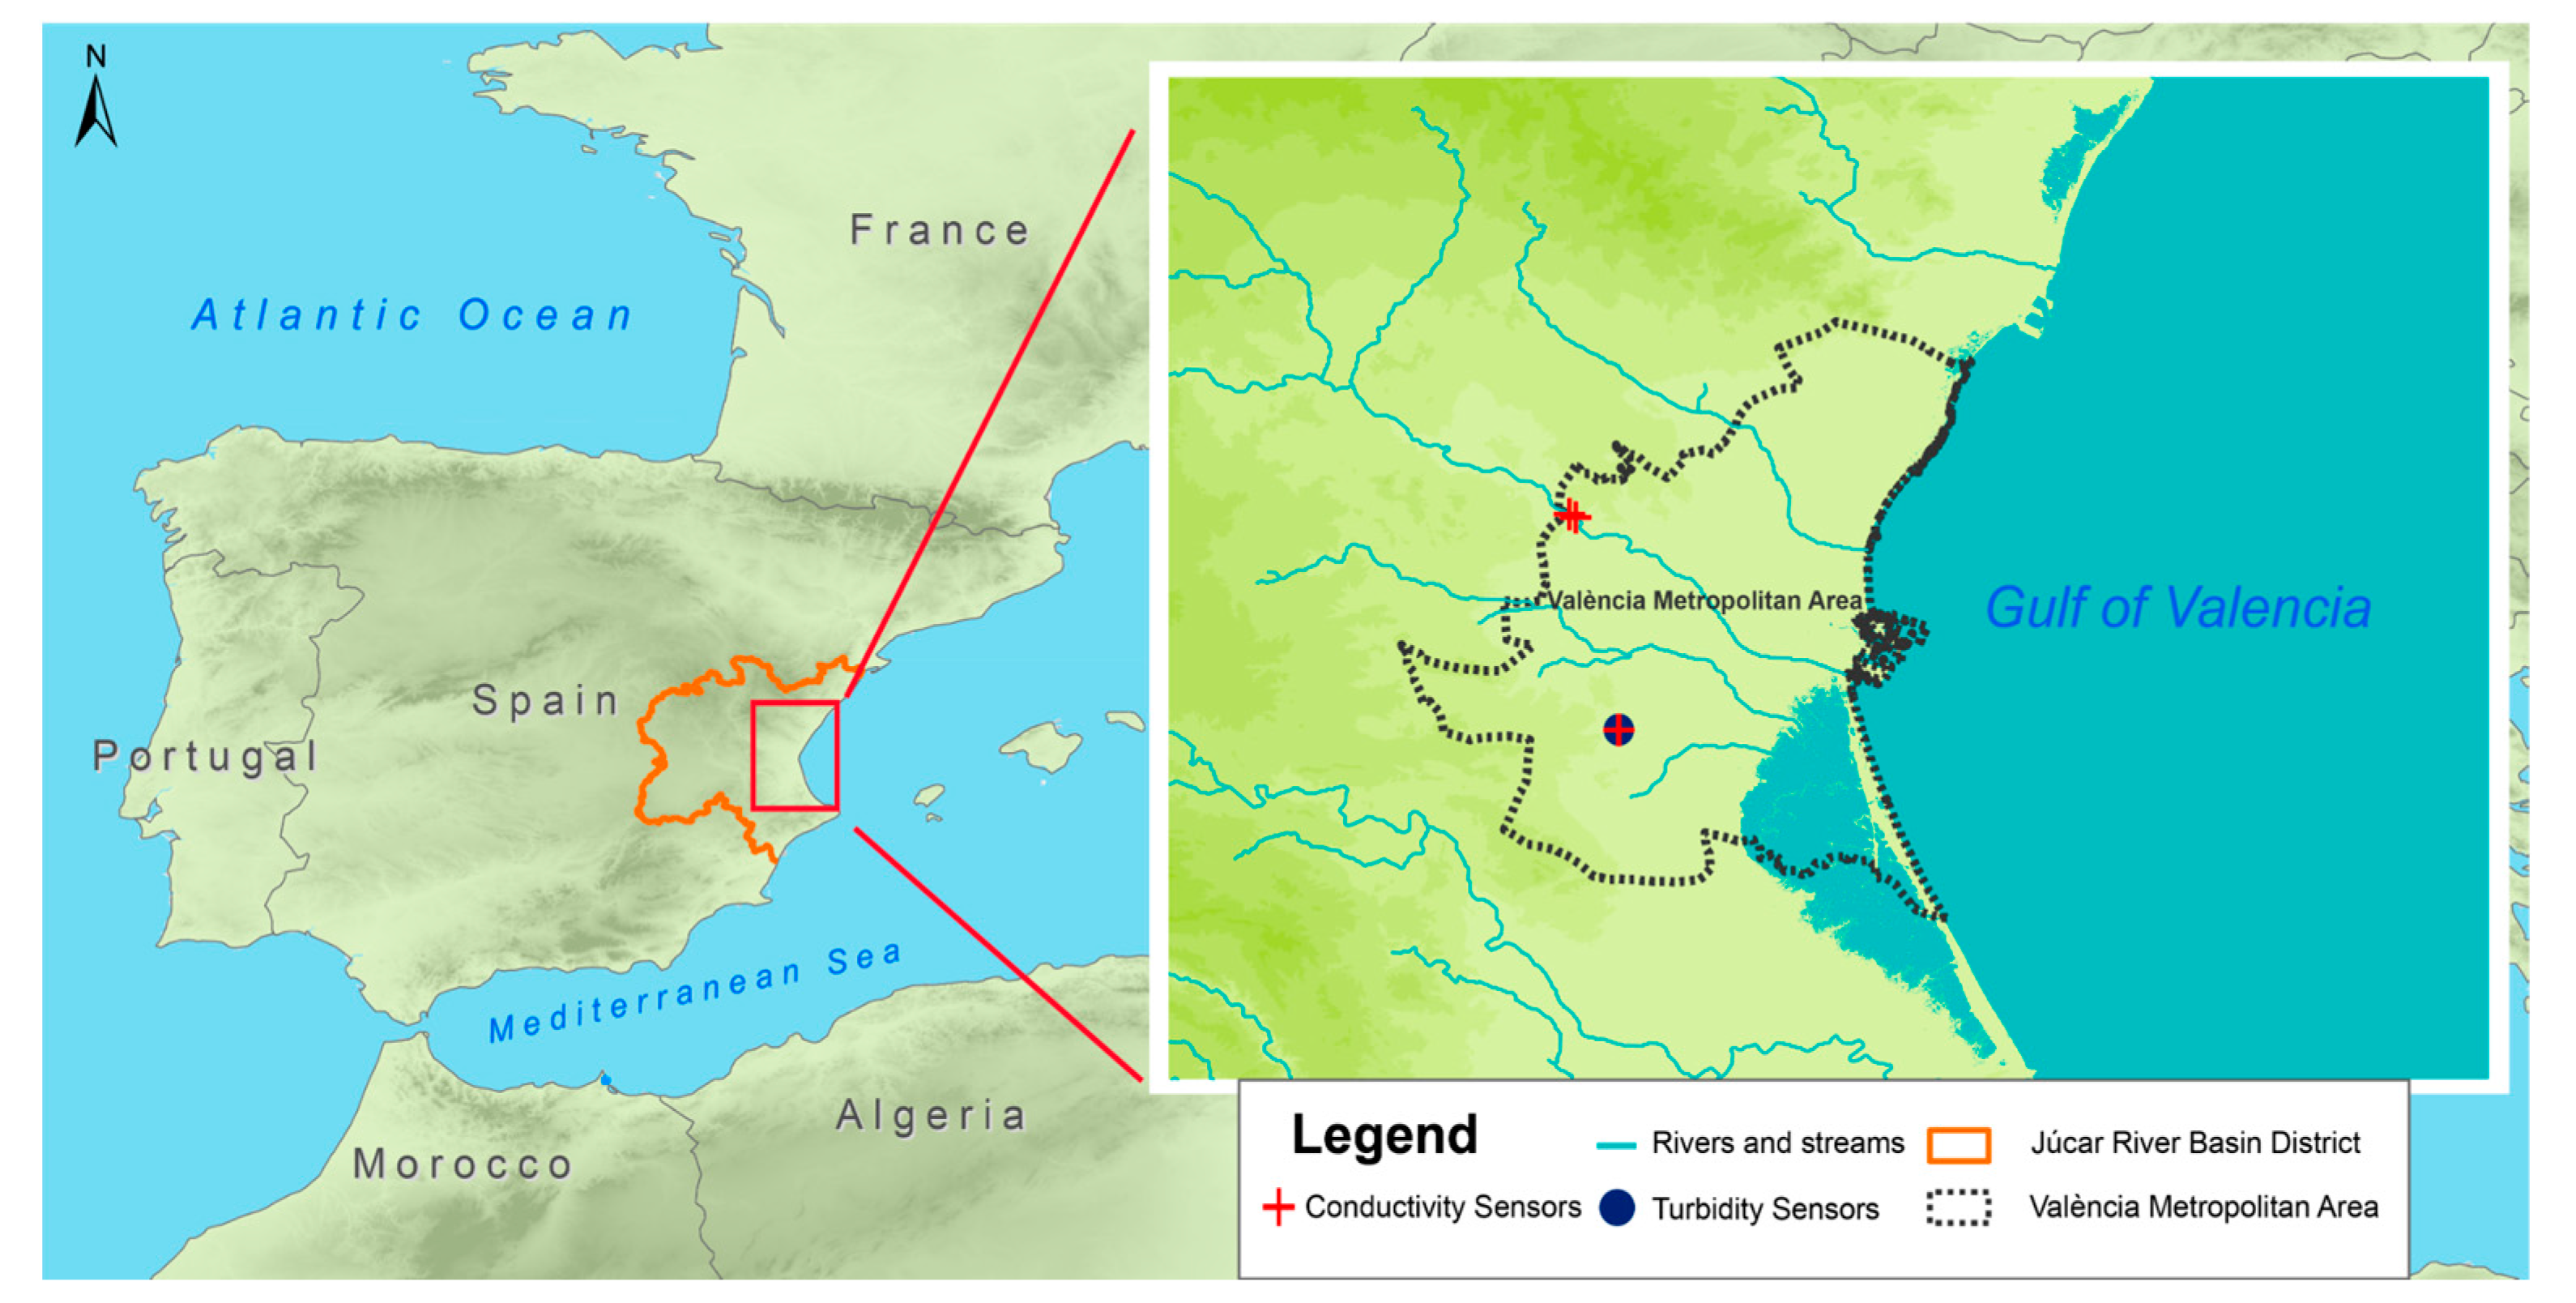
The Júcar River Basin and Túria River Basin are two of the nine water exploitation systems in the Júcar River Basin District, which is located in the eastern part of the Iberian Peninsula, both flowing into the Mediterranean Sea. The Júcar River Basin is the preeminent water exploitation system considering its size (22,186 km2) and the volume of water resources (1244.8 hm3/year). In second position, the Túria River Basin has a length of 6393 km2 and the volume of water resources rises to 401.4 hm3/year.
Both rivers symbolize an example of a typical Mediterranean river [31], characterized by mild winters and warm summers, with an average precipitation of 475.2 mm/year and a potential evapotranspiration of 926.6 mm/year [32]. The mean temperatures are about 14 and 16.5 °C, being the maximum degrees reached during the dry season (months of July and August). Moreover, the phenomenon called “gota fría” (a cold front with intense and short-term precipitations) may occur.
The supply system of the city of Valencia and its metropolitan area represents the main urban water supply in the Júcar River Basin District, along with the Sagunto and Albacete urban supplies. The Valencian case currently serves almost 1.5 million inhabitants, in an area of intense economic activity, which requires reinforcing the reliability of both supply and water quality.
The urban supply comes from two drinking water treatment plants (DWTP) located in the municipalities of Manises (La Presa) and Picassent (El Realón), with nominal treatment capacities of 3.4 and 3.0 m3/s, respectively.
The La Presa DWTP can provide raw water from the Túria River, from the Júcar–Túria transfer channel (CJT) and from the wells located in the facility itself, having three alternative supply sources. On the other hand, the El Realón DWTP captures the raw water only from the CJT. This channel begins at the Tous reservoir and water flows from the Júcar River to the Túria River. From the point of view of service coverage, both facilities are working, on average, at around 50% of their nominal capacity.
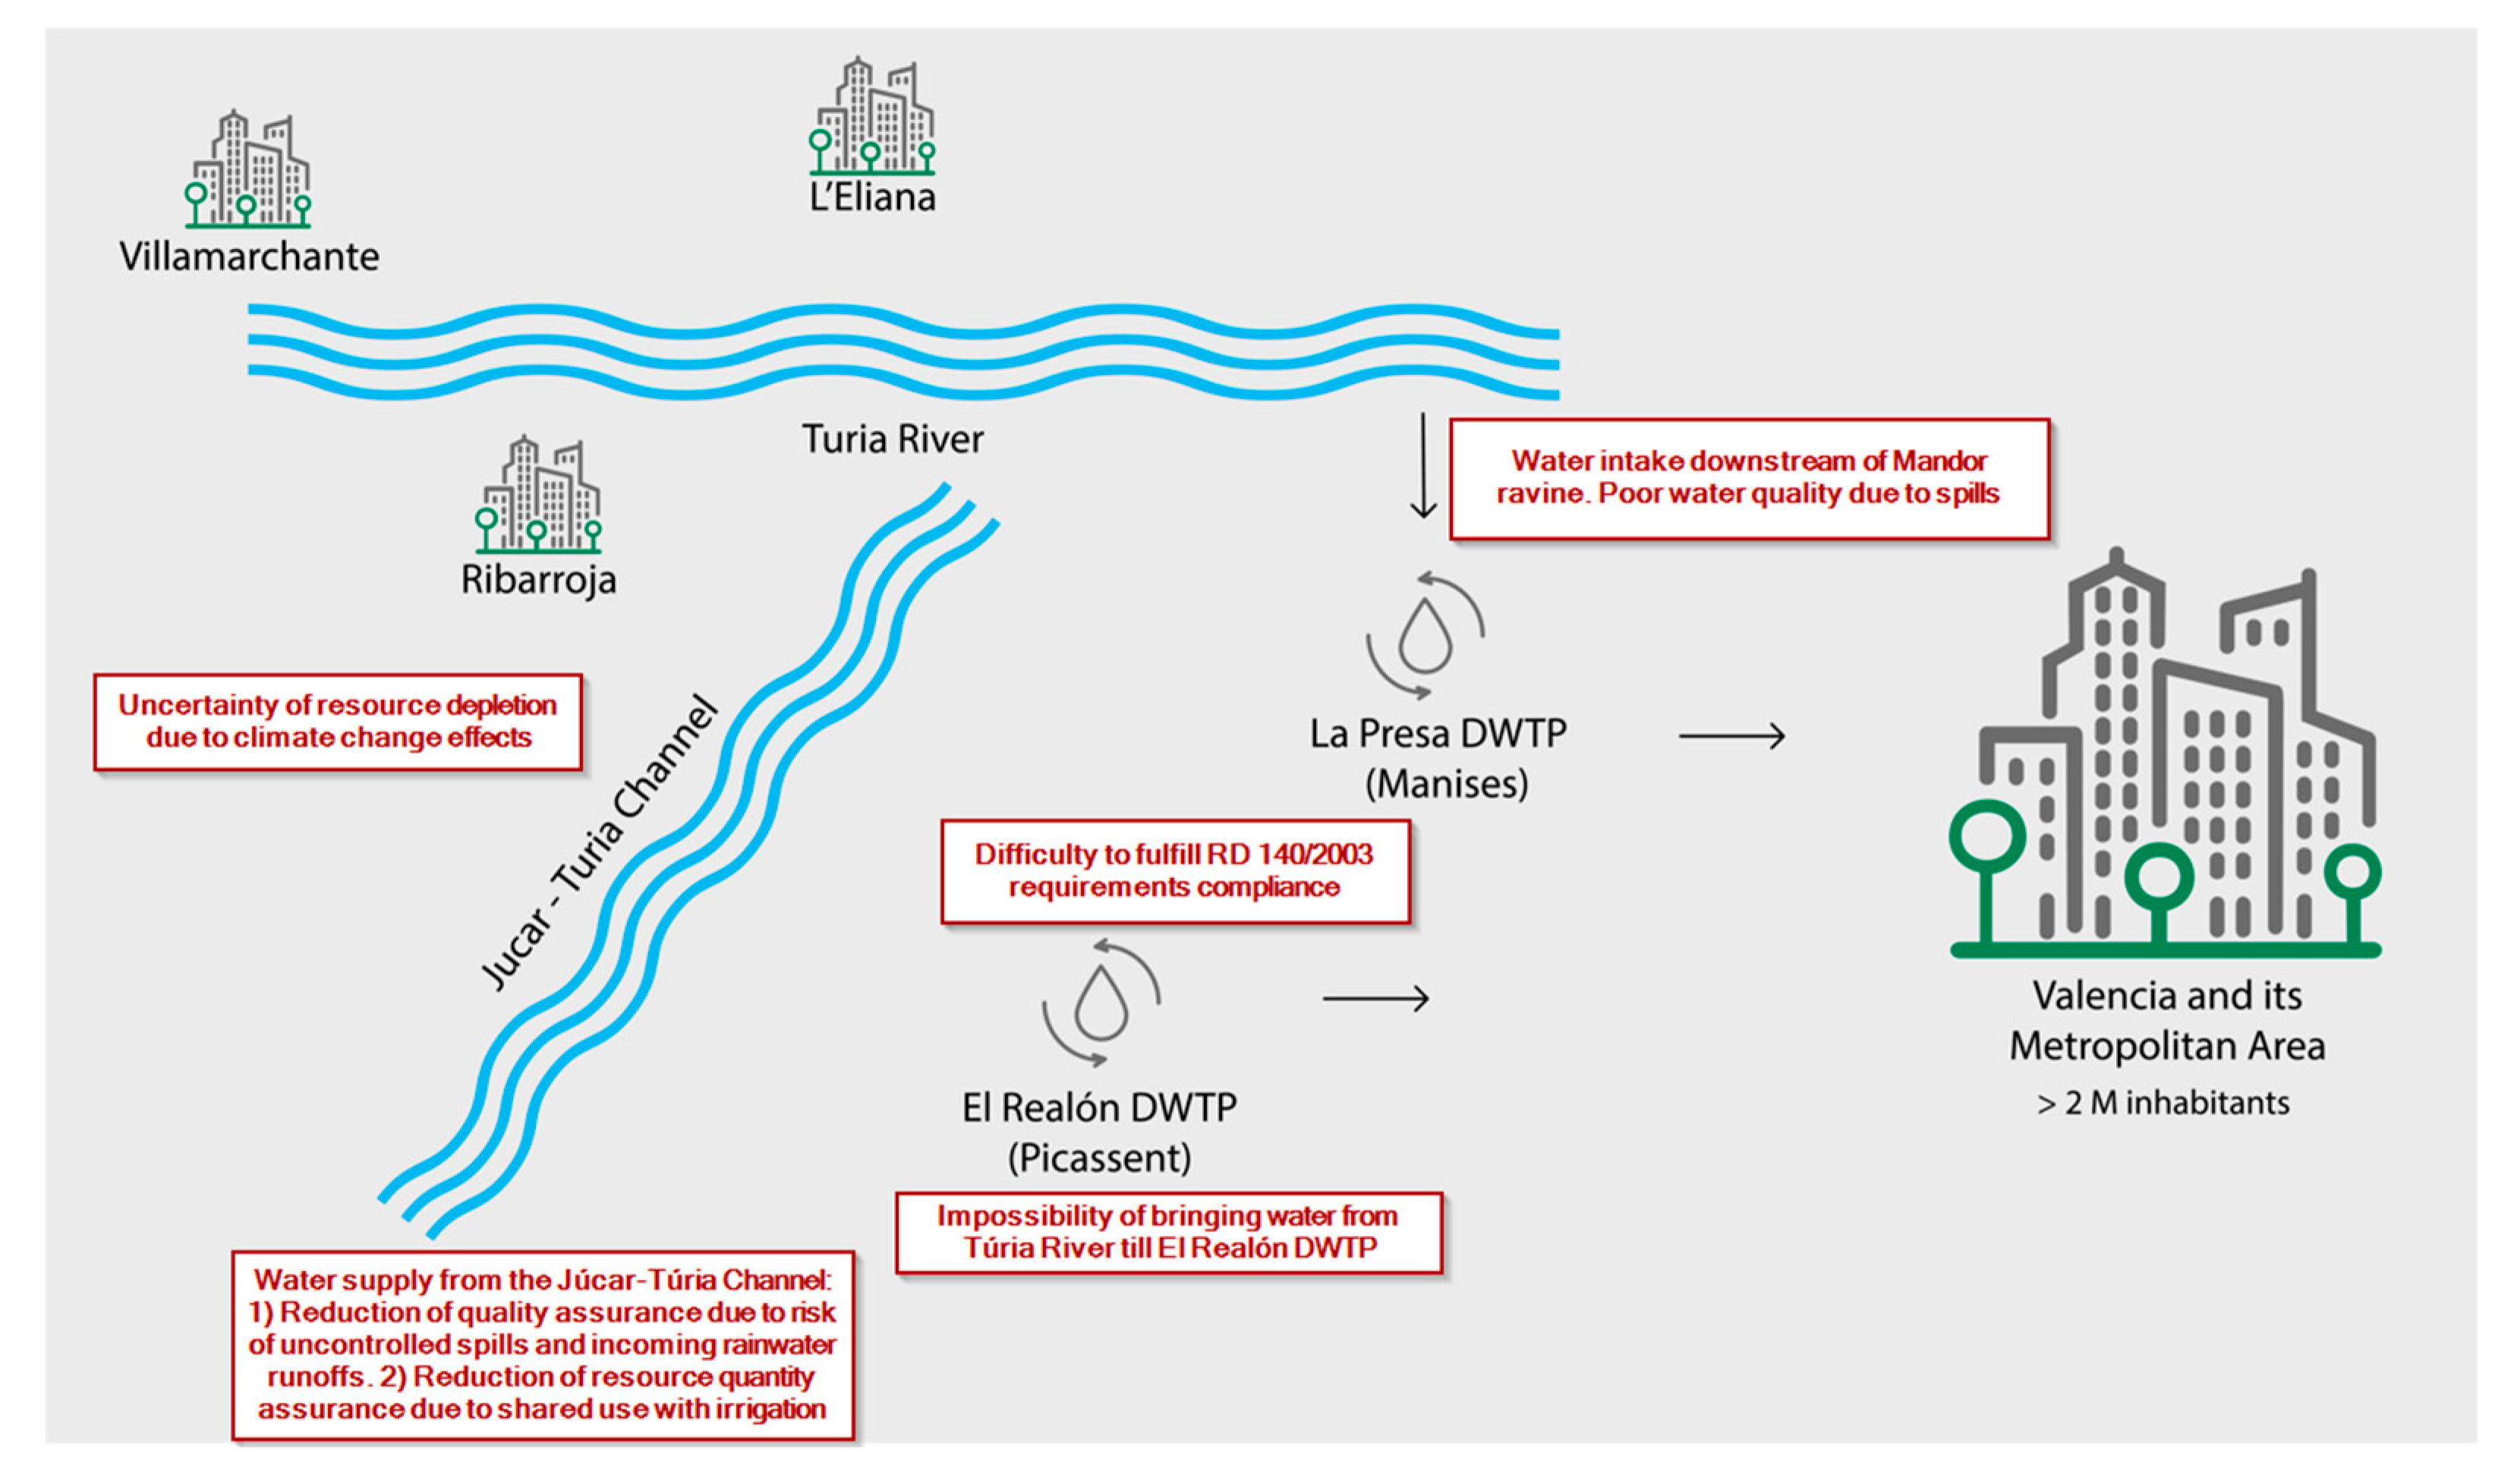
The supply of the city of Valencia and its metropolitan area presents mainly two key issues: the quality of the water at the point of intake of the DWTP and the vulnerability of the supply system (Figure 1). At certain times of the year, the water quality might be compromised due to the fact that, as an open channel, the risk of uncontrolled discharges into the channel itself and the entry of surface water run-off affects the treatments that must be carried out in order to obtain adequate water quality. Regarding the vulnerability of the system, the possibility of a failure in the CJT would affect the supply of thousands of users.
Furthermore, the intake of the La Presa DWTP is located downstream of the natural mouth of the ravine called Barranc de Mandor. In 1991, the non-pluvial flows collected by this channel were directed downstream of the intake of the DWTP. This passage collects the effluents from two WWTPs and in times of intense rains, the channel is insufficient and the rain and waste flows overflow upstream of the intake of the DWTP, affecting the intake of raw water from a quantitative, qualitative and environmental point of view. Having three alternative supply sources avoids the stoppage of the DWTP.
As noted, the El Realón DWTP has its intake in the Júcar–Túria channel. This channel transports good quality water from the Tous reservoir, but because it is an uncovered course there is a risk of uncontrolled discharges and runoff. This is due to the rains that generate specific events of water with toxic substances and that require the plant to stop. The effects related to the quantity are conditioned by the shared use of this canal, since the use of irrigation greatly hinders the normal work of maintenance of this critical infrastructure. In addition to conveniently ensuring supply reliability, it is convenient to have a more flexible system in terms of contributions from both the Júcar and the Túria in the two existing DWTPs.
Regarding the drinking water treatment system, it consists of a physical-chemical and microbiological nature, basically adapted to compliance with current regulations and the raw water quality conditions observed to date. In both cases, these are conventional treatment plants with a basic line made up of a pretreatment (roughing and pre-oxidation); clarification (coagulation–flocculation–decantation); filtration and a final disinfection.
If we consider the advent of emerging and complex pollutants, the growing demand from health authorities and the limitations they impose on the use of chlorinated components, together with the pressure from society to improve the quality required beyond water drinkable in terms of its organoleptic perception, it is very possible that in the future it will be necessary to rethink current treatment systems.

2.2. Materials and Methods

The available water quality data have been provided by EMIVASA water monitoring stations, located at different strategic points around the city of Valencia and its metropolitan area (Figure 2). Daily information of turbidity (nephelometric turbidity unit, NTU) and conductivity (micro siemens/centimeter, μS/cm) was collected from four monitoring stations to assess water quality in this study: (1) El Realón, (2)–Júcar-Túria channel, (3) La Presa and (4) Túria River upstream. The historical values of maximum and average inlet turbidity came from El Realón. The historical conductivity values came from four different recording sources: at the facility located at El Realón, the Júcar–Túria channel at the entrance to El Realón, at the entrance to the facility located at La Presa and in the Túria River, upstream. According to the available data series, the values belonging to the periods 2015–2020 (100%), 2014–2020 (64%), 2016–2020 (71%) and 2016–2020 (72%), respectively, for each database were studied.
Concerning climate data, the ERA5-Land reanalysis was selected since it is the most current reference for the climate modeling of surface variables in Europe. It results from the forcing of the European Center for Medium-Range Weather Forecasts’ (ECMWF) land component by the ERA5 atmospheric models but without coupling them. The assimilated observations influence the simulation through the ERA5 atmospheric forcing. It is run with an hourly temporal resolution and a spatial resolution of 9 km (versus 31 km for ERA5, the previous model). Fields are masked for all oceans and were selected for the period 1981–2020 [33].
The CMIP6 consists of numerous earth system models run by different modeling centers. They all include a historical experiment of climate variables from 1850 to 2014. From 2015 onwards, model outputs are based on climate projections of the same variables, simulated by imposing different scenarios of future emissions, from the most optimistic to the most pessimistic. The names of these scenarios are constituted of the combination of two indices: a socio-economic reference pathway “index” (from SSP1: sustainability to SSP5: fossil-fueled development), and the radiative forcing level in 2100 (from 1.9 to 8.5 W/m2) [34]. The CMIP6 models considered in this study are presented in Table A1 in Appendix A, as well as the centers and countries in which they have been developed and their spatial resolution. Both the ERA5-Land and CMIP6 climate databases were collected from the Climate Data Store (CDS) provided by the Copernicus Climate Change Service (C3S). The climate models were selected according to the availability of daily data for the variables used: mean/maximum temperature, total precipitation and minimum/maximum relative humidity.

3. Water Quality Modeling

The inertia of climatic predictors in relation to water quality was considered as a hypothesis of this study. Thus, it aimed to relate variables associated with water quality, such as turbidity and conductivity, measured at EMIVASA water monitoring stations (Figure 2), with climatic variables from the ERA5-Land reanalysis in order to obtain future projections of these variables of water quality. The observed databases contained daily data for turbidity, both maximum and average, and conductivity at different points in the province of Valencia, so the predictive climatic variables were considered on the same time scale. As mentioned above, the climatic influence on water quality can be variable, so all the climatic variables that may have some influence on it were considered: average daily temperature, maximum daily temperature, total daily rainfall, minimum daily relative humidity and maximum daily relative humidity.
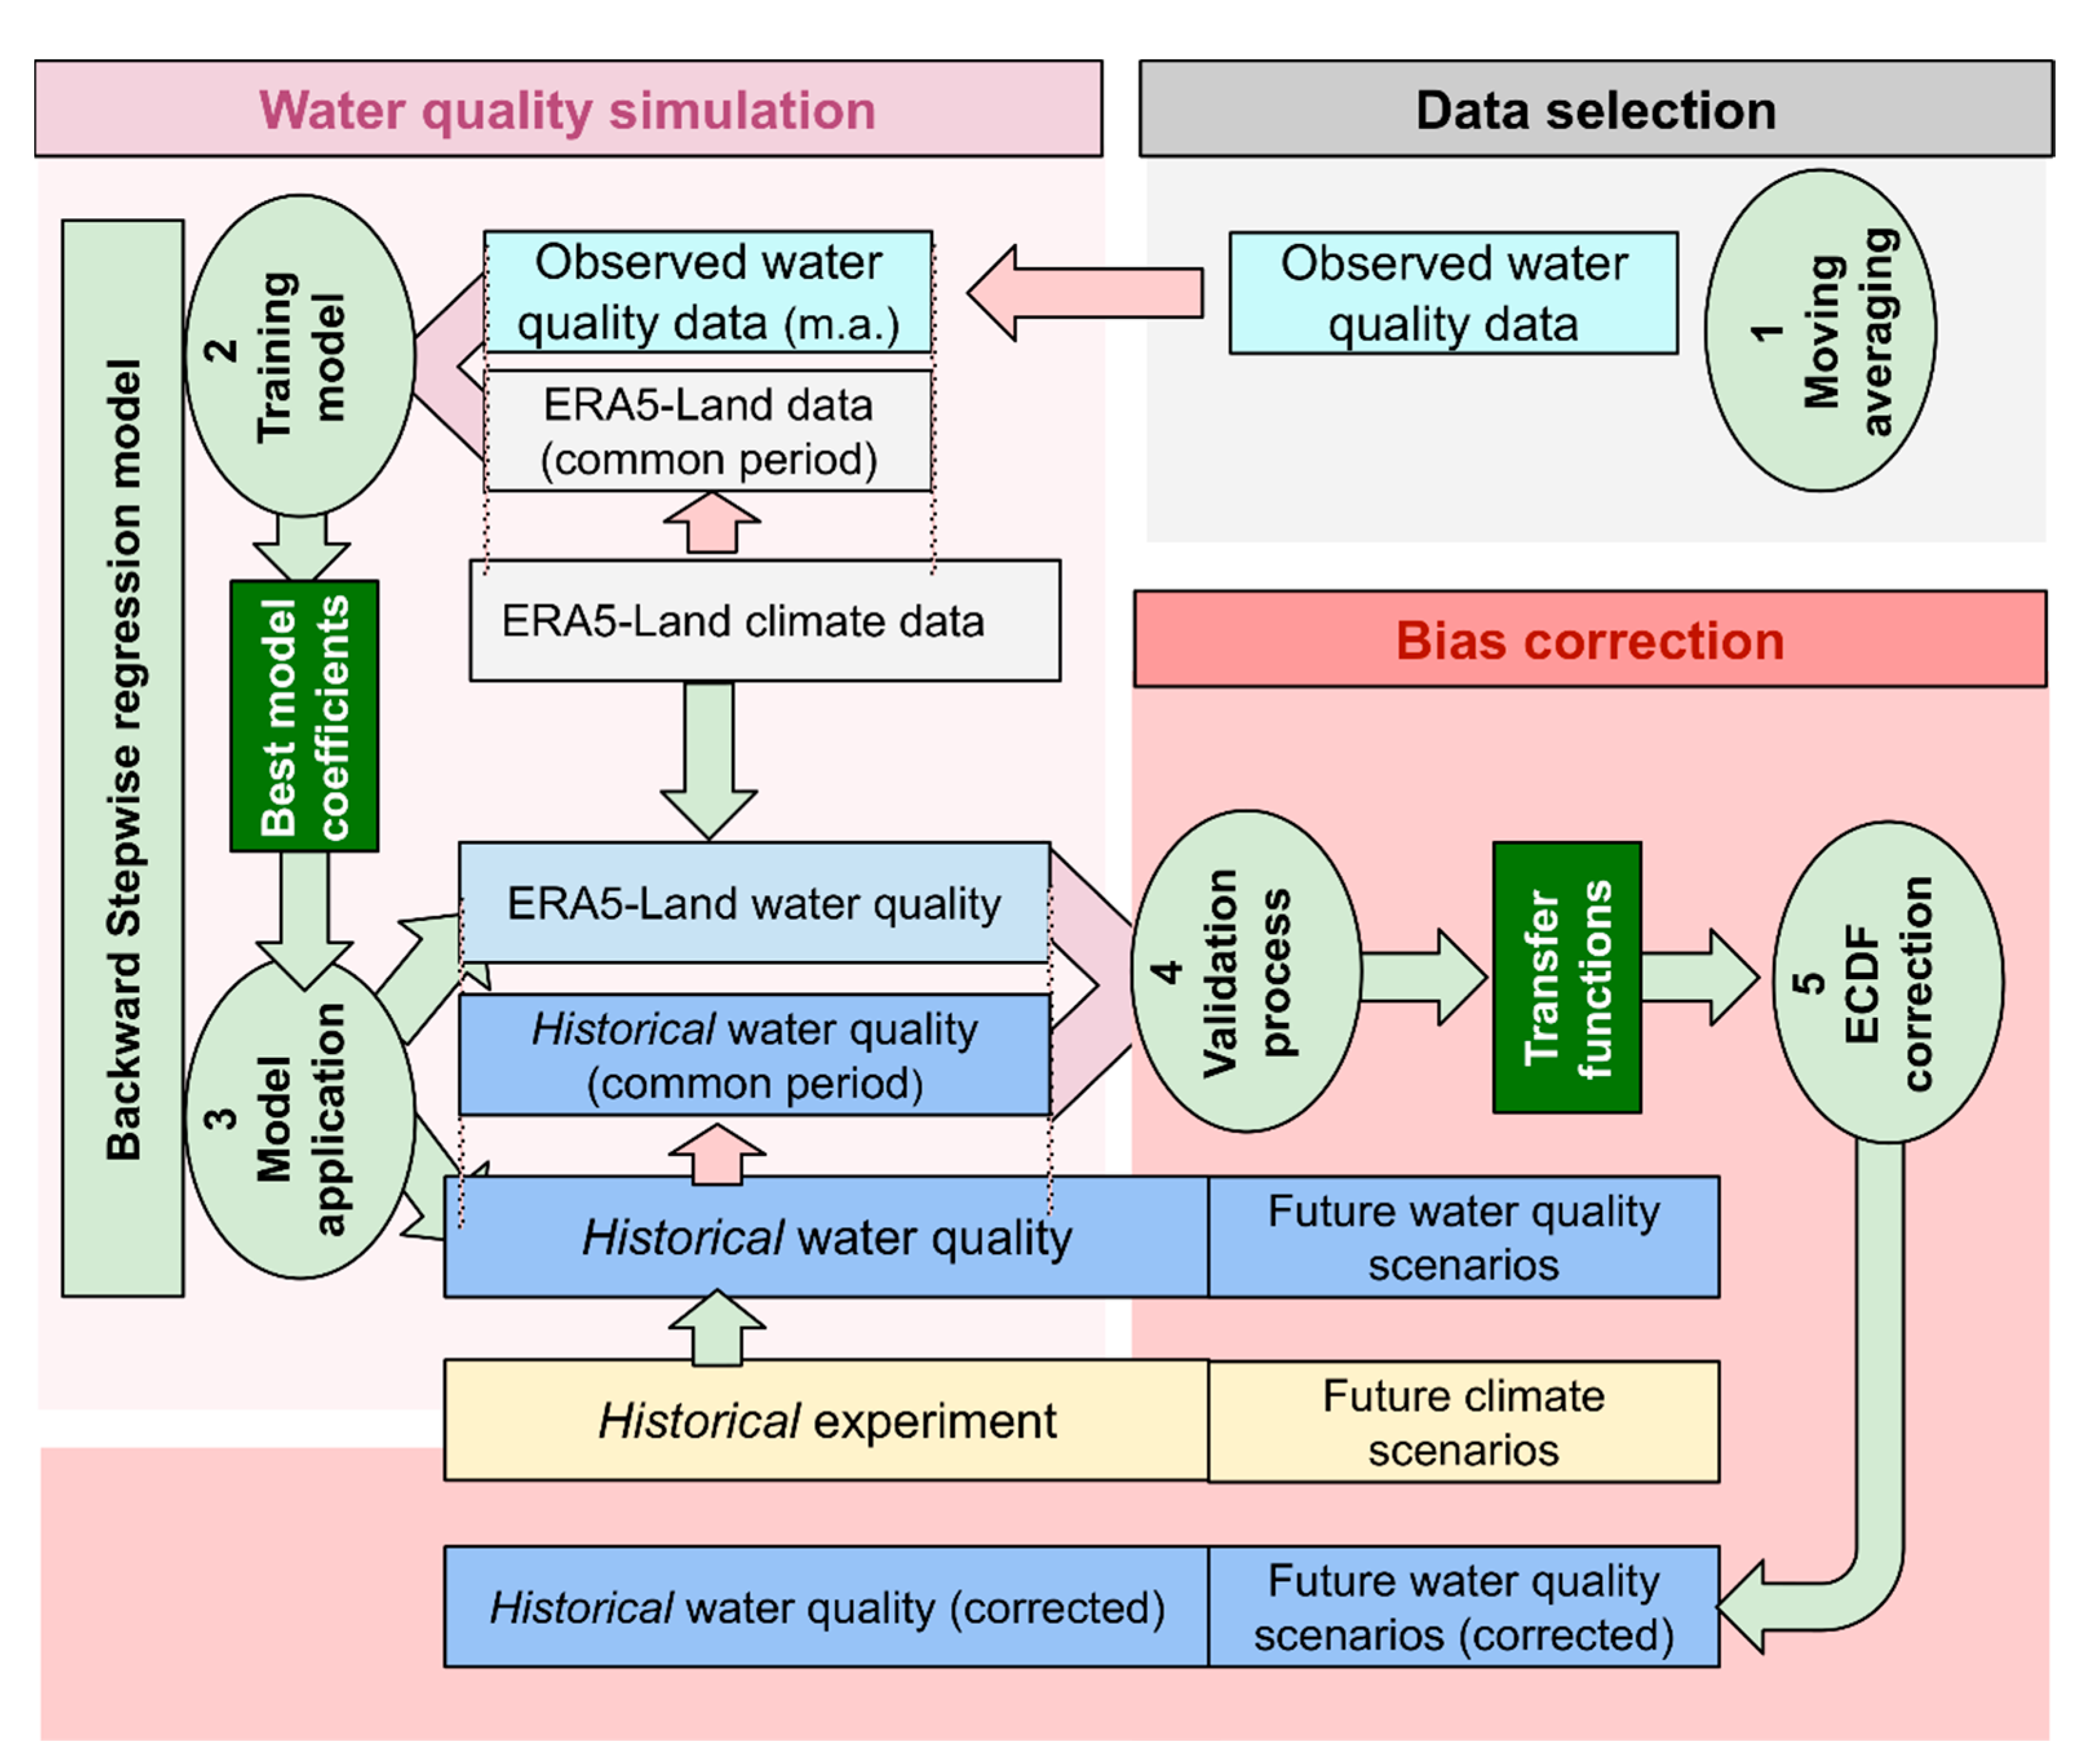
In order to find the predictor variables and time anticipation with which to predict the behavior of the different water quality parameters in the different databases, several configurations of multiple linear fits were proposed. In particular, prediction models were based on daily predictor series lagged and smoothed by 2 to 90-day moving averages with predictive character. The method used for the selection of the most suitable predictor climate variables was the backward stepwise regression [35], a linear regression approach that starts with a full model and at each step gradually removes variables from the regression model to find a reduced model that best explains the data (Figure 3). To avoid overfitting, these calculations were performed with detrended inputs by using the R programming language [36]. The selection of the best model was performed according to the Akaike information criterion (AIC) provided by the stepwise regression function [37,38].
Considering the results, the most appropriate models were selected for each water quality variable in order to obtain future projections of these variables. Conductivity and turbidity series obtained by the selected CMIP6 models (M) were corrected with ERA5-Land outputs (E) according to Gaussian and log-Gaussian transfer functions, respectively, i.e.:
Mcorr = E−mean(E)sd(E)sd(M) + mean(E)
Mcorr = exp{log(E)−mean(log(E))sd(log(E))sd(log(M)) + mean(log(E))}
where the log is the Neperian logarithm, while the sd function symbolizes standard deviation. Mcorr states the corrected model outputs, which reduce systematic errors of the simulated water quality in terms of climatology (mean and standard deviation). In this way, three future periods were considered: 2021–2050, 2046–2075 and 2071–2100 and two future scenarios SSP2 4.5 (medium but generous scenario) and SSP5 8.5 (catastrophic scenario); for each combination of these, the increase of the variables with respect to the average conditions of the historical period 1981–2010 of the same model were obtained. Subsequently, these increases were taken and added to the average conditions of the historical period (1981–2010) for the ERA5-Land reanalysis. Thus, the corrected future scenarios were finally obtained for each model and for each point of the ERA5-Land (Figure 3). Once this was done, the corrected future series were used to simulate the future conditions of turbidity and conductivity values, using the ERA5-Land point closest to each specific observatory.
Statistical analysis of both model performance (training) and projection trends (results) was applied according to the analysis of variance (ANOVA) [39]. Particularly, p-value of linear model coefficients indicates whether or not one can reject or accept the hypothesis (in our case, that predictors are not meaningful for the model). As commonly used, this paper sets p-value < 0.05 for a rejection of the “not meaningful predictor”, so it is probably an excellent contribution of explained variance of the variable modeled.

4. Results

4.1. Training and Validation of the Method

Taking into account the databases of observed values and past climatic values from the ERA5-Land reanalysis at the grid points closest to each observatory, the aim was to model for turbidity and conductivity considering exclusively climatic variables. The best fits were found to be obtained by modeling the predictors using multiple linear regressions based on daily predictor series smoothed by 2–90 day moving averages.
The validity of the results is based on the p-values and Pearson correlation coefficient (R) obtained for each adjustment. While for turbidity values, better results are obtained using small period moving averages, for conductivity values there is a higher variability (see Appendix A). This higher variability may be associated with the different locations of the observed conductivity databases used in the study. For the maximum and mean turbidity inlet values, the low correlation values obtained are interpreted as a minor contribution to the variability of the series (variance explained by the model) compared to other contributions of non-climatic origin (Figure 4). Despite this, the linear models showed statistical significance, with the total p-value obtained being less than 10−6 in all cases, implying that there was an influence of climate on this water quality variable. The best fits were obtained for the 2-day and 7-day moving average predictor series, respectively (Table A2).
Regarding the conductivity values (see Table A3), it should be noted that these conductivity values came from different databases and they have been extracted at different locations. It should also be taken into account that measured data series at the inlet point of the La Presa DWTP facility may vary depending on the mixing of water from different sources. In addition, it should be noted that all the observed series have missing data that have been removed for analysis, so there was not a complete day-to-day continuity in the series. Significantly higher linear-correlation values than for turbidity were obtained from all the databases except for the upstream Túria river, which remained in the same order of magnitude but with slightly higher values. This implied that the climatic contribution accounted for a larger proportion of the variability in the series than in the variable analyzed above (Figure 5). All models showed statistical significance, with the total p-value obtained being less than 10−11 in all cases, confirming that there is an influence of climate on water quality. However, the relationship is not perfectly linear and it accounted for less than 34% of the explained variability at best, therefore other contributions of non-climatic origin must be considered. For the conductivity measured at El Realón, the best fit resulted from the series of predictors smoothed by the 30-day moving average, although with 60-day smoothing a practically equal value was obtained; for the conductivity measured in the Júcar–Túria channel at the entrance to El Realón, the best fit also resulted from the 30-day moving average; for the conductivity measured at the entrance to La Presa, the best fit resulted from the 7-day moving average; finally, for the conductivity measured in the Túria River upstream, the best fit resulted from the 60-day moving average. These fits represented a higher percentage of the variability of the variable under similar statistical significance values.

4.2. Climate-Based Water Quality Scenarios

The future projections obtained for the different water quality variables are shown in Figure 6 and Figure 7 for turbidity and conductivity, respectively, at the different observatories analyzed. These figures correspond to the 5-year moving average of the annual averages of the daily values obtained so that inter-annual variability and year-to-year variations do not interfere in the observation of the future evolution of the values, thus being able to distinguish more easily trends towards higher or lower values.
In the simulations of turbidity values the CanESM5 model was not considered as it did not properly simulate the interannual variability (<50%). Regarding the results obtained, two different behaviors are observed (Figure 6). On the one hand, in terms of the 50th quantile of the six CMIP6 models analyzed, the maximum inlet turbidity would experience a reduction of 0.3 NTU (21%) in the SSP2 4.5 scenario, and of 1.2 NTU (71%) in the SSP5 8.5 scenario, both by the end of the 21st century (Figure 6a). On the other hand, the mean inlet turbidity variable would experience an increase of 0.5 NTU (35.1%) in the SSP2 4.5 scenario and an increase of 0.5 NTU (35.1%) in the SSP5 8.5 scenario, again both by the end of the 21st century (Figure 6b). The limitations of the baseline models should not be forgotten, as they have Pearson correlation coefficients of 0.2 and 0.19 (Table A2) for each variable, respectively, (climatic conditions do not account for a large percentage of the total variability). Even so, they do have considerable statistical significance. This result would indicate that climatic influence on these variables occurs significantly, and would cause them to decrease and increase, respectively. However, in order to predict with more certainty their future behavior, it would be necessary to consider what other factors might influence them and in what way.
Concerning conductivity values, in terms of the 50th quantile of the seven CMIP6 models analyzed, an increasing trend would be expected at all the stations analyzed in this study. Conductivity at the El Realón facility would increase by 3.8 μS/cm (0.4%) in the SSP2 4.5 scenario and 27.2 μS/cm (2.9%) in the SSP5 8.5 scenario by the end of the 21st century (Figure 7a). In the Júcar–Túria canal it would increase by 4.6 μS/cm (0.5) in the SSP2 4.5 scenario and 32.1 μS/cm (3.4%) in the SSP5 8.5 scenario by the end of the 21st century (Figure 7b). At the La Presa facility, it would increase by 15 μS/cm (1.5%) in the SSP2 4.5 scenario and 46.4 μS/cm (4.8%) in the SSP5 8.5 scenario by the end of the 21st century (Figure 7c). Finally, in the upstream Túria river it would increase by 125.7 μS/cm (10.9%) in the SSP2 4.5 scenario and 192.9 μS/cm (16.7%) in the SSP5 8.5 scenario by the end of the 21st century (Figure 7d). As for turbidity, the baseline models for conductivity have some limitations. In this case, the Pearson correlation coefficients are higher: 0.58, 0.58, 0.57 and 0.28 (Table A2) for each variable, respectively, indicating that climatic conditions contribute a higher percentage of the total variability than for the previous variable. Furthermore, all models also have considerable statistical significance. Therefore, the future behavior of these variables can be predicted with more certainty by considering only climatic factors, especially in the first three cases. However, it would be ideal to consider again what other factors could have an influence, even if their contribution is smaller than in the case of turbidity.
All increments were calculated by comparing the 5-year moving average of the annual averages of the daily values obtained at the end of the 21st century with the most current historical value.

5. Discussion

Climate change’s impacts on productive processes and human activities are of high interest, as they are associated with activities that produce essential services or resources, subject to high climate-related vulnerabilities and risks. Particularly, this study is focused on the effects of climate change on water quality, completing previous works about climate-related impacts on water availability [1,2,3,4,5,6,7,8,9,13,24,32]. Such is the case of the drinking water supply processes for human consumption, provided by the water operator, capturing, treating and supplying drinking water to the city of Valencia and its metropolitan area in Spain.
The information provided by these kind of geographic information systems with forecast information for the values of the determining variables in the water cycle, according to different scenarios, is an extremely useful tool which let water managers adapt and anticipate future needs of quantity and quality, and therefore, the application of necessary adaptation measures, thus improving the efficiency of processes and the resilience of systems, such as in the case study selected.
It should be noted that the quality processes are directly and widely related to the quantity values of the resource, since the measured concentrations of the different parameters that define the quality of the water ultimately depend on the dilution, defined by the level of flows available. That is why one of the main evidenced and widely identified effects of climate change, such as the reduction in available contributions due to the change in hydrology [12], will mean lower flows, and therefore higher concentration values (turbidity, conductivity, etc.), due to a lower dilution.
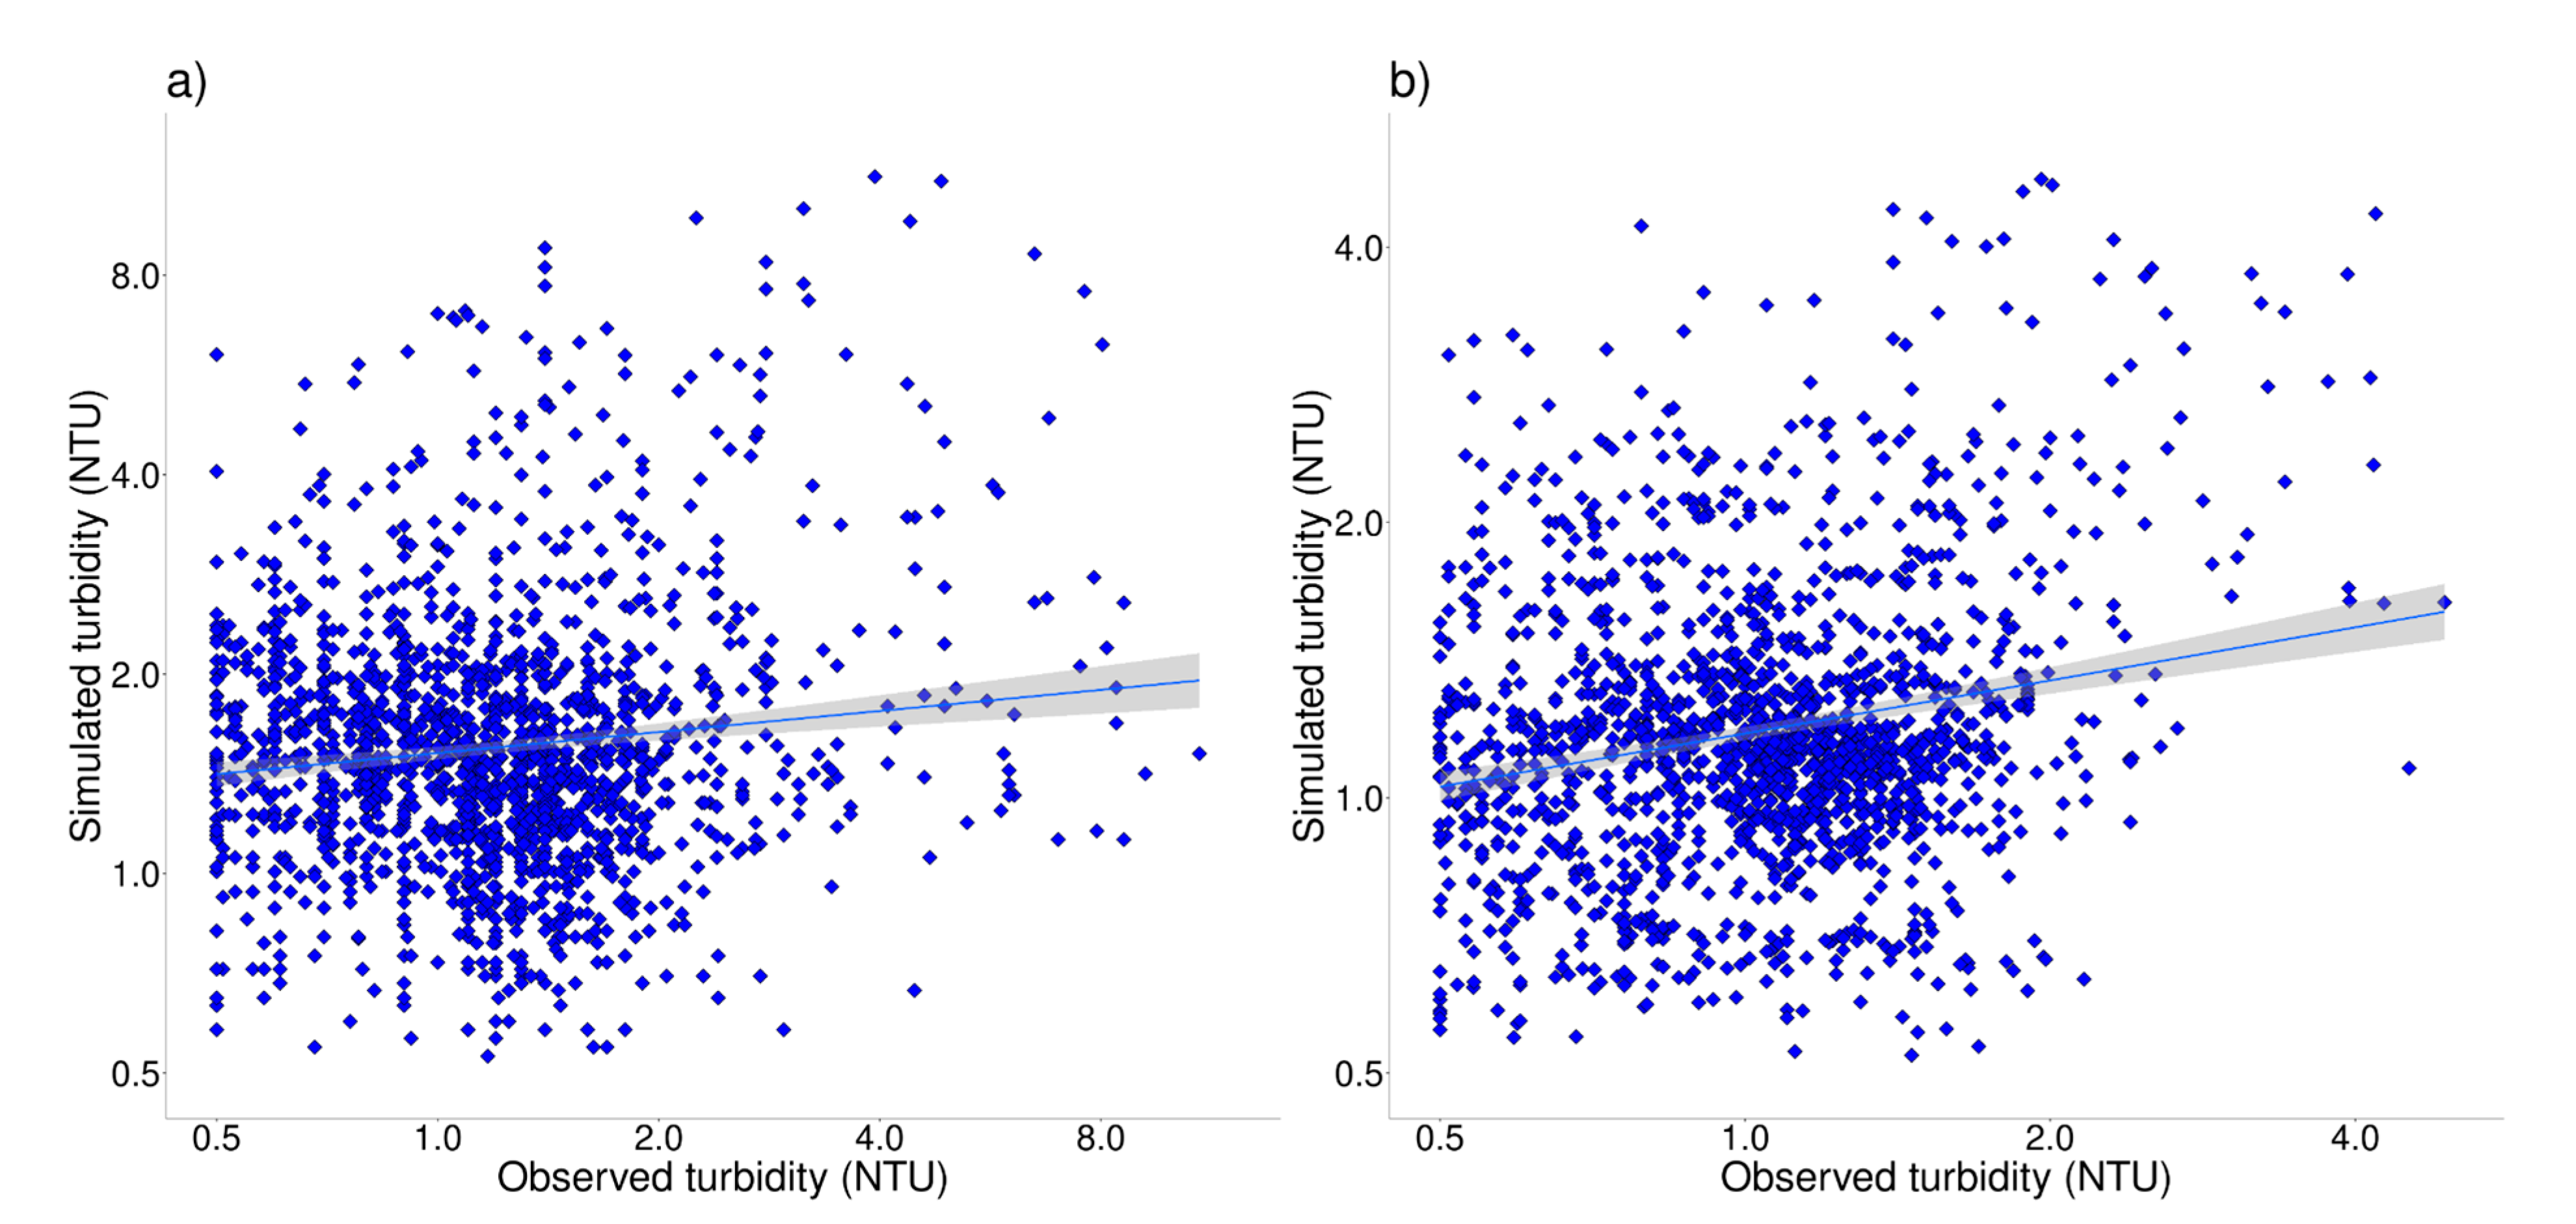
Results showed that turbidity quickly depends on daily mean temperature, total rainfall and maximum relative humidity, with statistically significant linear coefficients for moving-average windows ranging between 2 and 7 days. Moreover, the empirical relationship shows nonlinear contributions that are can be viewed in Figure 5. On the other hand, the predictive model for conductivity presented a slower response (with significant linear signal up to 30 or 60 days) and also incorporating maximum temperature and minimum relative humidity, additional to the climate-dependency obtained for turbidity.
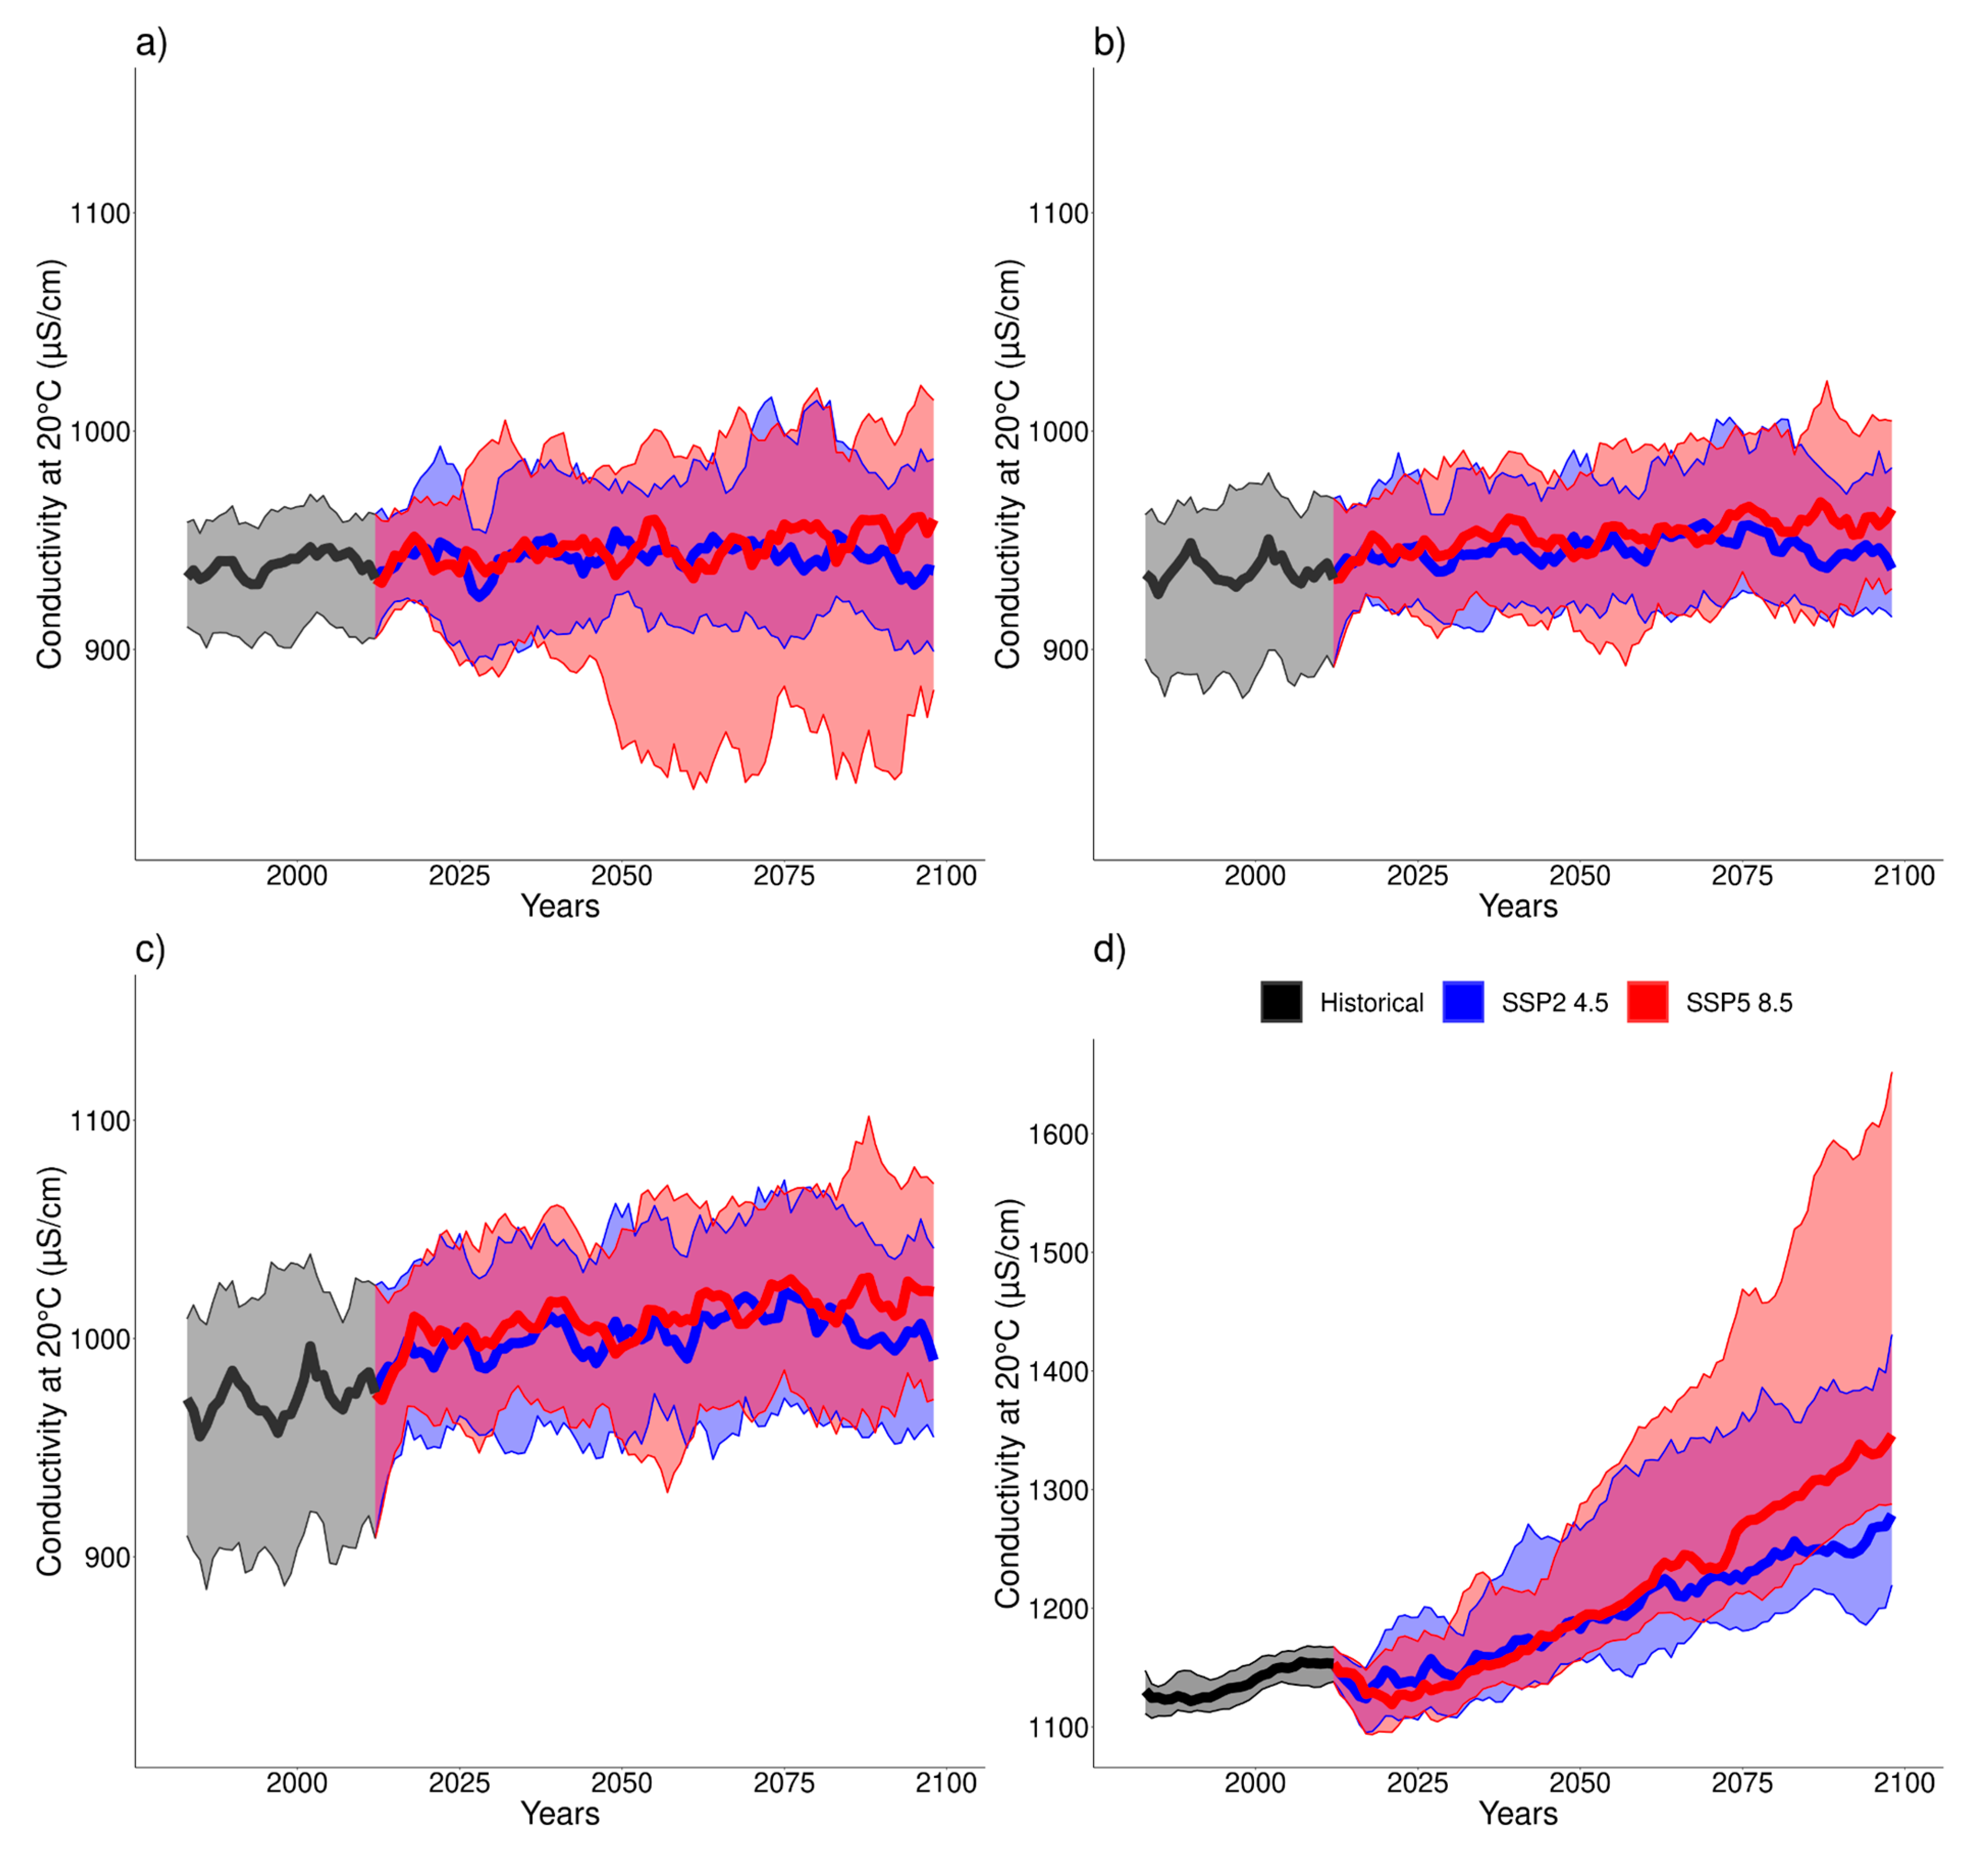
According to the future scenarios generated, the most significant change was found in the projected increase of conductivity for the station of the Túria River. However, this increment of conductivity has not been highlighted in the vicinity of the Júcar–Túria channel stations which provide streams from the Júcar River. In this case, the water quality simulation is positive but with a lower trend and does not reflect the expected similar behavior among both river basins, possibly due to other contributions of non-climatic origin that should be considered as river basin regulation. Note that this is a crucial question in the Jucar River Basin District planning and management and specially for the drinking water supply of Valencia and its metropolitan area where, currently three out of four cubic meters of water have their origin in the Jucar River. Depending on the quality of water resources this relation may vary in the future.
Furthermore, the main requirement for human consumption of water is to meet the quality standards required by the applicable health regulations in each country or region and its modifications (RD 140/2003), being currently under review and within the approval process of the new one [40]. This is done through the analysis of certain parameters or variables, whose concentration determines the quality of the water and the physical-chemical processes necessary to apply for its treatment.
Compliance with quality requirements is increasingly influenced or affected by risk episodes associated with extreme meteorological processes, such as floods and droughts, since their appearance affects the values of the monitored quality parameters. The monitored parameters within this study, as previously shown, are conductivity, turbidity, which could mean a limitation of the study’s scope (more uncertainty associated with the forecasts and results), so there are more variables or parameters affecting water quality. This means an opportunity of widening the future project’s scope, so climate change research involves multiple activities, variables and parameters, and need the use of different methodologies, and decision making and management tools, to tackle the overwhelming task [41].
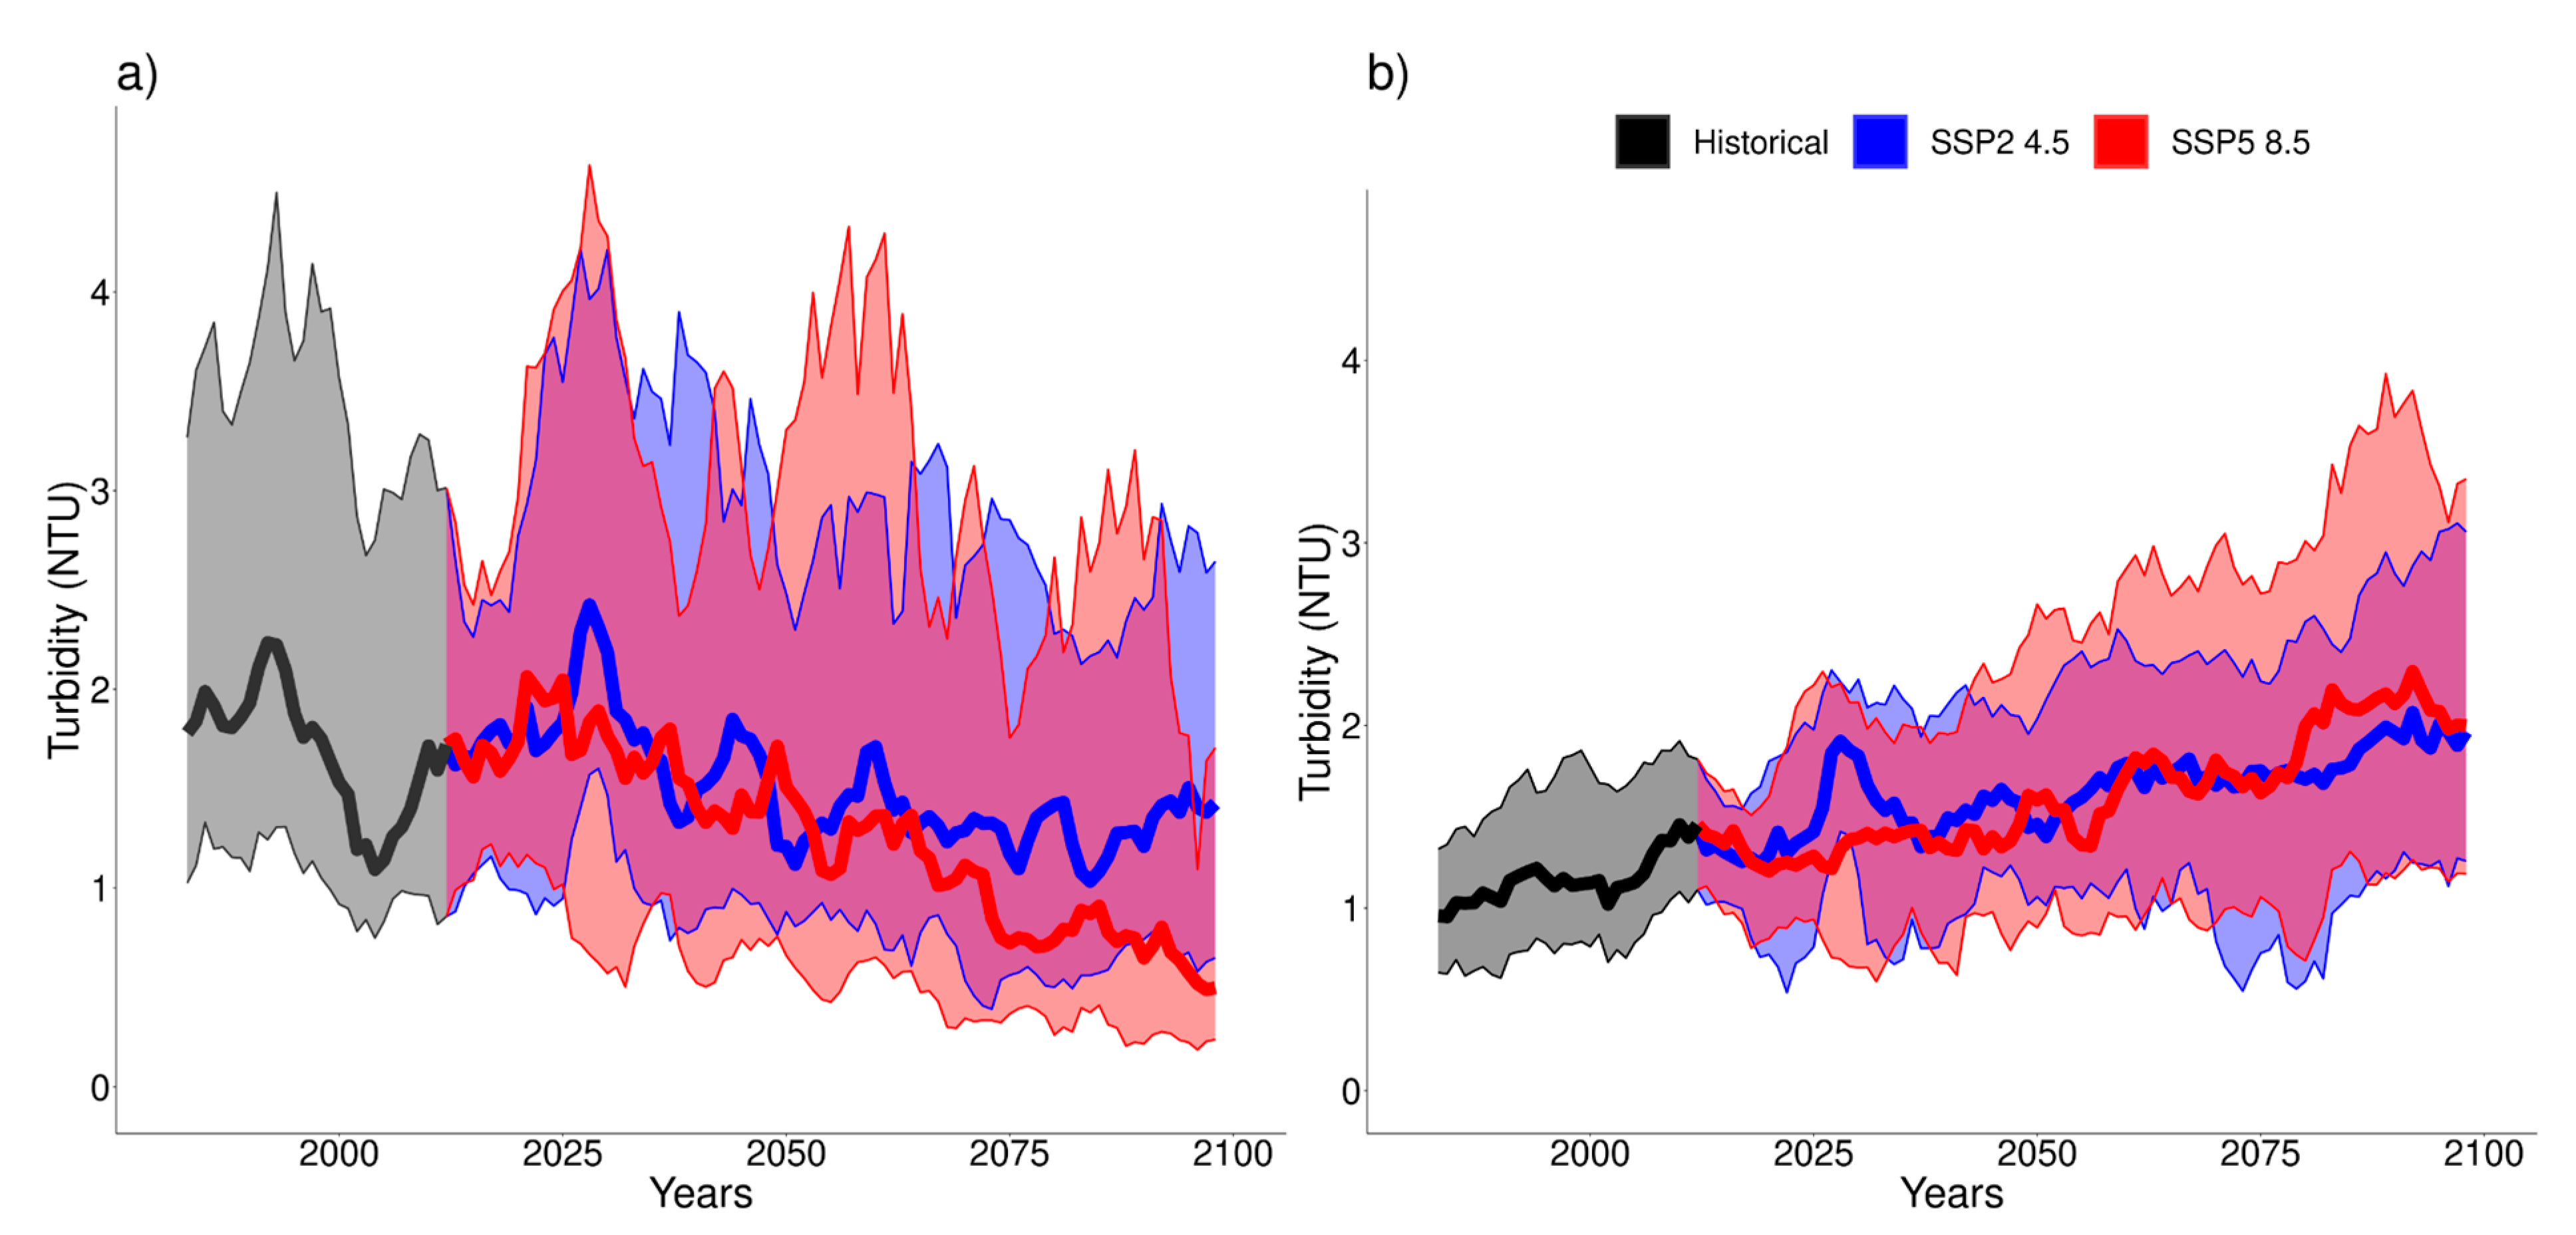
On the other hand, it is worth noting that this study is focused on predicting an average climate. The 5-year moving average of the annual averages of the daily values obtained masks the extreme precipitation events that may occur, which should be analyzed by further works on probability distributions and return periods. Currently, during these episodes the turbidity and conductivity parameters tend to reach very high values and that usually requires the implementation of specific measures in the DWTP, such as the reduction of the treated flows or an increase in the addition of coagulants. As an example of this, the currently existing water treatment at the La Presa DWTP (composed by coagulants, flocculant, high I start-up and increase of oxidation at the head and start-up of wells) managed to treat turbidity values over 85 NTU during the extreme events that occurred in 2020. Higher turbidity values can be treated but the microbiological risk increases. The effluents go out from the plant with 0.1–0.15 NTU and in those moments of high turbidity, we would extract filtered with 0.2–0.3 NTU, going below 0.5 NTU.
Regarding conductivity values, especially for the Túria River station with forecasted conductivity values of 2000 µS/cm in the worst scenario around year 2100, RD140/2003 establishes a threshold for drinking water up to 2500 µS/cm but it would influence the value (out of range +/−0.5) encrusting in the index of Langelier, which is also reflected in this RD140/2003, so some additional treatment would be necessary in the case of this scenario occurring, which probably would be associated with a low occurrence probability, but it should be nevertheless considered in order to anticipate the adaptation strategy and the system’s resilience.
In this scenario, it would mean a drought episode in which the flow would basically be reduced to more than half compared to the existing one. In these situations, two options are considered in order to reduce conductivity. On the one hand, through dilution effect by mixing with water from the Júcar–Túria Channel, so the conductivity is somewhat lower, of 960 µS/cm. That proportion of water coming from the Channel increases compared to the reduction of the river flow. On the other hand, the objective of salinity can be reached through an adjustment in the membrane technology used in the filtration process.
Another example is presented when comparing with the adaptive measures carried out during the last period of drought with important repercussions on the supply system of Valencia and its metropolitan area that took place during the years 2005–2008. The main effects were related to the scarcity of water to meet demands and the deterioration of water quality. Thus, the main tasks were focused on improvements in water treatment to enhance raw water quality and, in second place, on reducing water losses in the system. Regarding quality aspects, the three main dangers affecting raw water quality were: (1) the increased levels of salt and nutrients concentration in the Túria River, such as nitrates and organic matter, related to suspended solids and turbidity; (2) the increase in pesticide levels in the Túria river due to irrigation systems; and (3) new emerging hazards in the system, such as some macrobiotics that could cause massive growth of algae, cyanobacteria and multiple episodes of 2-MIB or excessive concentrations of protozoa.
During this period, within the adaptation measures in the DWTPs, a framework of various structural and non-structural measures was created, with the aim of improving raw water quality and drought management. The structural measures included: the installation of a new granular activated carbon filtration stage in the La Presa DWTP, the construction of new wells also in La Presa with UV disinfection equipment, the installation of motorized activated carbon dosing in both plants for the retention of pesticides and organic pollutants and the advanced oxidation facility in El Realón to tackle the diseases caused by sapid substances.
This study has shown the usefulness of evaluating the expected consequences of climate change on purification treatments in the most important supply of the Júcar River Basin District. For future research, the results obtained here should be complemented with future predictions of external events, helping to prevent and economically quantify the dangerous changes to the climate. Possible improvements in further works are the incorporation of nonlinear factors within the turbidity model and the analysis of climate change and of extreme event occurrence. This will be developed as a demonstration in the European project WAtchfulness Tool for Evaluation of wateR Quality and Quantity (WATER-Q2).

6. Conclusions

The use of climate services means a decision-making and adaptation tool very useful for water managers, in order to assess the resilience of water supply systems against variations in the main variables and parameters determining the operation of their systems or facilities.
Within this study, the use of climate information for water systems provided by CRISI-ADAPT-II tools is presented in order to assess the evolution of the main climate variables influencing water quality for urban supply in the city of Valencia and its metropolitan area. These tools offer the possibility to obtain the evolution or future behavior of several variables such as temperature, turbidity, conductivity, etc., through results of the application of different climate change forecasting scenarios. The application of this tool within this study case may will be improved in the future, by increasing the number of variables determining water quality, such as temperature or dissolved oxygen, and the amount of data involved for a better models’ calibration.
Results showed that the modeled performance of the water quality simulation is more adequate for short moving-average windows (about 2–7 days) for turbidity and longer windows (about 30–60 days) for conductivity. With this method, future scenarios were obtained to analyze the possible effects of climate change on water quality. The most significant change was found in the projected increase of conductivity for the station of the Júcar river, between 4 and 11% by 2100.
Research and development of climate services applied to water resources management may respond to the need of quantifying these impacts on the availability of water resources, guaranteeing that the purification treatments are adequate to the new circumstances, influenced by the effects of climate change.
Improving and adapting the quality and reliability of the results provided by the use of these kinds of tools will let water managers make better fitted and planned investment programs to improve the resilience of the water resources systems to better respond to the impact of climate change. Thus, through the analysis of the evolution or the expected values of variables such as temperature, turbidity and conductivity, joined with the resources quantity’s forecasts, water managers will identify the necessary additional treatments within a purification or treatment process, or the necessary catchment works, in order to face water scarcity periods and the consequent quality problems.

Author Contributions

Conceptualization G.G.-M., M.P.-M., P.A.L., J.M.C. and M.Á.P.-M.; methodology, R.M.; software, C.P.-L.; validation, C.P.B. and T.R.; formal analysis, L.G. and G.G.-M.; investigation, G.G.-M., E.G. and L.G.; resources, D.R.; data curation, L.G.; writing—original draft preparation, G.G.-M.; writing—review and editing, G.G.-M. and M.P.-M.; visualization—figures, L.G., D.R., R.M. and M.P.-M.; supervision, S.F.-S. and M.A.S.; project administration, G.G.-M., M.P.-M. and R.M.; funding acquisition, M.P.-M. and E.G. All authors have read and agreed to the published version of the manuscript.

Funding

This research was co-funded by the Agència Valenciana de la Innovació, through the study “Aplicación de los servicios climáticos para el desarrollo de una estrategia de adaptación al cambio climático de los sistemas urbanos de abastecimiento” (INNTA3/2020/14), as well as by EIT Climate-KIC, financing the CRISI-ADAP-II project (EIT-CKIC-TC_2.13.7_190799), and supported by the Ministry for the Ecological Transition and the Demographic Challenge (MITECO) of the Spanish Government under the “IMpacts of climate change on wetlands Affected by GroUndwAter (IMAGUA)” project.

Informed Consent Statement

Informed consent was obtained from all subjects involved in the study.

Data Availability Statement

The CMIP6 model outputs and ERA5-Land climate databases were collected from the Climate Data Store (CDS) of the Copernicus Climate Change Service (C3S), and are available, respectively, at https://cds.climate.copernicus.eu/#!/home and https://cds.climate.copernicus.eu/cdsapp#!/dataset/reanalysis-era5-land?tab=overview (accessed on 30 December 2020). Finally, CRISI-ADAPT-II data is available in https://tool.crisi-adapt2.eu/clima-medio/ (accessed on 30 December 2020).

Acknowledgments

The authors wish to thank the Valencia City Council for its collaboration and support in all the technological initiatives of the supply management company. Thanks are due to all the colleagues from the EMIVASA Operations team for their collaboration by data and information delivery in this project; without them this work would not have been possible.

Conflicts of Interest

The authors declare no conflict of interest.

Appendix A

Table A1. Summary of basic information about CMIP6 models used in the study.
Earth System ModelEntity (Country)Spatial Resolution
(Length × Lat, Degree)
ACCESS-CM2Australian Community Climate and Earth System Simulator (ACCESS)1.87 × 1.25
ACCESS-ESM1-5Australian Community Climate and Earth System Simulator (ACCESS)1.87 × 1.25
CanESM5Canadian Centre for Climate Modeling and Analysis (Canada)2.81 × 2.79
CNRM-ESM2-1Centre National de Recherches Meteorologiques (France)1.4 × 1.4
EC-EARTH3-VegEC-EARTH Consortium (UE)1.25 × 1.00
MPI-ESM1-2-HRMax Planck Institute for Meteorology (Germany)0.938 × 0.935
MRI-ESM2-0Meteorological Research Institute (Japan)1.125 × 1.121
In this section, model configuration is shown concerning the fitting coefficients obtained from the stepwise regression and significance level for turbidity (Table A2) and conductivity (Table A3) according to several moving averages.
Table A2. Coefficients of the model fit of the turbidity values using the daily predictive series smoothed by a 2-, 7- and 30-day moving average, indicating for each one the error interval in its last significant number at a 95% confidence interval in brackets and its significance in the fitting model in square brackets according to the following classification: *** for p-value < 0.001, ** p-value < 0.01, * p-value < 0.05, ° p-value < 0.1, - p-value ≥ 0.1. The correlation value between the observed and simulated series for each fitting model is also presented. In all cases, the total p-value of the model is less than 10−6.
PredictandPredictor Fit CoefficientIntercept Fit CoefficientPearson Correlation Coefficient (R)
Daily Mean TemperatureDaily Max t °Daily Total RainfallDaily Minimum Relative HumidityDaily Maximum Relative Humidity
Maximum inlet turbidity El Realón DWTPma 2--0.26(9)
[***]
-0.03(2)
[**]
0(1)
[-]
0.20
ma 70.04(5)
[-]
-0.4(1)
[***]
-0.04(3)
[**]
−1(1)
[-]
0.19
ma 30--0.6(2)
[***]
--1.1(4)
[***]
0.13
Average inlet turbidity El Realón DWTPma 20.02(2)
[°]
-0.12(5)
[***]
-0.02(1)
[*]
0(1)
[-]
0.19
ma 70.03(2)
[*]
-0.19(7)
[***]
-0.02(1)
[*]
0(1)
[-]
0.19
ma 300.02(2)
[-]
-0.3(1)
[***]
--0.6(5)
(**)
0.12
Table A3. Coefficients of the model fit of the conductivity values using the daily predictive series smoothed by a 7-, 30- and 60-day moving average, indicating for each one the error interval in its last significant number at a 95% confidence interval in brackets and its significance in the fitting model in square brackets according to the following classification: *** for p-value < 0.001, ** p-value < 0.01, * p-value < 0.05, ° p-value < 0.1, - p-value ≥ 0.1. The correlation value between the observed and simulated series for each fitting model is also presented. In all cases, the total p-value of the model is less than 10−6.
PredictandPredictor Fit Coefficient (Significance Rating)Intercept Fit Coefficient
(Significance Rating)
R
Daily Mean TemperatureDaily Maximum TemperatureDaily Total RainfallDaily Minimum Relative HumidityDaily Maximum Relative Humidity
Conductivity El Realón DWTPma 7--−2(1)
[*]
-−3.0(4)
[***]
1080(20)
[***]
0.51
ma 30−1.3(6)
[***]
-−4(4)
[***]
-−3.4(6)
[***]
1130(30)
[***]
0.58
ma 6010(10)
[°]
−10(10)
[*]
−19(5)
[***]
-−4.2(8)
[***]
1260(90)
[***]
0.58
Conductivity Júcar–Túria channelma 78(6)
[**]
−9(6)
[**]
−3(2)
[**]
−4.4(9)
[***]
1.8(8)
[***]
1030(50)
[***]
0.52
ma 30-−1.4(5)
[***]
−15(4)
[***]
−3.6(6)
[***]
-1140(30)
[***]
0.58
ma 60−2.6(9)
[***]
-−16(6)
[***]
−3(2)
[***]
−2(1)
[-]
1280(130)
[***]
0.55
Conductivity of La Presa DWTPma 7-−0.8(8)
[*]
−12(4)
[***]
−4(1)
[***]
1.7(8)
[**]
1070(70)
[***]
0.57
ma 30-−3(1)
[***]
−36(9)
[***]
−4(2)
[***]
4(1)
[***]
960(120)
[***]
0.55
ma 60-−5(1)
[***]
−50(10)
[***]
−1(1)
[-]
-1200(40)
[***]
0.50
Upstream Túria river conductivityma 714(8)
[***]
−16(8)
[***]
−17(5)
[***]
−0.6(8)
[-]
-1290(70)
[***]
0.27
ma 3050(20)
[***]
−50(20)
[***]
−40(10)
[***]
−1(1)
[*]
-1510(140)
[***]
0.25
ma 6070(20)
[***]
−70(20)
[***]
−70(20)
[***]
--1620(140)
[***]
0.28

References

  1. Rubio-Martin, A.; Pulido-Velazquez, M.; Macian-Sorribes, H.; Garcia-Prats, A. System Dynamics Modeling for Supporting Drought-Oriented Management of the Jucar River System, Spain. Water 2020, 12, 1407. [Google Scholar] [CrossRef]
  2. Molina, J.-L.; Zazo, S.; Martín, A.-M. Causal Reasoning: Towards Dynamic Predictive Models for Runoff Temporal Behavior of High Dependence Rivers. Water 2019, 11, 877. [Google Scholar] [CrossRef] [Green Version]
  3. Caloiero, T.; Coscarelli, R.; Pellicone, G. Trend Analysis of Rainfall Using Gridded Data over a Region of Southern Italy. Water 2021, 13, 2271. [Google Scholar] [CrossRef]
  4. Mosleh, L.; Negahban-Azar, M. Role of Models in the Decision-Making Process in Integrated Urban Water Management: A Review. Water 2021, 13, 1252. [Google Scholar] [CrossRef]
  5. IPCC. Intergovernmental Panel on Climate Change. In Managing Therisks of Extreme Events and Disasters to Advance Climate Change Adaptation; Field, C.B., Barros, V.R., Eds.; A special report of working groups i and ii of the intergovernmental panel on climate change; Cambridge University Press: Cambridge, UK, 2012. [Google Scholar]
  6. IPCC. Intergovernmental Panel on Climate Change. Climate Change 2014—Impacts, Adaptation and Vulnerability: Part A: Global and Sectoral Aspects; Field, C.B., Barros, V.R., Dokken, D.J., Mach, K.J., Mastrandrea, M.D., et al., Eds.; Contribution of working group II to the fifth assessment report of the intergovernmental panel on climate change; Cambridge University Press: Cambridge, UK, 2014. [Google Scholar]
  7. Sabater, S.; Tockner, K. Effects of Hydrologic Alterations on the Ecological Quality of River Ecosystems; Sabater, S., Barcelo, D., Eds.; Water scarcity in the Mediterranean: Perspectives under global change, the handbook of environmental chemistry 8; Springer: Berlin/Heidelberg, Germany, 2010. [Google Scholar]
  8. Kellis, M.; Kalavrouziotis, I.K.; Gikas, P. Review of waste water reuse in the Mediterranean countries, focusing on regulations and policies for municipal and industrial applications. Glob. NEST J. 2013, 15, 333–350. [Google Scholar]
  9. Karaouzas, I.; Theodoropoulos, C.; Vardakas, L.; Kalogianni, E.; Th. Skoulikidis, N. A review of the effects of pollution and water scarcity on the stream biota of an intermittent Mediterranean basin. River Res. Applic. 2018, 34, 291–299. [Google Scholar] [CrossRef] [Green Version]
  10. Vargas-Amelin, E.; Pindado, P. The challenge of climate change in Spain: Water resources, agriculture and land. J. Hydrol. 2014, 518, 243–249. [Google Scholar] [CrossRef]
  11. Estrela, T.; Pérez-Martin, M.; Vargas, E. Impacts of climate change on water resources in Spain. Hydrol. Sci. J. 2012, 57, 1154–1167. [Google Scholar] [CrossRef]
  12. Gómez-Martínez, G.; Pérez-Martín, M.A.; Estrela, T.; Del-Amo, P. North Atlantic Oscillation as a Cause of the Hydrological Changes in the Mediterranean (Júcar River, Spain). Water Resour. Manag. 2018, 32, 2717–2734. [Google Scholar] [CrossRef]
  13. Suárez-Almiñana, S.; Solera, A.; Andreu, J.; García-Romero, L. Uncertainty analysis of climate projections in relation to historical contributions in the Júcar River Basin. Ing. Del Agua 2020, 24, 89–99. [Google Scholar] [CrossRef]
  14. Suárez-Almiñana, S.; Solera, A.; Madrigal, J.; Andreu, J.; Paredes-Arquiola, J. Risk assessment in water resources planning under climate change at the Júcar River basin. Hydrol. Earth Syst. Sci. 2020, 24, 5297–5315. [Google Scholar] [CrossRef]
  15. Delpla, I.; Jung, A.-V.; Baures, E.; Clement, M.; Thomas, O. Impacts of climate change on surface water quality in relation to drinking water production. Environ. Int. 2009, 35, 1225–1233. [Google Scholar] [CrossRef]
  16. Mosley, L. Drought impacts on the water quality of freshwater systems; review and integration. Earth-Sci. Rev. 2015, 140, 203–214. [Google Scholar] [CrossRef]
  17. Michalak, A.M. Study role of climate change in extreme threats to water quality. Nature 2016, 535, 349–350. [Google Scholar] [CrossRef] [PubMed]
  18. Rose, K.C.; Greb, S.R.; Diebel, M.; Turner, M.G. Annual precipitation regulates spatial and temporal drivers of lake water clarity. Ecol. Appl. 2017, 27, 632–643. [Google Scholar] [CrossRef]
  19. Collins, S.M.; Yuan, S.; Tan, P.N.; Oliver, S.K.; Lapierre, J.F.; Cheruvelil, K.S.; Fergus, C.E.; Skaff, N.K.; Stachelek, J.; Wagner, T.; et al. Winter Precipitation and Summer Temperature Predict Lake Water Quality at Macroscales. Water Resour. Res. 2019, 55, 2708–2721. [Google Scholar] [CrossRef]
  20. Shuvo, A.; O’Reilly, C.M.; Blagrave, K.; Ewins, C.; Filazzola, A.; Gray, D.; Mahdiyan, O.; Moslenko, L.; Quinlan, R.; Sharma, S. Total phosphorus and climate are equally important predictors of water quality in lakes. Aquat. Sci. 2021, 83, 1–11. [Google Scholar] [CrossRef]
  21. Bates, B.; Kundzewicz, Z.; Wu, S. Climate Change and Water; Intergovernmental Panel on Climate Change Secretariat: Geneva, Switzerland, 2008. [Google Scholar]
  22. Kundzewicz, Z.; Mata, L.J.; Arnell, N.W.; Döll, P.; Jimenez, B.; Miller, K.; Oki, T.; Şen, Z.; Shiklomanov, I. The implications of projected climate change for freshwater resources and their management. Hydrol. Sci. J. 2008, 53, 3–10. [Google Scholar] [CrossRef]
  23. Retallack, M. The intersection of economic demand for ecosystem services and public policy: A watershed case study exploring implications for social-ecological resilience. Ecosyst. Serv. 2021, 50, 101322. [Google Scholar] [CrossRef]
  24. Monjo, R.; Gaitán, E.; Pórtoles, J.; Ribalaygua, J.; Torres, L. Changes in extreme precipitation over Spain using statistical downscaling of CMIP5 projections. Int. J. Clim. 2015, 36, 757–769. [Google Scholar] [CrossRef]
  25. Gaitán, E.; Monjo, R.; Pórtoles, J.; Pino-Otín, M.R. Projection of temperatures and heat and cold waves for Aragón (Spain) using a two-step statistical downscaling of CMIP5 model outputs. Sci. Total. Environ. 2018, 650, 2778–2795. [Google Scholar] [CrossRef]
  26. Moutahir, H.; Bellot, P.; Monjo, R.; Bellot, J.; Garcia, M.; Touhami, I. Likely effects of climate change on groundwater availability in a Mediterranean region of Southeastern Spain. Hydrol. Process. 2016, 31, 161–176. [Google Scholar] [CrossRef] [Green Version]
  27. Forero-Ortiz, E.; Martínez-Gomariz, E.; Monjo, R. Climate Change Implications for Water Availability: A Case Study of Barcelona City. Sustainability 2020, 12, 1779. [Google Scholar] [CrossRef] [Green Version]
  28. Tuel, A.; Eltahir, E.A.B. Why Is the Mediterranean a Climate Change Hot Spot? J. Clim. 2020, 33, 5829–5843. [Google Scholar] [CrossRef]
  29. Valdivia-Garcia, M.; Weir, P.; Graham, D.W.; Werner, D. Predicted Impact of Climate Change on Trihalomethanes Formation in Drinking Water Treatment. Sci. Rep. 2019, 9, 1–10. [Google Scholar] [CrossRef]
  30. Abdul Malak, D.; McGlade, K.; Pascual, D.; Pla, E. Policy Assessment. Spanish Policy Framework. In Adapting to Climate Change; Springer Briefs in Environmental Science; Springer: Cham, Switzerland, 2017. [Google Scholar] [CrossRef]
  31. Haro-Monteagudo, D.; Solera, A.; Pedro-Monzonís, M.; Andreu, J. Optimal Management of the Jucar River and Turia River Basins under Uncertain Drought Conditions. Procedia Eng. 2014, 89, 1260–1267. [Google Scholar] [CrossRef] [Green Version]
  32. Suárez-Almiñana, S.; Pedro-Monzonís, M.; Paredes-Arquiola, J.; Andreu, J.; Solera, A. Linking Pan-European data to the local scale for decision making for global change and water scarcity within water resources planning and management. Sci. Total. Environ. 2017, 603–604, 126–139. [Google Scholar] [CrossRef] [PubMed]
  33. Muñoz-Sabater, J.; Dutra, E.; Agustí-Panareda, A.; Albergel, C.; Arduini, G.; Balsamo, G.; Boussetta, S.; Choulga, M.; Harrigan, S.; Hersbach, H.; et al. ERA5-Land: A state-of-the-art global reanalysis dataset for land applications. Earth Syst. Sci. Data Discuss 2021, 1–50. [Google Scholar] [CrossRef]
  34. O’Neill, B.C.; Tebaldi, C.; van Vuuren, D.P.; Eyring, V.; Friedlingstein, P.; Hurtt, G.; Knutti, R.; Kriegler, E.; Lamarque, J.-F.; Lowe, J.; et al. The Scenario Model Intercomparison Project (ScenarioMIP) for CMIP6. Geosci. Model. Dev. 2016, 9, 3461–3482. [Google Scholar] [CrossRef] [Green Version]
  35. Venables, W.N.; Ripley, B.D. Modern Applied Statistics with S, 4th ed.; Springer: New York, NY, USA, 2012. [Google Scholar]
  36. R Core Team. R: A Language and Environment for Statistical Computing; R Foundation for Statistical Computing: Vienna, Austria, 2021; Available online: https://www.R-project.org/ (accessed on 30 December 2020).
  37. Hastie, T.J.; Pregibon, D. Generalized Linear Models. In Wadsworth & Brooks/Cole; Chambers, J.M., Hastie, T.J., Eds.; Chapter 6 of Statistical Models in S; Springer: Berlin/Heidelberg, Germany, 1992. [Google Scholar]
  38. Yamashita, T.; Yamashita, K.; Kamimura, R. A Stepwise AIC Method for Variable Selection in Linear Regression. Commun. Stat.-Theory Methods 2007, 36, 2395–2403. [Google Scholar] [CrossRef]
  39. Chambers, J.M. Linear models. Chapter 4 of Statistical Models in Seds. In Wadsworth & Brooks/Cole; Chambers, J.M., Hastie, T.J., Eds.; Springer: Berlin/Heidelberg, Germany, 1992. [Google Scholar]
  40. Royal Decree 902/2018, of July 20, which Modifies Royal Decree 140/2003, of February 7, which Establishes the Sanitary Criteria of the Quality of Water for Human Consumption, and the Specifications of the Methods of Analysis of Royal Decree 1798/2010, of December 30, which Regulates the Exploitation and Commercialization of Natural Mineral Waters and Spring Waters Packaged for Human Consumption, and of Royal Decree 1799/2010, of December 30, by which the Process of Elaboration and Commercialization of Packaged Prepared Waters for Human Consumption is Regulated. Available online: https://www.boe.es/diario_boe/txt.php?id=BOE-A-2018-10940 (accessed on 1 September 2021).
  41. Hernández-Bedolla, J.; Solera, A.; Paredes-Arquiola, J.; Pedro-Monzonís, M.; Andreu, J.; Sánchez-Quispe, S.T. The Assessment of Sustainability Indexes and Climate Change Impacts on Integrated Water Resource Management. Water 2017, 9, 213. [Google Scholar] [CrossRef] [Green Version]
Figure 1. Main vulnerabilities and location of DWTP for the supply of the city of Valencia and its metropolitan area.
Water 13 02424 g001
Figure 2. Geographical location of the Jucar River Basin District (orange line) (left) and the EMIVASA water monitoring stations (right).
Water 13 02424 g002
Figure 3. General scheme of the methodologies used in this paper.
Water 13 02424 g003
Figure 4. Scatter plot of observed (NTU) versus simulated (NTU) values for the El Realón facility for (a) maximum inlet turbidity with simulated series obtained using 2-day moving average smoothed predictors; and (b) mean inlet turbidity with simulated series obtained using 7-day moving average smoothed predictors.
Water 13 02424 g004
Figure 5. Scatter plot of observed (µS/cm) versus simulated (µS/cm) conductivity values for (a) El Realón facility, (b) Júcar–Túria channel, (c) La Presa facility and (d) upstream Túria River. In each case, simulated series were obtained using 30-day, 30-day, 7-day and 60-day moving average smoothed predictors respectively.
Water 13 02424 g005
Figure 6. Graphics of 5-year moving average of the annual averages of the simulated daily values of (a) the maximum inlet turbidity and (b) the mean inlet turbidity, both measured in NTU at the El Realón facility. The thicker black, blue and red solid lines correspond to the 50th quantile of the values obtained for the different CMIP6 models in the historical simulation and for the emission scenarios SSP2 4.5 and SSP5 8.5, respectively. In shading, the range of values between the 10th and 90th quantiles are shown in grey, blue and red for the historical, SSP2 4.5 and SSP5 8.5 scenarios respectively. (a) maximum inlet turbidity; (b) mean inlet turbidity.
Water 13 02424 g006
Figure 7. Graphics of 5-year moving average of the annual averages of the simulated conductivity daily values at (a) El Realón facility, (b) Júcar–Túria canal, (c) La Presa facility and (d) upstream Túria river, all measured in µS/cm. The thicker black, blue and red solid lines correspond to the 50th quantile of the values obtained for the different CMIP6 models in the historical simulation and for the emission scenarios SSP2 4.5 and SSP5 8.5, respectively. In shading, the range of values between the 10th and 90th quantiles are shown in grey, blue and red for the historical, SSP2 4.5 and SSP5 8.5 scenarios, respectively.
Water 13 02424 g007
Publisher’s Note: MDPI stays neutral with regard to jurisdictional claims in published maps and institutional affiliations.

