
Effect of Vegetation Restoration on Soil Hydrology in Karst Area of Southwest China: Inspiration from Barrel Planting Experiments


1
School of Karst Science, Guizhou Normal University, Guiyang 550001, China
2
State Engineering Technology Institute for Karst Desertification Control, Guiyang 550001, China
*
Author to whom correspondence should be addressed.
†
The two authors contributed equally to this work and should be considered co-first authors.
Water 2021, 13(13), 1719; https://doi.org/10.3390/w13131719
Submission received: 27 April 2021
/
Revised: 13 June 2021
/
Accepted: 18 June 2021
/
Published: 22 June 2021
Abstract
:The purpose of this study was to explore the effects of different vegetation restoration types on soil hydrology characteristics in the Karst Plateau Gorge and to clarify the soil moisture (θ) use characteristics. A barrel experiment was conducted to monitor θ and the water potential () of three vegetation types (Zanthoxylum bungeanum (ZB), Zea mays L. (ZM), and Sophora tonkinensis (ST), Abandoned land (AL)) was used as a control to explore θ use conditions of each vegetation type. A larger surface permeability led to lower moisture storage. The soil moisture storage showed the law of ZM > ST > AL > ZB. The soil moisture storage also had obvious characteristics in dry-wet seasons. As a typical drought-tolerant crop, ZB responded more obviously to rainfall and had the highest effective replenishment amount and efficiency. Two processes were clearly involved in decreasing soil moisture, which could be divided into three stages of changes: a consumption period (CP), a moisture supplying period (SP), and a relatively stable period (RSP). CP occurred primarily in November to April, when θ was prone to water stress and required proper artificial replenishment. SP was characterized by limited rainfall replenishment in January and May, which significantly increased θ. During the rainy season, corresponding with RSP, θ fluctuated within a relatively stable range. At the end of the CP, the water shortage was more severe. In actual agricultural production, attention should be given to reasonable artificial recharge. This research aims to provide a theoretical basis for karst θ management.
1. Introduction
The soil moisture (θ) in the soil-plant-atmosphere continuum (SPAC) can affect the interactions among multiple Earth systems and plays an important role in the hydrological processes and ecological processes of the land surface. θ is a key variable directly controlling soil surface water and energy fluxes [1,2,3,4,5]. Surface θ plays an important role in rainfall infiltration and redistribution, surface runoff formation, soil erosion, vegetation transpiration, and solute migration [6,7]. θ exhibits high spatial and temporal variability due to the uneven distribution of topography, soil, vegetation, and precipitation [5,8]. θ directly affects the growth and distribution of vegetation, controls the water supply of vegetation, and constitutes the main source of vegetation water consumption [4]. Therefore, studying the dynamic changes in θ is of great value for exploring regional water cycle processes, revealing the patterns of vegetation water supply and consumption, estimating regional θ content, effectively managing water resources, and promoting agricultural production.
Affected by spatial heterogeneity, the dynamic changes in θ are complicated. There are differences in the research of θ at different scales [1,9,10]. On a large regional scale, the spatial pattern of θ is controlled by precipitation and radiation differences. On a small scale (e.g., field or watershed), the spatial heterogeneity of θ is strongly influenced by soil, vegetation, and terrain [11]. In the karst environment, karstification is intense, and the shallow soil layer contains more gravel. The heterogeneity of the underlying surface of karst makes θ flow path more complicated. Moreover, the shallow soil on karst slopes has weak water holding capacity and strong permeability, which promotes the rapid downward migration of θ [12]. Highly weathered carbonate rocks, which are exposed to the surface or lie beneath the surface soil, play an important role in the absorption, storage and redistribution of precipitation, and there is also a strong spatial difference between soil water storage and plant available water [5,13,14]. In the karst area of Southwest China, the shallow soil layer is broken and discontinuous, and the surface vegetation is mainly composed of uneven grasses and shrubs [15]. These characteristics have led to an uneven distribution of the permeability of the karst system surface and ground hydrological conditions; additionally, it is difficult for vegetation to make efficient use of the abundant precipitation resources, and many ecosystems suffer from water stress [2,16,17].
At present, most studies in karst areas focus on the dynamic changes in θ and its temporal stability under different site conditions, as well as the main influencing factors of soil moisture changes. Yang [1] analyzed the dynamic changes in θ on karst slopes, and the results showed that shallow θ conditions were poor and that θ stress was more likely to occur. The analysis of the time series showed that with the increase in soil layer thickness (0–70 cm), the influence of precipitation lasted longer, while the deep layer was not affected by precipitation. Chen [5] analyzed the seasonal recharge characteristics and mean retention time (MRT) of θ in small karst watersheds, and the results showed that the seasonal recharge of soil water on slopes and depressions was similar, but the hydrological process of slopes was faster. The MRT of the depression was longer than that of other points, which indicated more intensive water mixing. These studies mainly discussed the hydrological process of karst soil but seldom involved the function of vegetation type in soil hydrological regulation and storage. Desertification is the most serious ecological and environmental problem facing this area, and rocky desertification is one of the three major ecological and environmental disaster concerns in China. Desertification and fragile karst ecological management are among the focuses of the current global sustainable development strategy research [18,19]. The effective restoration and reconstruction vegetation and the coordinated utilization of water and soil resources are the main problems affecting the comprehensive management of rocky desertification in karst areas [20]. Understanding the θ utilization conditions of vegetation in karst areas and providing a scientific basis for vegetation restoration and reconstruction are the research emphases of karst ecological environment management.
We established a barrel planting experiment to dynamically monitor the soil moisture content of four different vegetation types. Our objectives were to: (1) explore the effects of different vegetation restoration types on soil hydrology characteristics and (2) clarify the soil moisture (θ) use characteristics. The results can help elucidate the soil hydrological processes in karst areas and promote ecological restoration and reconstruction.
2. Materials and Methods
2.1. Study Area
The study area is located at the Ecohydrological Observation Station of the State Engineering Technology Institute for Karst Desertification Control in the Beipanjiang catchment, Zhenfeng County, Guizhou Province, Southwest China (25°39′13″–25°41′00″ N, 105°36′30″–105°46′30″ E), which is in the Huajiang section of the Beipanjiang River basin, with a total area of approximately 26 km2. The karst area accounts for 87.92% of the total area, which is a typical type of the Karst Plateau Gorge landform [21] (Figure 1). The terrain is dominated by karst troughs and valleys, peak clusters and depressions. Carbonate rocks are exposed, and the terrain is undulating with elevations of 400–1100 m. The area has deep river valleys, and the groundwater level is deep, which makes it difficult to utilize the water resources. The climate type is a subtropical dry and hot valley climate, with a long-term average temperature of 18.4 °C, hot and humid summers and autumns, warm and dry winters and springs, and an uneven distribution of rainfall in different seasons. The annual rainfall is 1100 mm, mainly concentrated from May to October, and the rainy season precipitation accounts for 83% of the annual rainfall. The soil is mainly composed of limestone and marl as the parent material of soil formation, and the exposed amount of bedrock is as high as 70%. The surface rocks are exposed and broken, the rate of soil formation is slow, the soil layer is barren, and the soil water retention performance is poor. Karstification is strong, and rocky desertification landscapes such as karst gullies and fissures are widespread. The coverage rate of surface vegetation is low, the area of intense rocky desertification is large, and the soil erosion is serious and now on the verge of no soil flow. Affected by the special geomorphic pattern, the temperature is relatively high, the daily evaporation amount is large, the soil is thin, the water retention is poor, the drought tolerance is poor, and the abundant rainfall resources are difficult to efficiently utilize by plants. The primary vegetation in the small watershed has been destroyed, and the plants are mainly secondary forests, while the artificial economic forests are mainly drought resistant ZB, Hylocereus undatus (HU), Lonicera japonica (LJ), ST, and ZM. The evolution of rocky desertification patterns leads to difficulty in restoring degraded habitat vegetation and the poor structure of the remaining vegetation, which seriously restricts the comprehensive management of the ecological environment in this area.
2.2. Experimental Design
The study area is an area of intensive rocky desertification, which seriously affects the production of agriculture, forestry, and animal husbandry and restricts the sustainable development of the local society and economy. The area is influenced by the dual pressures of ecological reconstruction and accelerating economic construction [22]. Through scientific research on the comprehensive control of rocky desertification, the study area has been developed as a model of ZB production, with the subsequent development of the industrial scale production of characteristic economic forest fruits (such as HU, LJ, and ST). Therefore, typical local economic crops, such as ZB, ST, and ZM, were selected as the research objects, and AL was used as the control to discuss θ utilization of different vegetation types.
In karst areas, the soil layer is shallow, surface moisture can move quickly through the soil profile, and the spatial heterogeneity of soil hydrology is strong. The soil hydrological process is affected by multiple factors, such as soil physical and chemical properties, vegetation types, topographic factors, and rock exposure rates. Therefore, we used a barrel experiment in a relatively closed environment to avoid the disturbance of surrounding topographic environmental factors.
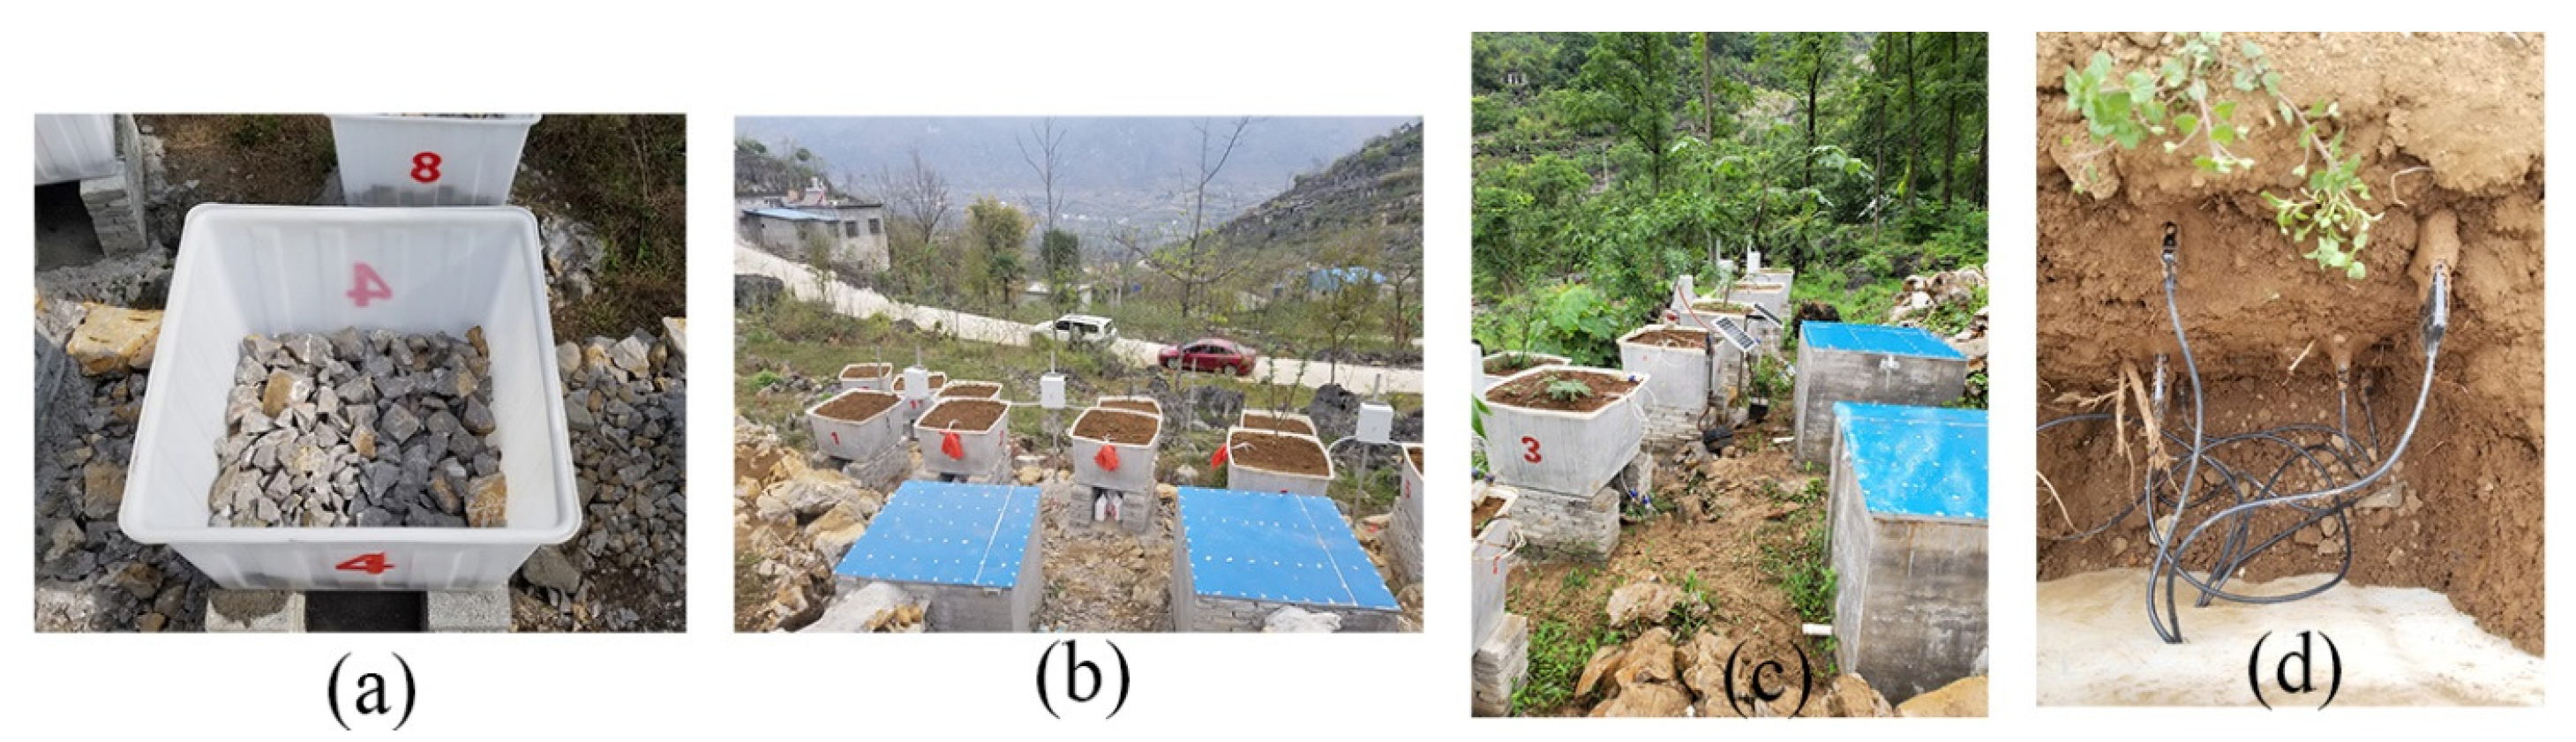
The experimental device was installed in October 2016. The barrel experiment was a regular trapezoid with a height of 65 cm and a volume of 500 L. The gravel was placed 5 cm from the bottom of the barrel, and a small hole was provided at the bottom to ensure the permeability of the device to prevent root rot during extreme rainfall events (Figure 2a). The same texture of soil was used for filling (Figure 2b). The fertilization and ploughing of planted ZB and ST occurred in the same period and ploughing and fertilization were generally not used in the latter period. ZM was planted in the spring of the following year, and ZM was fertilized and ploughed once a year. AL was abandoned naturally without tillage and fertilization. Three control devices were set for each vegetation type. From October 2016 to June 2019, each barrel was planted in a state of natural growth, and there was no other artificial disturbance except fertilization and ploughing (Figure 2c). For each vegetation type, we selected a group of barrel equipment with good growth conditions to collect samples of soil physical properties and install monitoring instruments. In June 2019, a ring knife (5 cm) was used to collect undisturbed soil within 0–15 cm, 15–30 cm, and 30–45 cm from the top to the bottom of each experimental bucket. Soil bulk density (ρb), field water holding capacity (FC), the total porosity (TP), and capillary porosity (CP) were measured using the ring knife method. Saturated water conductivity (Ks) was measured using the constant head method, and soil noncapillary porosity (NCP) was calculated by the difference of TP and CP [23]. The characteristics of these basic soil properties are shown in Table 1. At the same time, a 5TE θ sensor, MPS6 water potential sensor (Meter, USA), and data collector (EM50, USA) were installed at distances 10–15 cm from both ends of vegetation roots and 7.5 cm, 22.5 cm and 37.5 cm vertically downward from the horizontal plane (Figure 2d). Each layer (0–15 cm, 15–30 cm, 30–45 cm) was monitored to determine θ and . Using the EM50 data collector (Decagon, USA), the data indexes θ and were dynamically collected at a frequency of 30 min/time. The monitoring data used in this paper were from 1 October 2019 to 24 July 2020. A meteorological station (Meter, USA) was set 15 m from the experimental sample site. The main monitoring indexes of meteorological station included rainfall, air temperature. The data collection frequency was 30 min/time. The dynamic monthly changes in all indicators are shown in Figure 3. The rainfall was mainly concentrated in October 2019, June 2020, and July 2020.
2.3. Analytical Method
Based on meteorological data and the continuous dynamic monitoring of soil hydrology, this paper analyzed soil water storage and the lag time, rate and efficiency of effective soil water recharge by rainfall, and the gradient change in , and quantitatively analyzed the soil water retention performance and soil water transport patterns under different vegetation types.
- (1)
- Soil water storage [24]. Soil water storage refers to θ within a certain depth range. The soil water storage was calculated using Equation (1):
- (2)
- The soil water replenishment was calculated using Equation (2):
- (3)
- The lag time at each rainfall event was calculated using Equation (3):
- (4)
- The rainfall replenishment rate to soil water was calculated by using Equation (4):
- (5)
- The rainfall replenishment efficiency to soil water was calculated by using Equation (5):
- (6)
- Soil water potential gradient [25]. The water potential gradient is equal to the ratio of the difference in between two points and the distance between two points. The water potential gradient was calculated by using Equation (6):
2.4. Statistical Analysis
In this paper, Origin 2017 software was used for mapping, and IBM SPSS Statistics 22 was used for the statistical analysis of soil moisture data. The analysis indexes included maximum (Max), minimum (Min), mean, standard deviation (SD), and coefficient of variation (CV).
3. Results
3.1. Dynamic Changes in Profile θ
The spatial and temporal variations in θ of the four vegetation cover types were significantly different (Figure 4). The surface soil water was highest in ZM, followed by that in ST and AL, and the lowest was in ZB. The profile θ of AL had an average range of 19.4–26.3%, compared with the surface layer, the θ of the 15–30 cm and 30–45 cm soil profiles increased by 0.7% and 35.3%, respectively (Table 2). The θ in the 15–30 cm layer of the AL profile changed actively, and its CV value was 21.8%, which accounted for the highest proportion. The average CV value of the AL profile was 15.9%, which indicated a moderate change and was considered the sub-active layer [26]. The θ of the ZB and ZM profiles first decreased and then increased with increasing depth. Additionally, the θ of ZB was the lowest among the four vegetation types, with an average range of 13.3% to 15.7%; in relation to the θ of the surface layer, the θ of the 15–30 cm and 30–45 cm layers increased by −15.5% and−4.7%, respectively. The layers with the greatest changes in θ also had the highest CV values. The 0–30 cm can be classified as the fast-changing layer, and the 30–45 cm as the active layer. The average range of θ of ZM was 21.6% to 28.3%, while those of the 15–30 cm and 30–45 cm, increased by −23.7% and 10.5%, respectively, in relation to the θ at the surface. The CV value gradually increased with increasing depth, and the spatial heterogeneity of θ became stronger as the depth increased. Compared with the other three vegetation types, in ZM, the CV and SD of θ were the lowest at each soil depth and showed low to moderate variance. The profile θ of ST had an average range of 21.9% to 26.2%, while in relation to the surface layer, the moisture content of the 15–30 cm and 30–45 cm soil profiles increased by 18.6% and −0.7%, respectively. In ST, the CV change trend was opposite to the change trend of θ. The 15–30 cm layer was relatively stable, while the surface and bottom layers were relatively active, and the profile θ indicated moderate change and was considered the sub-active layer. In the time series, AL, ZM, ZB and ST all had typical dry-wet seasonal variation.
3.2. The Hysteresis of θ during Typical Rainfall
To explore the response characteristics of θ to rainfall in each vegetation type, 12 typical rainfall events were selected for analysis, including 4 events in the dry season and 8 events in the rainy season. Moreover, the rainfall required for the first increase in θ of 0–45 cm was used to analyze the hysteresis of the response of different vegetation to rainfall. The results of the analysis of the four typical rainfall plots in the dry season were shown in Figure 5. The θ of 0–45 cm increase times of the different vegetation types were as follows: ZB (4 times) > AL, ST (2 times) > ZM (1 time). The critical rainfall for the first increase in θ of ZB 0–45 cm was 7.8 mm, and that for AL was 8.4 mm. The critical rainfall of ZM and ST was higher than 8.4 mm. In the same rainfall event, the rainfall required for the increase in θ of ST was less than ZM. Therefore, the hysteresis of the initial increase in θ of each vegetation type was ZM > ST > AL > ZB. Eight rainfall types with increase in θ in the drought-rainy season were selected to analyze the response characteristics. As shown in Figure 6, the surface of the soil responded most rapidly to rainfall, and the hysteresis gradually strengthened with increasing depth. The 0–15 cm lag of all vegetation types was as follows: AL (1.4 h) > ZM (1.3 h) > ZB (1.1 h) > ST (0.8 h). The AL soil water infiltration increased uniformly, and the lag time of deep θ increased by approximately 25% on average compared with that of shallow θ. However, the profiles of ZB, ZM, and ST and the migration time from 0–15 cm to 15–30 cm were longer, and the hysteresis times of the 15–30 cm and 30–45 cm layers were relatively close. The overall performance of the hysteresis of θ of each vegetation type was ZB (2.2 h) > ST and ZM (1.9 h) > AL (1.73 h).
3.3. Effective Replenishment of θ during Typical Rainfall
As shown in Table 3, in typical rainfall events, the average effective recharge of each vegetation type was ZB (19.79 mm) > AL (18.88 mm) > ST (15.83 mm) > ZM (8.36 mm). Under similar rainfall intensities, as more rainfalls, the amount of recharge increases. The effective recharge efficiency of soil moisture can indicate the vertical transport speed of soil moisture in the profile, and the average recharge rate of each vegetation type was as follows: AL 5.67 mm/h, ST 3.66 mm/h, ZB 3.59 mm/h, and ZM 1.80 mm/h. The results showed that the soil moisture infiltration of the AL profile was the fastest and that of the ZM profile was the slowest. Additionally, the effective replenishment efficiency of ZB was the highest, and the proportion of rainfall converted to θ was 49.81%, followed by the recharge efficiency of AL and ST, which had rainfall replenishment efficiencies of 49.26% and 42.28%, respectively, and that of ZM was the lowest, with a value of only 24.60%, indicating that approximately quarter of the precipitation could be used by ZM. Overall, the response characteristics of ZB to rainfall were better than those of ZM and ST, and the recharge amount and effective recharge efficiency were both higher in ZB than in ZM and ST.
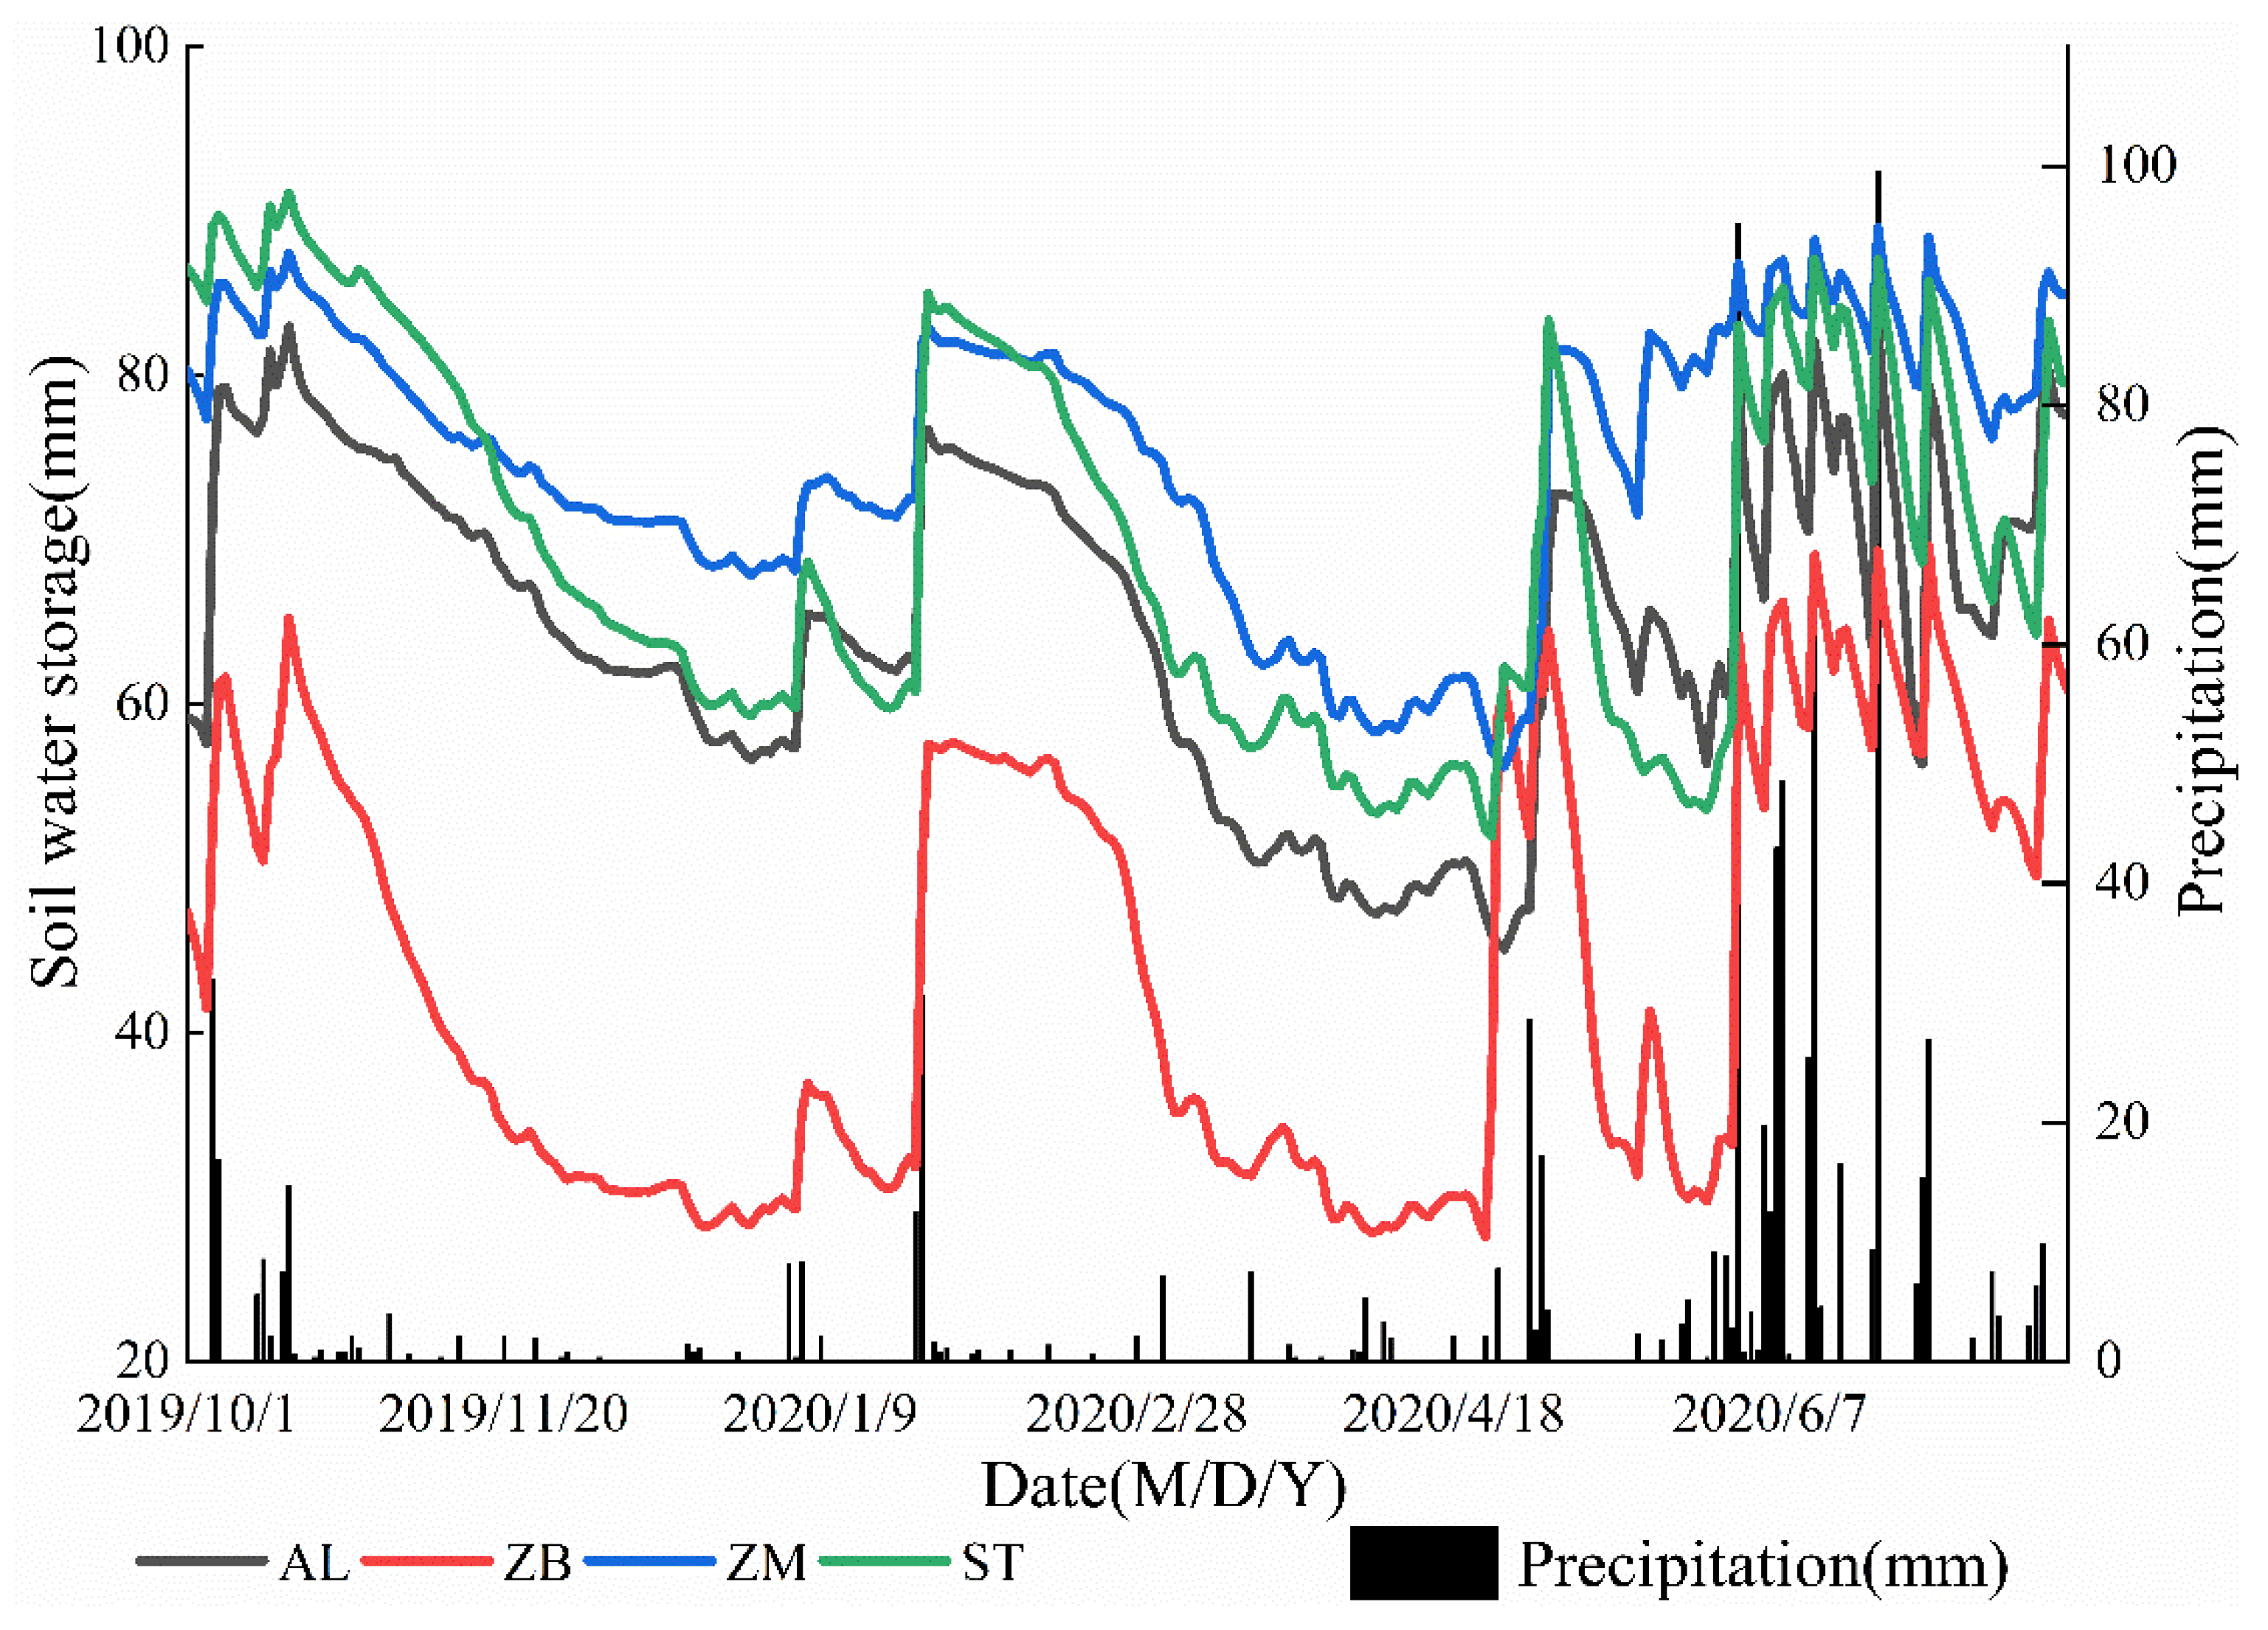
3.4. Dynamic Changes in Soil Moisture Storage
Figure 7 shows the dynamic change in soil moisture storage of each vegetation type. The variation trend of soil water storage of vegetation with rainfall was consistent with the trend of θ. The average soil moisture storage capacity was ZM (75.25 mm) > ST (70.09 mm) > AL (65.18 mm) > ZB (43.85 mm). There were three periods of the seasonal variation in soil water storage. There was an obvious consumption period (CP) from the middle of October 2019 to early January 2020 (CP1) and from February 2020 to April 2020 (CP2), in which soil water storage decreased greatly. Compared with that of the early dry season, the water storage of all vegetation types at the end of the dry season increased by: ZM 10.56%, ST 14.98%, AL 15.96%, and ZB 1.22%, indicating that the ZB moisture storage was relatively stable during the whole consumption period. There was an obvious water supply period (SP), during which the soil moisture storage gradually increased. The first stage of SP was in January 2020 (SP1) and the second stage was in May 2020 (SP2). After SP2, the supply of ZM and AL increased by more than 12%, while the water storage capacity of ZB remained basically unchanged, the increase in ST was 3.0%, and its soil was still in a state of water consumption. After the soil completely entered the rainy season (from June to July), the soil moisture storage fluctuated, although it was a relatively stable period (RSP). During RSP, the soil moisture storage of ZB increased by 32.30%, followed by that of ST by 19.23%, indicating that ZB and ST were more responsive than ZM and AL to rainfall replenishment. In different hydrological years, the specific dates of these three periods were different.
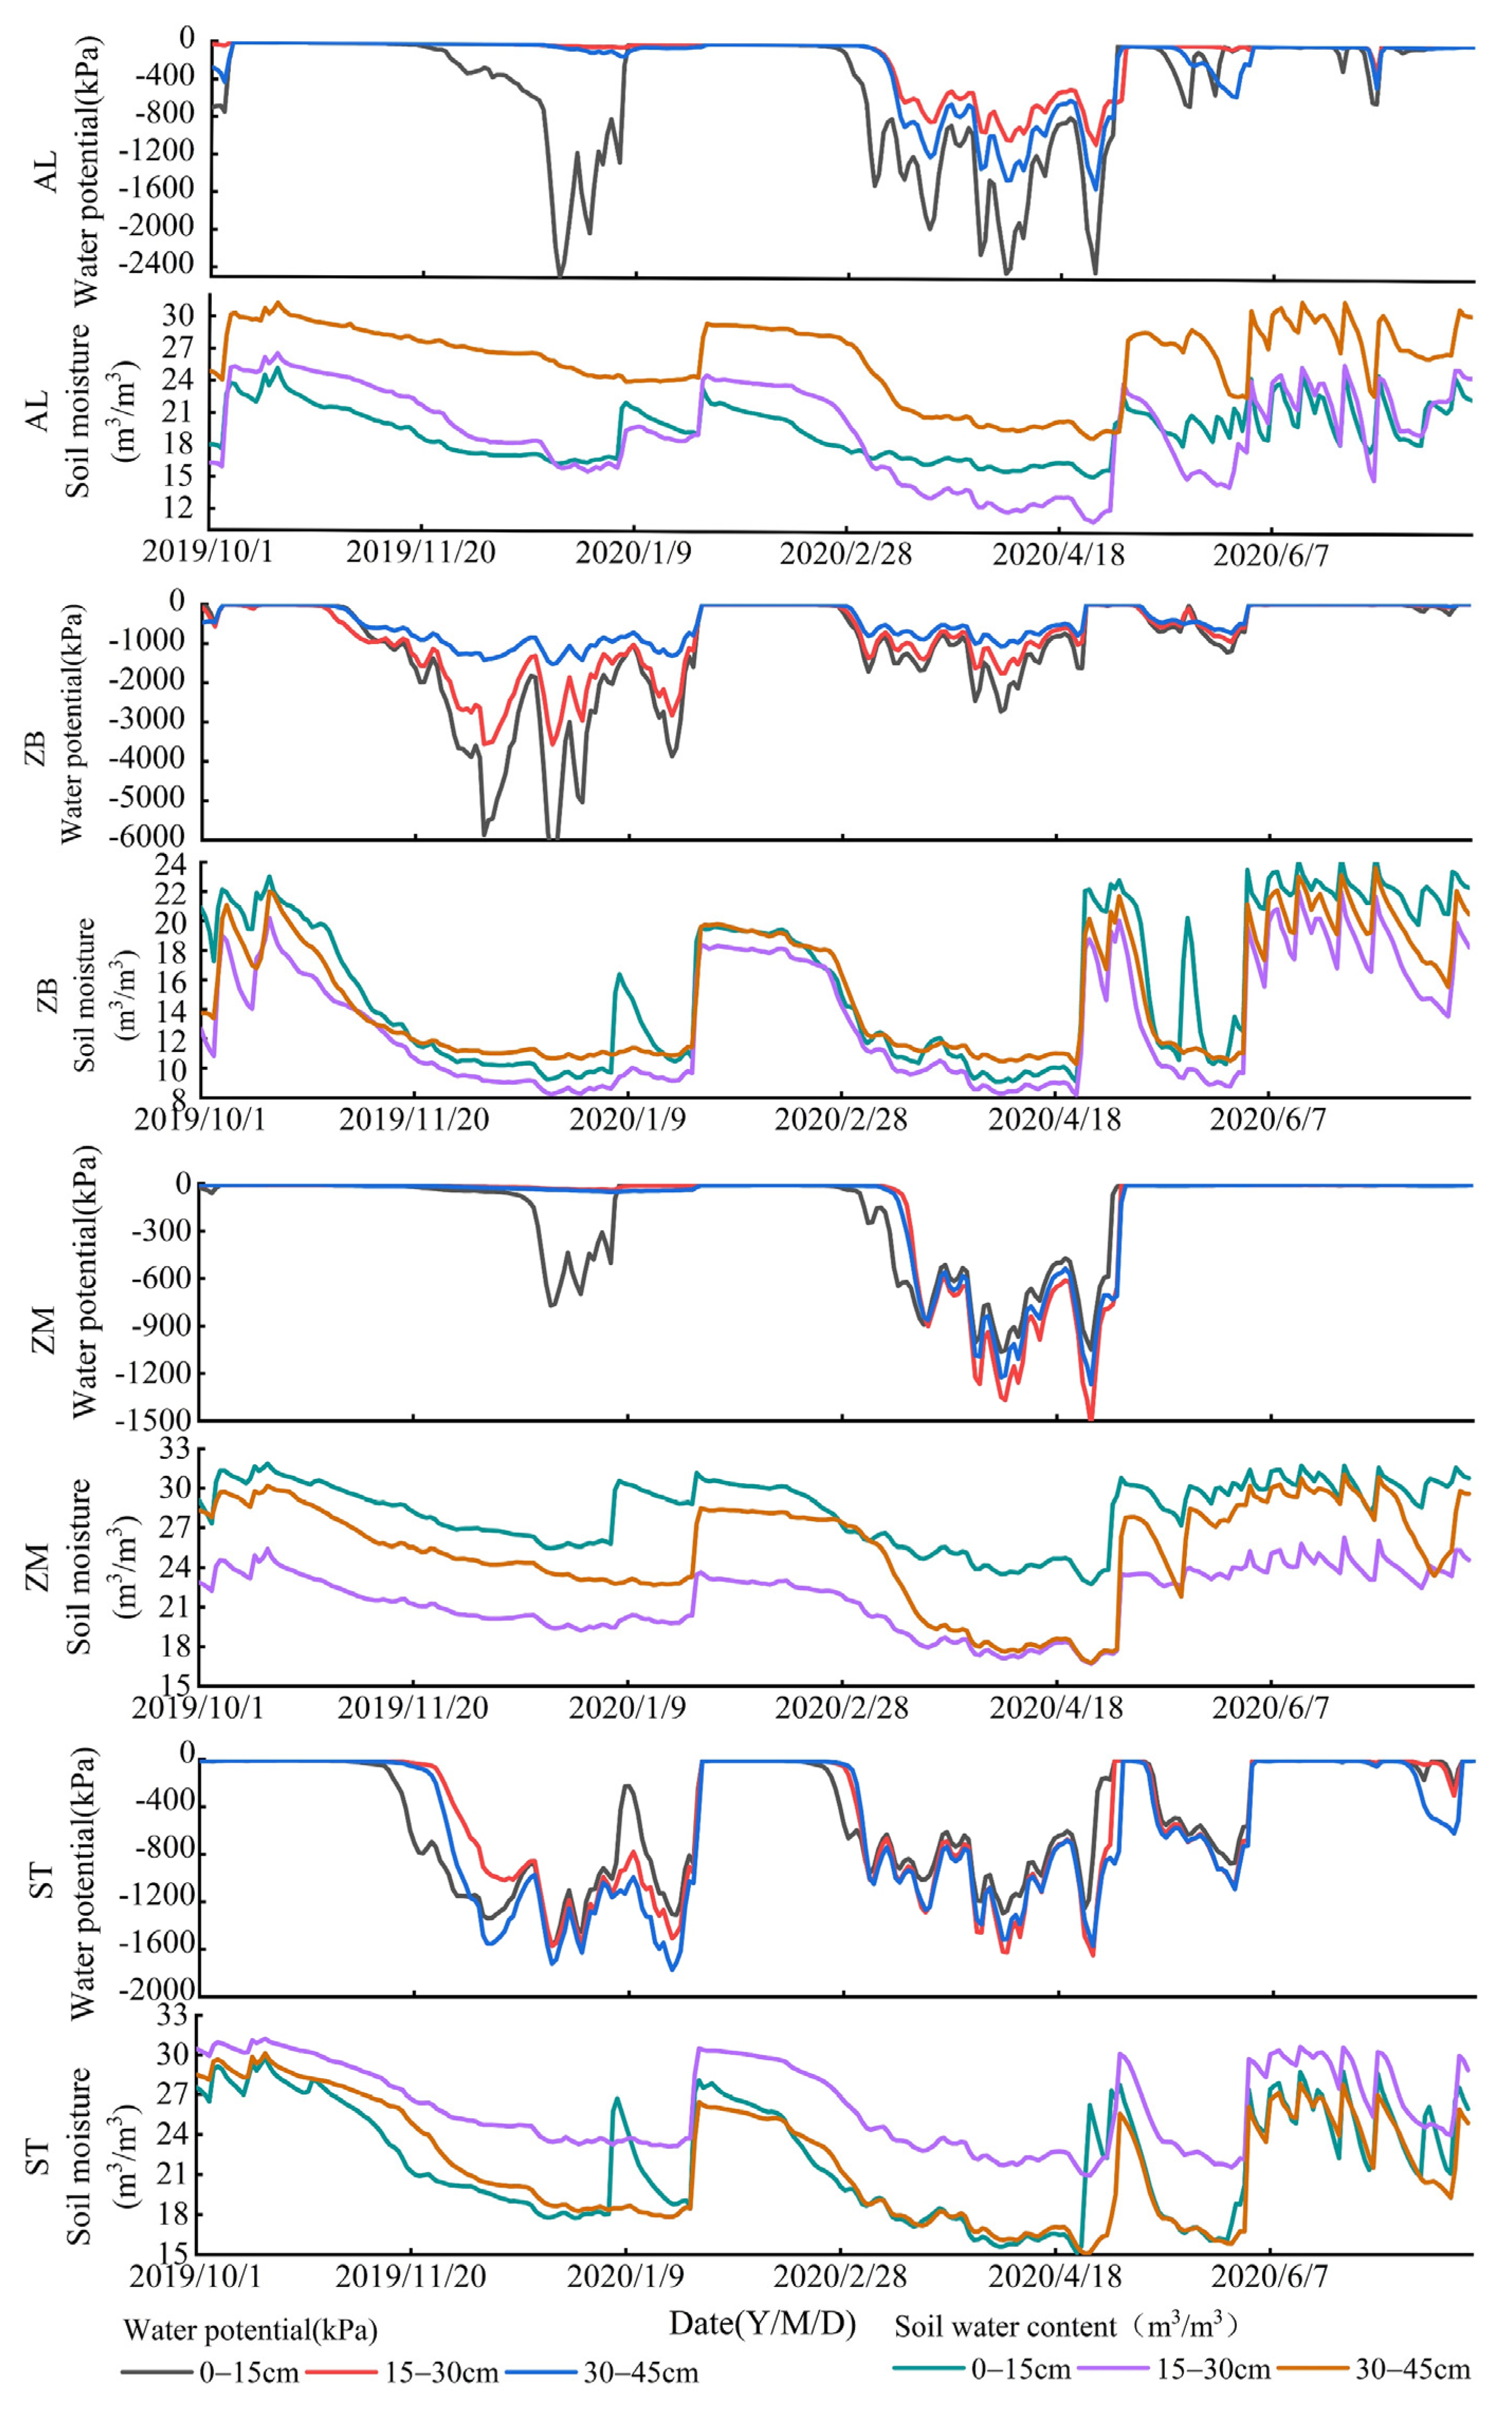
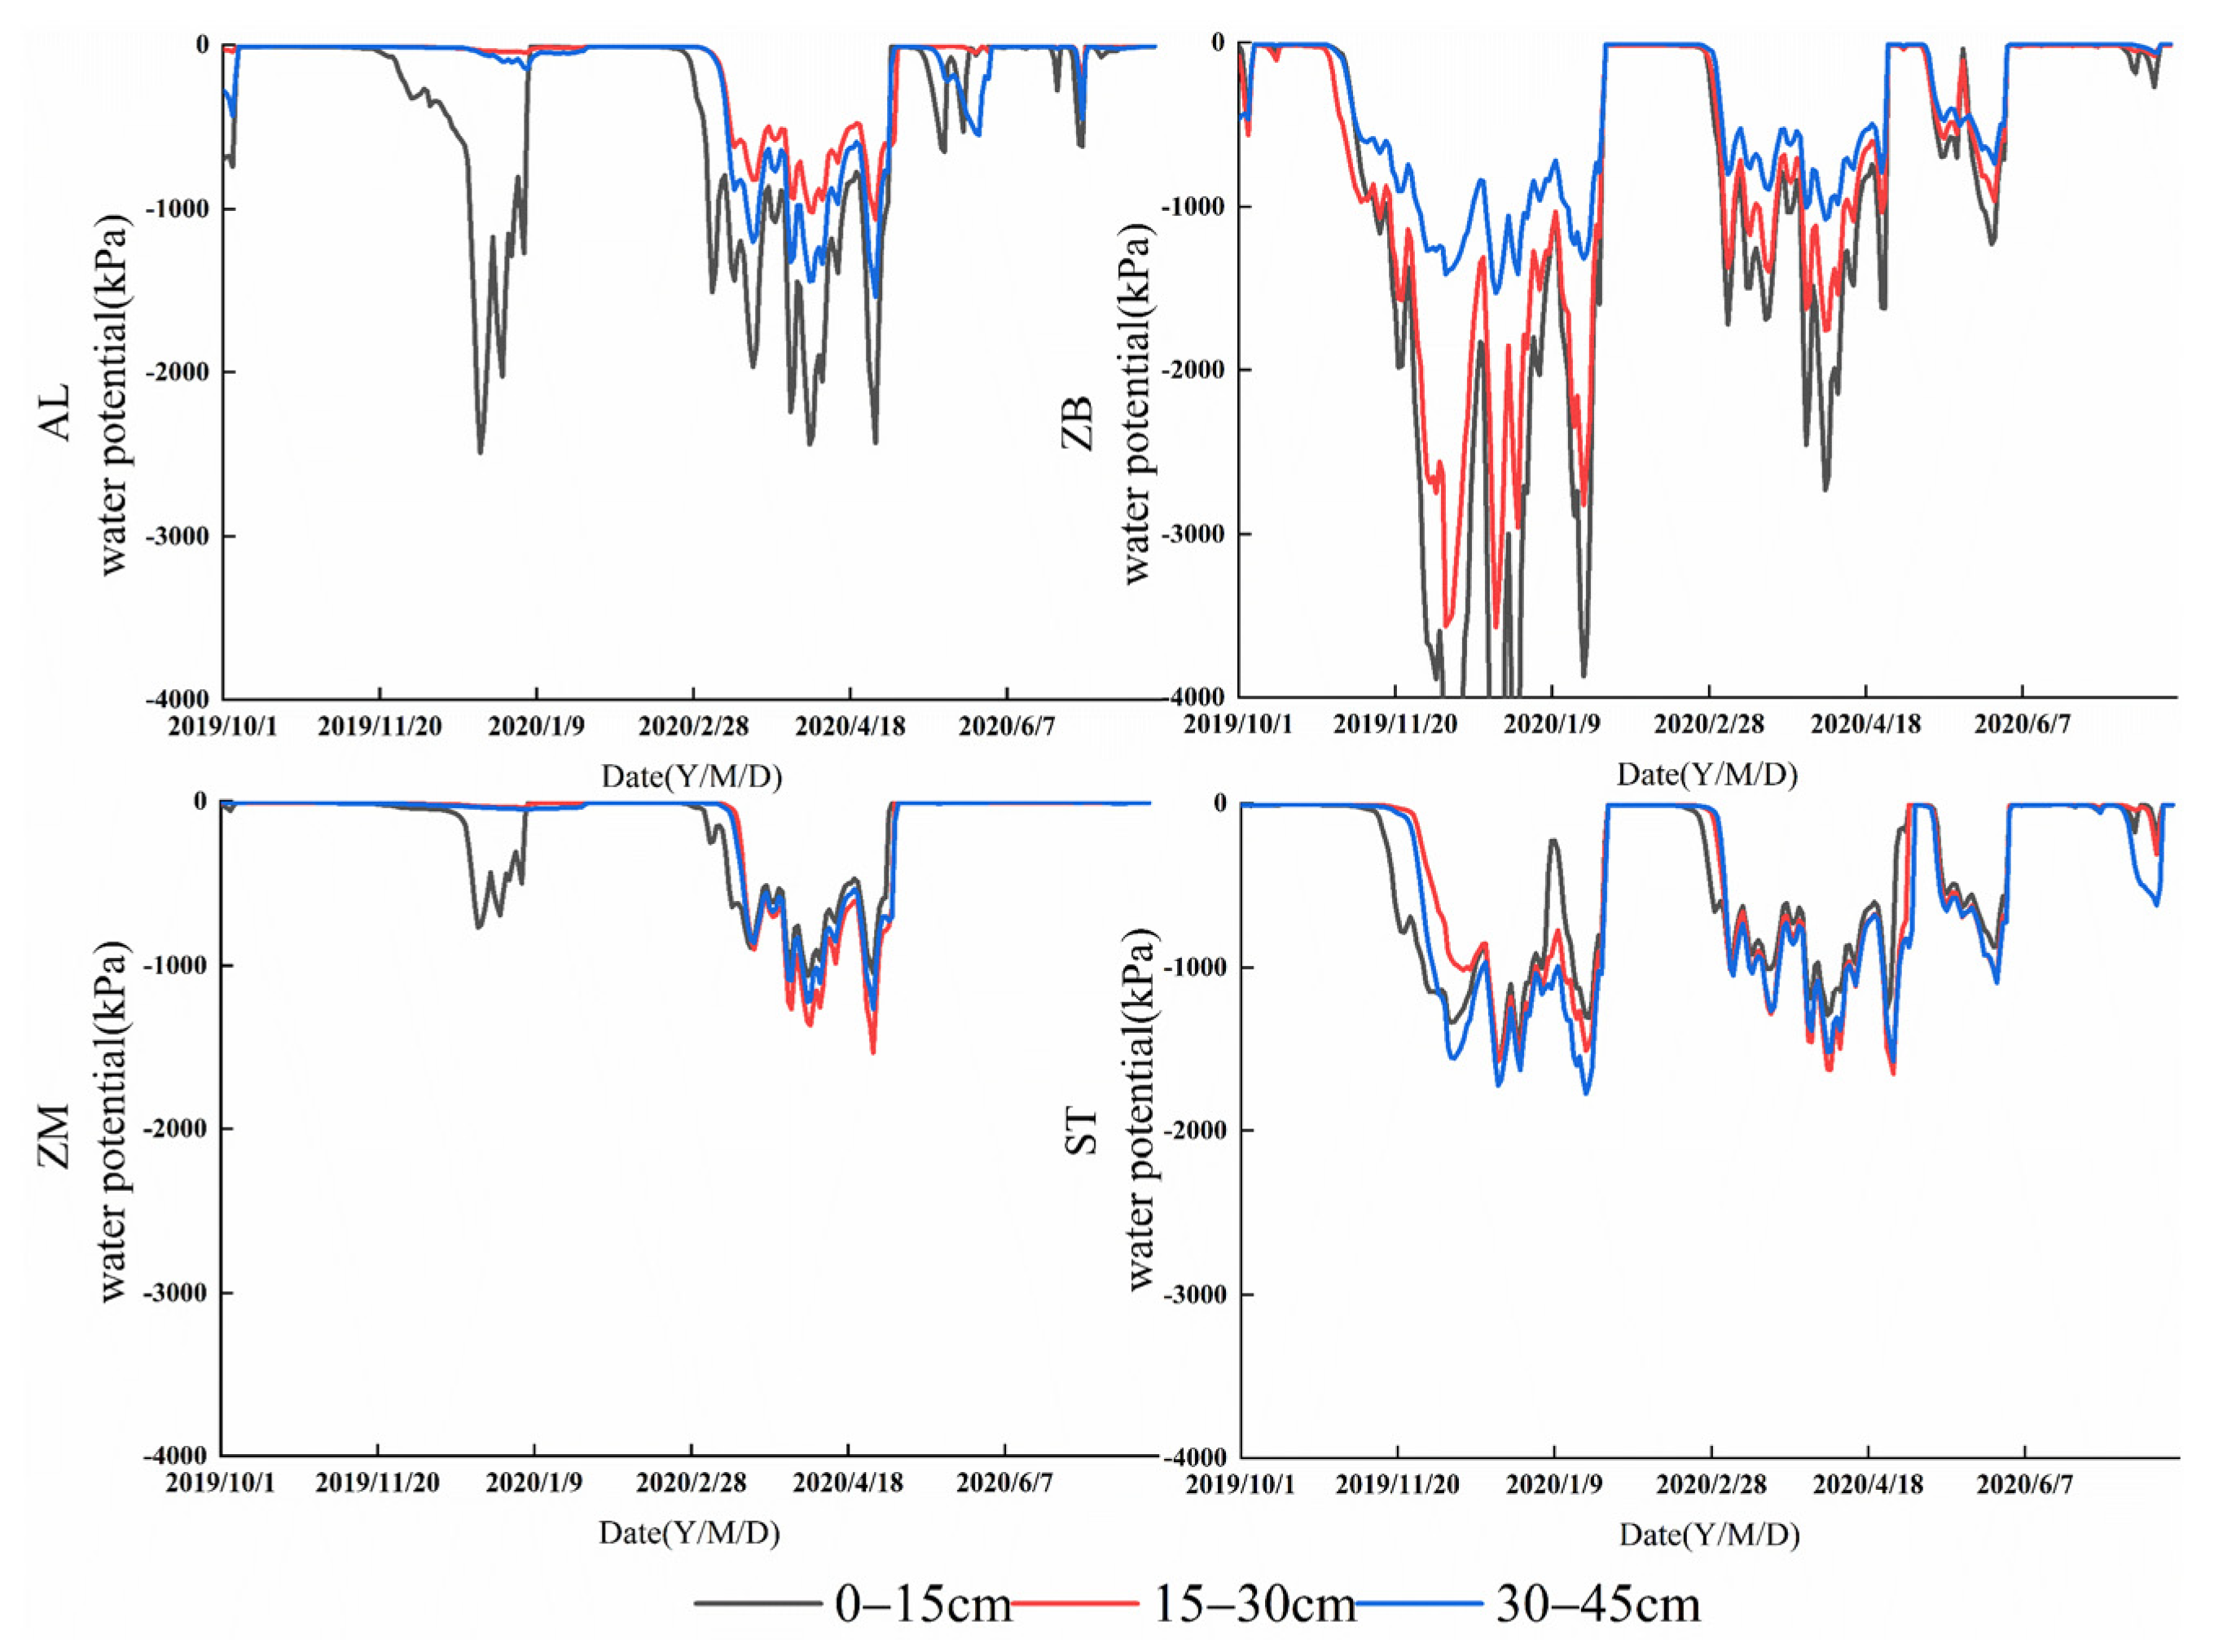
3.5. Dynamic Change of
The dynamic changes in in different vegetation types were shown in Figure 8, and its seasonal changes were significant. The profiles of ZB and ST experienced three long-lasting water stresses (CP, SP2). The 15–45 cm layer of both AL and ZM had one long-lasting moisture stress restriction during CP2, and the 0–15 cm had two long-lasting moisture stress restrictions during CP. Entering CP1, the of the soil layer in ZM gradually decreased, the change at 0–15 cm was the largest, while that at 15–45 cm showed a trend of (30–45 cm) < (15–30 cm), and the magnitude was relatively low. Entering CP2, the change range of was −1369.0 kPa~−142.7 kPa lower than that during CP1, indicating that the moisture demand of ZM increased in CP2. The variation trend of the AL was consistent with that in ZM, but the variation range of the in AL was larger than that in ZM, indicating that the amount of moisture available for plant growth and absorption was lower. ZB may have experienced 3 long-lasting moisture stress restrictions and 3 phase change trends that were the same: (30–45 cm) > (15–30 cm) > (0–15 cm). In CP1, the range of (0–15 cm) was −6514.5 kPa~−1084.3 kPa, the range of (15–30 cm) was −3569.0 kPa~−986.7 kPa, and the range of (30–45 cm) was −1526.3 kPa~−589.5 kPa. In CP2, the of these layers increased by 53.2%, 48.8% and 34.4%, respectively. The third moisture shortage period (10 May 2020 to 1 May 2020) lasted for a short time, and was the highest in each dry period. During the three stages of relative moisture shortage, the profile of ZB fluctuated greatly, but that of θ remained in a relatively stable state with a fluctuation range of 8–12%. Only in the third stage did θ (0–15 cm) show a short and significant increase. The change trend of in ST was similar to that of ZB and could be divided into 3 main water shortage stages. The in ST was second only to that in ZM. In the first drought stage, was expressed as (30–45 cm) > (15–30 cm), and the (0–15 cm) fluctuation was large. In the absence of rainfall, the value of (0–15 cm) was somewhere in between those in the other two layers. After rainfall recharged the soil, the surface increased rapidly and was higher than that in the 15–45 cm layer for a period of time. However, in the two subsequent drought stages, the surface was relatively high, and the change trends of the 15–30 cm and 30–45 cm soil layers were consistent and close. In the first two drought stages, the changes in the ST soil layers were not significant. Compared with the first drought stage, the of each layer increased by 13.5%, −17.9% and 5.4% in the second drought stage, respectively. In the dry period of ST, the (15–30 cm) and (30–45 cm) were similar, but with the 15–30 cm soil moisture generally higher than that in the 0–15 cm and 30–45 cm layers.
3.6. Temporal Variation in Moisture Potential Gradient
The dynamic changes in the soil moisture potential gradient of each vegetation type are shown in Figure 9. The large fluctuations in the moisture potential gradient of the four vegetation types were mainly caused by the water consumption period. The surface water potential gradient of AL was mostly positive, and the variation range was −39.9~153.4 cm/cm. The deep soil moisture potential gradient was relatively stable and fluctuated greatly only in CP2, the soil moisture mainly moved upward. The change in the soil moisture potential gradient of ZM in CP1 was similar to that in AL. After entering CP1, the soil moisture potential gradient range of the ZM surface was −42.5~39.88 cm/cm, and the depth was only −9.6~17.5 cm/cm. In this period, the surface soil moisture moved upward, and the deep soil moisture moved downward. The ZB soil moisture mainly moved downward, and the gradient trends of the surface and deep moisture potentials were basically the same, with the gradient value changing by approximately 12.1%. During CP1, the surface and depth of profile soil moisture in ST moved in opposite directions. The gradient of downward infiltration in the surface layer ranged from −11.8~50.1 cm/cm, while that in the deep layer ranged from −40.1~−0.31 cm/cm. During CP2, affected by a small amount of precipitation recharge in the early stage, both surface and deep moisture exhibited temporary downward recharge, and then the deep soil moisture moved upward, while the surface moisture moved downward. In this stage, the moisture potential gradients of the surface and deep moisture were −55.9~36.0 cm/cm and −50.9~10.1 cm/cm, respectively. AL, ZM, and ST all showed a decreasing trend with increasing depth. Due to the phenomenon of serious rocky desertification and the intense evaporation in the shallow soil layer, the soil layer was mainly a zone with alternating infiltration and evaporation based on the change characteristics of the soil moisture potential gradient of the different vegetation types in this area [27].
4. Discussion
4.1. Variations in θ for the Four Vegetation Types
Soil hydrological processes are significantly affected by rainfall, vegetation types, transpiration, and rock exposure [1]. The results showed (Figure 4) that there were significant spatial and temporal differences in θ of different vegetation types. The θ of the surface was ZM > ST > AL > ZB, indicating that the ZB surface had relatively poor moisture-holding capacity and good permeability, and θ could be replenished quickly in the deep layer with a short lag time and a high recharge rate. However, the permeability of the ZM surface layer was relatively low, and the overall lag time in the process of precipitation replenishment was relatively long (Figure 6). Cai [28] studied the saturated moisture conductivity of ZB, ZM, and AL, and showed that the maximum moisture permeability coefficient of the ZB surface soil could fully infiltrate, effectively preventing the loss of surface soil and moisture.
In the barrel planting experiment, the distribution of vegetation roots, litter and soil evaporation were important factors leading to the differences in θ. Existing studies have shown that the change in θ is caused by the joint action of precipitation, vegetation types, vegetation transpiration, and soil evaporation [2,29]. Fu [30] researched the difference in θ in different land types in karst areas, and the results showed that the litter layers played important regulating roles in soil moisture retention and moisture-holding capacity. In the karst area of Southwest China, the soil layer is thin, the rock exposure rate is high, and the content of gravel in the soil is high. Plant roots are mostly distributed in shallow soil, and the development of lateral roots and adventitious roots promotes the lateral movement of soil moisture [31]. In this study, all the vegetation was shallow-rooted plants. AL had herbaceous species. Roots were evenly distributed in the 0–20 cm soil layer, and soil moisture maintained a relatively stable infiltration process. Due to the high permeability of the surface soil led to the low θ and low soil moisture storage of the AL soil. In the growth process of ZB and ST, artificial tillage was not needed, and the change in soil physical and chemical properties was mainly controlled by the vegetation growth process. ZB roots were mainly distributed at 0–35 cm, with a relatively small number of taproot roots and a developed lateral root system. The horizontal root distribution was far greater than the vertical root distribution, and the absorption root distribution was denser, which was conducive to absorbing moisture [32]. The soil texture of ZB was loose, and in the process of ZB growth, spiny litter was atop the soil surface. As the cycle of shallow soil porosity increased, the replenishment effect of the ZB deep soil profile was remarkable. The evaporation of soil was stronger, and θ had a rapid variation made the ZB moisture-holding ability poor. The coverage of soil overburden vegetation of ST was second only that to the AL, and its root system was mainly distributed at 15–30 cm. This layer had the most moisture in the ST soil profile, and it was usually replenished by infiltration of the topsoil and absorption of deeper moisture. In CP2, θ of ST decreased. Under the action of water potential gradient, the surface soil water moved upward, and the deep soil water moved downward, and the water supply in the main root distribution area was low (Figure 9). Its soil spatial variability was low and its water holding capacity was relatively high, second only to ZM.
However, under drought conditions, θ was reduced, soil evaporation was strengthened, surface θ was lost through transpiration, and it was difficult to replenish roots in deep layers (Figure 9). The permeability of ST was lower than that of ZB, and the moisture holding capacity was higher. Affected by its growth cycle, the dynamic change in moisture storage was relatively complex (Figure 7 and Figure 9). The average total moisture storage was second only to that of ZM, which had a low surface soil porosity and a dense soil layer. The soil profile was mainly composed of 0–30 cm moisture with a large migration range. The deep θ was relatively stable, and the was higher than that of the other crops. Therefore, the soil moisture storage in this study was closely related to the surface permeability. In conclusion, soil water storage was closely related to the change of CV value. The lower the soil CV value, the higher the soil water storage. In this study, ZB has the highest average CV and the lowest soil water storage, while ZM has the lowest average CV and the highest soil water storage. The total soil water storage presented the law of ZM > ST > AL > ZB.
4.2. Rainfall Response of Soil Moisture
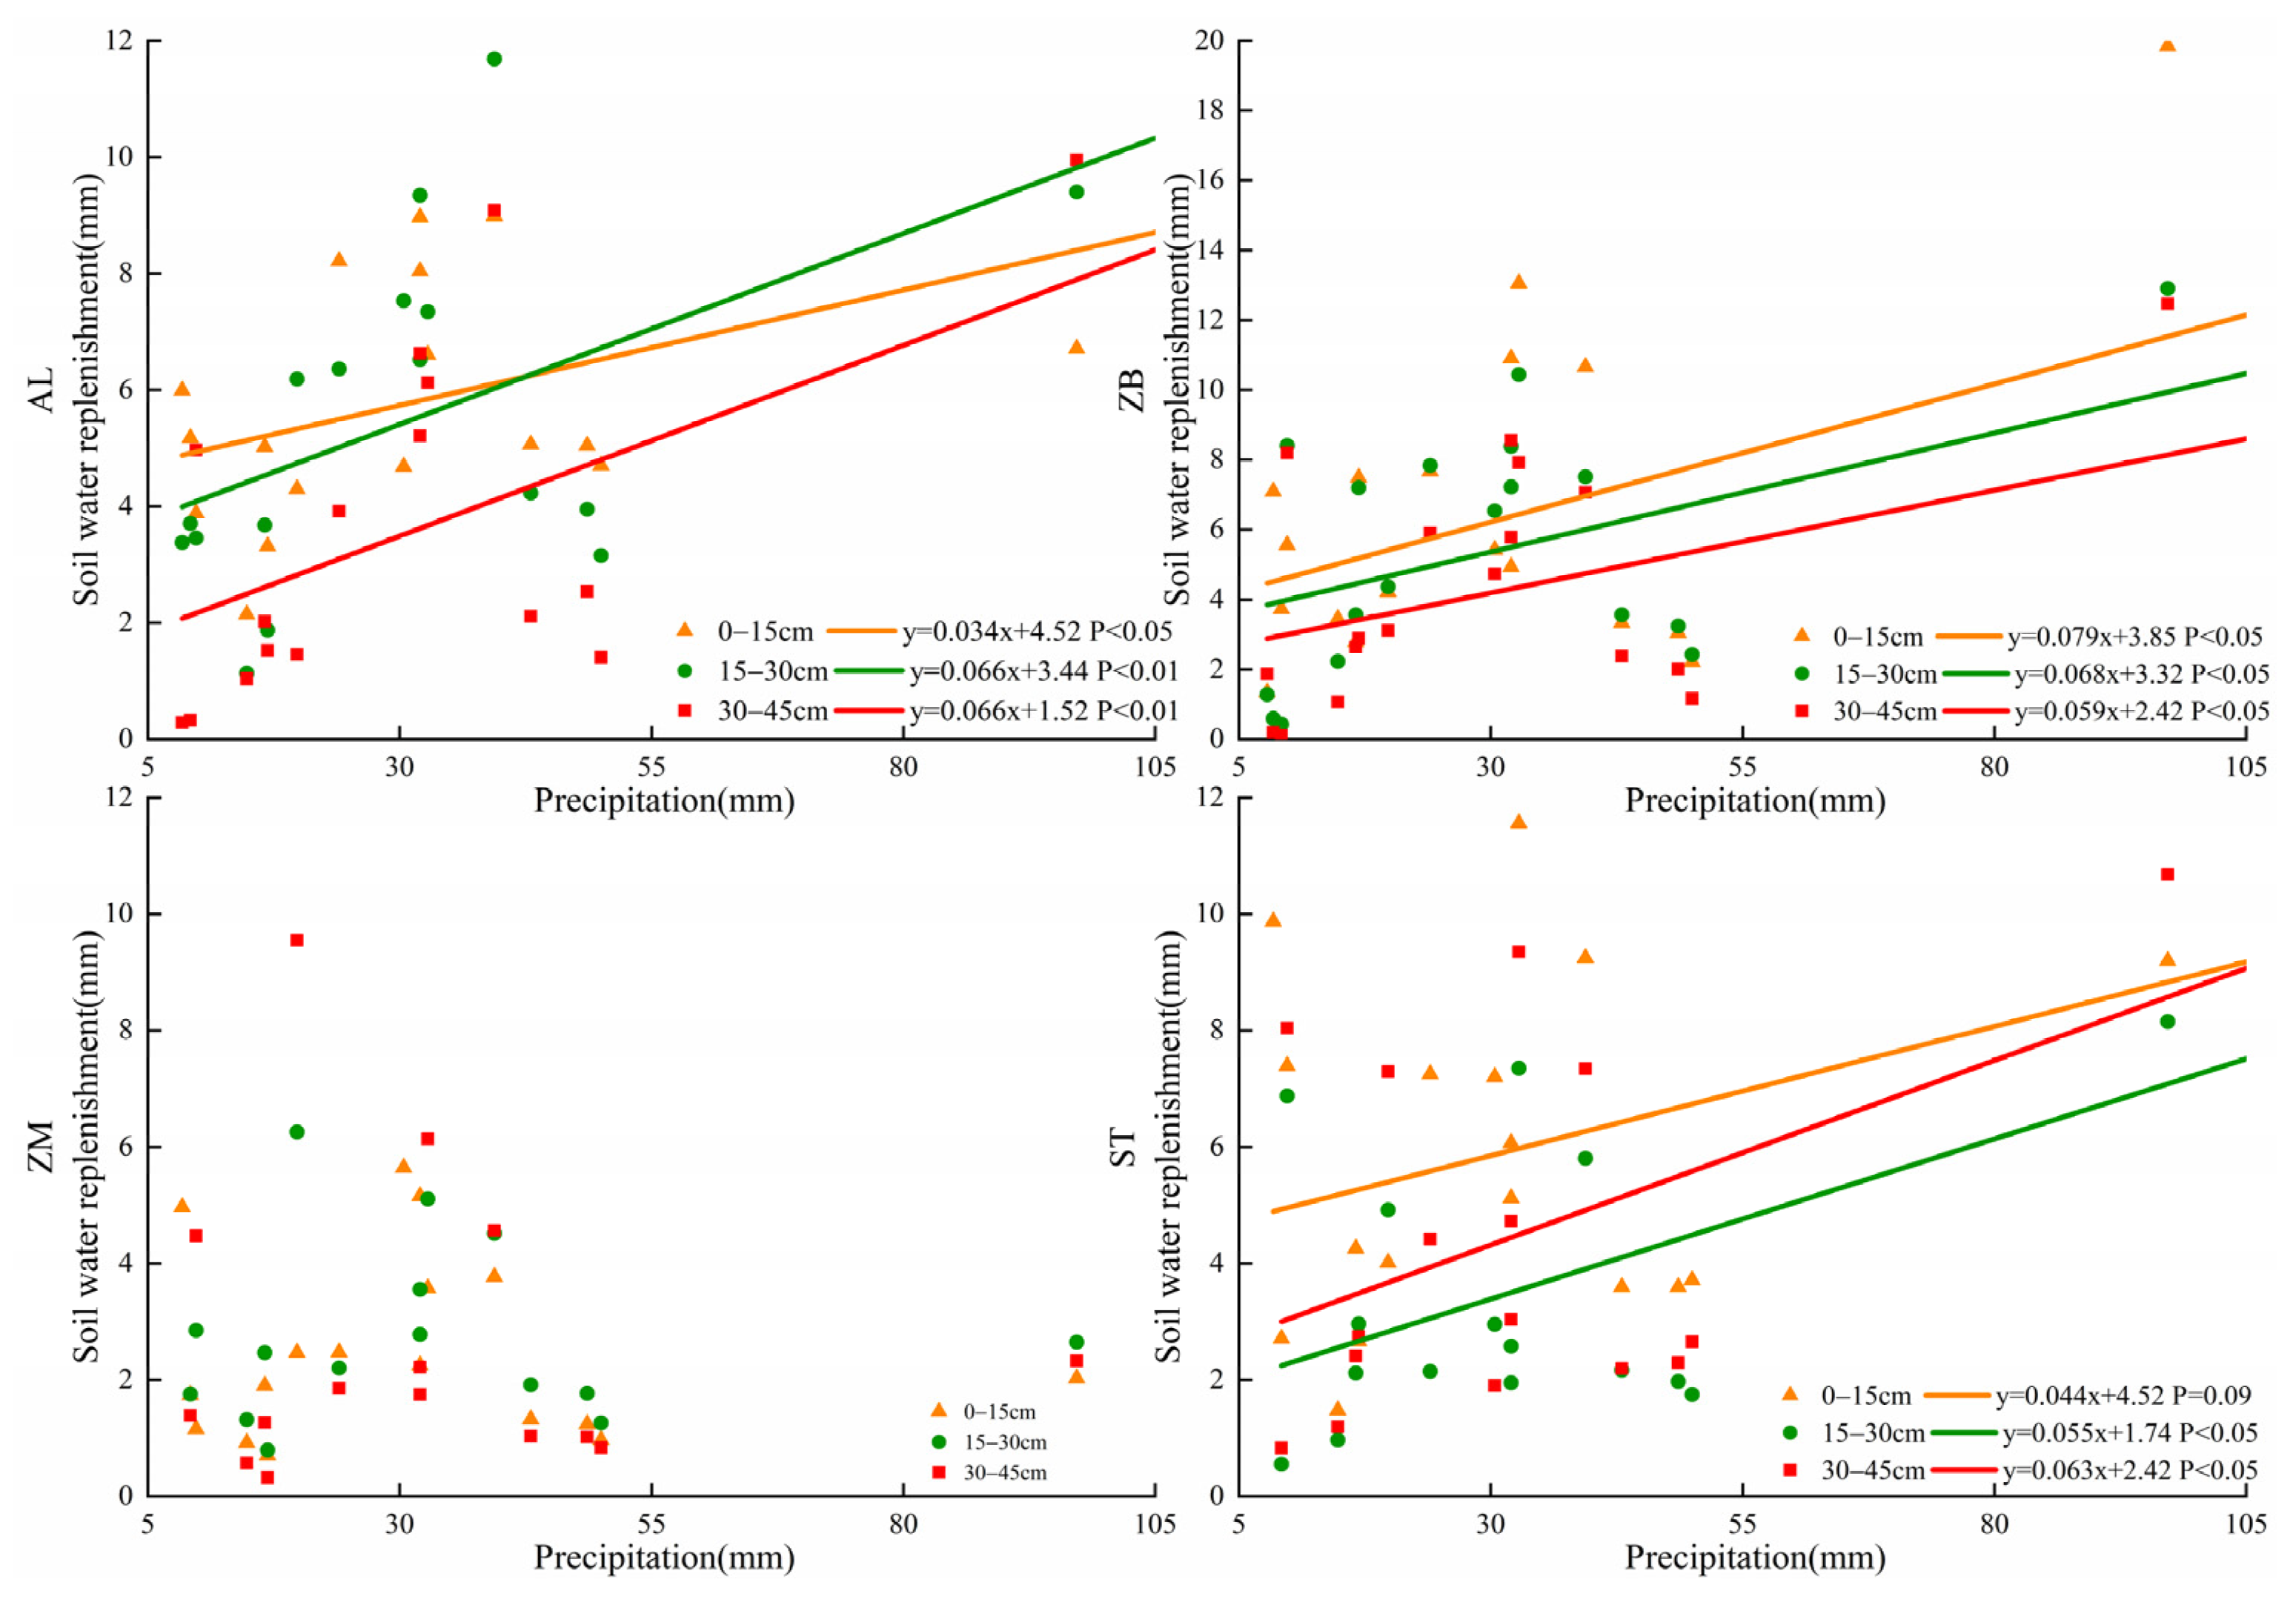
The response of θ of various vegetation types to precipitation is a complex process that is affected by factors such as the scale of rainfall events, rainfall intensity, previous drought interval, and soil texture. Additionally, vegetation types play an important role in the process of rainfall redistribution and evapotranspiration [33,34,35]. Precipitation is one of the important agricultural water replenishment sources in karst areas. As shown in Figure 10, the effective rainfall recharge of the AL, ZB, and ST soil profiles at different depths was positively correlated with rainfall, indicating that rainfall had a direct impact on the soil water replenishment of these three types of vegetation. The replenishment rate of AL was the highest, mainly due to the relatively strong surface permeability of AL and the even distribution of vegetation roots in the shallow layer, which was conducive to sufficient precipitation infiltration. The amount of soil replenishment was affected by the rainfall process, soil evaporation and plant transpiration. The surface layer was highly permeable, which accelerated the infiltration of precipitation and at the same time promoted the evaporation of the soil, accelerated the loss of θ, and reduced the water retention performance of the soil. Therefore, the combination of soil properties and overlying vegetation led AL to be significantly affected by rainfall and to exhibit a weaker water storage capacity. With increasing depth, the effective replenishment amount of ZB decreased gradually, and the root absorption was strong. The effective replenishment of rainfall was the largest, and the recharge efficiency was the highest, but the duration of rainfall was short. The effective amount of replenishment in ST was 0–15 cm > 30–45 cm > 15–30 cm, which was consistent with the characteristics of the distribution area of the main ST root water consumption in ST. The effective replenishment of each layer in ZM did not show a good linear relationship with rainfall, which might have been due to the relatively weak permeability of ZM. In the process of rainfall, ZM exhibited a strong hysteresis and was not sensitive to rainfall response. Compared with the other three vegetation types, the rainfall replenishment efficiency of ZM was the lowest.
He [36] studied the response of θ to rainfall under different land-use patterns, and the results showed that rainfall intensity and drought duration affected the dynamic change in θ, and the increase in θ within 20–40 cm was in direct proportion to the rainfall intensity. In the present study, there was no significant correlation between the amount of θ in each layer of the four vegetation types and the rainfall intensity. In the rainy season, under the conditions of medium rainfall, short duration, heavy rainfall, short duration, and heavy rain, the effective replenishment of each vegetation type had a low increase because the rainy season in this area provided relatively abundant rainfall resources and the θ was relatively high. In a state of relative surplus, and under the conditions of heavy rainfall, the soil infiltration capacity will slow, and the amount of replenishment will be reduced. Research by Peng [17], showed that heavy rainfall with high rainfall intensity formed a large amount of surface runoff and caused soil loss, so the effective replenishment of θ was limited. The longer the drought lasted, the more obvious the response of soil moisture to rainfall; additionally, more rainfall increased the depth of soil moisture replenishment. For example, in the 6 January 2020 rainfall event, the rainfall amount was only 8.4 mm. Under the influence of the long-duration non-small rainfall event in the earlier stage, the surface soil of all vegetation responded faster, and the effective replenishment was greater than that during the rainy season heavy rainfall event (Table 3). In the rainy season, soil evaporation and plant transpiration increase the loss of soil water, and high-frequency and small rainfall events do not promote an increase in soil water storage [37]. In small rainfall events (6 January 2020 and 31 May 2020) with similar rainfall, the increase in soil moisture storage in the dry season was 20–30% higher than that in the rainy season.
Research on the influencing factors of θ temporal stability has mainly focused on land-use type, soil properties, topography and other factors [38,39]. However, for karst areas with high heterogeneity, θ movement is more complex, so it is still difficult to identify the important influencing factors. The results showed that the seasonal variation in rainfall was an important factor affecting the fluctuation of θ, but there was little difference in the variation in θ among soil layer between the rainy season and dry season.
4.3. Soil Water Stress of Different Vegetation Types
The existing research has described remarkable vegetation restoration efforts in a series of ecological restoration projects, which resulted in a drying trend of the regional soil moisture content in the humid karst areas [40]. Monitoring θ and in different vegetation types allowed the availability of θ in different vegetation types to be examined in this study. is a useful predictive tool in agricultural irrigation scheduling is associated with physiological responses to water deficit [41]. The soil effective water content was between the field water holding capacity and the permanent wilting coefficient, both of which are affected by the soil texture, structure and vegetation type [14]. Usually, in the study of , −1500 kPa is regarded as the wilting point of θ; however, some plants begin to protect themselves from permanent damage before this point. This point is not the wilting point of all plants and is affected by plant growth characteristics. Therefore, the soil profile water stress of the four vegetation types had obvious differences.
ZB had strong drought tolerance, had the lowest permanent wilting point, and mainly faced water stress at 0–30 cm. As shown in Figure 8, water stress mainly occurred in the dry season, when the precipitation resources were insufficient, and the water absorbed by the ZB root system mainly came from the water stored in the soil pores. In the early dry season, the growth of ZB was relatively slow, and it did not germinate and blossom, so there was no need for artificial intervention for irrigation. Because of the high temperatures in the Karst Plateau canyon region, crops took root and sprouted earlier than crops in other regions. The temperature began to rise in February, and ZB gradually entered the germination stage. Due to the gradual strengthening of soil evaporation and low soil water storage in this stage, ZB mainly faced water stress, which was not conducive to later growth. Therefore, appropriate irrigation was needed in this stage (Figure 7 and Figure 11). AL and ZM were mainly exposed to high risk of shallow water stress, the ZM was mainly in the early planting period from March to April, and plant growth was easily restricted. Which might have been due to the combined effect of strong near-surface soil transpiration and plant absorption. However, because of the low surface permeability of ZM, the water holding capacity was relatively strong, the water condition was good, and the possibility of water stress was low. ZM seeds should be planted in March and April, which will artificially disturb the soil. Due to insufficient precipitation and enhanced transpiration, the soil water required for plant growth was limited, and irrigation was needed. The 15–30 cm layer of ST mainly faced water stress. This layer was the main water absorption layer of ST roots, and when water stress occurred, the growth of ST was affected. The θ of ST was relatively high, and the change in the water potential gradient was relatively stable. Under normal circumstances, the water shortage of ST will lead to the obstruction of water absorption by plants, but the permanent withering state is not typically reached. Since ST is a perennial crop, it requires a large amount of water, so it needs to be irrigated during the dry season and at the beginning of the rainy season.
The results showed that the four vegetation types were more prone to water stress at the end of the dry season, mainly due to the lack of precipitation and soil transpiration when the temperature increased and the increase in water consumption as the plants gradually entered the growing period. Boeck [42] also showed that when drought and high temperature were combined, the plants experienced significant stress. Apart from the dry season, the changes in soil water potential were relatively stable for all vegetation types, and the soil water content was at a comfortable state for the plants. Zhang [43] showed that in the rainy season, heavy rainfall could lead to a relatively uniform wet condition of soil moisture across the whole depression area by enough soil infiltration and overflow. In conclusion, there were two significant processes of decreased θ, presenting three stages of changes, which could be divided into the consumption period, the water replenishment period and the relatively stable period. The consumption period was mainly in the dry season, when the soil moisture was prone to water stress, and it needed to be artificially recharged. In the dry season, there was less rainfall replenishment in January and May, which significantly increased θ, and this stage was the water replenishment period. When the rainy season came, precipitation resources were abundant, and θ fluctuated within a relatively stable range.
5. Conclusions
The profiles θ of AL, ZB, ZM, and ST were monitored in barrel planting experiments, and the dynamic changes in the soil hydrology of each vegetation type were analyzed. The results showed that the soil moisture dynamics were affected by vegetation types and soil physical and chemical properties. Different vegetation types had significant differences in soil water storage. The stronger the surface soil permeability was, the lower the soil water storage was. Additionally, the water storage had obvious dry-wet season changes with time. The θ of each vegetation type showed different change trends with increasing soil depth. The profiles of AL, ZM, and ST were classified as composed of a sub-active layer, while that of ZB was comprised the rapidly changing layer and the active layer. Precipitation was an important source of water replenishment for vegetation growth. ZB, as a typical drought-tolerant crop, had a clearer response to rainfall, with the highest effective replenishment amount and replenishment rate. According to the analysis of the time series of soil moisture, there were two significant soil moisture decreasing processes during monitoring phase, presenting three stages of changes, which could be divided into the consumption period (November to April), the water supplying period (January and May), and the relatively stable period (June to October). The consumption period was mainly in the dry season, when soil moisture was prone to water stress, and needed to be artificially recharged. In the dry season, there was less rainfall supply in January and May, which significantly increased the soil moisture, and this stage was the water supply period. When the rainy season came, precipitation resources were abundant, and the soil moisture fluctuated greatly but was still with a relatively stable stage. At the end of the consumption period, soil water consumption increased significantly, and water shortages were more serious. In actual agricultural production, attention should be given to artificial replenishment.
Author Contributions
R.S. writing—original draft preparation, software and formal analysis; Z.L. conceptualization, methodology, and data curation; K.X. methodology, writing—review and editing, funding acquisition; Y.L. validation, investigation, and supervision; L.C. investigation, validation, and resources. All authors have read and agreed to the published version of the manuscript.
Funding
This research was funded by the Key Project of Science and Technology Program of Guizhou Province (No. 5411 2017 Qiankehe Pingtai Rencai), the project of National Key Research and Development Program of China (No. 2016YFC0502607) and the World Top Discipline Program of Guizhou Province (No. 125 2019 Qianjiao Keyan Fa).
Institutional Review Board Statement
Not applicable.
Informed Consent Statement
Not applicable.
Data Availability Statement
The data presented in this study are available on request from the corresponding author.
Acknowledgments
We appreciate the anonymous reviewers for their invaluable comments and suggestions on this manuscript.
Conflicts of Interest
The authors declare no conflict of interest.
References
- Yang, J.; Chen, H.; Nie, Y.; Wang, K. Dynamic variations in profile soil water on karst hillslopes in Southwest China. Catena 2019, 172, 655–663. [Google Scholar] [CrossRef]
- Chen, H.; Zhang, W.; Wang, K.; Fu, W. Soil moisture dynamics under different land uses on karst hillslope in northwest Guangxi, China. Environ. Earth Sci. 2010, 61, 1105–1111. [Google Scholar] [CrossRef]
- Yang, L.; Chen, L.D.; Wei, W.; Yu, Y.; Zhang, H.D. Comparison of deep soil moisture in two re-vegetation watersheds in semi-arid regions. J. Hydrol. 2014, 513, 314–321. [Google Scholar] [CrossRef]
- Jia, Y.-H.; Shao, M.-A. Temporal stability of soil water storage under four types of revegetation on the northern Loess Plateau of China. Agric. Water Manag. 2013, 117, 33–42. [Google Scholar] [CrossRef]
- Chen, H.S.; Hu, K.; Nie, Y.P.; Wang, K.L. Analysis of soil water movement inside a footslope and a depression in a karst catchment, Southwest China. Sci. Rep. 2017, 7, 2544. [Google Scholar] [CrossRef] [PubMed] [Green Version]
- Canton, Y.; Rodríguez-Caballero, E.; Contreras, S.; Villagarcia, L.; Li, X.-Y.; Solé-Benet, A.; Domingo, F. Vertical and lateral soil moisture patterns on a Mediterranean karst hillslope. J. Hydrol. Hydromech. 2016, 64, 209–217. [Google Scholar] [CrossRef] [Green Version]
- Daly, E.; Porporato, A. A Review of Soil Moisture Dynamics: From Rainfall Infiltration to Ecosystem Response. Environ. Eng. Sci. 2005, 22, 9–24. [Google Scholar] [CrossRef]
- Heathman, G.C.; Cosh, M.H.; Merwade, V.; Han, E. Multi-scale temporal stability analysis of surface and subsurface soil moisture within the Upper Cedar Creek Watershed, Indiana. Catena 2012, 95, 91–103. [Google Scholar] [CrossRef]
- Huang, X.; Shi, Z.H.; Zhu, H.D.; Zhang, H.Y.; Ai, L.; Yin, W. Soil moisture dynamics within soil profiles and associated en-vironmental controls. Catena 2016, 136, 189–196. [Google Scholar] [CrossRef]
- Yang, L.; Wei, W.; Chen, L.; Jia, F.; Mo, B. Spatial variations of shallow and deep soil moisture in the semi-arid Loess Plateau, China. Hydrol. Earth Syst. Sci. 2012, 16, 3199–3217. [Google Scholar] [CrossRef] [Green Version]
- Das, N.N.; Mohanty, B.P.; Njoku, E.G. Profile Soil Moisture across Spatial Scales under Different Hydroclimatic Condi-tions. Soil Sci. 2010, 175, 315–319. [Google Scholar] [CrossRef] [Green Version]
- Brocca, L.; Morbidelli, R.; Melone, F.; Moramarco, T. Soil moisture spatial variability in experimental areas of central Italy. J. Hydrol. 2007, 333, 356–373. [Google Scholar] [CrossRef]
- Williams, P.W. The role of the epikarst in karst and cave hydrogeology: A review. Int. J. Speleol. 2008, 37, 1–10. [Google Scholar] [CrossRef] [Green Version]
- Tokumoto, I.; Heilman, J.L.; Schwinning, S.; McInnes, K.J.; Litvak, M.E.; Morgan, C.L.S.; Kamps, R.H. Small-scale variability in water storage and plant available water in shallow, rocky soils. Plant Soil 2014, 385, 193–204. [Google Scholar] [CrossRef]
- Nie, Y.-P.; Chen, H.-S.; Wang, K.-L.; Tan, W.; Deng, P.-Y.; Yang, J. Seasonal water use patterns of woody species growing on the continuous dolostone outcrops and nearby thin soils in subtropical China. Plant Soil 2011, 341, 399–412. [Google Scholar] [CrossRef]
- Bonacci, O.; Pipan, T.; Culver, D.C. A framework for karst ecohydrology. Environ. Earth Sci. 2008, 56, 891–900. [Google Scholar] [CrossRef]
- Peng, T.; Wang, S.-J. Effects of land use, land cover and rainfall regimes on the surface runoff and soil loss on karst slopes in southwest China. Catena 2012, 90, 53–62. [Google Scholar] [CrossRef]
- Xiong, K.N.; LI, J.; Long, M.Z. Features of Soil and Water Loss and Key Issues in Demonstration Areas for Combating Karst Rocky Desertification. Acta Geogr. Sin. 2012, 67, 878–888. [Google Scholar]
- Yuan, D.X. World correlation of karst ecosystem: Objectives and implementation plan. Adv. Earth Sci. 2001, 4, 461–466. [Google Scholar]
- Chen, H.S.; Nie, Y.P.; Wang, K.L. Spatio-temporal heterogeneity of water and plant adaptation mechanisms in karst regions: A review. Acta Ecol. Sin. 2013, 33, 317–326. [Google Scholar] [CrossRef] [Green Version]
- Peng, J.; Yang, M.D. On the Present Soil Erosion Situation of Huajiang Karst Gorge in Guizhou Province. J. Mt. Sci. 2001, 6, 511–515. [Google Scholar]
- Xiong, K.N.; Chi, Y.K. The Problems in Southern China Karst Ecosystem in Southern of China and Its Countermeasures. Ecol. Econ. 2015, 31, 23–30. [Google Scholar]
- Fu, T.G.; Chen, H.S.; Zhang, W.; Nie, Y.P.; Peng, T.; Wang, K.L. Spatial variability of surface soil saturated hydraulic con-ductivity in a small karst catchment of southwest China. Environ. Earth Sci. 2015, 74, 2381–2391. [Google Scholar] [CrossRef]
- Yang, L.; Zhang, H.; Chen, L. Identification on threshold and efficiency of rainfall replenishment to soil water in semi-arid loess hilly areas. Sci. China Earth Sci. 2018, 61, 292–301. [Google Scholar] [CrossRef]
- Jing, B.D.; Jin, G.H.; Min, L.L.; Shen, Y.J. Deep soil moisture dynamic of typical irrigation farmland in piedmont of Taihang mountain. Trans. Chin. Soc. Agric. Eng. 2015, 31, 128–134. [Google Scholar]
- Zhang, C.; Chen, H.S.; Nie, Y.P.; Zhang, W.; Feng, T.; Wang, K.L. Dynamics of soil profile water content in peak-cluster de-pression areas in karst region. Chin. J. Eco-Agric. 2013, 21, 1225–1232. [Google Scholar] [CrossRef]
- Lei, Z.D.; Yang, S.X.; Ni, G.H. Water continuum feature in response to the type of groundwater level. J. Hydraul. Eng. 1992, 2, 1–6. [Google Scholar]
- Cai, L.L.; Liu, Z.Q.; LI, Y.; Yu, X.; Jing, J.S. Effect of Different Land Use Types on Soil Saturated Hydraulic Conductivity in Karst Areas. Res. Soil Water Conserv. 2020, 27, 119–125. [Google Scholar]
- Wang, X.Y.; Chen, H.S.; Wang, K.L.; Xie, X.L. Spatio-Temporal Dynamic Change of Soil Water in Sloping Land with Differ-ent Use Modes in Red Soil Region. J. Soil Water Conserv. 2006, 2, 110–113. [Google Scholar]
- Fu, W.; Chen, H.S.; Wang, K.L. Variability in soil moisture under five land use types in Karst hillslope territory. Chin. J. Eco-Agric. 2007, 15, 59–62. [Google Scholar]
- Nie, Y.-P.; Chen, H.-S.; Wang, K.-L.; Ding, Y.-L. Rooting characteristics of two widely distributed woody plant species growing in different karst habitats of southwest China. Plant Ecol. 2014, 215, 1099–1109. [Google Scholar] [CrossRef]
- Rong, L.; Xiong, K.N. Drought-resistance characters of karst plant of adaptability in Huajiang karst gorge: Root system of Zanthoxylum planispinum var dintanensis and its soil environment. J. Guizhou Norm. Univ. 2007, 4, 1–7. [Google Scholar]
- Heisler-White, J.L.; Knapp, A.K.; Kelly, E.F. Increasing precipitation event size increases aboveground net primary produc-tivity in a semi-arid grassland. Oecologia 2008, 158, 129–140. [Google Scholar] [CrossRef] [PubMed]
- Kurc, S.A.; Small, E.E. Soil moisture variations and ecosystem-scale fluxes of water and carbon in semiarid grassland and shrubland. Water Resour. Res. 2007, 43. [Google Scholar] [CrossRef]
- Yaseef, N.R.; Yakir, D.; Rotenberg, E.; Schiller, G.; Cohen, S. Ecohydrology of a semi-arid forest: Partitioning among water balance components and its implications for predicted precipitation changes. Ecohydrology 2009, 3, 143–154. [Google Scholar] [CrossRef]
- He, Z.; Zhao, W.; Liu, H.; Chang, X. The response of soil moisture to rainfall event size in subalpine grassland and meadows in a semi-arid mountain range: A case study in northwestern China’s Qilian Mountains. J. Hydrol. 2012, 420-421, 183–190. [Google Scholar] [CrossRef]
- Wythers, K.R.; Lauenroth, W.K.; Paruelo, J.M. Bare-Soil Evaporation under Semiarid Field Conditions. Soil Sci. Soc. Am. J. 1999, 63, 1341–1349. [Google Scholar] [CrossRef]
- Yao, X.; Fu, B.; Lü, Y.; Chang, R.; Wang, S.; Wang, Y.; Su, C. The multi-scale spatial variance of soil moisture in the semi-arid Loess Plateau of China. J. Soils Sediments 2012, 12, 694–703. [Google Scholar] [CrossRef]
- Zhao, Y.; Peth, S.; Wang, X.Y.; Lin, H.; Horn, R. Controls of surface soil moisture spatial patterns and their temporal stability in a semi-arid steppe. Hydrol. Process. 2010, 24, 2507–2519. [Google Scholar] [CrossRef]
- Wei, X.C.; Zhou, Q.W.; Cai, M.Y.; Wang, Y.J. Effects of Vegetation Restoration on Regional Soil Moisture Content in the Hu-mid Karst Areas—A Case Study of Southwest China. Water 2021, 13, 321. [Google Scholar] [CrossRef]
- Spinelli, G.M.; Shackel, K.A.; Gilbert, M.E. A model exploring whether the coupled effects of plant water supply and demand affect the interpretation of water potentials and irrigation management. Agric. Water Manag. 2017, 192, 271–280. [Google Scholar] [CrossRef] [Green Version]
- De Boeck, H.J.; Bassin, S.; Verlinden, M.; Zeiter, M.; Hiltbrunner, E. Simulated heat waves affected alpine grassland only in combination with drought. New Phytol. 2016, 209, 531–541. [Google Scholar] [CrossRef]
- Zhang, J.; Chen, H.; Su, Y.; Shi, Y.; Zhang, W.; Kong, X. Spatial Variability of Surface Soil Moisture in a Depression Area of Karst Region. Clean Soil Air Water 2011, 39, 619–625. [Google Scholar] [CrossRef]
Figure 1.
Locations of study area and experiment site.
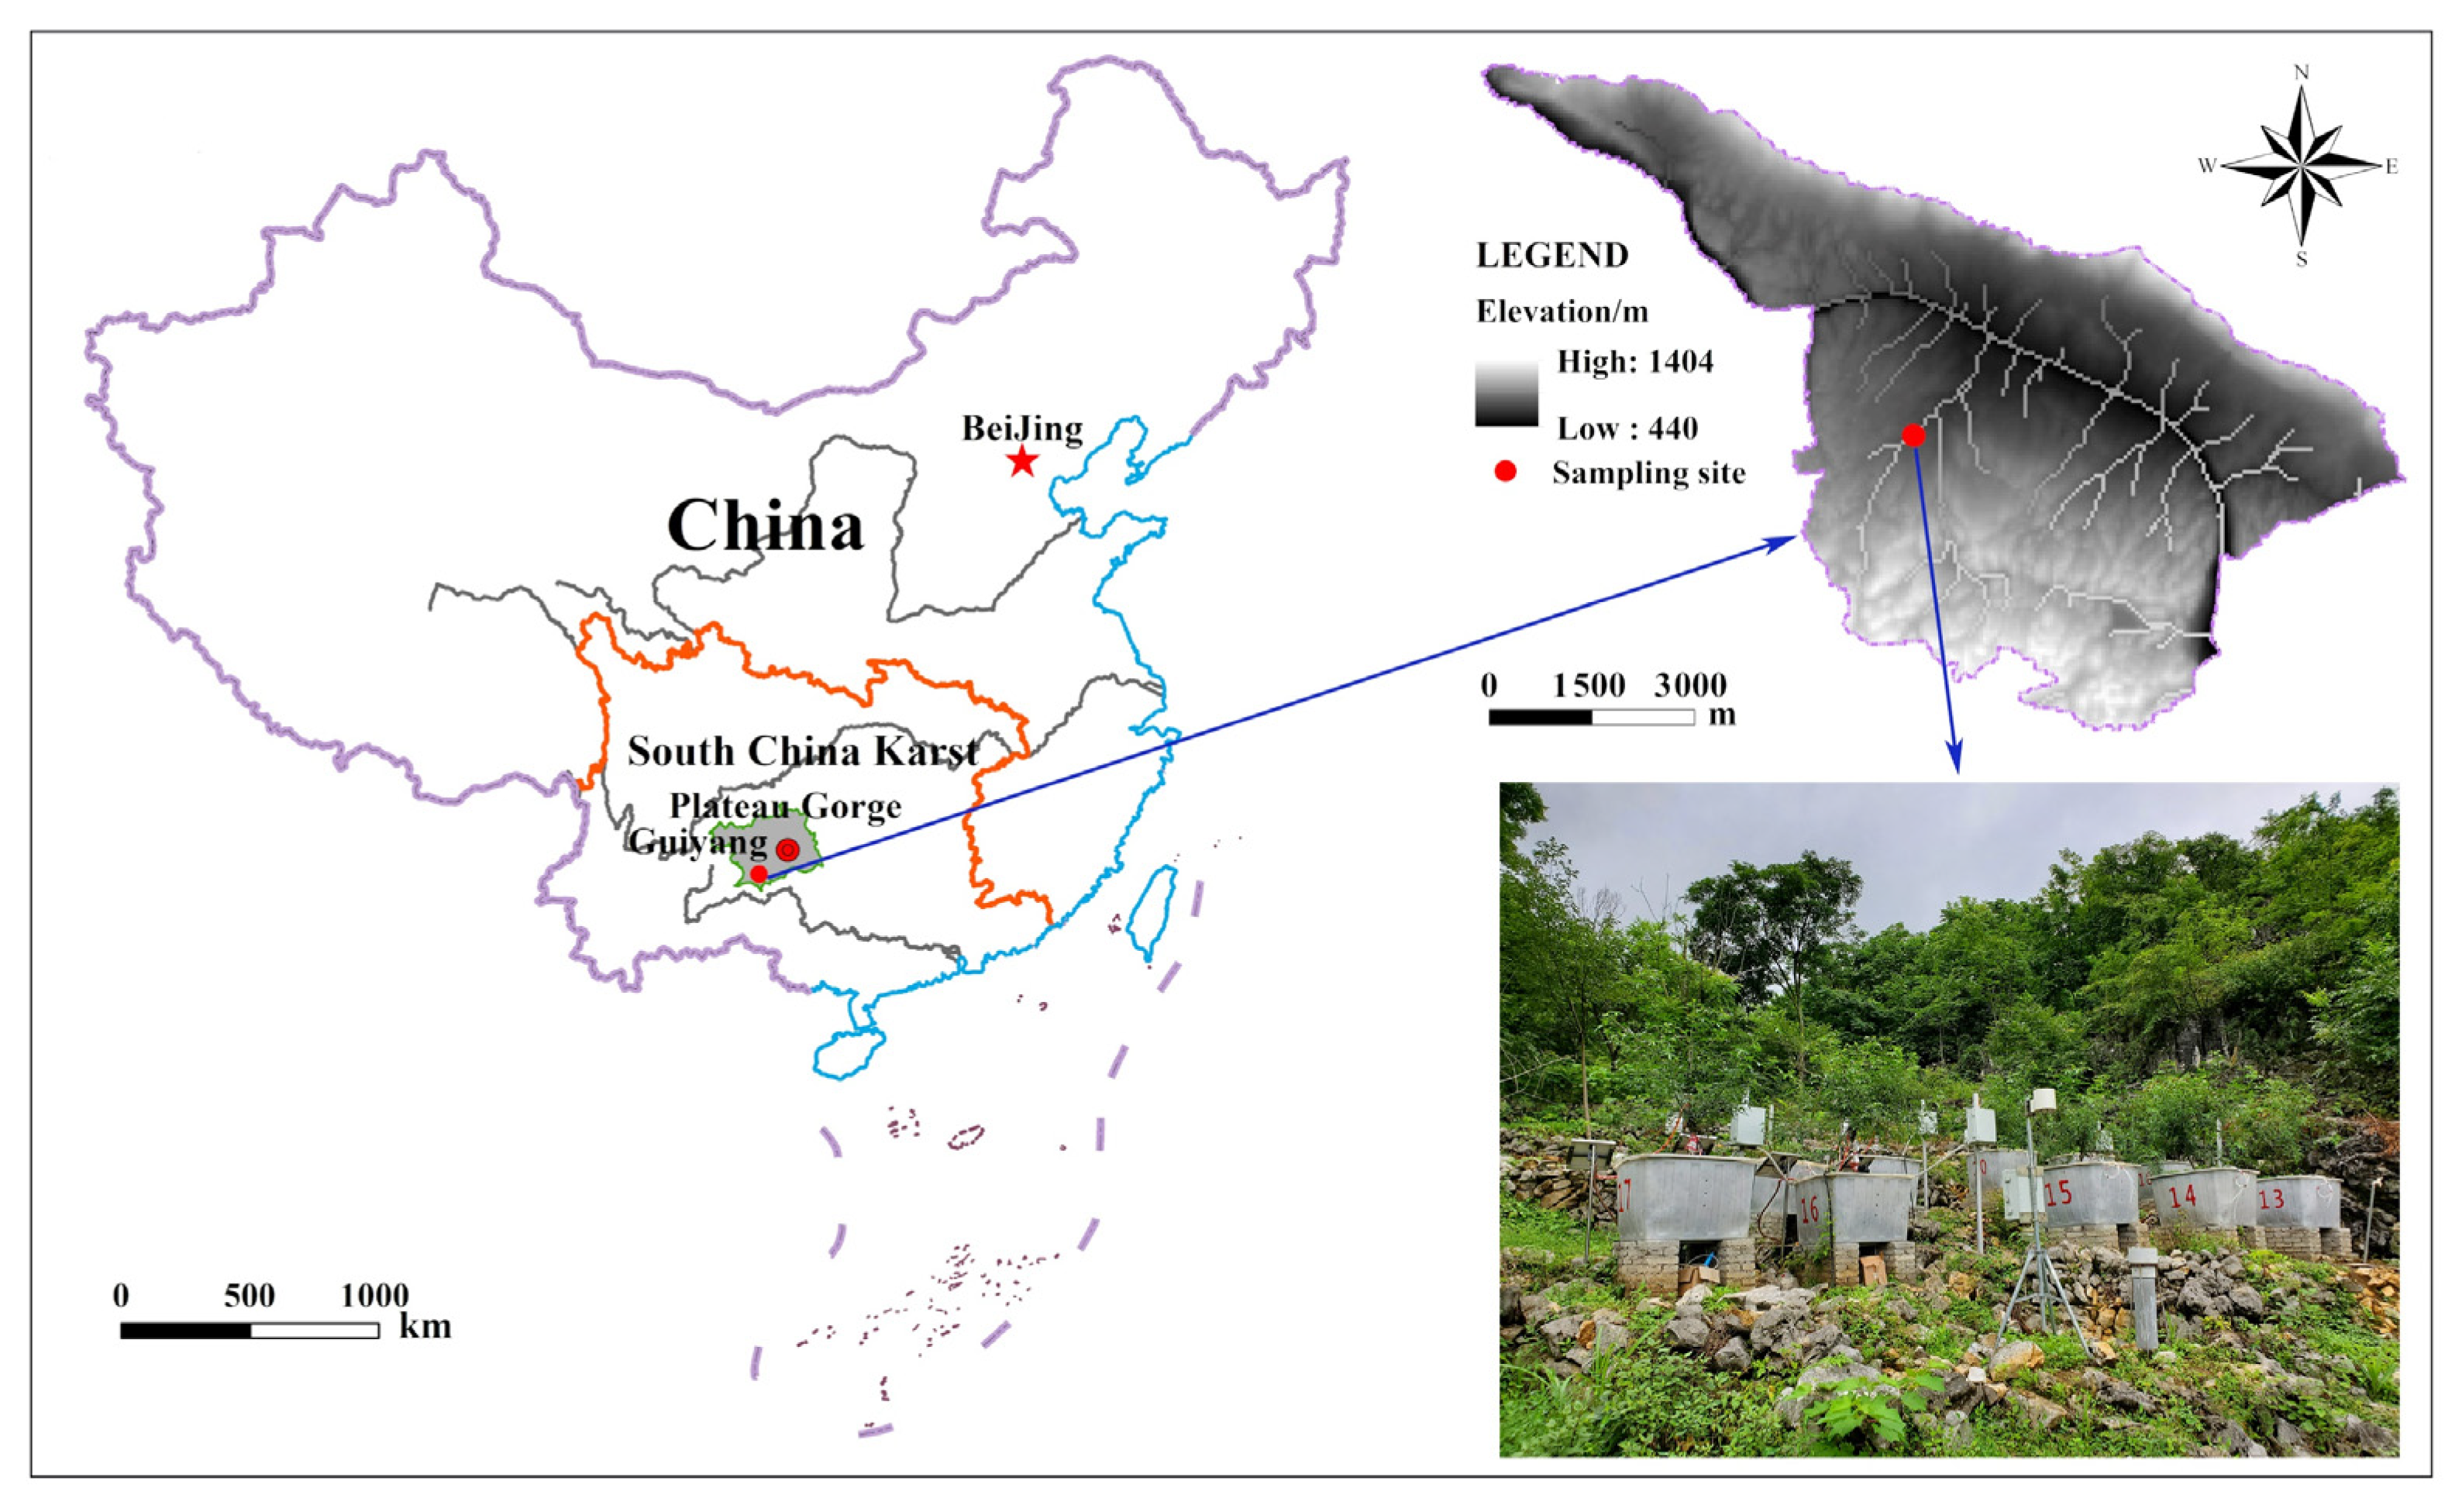
Figure 2.
Design process of barrel planting experiment. Place gravel at the bottom of the experiment barrel (a), the same texture of soil was used for filling (b), the natural growth state of each vegetation (c), and the placement of 5TE θ sensor and MPS6 sensor (d).
Figure 2.
Design process of barrel planting experiment. Place gravel at the bottom of the experiment barrel (a), the same texture of soil was used for filling (b), the natural growth state of each vegetation (c), and the placement of 5TE θ sensor and MPS6 sensor (d).

Figure 3.
Dynamic monthly changes in meteorological indicators.
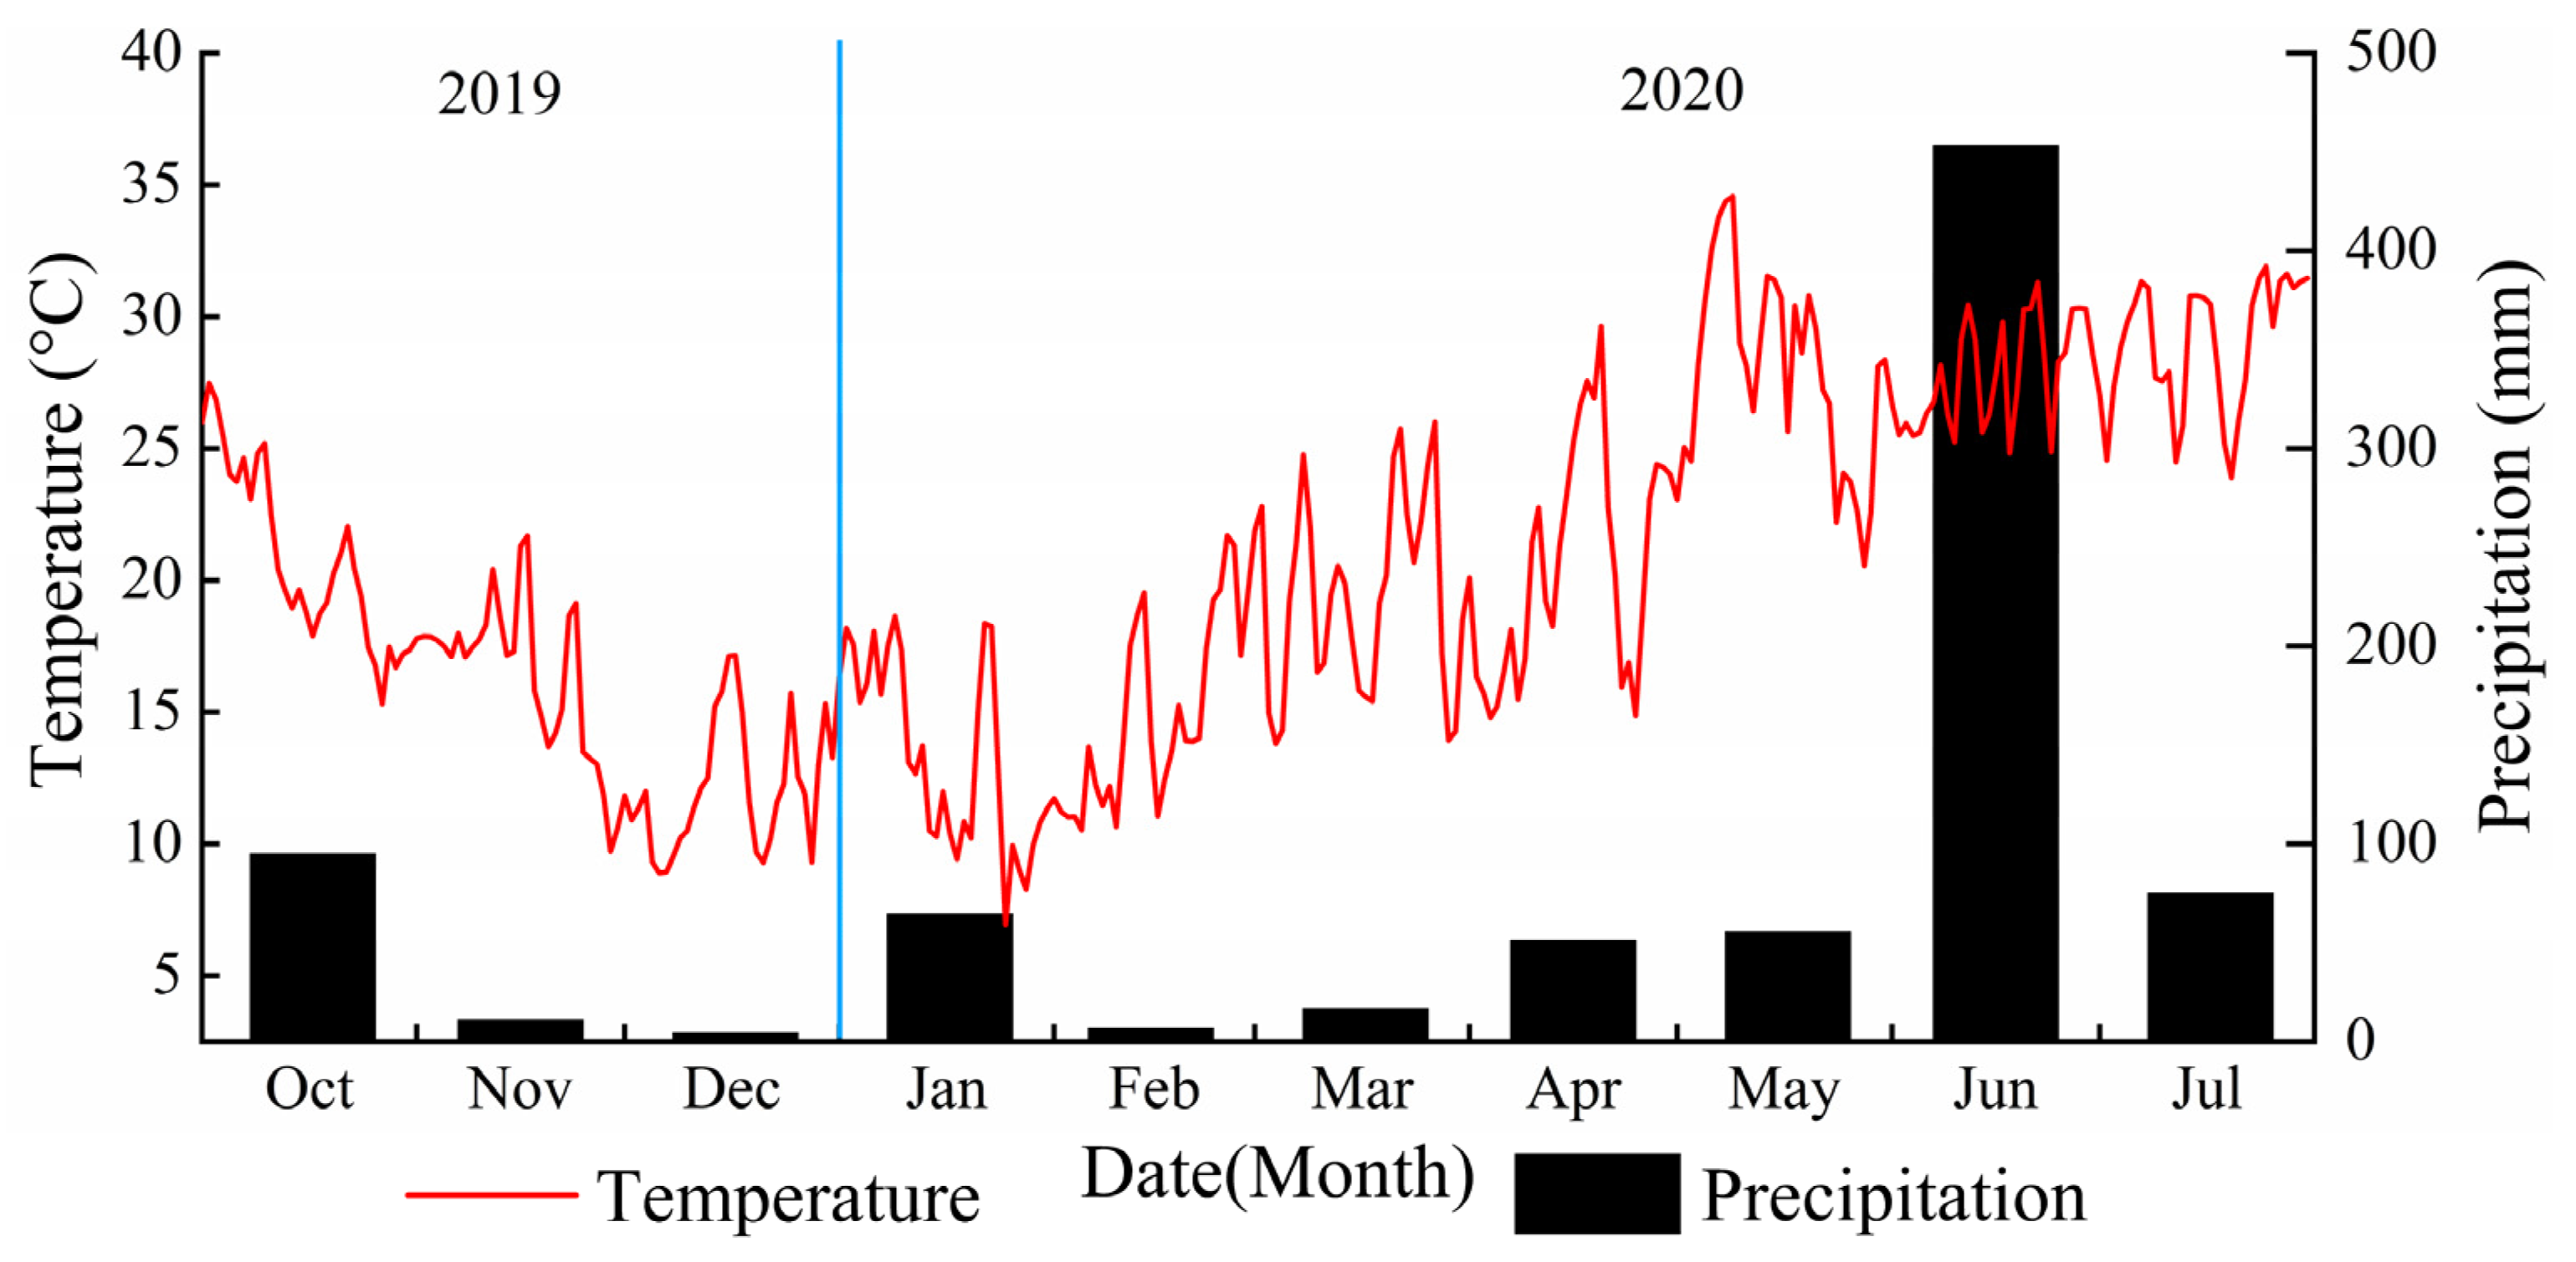
Figure 4.
Daily soil moisture content dynamics changes in profiles of AL, ZB, ZM, ST from 1 October 2019 to 24 July 2020.
Figure 4.
Daily soil moisture content dynamics changes in profiles of AL, ZB, ZM, ST from 1 October 2019 to 24 July 2020.
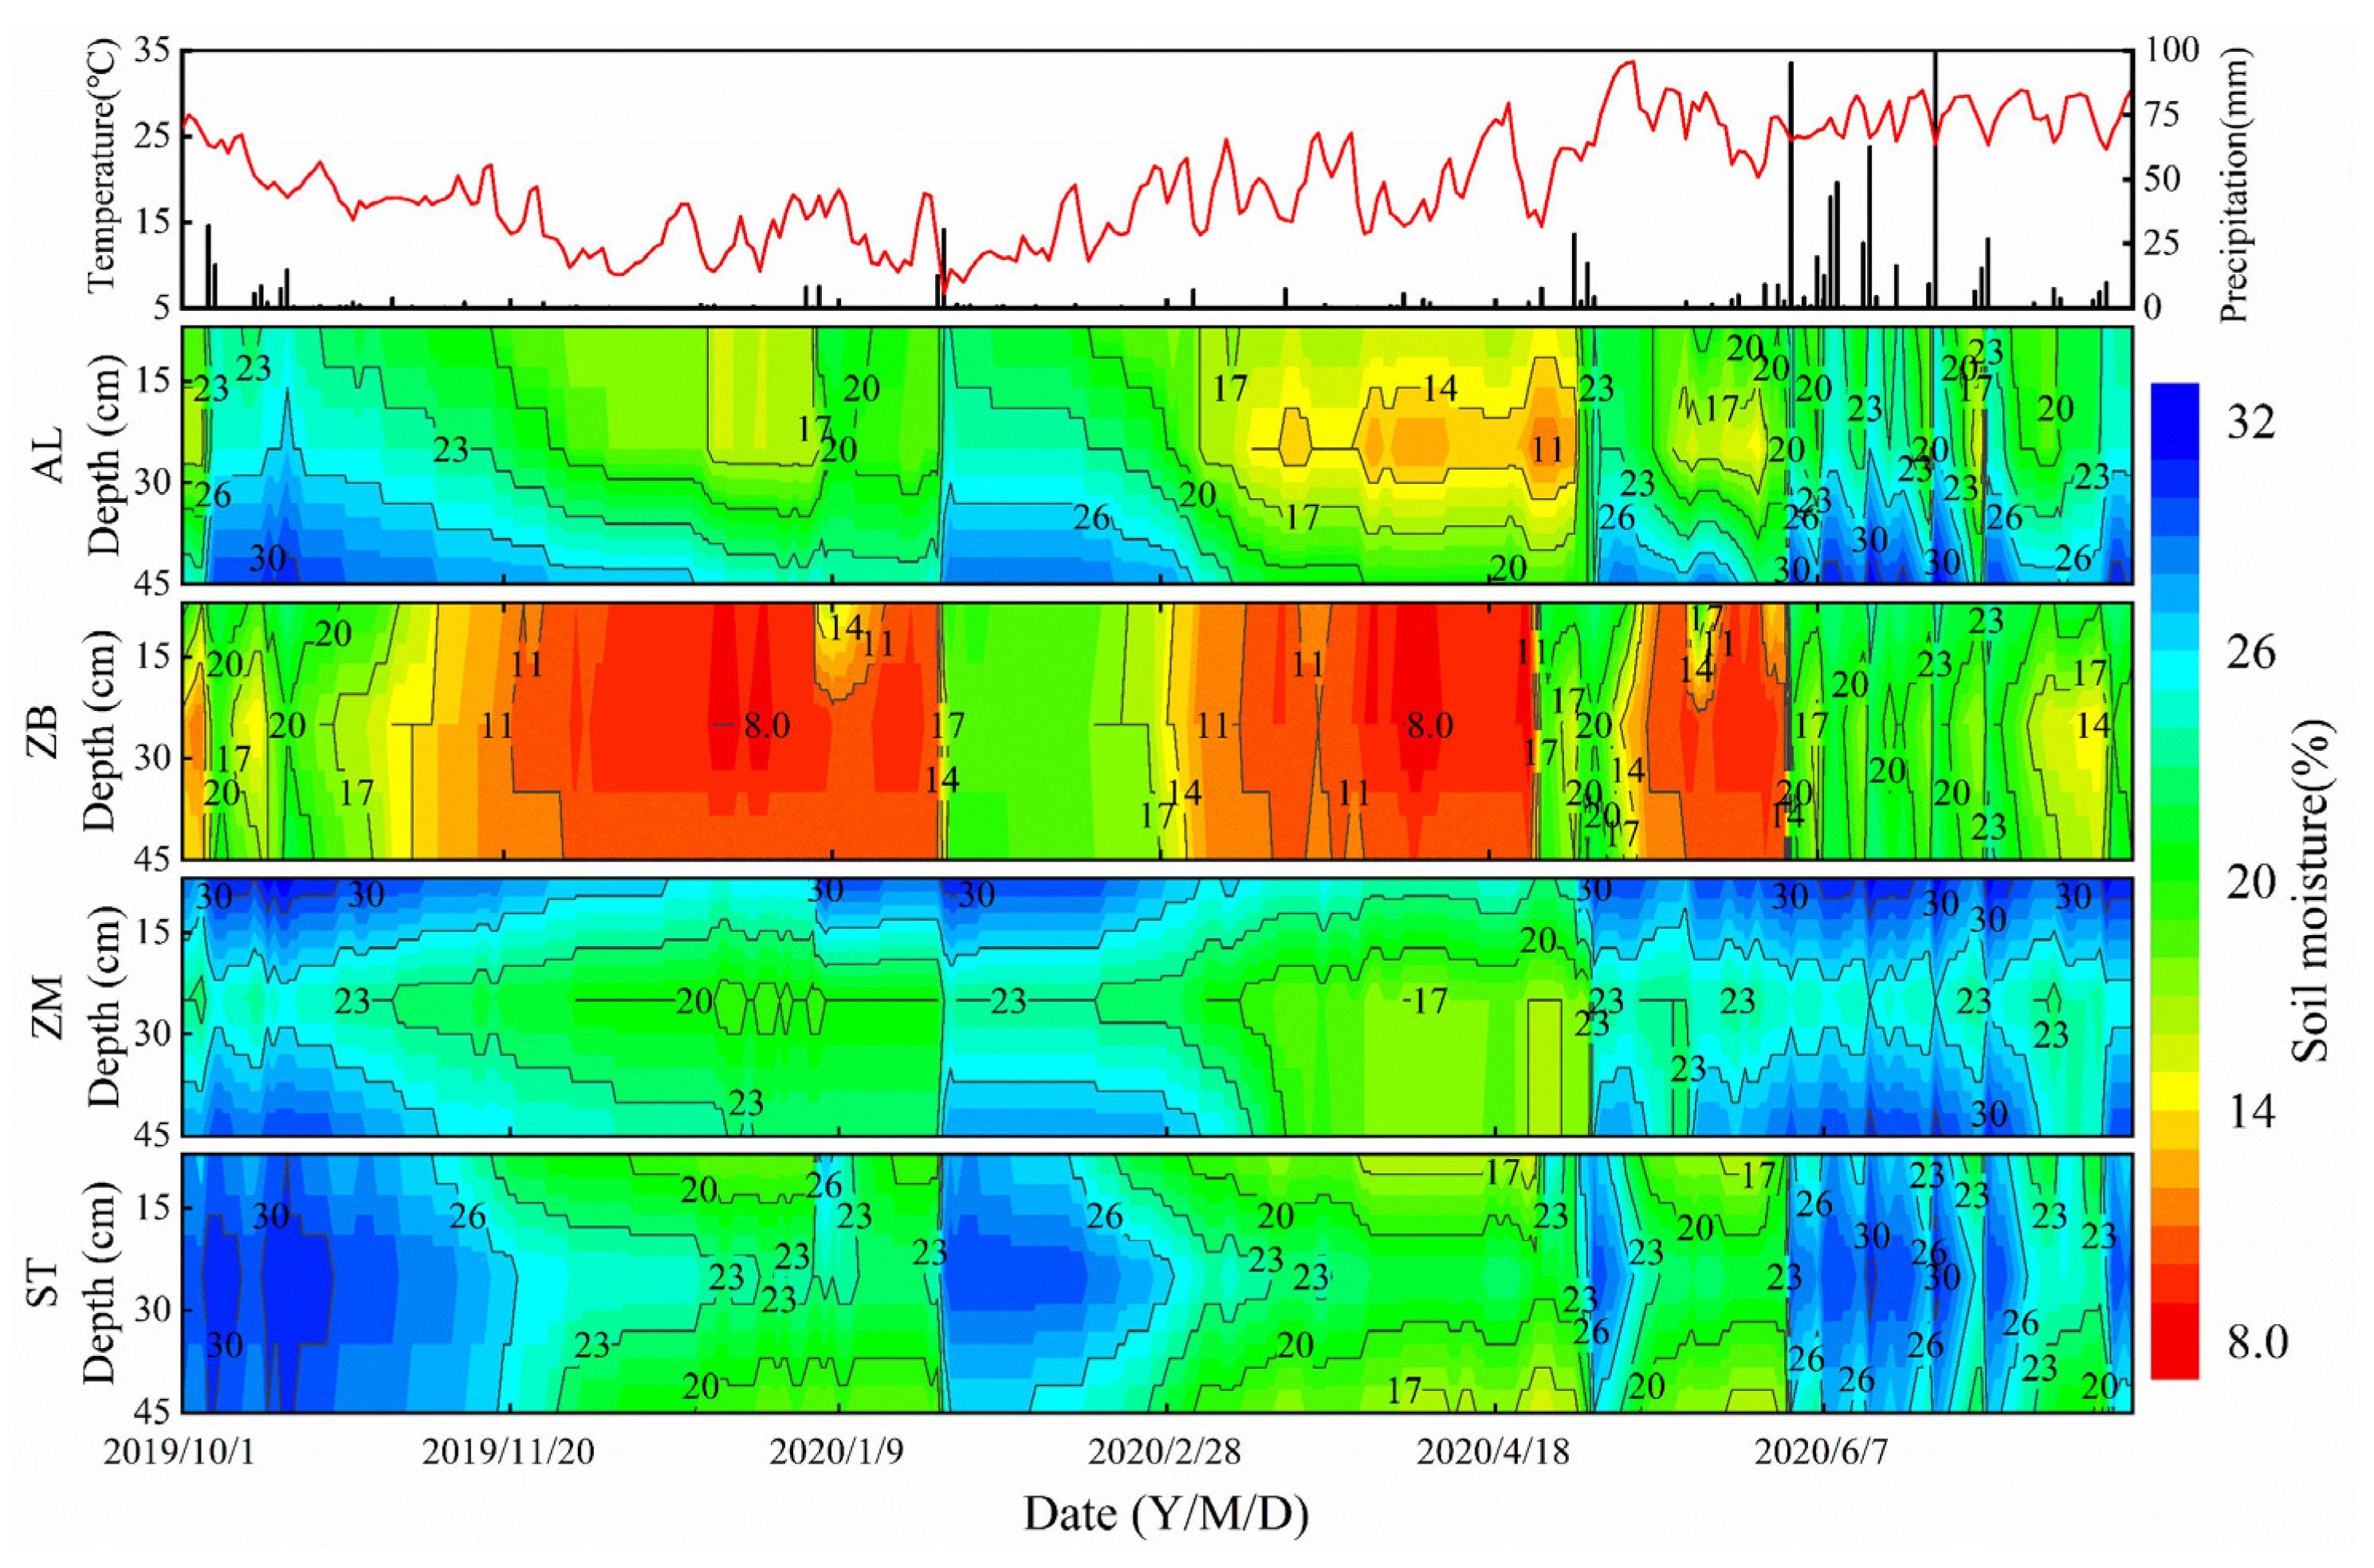
Figure 5.
Effective replenishment of the four vegetation types in typical rainfall during the dry season.
Figure 5.
Effective replenishment of the four vegetation types in typical rainfall during the dry season.
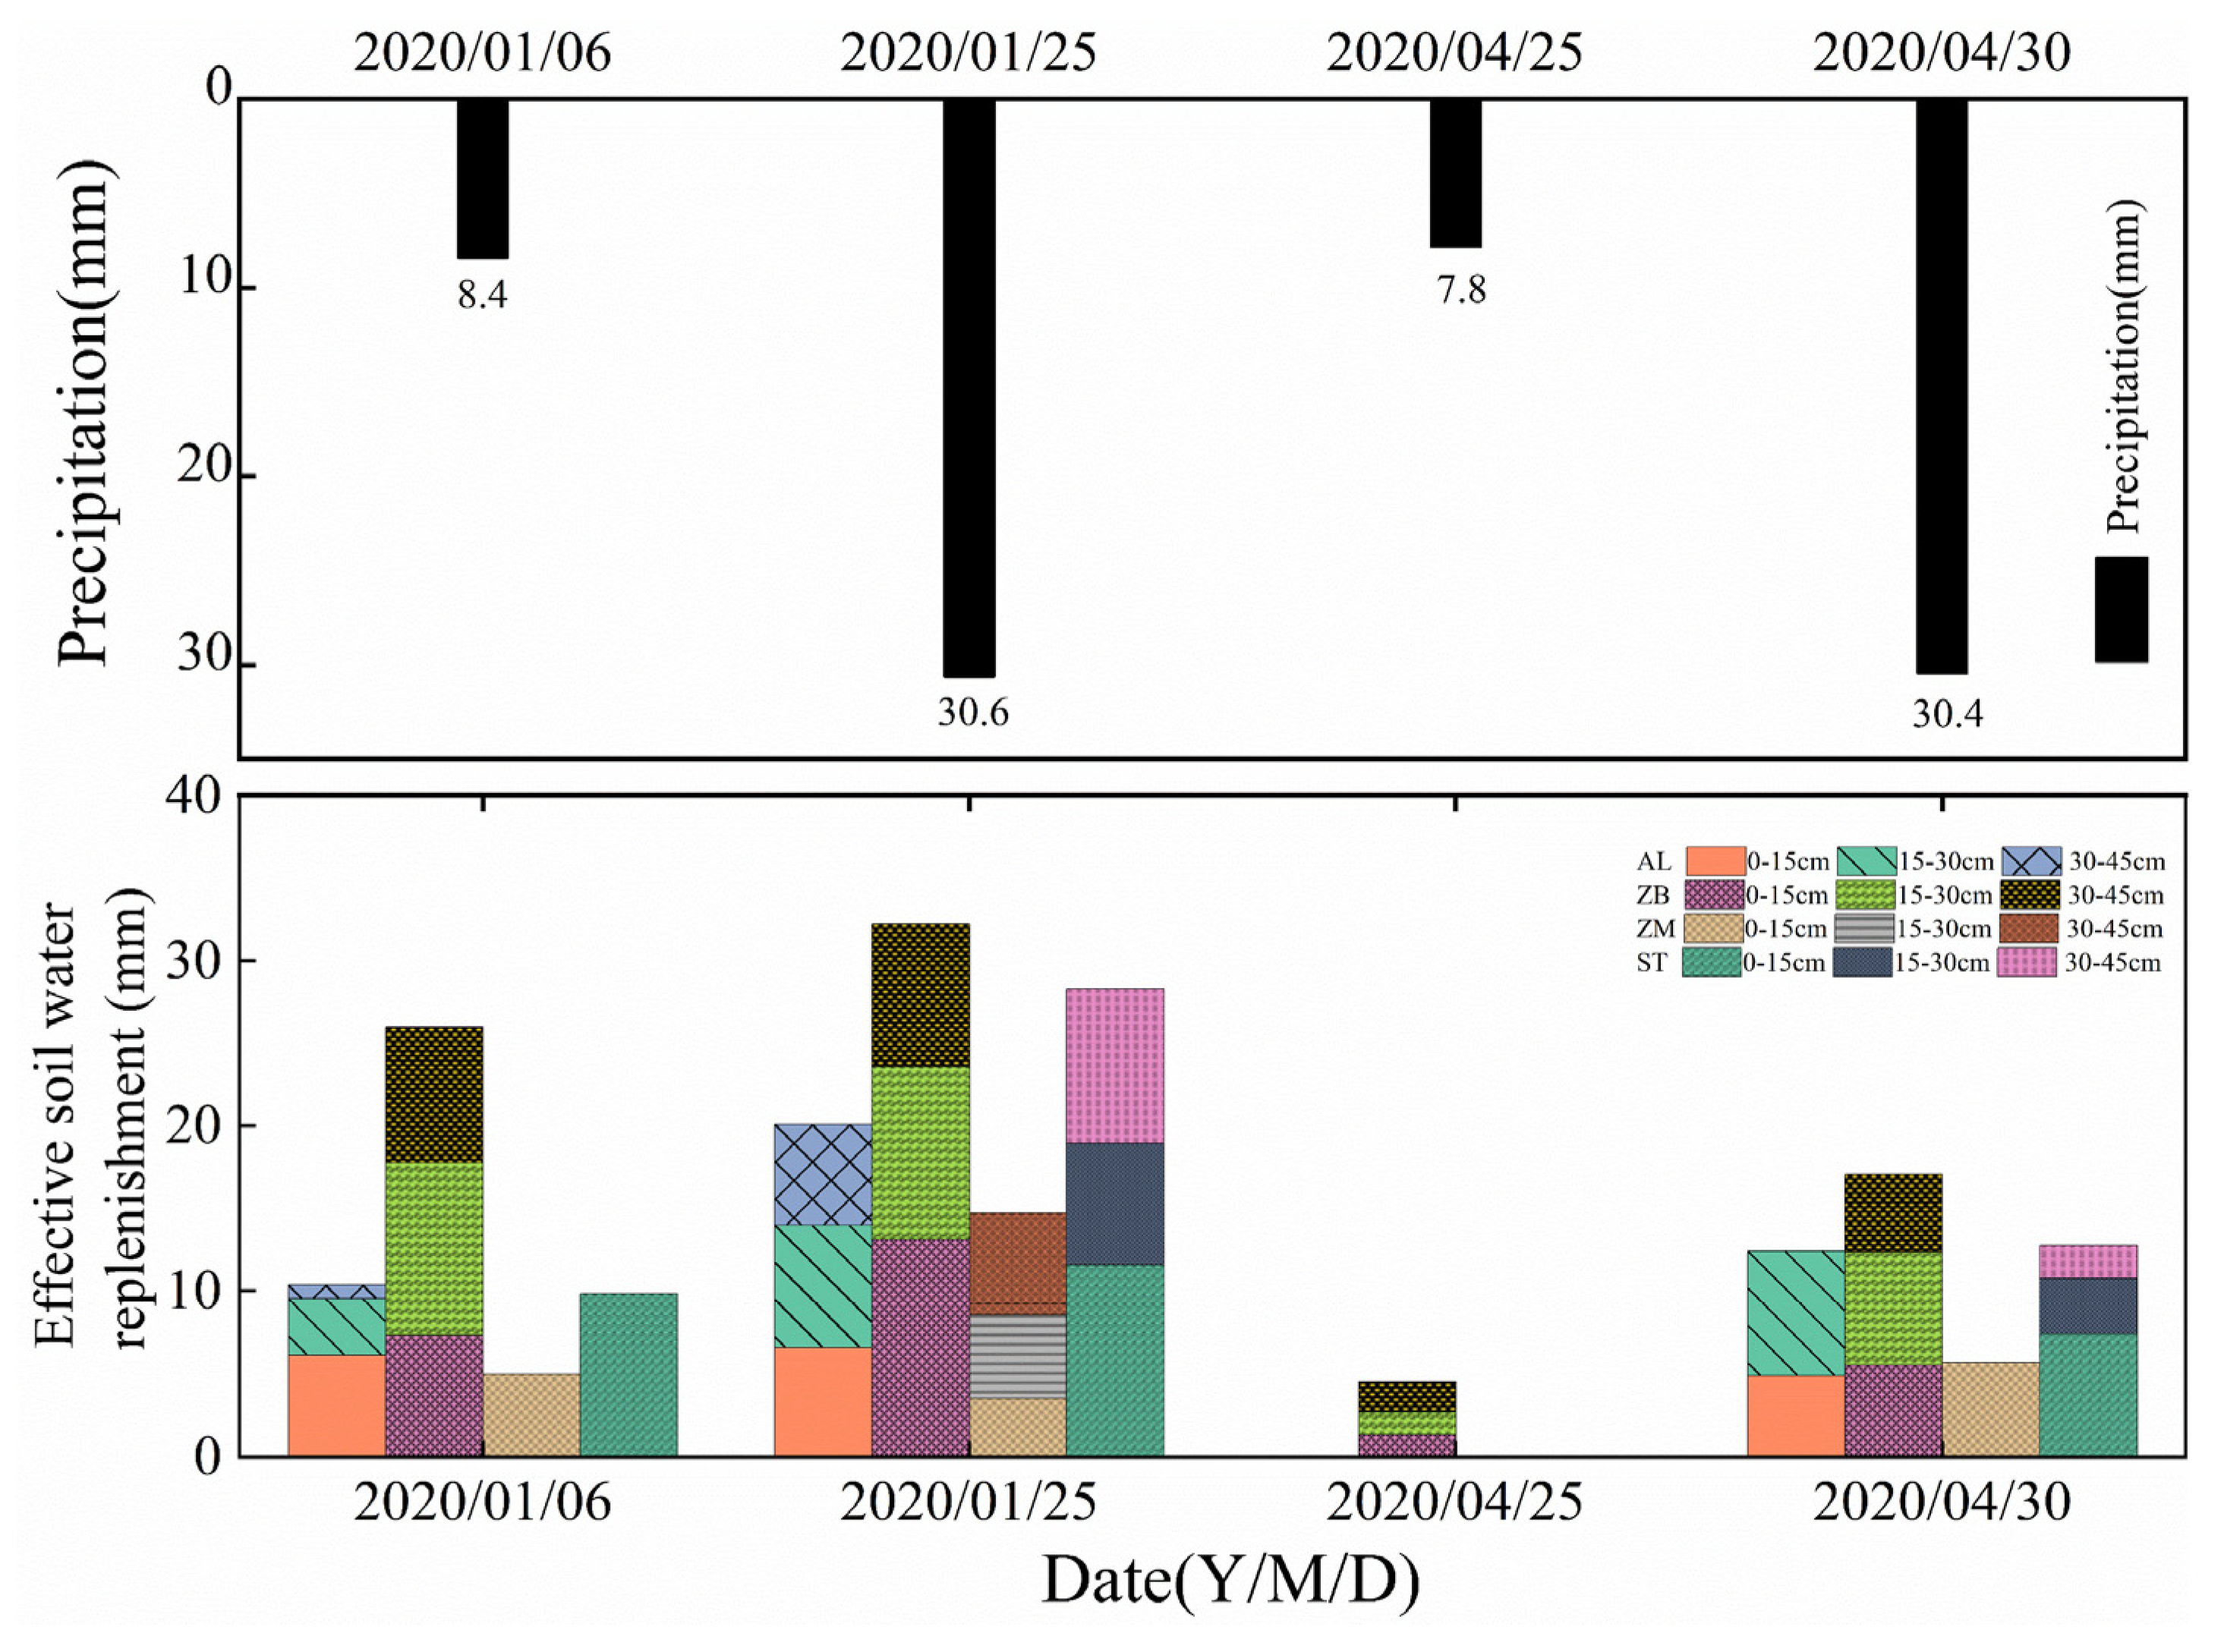
Figure 6.
Response characteristics of the four vegetation types to typical rainfall.

Figure 7.
Daily soil moisture storage dynamic changes in profiles of AL, ZB, ZM, ST from 1 October 2019 to 24 July 2020.
Figure 7.
Daily soil moisture storage dynamic changes in profiles of AL, ZB, ZM, ST from 1 October 2019 to 24 July 2020.

Figure 8.
Daily dynamic changes in profiles of AL, ZB, ZM, ST from 1 October 2019 to 24 July 2020.

Figure 9.
Daily the soil moisture potential gradient dynamic changes in profiles of AL, ZB, ZM, ST from 1 October 2019 to 24 July 2020.
Figure 9.
Daily the soil moisture potential gradient dynamic changes in profiles of AL, ZB, ZM, ST from 1 October 2019 to 24 July 2020.
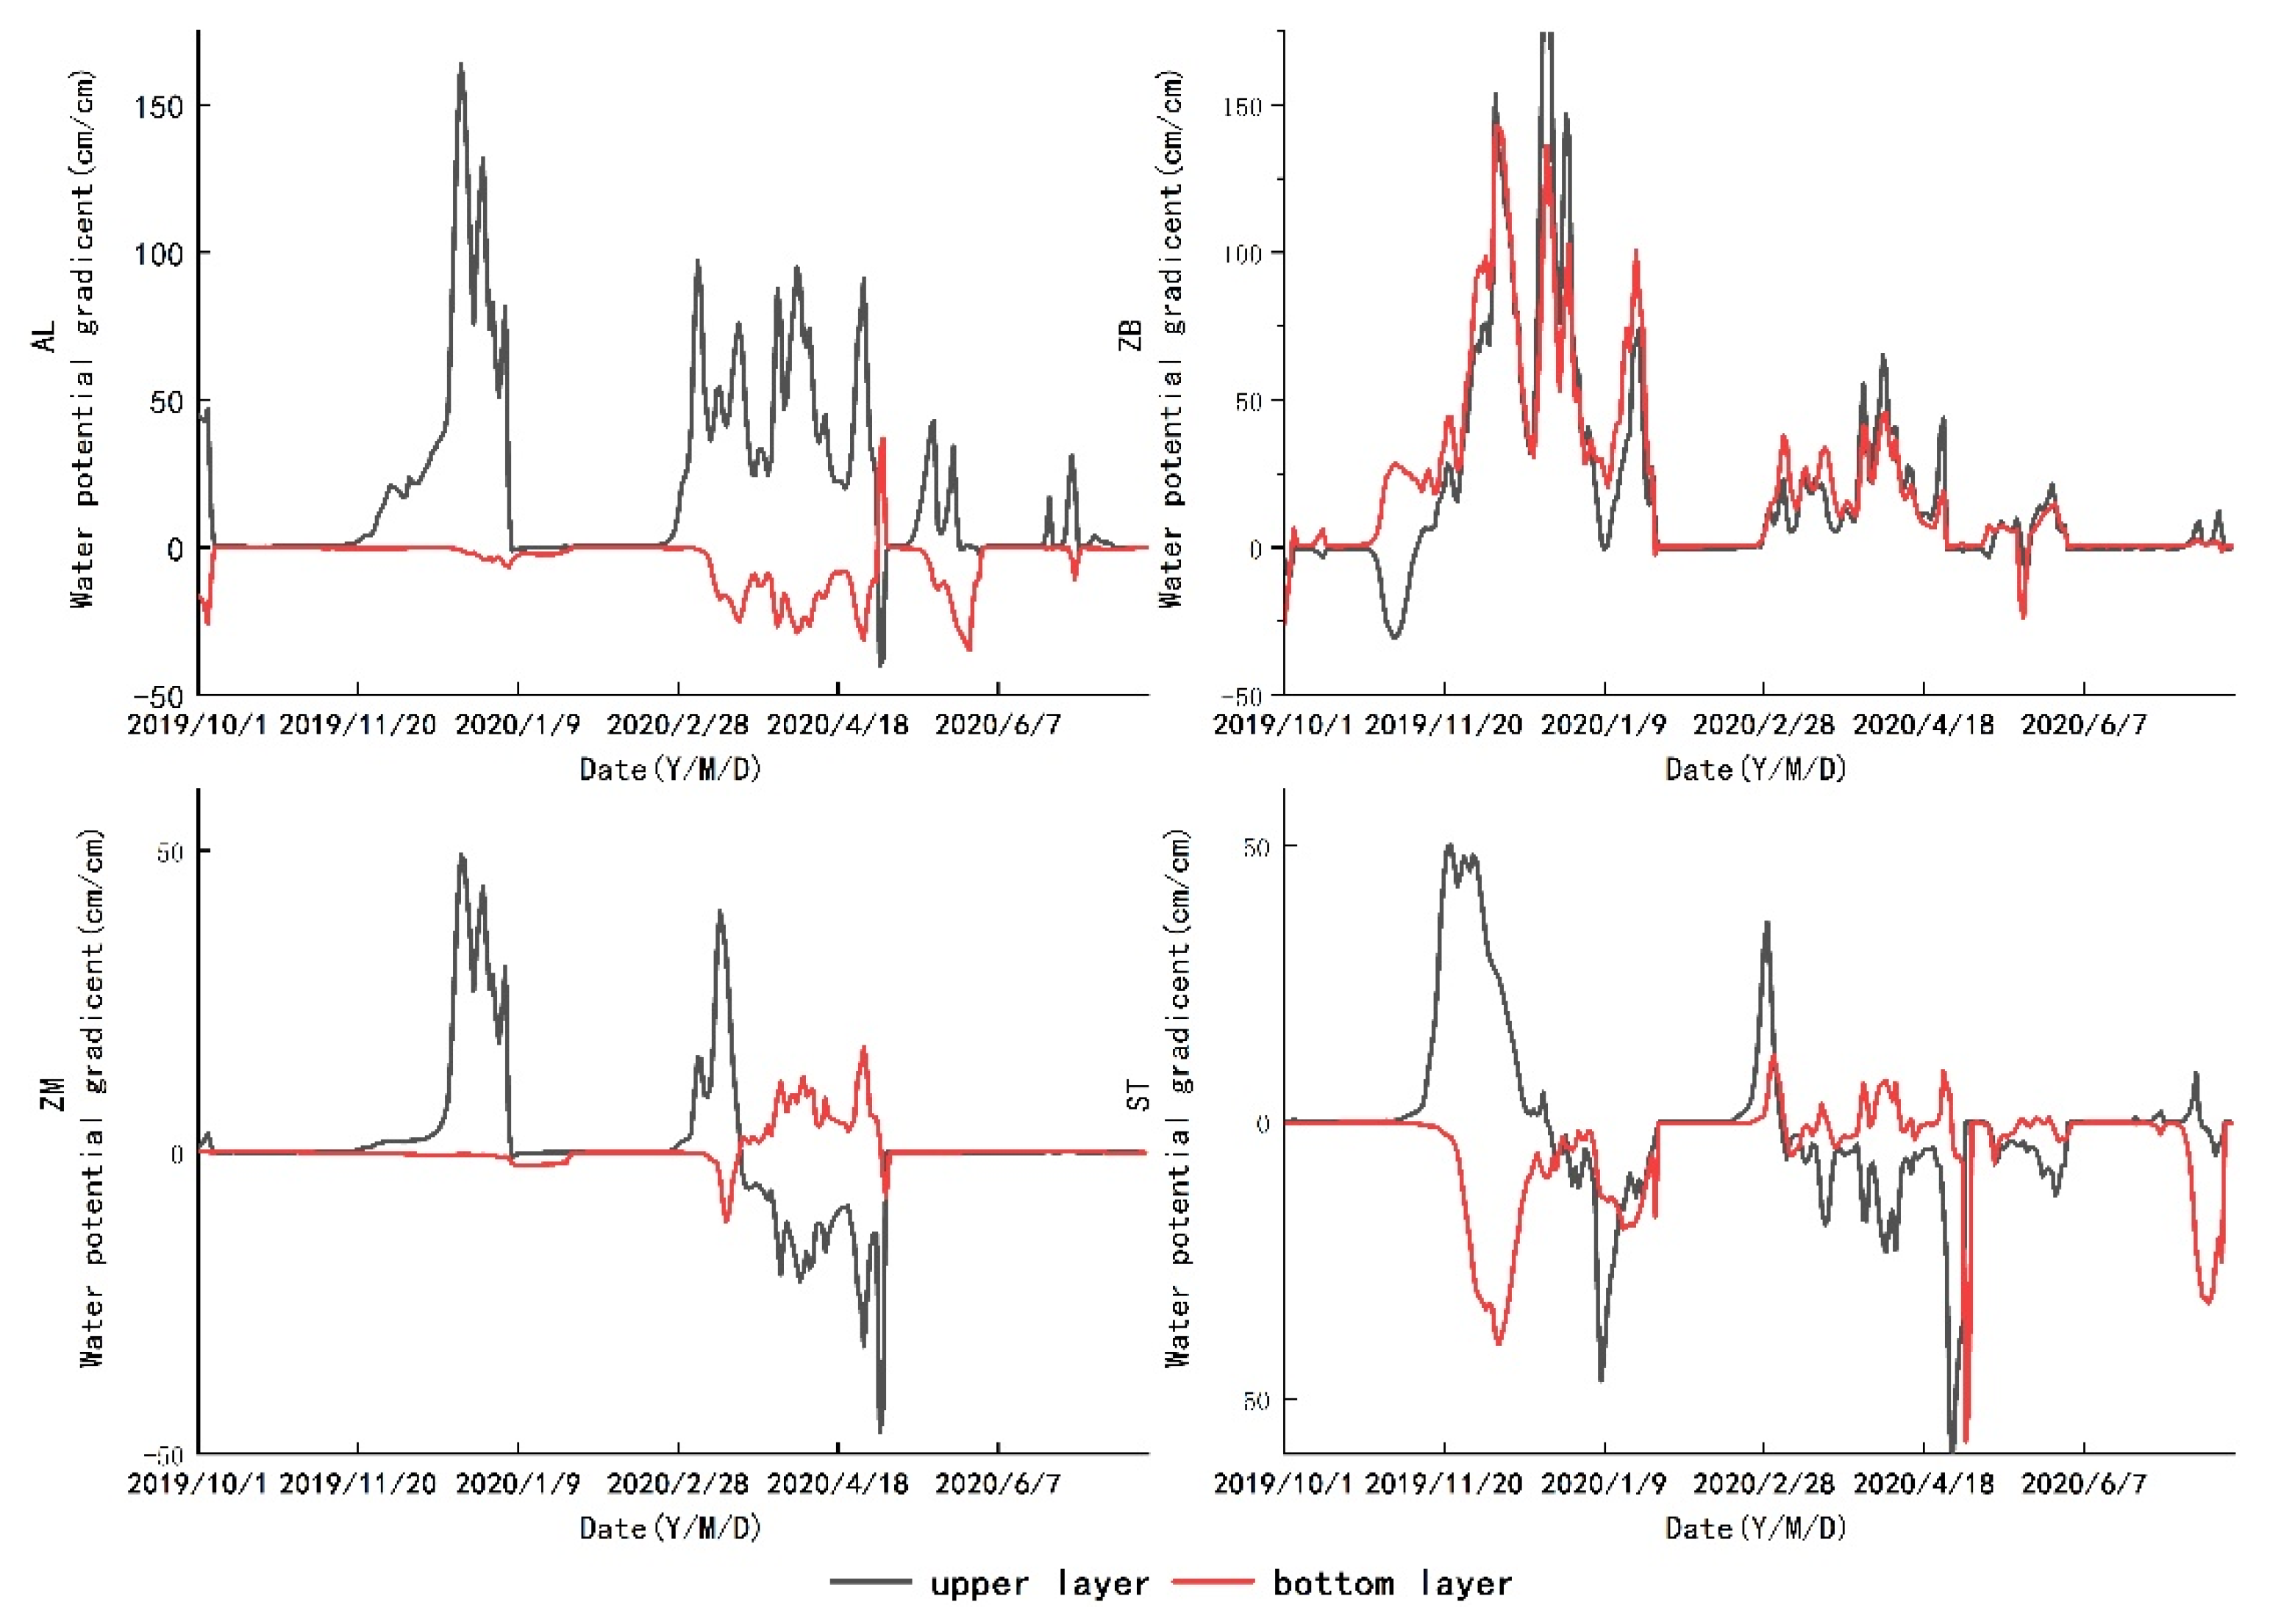
Figure 10.
The relationship between θ replenishment and rainfall of different vegetation types.

Figure 11.
The relationship between θ and of different vegetation types.

Table 1.
Basic properties of the soil profile for the four types of vegetation.
| Vegetation Types | Soil Depth (cm) | ρb (g/cm3) | FC (%) | CP (%) | NCP (%) | Ks (mm/min) |
|---|---|---|---|---|---|---|
| AL | 0–15 | 1.24 | 24.16 | 28.75 | 24.42 | 7.38 |
| 15–30 | 1.40 | 28.29 | 29.08 | 18.54 | 5.60 | |
| 30–45 | 1.51 | 33.52 | 30.44 | 13.62 | 3.88 | |
| ZB | 0–15 | 1.25 | 27.72 | 27.39 | 25.37 | 5.72 |
| 15–30 | 1.13 | 24.98 | 28.41 | 28.36 | 13.88 | |
| 30–45 | 1.28 | 26.32 | 25.24 | 26.54 | 1.57 | |
| ZM | 0–15 | 1.17 | 33.36 | 33.18 | 22.09 | 4.96 |
| 15–30 | 1.38 | 26.12 | 26.56 | 21.70 | 3.88 | |
| 30–45 | 1.53 | 29.30 | 27.20 | 16.39 | 2.33 | |
| ST | 0–15 | 1.24 | 26.31 | 31.34 | 21.59 | 8.24 |
| 15–30 | 1.33 | 32.00 | 33.72 | 16.33 | 6.50 | |
| 30–45 | 1.21 | 29.17 | 30.84 | 23.19 | 5.30 |
Notes: Labels are bulk density (ρb), field capacity (FC), capillary porosity (CP), noncapillary porosity (NCP), and saturated conductivity (Ks).
Table 2.
Statistical characteristics of the soil moisture profiles of AL, ZB, ZM and ST from 1 October 2019 to 24 July 2020.
Table 2.
Statistical characteristics of the soil moisture profiles of AL, ZB, ZM and ST from 1 October 2019 to 24 July 2020.
| Vegetation Types | Soil Depth (cm) | Soil Moisture | ||||
|---|---|---|---|---|---|---|
| MIN (%) | MAX (%) | Mean (%) | SD (%) | CV (%) | ||
| AL | 0–15 | 15.40 | 25.30 | 19.40 | 2.48 | 12.76 |
| 15–30 | 11.00 | 27.60 | 19.54 | 4.27 | 21.84 | |
| 30–45 | 19.00 | 32.70 | 26.25 | 3.46 | 13.18 | |
| mean | 15.03 | 28.53 | 21.73 | 3.40 | 15.93 | |
| ZB | 0–15 | 9.10 | 24.03 | 15.69 | 5.02 | 32.00 |
| 15–30 | 8.20 | 22.30 | 13.26 | 4.12 | 31.07 | |
| 30–45 | 10.30 | 24.10 | 14.96 | 4.07 | 27.23 | |
| mean | 9.20 | 23.57 | 14.64 | 4.40 | 30.10 | |
| ZM | 0–15 | 23.10 | 32.40 | 28.31 | 2.40 | 8.48 |
| 15–30 | 17.30 | 26.80 | 21.60 | 2.35 | 10.90 | |
| 30–45 | 17.60 | 31.40 | 25.35 | 3.81 | 15.04 | |
| mean | 19.33 | 30.20 | 25.09 | 2.86 | 11.47 | |
| ST | 0–15 | 15.10 | 29.80 | 22.06 | 4.19 | 19.01 |
| 15–30 | 20.90 | 31.20 | 26.16 | 3.13 | 11.98 | |
| 30–45 | 15.10 | 30.10 | 21.90 | 4.29 | 19.60 | |
| mean | 17.03 | 30.37 | 23.37 | 3.87 | 16.86 | |
Table 3.
Effective θ replenishment amount, replenishment rate and replenishment efficiency of different vegetation types under typical rainfall conditions.
Table 3.
Effective θ replenishment amount, replenishment rate and replenishment efficiency of different vegetation types under typical rainfall conditions.
| Date | Precipitation (mm) | AL | ZB | ZM | ST | ||||||||
|---|---|---|---|---|---|---|---|---|---|---|---|---|---|
| ∆SW | V (mm/h) | R (%) | ∆SW | V (mm/h) | R (%) | ∆SW | V (mm/h) | R (%) | ∆SW | V (mm/h) | R (%) | ||
| 5 October 2019 | 32.00 | 23.60 | 4.29 | 73.75 | 19.10 | 1.01 | 59.69 | 10.23 | 1.86 | 31.98 | 10.10 | 3.37 | 31.56 |
| 6 January 2020 | 8.40 | 6.88 | 0.32 | 81.90 | 6.24 | 0.32 | 74.29 | 4.24 | 0.20 | 50.48 | 7.12 | 0.79 | 84.76 |
| 25 January 2020 | 30.60 | 15.84 | 2.26 | 51.76 | 21.84 | 1.90 | 71.37 | 11.68 | 1.17 | 38.17 | 22.24 | 2.22 | 72.68 |
| 30 April 2020 | 30.40 | 12.30 | 1.29 | 40.46 | 15.20 | 3.80 | 50.00 | 5.30 | 0.28 | 17.43 | 9.50 | 0.59 | 31.25 |
| 2 June 2020 | 97.20 | 26.00 | 13.00 | 26.75 | 40.71 | 9.05 | 41.88 | 7.00 | 3.50 | 7.20 | 28.00 | 7.00 | 28.81 |
| 8 June 2020 | 43.00 | 10.40 | 4.16 | 24.19 | 9.30 | 1.86 | 21.63 | 4.30 | 1.08 | 10.00 | 6.90 | 1.73 | 16.05 |
| 25 June 2020 | 101.00 | 26.90 | 17.93 | 26.63 | 20.90 | 6.97 | 20.69 | 11.20 | 4.48 | 11.09 | 20.30 | 10.15 | 20.10 |
| 1 July 2020 | 42.40 | 29.10 | 2.08 | 68.63 | 25.00 | 3.85 | 58.96 | 12.90 | 1.84 | 30.42 | 22.50 | 3.46 | 53.07 |
| mean | 48.13 | 18.88 | 5.67 | 49.26 | 19.79 | 3.59 | 49.81 | 8.36 | 1.80 | 24.60 | 15.83 | 3.66 | 42.28 |
Publisher’s Note: MDPI stays neutral with regard to jurisdictional claims in published maps and institutional affiliations. |
© 2021 by the authors. Licensee MDPI, Basel, Switzerland. This article is an open access article distributed under the terms and conditions of the Creative Commons Attribution (CC BY) license (https://creativecommons.org/licenses/by/4.0/).
Share and Cite
MDPI and ACS Style
Liu, Z.; She, R.; Xiong, K.; Li, Y.; Cai, L. Effect of Vegetation Restoration on Soil Hydrology in Karst Area of Southwest China: Inspiration from Barrel Planting Experiments. Water 2021, 13, 1719. https://doi.org/10.3390/w13131719
AMA Style
Liu Z, She R, Xiong K, Li Y, Cai L. Effect of Vegetation Restoration on Soil Hydrology in Karst Area of Southwest China: Inspiration from Barrel Planting Experiments. Water. 2021; 13(13):1719. https://doi.org/10.3390/w13131719
Chicago/Turabian StyleLiu, Ziqi, Rong She, Kangning Xiong, Yuan Li, and Lulu Cai. 2021. "Effect of Vegetation Restoration on Soil Hydrology in Karst Area of Southwest China: Inspiration from Barrel Planting Experiments" Water 13, no. 13: 1719. https://doi.org/10.3390/w13131719
Note that from the first issue of 2016, this journal uses article numbers instead of page numbers. See further details here.