Article

Assessing the Impact of Lining Polluted Streams on Groundwater Quality: A Case Study of the Eastern Nile Delta Aquifer, Egypt

by
Ismail Abd-Elaty
1,
Abdelrahman M. Said
1,2,
Gamal M. Abdelaal
1,
Martina Zeleňáková
3,*,
Jan Jandora
4 and
Hany F. Abd-Elhamid
1,5
1
Department of Water and Water Structures Engineering, Faculty of Engineering, Zagazig University, Zagazig 44519, Egypt
2
Higher Institute of Engineering, Belbies 55419, Egypt
3
Department of Environmental Engineering, Faculty of Civil Engineering, Technical University of Kosice, 04001 Košice, Slovakia
4
Institute of Water Structures, Faculty of Civil Engineering, University of Technology Brno, 60200 Brno, Czech Republic
5
Center for Research and Innovation in Construction Faculty of Civil Engineering, Technical University of Kosice, 04001 Košice, Slovakia
*
Author to whom correspondence should be addressed.
Water 2021, 13(12), 1705; https://doi.org/10.3390/w13121705
Submission received: 11 April 2021 / Revised: 15 June 2021 / Accepted: 16 June 2021 / Published: 20 June 2021
(This article belongs to the Special Issue Assessment and Management of Flood Risk in Urban Areas)

Abstract

:
Groundwater is considered to be an important water supply for domestics, industry, and irrigation in many areas of the world. Renewable groundwater is recharged by rainfall and seepage from canals and open drain networks. Agricultural and industrial drainage, as well as domestic drainage, represent the main discharges into open drains. Therefore, these drains are considered to be a source of recharge as well as a source of pollution. In this study, we aim to evaluate the impact of the Bahr El Baqar drain system on groundwater quality in the Eastern Nile Delta, Egypt. MODFLOW was used to create a numerical model to simulate groundwater flow in an aquifer and MT3DS was used to simulate solute transport from the open contaminated Bahr El Baqar drain to the groundwater. Two approaches were developed in the study area. The first approach was applied to investigate the impact of increasing the abstraction rates on the contaminant transport into the aquifer, the second approach was developed to identify the effect of lining the drain using different materials on contaminant extension in the aquifer to protect groundwater quality in the east Nile Delta Aquifer. The results showed that the TDS values increased by 18.23%, 23.29%, and 19.24% with increased abstraction rates of 15%, 34%, and 70%, resulting from population increases in 2010, 2025, and 2040, respectively; however, the TDS in the aquifer decreased from 0.6%, to 6.36%, 88.35%, and 90.47% by using lining materials.

1. Introduction

Global groundwater abstraction quantities are estimated to be 982 km3/year [1]. Groundwater sources provide almost half of the total global drinking demands [2]. The total volume of groundwater in the upper 2 km of the Earth’s continental crust (not inclusive of high-latitude North America or Asia) is approximately 22.6 million km3, of which from 0.1 million km3 to 5.0 million km3 is less than 50 years old (judged as “modern” or recently recharged) [3]. Groundwater in Egypt plays a critical role in water supply. Protecting groundwater from the polluted sources improves all activities that depend on groundwater sources. In Egypt, there are two main sources of groundwater: (1) renewable groundwater which is located in the Nile Delta and Nile Valley system and (2) non-renewable groundwater that is located in the Nubian Sandstone Aquifer in the Western Desert [4].
About 20% of groundwater comes from conventional water resources where the total abstraction from the Nile Delta Aquifer, Egypt has been estimated to be 7 billion cubic meters (BCM) in 2016 [5,6,7].
Annual groundwater abstraction from the Nile aquifer system has been estimated to be 4.6 BCM, while the total groundwater abstraction from the Delta, Sinai, and New Valley regions has been estimated to be 5.1 BCM/year in addition to 0.50 BCM/year abstraction from the Western Desert aquifers [4]. Groundwater is recharged from different sources which include leakage from rivers, canals, and drainage systems; downward leakage from excess irrigation; leaks and groundwater intersection; inter-aquifer flow; and rainfall infiltration. The main discharge sources include groundwater return flow to canals and drains, direct extraction, evapotranspiration, and inter-aquifer flow of groundwater [4]. These sources have different impacts on the groundwater recharge rates from one location to another depending on soil type, geography, slope, depth, and temperature. The Nile Delta and the Nile Valley aquifers in Egypt are mainly replenished by seepage from the River Nile, the network of canals and drains, and percolation from agricultural water [5]. Multiple methods have been applied to investigate the effect of surface open drains on the groundwater in the Old River Irrigation area, northern Australia. The results have shown that surface drain and groundwater intersection are changing over shorter periods of time such as seasonally and over the long term as the aquifer fills [8].
The sources of groundwater recharge in the northeastern part of the Nile Valley, Egypt includes seepage from the current Nile water and old Nile water before constructing the High Aswan Dam, return flow from the irrigation water, and surface runoff resulting from local rains [9]. The three-dimensional (3D) regional model results indicate that surface water seepage and return irrigation water are the main sources of recharging the Nile Delta Aquifer [10]. There is a good and direct relation between groundwater and recharge from surface water systems. Bear (1979) presented four main sources of groundwater contamination, i.e., environmental, domestic, industrial, and agriculture sources [11].
The main role of open drains is to collect excess irrigation water which includes contaminants coming from agricultural activities due to excessive use of pesticides and fertilizers. In addition, these drains are under contamination pressure from the various industrial and domestic wastewater sources that introduce different organic and inorganic contaminants into the groundwater, such as heavy metals, sulphates, and many harmful compounds from the residential areas. The main source of drain water contamination in Mahala Kobra is discharge from household sewage directly into drains [12]. The open drain wastewater, leakage from sewage networks, and untreated wastewater from industrial areas represent the main groundwater contamination sources [13].
A MODFLOW numerical model was applied to a hypothetical case study to investigate the impact of contaminated open drains on groundwater quality. The model results indicated that solute transport from open drains to groundwater aquifers is very sensitive to changes in the pumping schemes [14]. A coupled numerical model using MODFLOW and MT3DMS was applied to assimilate the different water supply systems including surface water (polluted drains and canals) and groundwater and to determine groundwater contamination resulting from drains, as freshwater was polluted and the contamination level exceeded the standard limits. The results showed that the lining method was the best method and most effective system for decreasing contaminant migration and that this method can be applied universally, in addition to considering the conditions and geotechnical soil properties, the types of the lining material, and the source of pollutant loads and elements in these drains. Protecting groundwater from polluted open drains has become an essential issue for improving groundwater quality. A number of studies have presented natural materials with low permeability (clay, bentonite mixture, etc.) and manufactured materials (geomembrane, concrete, etc.) to minimize the leakage of open drains into groundwater. The impact of these materials on waterproofing indicates that these materials can be highly effective for waterproofing hydraulic works and which type to choose depends on the function of the reservoir itself and economic factors [15]. Using soil-cement tiles for the lining of open canals can significantly decrease the leakage from these canals [16]. Using low permeability materials such as clay, bentonite, geomembrane, and concrete for lining drain cross-sections has decreased the solute extension by 43, 89.6, 91.4, and 93%, respectively, as compared with the base case. Water vapour transmission test results have shown that the permeability of geomembrane ranges from 1−13 to 10−15 m/s, while the permeability of bentonite is estimated to be 10−10 m/s [17]. The hydraulic conductivity for concrete and mortars has been estimated to be 5.67 × 10⁻¹³ m/s and 5.87 × 10⁻¹⁴ m/s, respectively [18]. The hydraulic conductivity of sand-bentonite mixtures (80% sand and 20% bentonite) has been tested and calculated to be 0.033 m/d [19]. Different numerical simulations have been applied to study protecting groundwater from polluted streams using lining, a cutoff wall, and increasing fresh groundwater [20,21,22].
In this study, we aim to investigate the impact of a polluted stream, the Bahr El Baqar drain (BED), in eastern Nile Delta, Egypt on groundwater quality. The polluted water in the BED is received from agricultural, industrial, and domestic drainage with values of 58%, 2%, and 40%, respectively [23]. The total dissolved salt (TDS) values in the BED range from 4971 to 5010 (mg/L) [24]. The main sources of discharge into the BED are drainage water from the industrial areas in Shoubra El-Khema and Zagazig, as well as domestic and agriculture drainage water activities from Belbeis and Qalubeya drains [25]. In the current study, MODFLOW was used to simulate groundwater flow and contaminant transport. There are a number of techniques that can be applied to decrease solute transport from polluted water bodies to groundwater. In this study, we investigated the impact of using different lining materials with low hydraulic conductivity such as clay, bentonite, geomembrane, and concrete on groundwater quality. Finally, the feasibility for each lining material was considered.

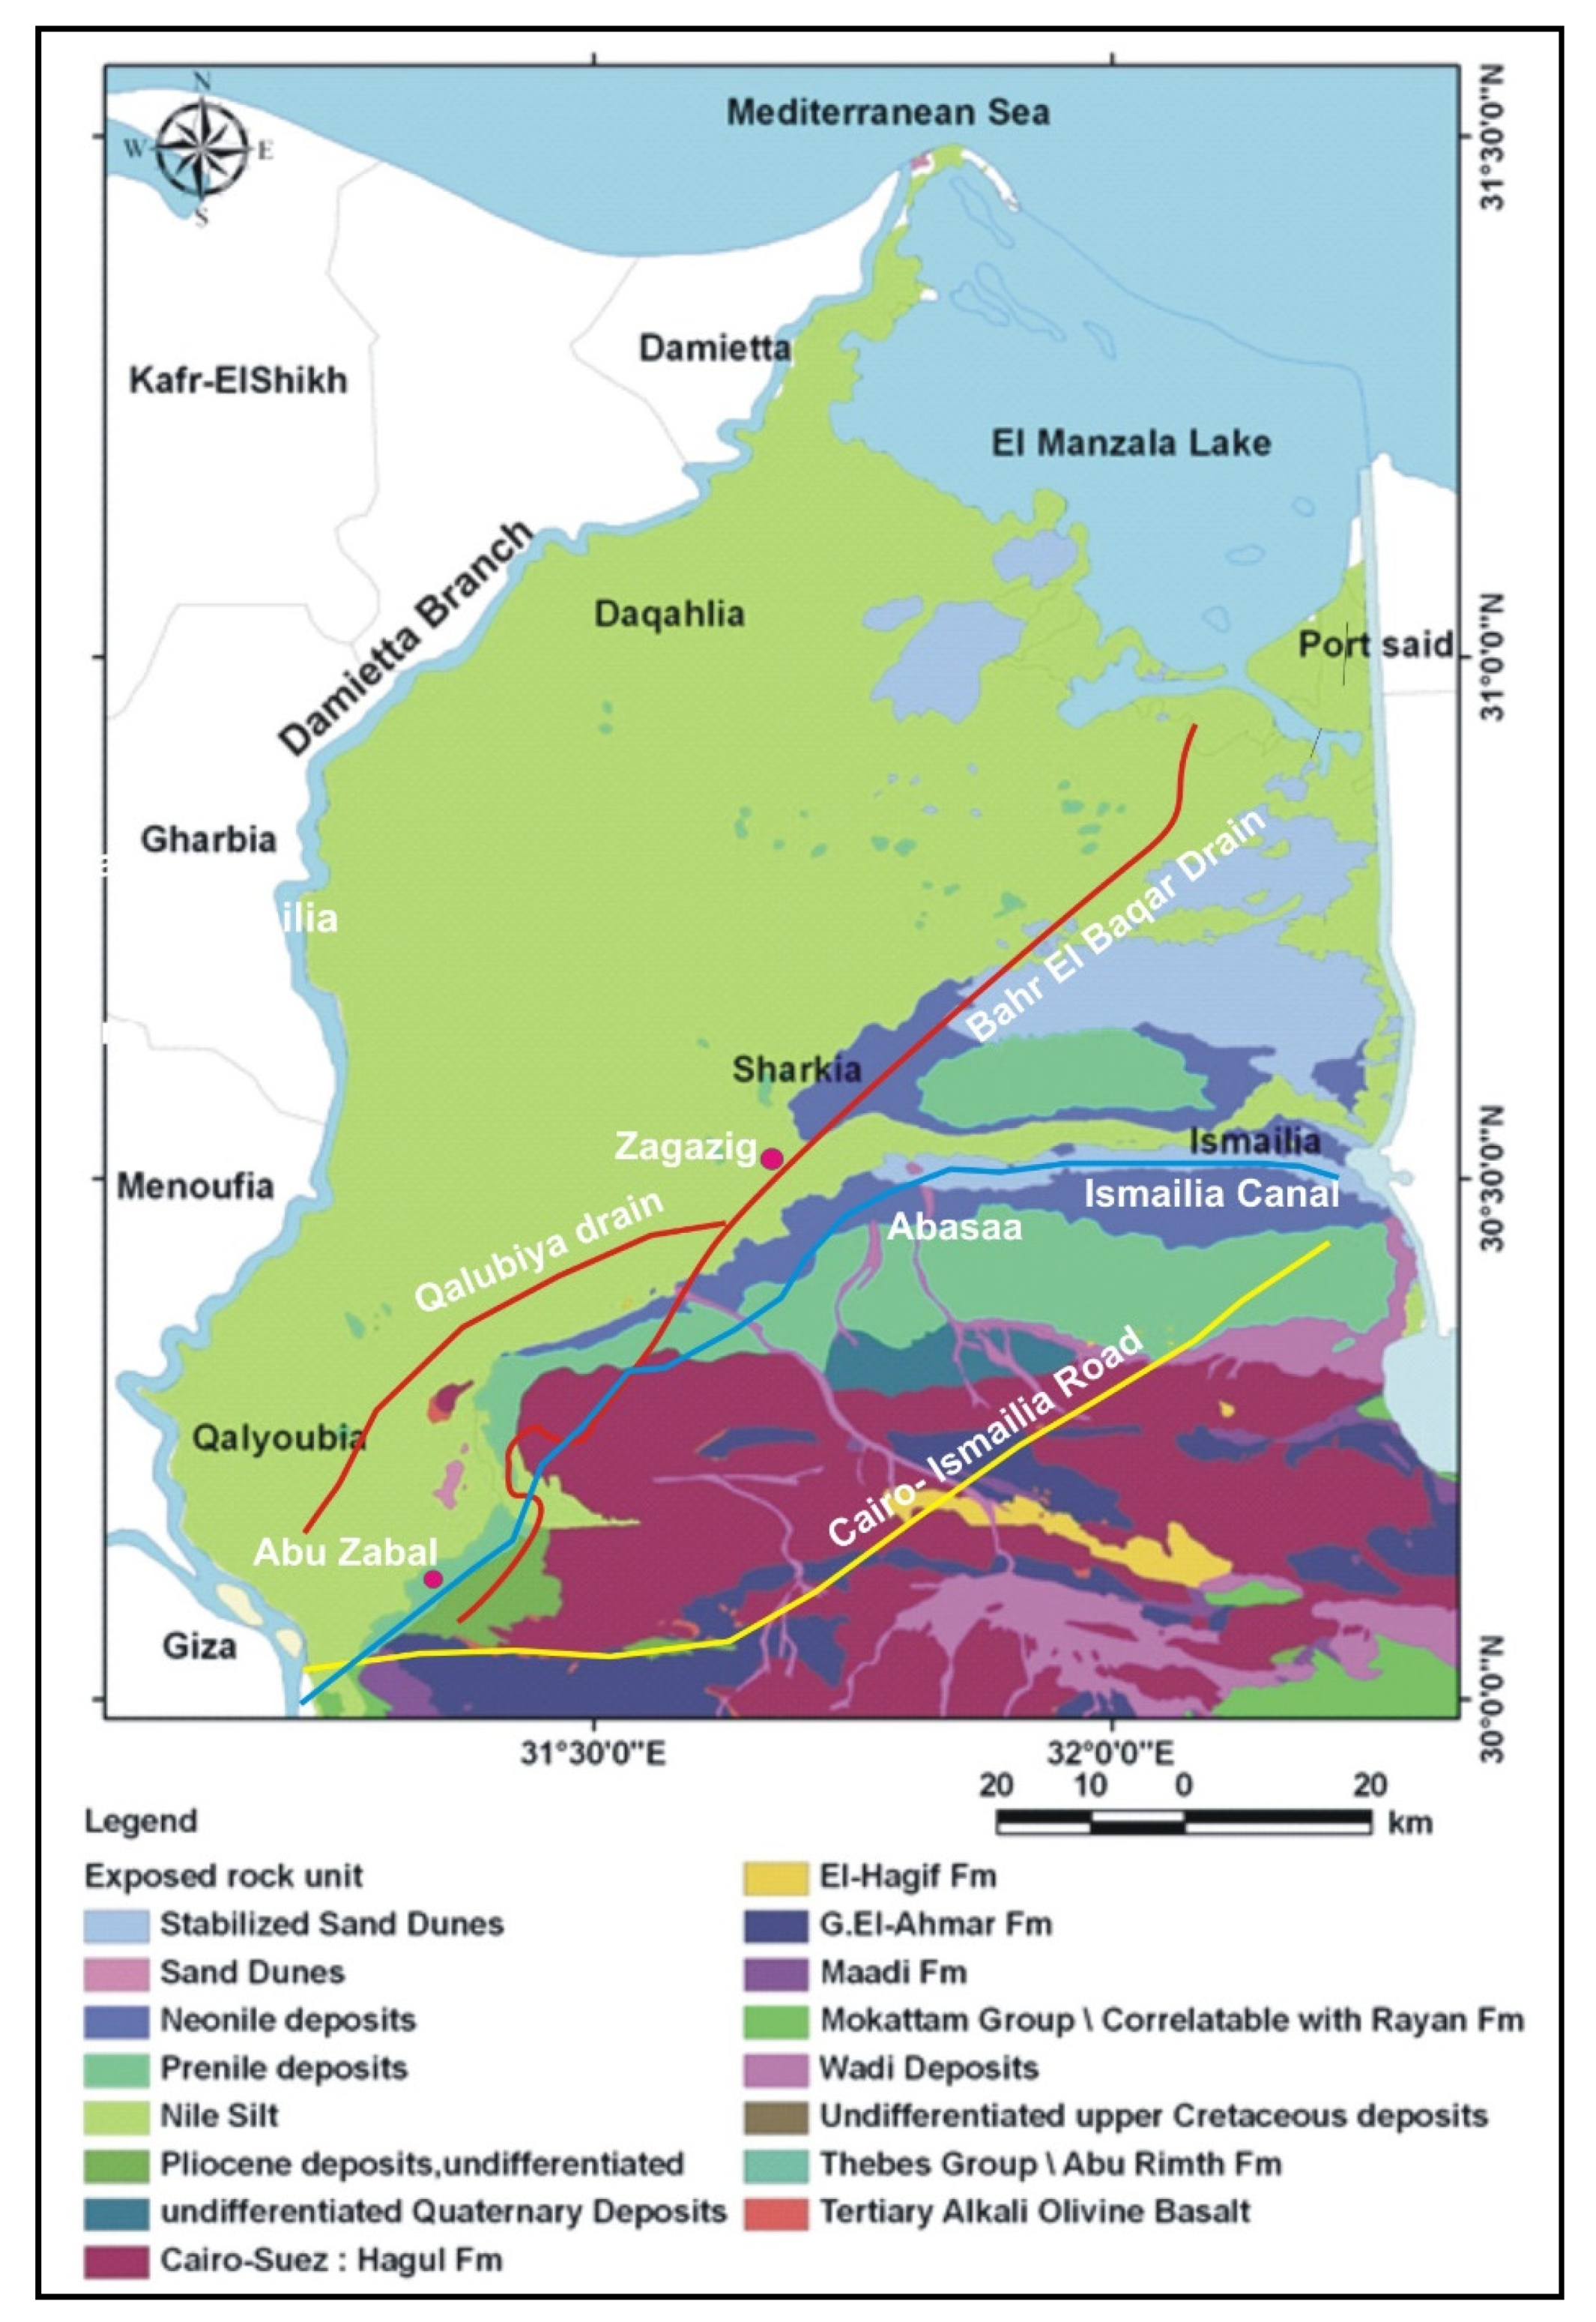
2. Study Area Description

The Eastern Nile Delta Aquifer (ENDA) is located between latitudes 30°00′, 31°30′ north and longitudes 31°00′, 32°30′ east with a total area of 14,000 km2. The ENDA has a predominantly agricultural nature with a high density of overlapping irrigation and drainage networks which follow from the south to the north, as shown in Figure 1 [21,26]. The area is bounded by the Damietta branch in the west, Suez Canal in the east, El Manzala Lake in the north, and Ismailia canal in the south. The Bahr El-Baqar drain system consists of two secondary drains (the Bilbeis and the Qalubeya drains), which merge downstream into a main drain [25,27]. This drain is considered to be one of the largest open surface drains in Egypt with a total length of 85 km. The drain bottom width ranges from 100 to 200 m with an average depth of 5 m. The drain conductance has been observed to be between 0.05 and 0.2 m/d [28,29].
The study area has low elevation terrain that slopes gently to the northern direction with an average slope of 1 m per 10 km. It is located in an arid region between southwest Asia and northeast Africa with the same climate as around the Mediterranean Sea [30]. The minimum and maximum recorded temperature ranges from 20.20 to 35.30 °C in summer and from 7.50 to 20.1 °C in winter, while the humidity reaches 74% at Zagazig station and decreases to 51% at Suez station [31]. The average recorded annual precipitation ranges from 0.065 mm/day in Cairo Ezbekiya station to 0.380 mm/day in the Baltim station [32]. The infiltration rates are different from one location to another depending on the dominant sedimentary facies (Food and Agriculture Organization (FAO) of the United Nations, 1966) [33]. The maximum recorded evaporation rates have reached 0.39 mm/day in Cairo and this rate decreases towards the north and east with minimum evaporation rates equals to 0.12 mm/day in Mansoura, while the evapotranspiration values increase southwards at the Suez Canal and Port Said zone due to high-speed wind and high temperature [22].

3. Mathematical Model
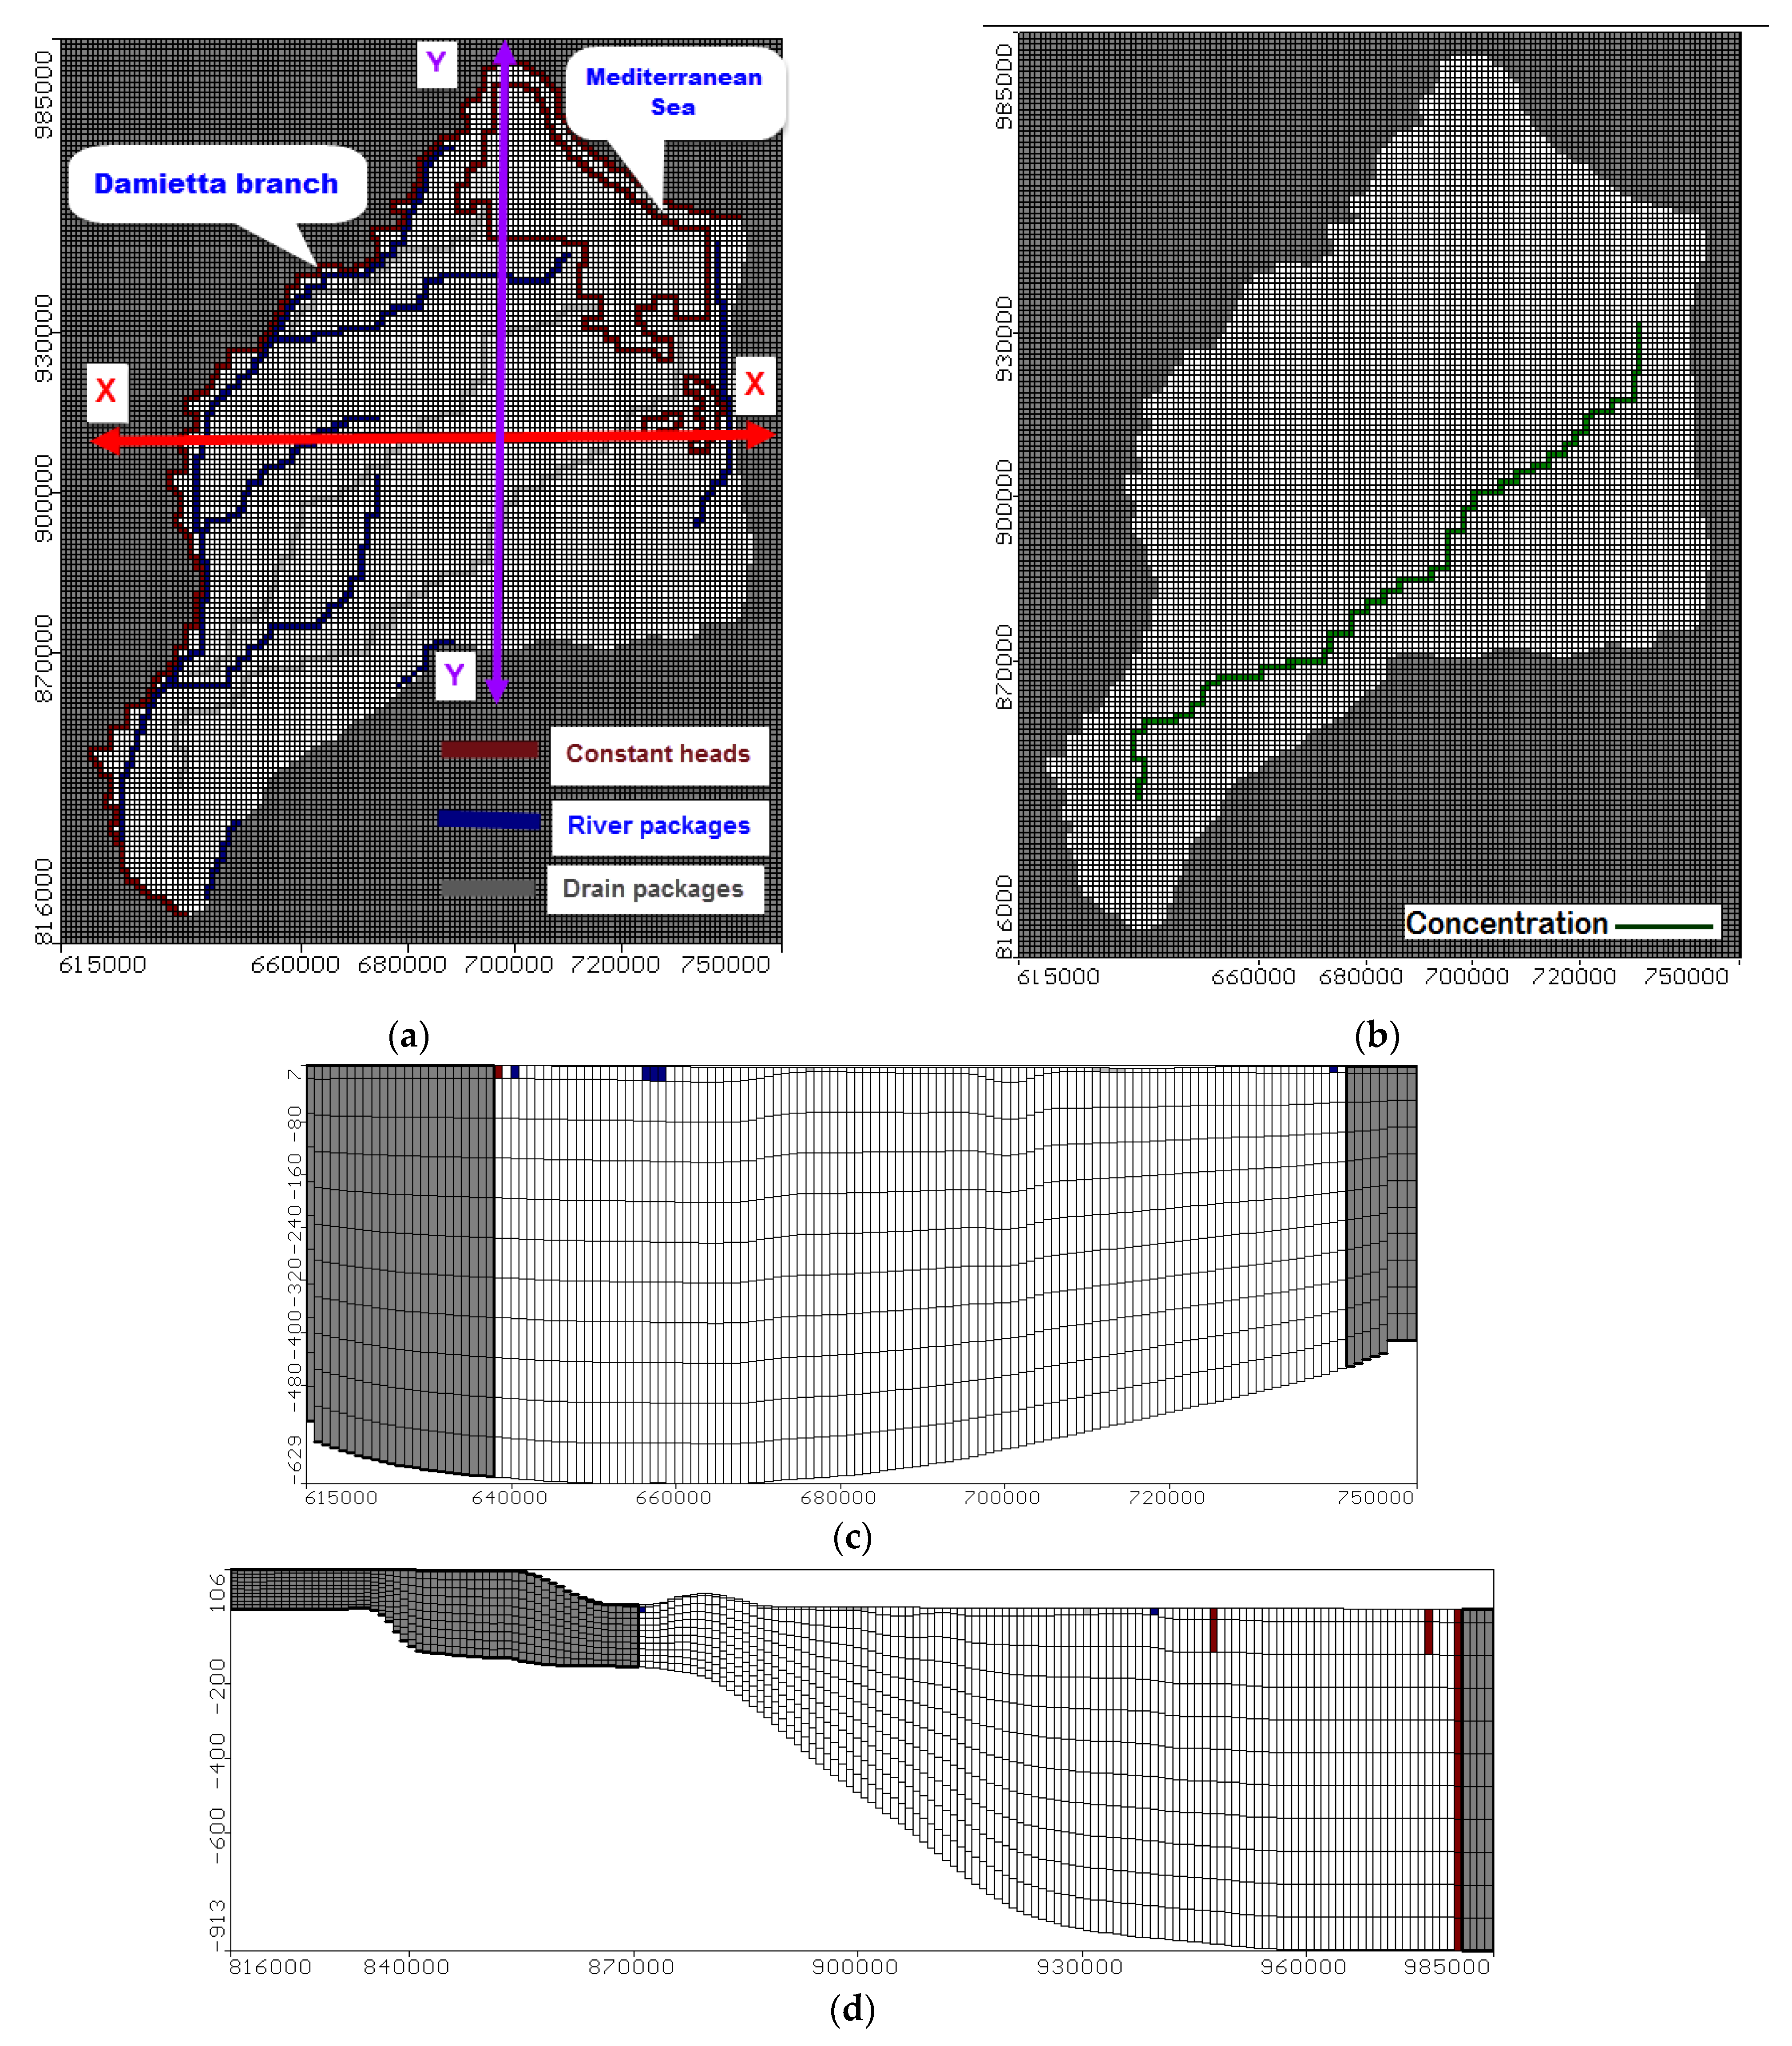
In the current study, MODFLOW (2010) is used to simulate groundwater flow and MT3DS is used to simulate the solute transport in the ENDA. A groundwater mathematical model of constant density through porous earth material can be described by a partial differential equation [34]:
x ( K x x h x ) + y ( K y y h y ) + z ( K z z h z ) + W = S S h t ,
where h(x, y, z, t) is the potentiometric head (L); Kxx(x, y, z), Kyy(x, y, z), and Kzz(x, y, z) are values of hydraulic conductivity (LT−1); W(x, y, z, t) is the volumetric flux per unit volume (T−1); Ss(x, y, z) is the specific storage of the porous material (L−1); and t is the time (T). The initial condition describes the potentiometric head h(x, y, z) in time t = 0 in an aquifer system. Boundary conditions specify flow and/or potentiometric head at the boundaries of the aquifer system (see Table 1 and Section 3.2). To solve the problem of groundwater flow, a finite difference method is used in MODFLOW.
MT3DS uses the following partial differential equation of an unknown function for the concentration, C, of contaminants dissolved in groundwater (ML−3) [35]:
c t = x i ( D i j c x j ) x i ( V i C ) + q S θ C S + K 1 N R K ,
where Dij is the hydrodynamic dispersion coefficient (L2T−1), Vi is the seepage or direction x (LT−1) calculated in groundwater flow problems, qS is the volumetric flux of water, θ is the porosity of the porous medium (-), C is the concentration of contaminants dissolved in groundwater (ML−3), CS is the concentration of contaminants dissolved in the volumetric flux of water, and Rk is the rate of solute production in reaction K of N different reactions (ML−3T−1). The initial condition describes the concentration C(x, y, z, 0) of contaminants dissolved in groundwater at time t = 0 in an aquifer system. Boundary conditions specify contaminant flux and/or concentration of contaminants dissolved in groundwater at the boundaries of the aquifer system.

3.1. Model Geometry

The numerical domain of the ENDA was carried out using a mesh of 175 rows and 135 columns with a cell area of 1 km2, as presented in Figure 2a. This domain was divided into eleven layers, as presented in Figure 2c,d, in which the first layer represented the clay cap with thickness ranging from 20 m in the south to 50 m in the north, while the other layers were divided by equal thicknesses to represent the actual aquifer. Moreover, Layers 2–5 were simulated to represent fine sand with lenses of clay type, Layers 6–9 represented coarse sand for quaternary properties, and Layers 10 and 11 represented graded sand and gravel type.

3.2. Model Boundary Conditions

The ENDA has three types of boundary conditions. The first boundary condition is the constant head which represents sea level with a value of zero; the second boundary condition is the river boundary which represents the main water bodies of the main system of canals; the third boundary condition is the drain boundary which represents the main system of drains (presented in Table 1). Figure 2a shows the head boundary condition for the ENDA domain. The concentration with constant ranges from 4971 to 5010 mg/L is assigned along the Bahr El Baqar drain length, as presented in Figure 2b.

3.3. Hydraulic Parameters

The hydraulic parameters were assigned based on previous studies and calculations, as presented in Table 2 [37]. These parameters include specific storage (SS), specific yield (Sy), effective porosity (neff), and hydraulic conductivity (K) in x, y, and z. The recharge values in the ENDA vary from one location to another; the maximum recorded recharge is 0.80 mm/day, while the minimum recorded rate is 0.25 mm/day [38,39]. The Eastern Nile Delta has a high density of wells with a total abstraction rate of 3.48 Mm3/day. Figure 5b presents the distribution of abstraction wells in the ENDA.

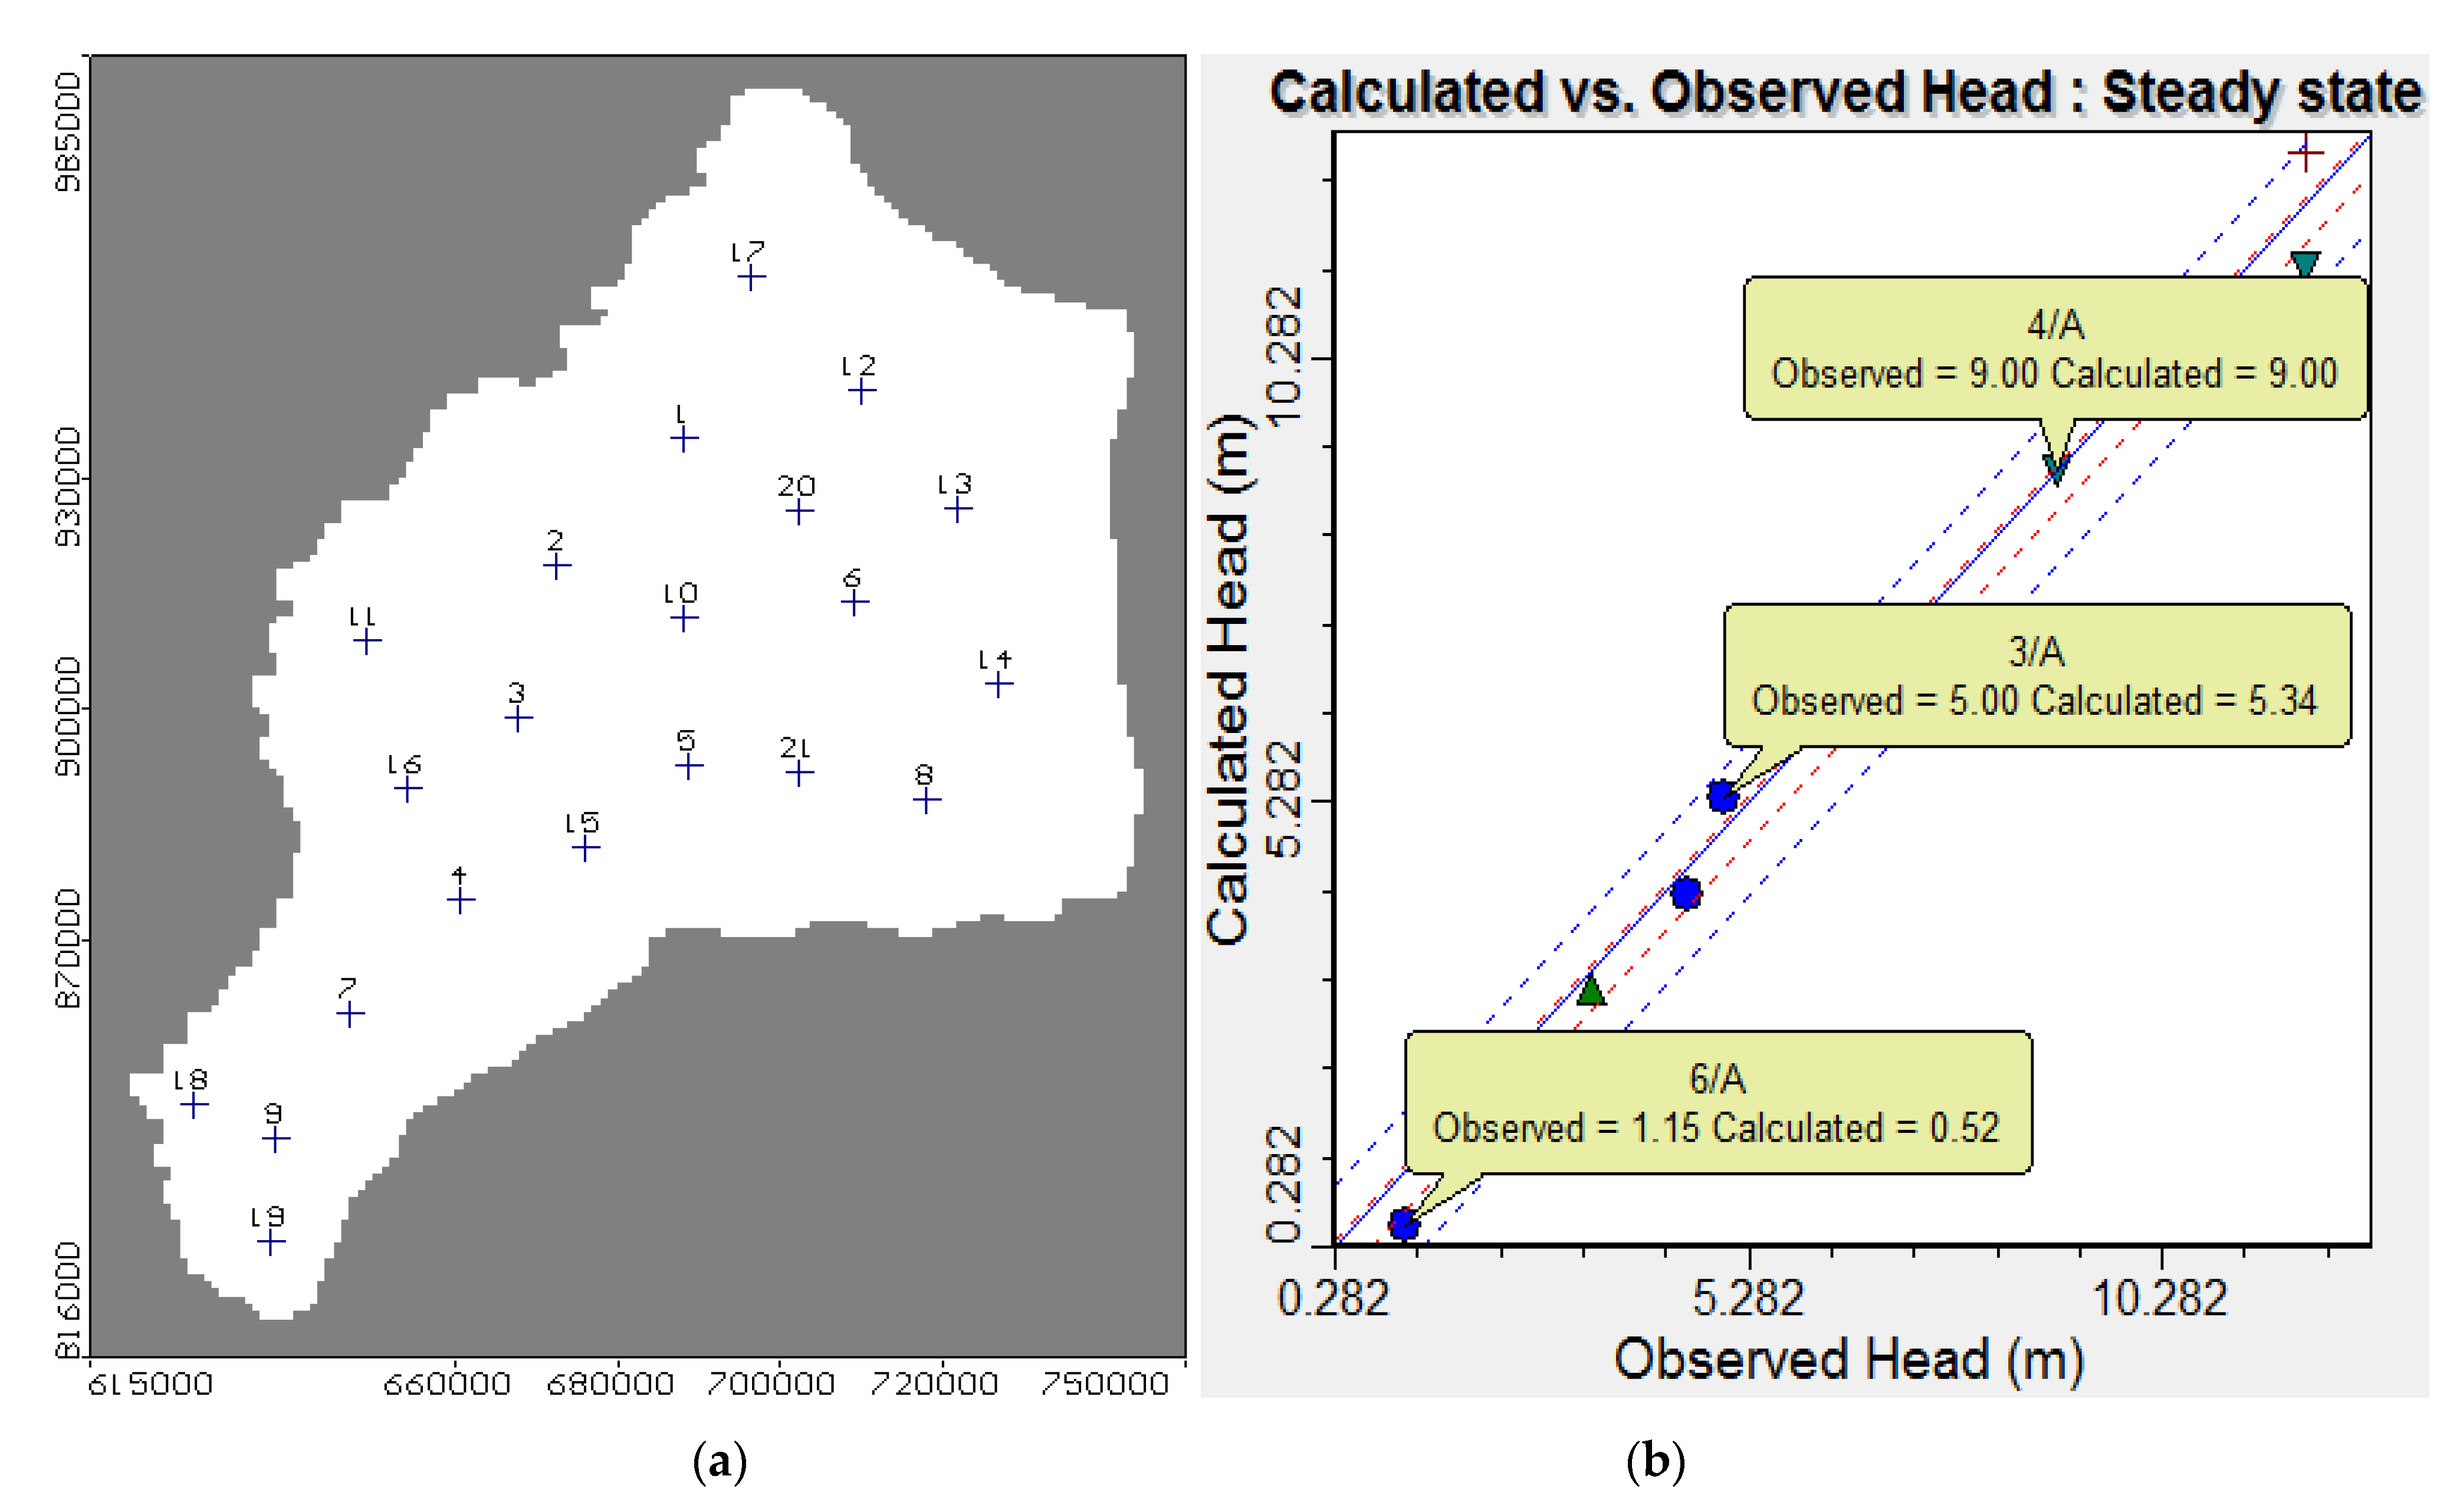
3.4. Model Calibration

Calibration of the model was done using 21 observation wells distributed in the ENDA domain based on field data, as presented in Figure 3a. The calibration was developed by trial and error to match between the calculated head by MODFLOW and the observed head using the piezometric map which was developed by Morsy in 2009 [28]. Figure 3b represents a comparison between the calculated and observed field data in which the residual values ranged from 0.002 to −0.69 m with a root mean square (RMS) of 0.382 m and a normalized RMS of 2.495%. From these results, the model provided good agreement between the calculated and observed data, and therefore the results were satisfactory. The calculated total inflow and outflow reached 4,910,400 m3/day, while the validation target achieved was 0.0002% less than 1.00% of the total inflow. The total inflow was 4,910,300 m3/day and the total outflow was 4,910,400 m3/day with a net flow of 100 m3/day, which indicated that the discrepancy percentage was zero.

4. Model Results

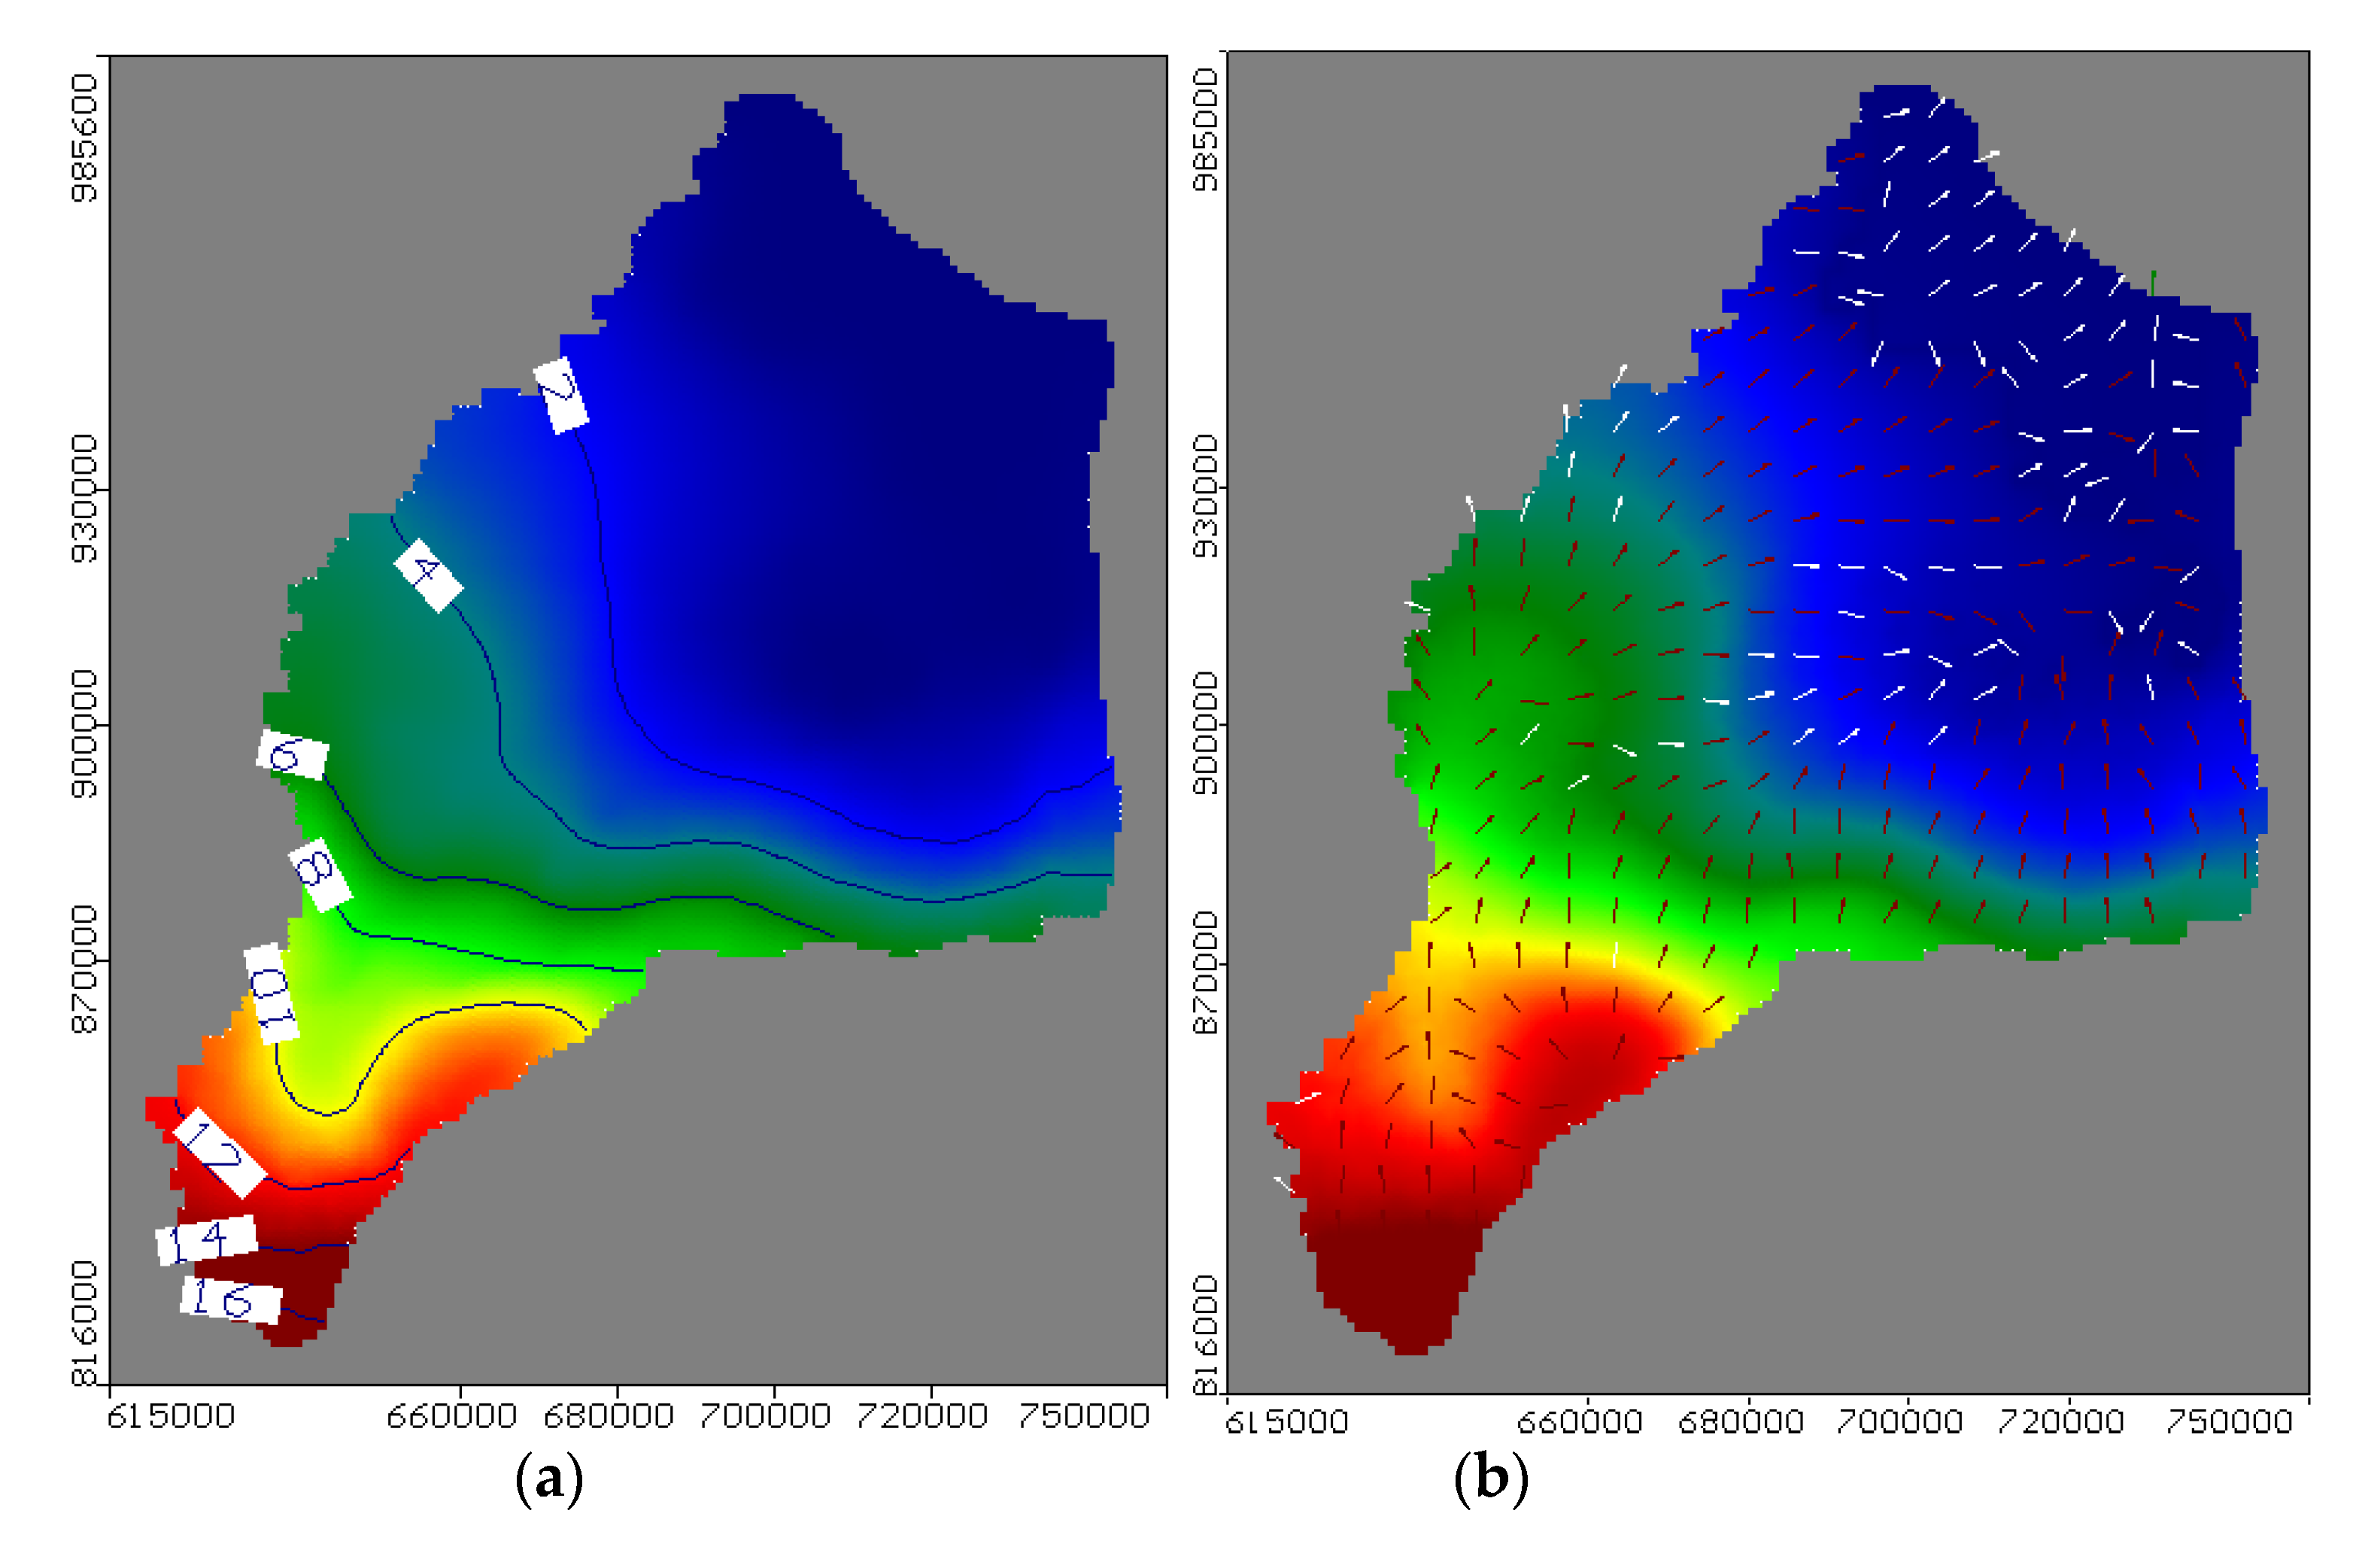
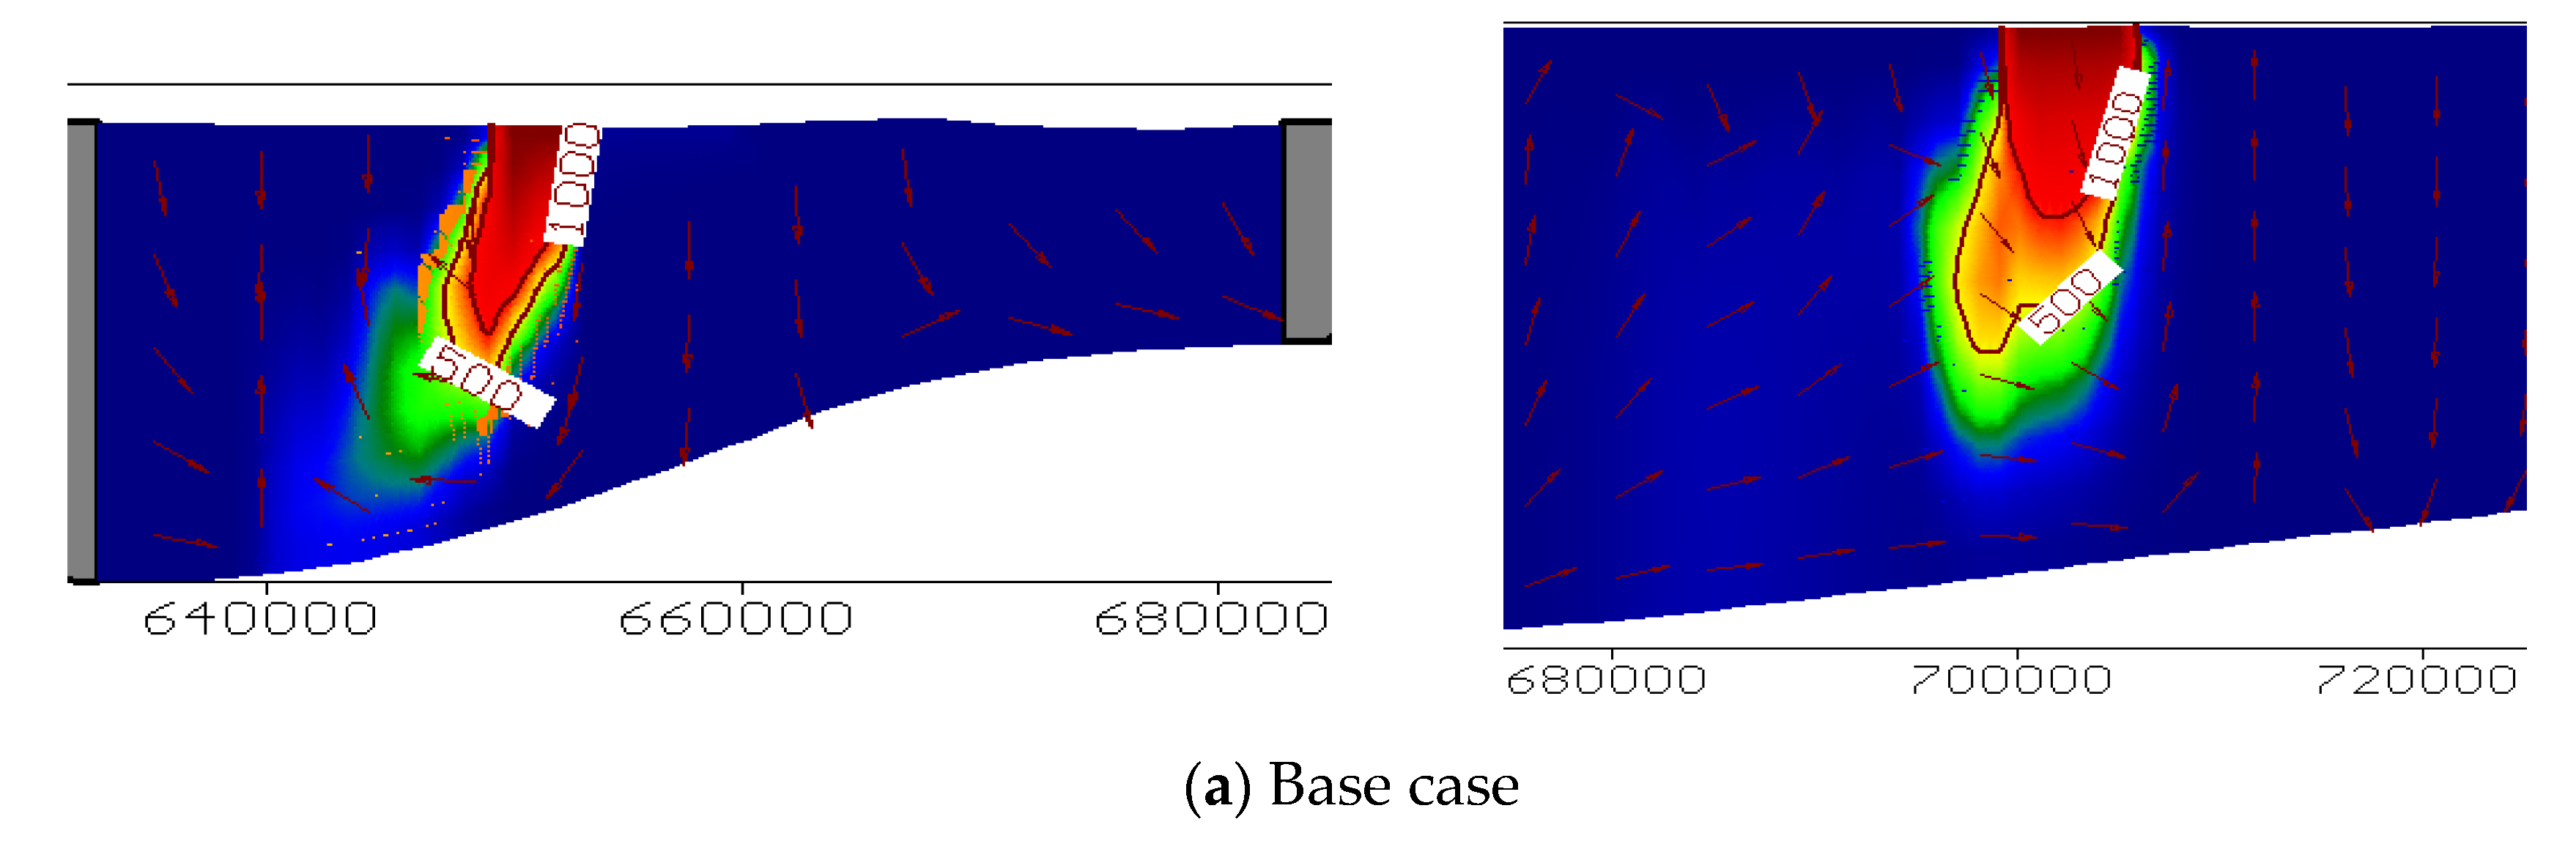
4.1. Groundwater Flow in the ENDA

The calibrated model for the ENDA indicates that the groundwater levels reached 16 m in the south of Cairo, deceased toward the north, and finally reached 0 m. Figure 4a presents the contour map for the groundwater heads in the ENDA. The groundwater flows from the high head at Cairo to the low head at Mediterranean Sea are presented in Figure 4a,b. The minimum velocity calculated in the clay layer is 0.0007 m/day while the average velocity in the quaternary aquifer is 0.000615 m/day with a maximum velocity of 0.00053 m/day.

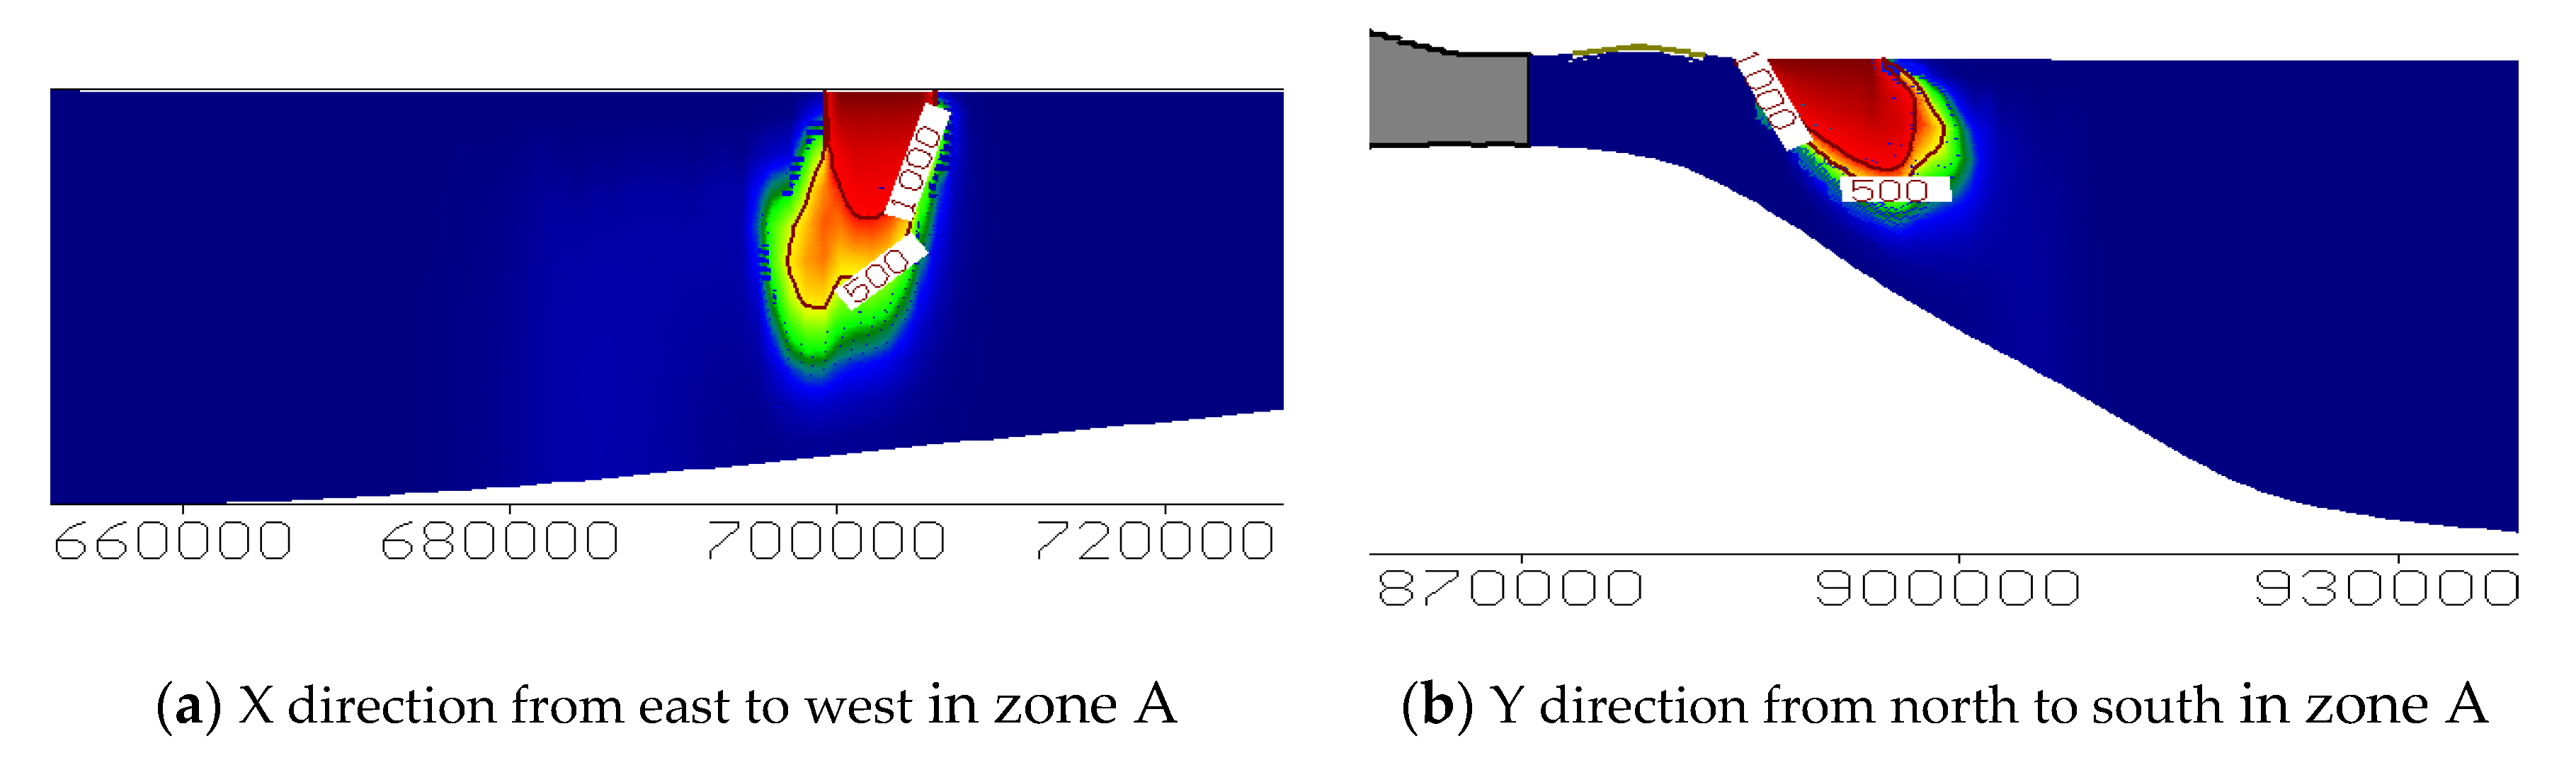
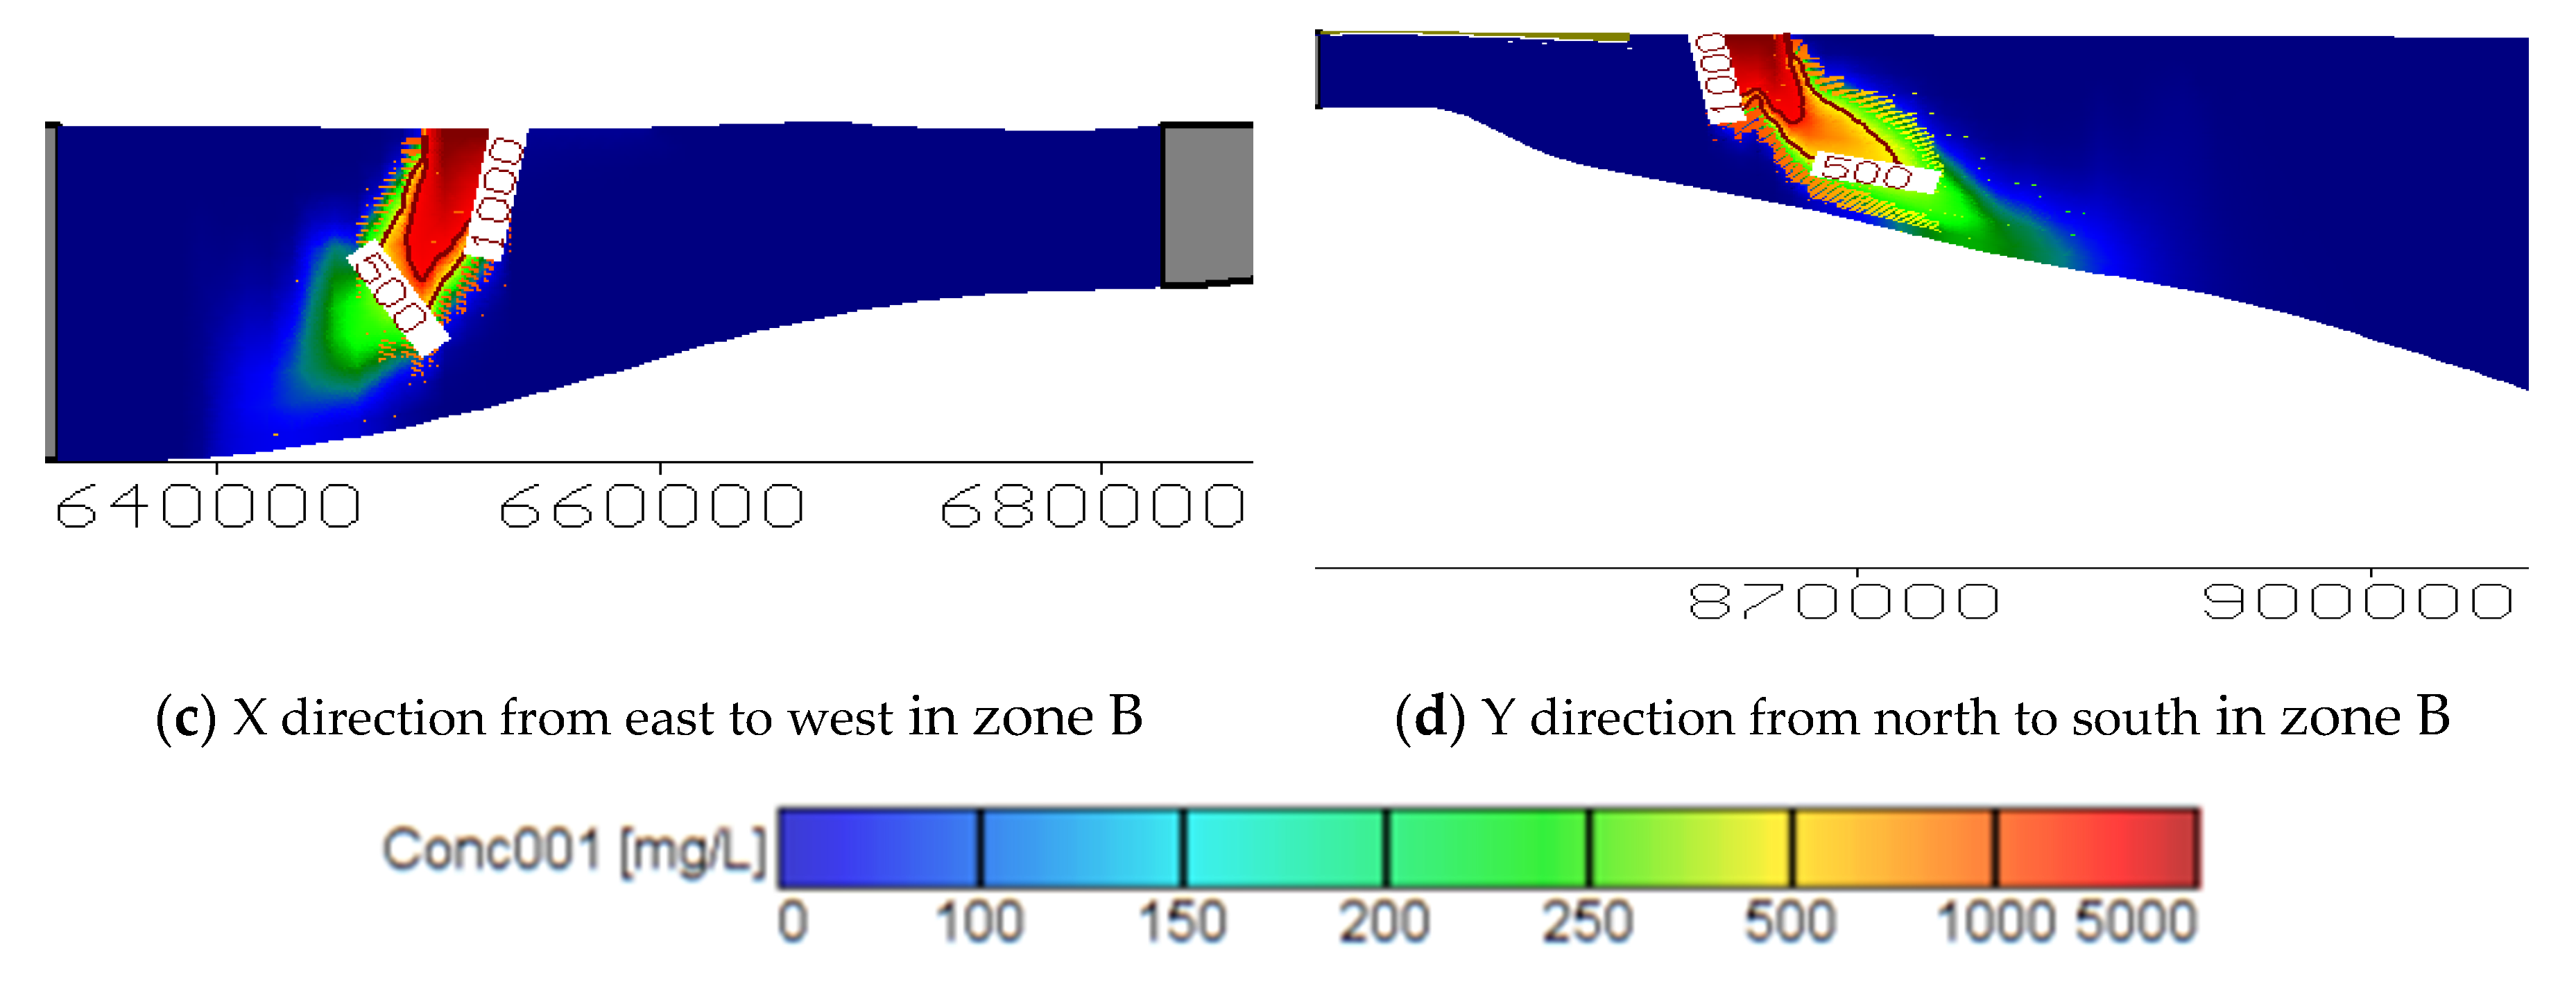
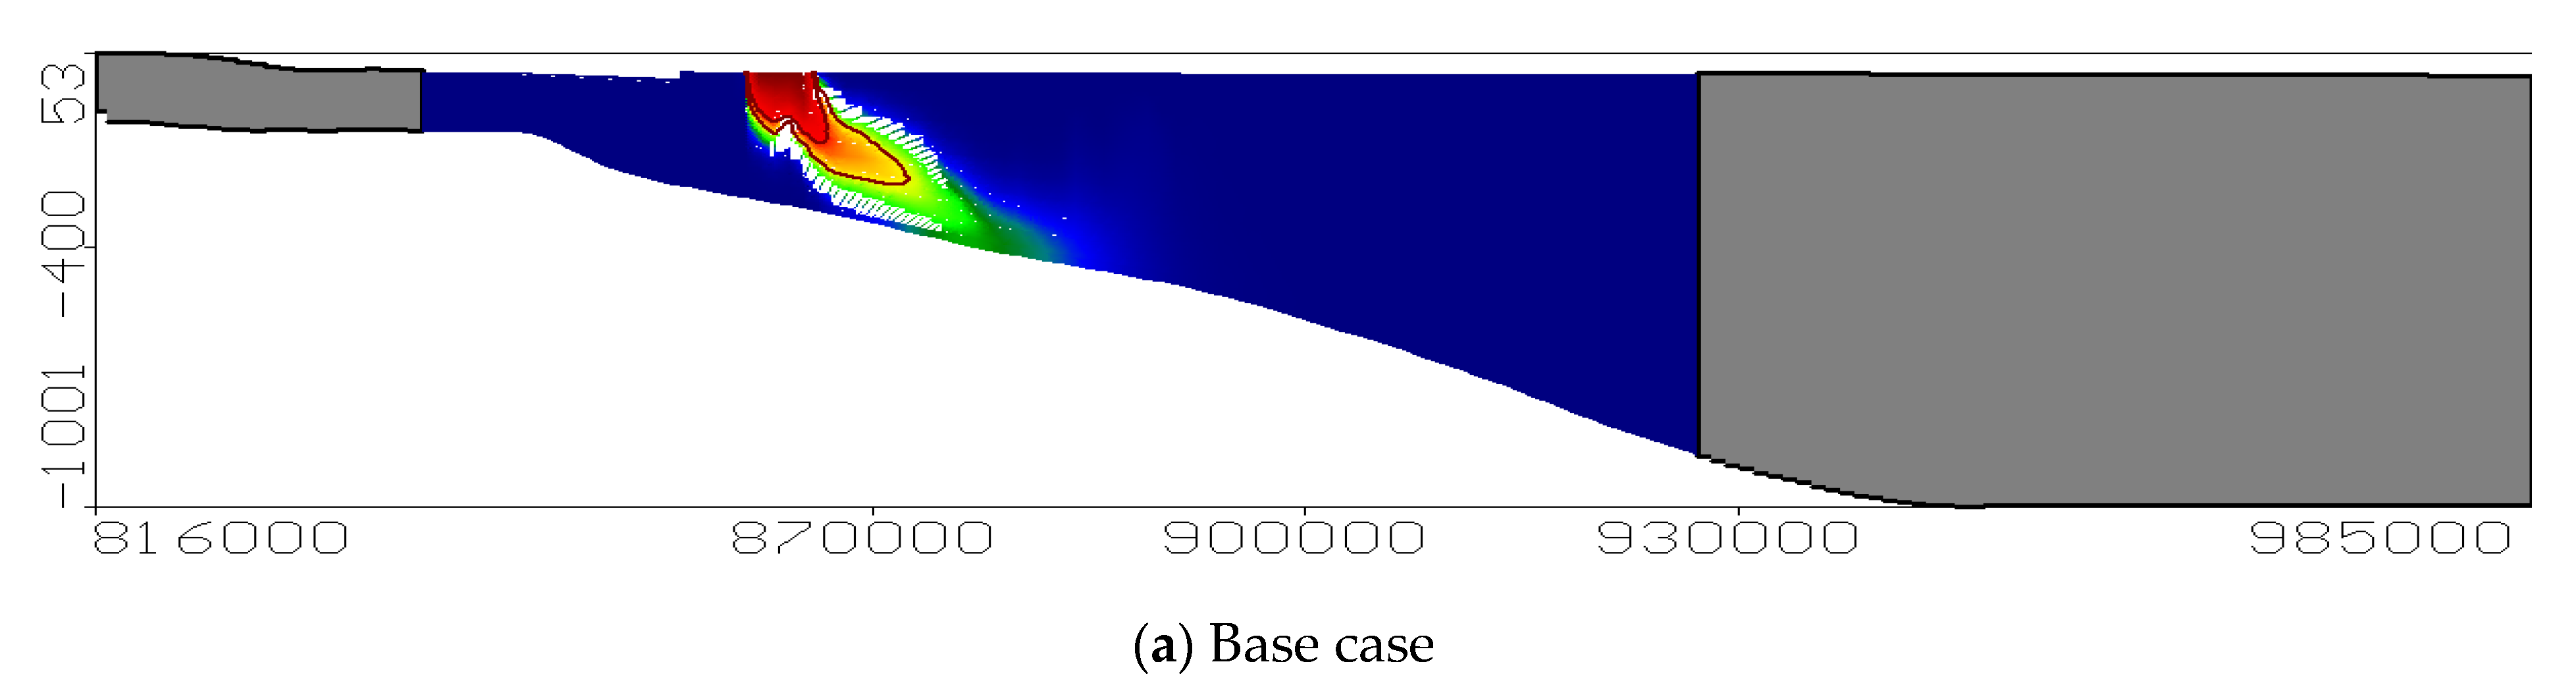
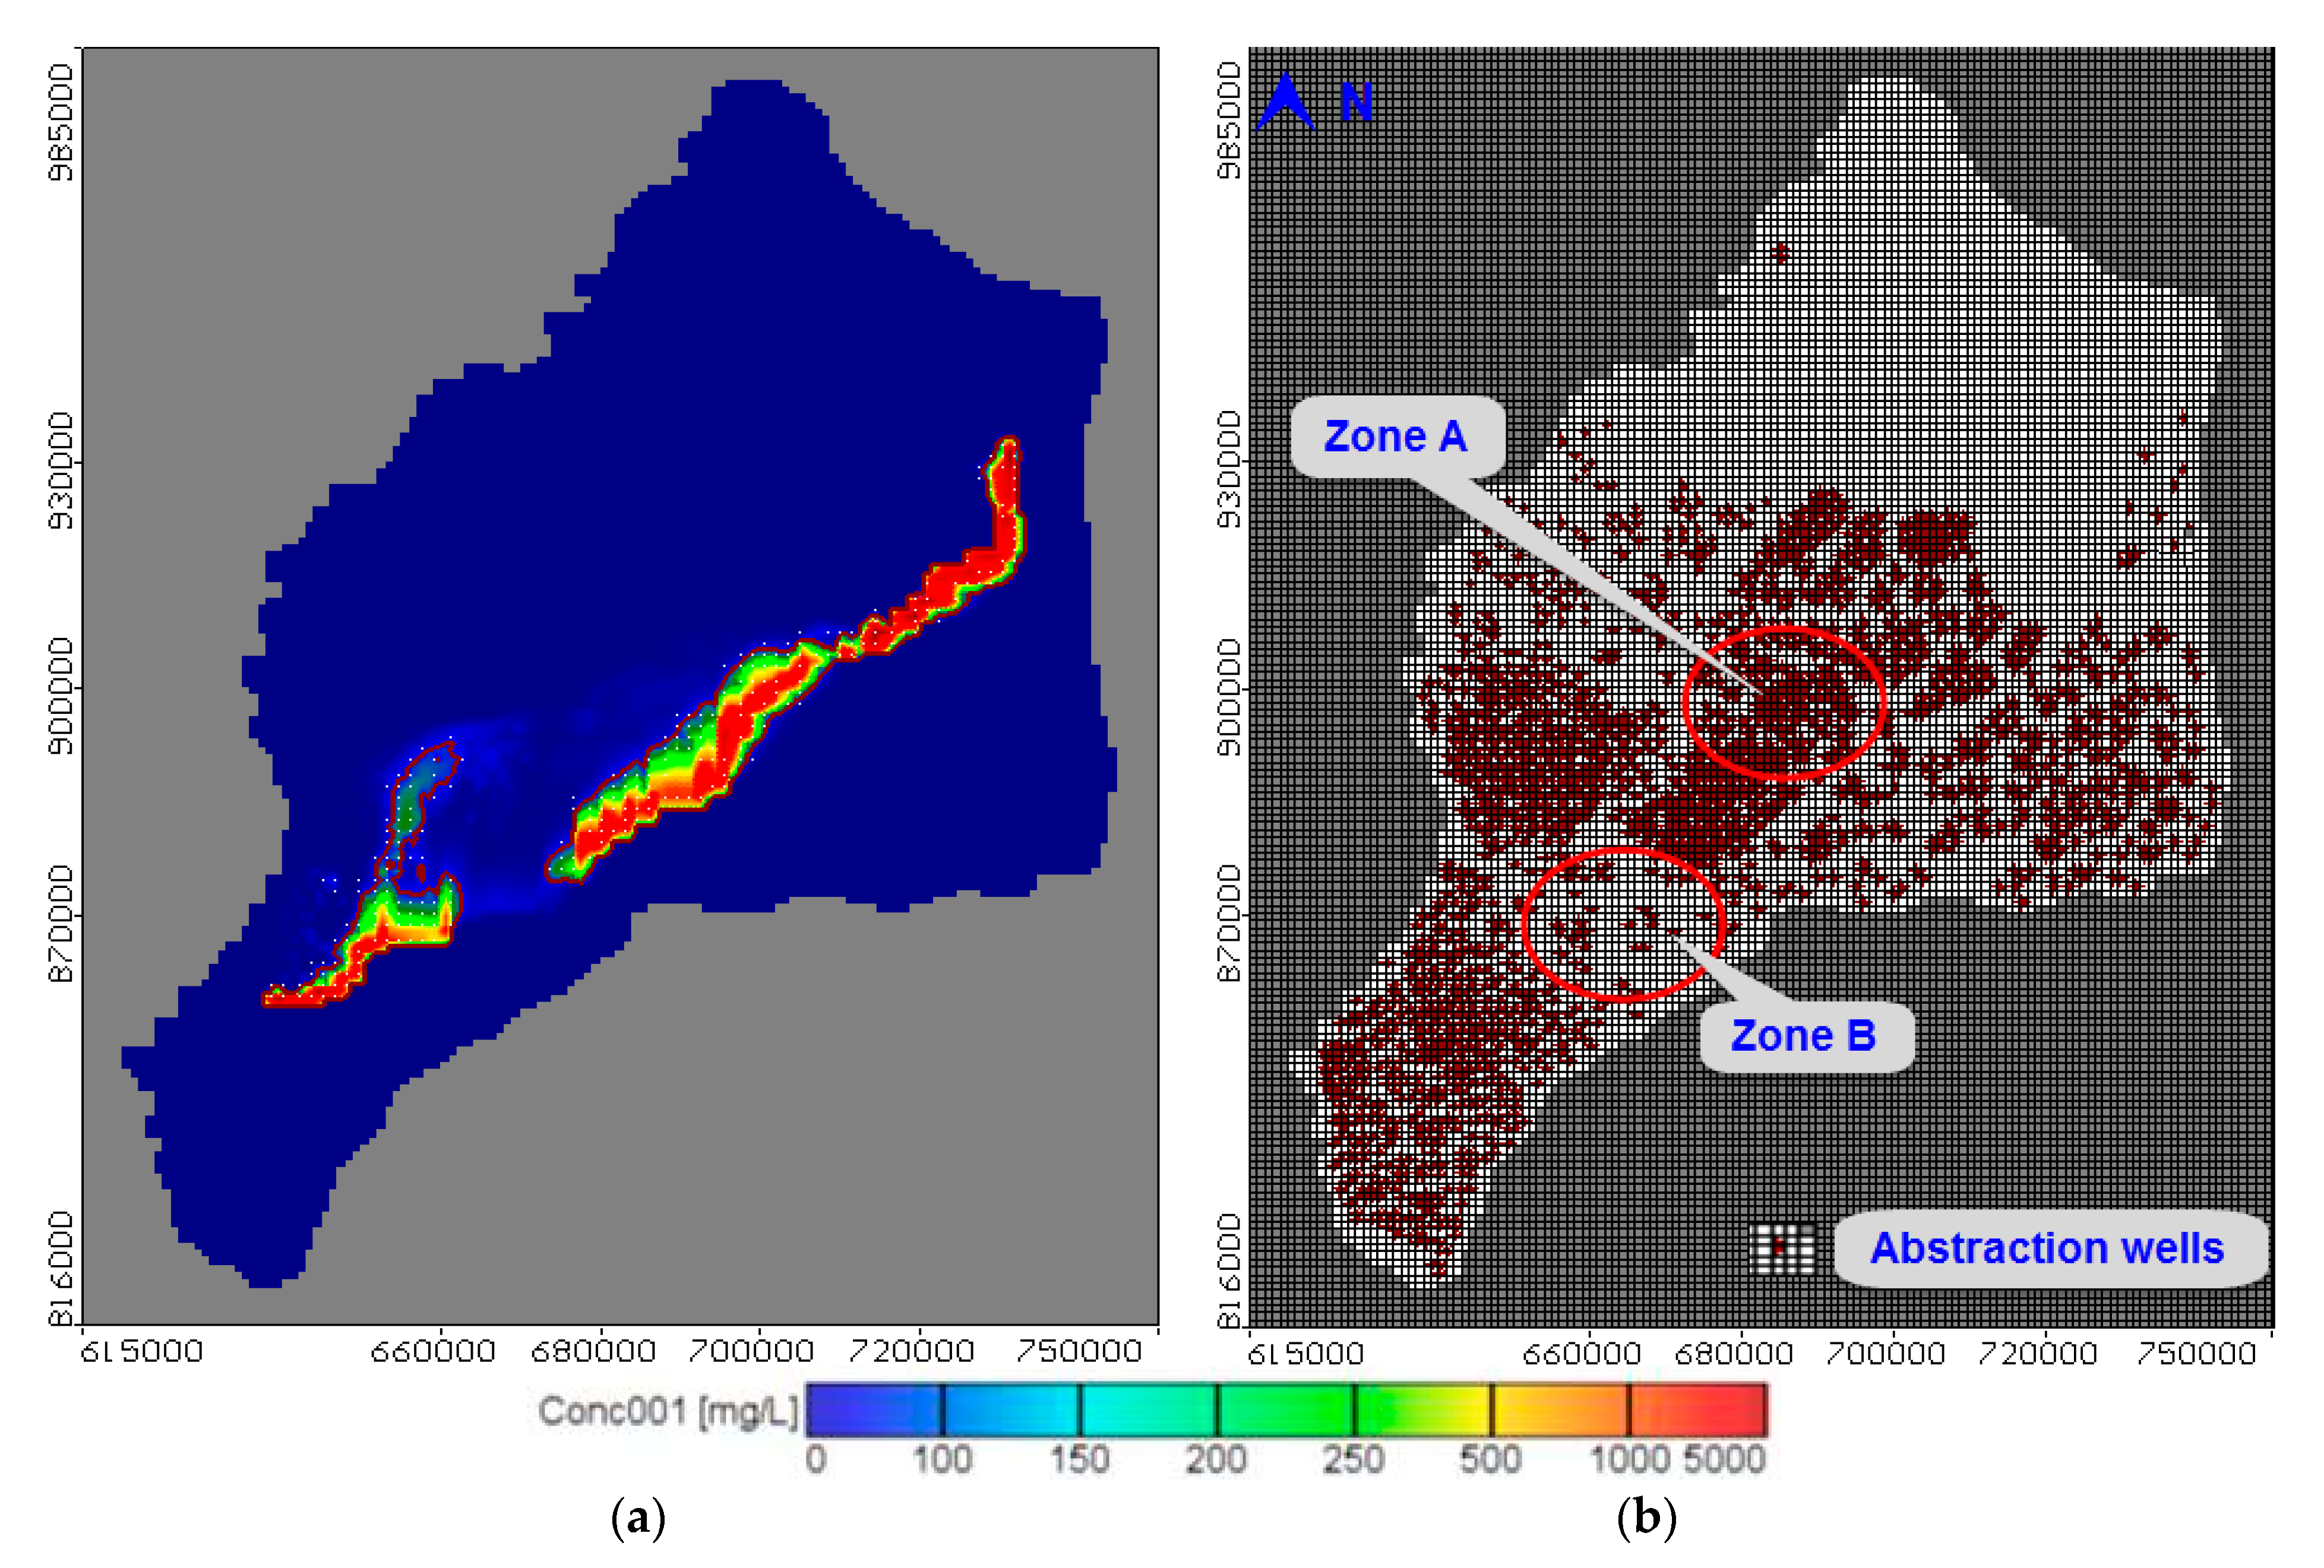
4.2. Solute Transport in the ENDA

The MT3D model is used to investigate the solute transport to the groundwater aquifer. The model results indicate that the contamination moves in the same direction as the groundwater flow. Figure 5a presents an area view of the contaminant, with total dissolved salt (TDS) in the ENDA for isochlorine 1000 ppm at Layer 4 located between 80 and 200 m below the ground surface. The simulated TDS source in and sink out in the ENDA with a total salt mass of 6.907 × 10¹⁰. Two cross-sections in the model domain are presented to investigate the impact of over pumping on the groundwater quality in the study area. The first cross-section is located in zone A which has a large number of wells with high abstraction rates, while the second cross-section is located in zone B which has a low number of wells with low abstraction rates, as presented in Figure 5b. Figure 6 presents the contaminant extension for isochlorine 1000 ppm in the X and Y directions of zone A. The results show a clear extension of contaminant into the study domain, while the results presented in zone B show a sharp impact from the drain in the aquifer.

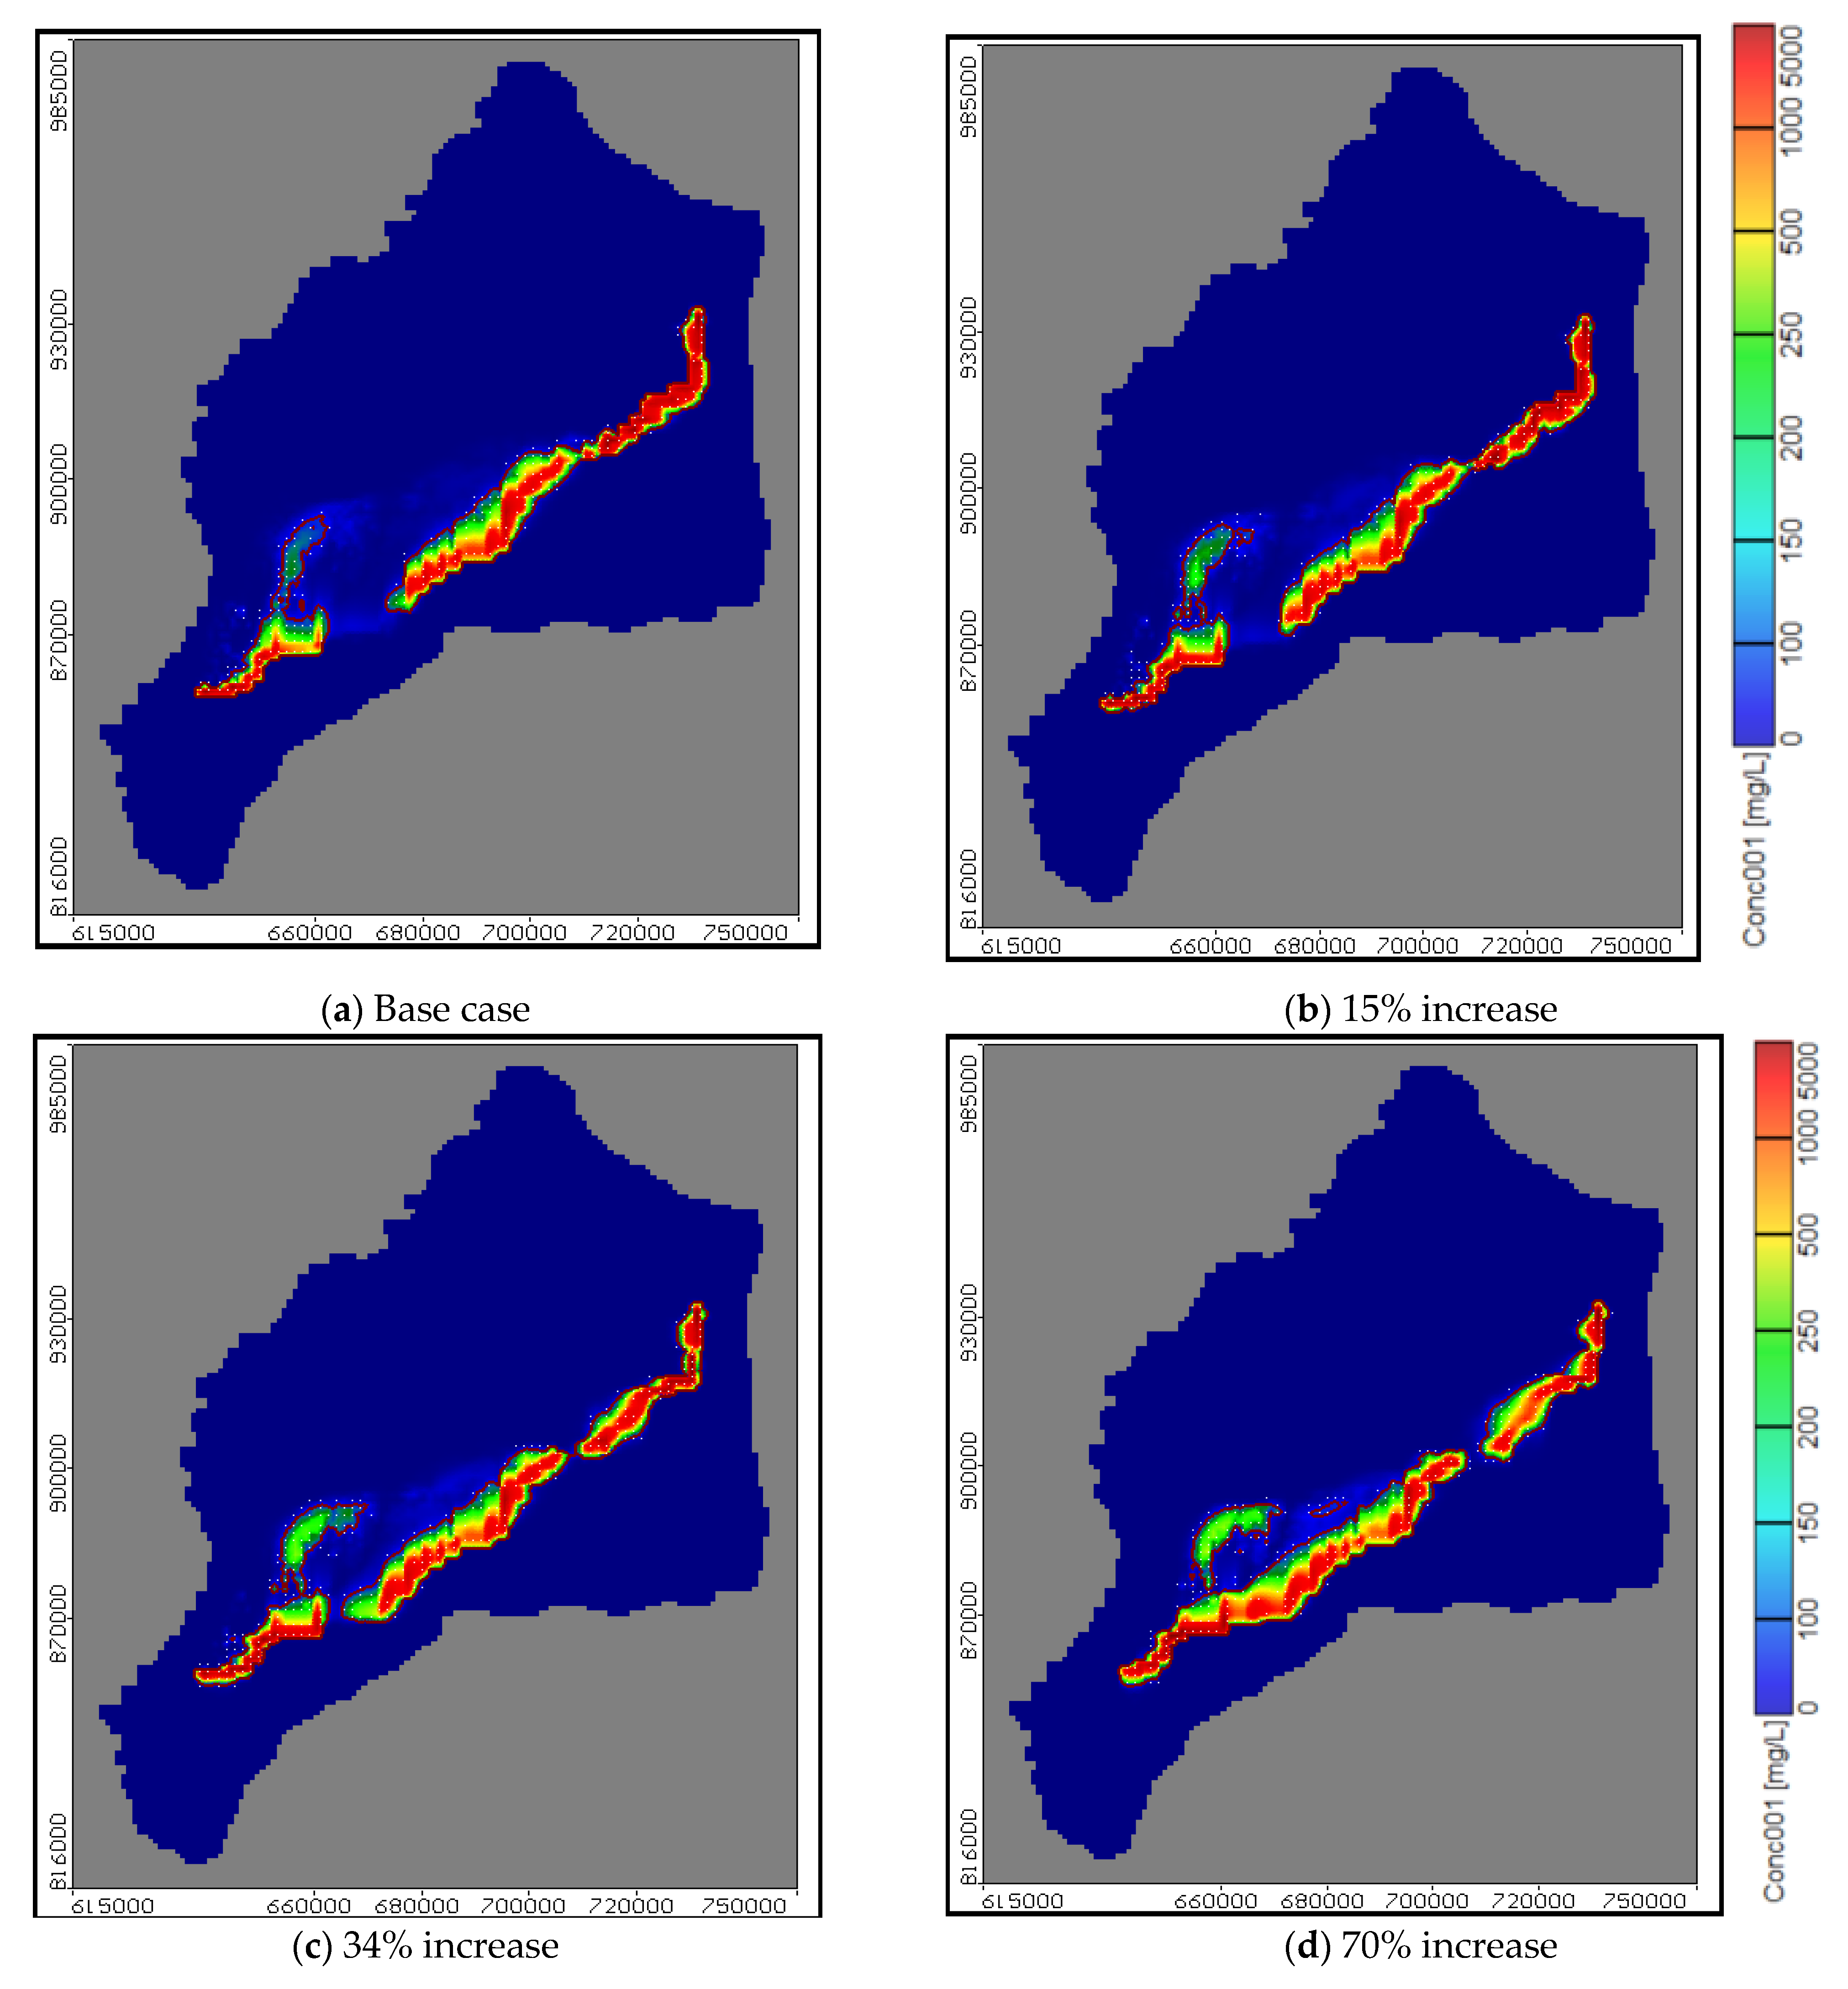
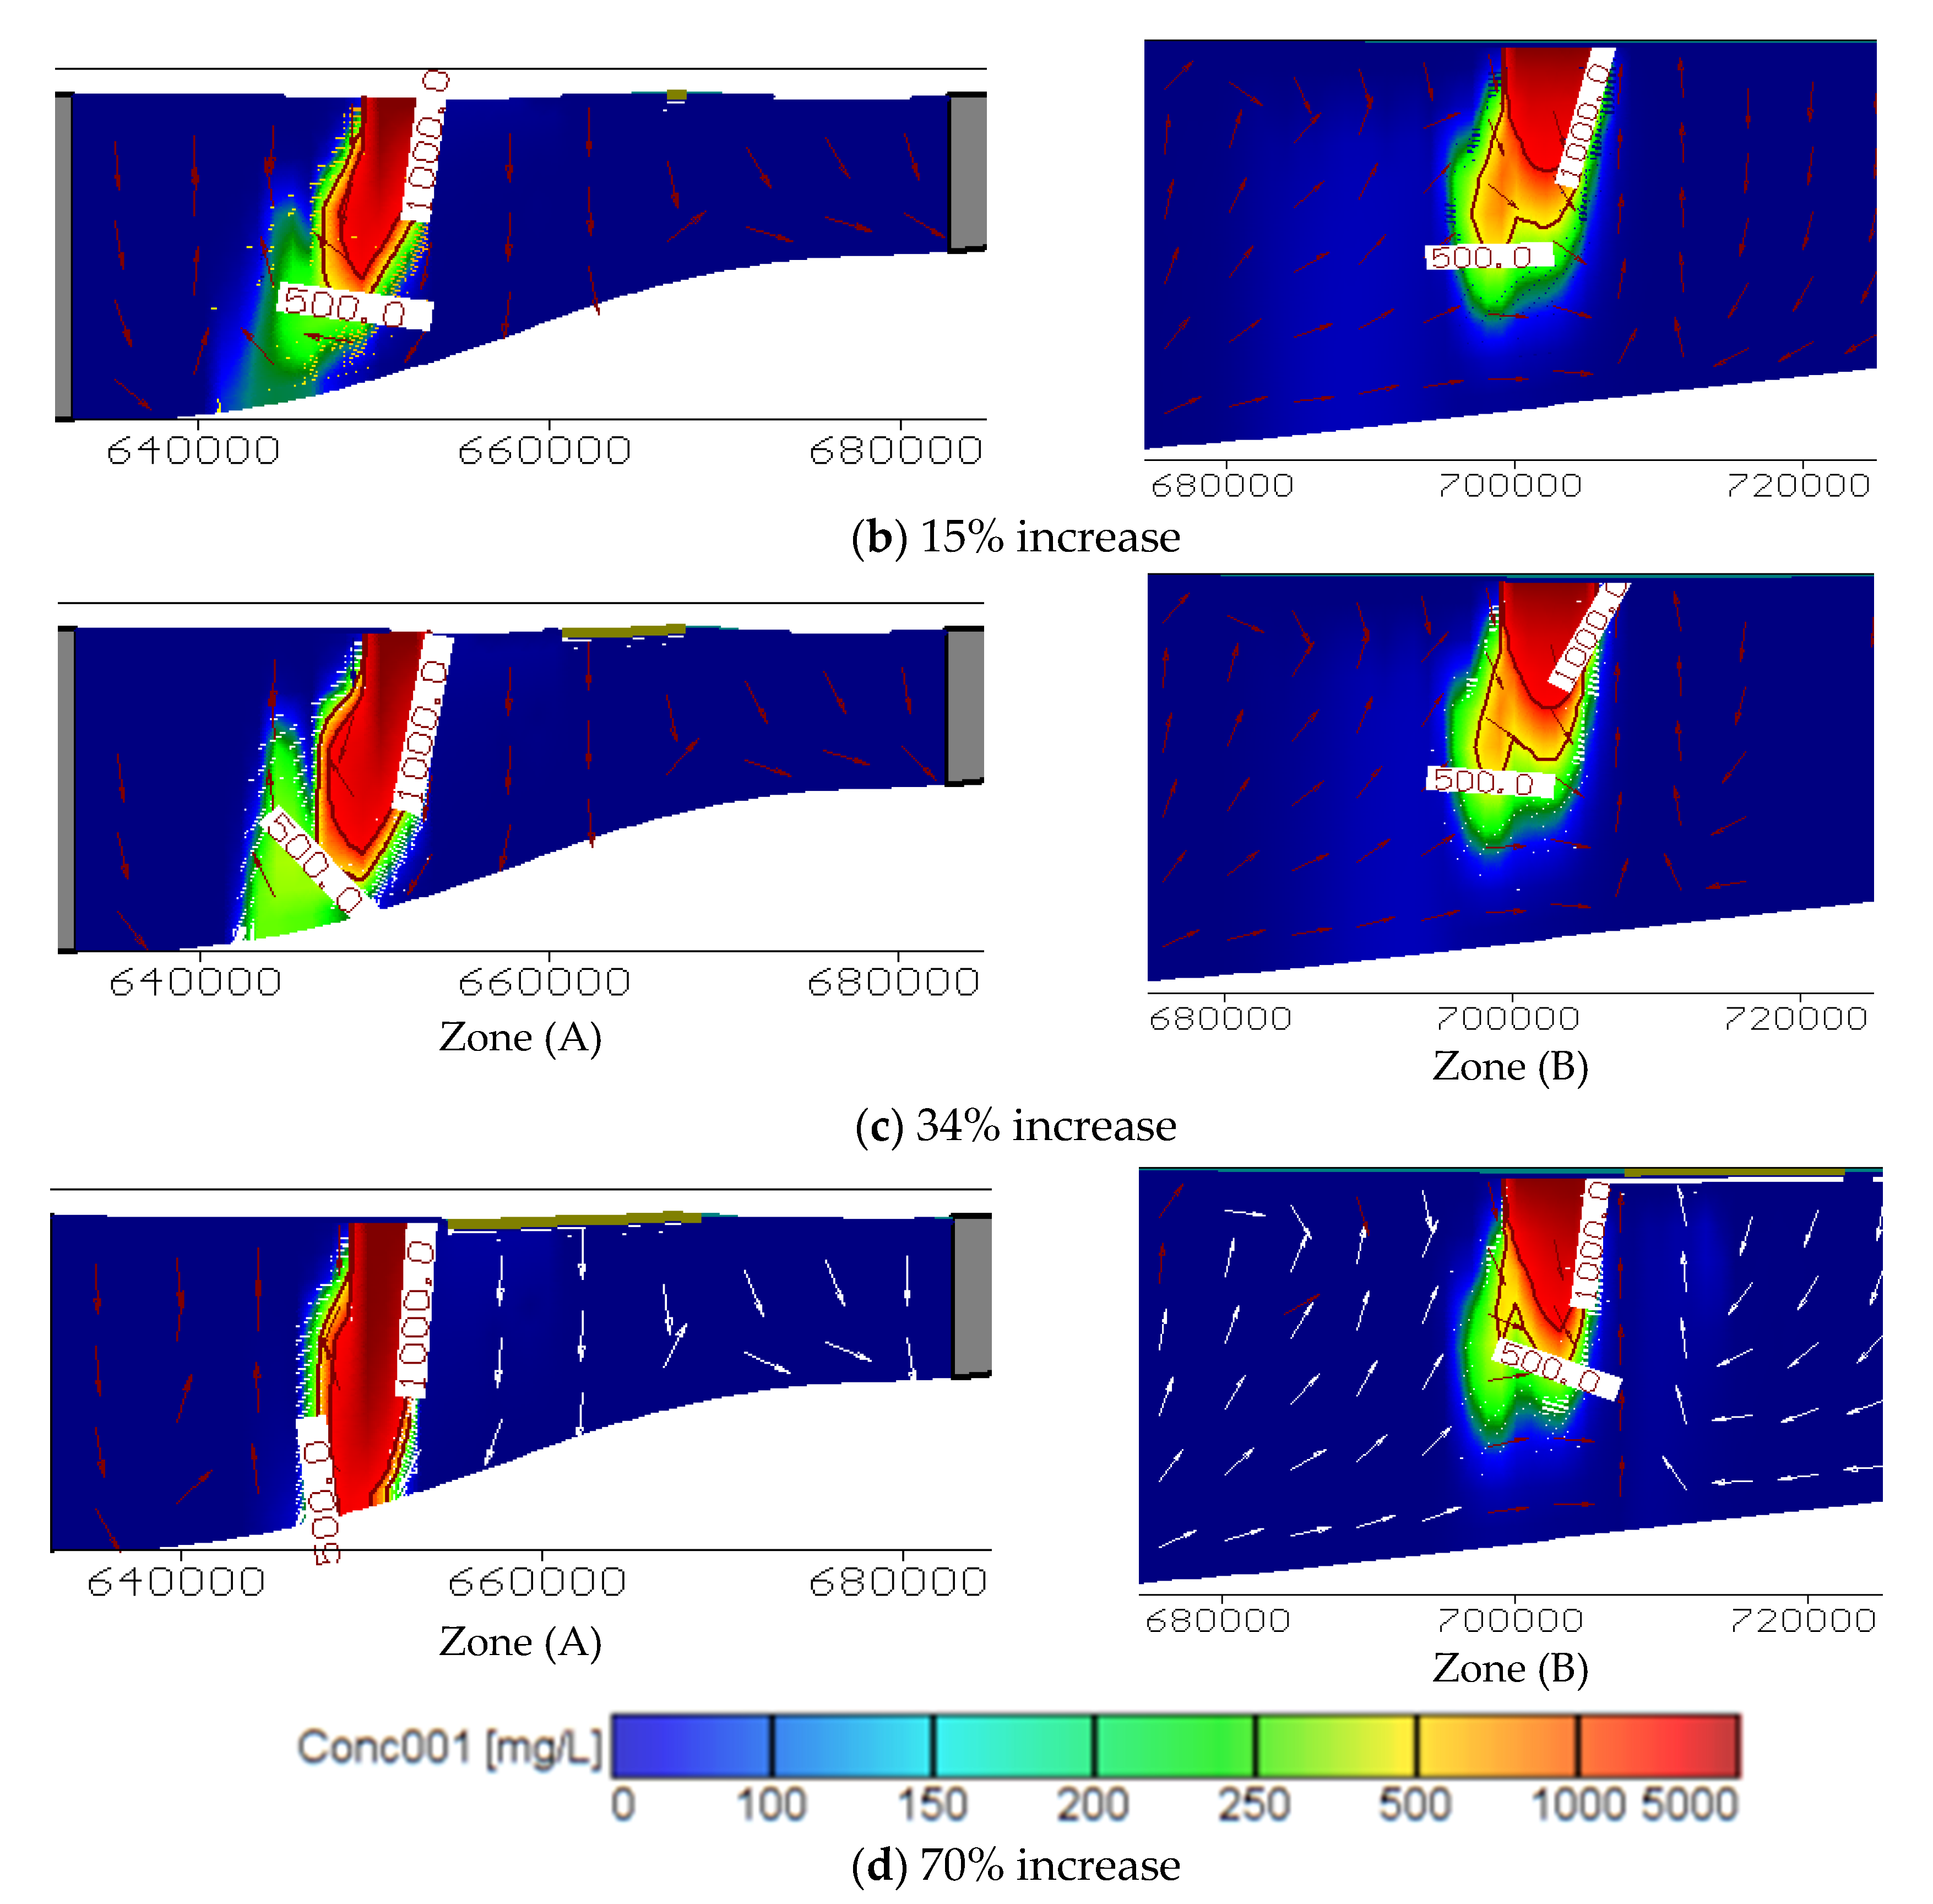
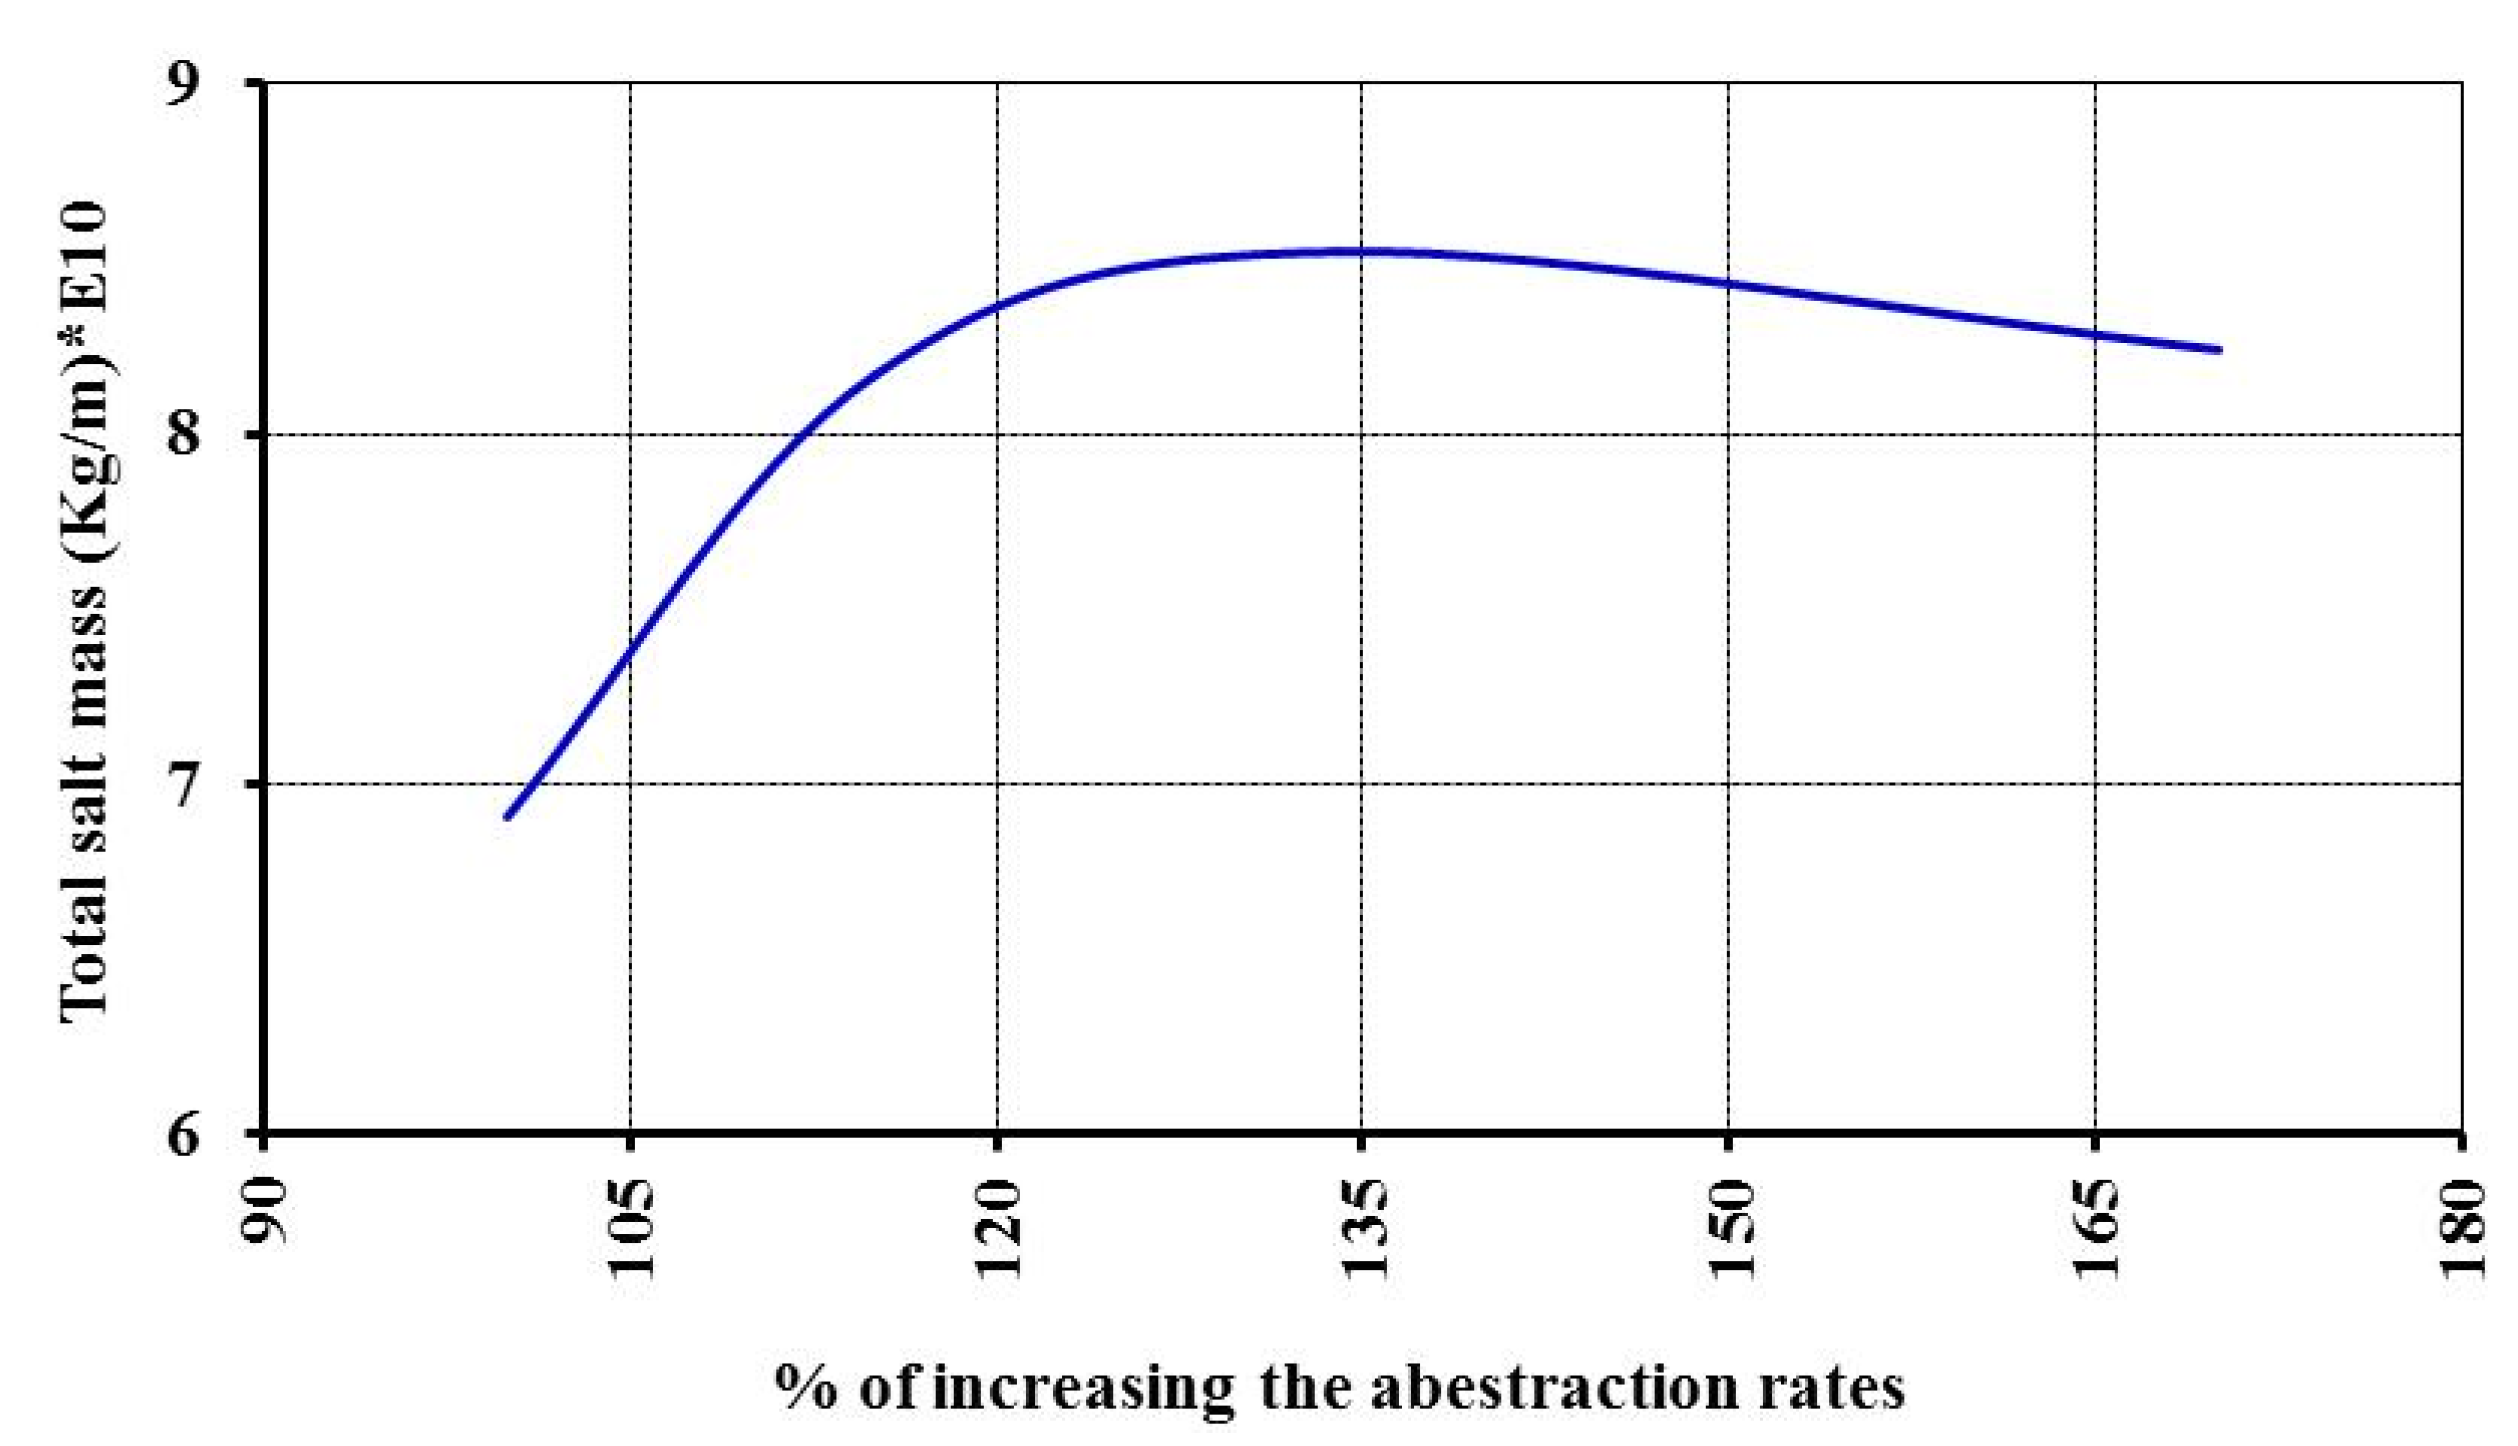
4.3. Impact of Increasing Abstraction Rates on Groundwater Quality in the ENDA

The first approach in this study aims to apply the model to investigate the impact of increasing the abstraction rate from the ENDA on the extension of contaminant from the drain bed into the aquifer. Three scenarios were applied which involved increasing the abstraction rates from the base case (100%) to 115%, 134%, and 170%. These rates were calculated based on an estimation of population growth rates in 2010, 2025, 2040, and 2060.
The results showed that the contaminant extension increased in the aquifer domain with an increase of total abstraction rates by 15% and 34% in the first and second scenarios. The maximum extension was observed in the lower part of the east ENDA where there was over pumping. In addition, the TDS values increased from 6.907 × 10¹⁰ kg in the base case to 8.165 × 10¹⁰ and 8.519 × 10¹⁰ kg in the first and second scenario.
In the third scenario, the abstraction rates were increased by 70% and the TDS was decreased to zone due to the upward flow which occurred in this case because this zone has high abstraction rates in addition to an increase in these rates by 70%. The groundwater flow velocity increased causing abstraction from the lower layers and increased the upward velocity, and over pumping led to contamination abstraction from the aquifer. In zone B, the results showed that the pollution in the study area was increased with an increase in abstraction because this zone had low abstraction rates as compared with zone A, therefore, the upward velocity was less than the velocity in zone A, and therefore the contamination was transferred from this zone to zone A and extended into the aquifer. Figure 7 shows the change in contaminant extension for an equivalent concentration line of 1000 mg/L in zones A and B for each increase in abstraction rates. Figure 8 presents a vertical distribution of TDS in zones A and B for all scenarios of abstraction in the X direction which explains the TDS increasing and deceasing in the domain vectors.
The values of TDS decreased to 8.239 × 10¹⁰ as compared with 8.519 × 10¹⁰ in the second scenario, as presented in Table 3.

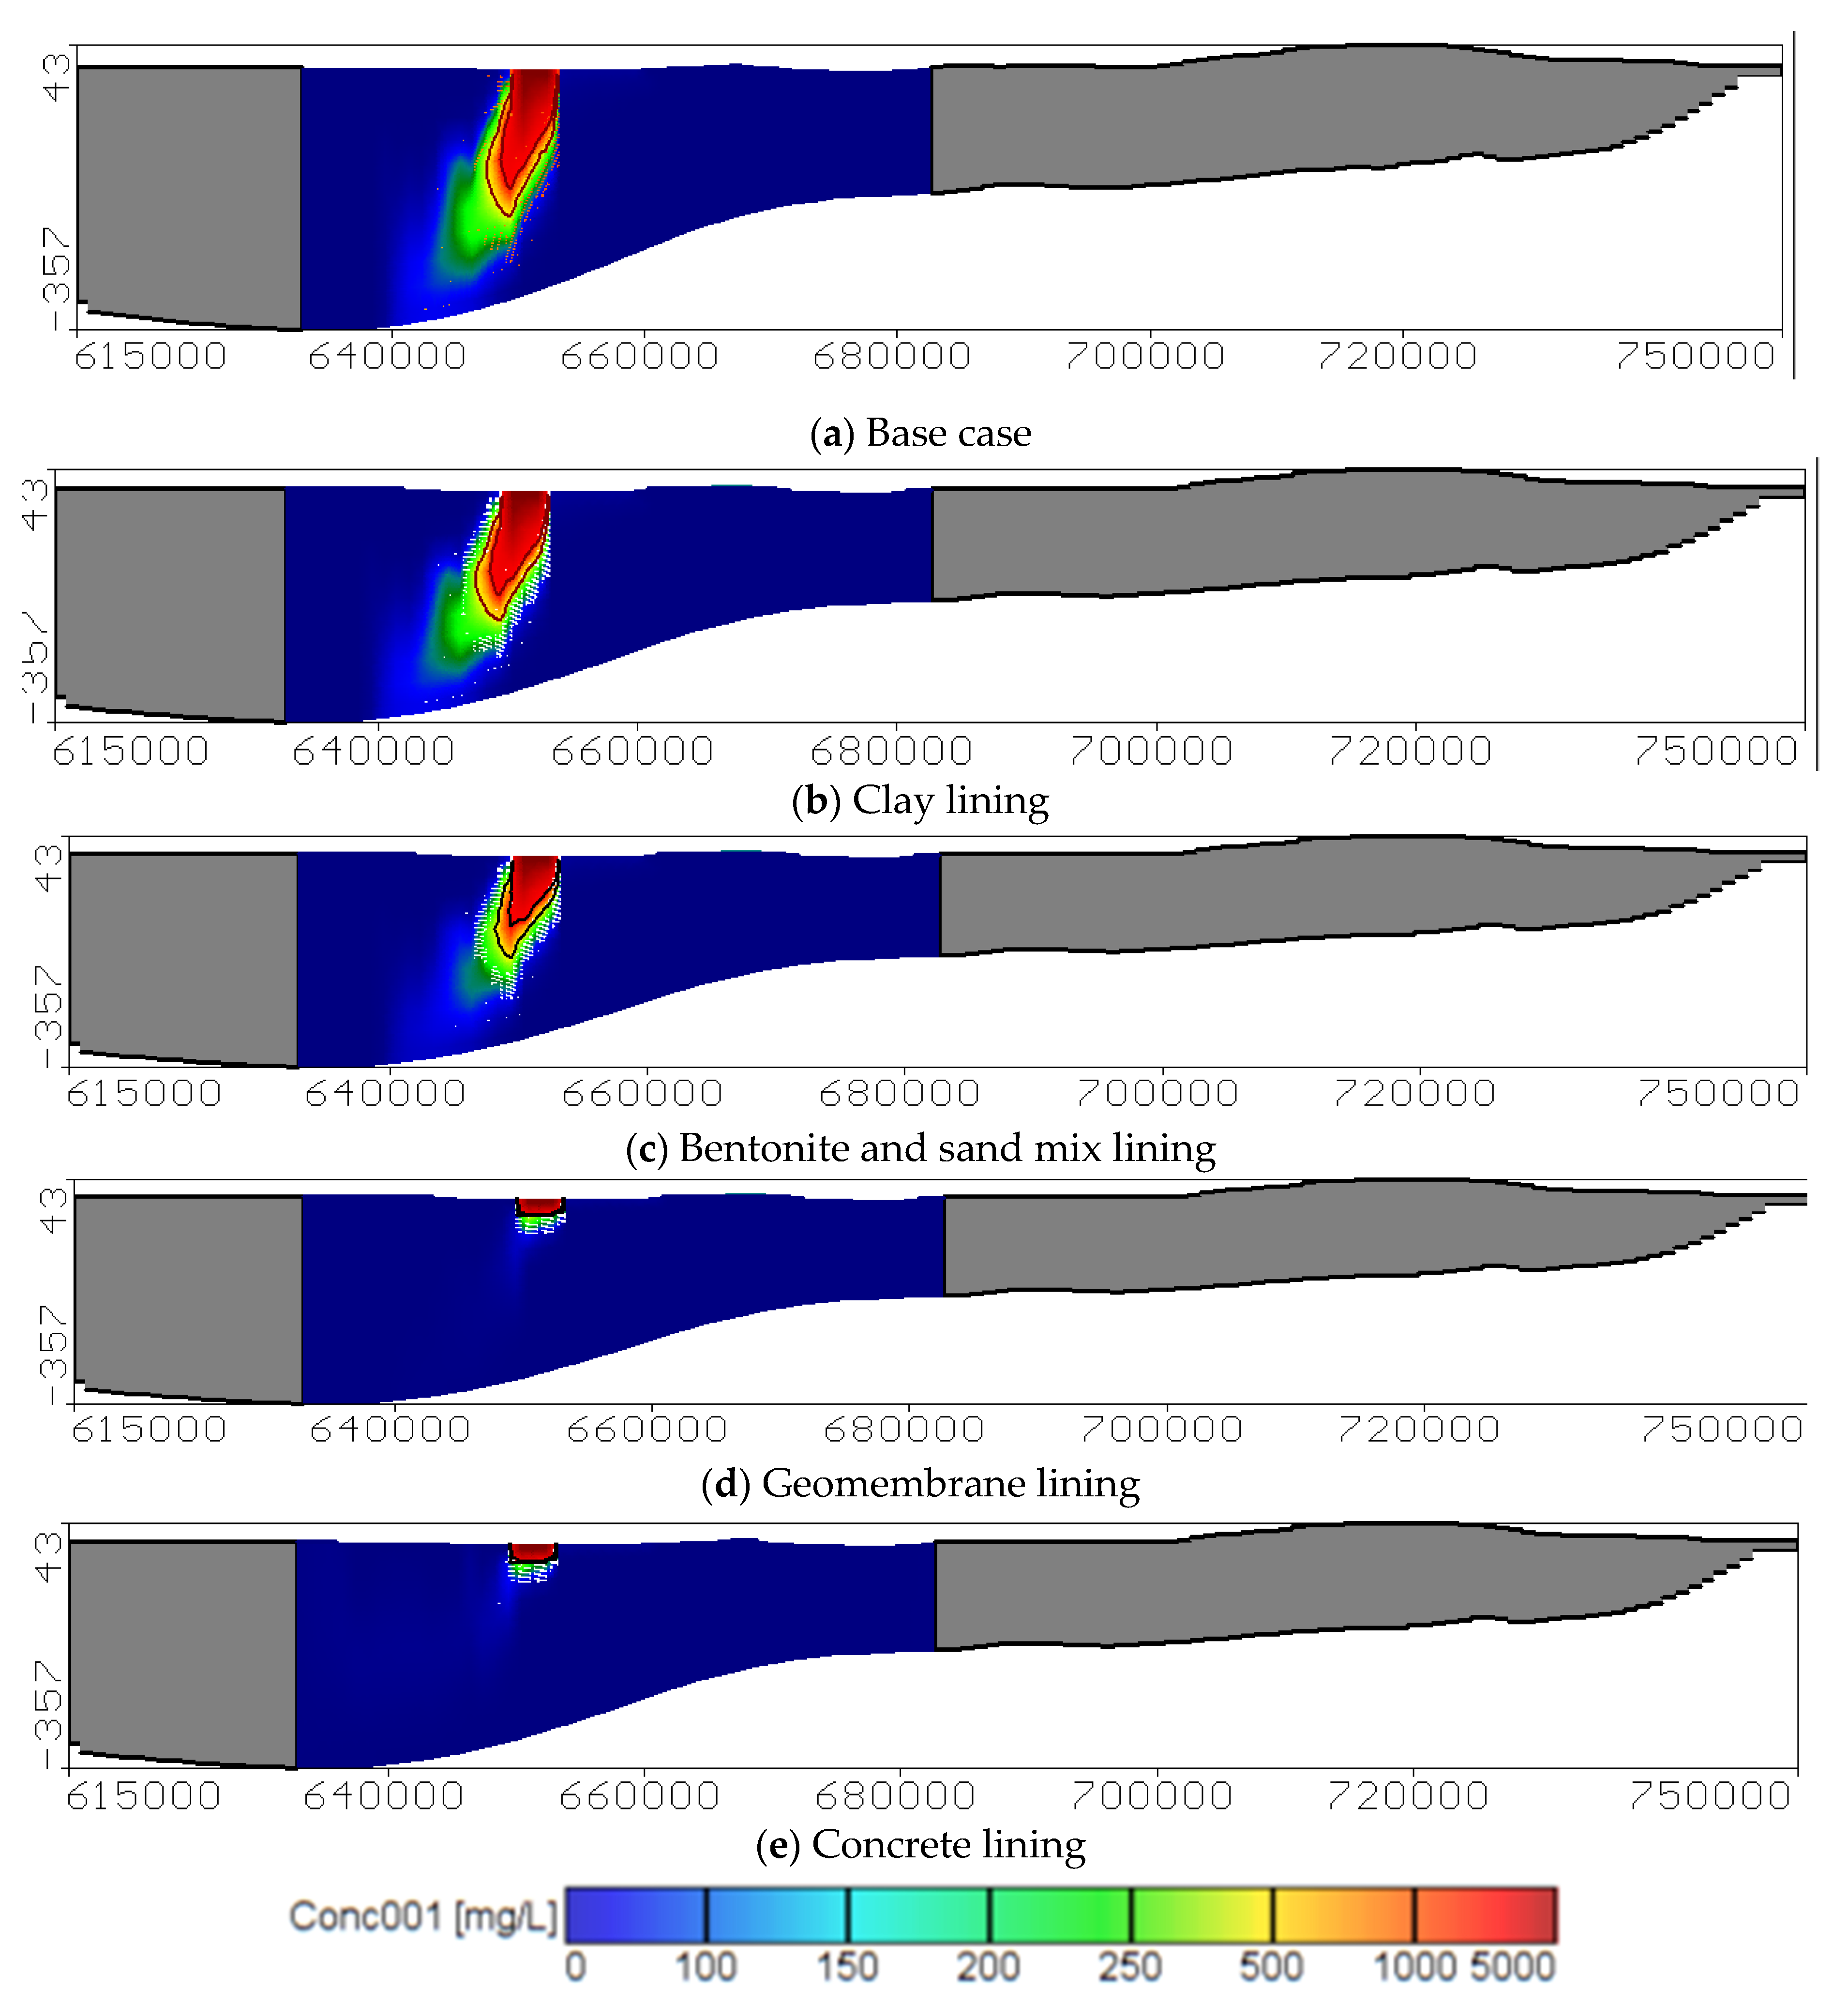
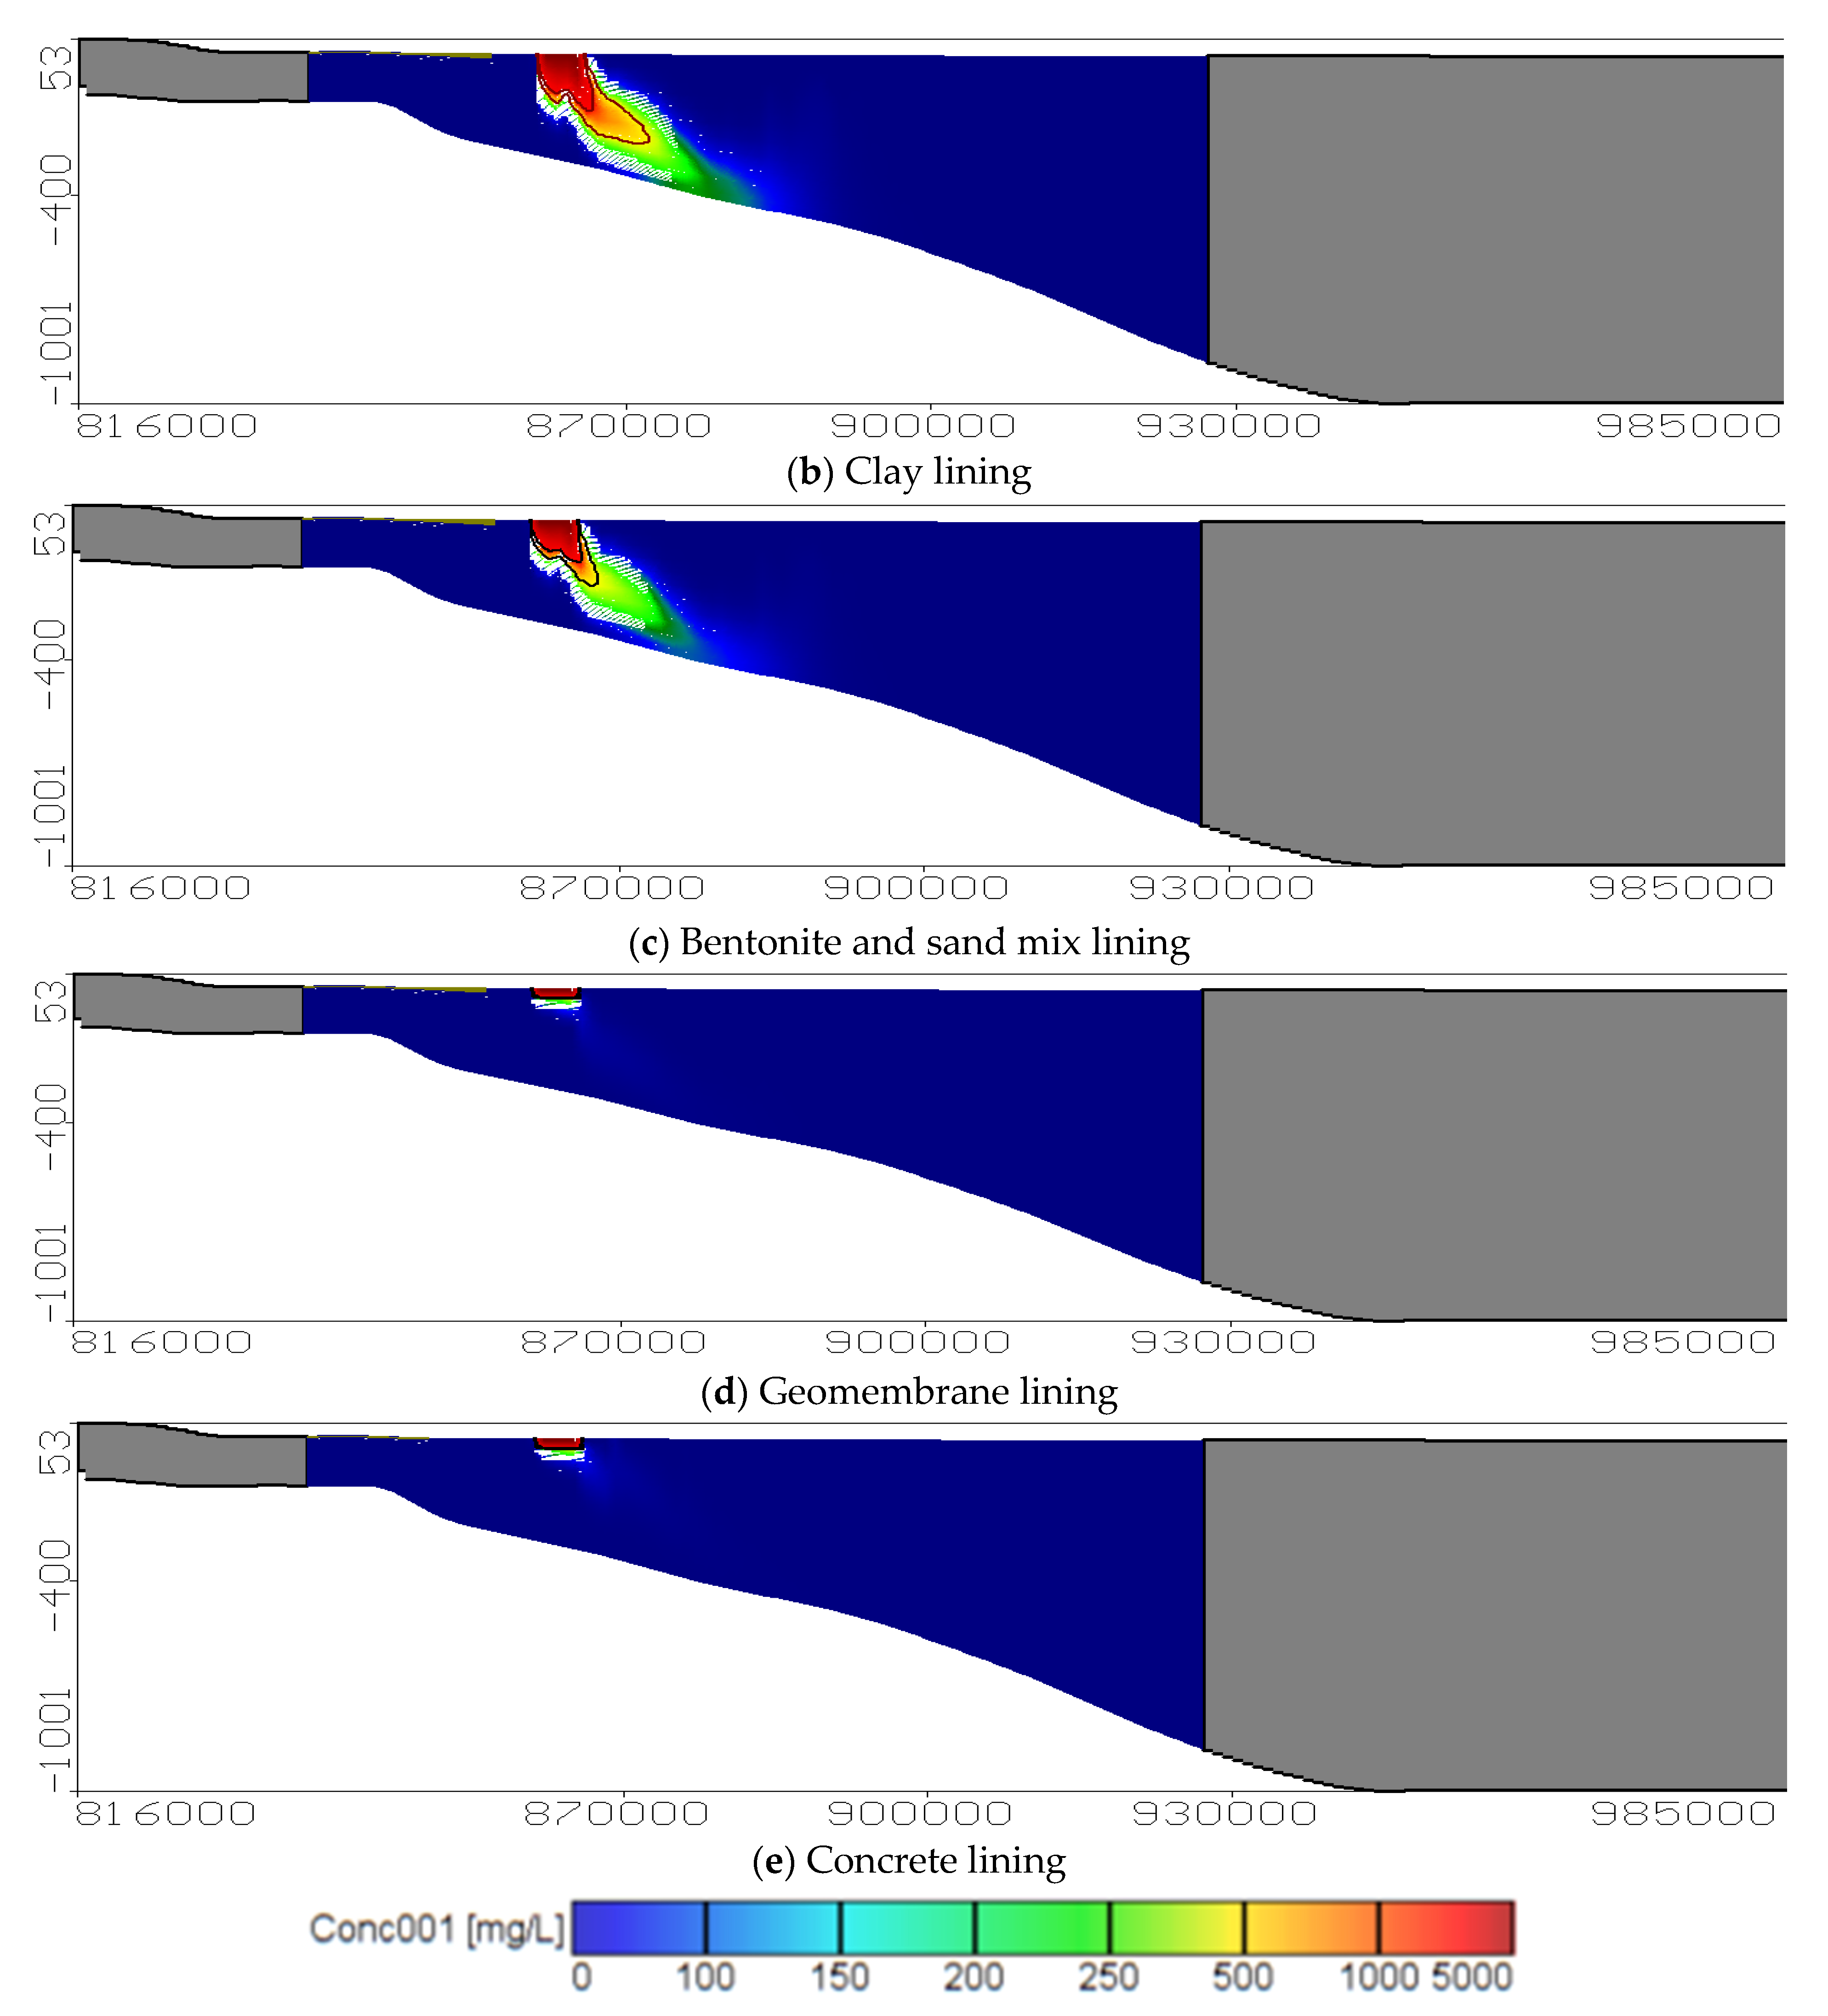
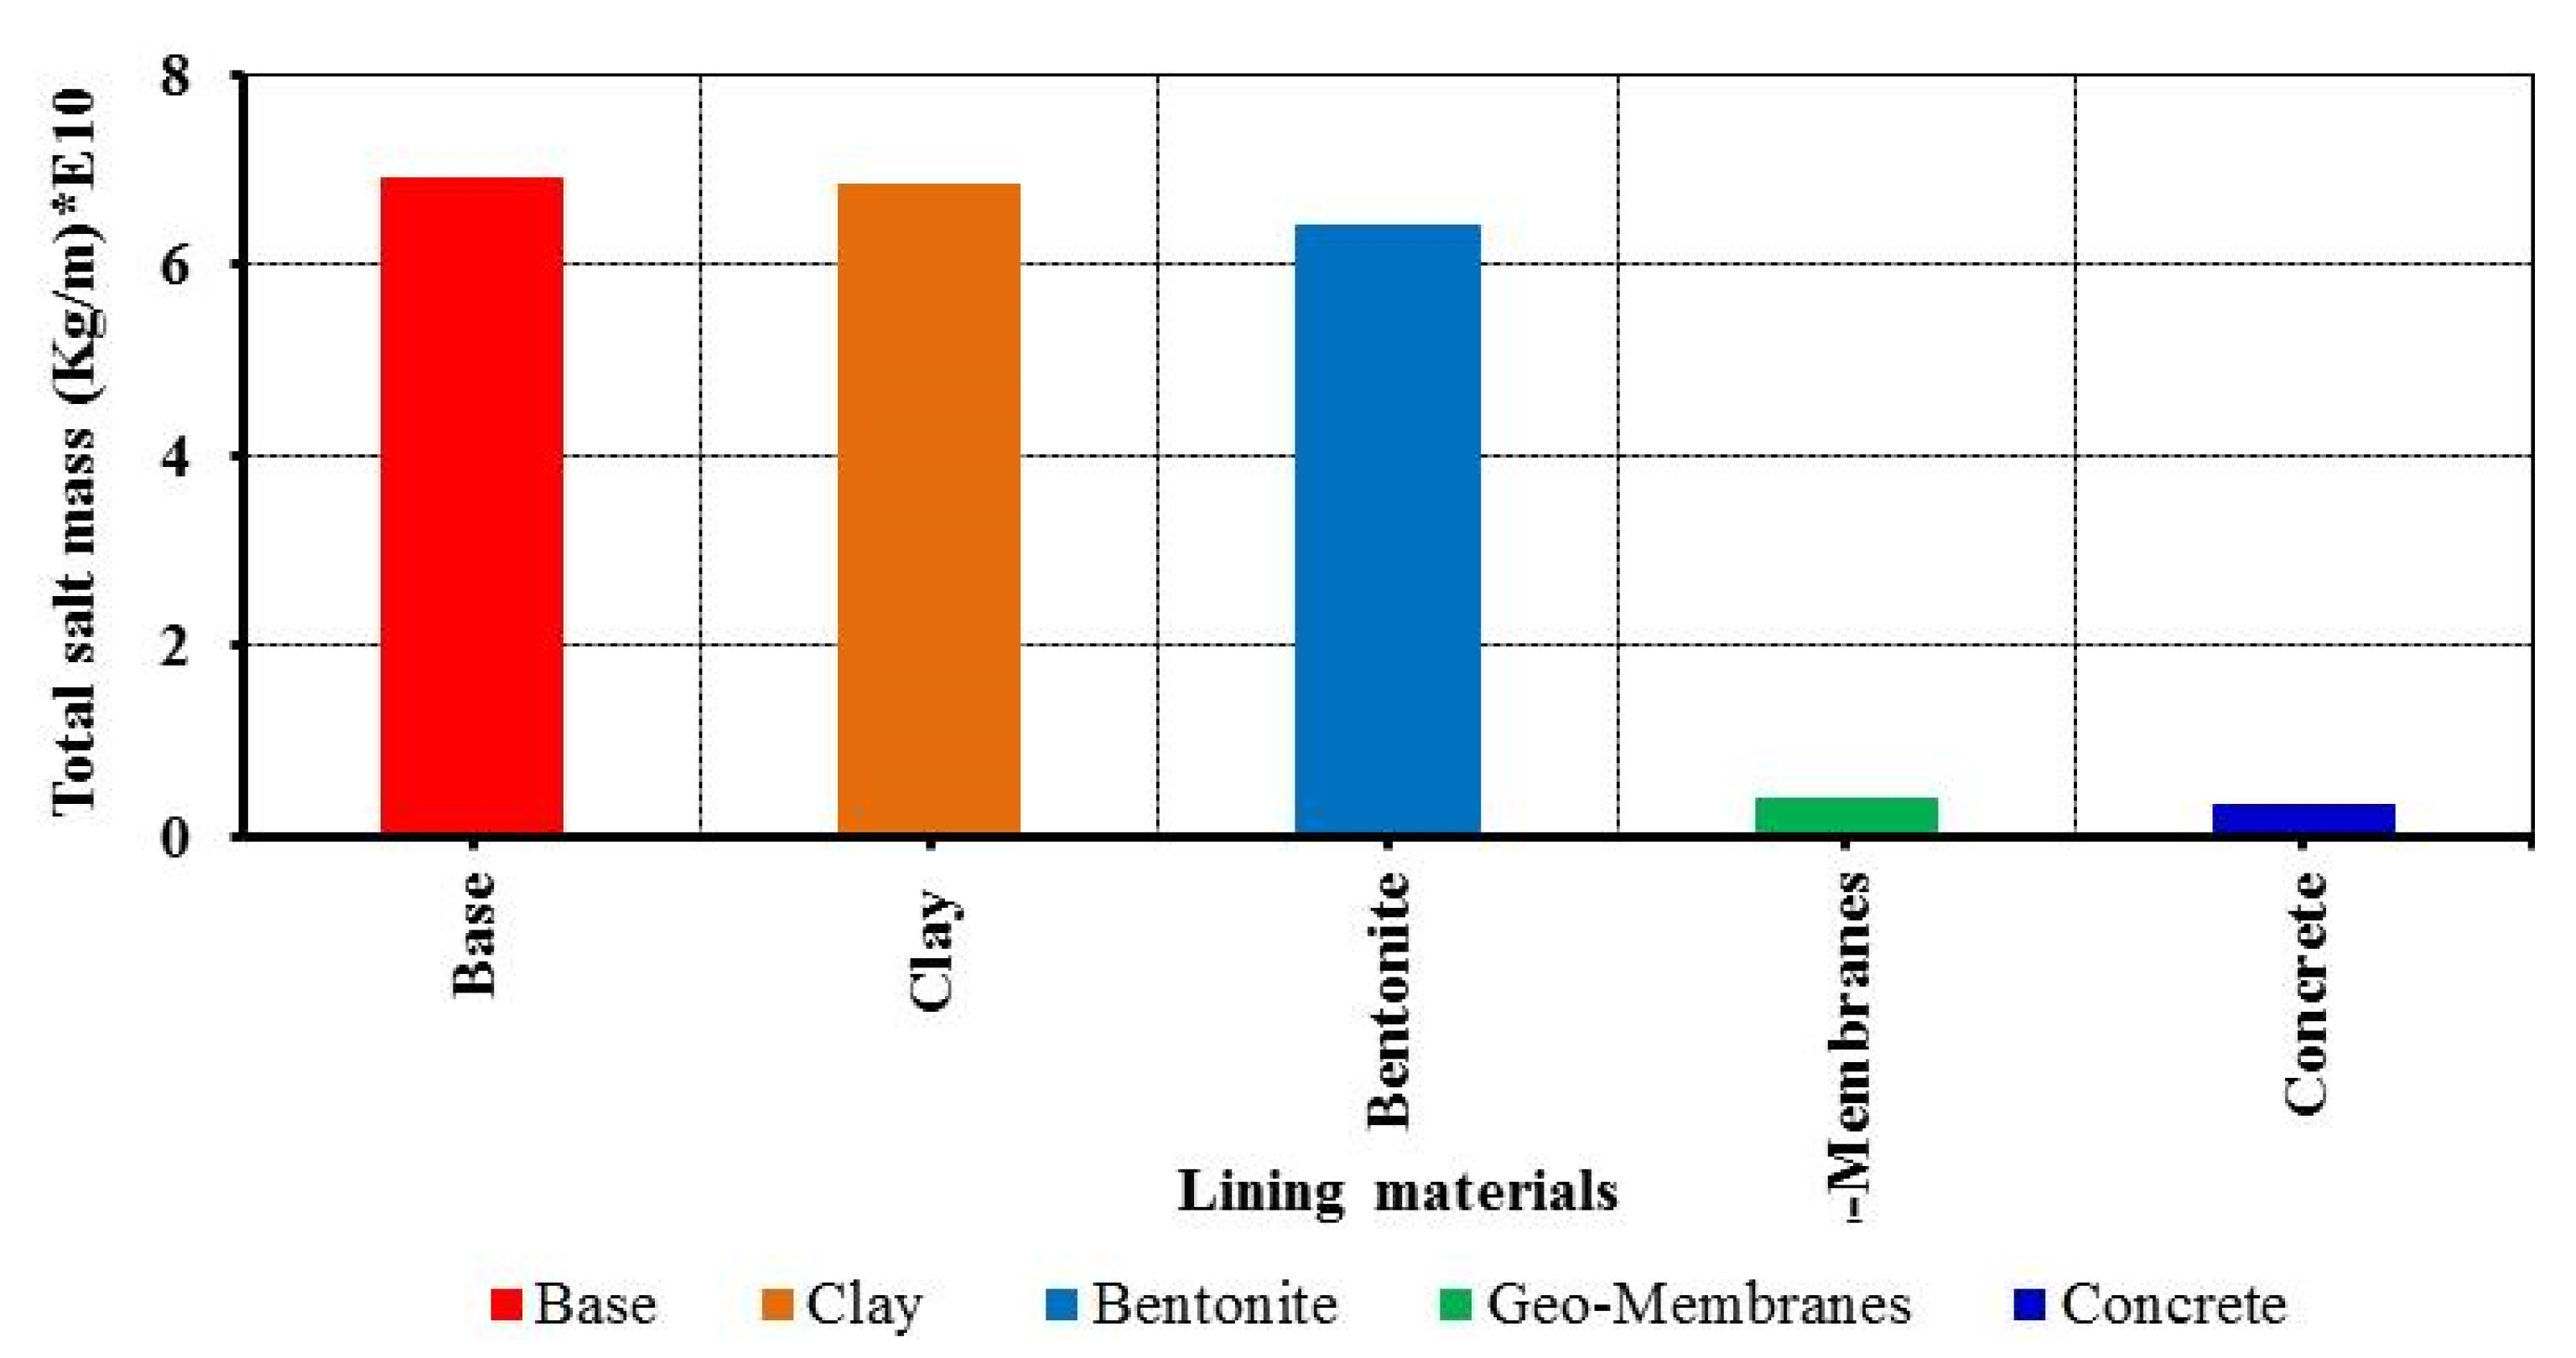
5. Protecting the Groundwater in the ENDA

The second approach in this study uses the model to investigate the impact of aquifer protection on groundwater quality in the ENDA using different low permeability materials. The study includes testing different materials, i.e., clay, bentonite, geomembrane, and concrete, due to their availability and their low permeabilities of 0.25 [36], 0.033 [18], 0.0001 [16], and 4 × 0−9 m/day [17], respectively.
The results showed that lining the drain with these materials had a significant effect on groundwater quality. In the first case, the drain was lined using clay with a permeability of 0.25 m/day. The results showed that the extension of contaminant in the ENDA decreased from 6.907 × 10¹⁰ (base case) to 6.87 × 10¹⁰. In the second case, the drain was lined using a mixture of bentonite and sand at a ratio of 80% sand and 20% bentonite with a permeability of 0.033 m/day. The results indicated a significant decrease in contamination into the aquifer and the total salt mass reached 6.409 × 10¹⁰.
In the third case, the drain was lined using manufactured textured LDPE geomembrane which had a permeability of 0.0001 m/day. The results indicated a significant decrease in the total salt mass, reaching 3.969 × 10⁹ as compared with 6.907 × 10¹⁰ in the base case. In the fourth case, the drain was lined using concrete with a permeability of 4 × 10⁻⁹ m/day; the results revealed that the concrete lining had a high positive impact on reducing the contaminant into the ENDA where the total salt mass decreased to 3.440 × 10⁹. Figure 9 shows the results for the different lining materials on the contaminant extension in the X direction and Figure 10 presents the values in the Y direction. The results showed that the lining materials were useful for reducing the extension of contaminant and had a significant effect on groundwater quality.

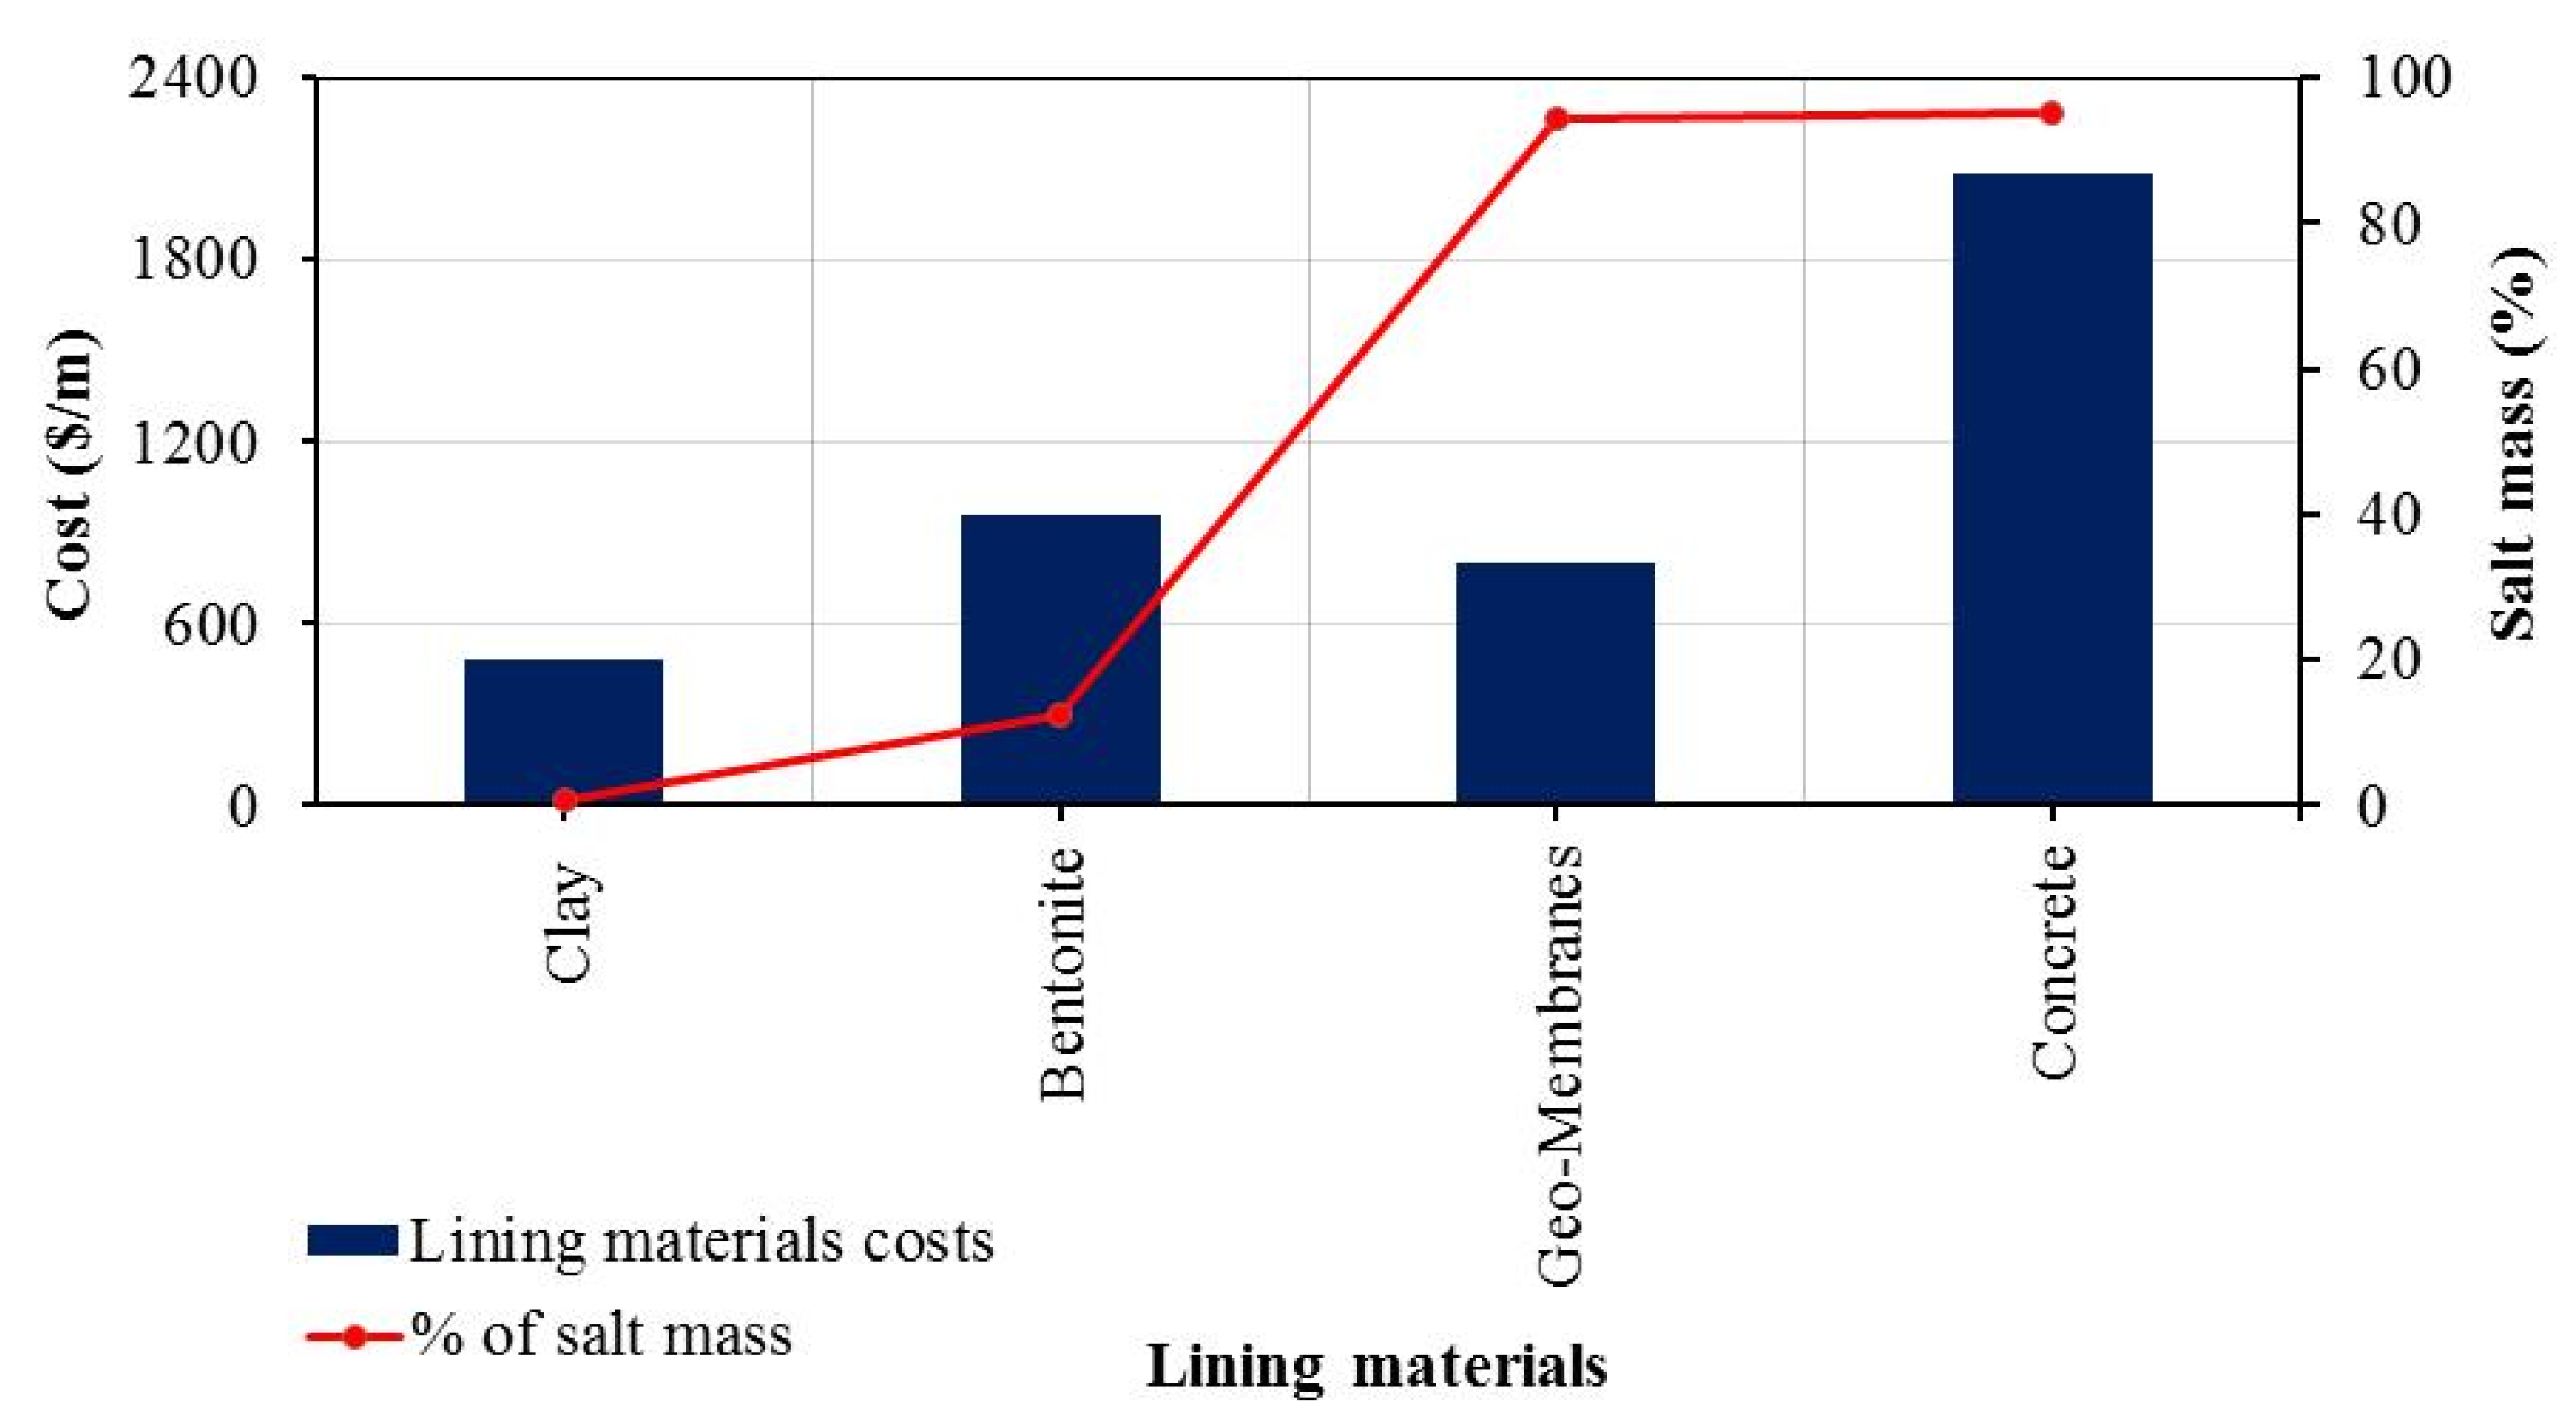
6. Cost Analysis for the Lining Materials Used

In the study, we also present the feasibility for using different lining materials. According to the market survey, the cost of the textured LDPE geomembrane ranges between 0.50 and 5 USD/m2 depending on properties and durability, the cost of concrete starts at 13 USD/m2 for 25 cm thickness, mixed bentonite with sand reaches 6 USD/m2, and clay is about 3 USD/m2. The estimated value of the wetted perimeter for the BED is 160 m and the calculated cost for each material is USD 480, 960, 800 and 2080 for clay, bentonite, geomembrane, and concrete, respectively. Figure 11 shows the relation between the cost for different lining materials and the reduction in percentage of salt mass in the aquifer.
The estimated cost of lining materials show that clay has the lowest cost but its effect on reducing contaminant extension in the aquifer is less than 0.6%. The cost of bentonite is also lower by 12.50% but its effect on reducing contaminant extension is not high, while the LDPE-type geomembrane is considered to be the best material for the lining because it can decrease the contaminant extension by 94.35% with a low cost as compared with concrete that can reduce the extension of contaminant by 95.02% and its cost was more than twice the cost of the geomembrane.

7. Discussion

Recently, it has become more and more important to protect groundwater quality in order to meet increasing global water demands [40,41]. From the results, contaminated open drains are one of the main sources of groundwater recharge by polluted water. Therefore, applying the presented solutions such as lining contaminated drains with low permeability materials and decreasing abstraction from groundwater present an effective solution for improving groundwater quality.
The data presented in Table 3 show the expected abstraction rates and the calculated TDS values for the proposed scenarios. Figure 12 presents the relation between changing the abstraction rate and the total salt mass in the ENDA; the figure shows that changing the abstraction rates by 15% and 34% had a negative impact on total aquifer salt and distribution of TDS in the ENDA, while increasing abstraction by 70% led to a positive impact on the total aquifer salts due to the abstraction of salt from the aquifer. The salinity increased from 6.907 × 10¹⁰ kg in the base case to 8.165 × 10¹⁰ and 8.519 × 10¹⁰ kg in the first and second scenario, with a decrease to 8.239 × 10¹⁰ kg due to the effect of over pumping on abstraction the salt.
Figure 13 presents the relation between the TDS values and different lining materials which indicates that aquifer contamination is decreased by lining the polluted streams of the BED. In addition, total salt mass decreased from 6.87 × 10¹⁰ in the base case to 6.409 × 10¹⁰, 3.969 × 10⁹, and 3.440 × 10⁹ kg using clay, bentonite, geomembrane, and concrete lining materials, respectively, as shown in Figure 13.

8. Conclusions

One of the advantages of groundwater is that it is a source of renewable water that can be recharged again from different water sources, but this advantage has another harmful effect on the quality of unconfined groundwater especially when the recharge sources are polluted by contaminations such as polluted open drains. Therefore, in the presented study, a numerical model using MODFLOW was applied to the most contaminated and largest drain, the Bahr El Baqar drain in the East Nile Delta Aquifer (ENDA). We presented two approaches to determine the impact of the drain on the groundwater quality in the study area. In the first approach, we studied increased abstraction rates of 15%, 34%, and 70% resulting from population increases in 2010, 2025, and 2040, respectively, and the results indicated that the TDS values increased by 18.23%, 23.29%, and 19.24%, respectively. In the second approach, we studied the protection of groundwater in the ENDA using low hydraulic conductivity materials including clay, bentonite, geomembrane, and concrete; the TDS decreased from 0.6% to 6.36%, 88.35%, and 90.47% in the aquifer by using different lining materials, respectively. A comparison of the costs of the different materials indicated that geomembrane was the best material to use for lining the Bahr El Baqar drain as it decreased the TDS by 94.35% with a low cost as compared with concrete that reduced the TDS by 95.02% but with a high cost.

Author Contributions

Conceptualization, M.Z.; methodology, I.A.-E., H.F.A.-E. A.M.S., and G.M.A.; validation, I.A.-E., H.F.A.-E., and A.M.S.; formal analysis, I.A.-E., A.M.S., and J.J.; investigation, I.A.-E. and A.M.S.; data curation, I.A.-E., A.M.S., and H.F.A.-E.; writing—original draft preparation, I.A.-E., H.F.A.-E., and A.M.S.; writing—review and editing, I.A.-E., A.M.S., H.F.A.-E., M.Z., G.M.A., and J.J.; supervision, G.M.A. and M.Z.; project administration, M.Z.; funding acquisition, M.Z. All authors have read and agreed to the published version of the manuscript.

Funding

This research received no external funding.

Institutional Review Board Statement

Not applicable.

Informed Consent Statement

Not applicable.

Data Availability Statement

The data are not publicly available due to institutional property rights.

Acknowledgments

This work was supported by a project of the Ministry of Education of the Slovak Republic, VEGA 1/0308/20, Mitigation of hydrological hazards, floods, and droughts by exploring extreme hydroclimatic phenomena in river basins and project HUS OUA/1702/6.1/0072, Environmental Assessment for Natural Resources Revitalization in Solotvyno to prevent the further pollution of the Upper-Tisza Basin through the preparation of a complex monitoring system.

Conflicts of Interest

The authors declare no conflict of interest.

References

  1. Margat, J.; Gun, J.v.d. Groundwater around the World; CRC Press/Balkema: Boca Raton, FL, USA, 2013. [Google Scholar]
  2. Smith, M.; Cross, K.; Paden, M.; Laban, P. Spring—Managing Groundwater Sustainability; IUCN: Gland, Switzerland, 2016. [Google Scholar]
  3. Gleeson, T.; Befus, K.M.; Jasechko, S.; Luijendijk, E.; Cardendas, M.B. The global volume and distribution of modern groundwater. Nat. Geosci. 2016, 9, 161–167. [Google Scholar] [CrossRef]
  4. Abdel-Shafy, H.; Kamel, A.H. Groundwater in Egypt issue: Resources, location, amount, contamination, protection, renewal, future overview. Egypt. J. Chem. 2016, 59, 321–362. [Google Scholar]
  5. Negm, A.M.; Sakr, S.; Abd-Elaty, I.; Abd-Elhamid, H.F. An Overview of Groundwater Resources in Nile Delta Aquifer. The Handbook of Environmental Chemistry. In Groundwater in the Nile Delta; Negm, A., Ed.; Springer: Cham, Switzerland, 2018; Volume 73. [Google Scholar] [CrossRef]
  6. Molle, F.; Gaafar, I.; El-Agha, D.E.; Rap, E. Irrigation Efficiency and the Nile Delta Water Balance, Water and salt management in the Nile Delta: Report No.9. Int. Water Manag. Inst. Aust. Cent. Int. Agric. Res. 2016. [Google Scholar] [CrossRef]
  7. Abd-Elaty, I.; Javadi, A.; Abd-Elhamid, H. Management of saltwater intrusion in coastal aquifers using different wells systems: A case study of the Nile Delta aquifer in Egypt. Hydrogeol. J. 2021. [Google Scholar] [CrossRef]
  8. Smith, A.J.; Pollock, D.W.; Palmer, D. Groundwater interaction with surface drains in the Ord River Irrigation Area, northern Australia: Investigation by multiple methods. Hydrogeol. J. 2010, 18, 1235–1252. [Google Scholar] [CrossRef]
  9. El-Sayed, S.A.; Morsy, S.M.; Zakaria, K.M. Recharge sources and geochemical evolution of groundwater in the Quaternary aquifer at Atfih area, the northeastern Nile Valley, Egypt. J. Afr. Earth Sci. 2018, 142, 82–92. [Google Scholar] [CrossRef]
  10. Nofal, E.R.; Fekry, A.M.; Ahmed, M.H.; El-Kharakany, M.M. Groundwater: Extraction versus recharge; vulnerability assessment. Water Sci. 2018, 32, 287–300. [Google Scholar] [CrossRef] [Green Version]
  11. Bear, J. Hydraulics of Groundwater; McGraw-Hill: New York, NY, USA, 1979. [Google Scholar]
  12. JICA (Japan International Cooperation Agency). The Project for Drainage Water Quality Control for Irrigation in Middle Nile Delta in the Arab Republic of Egypt, Report; JICA: Tsukuba-shi, Ibaraki-ken, Japan, 2016. [Google Scholar]
  13. Arnous, M.O.; El-Rayes, A.E. An Integrated GIS and Hydrochemical Approach to Assess Groundwater Contamination in West Ismailia Area, Egypt. Arab. J. Geosci. 2013, 6, 2829–2842. [Google Scholar] [CrossRef]
  14. Abd-Elhamid, H.F.; Abdelaal, G.M.; Abd-Elaty, I.; Said, A.M. Evaluation of groundwater vulnerability to seepage from open drains considering different pumping schemes in unconfined aquifers. In Proceedings of the Twenty-First International Water Technology Conference, IWTC21, Ismailia, Egypt, 28–29 June 2018; pp. 358–364. [Google Scholar]
  15. Blanco, M.; Castillo, F.; Soriano, J.; Noval, A.M.; Touze-Foltz, N.; Pargada, L.; Rico, G.; Aguiar, E. Comparative Study of Three Different Kinds of Geomembranes (PVC-P, HDPE, EPDM) Used in the Waterproofing of Reservoirs; Eurogeo: Valencia, Spain, 2012; pp. 46–54. [Google Scholar]
  16. Khair, A.; Nalluri, C.; Kilkenny, W.M. Soil-cement tiles for lining irrigation canals. Irrig. Drain. Syst. 1991, 5, 151–163. [Google Scholar] [CrossRef]
  17. Park, J.H.; Rim, J.T.; Min, T.I. Thermoplastic Geomembranes for Water Barriers. In Frontiers of Polymers and Advanced Materials; Prasad, P.N., Ed.; Springer: Boston, MA, USA, 1994; pp. 411–421. [Google Scholar]
  18. Schneider, S.; Mallants, D.; Jacques, D. Determining hydraulic properties of concrete and mortar by inverse modelling. MRS Proc. 2012, 1475, 60. [Google Scholar] [CrossRef] [Green Version]
  19. Ören, A.H.; Kaya, A.; Kayalar, A.Ş. Hydraulic conductivity of zeolite–bentonite mixtures in comparison with sand–bentonite mixtures. Can. Geotech. J. 2011, 48, 1343–1353. [Google Scholar] [CrossRef]
  20. Abd-Elaty, I.; Zelenakova, M.; Straface, S.; Vranayová, Z.; Abu-hashim, M. Integrated Modelling for Groundwater Contamination from Polluted Streams Using New Protection Process Techniques. Water 2019, 11, 2321. [Google Scholar] [CrossRef] [Green Version]
  21. Abd-Elaty, I.; Pugliese, L.; Zelenakova, M.; Mesaros, P.; Shinawi, A.E. Simulation-Based Solutions Reducing Soil and Groundwater Contamination from Fertilizers in Arid and Semi-Arid Regions: Case Study the Eastern Nile Delta, Egypt. Int. J. Environ. Res. Public Health 2020, 17, 9373. [Google Scholar] [CrossRef]
  22. El Haddad, I.M. Hydrogeological Studies and Their Environmental Impact on Future Management and Sustainable Development of the New Communities and Their Surroundings, East of the Nile Delta. Ph.D. Thesis, University of Mansoura, Mansoura, Egypt, 2002. [Google Scholar]
  23. Saad, A.K. Environmental Hydrogeologic Impacts Groundwater Withdrawal in the Eastern Nile Delta Region with Emphasis on Groundwater Pollution Potential. Ph.D. Thesis, Institute of Environmental Studies, Ain Shams University, Cairo, Egypt, 1997; 232p. [Google Scholar]
  24. Karaman, H.G. Identifying uncertainty of the mean of some water quality variables along water quality monitoring network of Bahr El Baqar drain. Water Sci. 2013, 27, 48–56. [Google Scholar] [CrossRef] [Green Version]
  25. Taha, A.A.; El Mahmoudi, A.E.; El-Haddad, I.M. Pollution sources and related environmental impacts in the new communities southeast Nile Delta, Egypt. Emir. J. Eng. Res. 2004, 9, 35–49. [Google Scholar]
  26. CONOCO. Geological Map of Egypt, Scale 1: 500,000, Nile Delta, NH-36; Egyptian General Petroleum Corporation: Cairo, Egypt, 1987. [Google Scholar]
  27. Abd-Elhamid, H.F.; Javadi, A.; Abdelaty, I.; Sherif, M. Simulation of seawater intrusion in the Nile Delta aquifer under the conditions of climate change. Hydrol. Res. 2016, 47, 1198–1210. [Google Scholar] [CrossRef]
  28. Morsy, W.S. Environmental Management to Groundwater Resources for Nile Delta Region. Ph.D. Thesis, Faculty of Engineering, Cairo University, Cairo, Egypt, 2009. [Google Scholar]
  29. Abd-Elaty, I.; Sallam, G.A.; Strafacec, S.; Scozzari, A. Effects of climate change on the design of subsurface drainage systems in coastal aquifers in arid/semi-arid regions: Case study of the Nile delta. Sci. Total Environ. J. 2019, 672, 283–295. [Google Scholar] [CrossRef] [PubMed]
  30. Abdelaty, I.M.; Abd-Elhamid, H.F.; Fahmy MRAbdelaal, G.M. Study Impact of Climate Change and Other on Groundwater System in Nile Delta Aquifer. Egypt. J. Eng. Sci. Technol. Zagazig Univ. Fac. Eng. 2014, 174, 2061–2079. [Google Scholar]
  31. MWRI. Adaptation to Climate Change in the Nile Delta through Integrated Coastal Zone Management; Ministry of Water Resources and Irrigation: Cairo, Egypt, 2013. [Google Scholar]
  32. Gado, T.A. Statistical characteristics of extream rainfall events in Egypt. In Proceedings of the Twentieth International Water Technology Conference, IWTC20, Hurghada, Egypt, 18–20 May 2017; pp. 645–653. [Google Scholar]
  33. FAO, Food and Agriculture Organization of the United Nations. High Dam Soil Survey Project; Ministry of Agriculture: Cairo, Egypt, 1966; Volume 3, pp. 1–348. [Google Scholar]
  34. McDonald, M.G.; Harbaugh, A.W. Techniques of Water-Resources Investigations 06-A1. In A Modular Three-Dimensional Finite-Difference Ground-Water Flow Model; US Geological Survey: Reston, VA, USA, 1988. [Google Scholar]
  35. Javandel, I.; Doughty, C.; Tsang, C.-F. Groundwater Transport: Handbook of Mathematical Models. American Geophysical Union. Water Resour. Monogr. 1984. [Google Scholar] [CrossRef]
  36. Ezzeldin, M.; El-Alfy, K.; Abdelgawad, H.A.; Abd-Elmaboud, M. Comparison between Structured and Unstructured MODFLOW for Simulating Groundwater Flow in Three-Dimensional Multilayer Quaternary Aquifer of East Nile Delta, Egypt. Hydrol. Curr. Res. 2018, 9, 1000297. [Google Scholar] [CrossRef]
  37. El-Arabi, M. Environmental Impact of New Settlements in Groundwater in a Region in the Nile Delta. Master’s Thesis, Faculty of Engineering, Zagazig University, Zagazig, Egypt, 2007. [Google Scholar]
  38. RIGW (Research Institute for Groundwater). Projected of the Safe Yield Study for Groundwater Aquifer in the Nile Delta and Upper Egypt. Part 1; Ministry of Irrigation, Academy of Scientific Research and Technology, and Organization of Atomic Energy: Cairo, Egypt, 1980. [Google Scholar]
  39. Abd-Elaty, I.; Zeleňáková, M.; Krajníková, K.; Abd-Elhamid, H.F. Analytical Solution of Saltwater Intrusion in Costal Aquifers Considering Climate Changes and Different Boundary Conditions. Water 2021, 13, 995. [Google Scholar] [CrossRef]
  40. Zelenakova, M.; Hlavinek, P.; Negm, A.M. Management of Water Quality and Quantity; Springer International Publishing Ag: Cham, Switzerland, 2020. [Google Scholar]
  41. Negm, A.M.; Romanescu, G.; Zelenakova, M. Water Resources Management in Balkan Countries; Springer International Publishing Ag: Cham, Switzerland, 2020. [Google Scholar]
Figure 1. Geologic map of the eastern Nile Delta [21] (modified after [26]).
Water 13 01705 g001
Figure 2. The ENDA boundary conditions: (a) Head; (b) TDS concentration; (c) vertical section in the Y direction from north to south; (d) vertical section in the X direction from east to west.
Water 13 01705 g002
Figure 3. Calibration of the model for (a) a real view and (b) calculated versus observed heads.
Water 13 01705 g003
Figure 4. A real view of (a) groundwater levels and (b) flow pattern and velocity direction in the ENDA.
Water 13 01705 g004
Figure 5. Area view for (a) TDS in the ENDA and (b) location of the cross-sections with abstraction well distribution.
Water 13 01705 g005
Figure 6. Contaminant extension in the ENDA.
Water 13 01705 g006aWater 13 01705 g006b
Figure 7. Area distribution of TDS in the aquifer at different values of abstraction.
Water 13 01705 g007
Figure 8. Vertical distribution of TDS in zones A and B for all scenarios of abstraction in the X direction.
Water 13 01705 g008aWater 13 01705 g008b
Figure 9. Vertical cross-section for TDS distribution using lining in the X direction of zone B.
Water 13 01705 g009
Figure 10. Vertical cross-section for TDS distribution using lining in the Y direction for zone B.
Water 13 01705 g010aWater 13 01705 g010b
Figure 11. Total cost for different lining materials and the percentage of salt mass.
Water 13 01705 g011
Figure 12. Relation between abstraction rate and total dissolved salt (TDS) values in the ENDA.
Water 13 01705 g012
Figure 13. Total salt mass for different lining materials.
Water 13 01705 g013
Table 1. The main water bodies in the ENDA [36].
Water BodyTotal Length (km)Bottom Width (m)Mean Depth (m)Surface Water Level Range
Damietta branch2450–200 616–1.0
El Rayah El Tawfiky6310–26 516–0.5
Ismailia canal13610–30 516–0.0
El Sharkaweya Canal327–10 516.5–13.0
El Basoseya Canal245–10 516–12.0
Suez Canal173-16-
El Manzala Lake (area) Km21500 -1.21–0.0
Bahr El Baqar drain85100–2005-
Bahr Hadous drain505–405-
El Serw drain305–105-
Table 2. Hydraulic parameters of the ENDA for each layer [36].
Layer No.Layer TypeHydraulic Conductivity (m/Day)Storage CoefficientSpecific YieldEffective Porosity
KhKvSS (-)Sy (1/m)neff (%)
1Clay0.10–0.250.01–0.02510−30.1050–0
From 2 to 5Fine sand with
lenses of clay
5–200.5–25 × 10−30.1530
From 6 to 9Coarse sand
quaternary
20–752–7.52.5 × 10−30.1825
From 10 and 11Graded sand and gravel75–1007.5–105 × 10−40.2020
Table 3. Abstraction rates and total mass for different scenarios.
Scenarios NoYearIncreasing Rate (%)Abstraction Rate (m3)Total Mass After (kg)
Base case study20101003.480 × 106 6.907 × 10¹⁰
First scenario20251154.002 × 106 8.165 × 10¹⁰
Second scenario20401344.663 × 106 8.519 × 10¹⁰
Third scenario20601705.916 × 106 8.239 × 10¹⁰
Publisher’s Note: MDPI stays neutral with regard to jurisdictional claims in published maps and institutional affiliations.

