
Suspended-Sediment Distribution Patterns in Tide-Dominated Estuaries on the Eastern Amazon Coast: Geomorphic Controls of Turbidity-Maxima Formation

 ,
,  , , and
Abstract
:1. Introduction
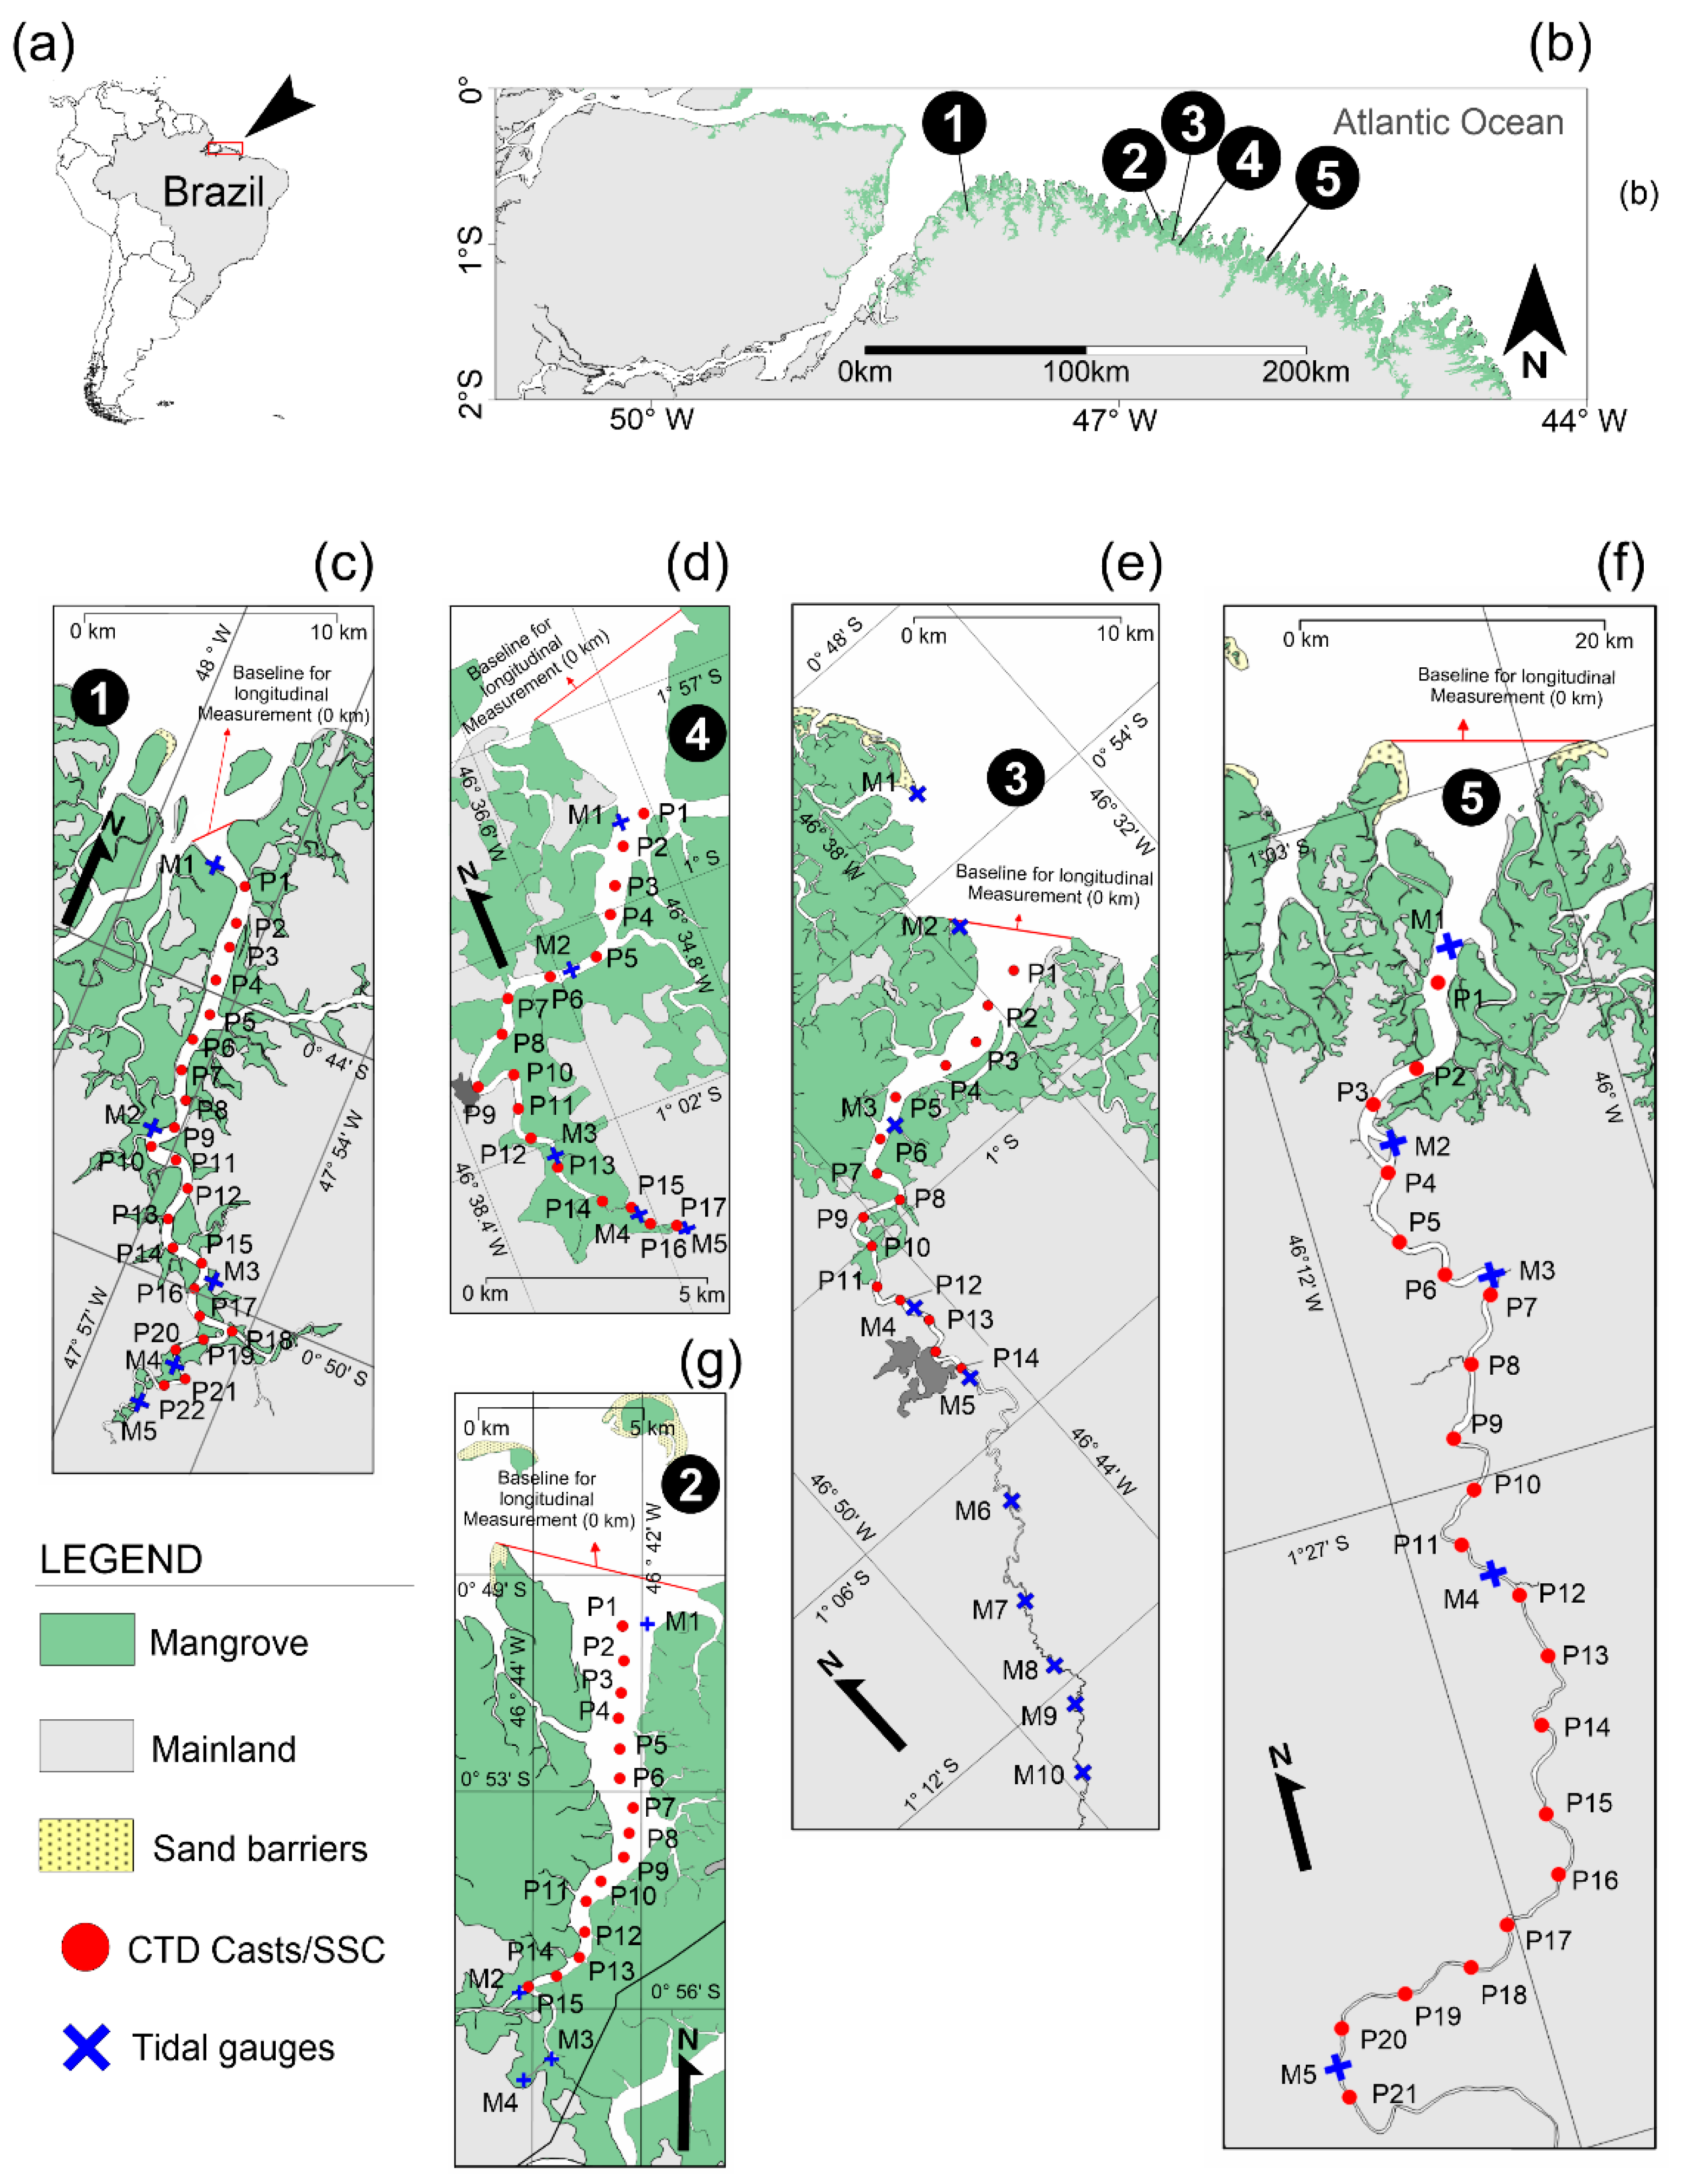
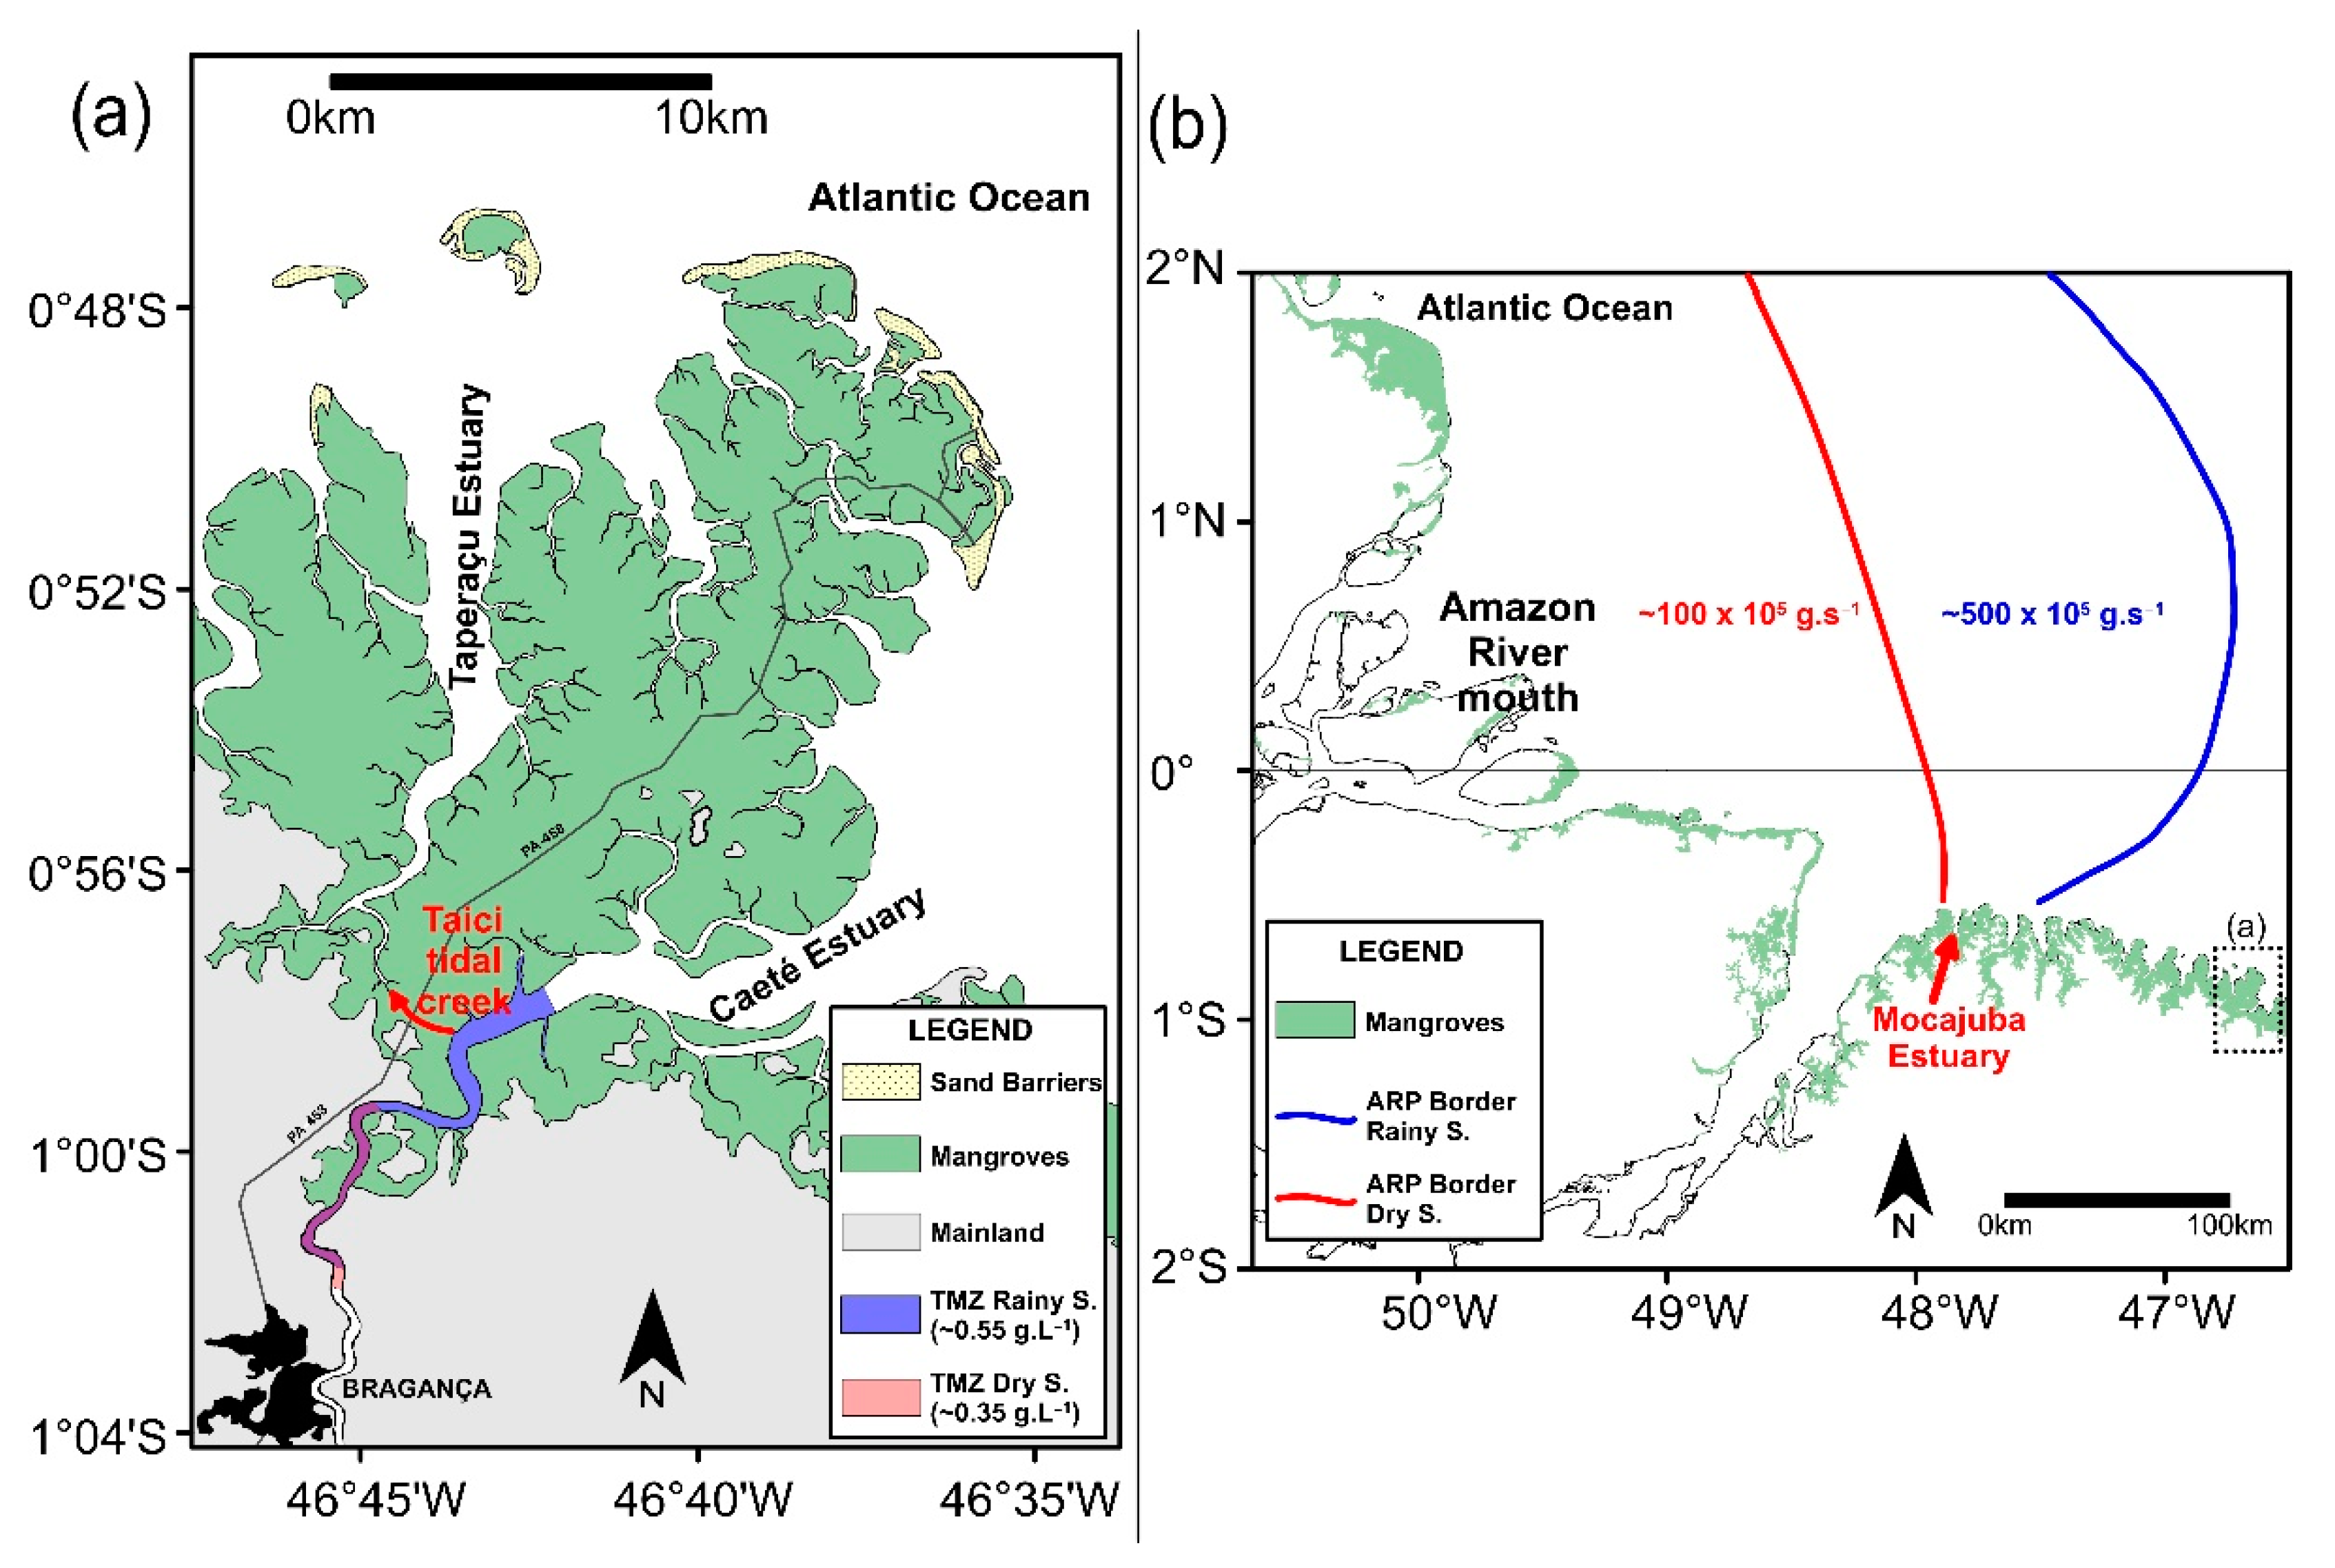
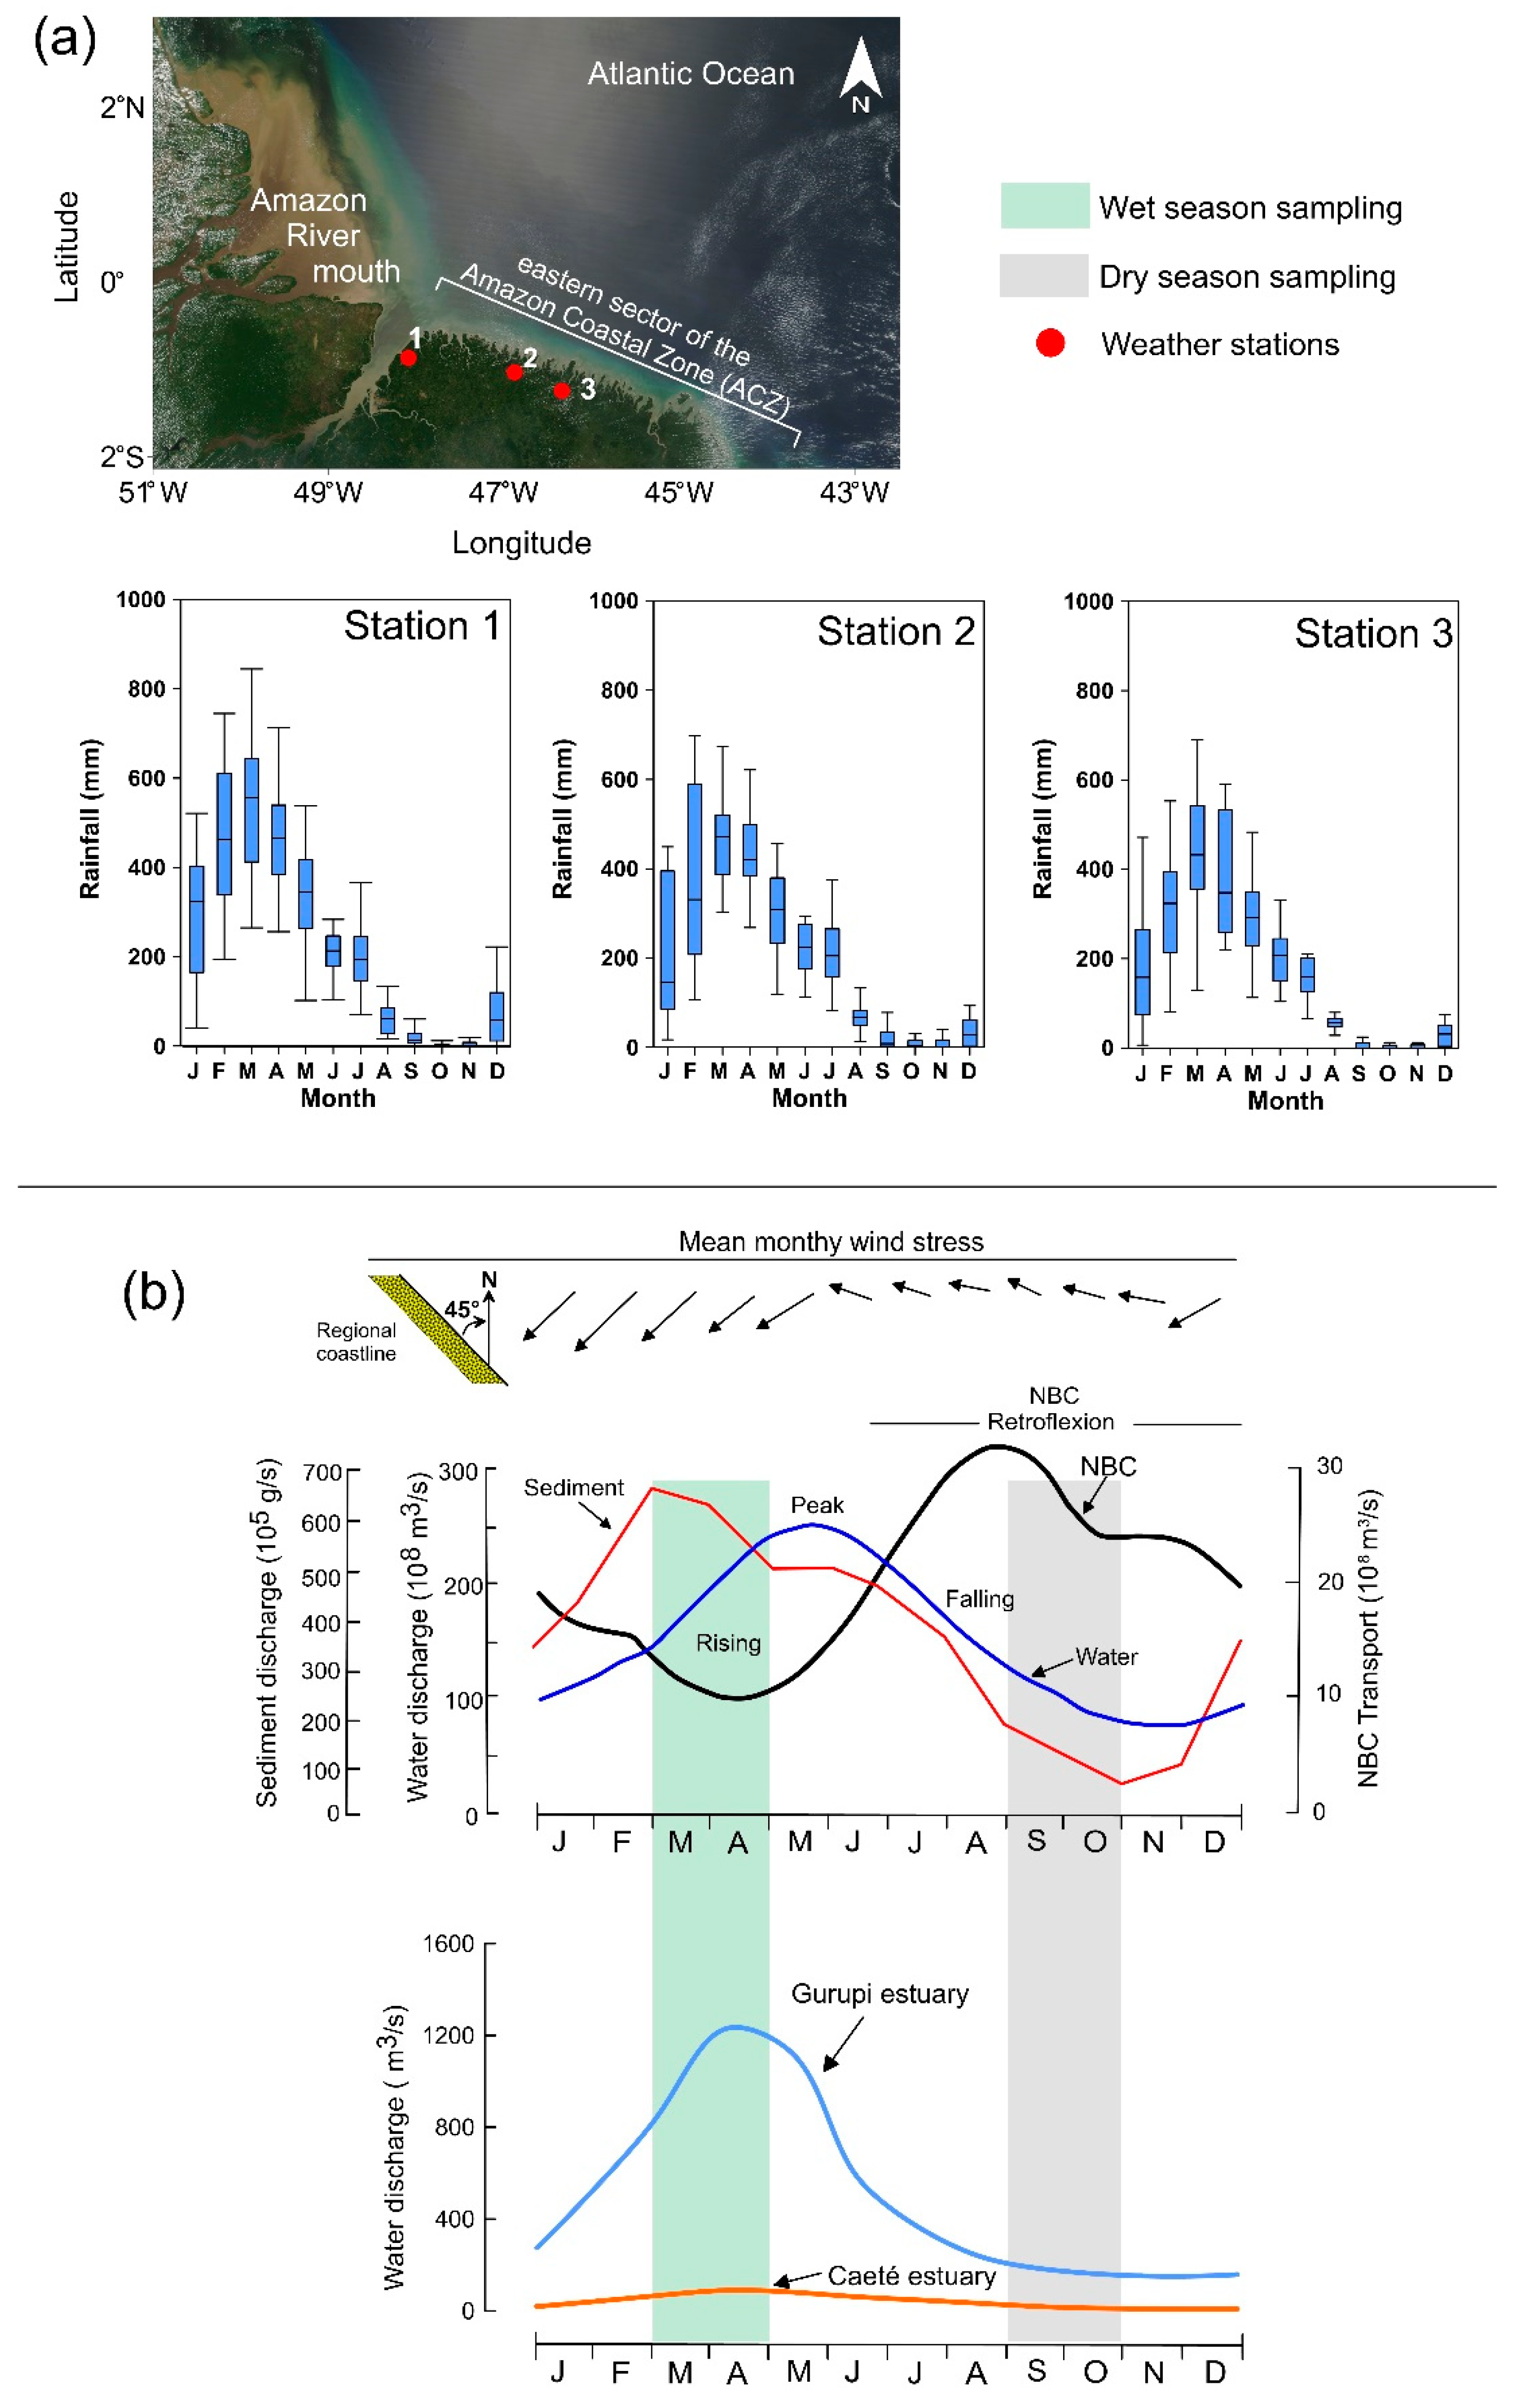
2. Study Area
3. Materials and Methods
3.1. Measurements of SSC and Salinity throughout the Estuaries
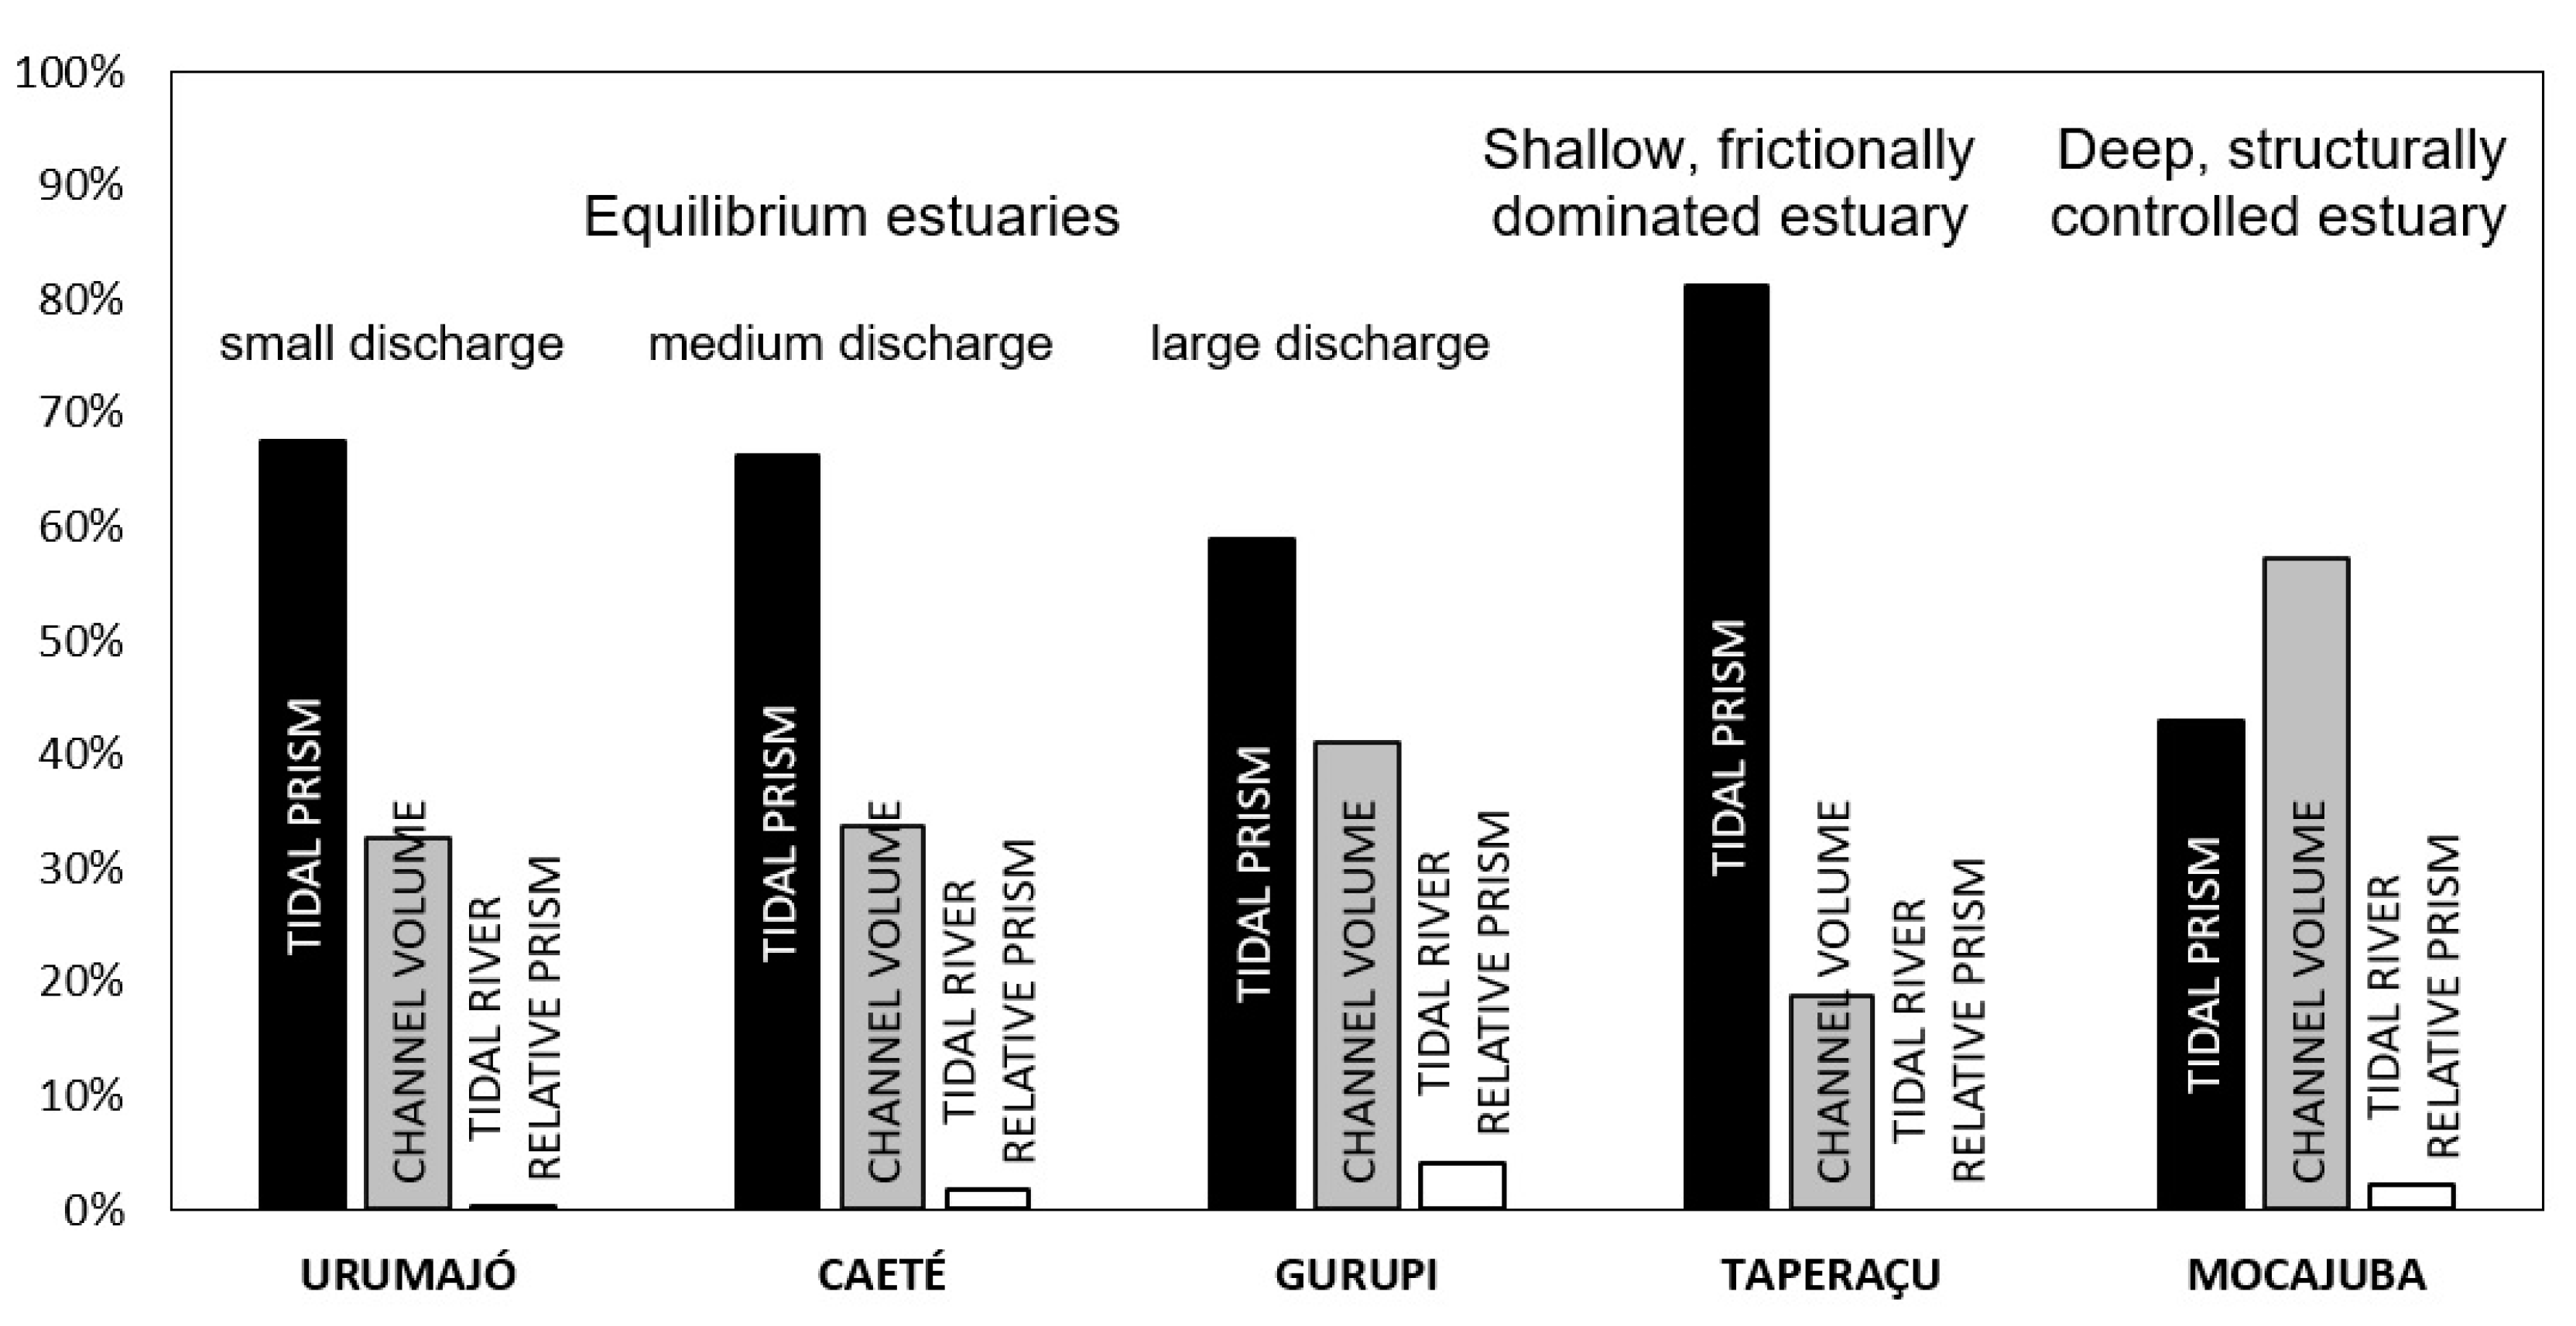
3.2. Morphological Measurements, Tidal Amplitude, and Calculation of Tidal Prisms
4. Results and Discussion
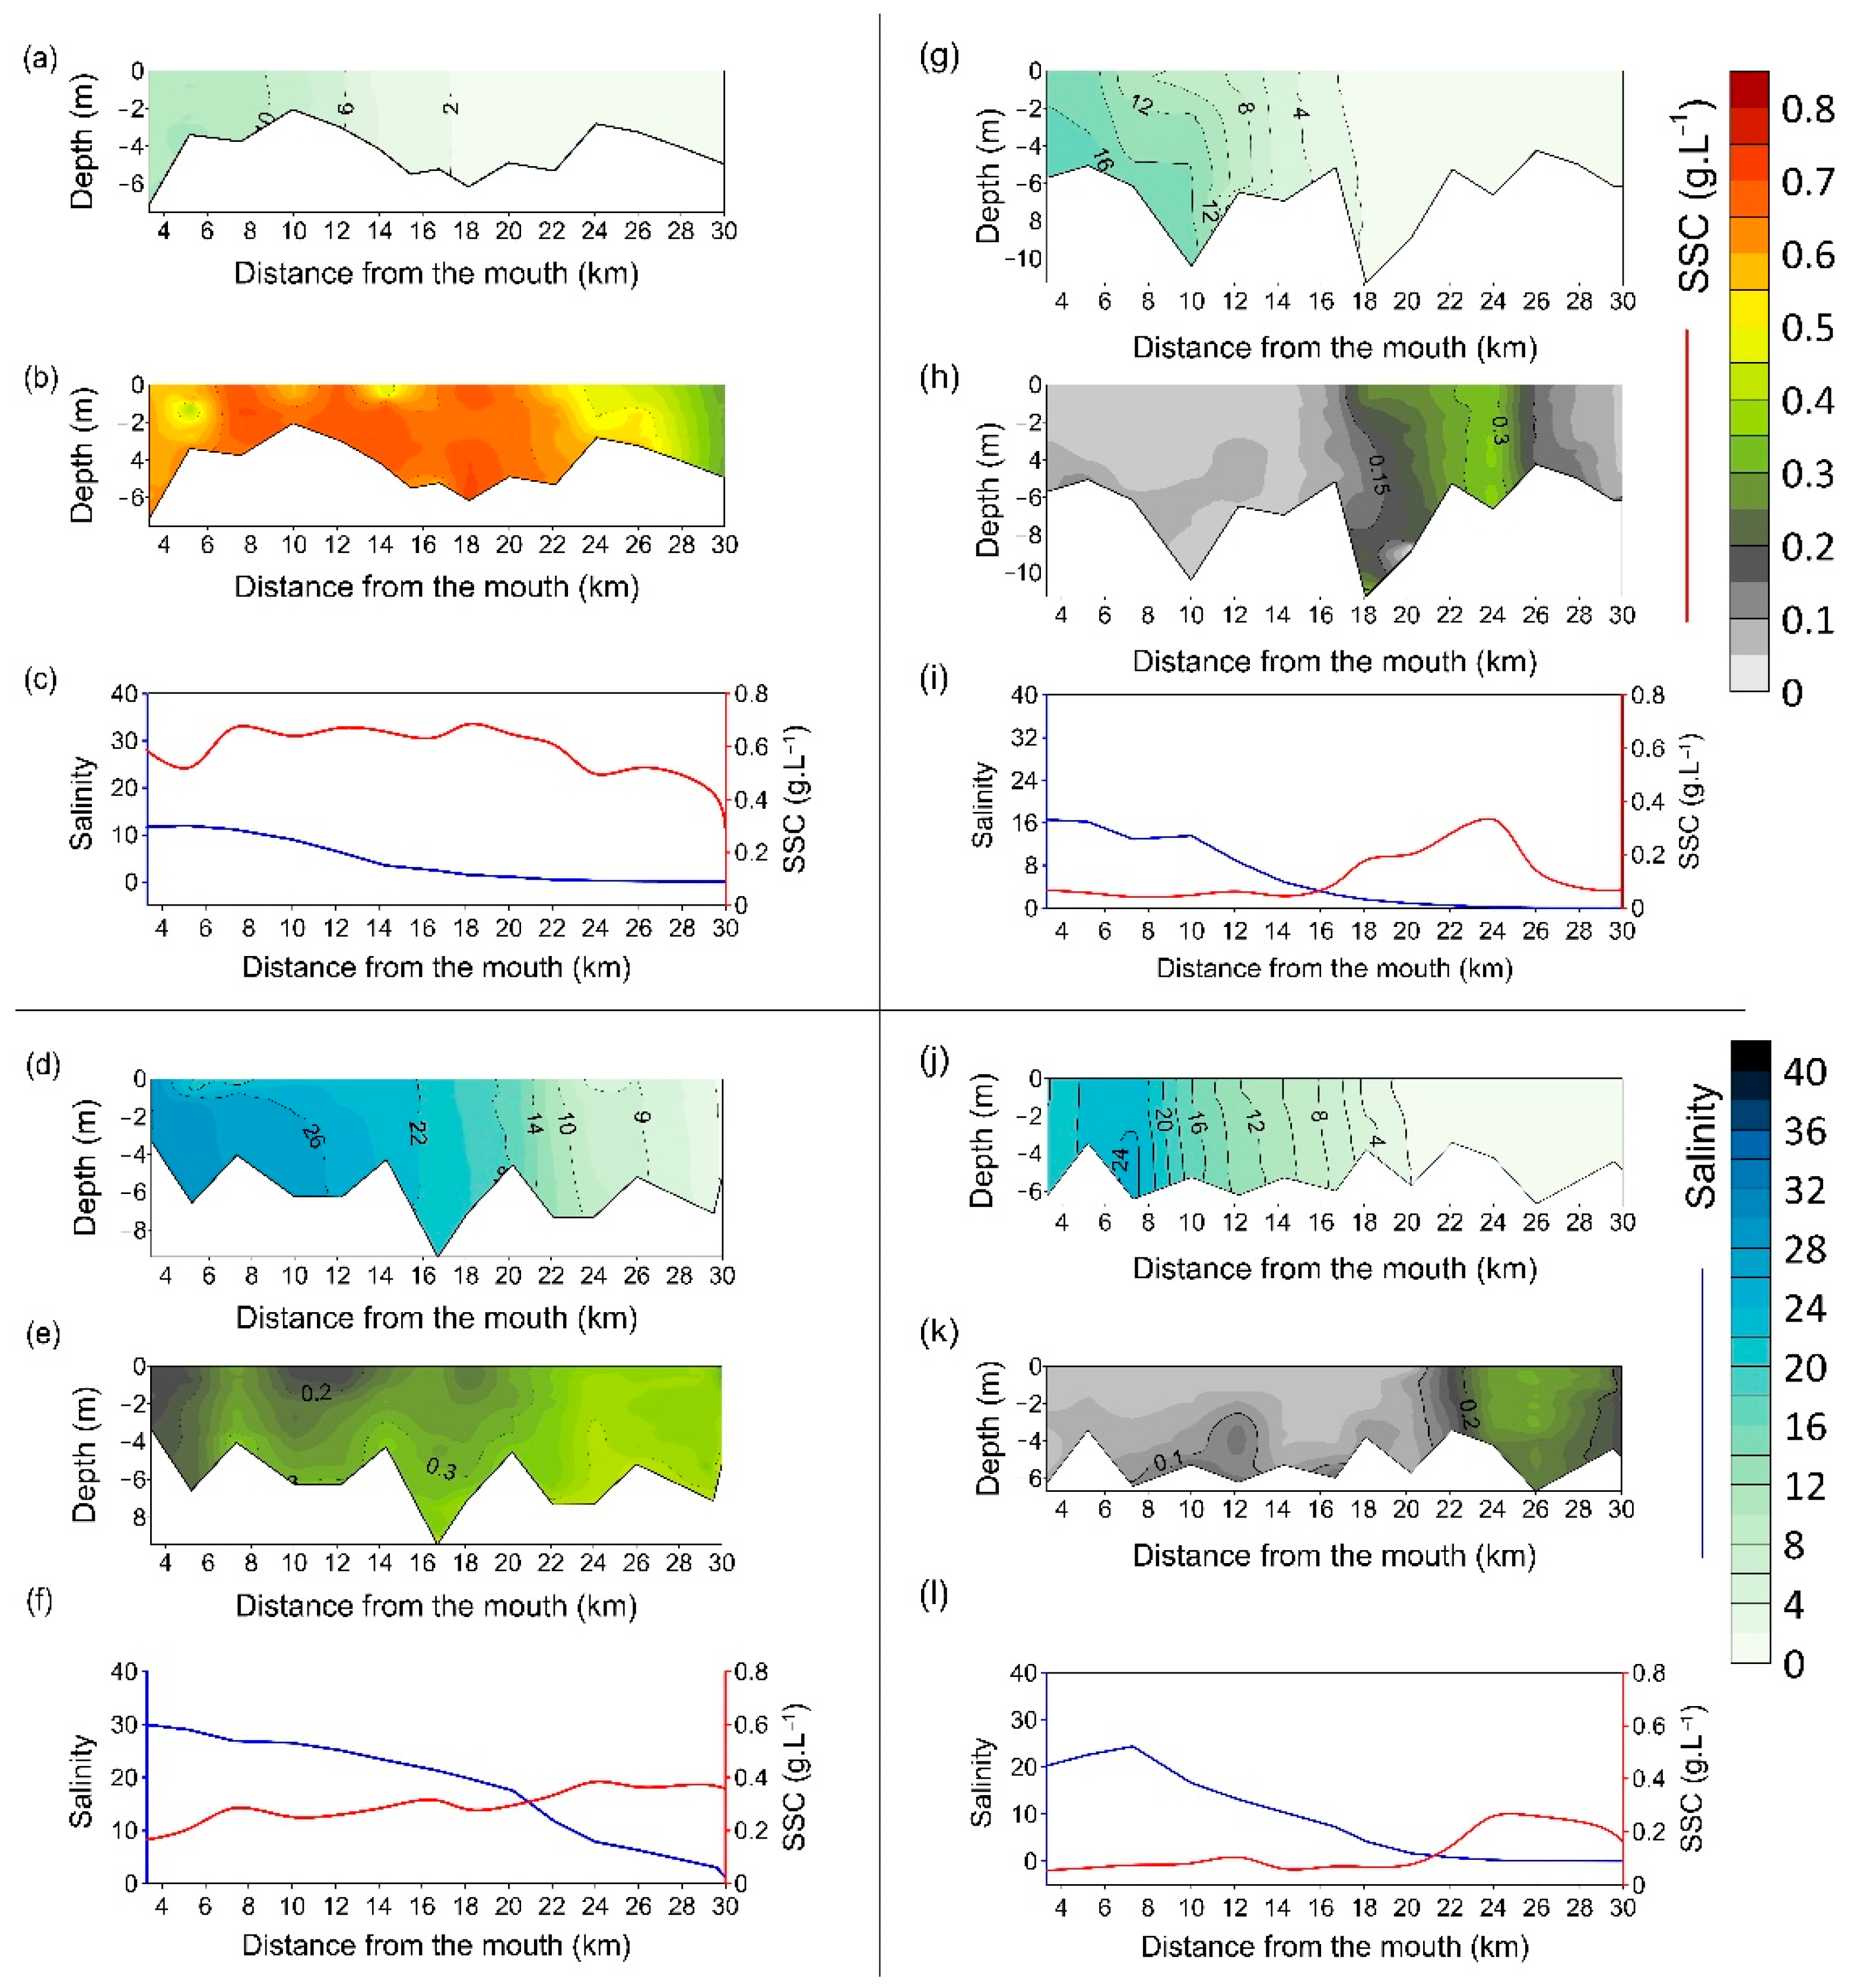
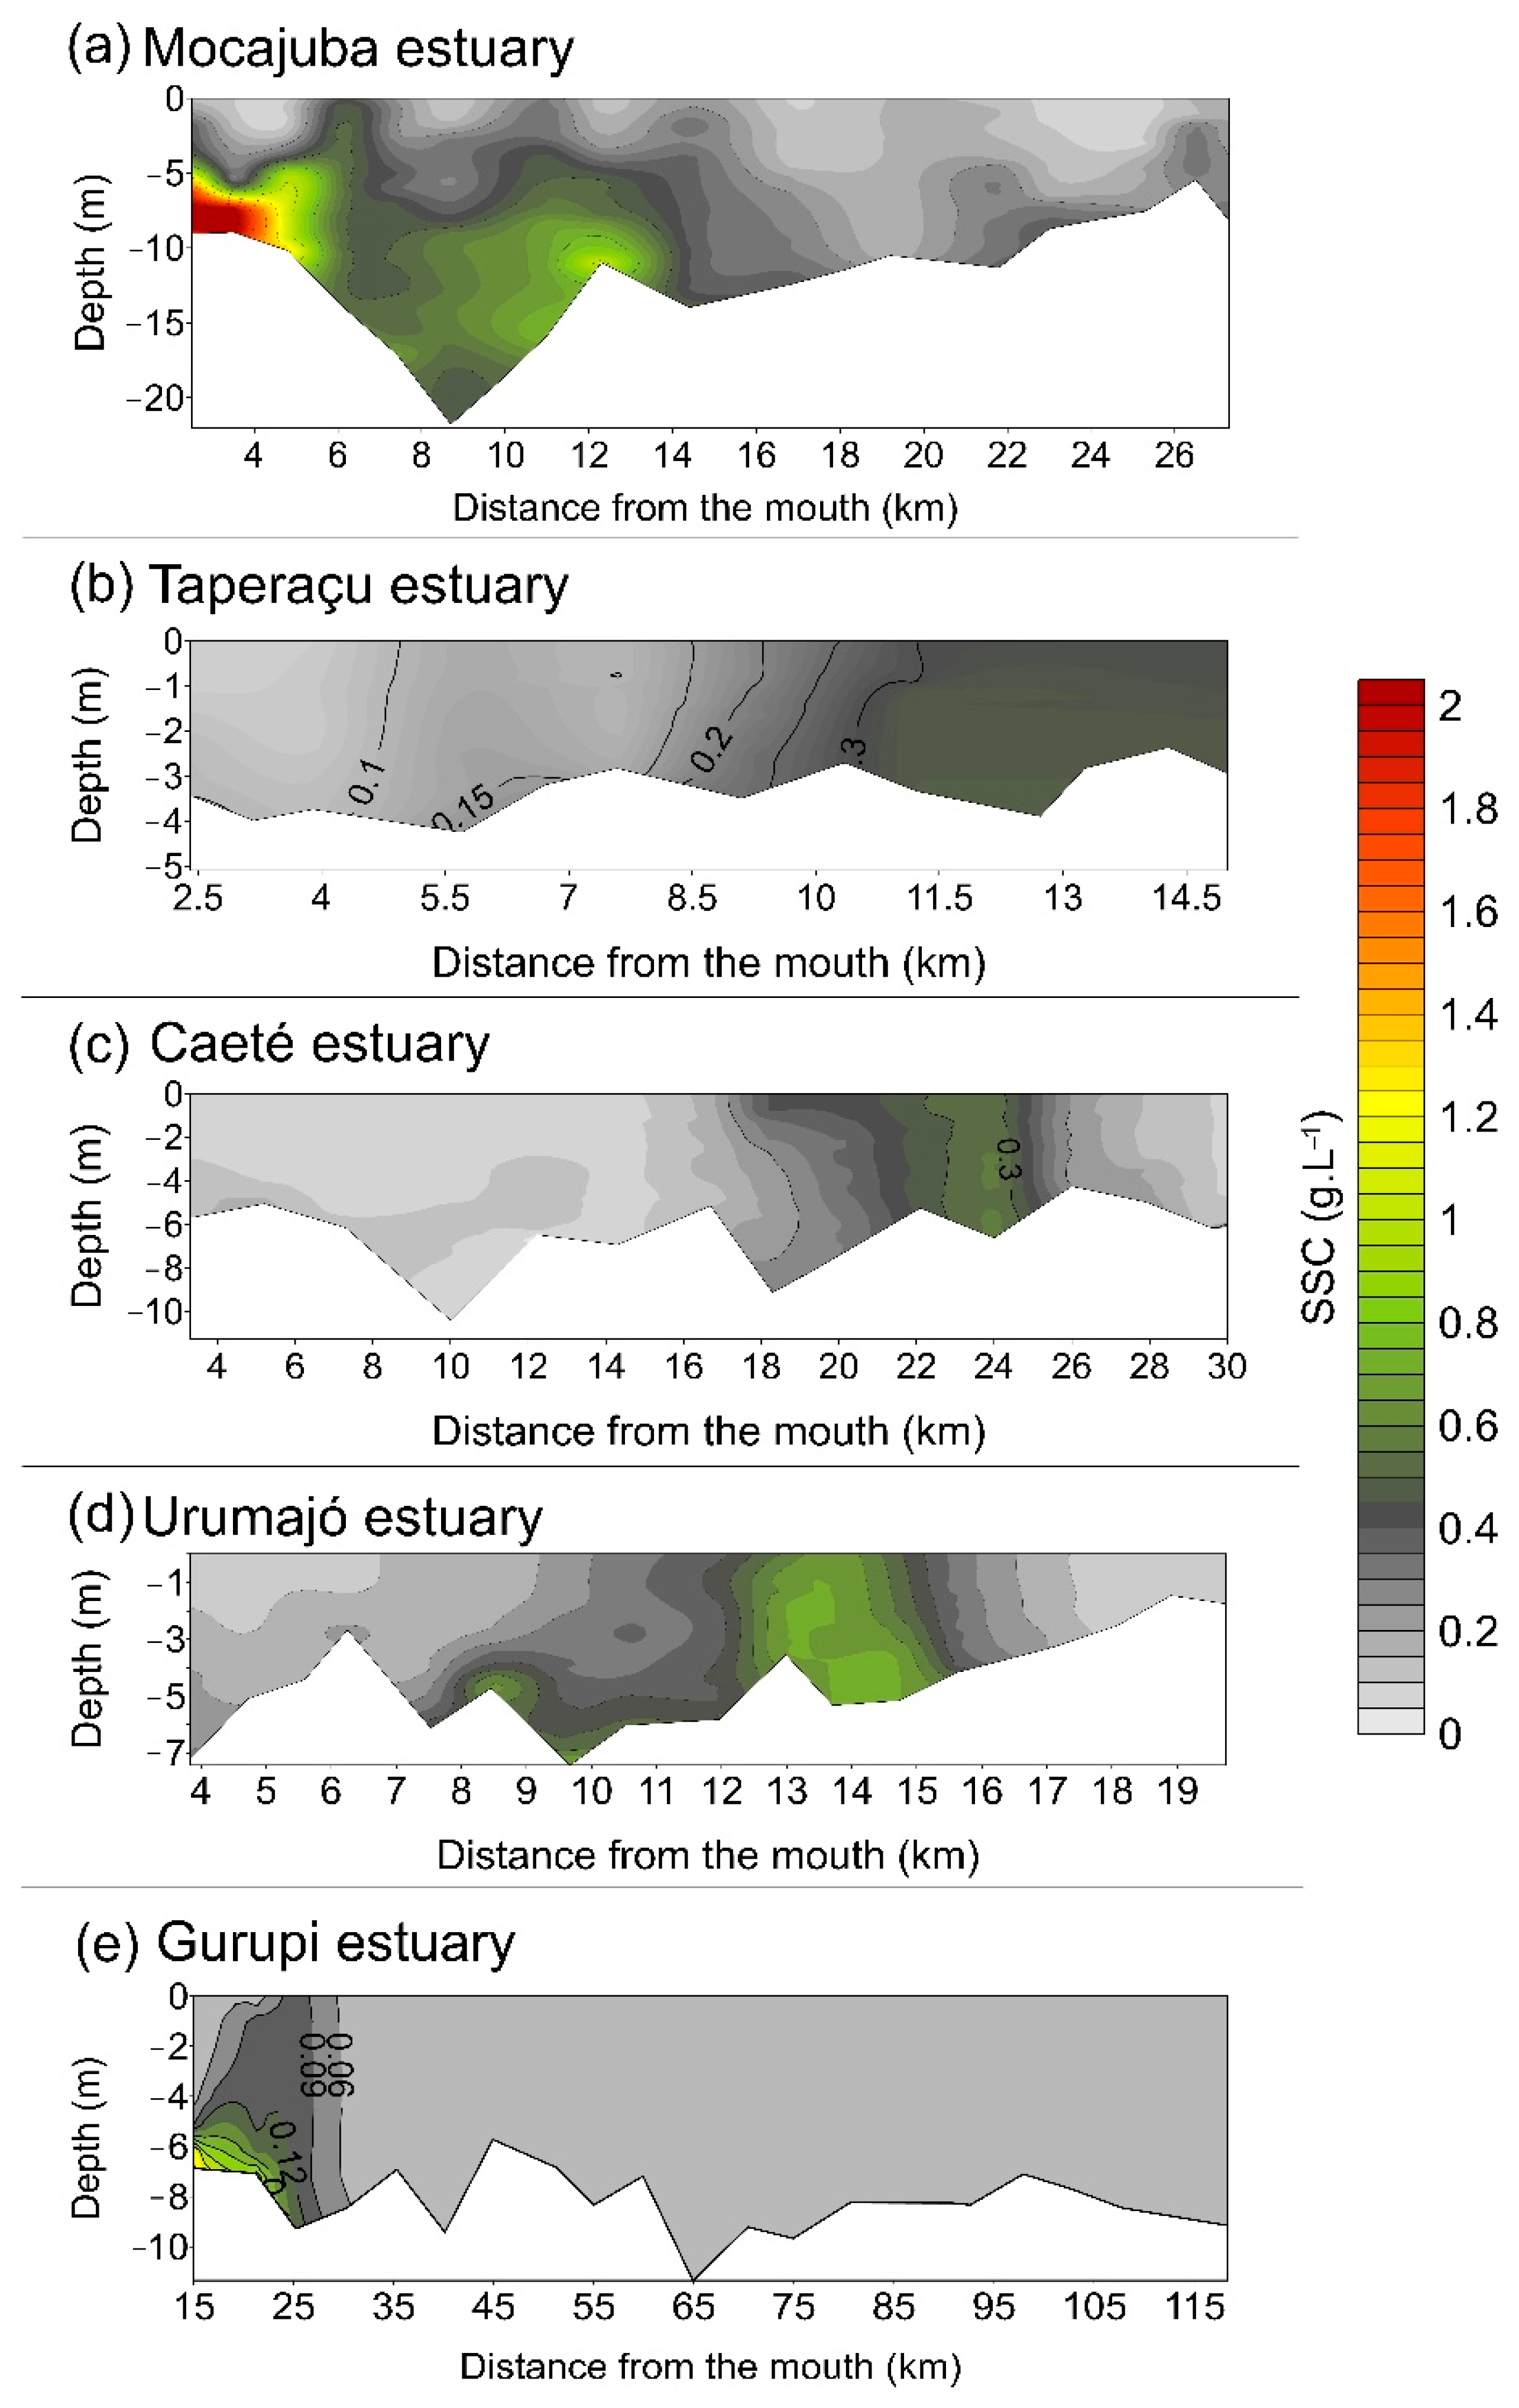
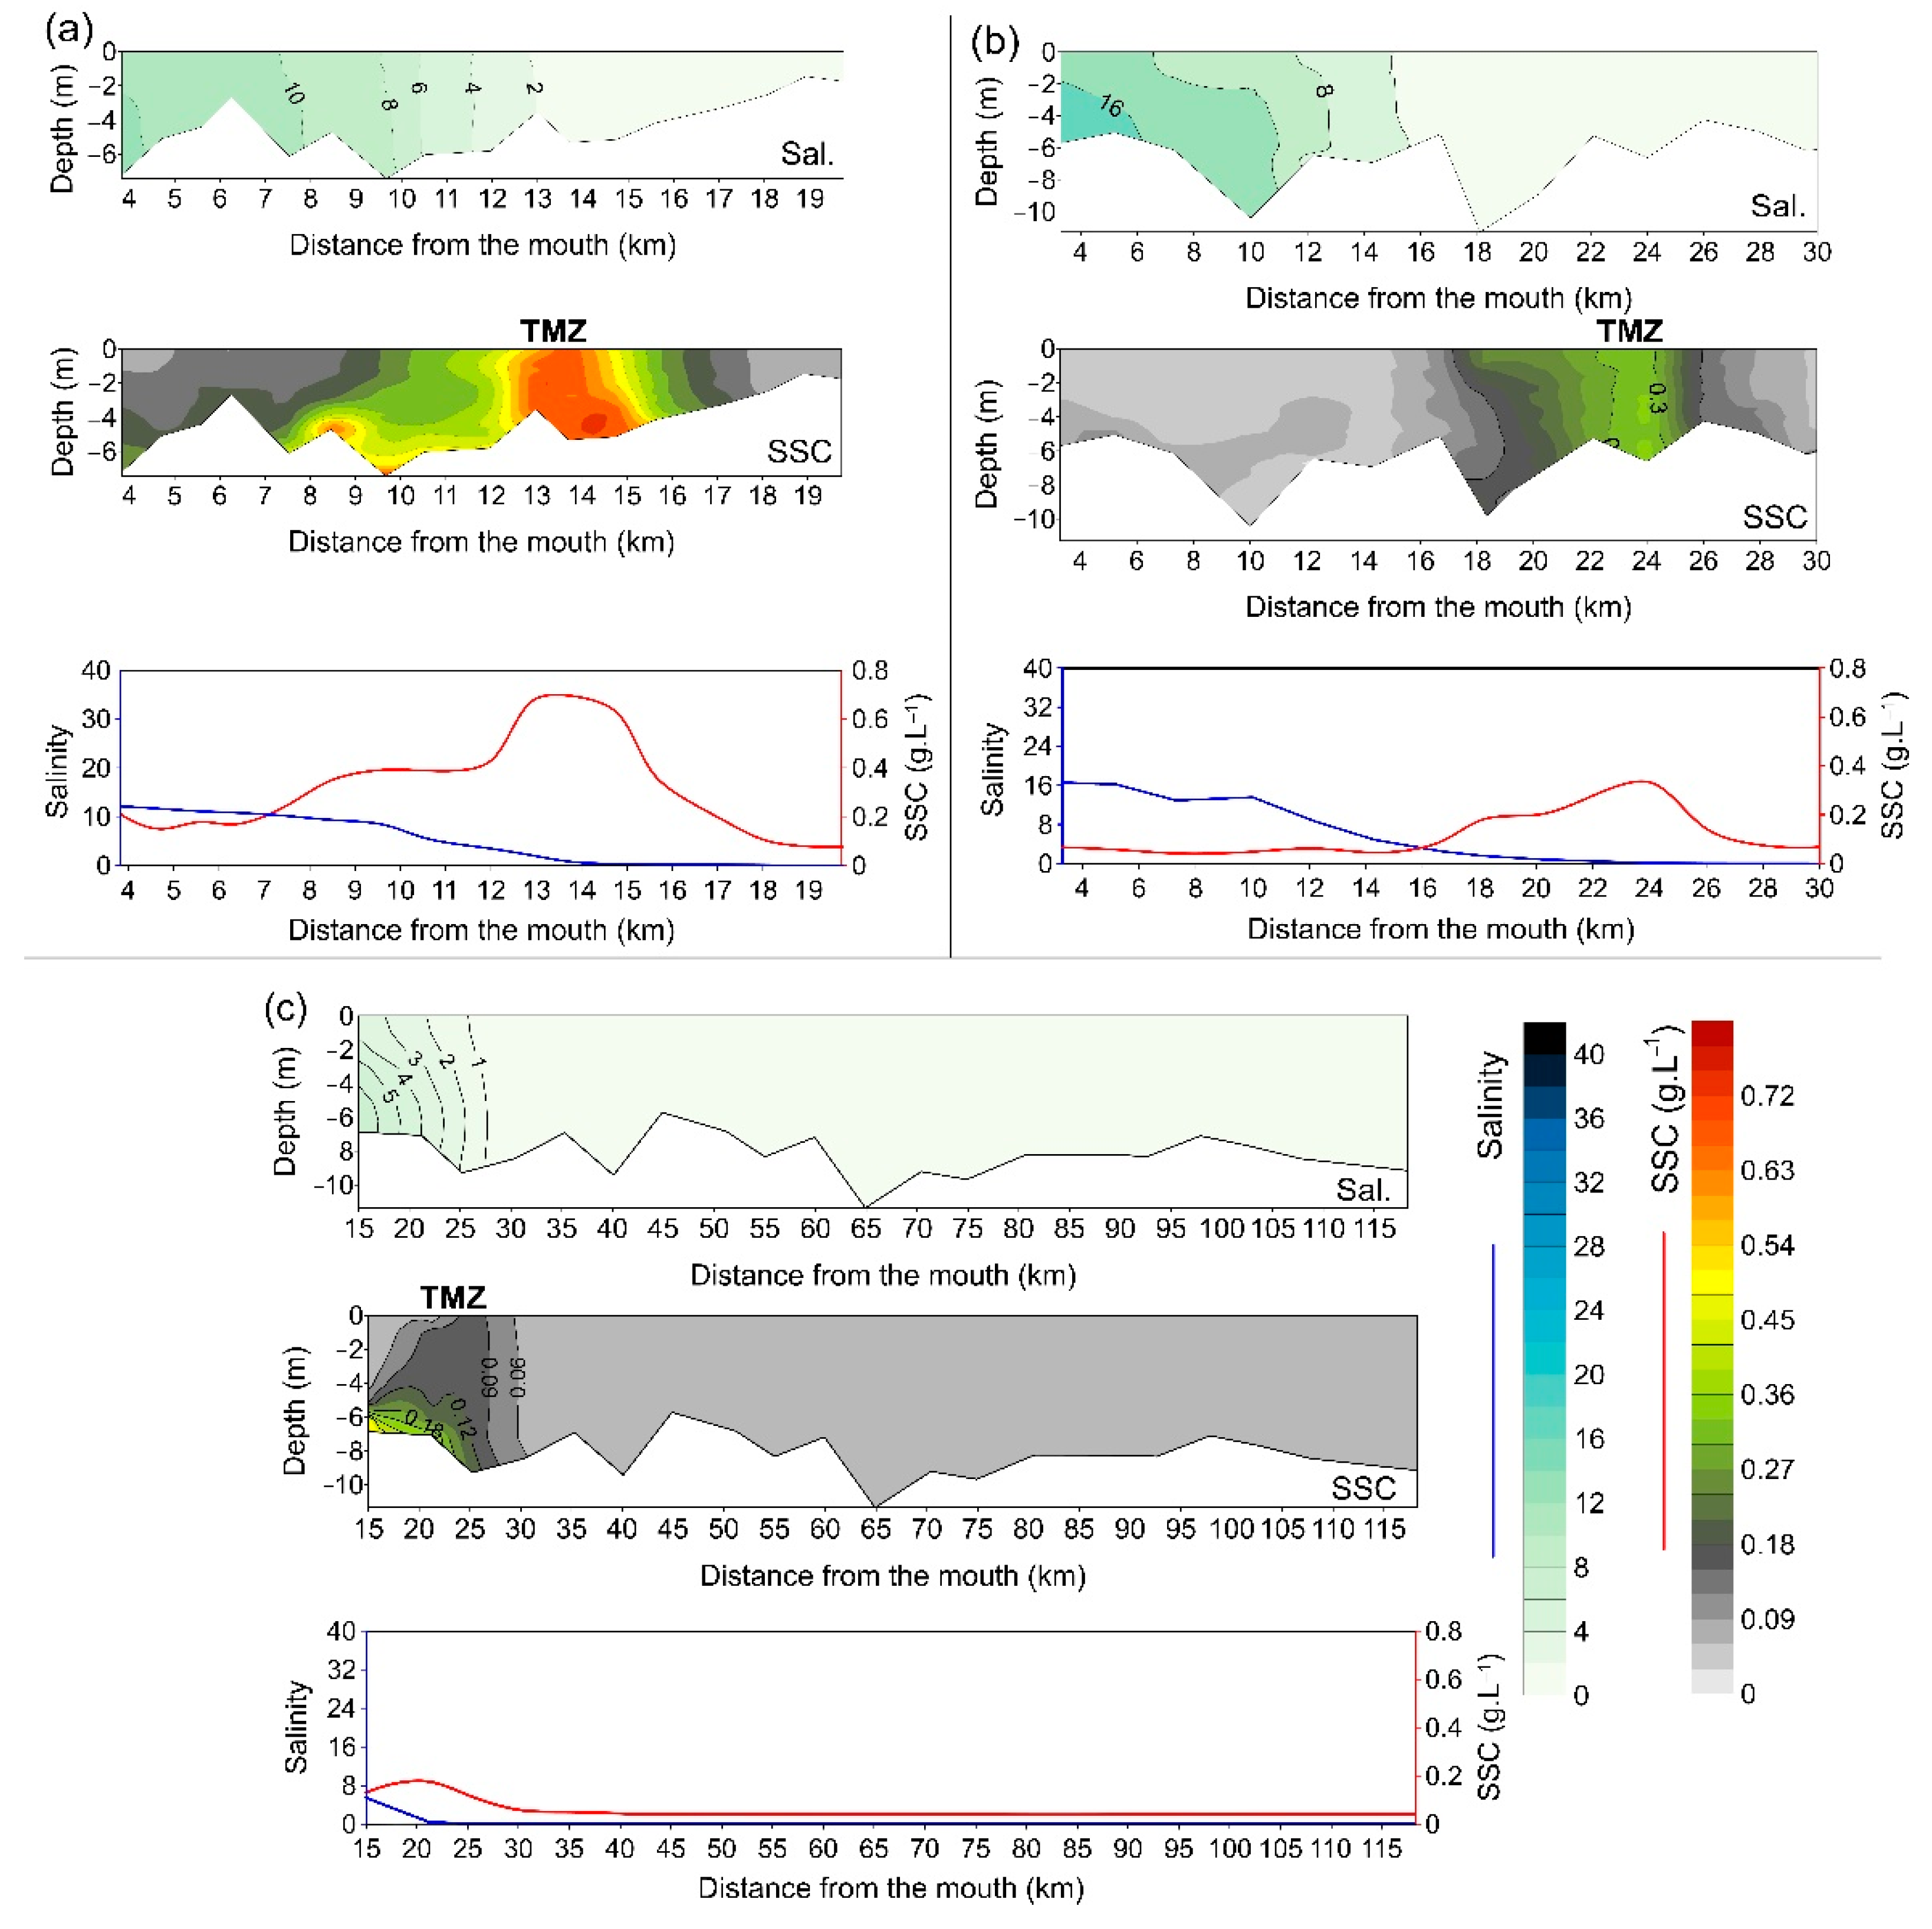
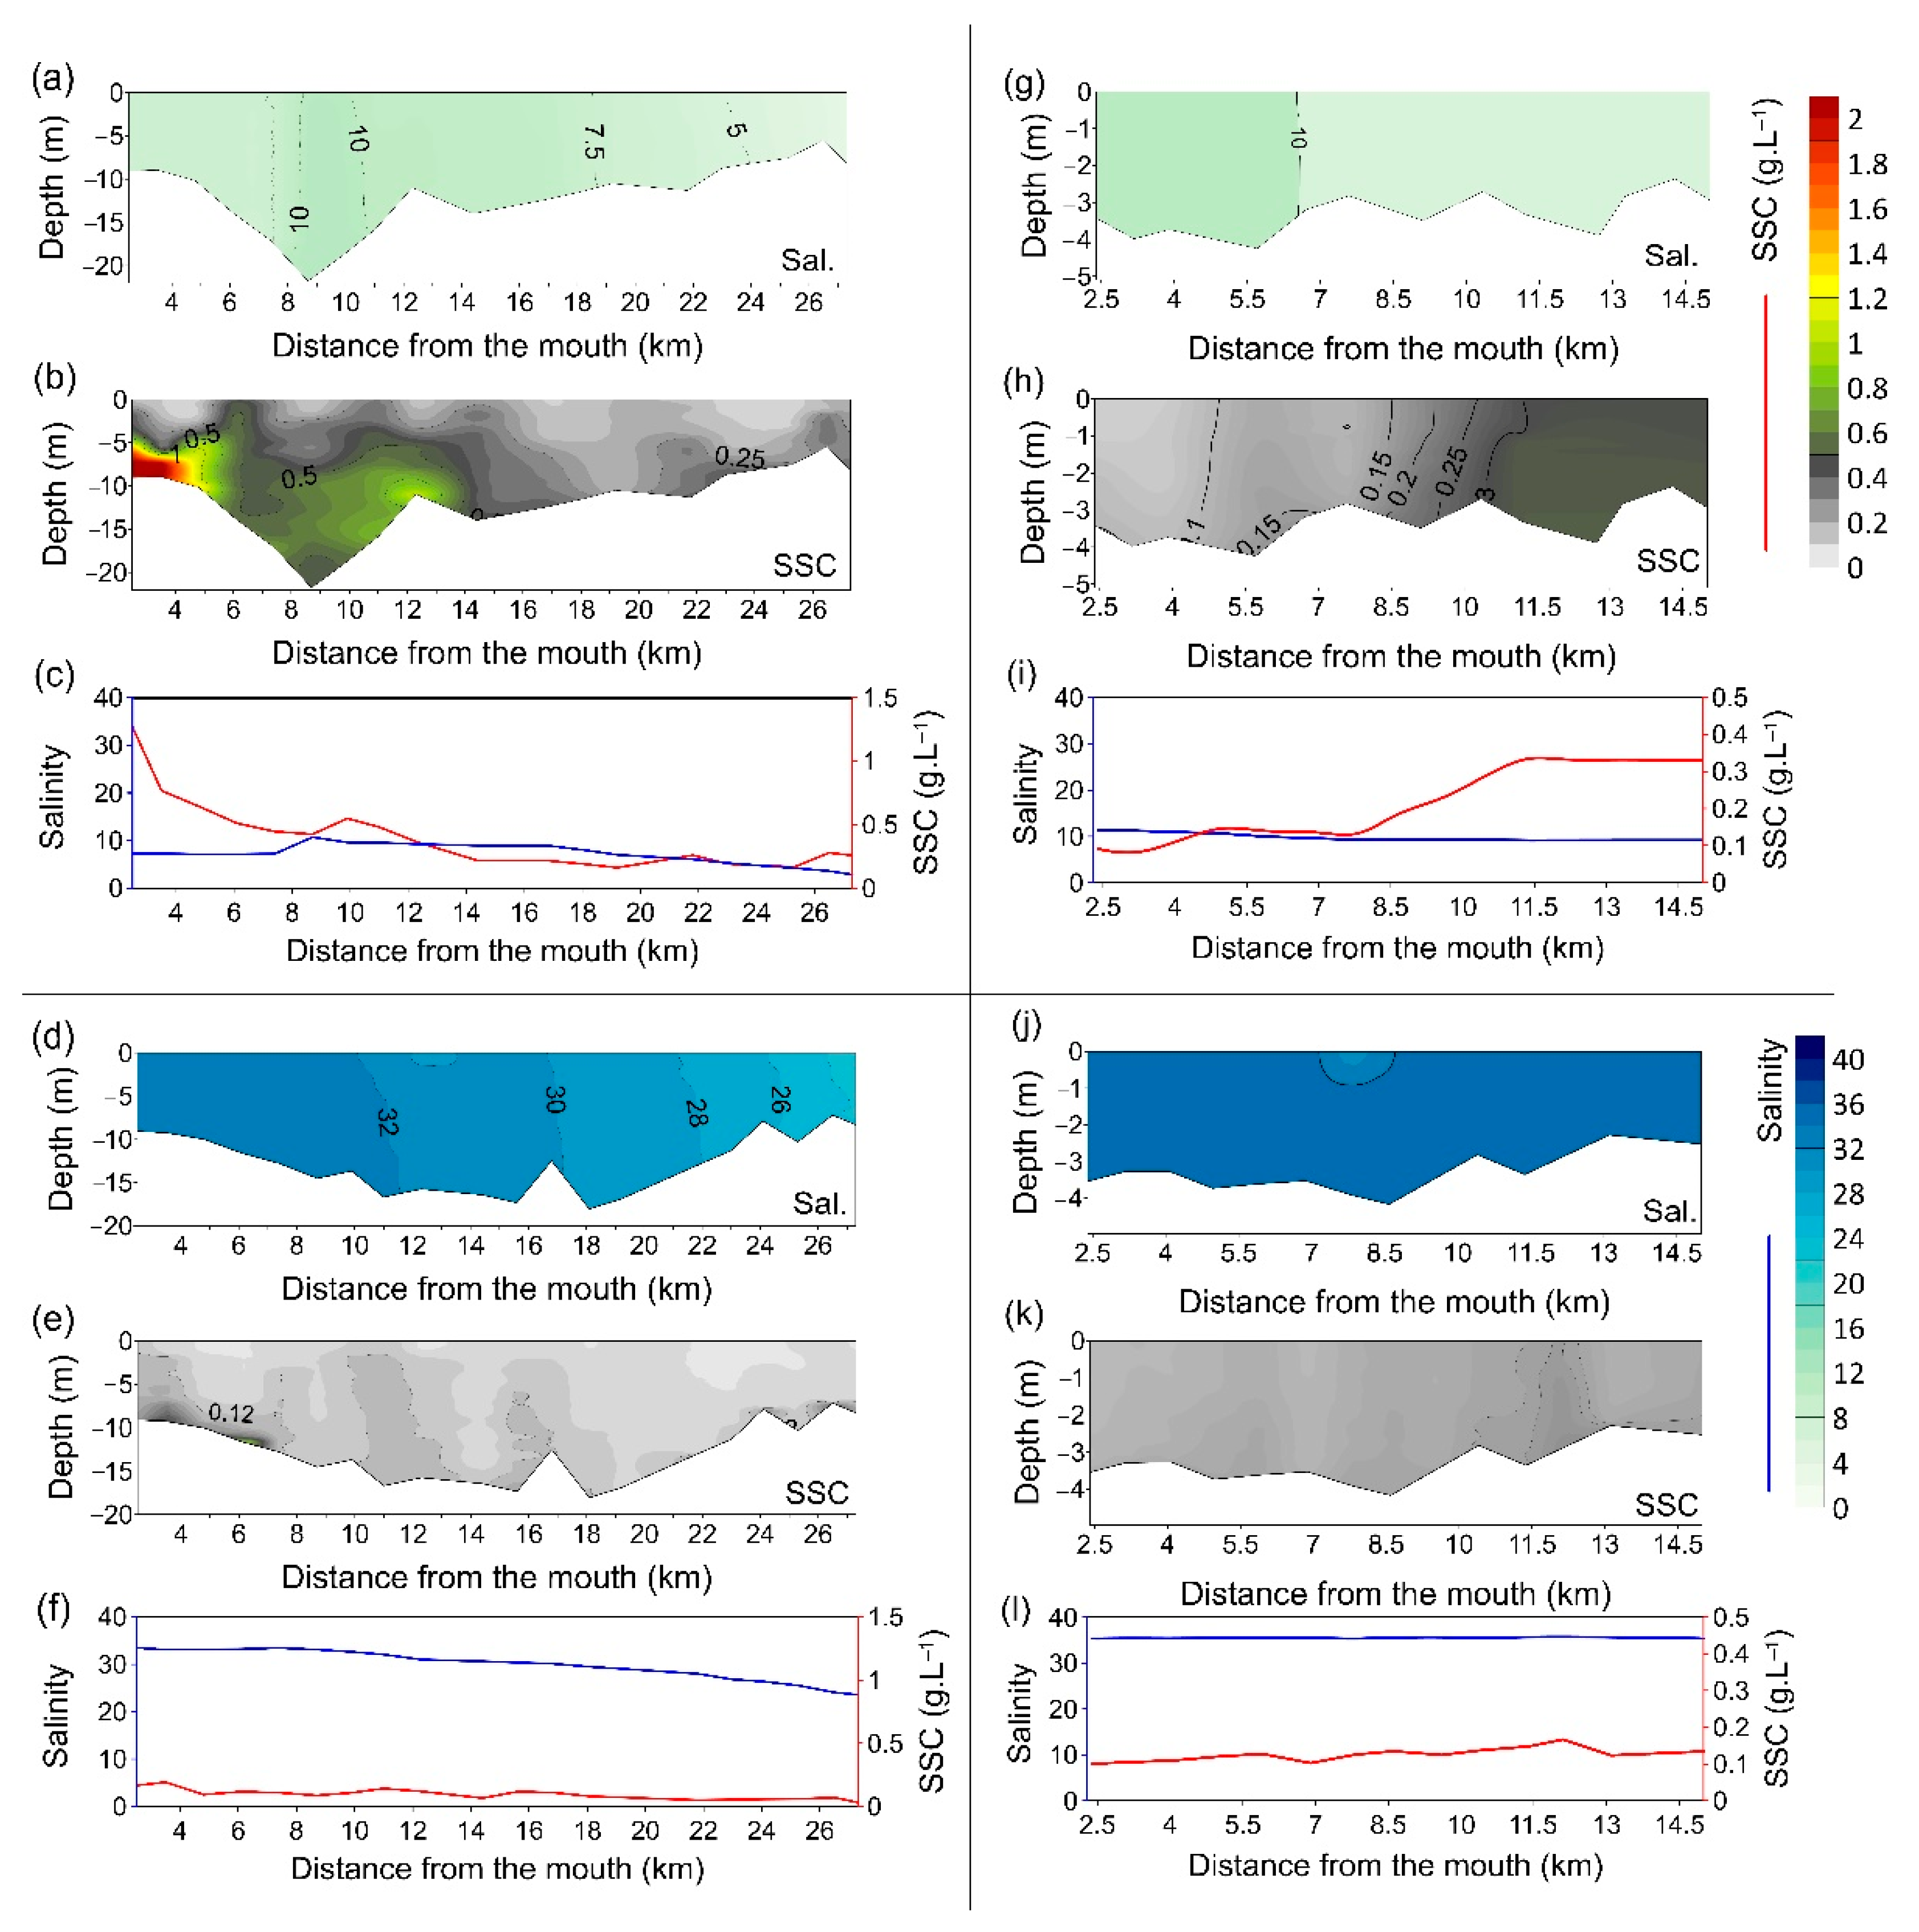
4.1. SSC Distribution Patterns and Salinity
4.1.1. Regional Model of SSC Distribution and River Flow Rate Variations
4.1.2. Estuaries That Do Not Fit the Standard and Their Particularities
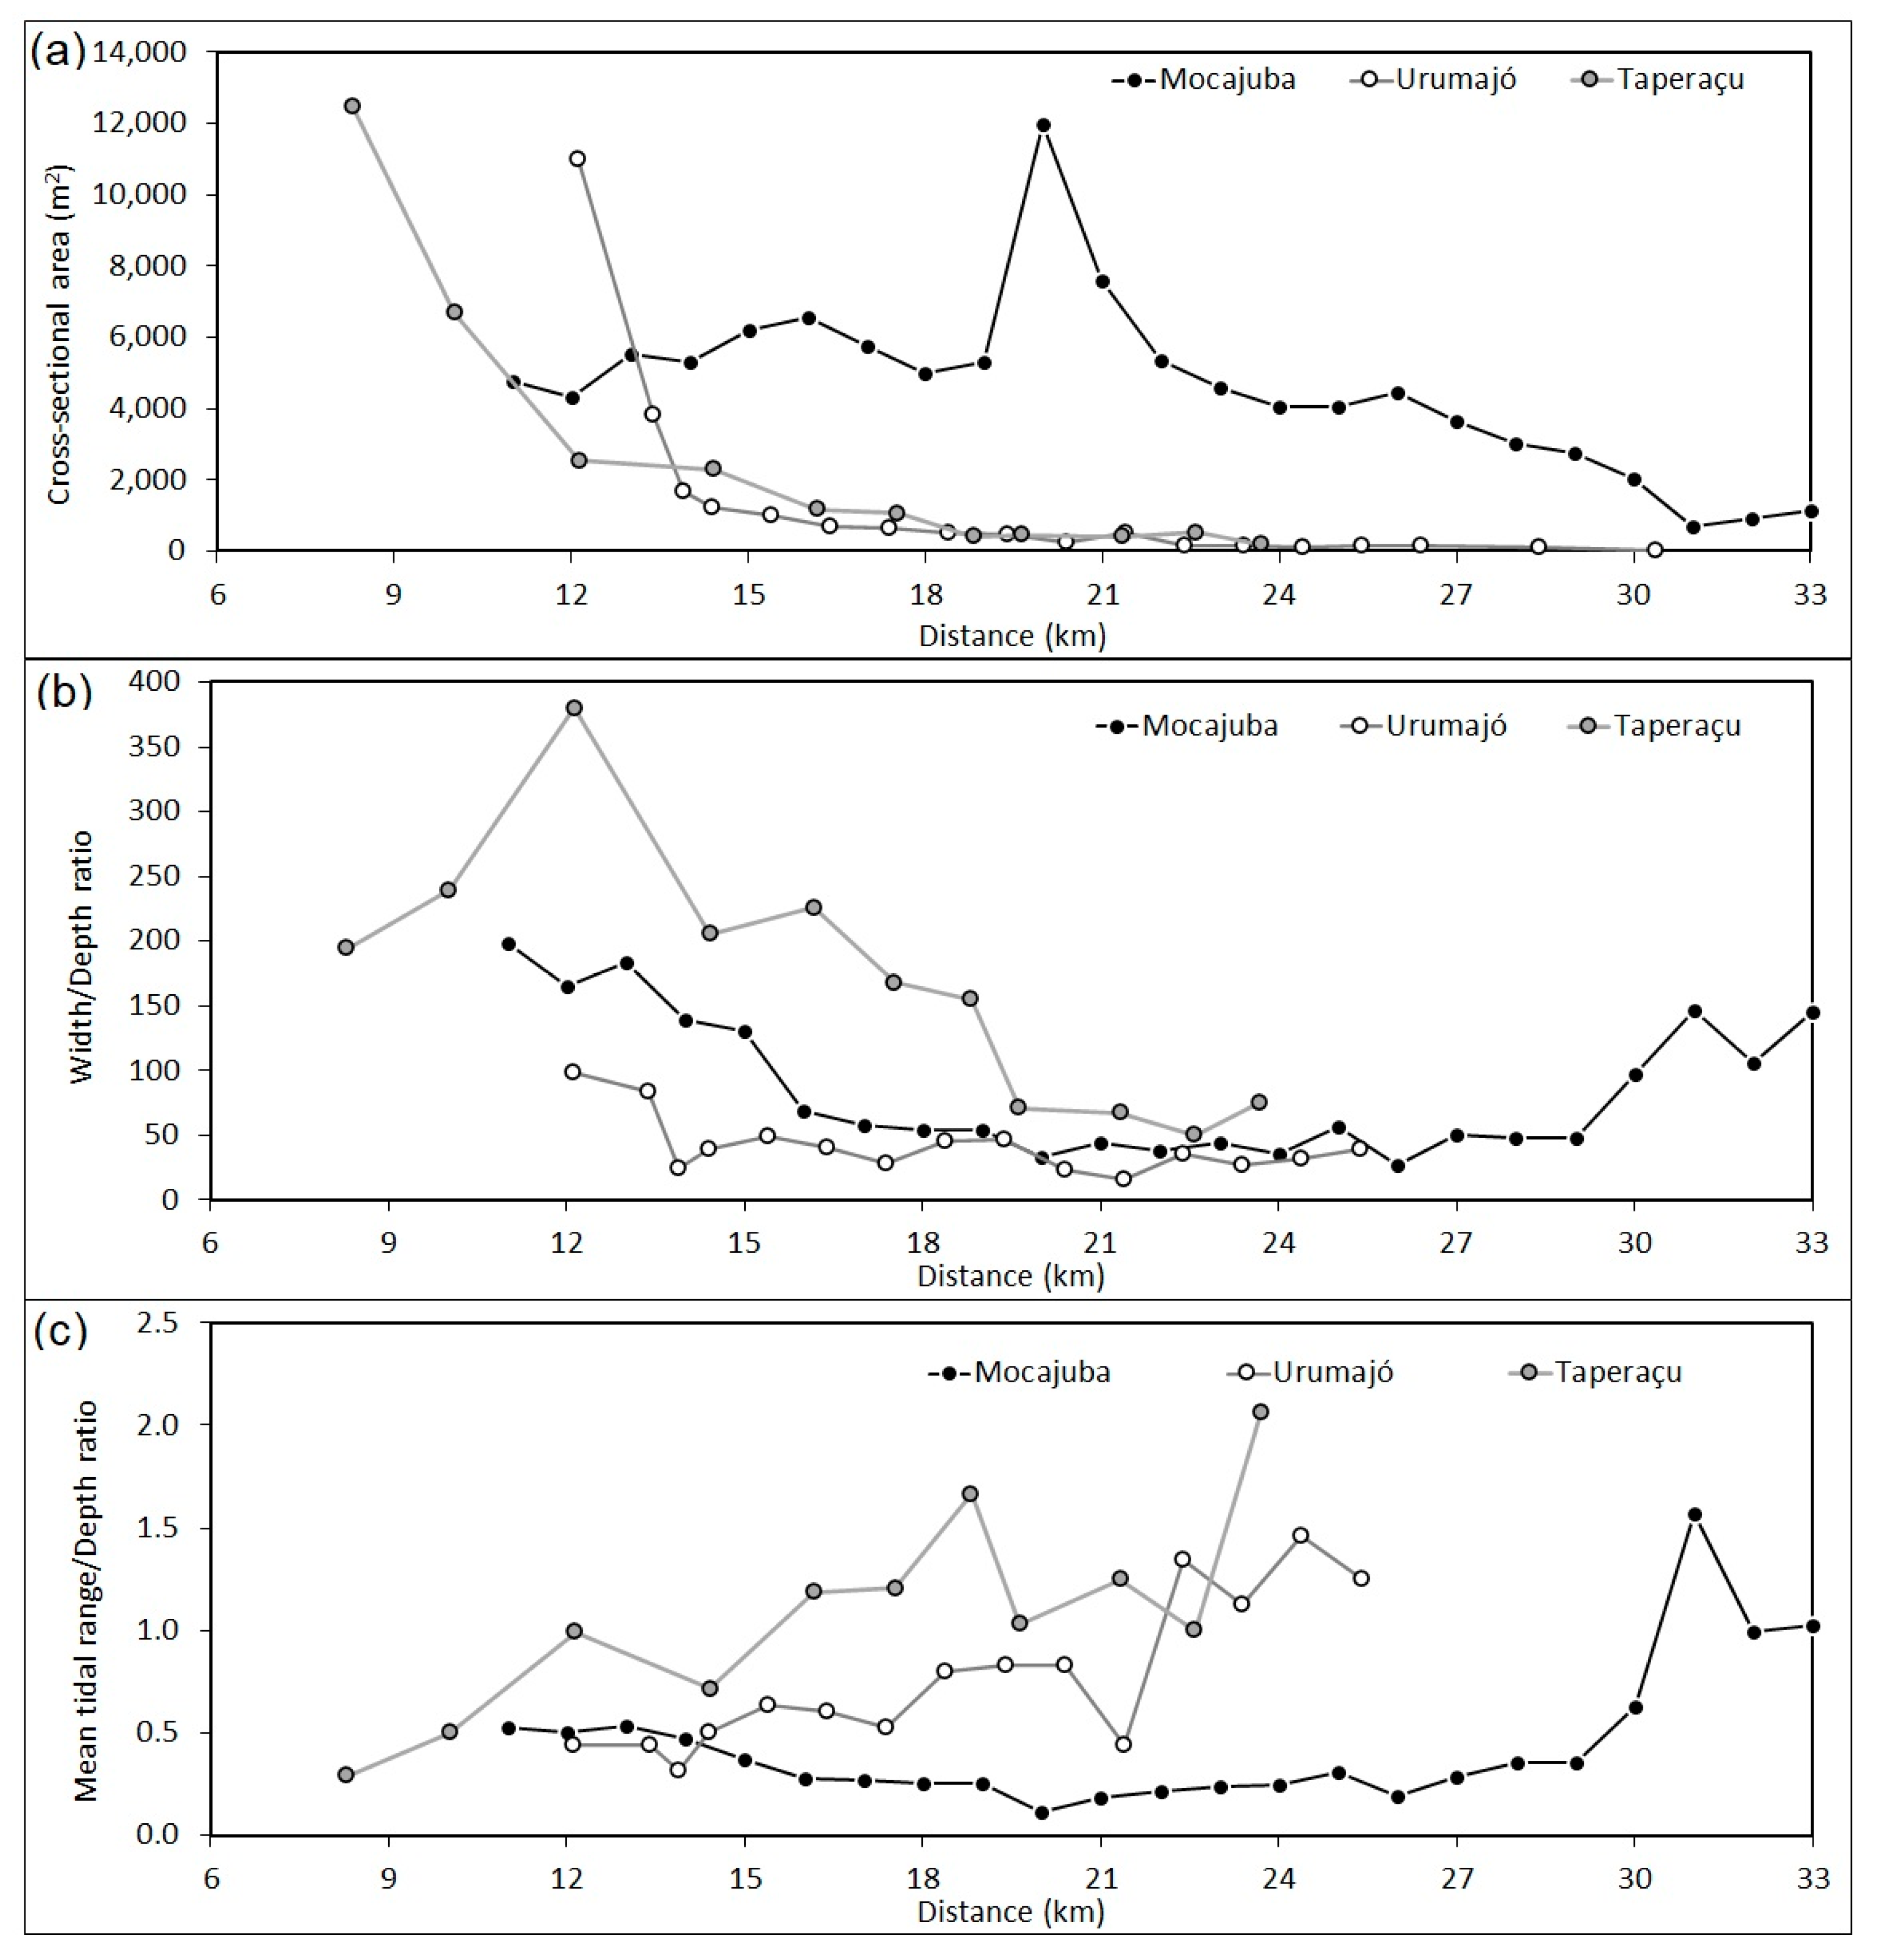
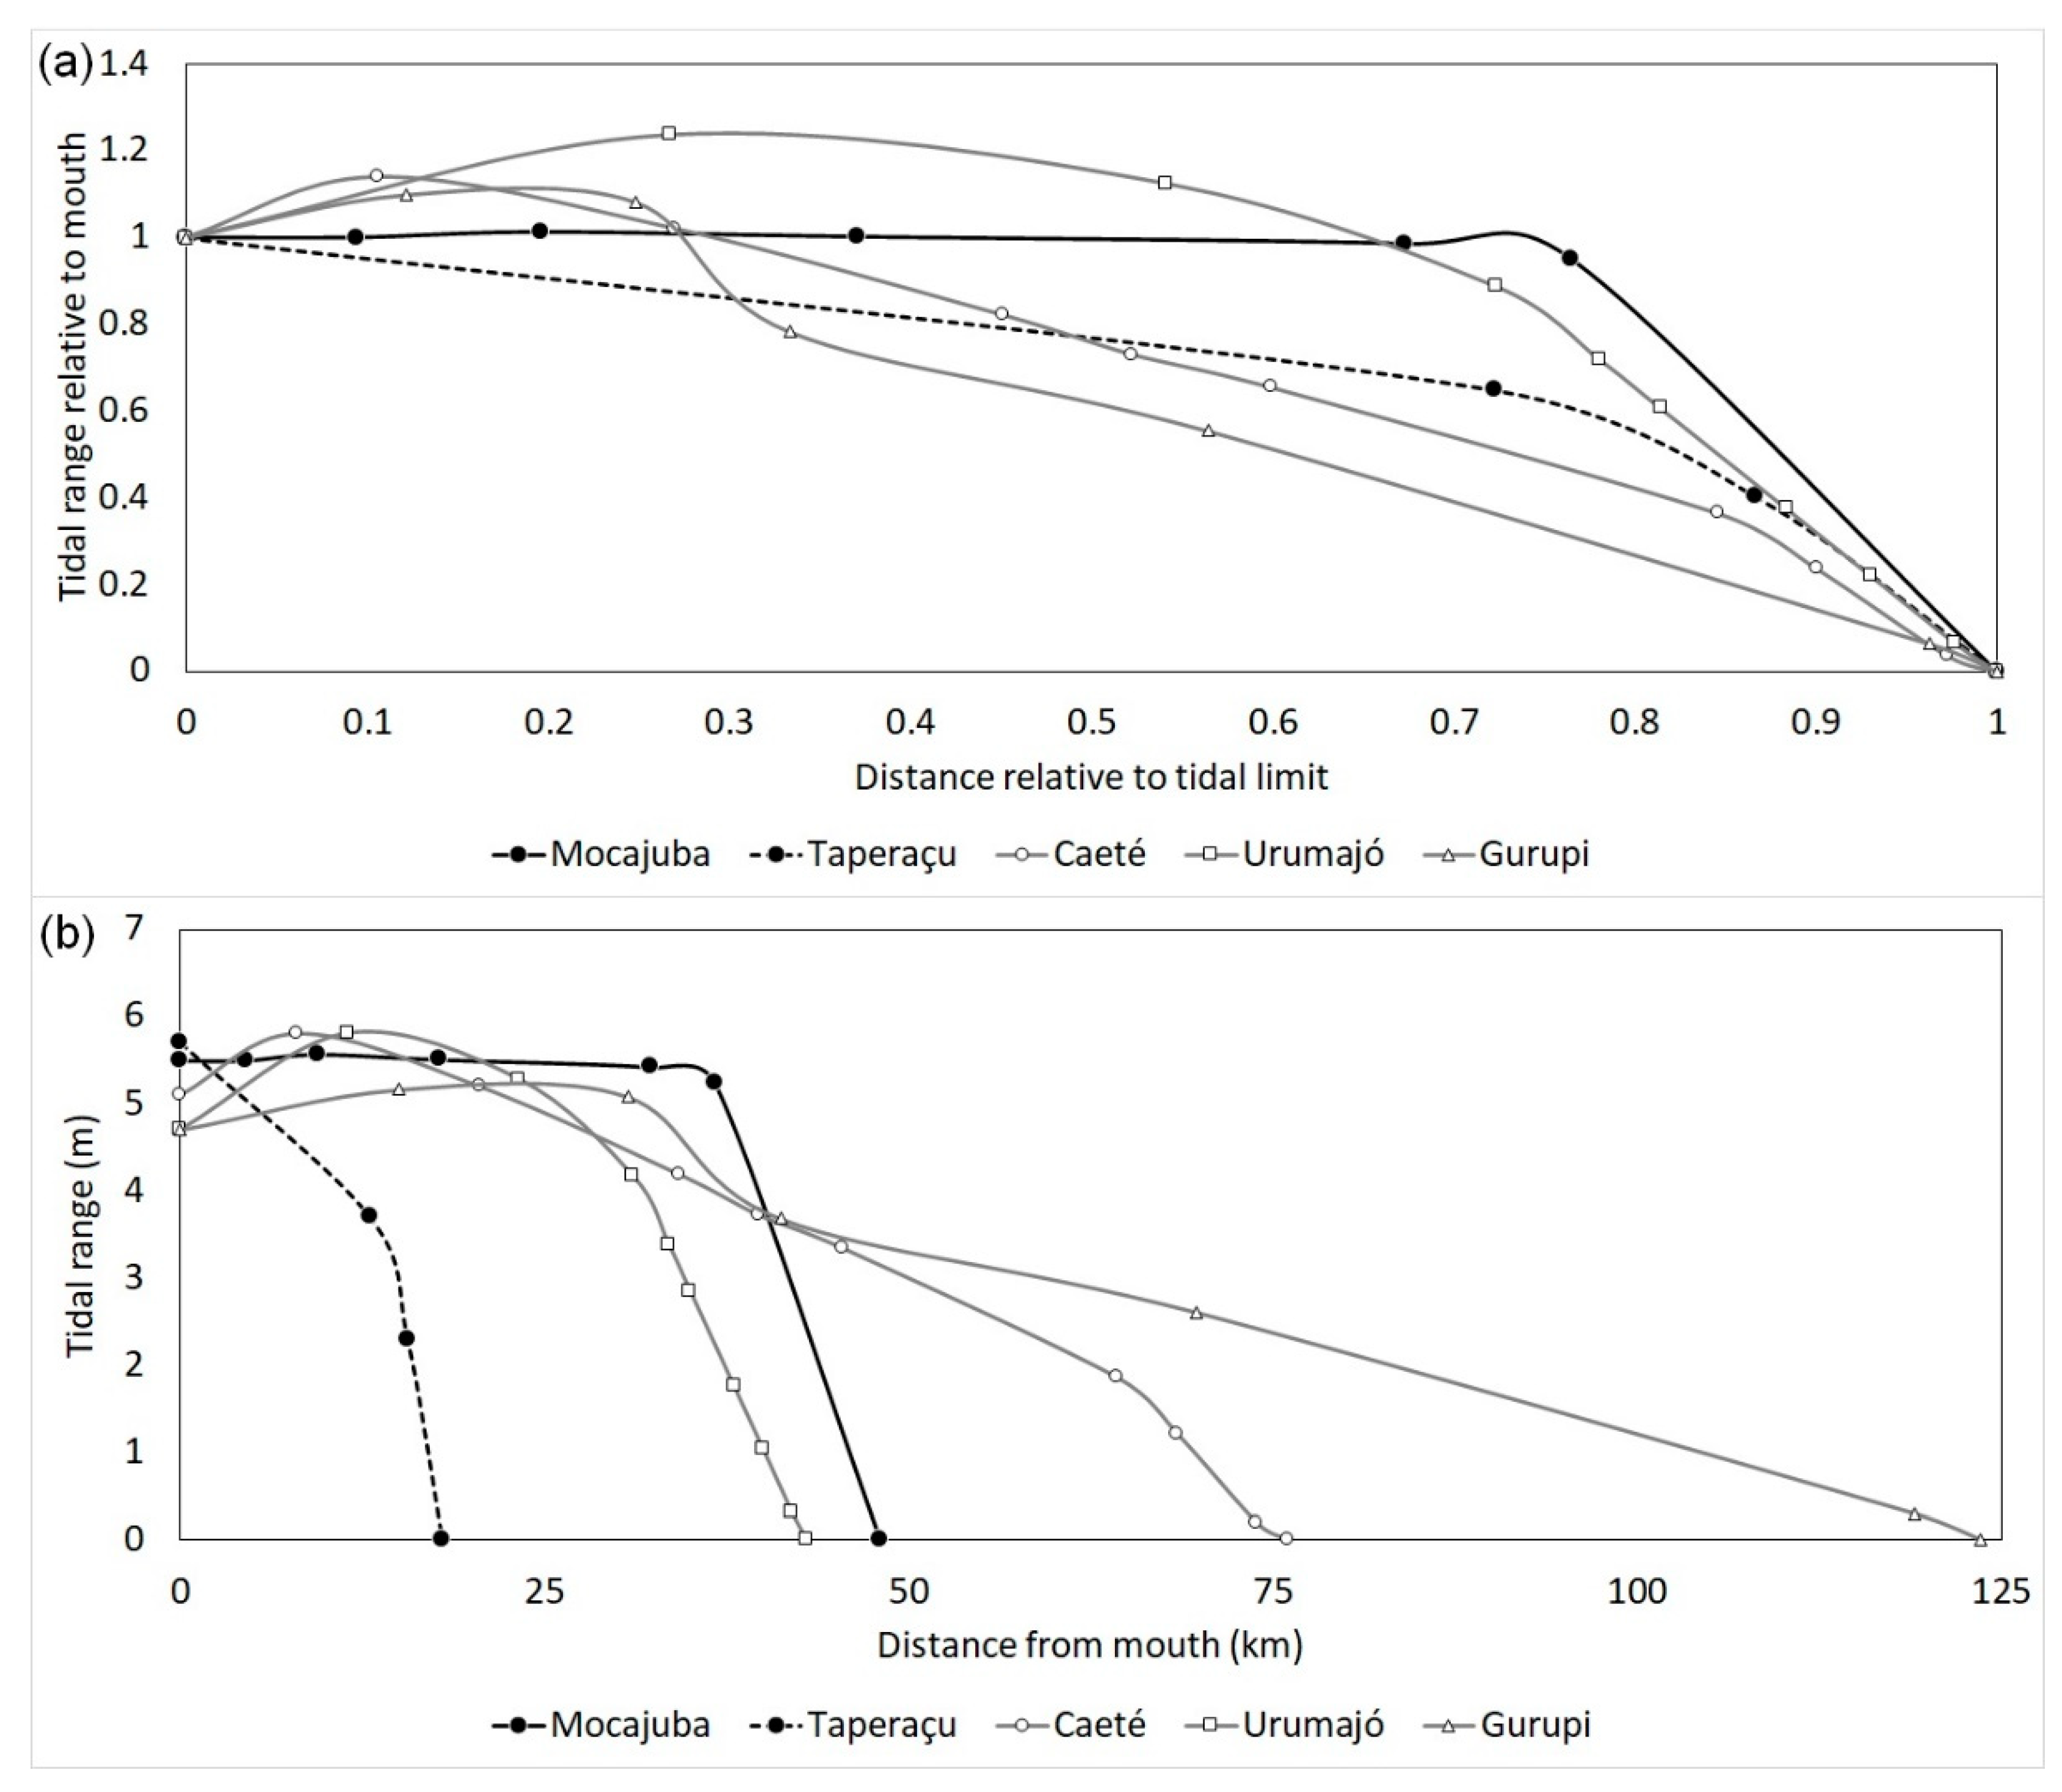
4.2. Interaction of Channel Morphology and Tidal Propagation and Its Control of SSC Patterns
5. Concluding Remarks
Supplementary Materials
Author Contributions
Funding
Institutional Review Board Statement
Informed Consent Statement
Data Availability Statement
Acknowledgments
Conflicts of Interest
References
- Lessa, G.C.; Santos, F.M.; Souza Filho, P.W.; Corrêa-Gomes, L.C. Brazilian estuaries: A geomorphologic and oceanographic perspective. In Brazilian Estuaries. Brazilian Marine Biodiversity; Lana, P., Bernardino, A., Eds.; Springer: Cham, Switzerland, 2018; pp. 1–37. [Google Scholar]
- Fairbridge, R.W. The estuary: Its definition and geodynamic cycle. In Chemistry and Biogeochemistry of Estuaries; Olausson, E., Cato, I., Eds.; John Wiley and Sons Ltd.: New York, NY, USA, 1980; pp. 1–35. [Google Scholar]
- Dalrymple, R.W.; Zaitlin, B.A.; Boyd, R. Estuarine facies models: Conceptual basis and stratigraphic implications. J. Sediment. Petrol. 1992, 62, 1130–1146. [Google Scholar] [CrossRef]
- Boyd, R.; Dalrymple, R.; Zaitlin, B.A. Classification of clastic coastal depositional environments. Sediment. Geol. 1992, 80, 139–150. [Google Scholar] [CrossRef]
- Pritchard, D.W. Estuarine Hydrography. Adv. Geophys. 1952, 1, 243–280. [Google Scholar] [CrossRef]
- Cameron, W.M.; Pritchard, D.W. Estuaries. In The Sea: Ideas and Observations on Progress in the Study of the Seas; Hill, M.N., Ed.; Wiley: New York, NY, USA, 1963; pp. 306–324. [Google Scholar]
- Pritchard, D.W. What is an Estuary: Physical Viewpoint? In Estuaries; Lauff, G.H., Ed.; American Association for the Advancement of Science: Washington, DC, USA, 1967; pp. 3–5. [Google Scholar]
- Caspers, H. Estuaries: Analysis of Definitions and Biological Considerations. In Estuaries; Lauff, G.H., Ed.; American Association for the Advance of Science: Washington, DC, USA, 1967; pp. 6–8. [Google Scholar]
- Hansen, D.V.; Rattray, M. New dimensions in estuary classification. Limnol. Oceanogr. 1966, 11, 319–326. [Google Scholar] [CrossRef]
- Ibañez, C.; Pont, D.; Prat, N. Characterization of the Ebre and Rhone estuaries: A basis for defining and classifying salt-wedge estuaries. Limnol. Oceanogr. 1997, 42, 89–101. [Google Scholar] [CrossRef] [Green Version]
- Dyer, K.R. Estuaries: A Physical Introduction, 2nd ed.; John Wiley and Sons Ltd.: New York, NY, USA, 1997; ISBN 0-471-9741-4. [Google Scholar]
- Chappell, J.; Woodroffe, C. Macrotidal estuaries. In Coastal Evolution: Late Quaternary Shoreline Morphodynamics; Carter, R.W., Woodroffe, C.D., Eds.; Cambridge University Press: Cambridge, UK, 1994; pp. 187–218. [Google Scholar]
- Boon, J.D.; Byrne, R.J. On basin hyposmetry and the morphodynamic response of coastal inlet systems. Mar. Geol. 1981, 40, 27–48. [Google Scholar] [CrossRef]
- Friedrichs, C.T.; Aubrey, D.G. Nonlinear tidal distortion in shallow well-mixed estuaries. Estuar. Coast. Shelf Sci. 1988, 27, 521–545. [Google Scholar] [CrossRef]
- Lessa, G.; Masselink, G. Morphodynamic evolution of a macrotidal barrier estuary. Mar. Geol. 1995, 129, 25–46. [Google Scholar] [CrossRef]
- Burchard, H.; Schuttelaars, H.M.; Ralston, D.K. Sediment trapping in estuaries. Ann. Rev. Mar. Sci. 2018, 10, 371–395. [Google Scholar] [CrossRef] [PubMed]
- Dyer, K.R. Sediment transport processes in estuaries. In Developments in Sedimentology; Perillo, G.M.E., Ed.; Elsevier Science: Oxford, UK, 1995; Volume 53, pp. 423–449. [Google Scholar]
- Nichols, M.M.; Biggs, R.B. Estuaries. In Coastal Sedimentary Environments; Davis, R.A., Jr., Ed.; Springer: New York, NY, USA, 1985; pp. 77–186. [Google Scholar]
- Van Maanen, B.; Sottolichio, A. Hydro- and sediment dynamics in the Gironde estuary (France): Sensitivity to seasonal variations in river inflow and sea-level rise. Cont. Shelf Res. 2018, 165, 37–50. [Google Scholar] [CrossRef]
- Asp, N.E.; Gomes, V.J.C.; Schettini, C.A.F.; Souza-Filho, P.W.M.; Siegle, E.; Ogston, A.S.; Nittrouer, C.A.; Silva, J.N.S.; Nascimento, W.R.; Souza, S.R.; et al. Sediment dynamics of a tropical tide-dominated estuary: Turbidity maximum, mangroves and the role of the Amazon River sediment load. Estuar. Coast. Shelf Sci. 2018, 214, 10–24. [Google Scholar] [CrossRef]
- Capo, S.; Sottolichio, A.; Brenon, I.; Castaing, P.; Ferry, L. Morphology, hydrography and sediment dynamics in a mangrove estuary: The Konkoure Estuary, Guinea. Mar. Geol. 2006, 230, 199–215. [Google Scholar] [CrossRef]
- Jiang, X.; Lu, B.; He, Y. Response of the turbidity maximum zone to fluctuations in sediment discharge from river to estuary in the Changjiang Estuary (China). Estuar. Coast. Shelf Sci. 2013, 131, 24–30. [Google Scholar] [CrossRef] [Green Version]
- Gong, W.; Jia, L.; Shen, J.; Liu, J.T. Sediment transport in response to changes in river discharge and tidal mixing in a funnel-shaped micro-tidal estuary. Cont. Shelf Res. 2014, 76, 89–107. [Google Scholar] [CrossRef]
- Uncles, R.J.; Stephens, J.A. Distributions of suspended sediment at high water in a macrotidal estuary. J. Geophys. Res. Ocean. 1989, 94, 14395–14405. [Google Scholar] [CrossRef]
- Azhikodan, G.; Yokoyama, K. Spatio-temporal variability of phytoplankton (Chlorophyll-a) in relation to salinity, suspended sediment concentration, and light intensity in a macrotidal estuary. Cont. Shelf Res. 2016, 126, 15–26. [Google Scholar] [CrossRef]
- Azhikodan, G.; Yokoyama, K. Erosion and sedimentation pattern of fine sediments and its physical characteristics in a macrotidal estuary. Sci. Total Environ. 2021, 753, 142025. [Google Scholar] [CrossRef]
- McAnally, W.H.; Friedrichs, C.; Hamilton, D.; Hayter, E.; Shrestha, P.; Rodriguez, H.; Sheremet, A.; Teeter, A. Management of fluid mud in estuaries, bays, and lakes. I: Present state of understanding on character and behavior. J. Hydraul. Eng. 2007, 133, 9–22. [Google Scholar] [CrossRef]
- Shen, H.T.; He, S.L.; Pan, D.A.; Li, J.F. A study of turbidity maximum in the Changjiang estuary. Acta Geogr. Sin. 1992, 47, 472–479. [Google Scholar]
- Yu, Q.; Wang, Y.; Gao, J.; Gao, S.; Flemming, B. Turbidity maximum formation in a well-mixed macrotidal estuary: The role of tidal pumping. Geophys. Res. Ocean. 2014, 119, 7705–7724. [Google Scholar] [CrossRef] [Green Version]
- Doxaran, D.; Castaing, P.; Lavender, S.J. Monitoring the maximum turbidity zone and detecting fine-scale turbidity features in the Gironde estuary using high spatial resolution satellite sensor (SPOT HRV, Landsat ETM+) data. Int. J. Remote. Sens. 2006, 27, 2303–2321. [Google Scholar] [CrossRef]
- Uncles, R.J.; Stephens, J.A.; Harris, C. Runoff and tidal influences on the estuarine turbidity maximum of a highly turbid system: The upper Humber and Ouse Estuary, UK. Mar. Geol. 2006, 235, 213–228. [Google Scholar] [CrossRef]
- Mitchell, S.B. Turbidity maxima in four macrotidal estuaries. Ocean Coast. Manag. 2013, 79, 62–69. [Google Scholar] [CrossRef]
- Asp, N.E.; Gomes, V.J.C.; Ogston, A.; Borges, J.C.C.; Nittrouer, C.A. Sediment source, turbidity maximum, and implications for mud exchange between channel and mangroves in an Amazonian estuary. Ocean Dyn. 2016, 66, 285–297. [Google Scholar] [CrossRef]
- Nascimento, W.R.; Souza-Filho, P.W.M.; Proisy, C.; Lucas, R.M.; Rosenqvist, A. Mapping changes in the largest continuous Amazonian mangrove belt using object-based classification of multisensor satellite imagery. Estuar. Coast. Shelf Sci. 2013, 117, 83–93. [Google Scholar] [CrossRef]
- Souza-Filho, P.W.M.; Lessa, G.C.; Cohen, M.C.L.; Costa, F.R.; Lara, R.J. The subsiding macrotidal barrier estuarine system of the Eastern Amazon Coast, Northern Brazil. In Geology and Geomorphology of Holocene Coastal Barriers of Brazil; Lecture Notes in Earth Sciences; Springer: Berlin/Heidelberg, Germany, 2009; Volume 107, pp. 347–375. ISBN 9783540250081. [Google Scholar]
- Asp, N.E.; Amorim de Freitas, P.T.; Gomes, V.J.C.; Gomes, J.D. Hydrodynamic overview and seasonal variation of estuaries at the eastern sector of the Amazonian coast. J. Coast. Res. 2013, 165, 1092–1097. [Google Scholar] [CrossRef]
- Meade, R.H.; Dunne, T.; Richey, J.E.; Santos, U.D.M.; Salati, E. Storage and remobilization of suspended sediment in the lower Amazon River of Brazil. Science 1985, 228, 488–490. [Google Scholar] [CrossRef] [PubMed] [Green Version]
- Nittrouer, C.A.; Kuehl, S.A.; Sternberg, R.W.; Figueiredo, A.G.; Faria, L.E.C. An introduction to the geological significance of sediment transport and accumulation on the Amazon continental shelf. Mar. Geol. 1995, 125, 177–192. [Google Scholar] [CrossRef]
- Geyer, W.R.; Beardsley, R.C.; Lentz, S.J.; Candela, J.; Limeburner, R.; Johns, W.E.; Castro, B.M.; Soares, I.D. Physical oceanography of the Amazon shelf. Cont. Shelf Res. 1996, 16, 575–616. [Google Scholar] [CrossRef]
- Gomes, V.J.C.; Freitas, P.T.A.; Asp, N.E. Dynamics and seasonality of the middle sector of a macrotidal estuary. J. Coast. Res. 2013, 165, 1140–1145. [Google Scholar] [CrossRef]
- ANA—Agência Nacional de Águas Hidroweb: Serviço de Informações Hidrológicas. Available online: http://www3.ana.gov.br (accessed on 12 December 2020).
- Asp, N.E.; Schettini, C.A.F.; Siegle, E.; da Silva, M.S.; de Brito, R.N.R. The dynamics of a frictionally-dominated Amazonian estuary. Braz. J. Oceanogr. 2012, 60, 391–403. [Google Scholar] [CrossRef] [Green Version]
- Araújo, W.P., Jr.; Asp, N.E. Hydrodynamic connectivity between two macrotidal Amazonian estuaries. J. Coast. Res. 2013, 65, 1086–1091. [Google Scholar] [CrossRef]
- McLachlan, R.L.; Ogston, A.S.; Asp, N.E.; Fricke, A.T.; Nittrouer, C.A.; Gomes, V.J.C. Impacts of tidal-channel connectivity on transport asymmetry and sediment exchange with mangrove forests. Estuar. Coast. Shelf Sci. 2020, 233, 106524. [Google Scholar] [CrossRef]
- Gomes, V.J.C.; Asp, N.E.; Siegle, E.; McLachlan, R.L.; Ogston, A.S.; Silva, A.M.M.; Nittrouer, C.A.; Souza, D.F. Connection between macrotidal estuaries along the southeastern Amazon coast and its role in coastal progradation. Estuar. Coast. Shelf Sci. 2020, 240, 106794. [Google Scholar] [CrossRef]
- Magalhães, A.; Pereira, L.C.C.; da Costa, R.M. Relationships between copepod community structure, rainfall regimes, and hydrological variables in a tropical mangrove estuary (Amazon coast, Brazil). Helgol. Mar. Res. 2015, 69, 123–136. [Google Scholar] [CrossRef] [Green Version]
- Martins, E.S.F.; Souza, F.P.W.M.; Costa, F.R.; Alves, P.J.O. Extração automatizada e caracterização da rede de drenagem e das bacias hidrográficas do nordeste do Pará ao noroeste do Maranhão a partir de imagens SRTM. In Proceedings of the 13th Simpósio Brasileiro de Sensoriamento Remoto, Florianópolis, Brazil, 21–26 April 2007; pp. 6827–6834. [Google Scholar]
- Klein, E.L.; Moura, C.A.V. Síntese geológica e geocronológica do Cráton São Luís e do Cinturão Gurupi na região do rio Gurupi (NE-Pará/NW-Maranhão). Geol. USP Ser. Cient. 2003, 3, 97–112. [Google Scholar] [CrossRef] [Green Version]
- Moraes, B.C.d.; Costa, J.M.N.D.; Costa, A.C.L.D.; Costa, M.H. Variação espacial e temporal da precipitação no Estado do Pará. Acta Amaz. 2005, 35, 207–214. [Google Scholar] [CrossRef] [Green Version]
- Figueroa, S.N.; Nobre, C.A. Precipitations distribution over central and western tropical South América. Climanálise 1990, 5, 36–45. [Google Scholar]
- Marengo, J.A. Interannual variability of deep convection over the tropical South American sector as deduced from ISCCP C2 data. Int. J. Climatol. 1995, 15, 995–1010. [Google Scholar] [CrossRef]
- Pielke, R.A. The Hurricane; Routledge: New York, NY, USA, 1990. [Google Scholar]
- Tölgyessy, J. The chemistry of water. In Chemistry and Biology of Water, Air and Soil: Environmental Aspects; Tölgyessy, J., Ed.; Elsevier Inc.: Amsterdam, The Netherlands, 1993; pp. 14–325. [Google Scholar]
- American Public Health Association. Standard Methods for the Examination of Water and Wastewater, 19th ed.; American Public Health Association: Washington, DC, USA, 1995. [Google Scholar]
- Luketina, D. Simple tidal prism models revisited. Estuar. Coast. Shelf Sci. 1998, 46, 77–84. [Google Scholar] [CrossRef]
- Geyer, W.R.; Signell, R.; Kineke, G. Lateral trapping of sediment in a partially mixed estuaries. In Physics of Estuaries and Coastal Seas, Proceedings of the 8th International Biennial Conference on Physics of Estuaries and Coastal Seas, 9–12 September 1996; Dronkers, J., Scheffers, M., Eds.; A.A. Balkema: Rotterdam, The Netherlands, 1998; pp. 115–124. [Google Scholar]
- Fernandes, L.L.; Rao, V.P.; Kessarkar, P.M.; Suresh, S. Estuarine turbidity maximum in six tropical minor rivers, central west coast of India. Hydrol. Res. 2018, 49, 1234–1254. [Google Scholar] [CrossRef]
- Costa, M.S.; Rocha, A.S.; Santos, A.S.; Rollnic, M. Influence of tide on salt entrapment in the Mojuim River estuary. J. Coast. Res. 2018, 85, 81–85. [Google Scholar] [CrossRef]
- Cooper, J.A. Geomorphology of Irish estuaries: Inherited and dynamic controls. J. Coast. Res. 2006, I, 176–180. [Google Scholar]
- Salomon, J.C.; Allen, G.P. Rôle sédimentologique de la marée dans les estuaires à fort marnage. Cie. Fr. Petroles Notes Mem. 1983, 18, 35–44. [Google Scholar]
- Perillo, G.M.E.; Sequeira, M.E. Geomorphologic and sediment transport characteristics of the middle reach of the Bahia Blanca estuary (Argentina). J. Geophys. Res. 1989, 94, 14351–14362. [Google Scholar] [CrossRef]
- Hayes, M.O. Morphology of sand accumulation in estuaries. In Estuarine Research; Cronin, L.E., Ed.; Academic Press: New York, NY, USA, 1975; pp. 3–22. [Google Scholar]
- Souza-Filho, P.W.M. Avaliação e aplicação de dados de sensores remotos no estudo de ambientes costeiros tropicais úmidos, Bragança, norte do Brasil. Ph.D. Thesis, Universidade Federal do Pará, Belém, Brazil, 2000. [Google Scholar]
- Hudson, A.S.; Talke, S.A.; Jay, D.A. Using satellite observations to characterize the response of estuarine turbidity maxima to external forcing. Estuar. Coast. 2017, 40, 343–358. [Google Scholar] [CrossRef]
- Sommerfield, C.K.; Wong, K.C. Mechanisms of sediment flux and turbidity maintenance in the Delaware Estuary. J. Geophys. Res. Ocean. 2011, 116, 1–16. [Google Scholar] [CrossRef]
- Dronkers, J.J. Tidal Computations in Rivers and Coastal Waters; North Holland Publishing: Amsterdam, The Netherlands, 1964. [Google Scholar]
- North, E.W.; Houde, E.D. Retention of white perch and striped bass larvae: Biological-physical interactions in Chesapeake Bay estuarine turbidity maximum. Estuaries 2001, 24, 756–769. [Google Scholar] [CrossRef]
- Kappenberg, J.; Grabemann, I. Variability of the mixing zones and estuarine turbidity maxima in the Elbe and Weser estuaries. Estuaries 2001, 24, 699–706. [Google Scholar] [CrossRef]


| Estuary | Distance from Amazon River Mouth (km) | Estuarine Length (km) | Catchment Area (km2) | Mangrove Area (km2) | River Discharge (m3·s−1) |
|---|---|---|---|---|---|
| Mocajuba | 225 | 53.0 | 323 | 54.5 | 11.0 |
| Taperaçu | 353 | 27.5 | 40 | 100.6 | – |
| Caeté | 369 | 54.3 | 2236 | 110.1 | 41.5 |
| Urumajó | 374 | 43.0 | 544 | 36.4 | 10.0 |
| Gurupi | 433 | 57.7 | 35,053 | 85.9 | 472.0 |
| Section | Mocajuba | Taperaçu | Caeté | Urumajó | Gurupi | |
|---|---|---|---|---|---|---|
| Total | Total vol. 1 | 14.5 | 5.49 | 51.6 | 28.0 | 75.677 |
| Channel vol. 1 | 8.29 | 1.03 | 17.4 | 9.10 | 31.09 | |
| Tidal prism 1 | 6.22 | 4.46 | 34.1 | 18.9 | 44.587 | |
| Salt estuary | Total vol. 1 | 14.4 | 5.49 | 50.7 | 27.9 | 71.413 |
| Channel vol. 1 | 8.27 | 1.03 | 17.2 | 9.08 | 28.594 | |
| Tidal prism 1 | 6.09 | 4.46 | 33.6 | 18.8 | 42.819 | |
| Tidal river | Total vol. 1 | 0.16 | 0 | 0.82 | 0.07 | 4.2634 |
| Channel vol. 1 | 0.03 | 0 | 0.24 | 0.03 | 2.4957 | |
| Tidal prism 1 | 0.13 | 0 | 0.59 | 0.04 | 1.7678 | |
| Relat. prism | 2.12% | 0.00% | 1.75% | 0.24% | 4.13% |
Publisher’s Note: MDPI stays neutral with regard to jurisdictional claims in published maps and institutional affiliations. |
© 2021 by the authors. Licensee MDPI, Basel, Switzerland. This article is an open access article distributed under the terms and conditions of the Creative Commons Attribution (CC BY) license (https://creativecommons.org/licenses/by/4.0/).
Share and Cite
Gomes, V.J.C.; Asp, N.E.; Siegle, E.; Gomes, J.D.; Silva, A.M.M.; Ogston, A.S.; Nittrouer, C.A. Suspended-Sediment Distribution Patterns in Tide-Dominated Estuaries on the Eastern Amazon Coast: Geomorphic Controls of Turbidity-Maxima Formation. Water 2021, 13, 1568. https://doi.org/10.3390/w13111568
Gomes VJC, Asp NE, Siegle E, Gomes JD, Silva AMM, Ogston AS, Nittrouer CA. Suspended-Sediment Distribution Patterns in Tide-Dominated Estuaries on the Eastern Amazon Coast: Geomorphic Controls of Turbidity-Maxima Formation. Water. 2021; 13(11):1568. https://doi.org/10.3390/w13111568
Chicago/Turabian StyleGomes, Vando J. C., Nils E. Asp, Eduardo Siegle, José Diego Gomes, Ariane M. M. Silva, Andrea S. Ogston, and Charles A. Nittrouer. 2021. "Suspended-Sediment Distribution Patterns in Tide-Dominated Estuaries on the Eastern Amazon Coast: Geomorphic Controls of Turbidity-Maxima Formation" Water 13, no. 11: 1568. https://doi.org/10.3390/w13111568