Quantitative Lasting Effects of Drought Stress at a Growth Stage on Soybean Evapotranspiration and Aboveground BIOMASS
by
 , and
, and
Yi Cui
1,2, 
Shaowei Ning
1,2,
Juliang Jin
1,2,*,
Shangming Jiang
3,
Yuliang Zhou
1,2 and
Chengguo Wu
1,2 1
School of Civil Engineering, Hefei University of Technology, Hefei 230009, China
2
Institute of Water Resources and Environmental Systems Engineering, Hefei University of Technology, Hefei 230009, China
3
Key Laboratory of Water Conservancy and Water Resources of Anhui Province, Water Resources Research Institute of Anhui Province and Huaihe River Commission, Ministry of Water Resources, Hefei 230088, China
*
Author to whom correspondence should be addressed.
Water 2021, 13(1), 18; https://doi.org/10.3390/w13010018
Submission received: 27 November 2020
/
Revised: 17 December 2020
/
Accepted: 22 December 2020
/
Published: 24 December 2020
(This article belongs to the Special Issue Hydrological Modeling in Water Cycle Processes)
Abstract
:Quantifying the lasting effects of drought stress on crop growth is a theoretical basis for revealing agricultural drought risk mechanism and formulating adaptive irrigation strategies. Based on two-season pot experiments of soybean in the Huaibei Plain, quantitative responses of plant evapotranspiration and aboveground biomass at each growth stage from a drought were carried out. The results showed that drought stress at a certain stage of soybean not only significantly reduced the current evapotranspiration and aboveground biomass accumulation during this stage, compared with full irrigation, but also generated the after-effects, which resulted in the reductions of evapotranspiration and biomass accumulation at the subsequent periods. Furthermore, the damaged transpiration and growth mechanism caused by drought gradually recovered through the rewatering later, and the compensation phenomenon even occurred. Nevertheless, the specific recovery effect was decided by both the degree and period of drought before. It is practical to implement deficit irrigation at the seedling and branching stages, but the degree should be controlled. Meanwhile, it is crucial to ensure sufficient water supply during the reproductive growth phase, especially at the flowering and pod-enlargement stage, to guarantee a normal transpiration function and a high biomass yield for soybeans in the Huaibei Plain.
1. Introduction
Agricultural drought is one of the major natural disasters all over the world [1,2], it seriously threatens the national food safety and social stability. Furthermore, in recent years, with the global warming and impact of human activities, the frequency, intensity, and range of agricultural drought have increased significantly, which has severely restricted the social and economic development in many countries [3]. The quantitative responses of crops to drought stress is the basis for revealing agricultural drought disaster-caused theory [4,5]. However, due to so much uncertainty in the crop growth process under drought conditions, the mechanism of crop response to drought stress is extremely complex [6]. Therefore, the related studies have always been faced difficulty.
The response of crops to drought stress is a complex physical and chemical process [7]. A large number of experimental studies [8,9,10,11,12] have found that when the crop is subjected to drought at a growth stage, the morphological characteristics during this stage and final yield components are inhibited, compared with sufficient irrigation. Moreover, the degree of inhibition to drought at different stages varies greatly. Specifically, some studies showed that stalks shrank slightly when crops were under drought situations [8,9], and the continuous water deficit caused short plants and low rates of leaf area expansion [10]. In addition, Jumrani and Bhatia [11] found by greenhouse experiments that drought during soybean vegetative and reproductive growth phases all resulted in reductions of dry matter and yield, while that at the reproductive stage induced a greater yield loss. Wei et al. [12] discovered by pot experiments that, compared with full irrigation, drought at each growth stage of soybean all caused decreases in plant height, leaf area, aboveground biomass, and grain yield; furthermore, the drought at the flowering–podding stage resulted in a larger yield loss. These works are fundamental for agricultural drought research and should be further studied [13].
Drought stress at a certain growth stage (stage i) not only affects the crop growth in this stage, but also has after-effects on the plant during the subsequent stages (stage i + 1, …) [14,15]. For instance, Cui et al. [16] found that as the drought at a given stage was severe, the evapotranspiration of wheat during this period reduced significantly, and it also caused the reductions of evapotranspiration at the following stages. Alghory and Yazar [17] discovered by field experiments of rice, the continuous drought during the filling stage led to the drops of leaf water potential at the subsequent growth periods. Moreover, the after-effects produced by drought at a certain period are directly related to the degree of drought. When the drought is mild, the after-effects could be offset by the rewatering later [18], which is often called the compensation effect of crop growth. Boyer [19] presented that during a moderate drought, the turgor pressure of plant decreased, but the photosynthesis and cell division was not significantly affected; after rewatering, the previously accumulated photosynthetic products provided sufficient materials for plant, resulting in an obvious compensatory growth of aboveground part. Desotgiu et al. [20] found that rewatering after a slight drought promoted various physiological indicators of poplar canopy. Luo et al. [21] proposed that a mild drought reduced the leaf water potential of cotton, while after rewatering, it reached or even exceeded that under sufficient irrigation. Nevertheless, the compensation effect after a severe drought becomes weak and the after-effects are significant [22]. It can be seen that the lasting response process of crop to drought stress is quite complicated. However, at present, most studies have focused on the current influences of drought at a certain stage on the crop’s physiological indicators only during this period. While there are few studies about the quantitative after-effects [23], which severely limits the discovery of crop response mechanisms to drought stress. Therefore, it is necessary to quantify both the current influences and the after-effects of various drought degrees at different growth stages on crop, combined with experiments in typical agricultural drought regions [24,25].
China is located in the southeastern part of the Eurasian continent. It has a significant continental monsoon climate, and an uneven distribution of precipitation in time and space. Moreover, the imbalance of water and land resources, low level of development, and fragile ecological environment have determined that China has always been a country with frequent droughts [26]. From 2006 to 2018, the average annual drought area of crops was 16,806.02 thousand ha. Food losses were 21.918 billion kilograms and economic losses reached 3.90 billion dollars [27]. Nowadays, agricultural drought has become one of the severe challenges to China’s sustainable economy, social development, and food safety. Furthermore, soybean is one of the most important grain and oil crops in China. With the increase of population and the improvement of people’s living standard, the demand for soybean products is rising significantly [28]. Huaibei Plain, with a planting area of 700,000–800,000 ha for soybeans [29], is the main production region of China’s high-protein soybean. Moreover, soybeans of the Huaibei Plain are basically rain-fed in summer. However, this region is located in a transitional zone of semi-arid and semi-humid monsoon climate [30], where precipitation is unevenly distributed and temperature in summer is relatively high. Meanwhile, with the global climate change in recent years, agricultural droughts occur more frequently during soybean growth period in the Huaibei Plain, which markedly reduces the grain yield. Therefore, it is of great significance for guiding the irrigation and guaranteeing a high production to accurately quantify the lasting influences of drought at each stage on soybean growth process. Furthermore, plant evapotranspiration and aboveground biomass are two key indicators that could directly and precisely reflect the crop growth status [31]. Consequently, this study carried out quantitative lasting effects of drought stress at a growth stage based on experiments of summer soybean in the Huaibei Plain, including: (1) quantitative responses of evapotranspiration at each stage from stress to different drought degrees and (2) quantitative responses of aboveground biomass accumulation of plant at each period from drought, in order to reveal the complex mechanism of crop growth under various drought conditions, laying a foundation for effective agricultural drought risk management.
2. Materials and Methods
2.1. Experimental Site
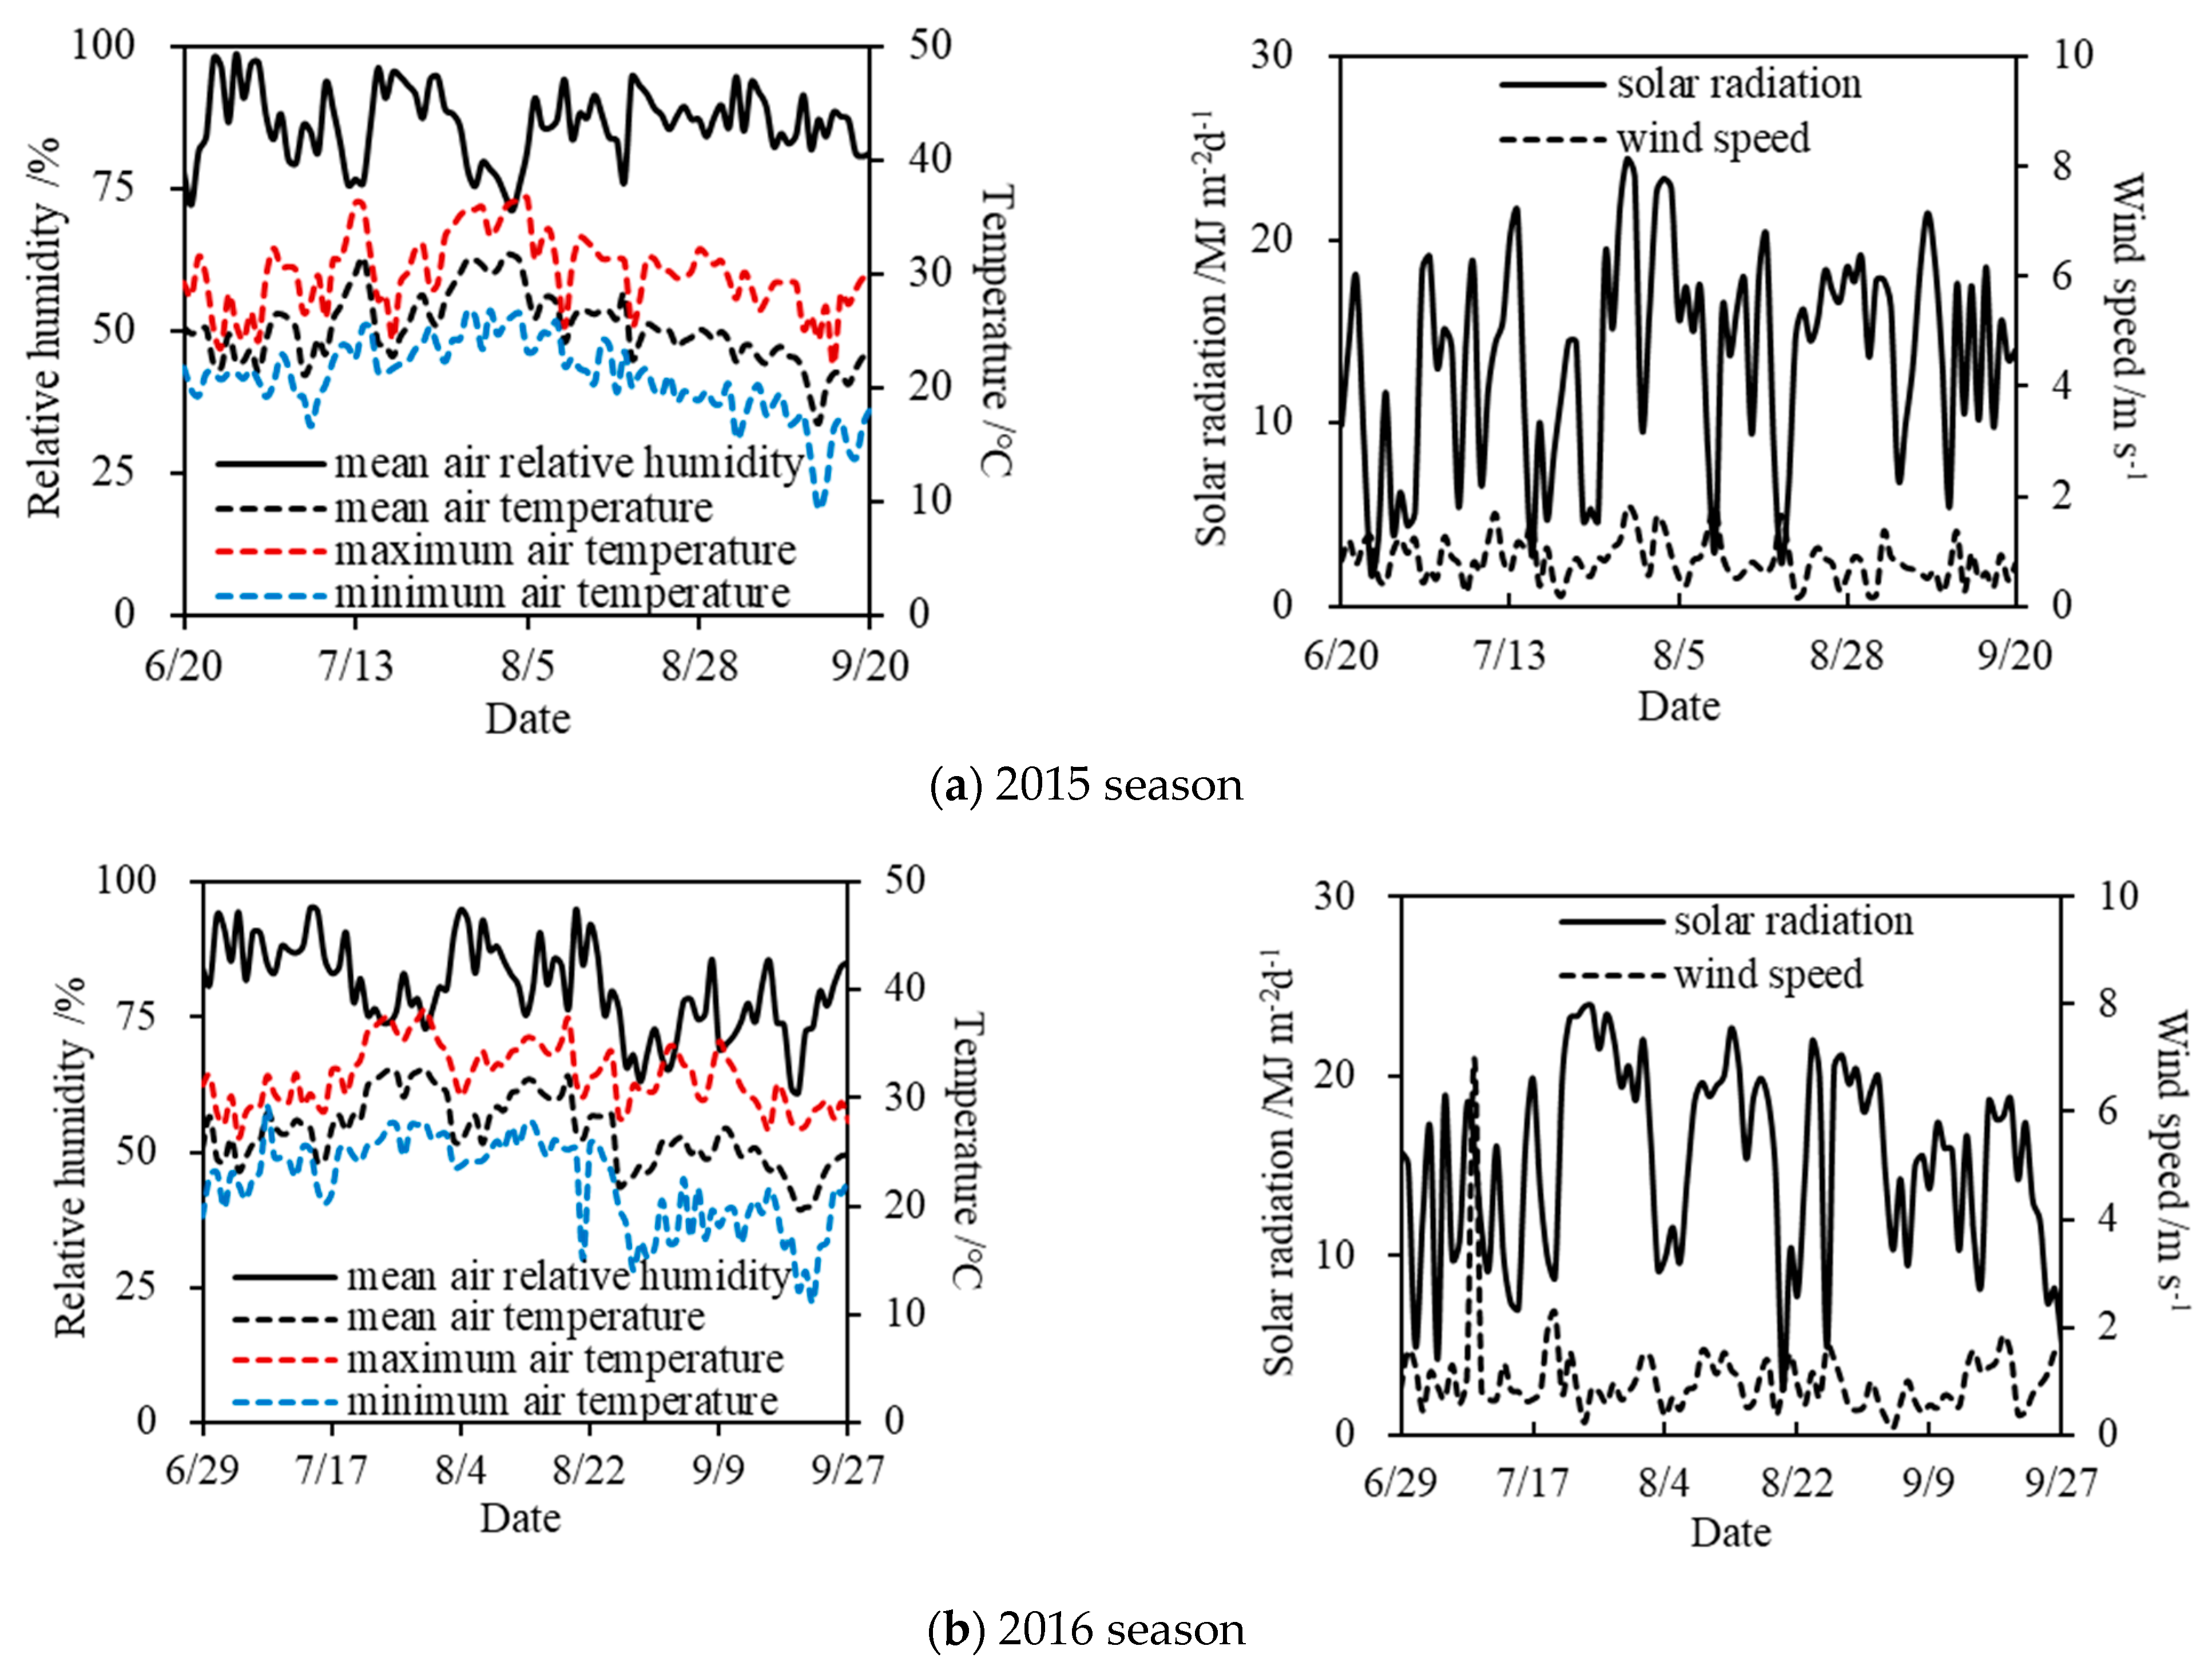
The summer soybean pot experiments under drought stress were carried out at the Xinmaqiao Agricultural Irrigation Research Station, Water Resources Research Institute of Anhui Province and Huai River Commission, P.R. China, which lies in the Huaibei Plain (Figure 1). The station is located in a typical transitional zone of subtropical and temperate monsoon climate (latitude 33°09′ N, longitude 117°22′ E, altitude 19.7 m). Over the years, the precipitation has changed greatly from year to year, and meanwhile it is unevenly distributed during a year, which results in frequent agricultural droughts in this region [32]. The soybean experimental periods were both from June to September in the 2015 and 2016 seasons. Moreover, the daily meteorological elements (relative humidity, temperature, wind speed, etc.) measured at the station during the two seasons are shown in Figure 2.
2.2. Crop Management
Potted soybean plants in the two seasons were both planted in plastic buckets. For the 2015 season, the upper inner diameter of bucket was 28 cm, the bottom inner diameter was 20 cm, and the height was 27 cm, and each empty bucket was filled with 15 kg of air-dried soil. In 2016, the upper inner diameter of bucket was 31 cm, the bottom inner diameter was 23 cm, and the height was 27 cm, and 17 kg of air-dried soil was loaded in each bucket. All empty buckets were weighed before filling with soil. The soil for the experiments was collected from the field plough layer in the experimental station, which is a typical lime concretion black soil in the Huaibei Plain of Anhui Province. The soil characteristics in the upper layer (0–50 cm) are shown in Table 1 [33]. In order to ensure the germination of the soybean seeds, the soil in all pots was irrigated to field capacity before sowing and 4 g of compound fertilizer (N 15%, P2O5 15%, K2O 15%) was applied along with irrigation for each pot. All soybean pots were placed in an open environment, at the same time, a mobile canopy was arranged to isolate the precipitation when it occurred (Figure 1). The soil moisture in pots was only supplemented by irrigation. In addition, for all potted samples, except for water management, other crop management measures were completely the same during the experimental period, to ensure the normal growth and development of plants without the interference from pests and diseases. The variety of experimental soybeans were Zhonghuang 13 for both seasons. The seeds in the 2015 season were sown on 20 June and did not all germinate until 3 July, and the experimental treatments began on 4 July. The experimental period in 2016 was from 15 July to 27 September.
According to the field planting density of summer soybean in the Huaibei Plain, three plants that grew evenly were retained per pot. Combining the actual growth records of soybeans in the station for many years with the division of stages in related research [34,35], the whole growth period of the soybeans in the experiments was divided into four stages, which were seedling stage (Stage I), branching stage (Stage II), flowering-podding stage (Stage III), and seed filling stage (Stage IV). The classification basis and results of each growth stage for the two seasons are shown in Table 2.
2.3. Experimental Design
Nine treatments were set in the experiments for 2015 and 2016 seasons, including one sufficient irrigation treatment and eight drought stress treatments. The experimental design is shown in Table 3. In order to quantitatively evaluate and compare the effects of drought at different periods on the growth process of soybean, the experiments in this study only set drought at a single growth stage. Furthermore, when each stage from drought ended, destruction experiments were carried out to measure the aboveground biomass of plants during this stage. The controlling factors in the experiments were the soil water content of pot at different growth stages, that is, treatments were implemented by controlling the lower limit of soil water content in the pot at each stage. Combining crop drought experiments in the station for years with the experimental design of crop deficit irrigation experiments in related studies [34,36,37], three lower limits of soil water content were set in the experiments for both seasons, they were 75%, 55%, and 35% of field capacity, which corresponded to no drought stress, mild drought stress, and severe drought stress levels, respectively (Table 3).
Moreover, in order to reflect the soybean growth response to the process of drought stress, and meanwhile to meet the actual irrigation situation in crop production and ensure that the plants could survive under severe drought condition, in the experiments when the soil water content of soybean pot was below the lower limit of the corresponding treatment, the pot would be irrigated to 90% of field capacity [38]. Specifically, during the 2015 and 2016 seasons, mild and severe drought were set at Stage I, Stage II, Stage III, and Stage IV, which corresponded to the drought stress treatments T1–T8, respectively. In addition, there was a sufficient irrigation treatment CK (control group) with no drought stress during the whole growth period of the soybeans. The lower limits of soil water content at the four growth stages of the soybeans under nine treatments are shown in Table 3.
In the experiments for the two seasons, considering the influence of soybean growth on the calculation of soil water content in pot, the plant weight at the end of the previous stage was deducted from the weight of pot at the current stage. Therefore, besides arranging pot samples for replications (five replications for T1–T8 in both seasons, fifteen and five replications for CK in 2015 and 2016 seasons, respectively), it was necessary to additionally set up pots for measuring plant weight at the end of Stage I, Stage II, and Stage III. Specifically, for CK, after the three growth stages, five pots were randomly selected for destruction experiments, for which, three plants in each pot were taken out and weighed. For T1–T6, destruction experiments of five pots were implemented at the end of each stage after drought. Furthermore, for T3–T8, the weight of soybean plant at the end of each stage before drought was substituted by the corresponding value in CK. Therefore, in both seasons, there were twenty replications (pots) for T1 and T2, fifteen for T3 and T4, ten for T5 and T6, and five for T7 and T8. As for CK, there were thirty and twenty replications in 2015 and 2016 seasons, respectively. In addition, the soybean pot experiments for the two seasons were both arranged in a completely randomized design.
2.4. Measurements
2.4.1. Pot Weight
The weight of pot on day j after the emergence of soybean seed was represented by Wj (kg), measured by an electronic balance, model YP30KN, designed by Shanghai Sunny Hengping Scientific Instrument Co., Ltd., Shanghai, China. The size of the balance was 320 mm × 315 mm × 130 mm, and the net weight was 3.3 kg. The maximum measuring range was 30,000 g and the least count was 1 g. In addition, the repeatability error of the balance was less than ±1 g, and the linearity error was lower than ±2 g. During the whole experimental period from the germination of the seeds to the harvest of the plants, the weight of each soybean pot sample was measured at around 18:00 every day.
2.4.2. Soil Water Content
The soil water content of each soybean pot was calculated according to the weighing data as follows:
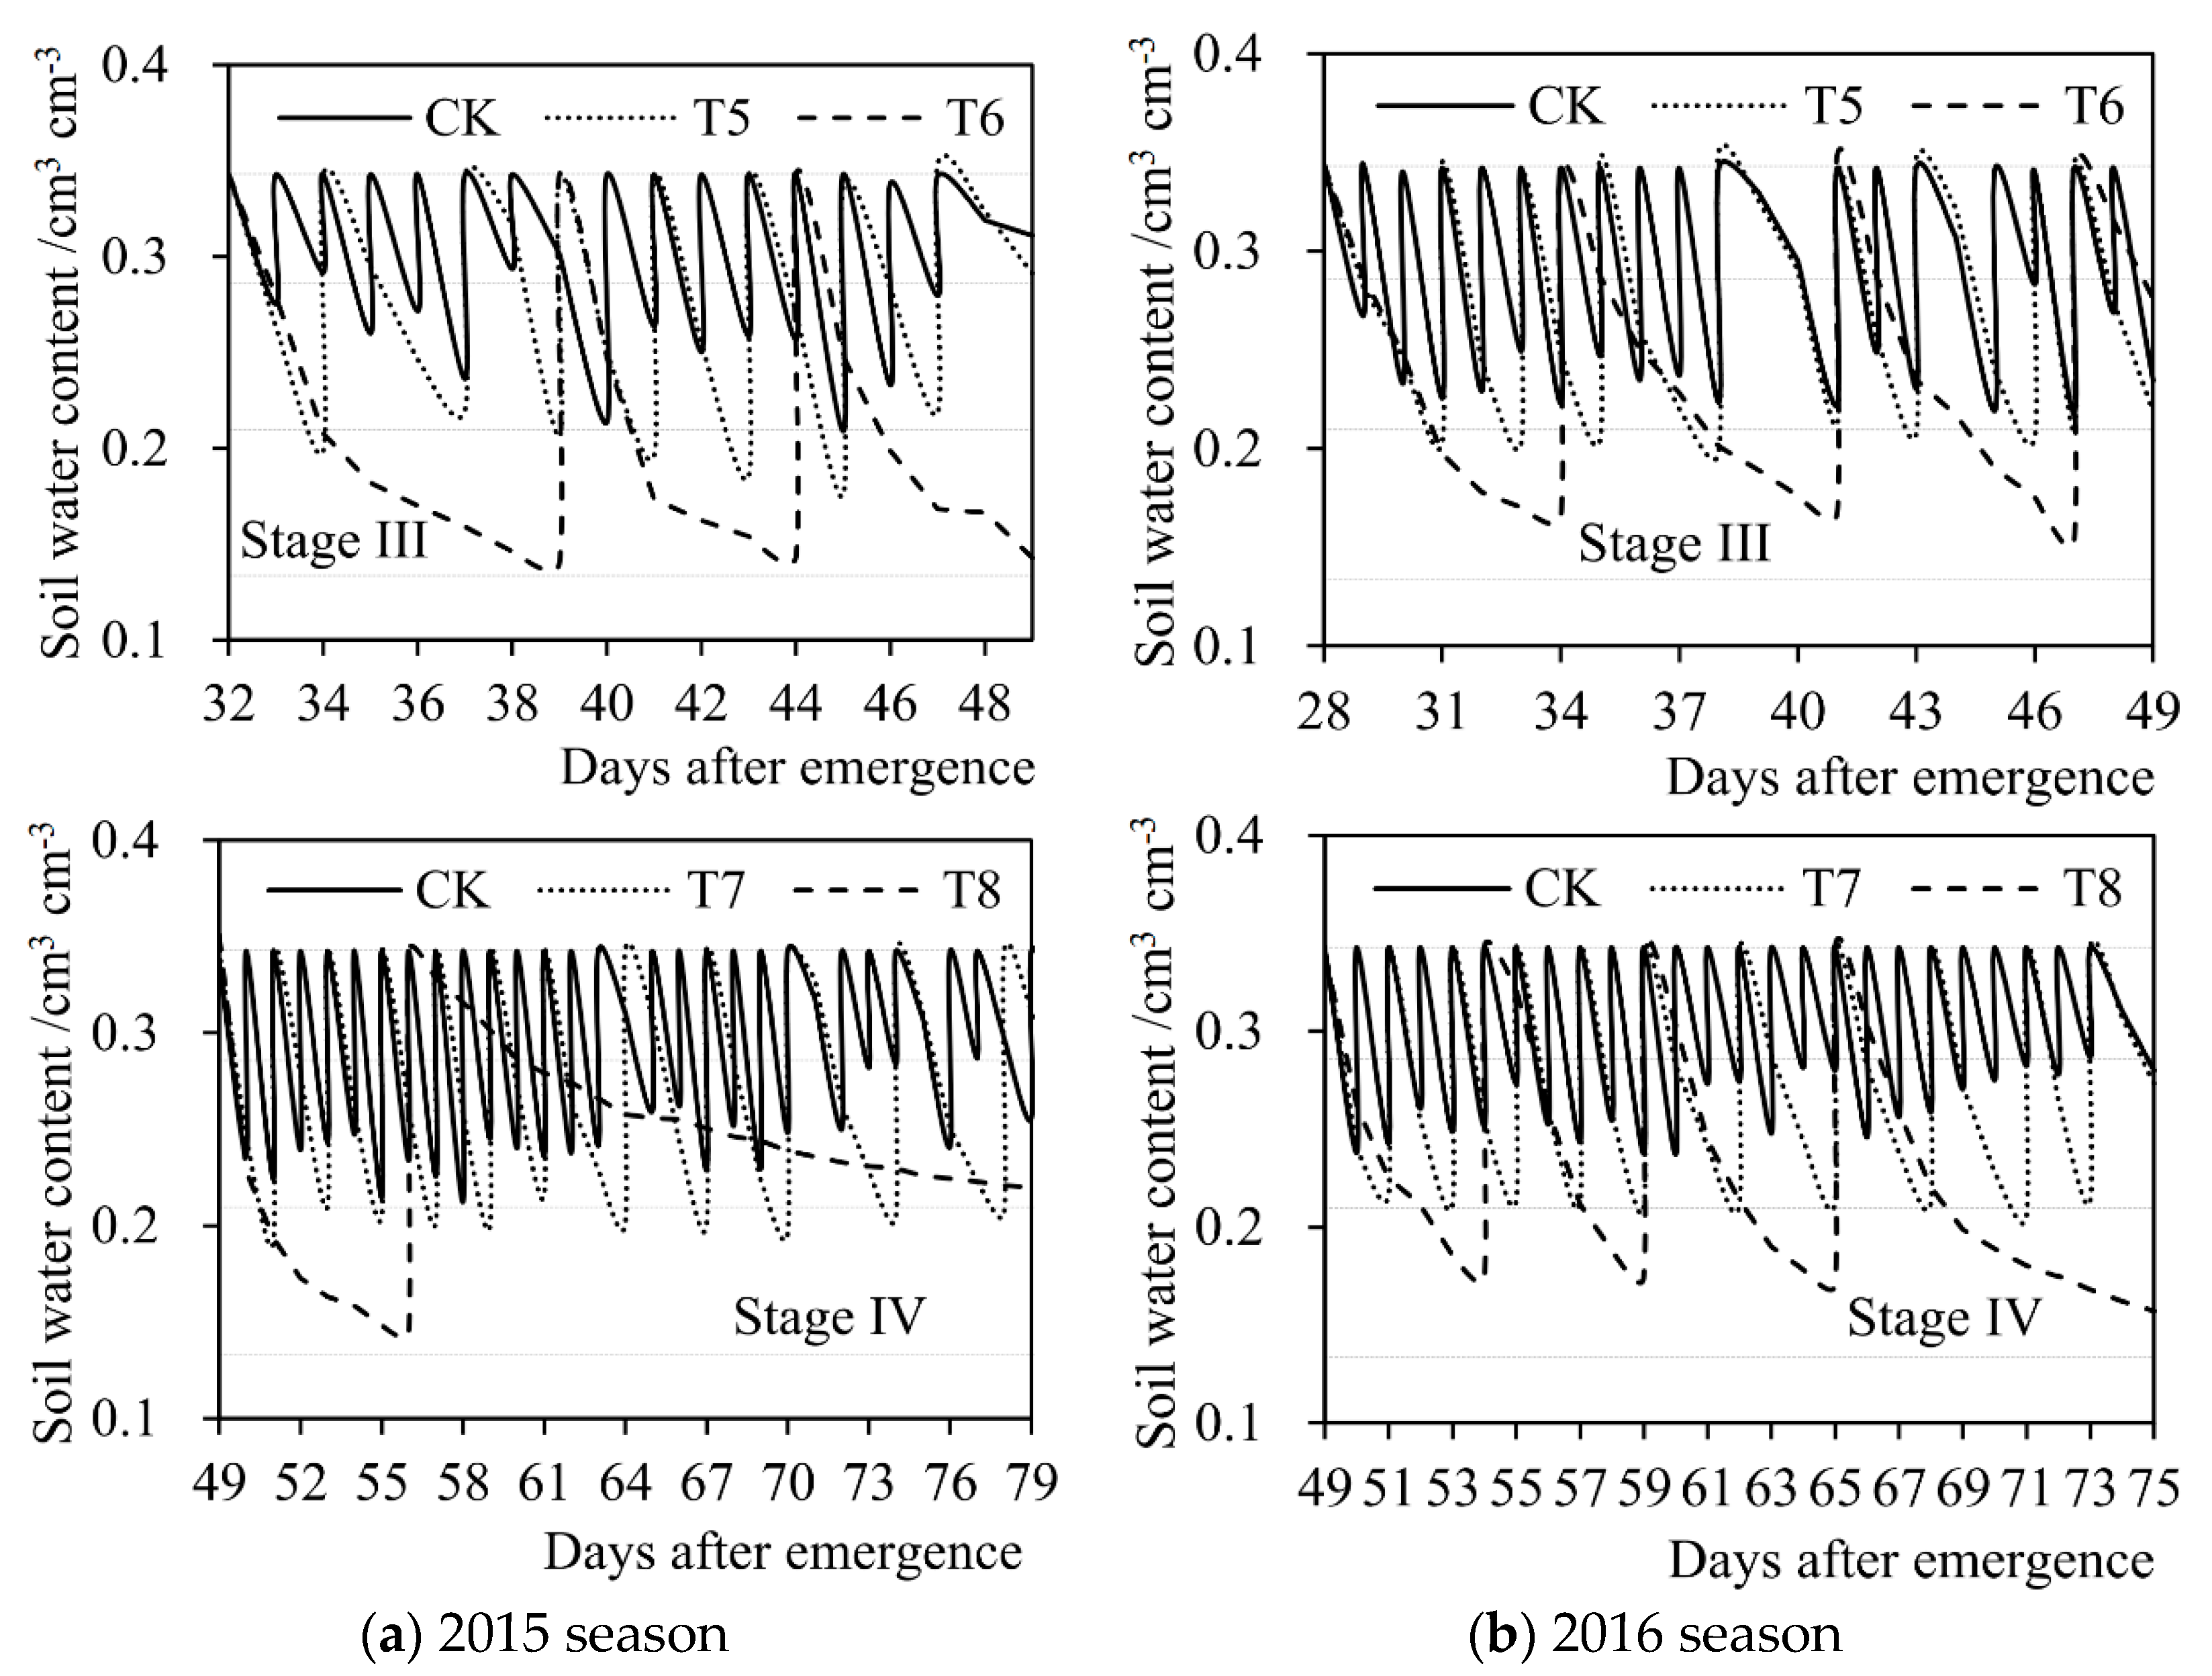
where θj,b (g × g−1) represents the soil water content of soybean pot at the beginning of day j (after irrigation) after seed emergence (weight water content). θj,e (g × g−1) represents the soil water content of pot at the end of day j (when weighing). θj (g × g−1) represents the average soil water content of pot on day j. Wj−1 (kg) and Wj (kg) respectively represent the pot weight on day (j−1) and day j after seed emergence. Ws (kg) represents the weight of air-dried soil put in the empty bucket before sowing. Wp (kg) represents the weight of empty bucket. Ij (kg) represents the irrigation amount on day j. In order to reduce the influence of plant weight on the calculation of soil water content in pot, in the experiments, the destruction experiments were carried out at the end of the seedling stage (Stage I), the branching stage (Stage II), and the flowering-podding stage (Stage III), respectively. Three intact soybean plants were taken out from five pot samples, and the plant weight was measured by an electronic balance (model TD30K-0.1, designed by Tianjin Balance Instrument Co., Ltd., Tianjin, China. The size of the balance was 370 mm × 380 mm × 130 mm, the net weight was 6.0 kg. The maximum weighing range was 30,000 g and the least count was 0.1 g. Moreover, the repeatability error of the balance was ±0.3 g, and the nonlinearity error was ±0.3 g.). The average plant weight of the five samples was deducted from the pot weight in the corresponding next stage. Figure 3 shows the soil water content of soybean pot at each growth stage under different treatments in the experiments during 2015 and 2016 seasons.
2.4.3. Irrigation Amount
The irrigation amount of pot on day j after the emergence of the soybean seed was determined by the soil water content of the pot and the corresponding lower limit of soil water content for the treatment of the pot. The calculation formula of irrigation amount is as follows:
where θFC (g × g−1) represents the field capacity of the soil used in the soybean drought experiments (weight water content). θj−1,e (g × g−1) represents the soil water content of the pot at the end of the day (j−1) (when weighing) after seed emergence. θlm (g × g−1) represents the lower limit of soil water content for the treatment of pot in the experimental design (Table 3). In the experiments, when the soil water content of pot at the end of day (j−1) was lower than the corresponding lower limit of the treatment, the pot would be irrigated to 90% of field capacity on day j. The irrigation was implemented around 7:00, and the amount of irrigation was precisely controlled by measuring cups (the maximum ranges were 500 mL and 1000 mL) and measuring cylinders. In the two-season experiments, the irrigation amount and times at each growth stage of soybean under different treatments are shown in Table 4.
2.4.4. Evapotranspiration
The actual water consumption of potted soybean was calculated by the following formula according to the weight and irrigation amount of the pot:
where ETj represents the evapotranspiration of soybean on day j after seed emergence, and it could be converted from kilograms (kg) to millimeters (mm) by the density of water and the upper area of the pot.
2.4.5. Aboveground Biomass
Five soybean pots were randomly chosen for destruction experiments at the end of each stage from drought stress. Specifically, the aboveground and underground parts of three plants in each pot were separated. The aboveground matters (stems, leaves, pods, and seeds) were taken for further separation and cleaning, and then were dried with absorbent papers and placed in an oven (model BPG-9420A, designed by Shanghai Yiheng Scientific Instrument Co., Ltd., Shanghai, China. The inner size of the oven was 100 cm × 51 cm × 80 cm, the volume was 400 L. The controlled temperature range was 10 °C to 200 °C and the lowest count was 0.1 °C. The fluctuation of constant temperature was ±1 °C at a temperature of 105 °C to de-enzyme for 30 min. Furthermore, the aboveground parts were further dried at a temperature of 75 °C until they remained at constant weights. Then, the dry matters of three plants were weighed using an electronic balance (model TD30K-0.1, designed by Tianjin Balance Instrument Co., Ltd., Tianjin, China.), which represented the aboveground biomass of soybean at the end of a growth stage.
At harvest, the aboveground matters of three intact soybean plants in all remaining pots were measured. Specifically, all the pods (including the seeds) of three plants in each pot were removed and put into a numbered gauze bag. Then they were exposed to the sun outdoors until they reached constant weights and were weighed by an electronic balance (model TD30K-0.1, designed by Tianjin Balance Instrument Co., Ltd., Tianjin, China.) At the same time, the aboveground parts of the remaining plants were placed in numbered gauze bags after washing. Then, the aboveground dry matters (stems and leaves) of three plants after exposure to the sun were weighed using an electronic balance. The aboveground biomass at harvest was the sum of the measured weights of stems, leaves, pods, and seeds. In addition, the aboveground biomass accumulation of soybean plants during a certain growth stage was the difference between the aboveground biomass at the end of this stage and that at the end of the previous stage as follows:
where ABa,m represents the aboveground biomass accumulation during the mth growth stage of soybean. ABm and ABm−1 represent the aboveground biomass at the end of the mth and (m−1)th stages, respectively. m = 1, 2, 3, 4 indicates the seedling stage (Stage I), branching stage (Stage II), flowering-podding stage (Stage III), and seed-filling stage (Stage IV) of the soybean, respectively.
3. Results and Discussion
3.1. Current Influences of Drought Stress on Evapotranspiration
The soybean evapotranspiration (ET) and average daily evapotranspiration intensity (ETd) at each growth stage under different treatments in the 2015 and 2016 seasons are shown in Table 5 (statistically significant at p ≤ 0.001 level). It can be seen that compared with evapotranspiration under sufficient irrigation (CK), the evapotranspiration under drought conditions (the average value of mild and severe drought stress) at the seedling stage (Stage I), branching stage (Stage II), flowering-podding stage (Stage III), and seed-filling stage (Stage IV) in 2015 decreased by 48.54%, 52.40%, 48.78%, and 61.26%, respectively. Those in 2016 decreased by 51.26%, 44.70%, 54.83%, and 61.85%, respectively. It indicated that drought stress at a given growth stage significantly reduced the soybean evapotranspiration in this stage, and the current drought influence at the seed filling stage was the greatest. Similar results were found by Jacobsen et al. [39] in a greenhouse pot experiment study of quinoa. Specifically, under drought situations, plants tended to minimize transpiration by closing stomata to conserve and prevent excessive loss of water, lowering stomatal conductance, thereby resulting in lower evapotranspiration [40,41]. Moreover, the reduction of evapotranspiration was directly proportional to the level of drought, that is, the more serious the drought at a growth stage, the more significant the reduction of evapotranspiration during this period. For example, the evapotranspiration at Stage I under T1 was 35.55% less compared with CK in the 2015 season, while that under T2 was 61.54% less. Similarly, the evapotranspiration at Stage II under T3 and T4 in 2016 were 27.73% and 61.67% less, respectively. These results were in agreement with Chen et al. [38], who reported that the greater water deficit resulted in the lower tomato evapotranspiration by a greenhouse experiment study. Furthermore, the soybean evapotranspiration under severe drought situation at Stage IV (T8) for the two seasons decreased most markedly compared with CK (decreased by 84.44% and 79.66% in 2015 and 2016). It reflected that serious drought stress at the seed-filling stage had the greatest adverse effect on the current evapotranspiration. Similar results were also reported by Wei et al. [12] in a pot experiment study of soybean growth and development response to drought stress. In addition, the changes of average daily evapotranspiration intensity were consistent with those of evapotranspiration.
3.2. After-Effects of Drought Stress on Evapotranspiration
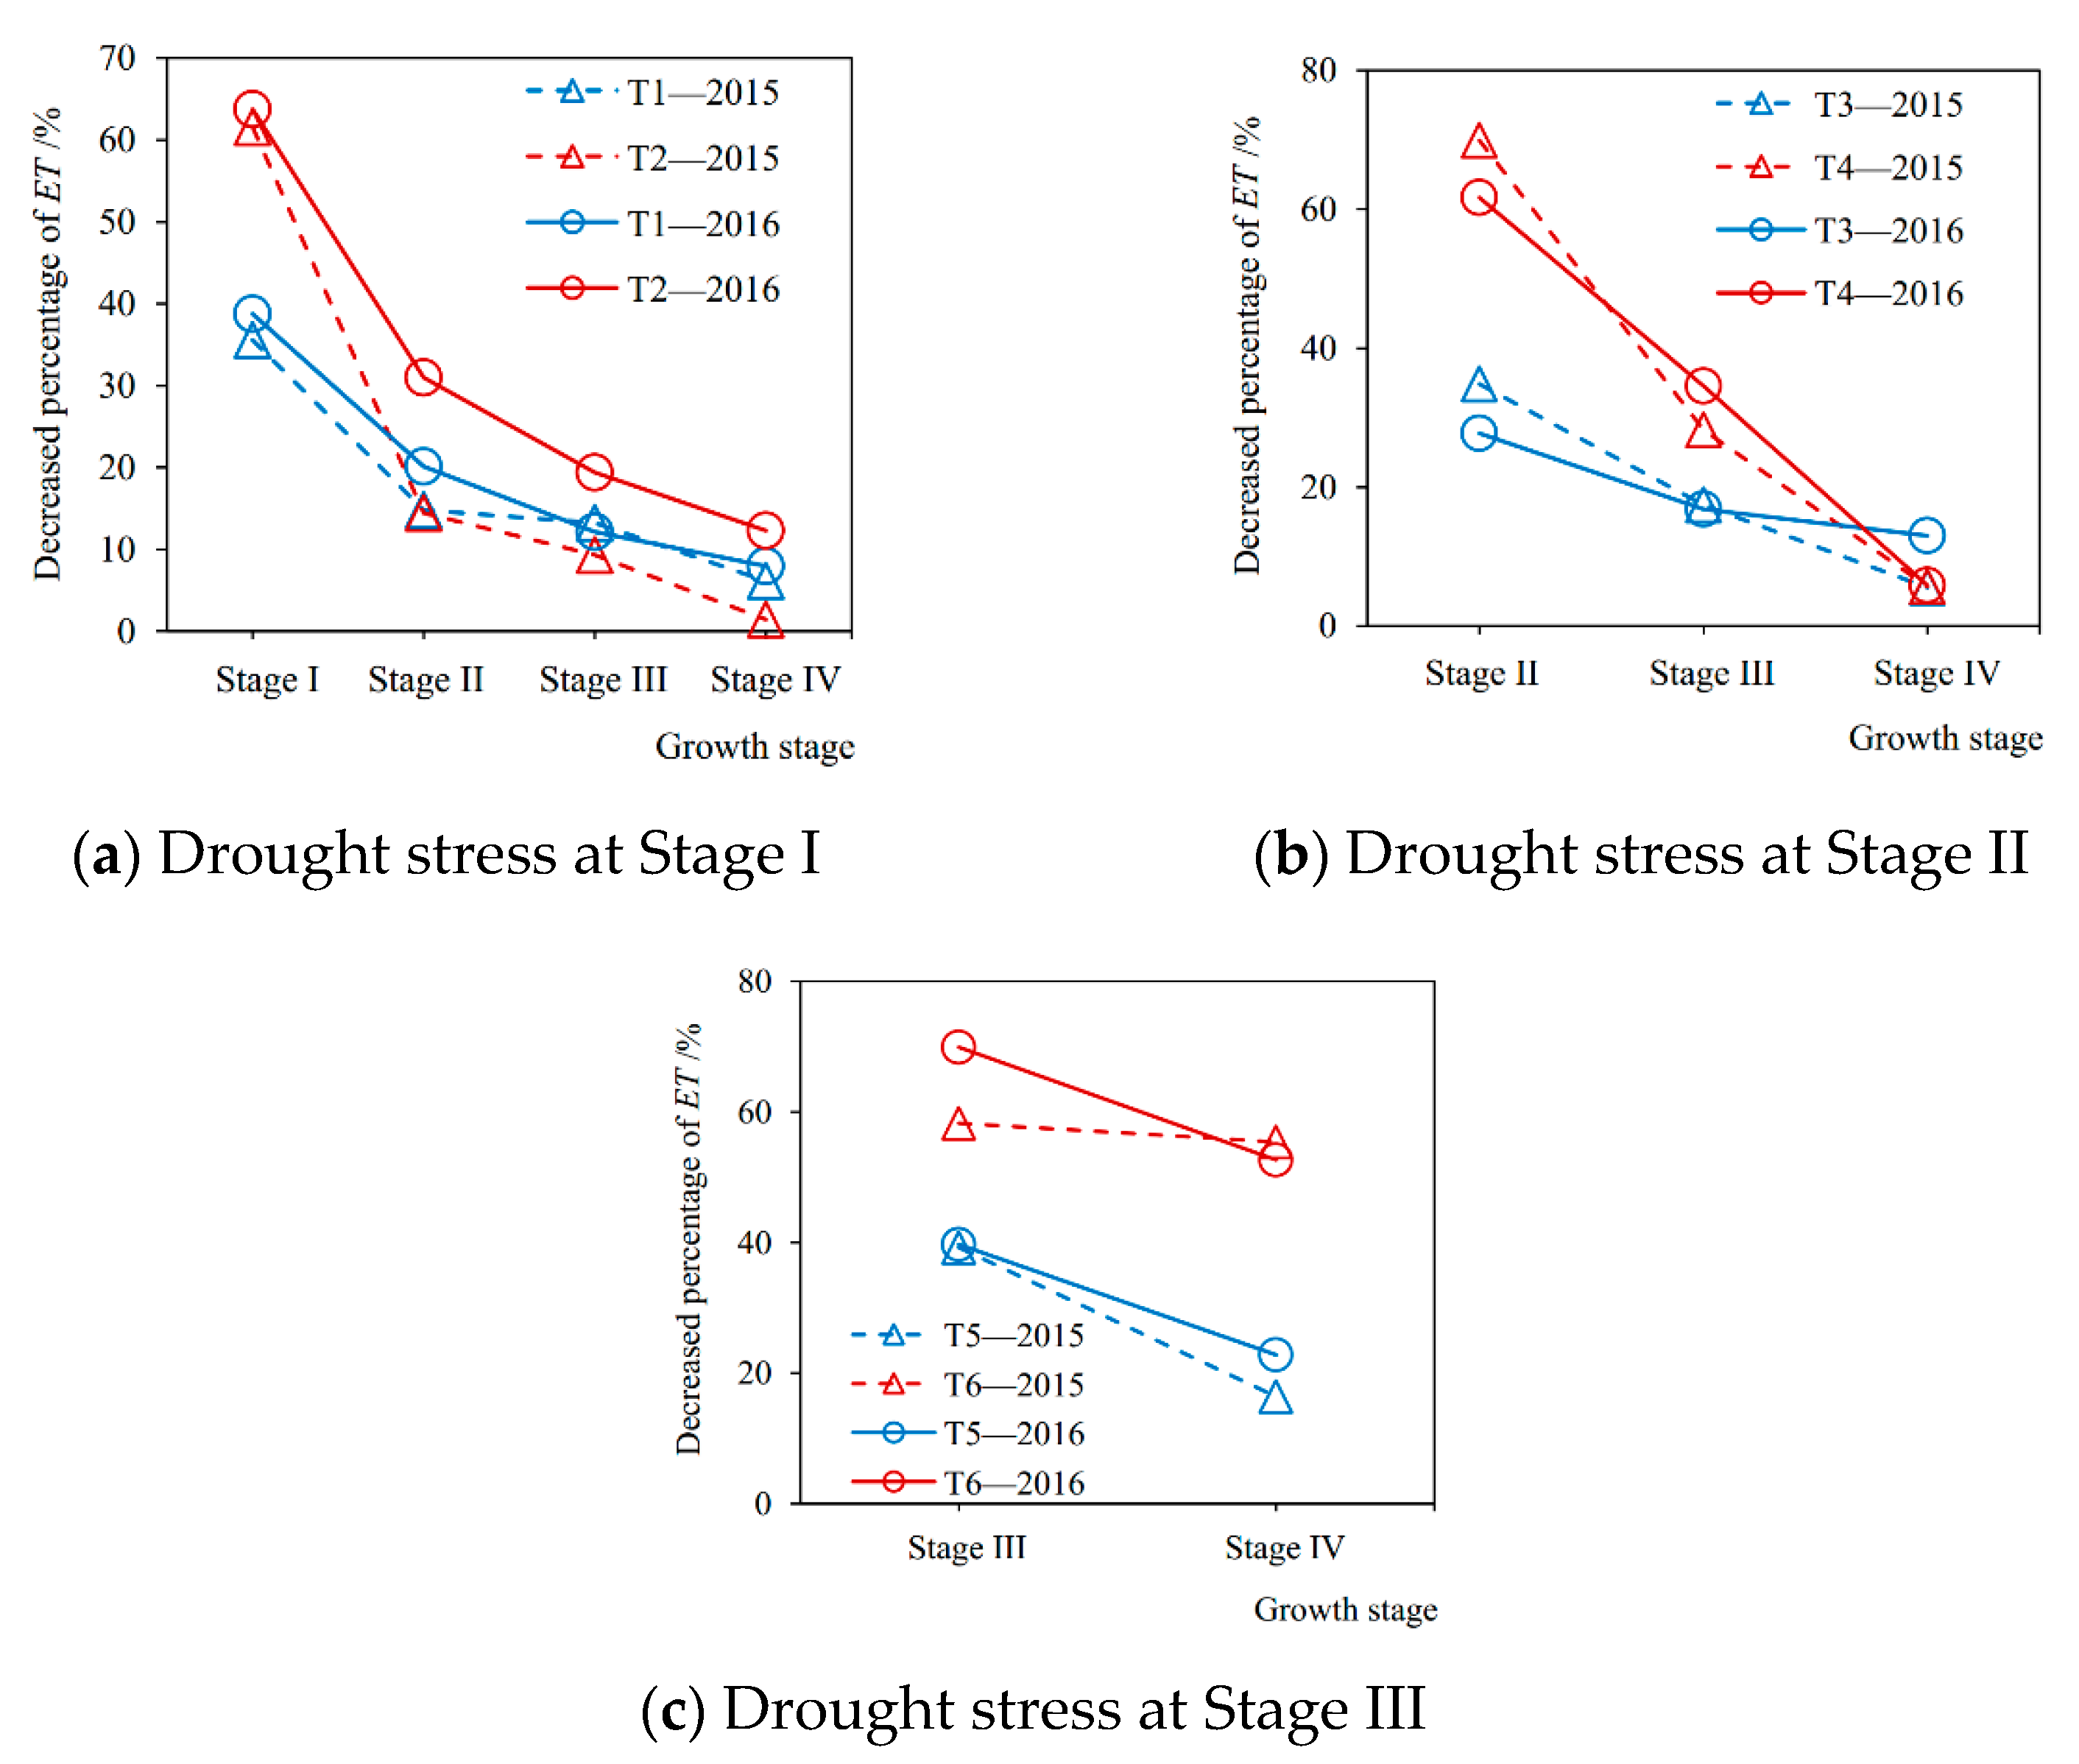
The decreased percentages of evapotranspiration at each growth stage from drought stress compared with sufficient irrigation in the 2015 and 2016 seasons are shown in Figure 4. It can be seen from Figure 4a that, when the soybean plant was suffered from a mild drought at Stage I in the 2015 season (T1-2015), the evapotranspiration at Stage I, Stage II, Stage III, and Stage IV decreased by 35.55%, 14.80%, 13.23%, and 6.12%, respectively, compared with no drought stress (CK-2015). When it was under severe drought condition (T2-2015), the evapotranspiration decreased by 61.54%, 14.45%, 9.29%, and 1.42%, respectively. Figure 4b shows that when the plant encountered a slight drought at Stage II in 2015 (T3-2015), evapotranspiration during Stage II, Stage III, and Stage IV was reduced by 34.87%, 17.42%, and 5.56%, respectively, compared with full irrigation (CK-2015), and when under serious drought (T4-2015), the evapotranspiration decreased by 69.92%, 28.20%, and 5.66%, respectively. From Figure 4c, it can be seen that when the soybean plant was subjected to mild drought situation at Stage III in the 2015 season (T5-2015), the evapotranspiration during Stage III and Stage IV decreased by 39.26% and 16.42%, respectively, compared with sufficient irrigation (CK-2015), and when under severe drought (T6-2015) the evapotranspiration was reduced by 58.30% and 55.40%, respectively. Furthermore, the results in the 2016 season were consistent with those in 2015.
Drought stress at a certain growth stage of soybean not only significantly reduced the evapotranspiration during this stage compared with sufficient irrigation, but also generated after-effects, which resulted in the reductions of evapotranspiration at the subsequent stages (Figure 4). Similar results were reported by Chen et al. [14] and Liu et al. [15], who found that there were lag effects of water deficit on the evapotranspiration of spring maize and winter wheat, respectively. Nosalewicz et al. [42] indicated that plants have evolved mechanisms of adaptation to fluctuations in their environmental conditions that have recently been given the term “stress memory”. However, our study has implemented specific experiments to further quantify the lasting effects caused by drought during different growth periods for soybeans. In addition, the after-effects of drought stress on soybean evapotranspiration weakened with rewatering later, the damaged transpiration mechanism gradually restored, and the recovery speed from severe drought was more significant than that of mild drought (Figure 4). Nevertheless, when the plant was rewatered after drought at the flowering-podding stage, the recovery effect of transpiration was obviously not as good as those after the seedling stage and the branching stage, especially under serious drought. The evapotranspiration at its next growth period (seed filling stage) was still greatly reduced in comparison with full irrigation (Figure 4c). These results were in accordance with the existing studies [12,16,22,33], which reflect that the recovery effect of rewatering is directed related to the degree and occurrence period of drought before. In addition, Xu et al. [18] reported that the speed of recovery with re-watering depended on the severity and duration of water stress for plants. Kaiser [43] discovered that an irreversible decrease in plant photosynthetic capacity occurred as relative leaf water content dropped below 30%, leading to cell death. Therefore, there may be two major reasons for the reductions of evapotranspiration at the growth stages after drought. One is that the drought at a given stage irreversibly destroys the physiological function of crop transpiration. Another is that the drought causes a short plant or low leaf area compared with full irrigation.
3.3. Current Influences of Drought Stress on Aboveground Biomass
The soybean aboveground biomass accumulation measured at the end of each growth stage under various treatments in the 2015 and 2016 seasons are shown in Figure 5, which quantitatively describes the matter accumulation process of plant under different drought conditions. It can be seen that from Figure 5 that drought stress at a certain stage directly caused the current loss of aboveground biomass accumulation during this stage. The more severe the drought, the greater the loss. For instance, under mild and severe droughts (T1-2015 and T2-2015) at Stage I in 2015, the aboveground biomass accumulation of plant was reduced by 34.90% and 49.72%, respectively, compared with no drought stress (CK-2015) (Figure 5a (a-1)). Our findings were consistent with those of Dogan et al. [35] and Sincik et al. [36], who discovered that there was an obvious difference in the reductions of biomass when soybeans encountered various degrees of water deficit. Similarly, Igbadun et al. [44] found that deficit irrigation at any growth stage of the maize led to decrease in seasonal evapotranspiration, dry matter, and grain yields. Moreover, the current losses of accumulation at the flowering-podding stage and the seed filling stage were significantly higher than those at the seedling stage and the branching stage. For example, in 2015 and 2016 under slight drought at Stage III (T5-2015 and T5-2016), the losses of accumulation were 54.73% and 47.81% higher than those at Stage I (T1-2015 and T1-2016), respectively (Figure 5a (a-1),b (b-1),a (a-3),b (b-3)). Similar results were discovered by Wei et al. [12] and Anda et al. [45], who found that the adverse influences of water deficit on soybean growth and development during the reproductive phase were significantly greater than those at the vegetative phase. In addition, when the soybean was subjected to severe drought at the flowering-podding stage and the seed-filling stage, the aboveground parts of plant during these two periods even withered (Figure 5a (a-3),b (b-3),a (a-4),b (b-4)). That is, the aboveground biomass at the end of the growth stage was less than that at the beginning, the accumulation during this stage was a negative value. For example, the biomass accumulation of soybean under serious drought at Stage IV in the 2015 and 2016 seasons (T8-2015 and T8-2016) decreased by 34.20 g and 43.26 g, respectively, compared with full irrigation (CK-2015 and CK-2016) (Figure 5a (a-4),b (b-4)). Similarly, many studies by field experiments have reported that soybeans were more susceptible to water deficit during the beginning of flowering to the beginning of seed formation [33,35,46]. Jha et al. [47] observed that water stress during the vegetative growth and flowering period affected soybean biomass yields significantly. Specifically, at the soybean flowering and pod-enlargement stage, vegetative and reproductive growth proceeded simultaneously and the water consumption approached the maximum [48], once the plant encountered a severe drought, the pod and seed formation would be severely obstructed. Moreover, drought at the flowering stage reduced the number of pods and seed size, and seed size would significantly decline if drought occurred in the late flowering and pod-filling stages [49,50]. These findings well explained the withered soybean plants caused by drought at the flowering-podding and seed-filling stages in this study. Therefore, it is vital to ensure the water supply during these periods for a high biomass yield.
3.4. After-Effects of Drought Stress on Aboveground Biomass
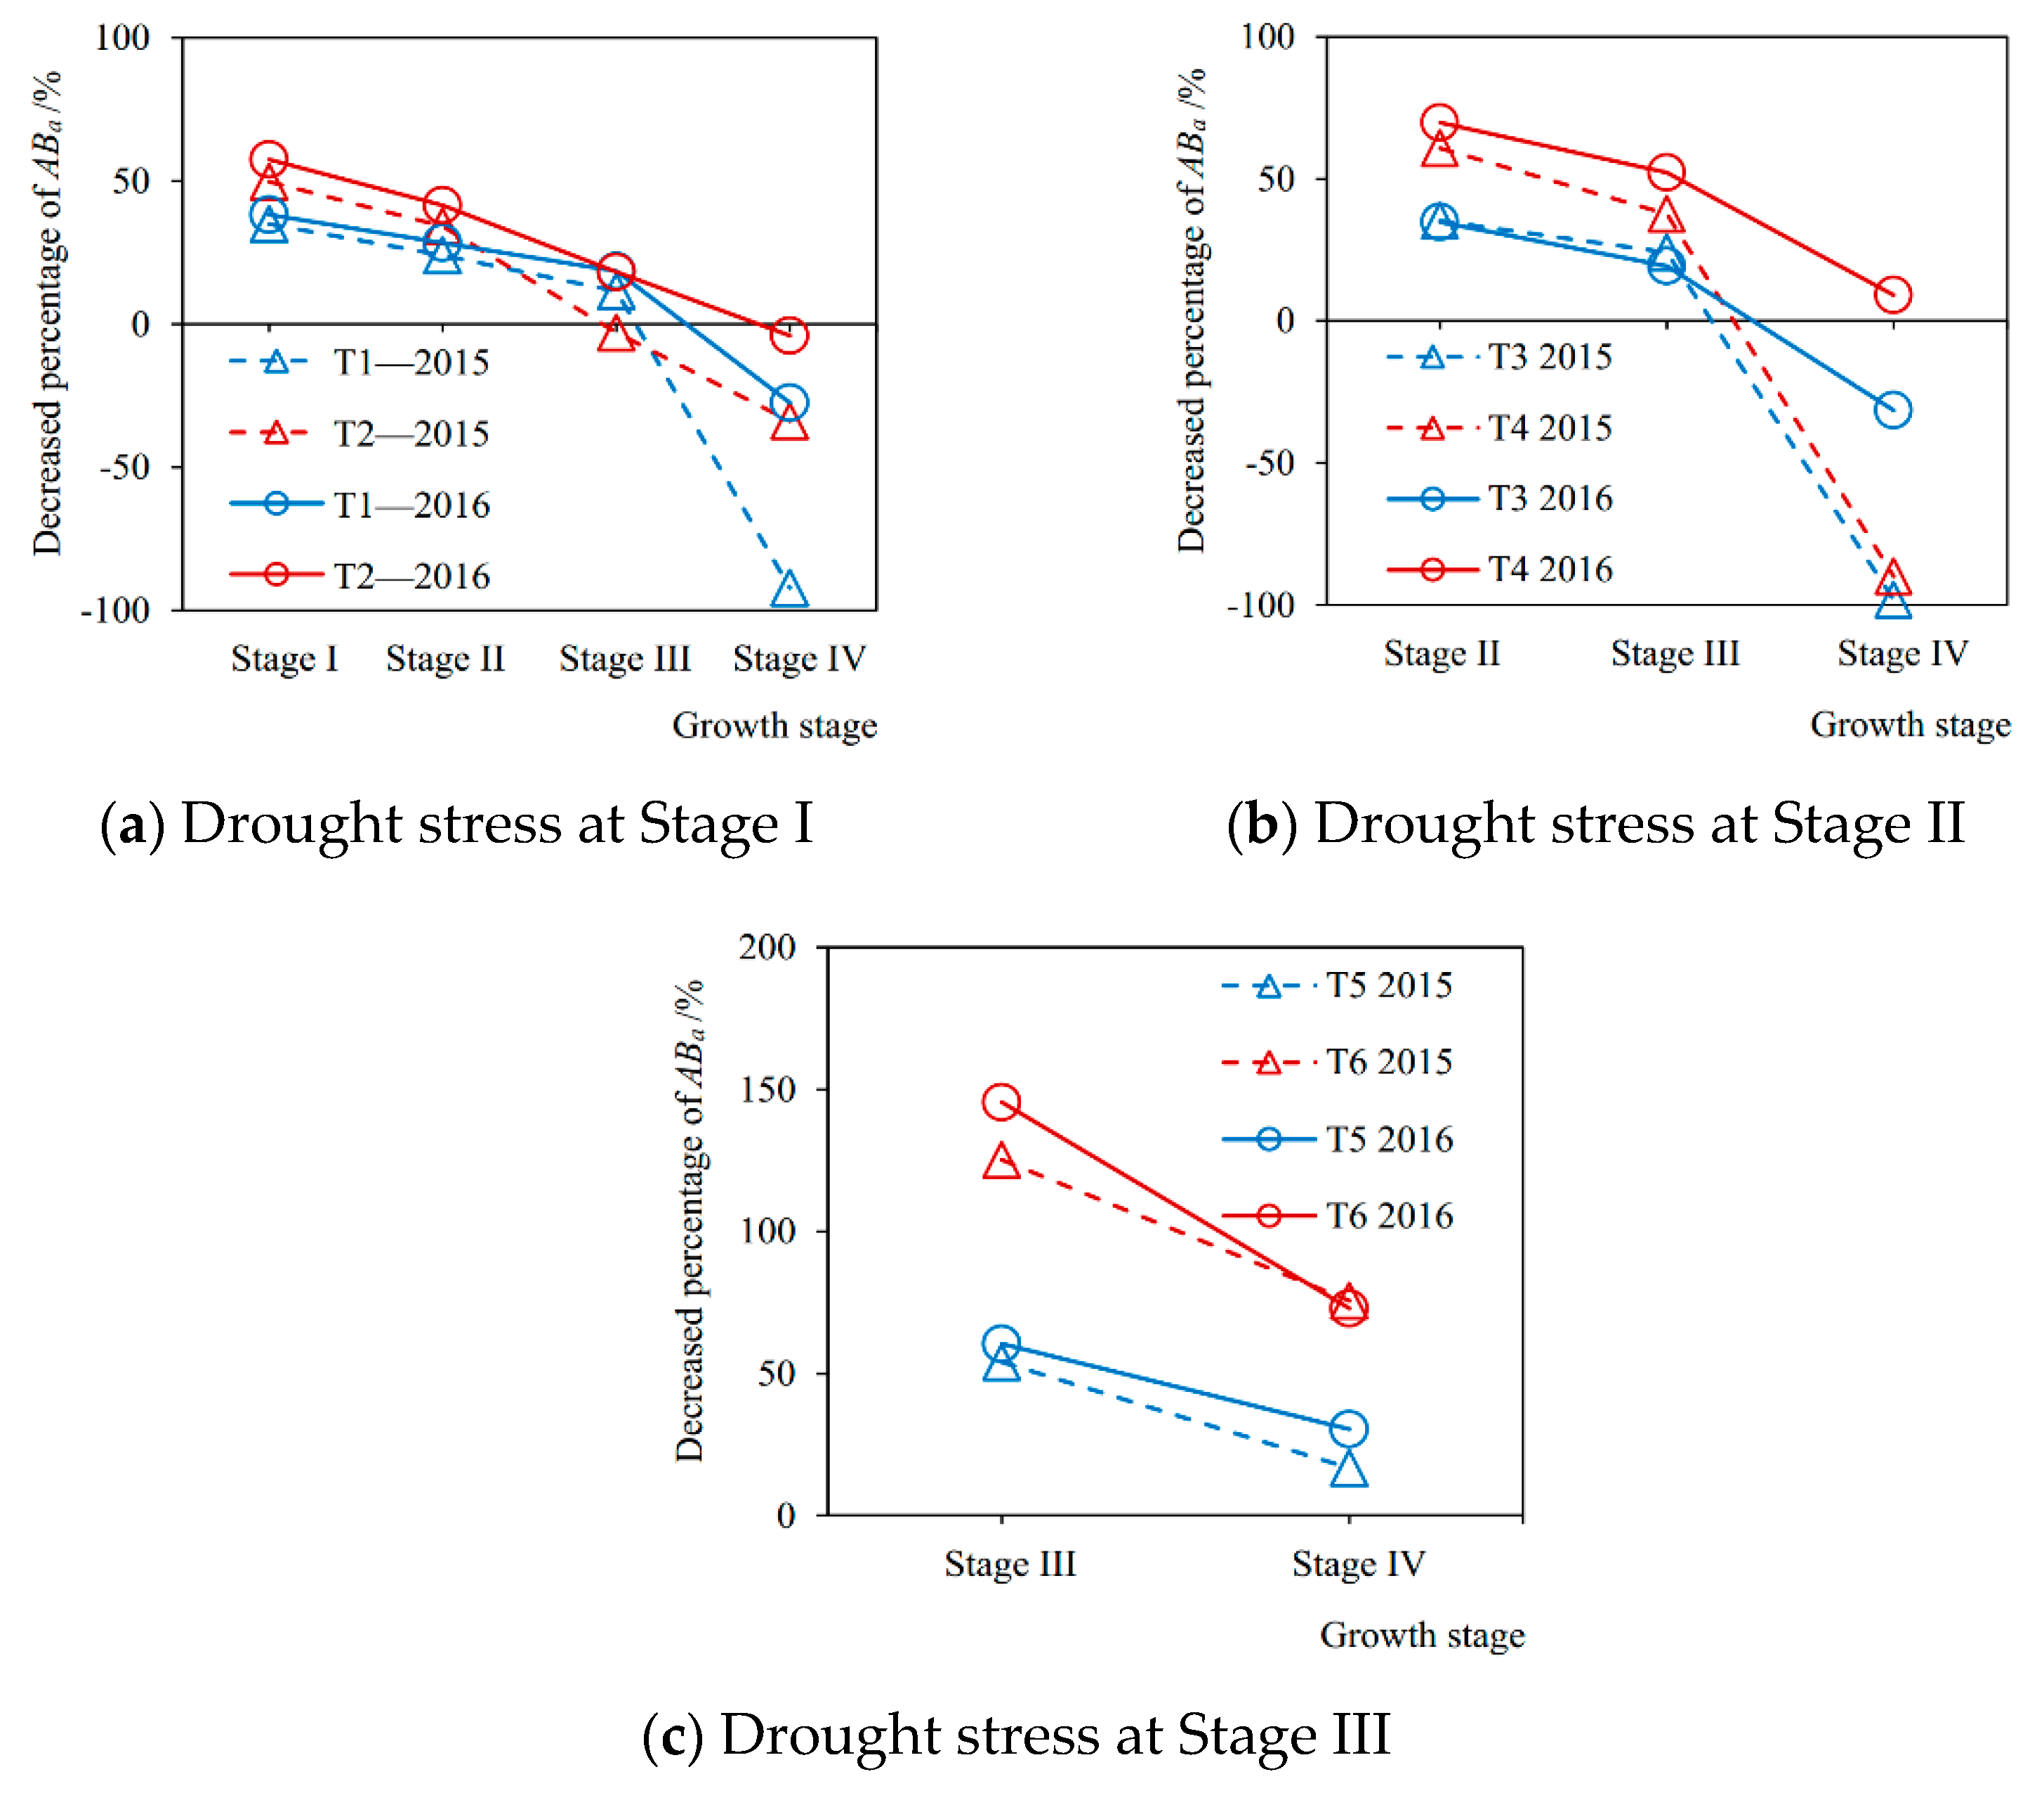
The decreased percentages of aboveground biomass accumulation at each growth stage from drought stress compared with full irrigation are shown in Figure 6. It can be seen from Figure 6a that in the 2015 season when the plant was under mild drought condition at Stage I (T1-2015), the biomass accumulations at Stage I, Stage II, Stage III, and Stage IV were reduced by 34.90%, 24.01%, 11.49%, and −92.21% (compensation effect after rewatering), respectively, compared with no drought stress (CK-2015). While those under severe drought stress (T2-2015) decreased by 49.72%, 34.26%, −2.93%, and −33.91%, respectively. The trends in the 2016 season were consistent with 2015, but the percentage of reduction in biomass accumulation at each stage was generally higher than that in 2015, which may be due to the different degrees of drought stress at the corresponding growth stage for the two seasons. It can be seen that from Figure 6b that when the plant was under slight drought situation at Stage II in the 2015 season (T3-2015), the aboveground biomass accumulations at Stage II, Stage III, and Stage IV decreased by 35.26%, 24.09%, and −98.24%, respectively, compared with no drought stress (CK-2015), and decreased by 60.85%, 37.70%, and −89.93% under severe drought condition (T4-2015). The trends in 2016 were the same, but the decreased percentage at each growth stage under mild drought stress was all lower than that in 2015, and higher than 2015 under severe drought. From Figure 6c, it can be seen that when the plants suffered from slight drought stress at Stage III in 2015 season (T5-2015), the aboveground biomass accumulation at Stage III and Stage IV were reduced by 53.94% and 16.76%. While under severe drought (T6-2015), they decreased by 125.17% and 75.61%, respectively. Similarly, the trends in the 2016 season were consistent with 2015, but the percentages of reduction during the two growth stages were both higher than those in 2015.
Drought stress at a certain growth stage of soybean not only significantly reduced the current aboveground biomass accumulation during this stage compared with no drought stress, but also produced the after-effects on the aboveground growth process of plants during the subsequent stages, making the biomass accumulations decrease. Similarly, Chen et al. [14] and Liu et al. [15] found the lag effects of drought at a given stage on dry matter accumulation of maize and wheat by field experiments. Meanwhile, these were consistent with the after-effects of drought stress on the evapotranspiration mentioned above. It indicated that there was a correlation between transpiration and aboveground growth of soybean plants under various drought conditions, which was in accordance with the existing studies [45,51]. Siahpoosh et al. [52] showed that the relationship between dry matter at different growing stages and crop evapotranspiration for bread wheat could be modeled in a linear function by regression analysis. In addition, the damaged growth mechanism of soybeans caused by drought gradually recovered after rewatering later, and even the compensation effect occurred, which meant that the biomass accumulation during a stage was higher than that always under sufficient irrigation condition. Similar results of compensation effects after rewatering from water deficit for corn, soybean, and pea were presented by Boyer [19] and Lecoeur et al. [53]. Wu et al. [54] discovered that drought at the earlier growth stages decreased the lint and cottonseed yield, whereas waterlogging during the later stages had a compensatory effect.
Furthermore, for rewatering after drought at the seedling stage and the branching stage, the compensation effect of soybean growth at the seed filling stage was more prominent (the decreased percentages of aboveground biomass accumulation at Stage IV were mostly negative values in Figure 6a,b). However, severe drought during the flowering-podding stage caused an irreversible damage to the aboveground growth of soybean (the decreased percentages of accumulation exceeded 100% in Figure 6c, which indicated that the aboveground part of plant had withered), which resulted in a poor recovery of growth after rewatering at the following period (seed-filling stage) and still a large loss of biomass accumulation. Therefore, the recovery effect of soybean aboveground growth after rewatering is decided by both the degree and occurrence period of drought before. Specifically, it seems that after suffering a moderate drought at the vegetative growth stage for soybeans, the photosynthesis and respiration may be not significantly affected, and the cell division may be not inhibited. After rewatering, the physiological function quickly returns to the normal status and the previously accumulated photosynthetic products provide enough material basis for plant growth, so the soybean shows a restored or even compensatory performance [19,53]. In addition, Igbadun et al. [44] found that the effect of deficit irrigation on the maize during the vegetative growth stage could be compensated for and final biomass yield and grain yields improved upon if the maize was adequately irrigated during the flowering and grain filling stages.
Soybean responses to water deficit is a highly dynamic and complex process involving several morpho-physiological, genotypic, and biochemical mechanisms [55]. In addition, it is sensitive to drought stress [56] as droughts reduce the evapotranspiration and biomass yield [57]. Specifically, from the above lasting responses of evapotranspiration and aboveground biomass to drought at different stages, it is practical to implement deficit irrigation during the seedling and branching stages, but the degree should be controlled. Furthermore, it is crucial to ensure sufficient water supply during the reproductive growth period, especially at the flowering and pod-enlargement stage, to guarantee normal transpiration and a high biomass yield for soybeans in the Huaibei Plain.
4. Conclusions
This study quantitatively analyzed the lasting responses of plant evapotranspiration and aboveground biomass to drought stress at different growth stages by soybean (Zhonghuang 13) pot experiments in the Huaibei Plain, China, and the following conclusions were obtained.
(1) Compared with full irrigation, soybean evapotranspiration under droughts at the seedling stage, branching stage, flowering-podding stage, and seed-filling stage in 2015 decreased by 48.54%, 52.40%, 48.78%, and 61.26%, respectively. Those in 2016 were 51.26%, 44.70%, 54.83%, and 61.85%. Therefore, drought at a certain growth stage of soybean significantly reduced the evapotranspiration during this period. Moreover, the adverse influence at the seed filling stage was the most serious.
Furthermore, in the 2015 season, when the soybean suffered from a mild drought at the seedling stage, the evapotranspiration at the subsequent branching stage, flowering-podding stage, and seed-filling stage decreased by 14.80%, 13.23%, and 6.12%, respectively, compared with sufficient irrigation. Those under serious drought were 14.45%, 9.29%, and 1.42%. When the plant encountered a slight drought at the branching stage, the evapotranspiration during the flowering-podding stage and seed-filling stage reduced by 17.42% and 5.56%, respectively, and under severe drought decreased by 28.20% and 5.66%. In addition, when the soybean was subjected to mild and serious droughts at the flowering-podding stage, the evapotranspiration during the seed filling stage decreased by 16.42% and 55.40%, respectively. The results in the 2016 season were consistent with those in 2015. Therefore, drought at a certain growth stage of soybean also generated after-effects and caused the reductions of evapotranspiration during the following periods. Moreover, the after-effects weakened with rewatering later, and the recovery speed from severe drought was more significant. Nevertheless, the recovery of transpiration was not obvious when rewatering after drought at the flowering-podding stage, especially under serious drought.
(2) Under slight and serious droughts at the seedling stage, branching stage, flowering-podding stage, and seed-filling stage in the 2015 season, the current aboveground biomass accumulation of plant was reduced by 34.90% and 49.72%, 35.26% and 60.85%, 53.94% and 125.17%, 264.59% and 308.85%, respectively, compared with sufficient irrigation. Therefore, drought at a certain growth stage of soybean directly caused the loss of aboveground biomass accumulation during this period, and the more severe the drought, the greater the loss. Moreover, the current losses of accumulation caused by drought at the flowering-podding stage and the seed-filling stage were significantly larger.
In addition, during the 2015 season, when the soybean was under mild drought at the seedling stage, the biomass accumulations at the following branching stage, flowering-podding stage, and seed-filling stage were reduced by 24.01%, 11.49%, and −92.21%, respectively, compared with no drought. While those under severe drought decreased by 34.26%, −2.93%, and −33.91%. When the plant was under slight drought at the branching stage, the accumulations at the flowering-podding stage and seed-filling stage decreased by 24.09% and −98.24%, respectively, and under serious drought decreased by 37.70% and −89.93%. Furthermore, when the plant suffered from mild and severe droughts at the flowering-podding stage, the accumulations at the seed-filling stage were reduced by 16.76% and 75.61%, respectively. The trends in the 2016 season were consistent with those in 2015. Therefore, drought at a certain growth stage of soybean growth also produced the after-effects to the aboveground growth process of plant during the subsequent periods. Moreover, the damaged growth mechanism gradually recovered after rewatering later, and even the compensation effect occurred. For rewatering after drought at the seedling stage and the branching stage, the compensation effect at the seed filling stage was more prominent. However, severe drought at the flowering-podding stage caused an irreversible damage to the growth. Thus, the recovery effect of aboveground growth after rewatering for soybeans is decided by both the degree and occurrence period of drought before.
(3) It is practical to implement deficit irrigation during the seedling stage and the branching stage, but the degree of deficit should be strictly controlled. Meanwhile, it is vital to ensure sufficient water supply at the reproductive growth period, especially during the flowering and pod-enlargement stage, to guarantee normal transpiration and a high biomass yield for soybeans in the Huaibei Plain. This study provides an important reference for formulating irrigation strategies, and the results based on two-season pot experiments should be further verified in our future works.
Author Contributions
Conceptualization, Y.C. and J.J.; methodology, Y.C., J.J., and Y.Z.; validation, S.N. and C.W.; investigation, Y.C. and C.W.; resources, S.J.; writing—original draft preparation, Y.C. and S.N.; writing—review and editing, J.J., S.J., Y.Z., and C.W.; funding acquisition, J.J., Y.Z., S.N., and Y.C. All authors have read and agreed to the published version of the manuscript.
Funding
This research was funded by the National Key Research and Development Program of China (Grant No. 2017YFC1502405), the Fundamental Research Funds for the Central Universities of China (Grant No. JZ2020HGQA0202), the National Natural Science Foundation of China (Grant Nos. 51779067 and 51709071), and the Key Research and Development Program of Shandong Province of China (Grant No. 2017GSF20101).
Institutional Review Board Statement
The study was conducted according to the guidelines of the Declaration of Helsinki, and approved by the Institutional Review Board.
Acknowledgments
We are grateful to Hongwei Yuan for his technical assistance in the pot experiments.
Conflicts of Interest
The authors declare no conflict of interest.
References
- Sun, F.X.; Mejia, A.; Zeng, P.; Che, Y. Projecting meteorological, hydrological and agricultural droughts for the Yangtze River basin. Sci. Total Environ. 2019, 696, 134076. [Google Scholar] [CrossRef]
- Sánchez, N.; González-Zamora, Á.; Martínez-Fernández, J.; Piles, M.; Pablos, M. Integrated remote sensing approach to global agricultural drought monitoring. Agric. For. Meteorol. 2018, 259, 141–153. [Google Scholar] [CrossRef]
- Zhang, F.; Chen, Y.N.; Zhang, J.Q.; Guo, E.L.; Wang, R.; Li, D.J. Dynamic drought risk assessment for maize based on crop simulation model and multi-source drought indices. J. Clean. Prod. 2019, 233, 100–114. [Google Scholar] [CrossRef]
- Dai, A.G.; Trenberth, K.E.; Qian, T.T. A global dataset of Palmer Drought Severity Index for 1870–2002: Relationship with soil moisture and effects of surface warming. J. Hydrometeorol. 2004, 5, 1117–1130. [Google Scholar] [CrossRef]
- Fontaine, M.M.; Steinemann, A.C. Assessing vulnerability to natural hazards: Impact-based method and application to drought in Washington State. Nat. Hazards Rev. 2009, 10, 11–18. [Google Scholar] [CrossRef]
- Mishra, A.K.; Singh, V.P. Drought modeling—A review. J. Hydrol. 2011, 403, 157–175. [Google Scholar] [CrossRef]
- Khakwani, A.A.; Dennett, M.D.; Khan, N.U.; Munir, M.; Baloch, M.J.; Latif, A.; Gul, S. Stomatal and chlorophyll limitations of wheat cultivars subjected to water stress at booting and anthesis stages. Pak. J. Bot. 2013, 45, 1925–1932. [Google Scholar]
- Goldhamer, D.A.; Fereres, E. Irrigation scheduling protocols using continuously recorded trunk diameter measurements. Irrig. Sci. 2001, 20, 115–125. [Google Scholar] [CrossRef]
- Gallardo, M.; Thompson, R.B.; Valdez, L.C.; Fernández, M.D. Use of stem diameter variations to detect plant water stress in tomato. Irrig. Sci. 2006, 24, 241–255. [Google Scholar] [CrossRef]
- Meeks, C.D.; Snider, J.L.; Babb-Hartman, M.E.; Barnes, T. Evaluating the mechanisms of photosynthetic inhibition under growth-limiting, early-season water deficit stress in cotton. Crop Sci. 2019, 59, 1–11. [Google Scholar] [CrossRef]
- Jumrani, K.; Bhatia, V.S. Impact of combined stress of high temperature and water deficit on growth and seed yield of soybean. Physiol. Mol. Biol. Plants 2018, 24, 37–50. [Google Scholar] [CrossRef] [PubMed]
- Wei, Y.Q.; Jin, J.L.; Jiang, S.M.; Ning, S.W.; Liu, L. Quantitative response of soybean development and yield to drought stress during different growth stages in the Huaibei Plain, China. Agronomy 2018, 8, 97. [Google Scholar] [CrossRef] [Green Version]
- Yue, Y.J.; Wang, L.; Li, J.; Zhu, A.X. An EPIC model-based wheat drought risk assessment using new climate scenarios in China. Clim. Chang. 2018, 147, 1–15. [Google Scholar] [CrossRef]
- Chen, Y.X.; Yu, J. A study on model of crop response to water in consideration of lag effect with limited water deficit. J. Hydraul. Eng. 1998, 4, 70–74. [Google Scholar]
- Liu, X.Y.; Luo, Y.P. Simulation of after-effect of water stress on growth of winter wheat. Trans. Chin. Soc. Agric. Eng. 2003, 19, 28–32. [Google Scholar]
- Cui, Y.; Jiang, S.M.; Feng, P.; Jin, J.L.; Yuan, H.W. Winter wheat evapotranspiration estimation under drought stress during several growth stages in Huaibei Plain, China. Water 2018, 10, 1208. [Google Scholar] [CrossRef] [Green Version]
- Alghory, A.; Yazar, A. Evaluation of crop water stress index and leaf water potential for deficit irrigation management of sprinkler-irrigated wheat. Irrig. Sci. 2019, 37, 61–77. [Google Scholar] [CrossRef]
- Xu, Z.Z.; Zhou, G.S.; Shimizu, H. Plant responses to drought and rewatering. Plant Signal. Behav. 2010, 5, 649–654. [Google Scholar] [CrossRef] [Green Version]
- Boyer, J.S. Differing sensitivity of photosynthesis to low leaf water potentials in corn and soybean. Plant Physiol. 1970, 46, 236–239. [Google Scholar] [CrossRef] [Green Version]
- Desotgiu, R.; Pollastrini, M.; Cascio, C.; Gerosa, G.; Marzuoli, R.; Bussotti, F. Chlorophyll a fluorescence analysis along a vertical gradient of the crown in a poplar (Oxford clone) subjected to ozone and water stress. Tree Physiol. 2012, 32, 976–986. [Google Scholar] [CrossRef] [Green Version]
- Luo, H.H.; Zhang, Y.L.; Zhang, W.F. Effects of water stress and rewatering on photosynthesis, root activity, and yield of cotton with drip irrigation under mulch. Photosynthetica 2016, 54, 65–73. [Google Scholar] [CrossRef]
- Guo, X.P.; Liu, Z.P.; Wang, Q.M.; Guo, F.; Yuan, J.; Chen, Z.P. Study on photosynthetic compensatory effects of PEG osmotic stress and rewatering on maize. J. Hohai Univ. 2007, 35, 286–290. [Google Scholar]
- Zegada-Lizarazu, W.; Monti, A. Photosynthetic response of sweet sorghum to drought and re-watering at different growth stages. Physiol. Plant. 2013, 149, 56–66. [Google Scholar] [CrossRef]
- Steduto, P.; Hsiao, T.C.; Fereres, E. On the conservative behavior of biomass water productivity. Irrig. Sci. 2007, 25, 189–207. [Google Scholar] [CrossRef] [Green Version]
- Board, J.E.; Modali, H. Dry matter accumulation predictors for optimal yield in soybean. Crop Sci. 2004, 45, 1790–1799. [Google Scholar] [CrossRef]
- Wu, Z.T.; Yu, L.; Du, Z.Q.; Zhang, H.; Fan, X.H.; Lei, T.J. Recent changes in the drought of China from 1960 to 2014. Int. J. Climatol. 2020, 40, 3281–3296. [Google Scholar] [CrossRef]
- Ministry of Water Resources, Office of State Flood Control and Drought Relief Headquarters. China Floods and Droughts Bulletin; Water and Power Press: Beijing, China, 2014.
- Wei, Z.; Paredes, P.; Liu, Y.; Chi, W.W.; Pereira, L.S. Modelling transpiration, soil evaporation and yield prediction of soybean in North China Plain. Agric. Water Manag. 2015, 147, 43–53. [Google Scholar] [CrossRef]
- Wei, Y.Q.; Jin, J.L.; Jiang, S.M.; Ning, S.W.; Cui, Y.; Zhou, Y.L. Simulated assessment of summer maize drought loss sensitivity in Huaibei Plain, China. Agronomy 2019, 9, 78. [Google Scholar] [CrossRef] [Green Version]
- Chen, M.L.; Ning, S.W.; Cui, Y.; Jin, J.L.; Zhou, Y.L.; Wu, C.G. Quantitative assessment and diagnosis for regional agricultural drought resilience based on set pair analysis and connection entropy. Entropy 2019, 21, 373. [Google Scholar] [CrossRef] [Green Version]
- Tsubo, M.; Walker, S. A model of radiation interception and use by a maize-bean intercrop canopy. Agric. For. Meteorol. 2002, 110, 203–215. [Google Scholar] [CrossRef]
- Cui, Y.; Jiang, S.M.; Jin, J.L.; Feng, P.; Ning, S.W. Decision-making of irrigation scheme for soybeans in the Huaibei Plain based on grey entropy weight and grey relation–projection pursuit. Entropy 2019, 21, 877. [Google Scholar] [CrossRef] [Green Version]
- Cui, Y.; Jiang, S.M.; Jin, J.L.; Ning, S.W.; Feng, P. Quantitative assessment of soybean drought loss sensitivity at different growth stages based on S-shaped damage curve. Agric. Water Manag. 2019, 213, 821–832. [Google Scholar] [CrossRef]
- Desclaux, D.; Huynh, T.; Roumet, P. Identification of soybean plant characteristics that indicate the timing of drought stress. Crop Sci. 2000, 40, 716–722. [Google Scholar] [CrossRef]
- Dogan, E.; Kirnak, H.; Copur, O. Deficit irrigations during soybean reproductive stages and GROPGRO-soybean simulations under semi-arid climatic conditions. Field Crop. Res. 2007, 103, 154–159. [Google Scholar] [CrossRef]
- Sincik, M.; Candogan, B.N.; Demirtas, C.; Büyükcangaz, H.; Yazgan, S.; Göksoy, A.T. Deficit irrigation of soya bean [Glycine max (L.) Merr.] in a sub-humid climate. J. Agron. Crop Sci. 2008, 194, 200–205. [Google Scholar] [CrossRef]
- Patanè, C.; Cosentino, S.L. Effects of soil water deficit on yield and quality of processing tomato under a Mediterranean climate. Agric. Water Manag. 2010, 97, 131–138. [Google Scholar] [CrossRef]
- Chen, J.L.; Kang, S.Z.; Du, T.S.; Qiu, R.J.; Guo, P.; Chen, R.Q. Quantitative response of greenhouse tomato yield and quality to water deficit at different growth stages. Agric. Water Manag. 2013, 129, 152–162. [Google Scholar] [CrossRef]
- Jacobsen, S.-E.; Liu, F.; Jensen, C.R. Does root-sourced ABA play a role for regulation of stomata under drought in quinoa (Chenopodium quinoa Willd.). Sci. Hortic. 2009, 122, 281–287. [Google Scholar] [CrossRef] [Green Version]
- Guo, W.H.; Li, B.; Zhang, X.S.; Wang, R.Q. Effects of water stress on water use efficiency and water balance components of Hippophae rhamnoides and Caragana intermedia in the soil-plant-atmosphere continuum. Agrofor. Syst. 2010, 80, 423–435. [Google Scholar] [CrossRef]
- Čereković, N.; Pagter, M.; Kristensen, H.L.; Brennan, R.; Petersen, K.K. Effects of deficit irrigation during flower initiation of two blackcurrant (Ribes nigrum L.) cultivars. Sci. Hortic. 2014, 168, 193–201. [Google Scholar]
- Nosalewicz, A.; Siecińska, J.; Kondracka, K.; Nosalewicz, M. The functioning of Festuca arundinacea and Lolium perenne under drought is improved to a different extend by the previous exposure to water deficit. Environ. Exp. Bot. 2018, 156, 271–278. [Google Scholar] [CrossRef]
- Kaiser, W.M. Effects of water deficit on photosynthetic capacity. Physiol. Plant. 1987, 71, 142–149. [Google Scholar] [CrossRef]
- Igbadun, H.E.; Salim, B.A.; Tarimo, A.K.P.R.; Mahoo, H.F. Effects of deficit irrigation scheduling on yields and soil water balance of irrigated maize. Irrig. Sci. 2008, 27, 11–23. [Google Scholar] [CrossRef]
- Anda, A.; Soós, G.; Menyhárt, L.; Kucserka, T.; Simon, B. Yield features of two soybean varieties under different water supplies and field conditions. Field Crop. Res. 2020, 245, 107673. [Google Scholar] [CrossRef]
- Foroud, N.; Mündel, H.H.; Saindon, G.; Entz, T. Effect of level and timing of moisture stress on soybean plant development and yield components. Irrig. Sci. 1993, 13, 149–155. [Google Scholar] [CrossRef]
- Jha, P.K.; Kumar, S.N.; Ines, A.V.M. Responses of soybean to water stress and supplemental irrigation in upper Indo-Gangetic plain: Field experiment and modeling approach. Field Crop. Res. 2018, 219, 76–86. [Google Scholar] [CrossRef]
- Xu, S.Q.; Song, J.; Wu, Y. Discussion of soybean water demand regulation and sprinkling irrigation pattern. Water Sav. Irrig. 2003, 3, 23–25. [Google Scholar]
- Egli, D.B.; Bruening, W.P. Water stress, photosynthesis, seed sucrose levels and seed growth in soybean. J. Agric. Sci. 2004, 142, 1–8. [Google Scholar] [CrossRef]
- Oya, T.; Nepomuceno, A.L.; Neumaier, N.; Farias, J.R.B.; Tobita, S.; Ito, O. Drought tolerance characteristics of Brazilian soybean cultivars—Evaluation and characterization of drought tolerance of various Brazilian soybean cultivars in the field. Plant Prod. Sci. 2004, 7, 129–137. [Google Scholar] [CrossRef] [Green Version]
- Karam, F.; Masaad, R.; Thérèse, S.; Mounzer, O.; Rouphael, Y. Evapotranspiration and seed yield of field grown soybean under deficit irrigation conditions. Agric. Water Manag. 2005, 75, 226–244. [Google Scholar] [CrossRef]
- Siahpoosh, M.R.; Dehghanian, E.; Kamgar, A. Drought tolerance evaluation of bread wheat genotypes using water use efficiency, evapotranspiration efficiency, and drought susceptibility index. Crop Sci. 2011, 51, 1198–1204. [Google Scholar] [CrossRef]
- Lecoeur, J.; Wery, J.; Turc, O.; Tardieu, F. Expansion of pea leaves subjected to short water deficit: Cell number and cell size are sensitive to stress at different periods of leaf development. J. Exp. Bot. 1995, 46, 1093–1101. [Google Scholar] [CrossRef]
- Wu, H.; Wang, X.G.; Xu, M.; Zhang, J.X. The effect of water deficit and waterlogging on the yield components of cotton. Crop Sci. 2018, 58, 1751–1761. [Google Scholar] [CrossRef]
- Wijewardana, C.; Alsajri, F.A.; Irby, J.T.; Krutz, L.J.; Golden, B.R.; Henry, W.B.; Reddy, K.R. Water deficit effects on soybean root morphology and early-season vigor. Agronomy 2019, 9, 836. [Google Scholar] [CrossRef] [Green Version]
- Van Heerden, P.D.R.; Krüger, G.H.J. Separately and simultaneously induced dark chilling and drought stress effects on photosynthesis, proline accumulation and antioxidant metabolism in soybean. J. Plant Physiol. 2002, 159, 1077–1086. [Google Scholar] [CrossRef]
- Liu, F.L.; Jensen, C.R.; Andersen, M.N. Pod set related to photosynthetic rate and endogenous ABA in soybeans subjected to different water regimes and exogenous ABA and BA at early reproductive stages. Ann. Bot. 2004, 94, 405–411. [Google Scholar] [CrossRef] [Green Version]
Figure 1.
Location of experimental site and soybean pots under drought stress in the Huaibei Plain.
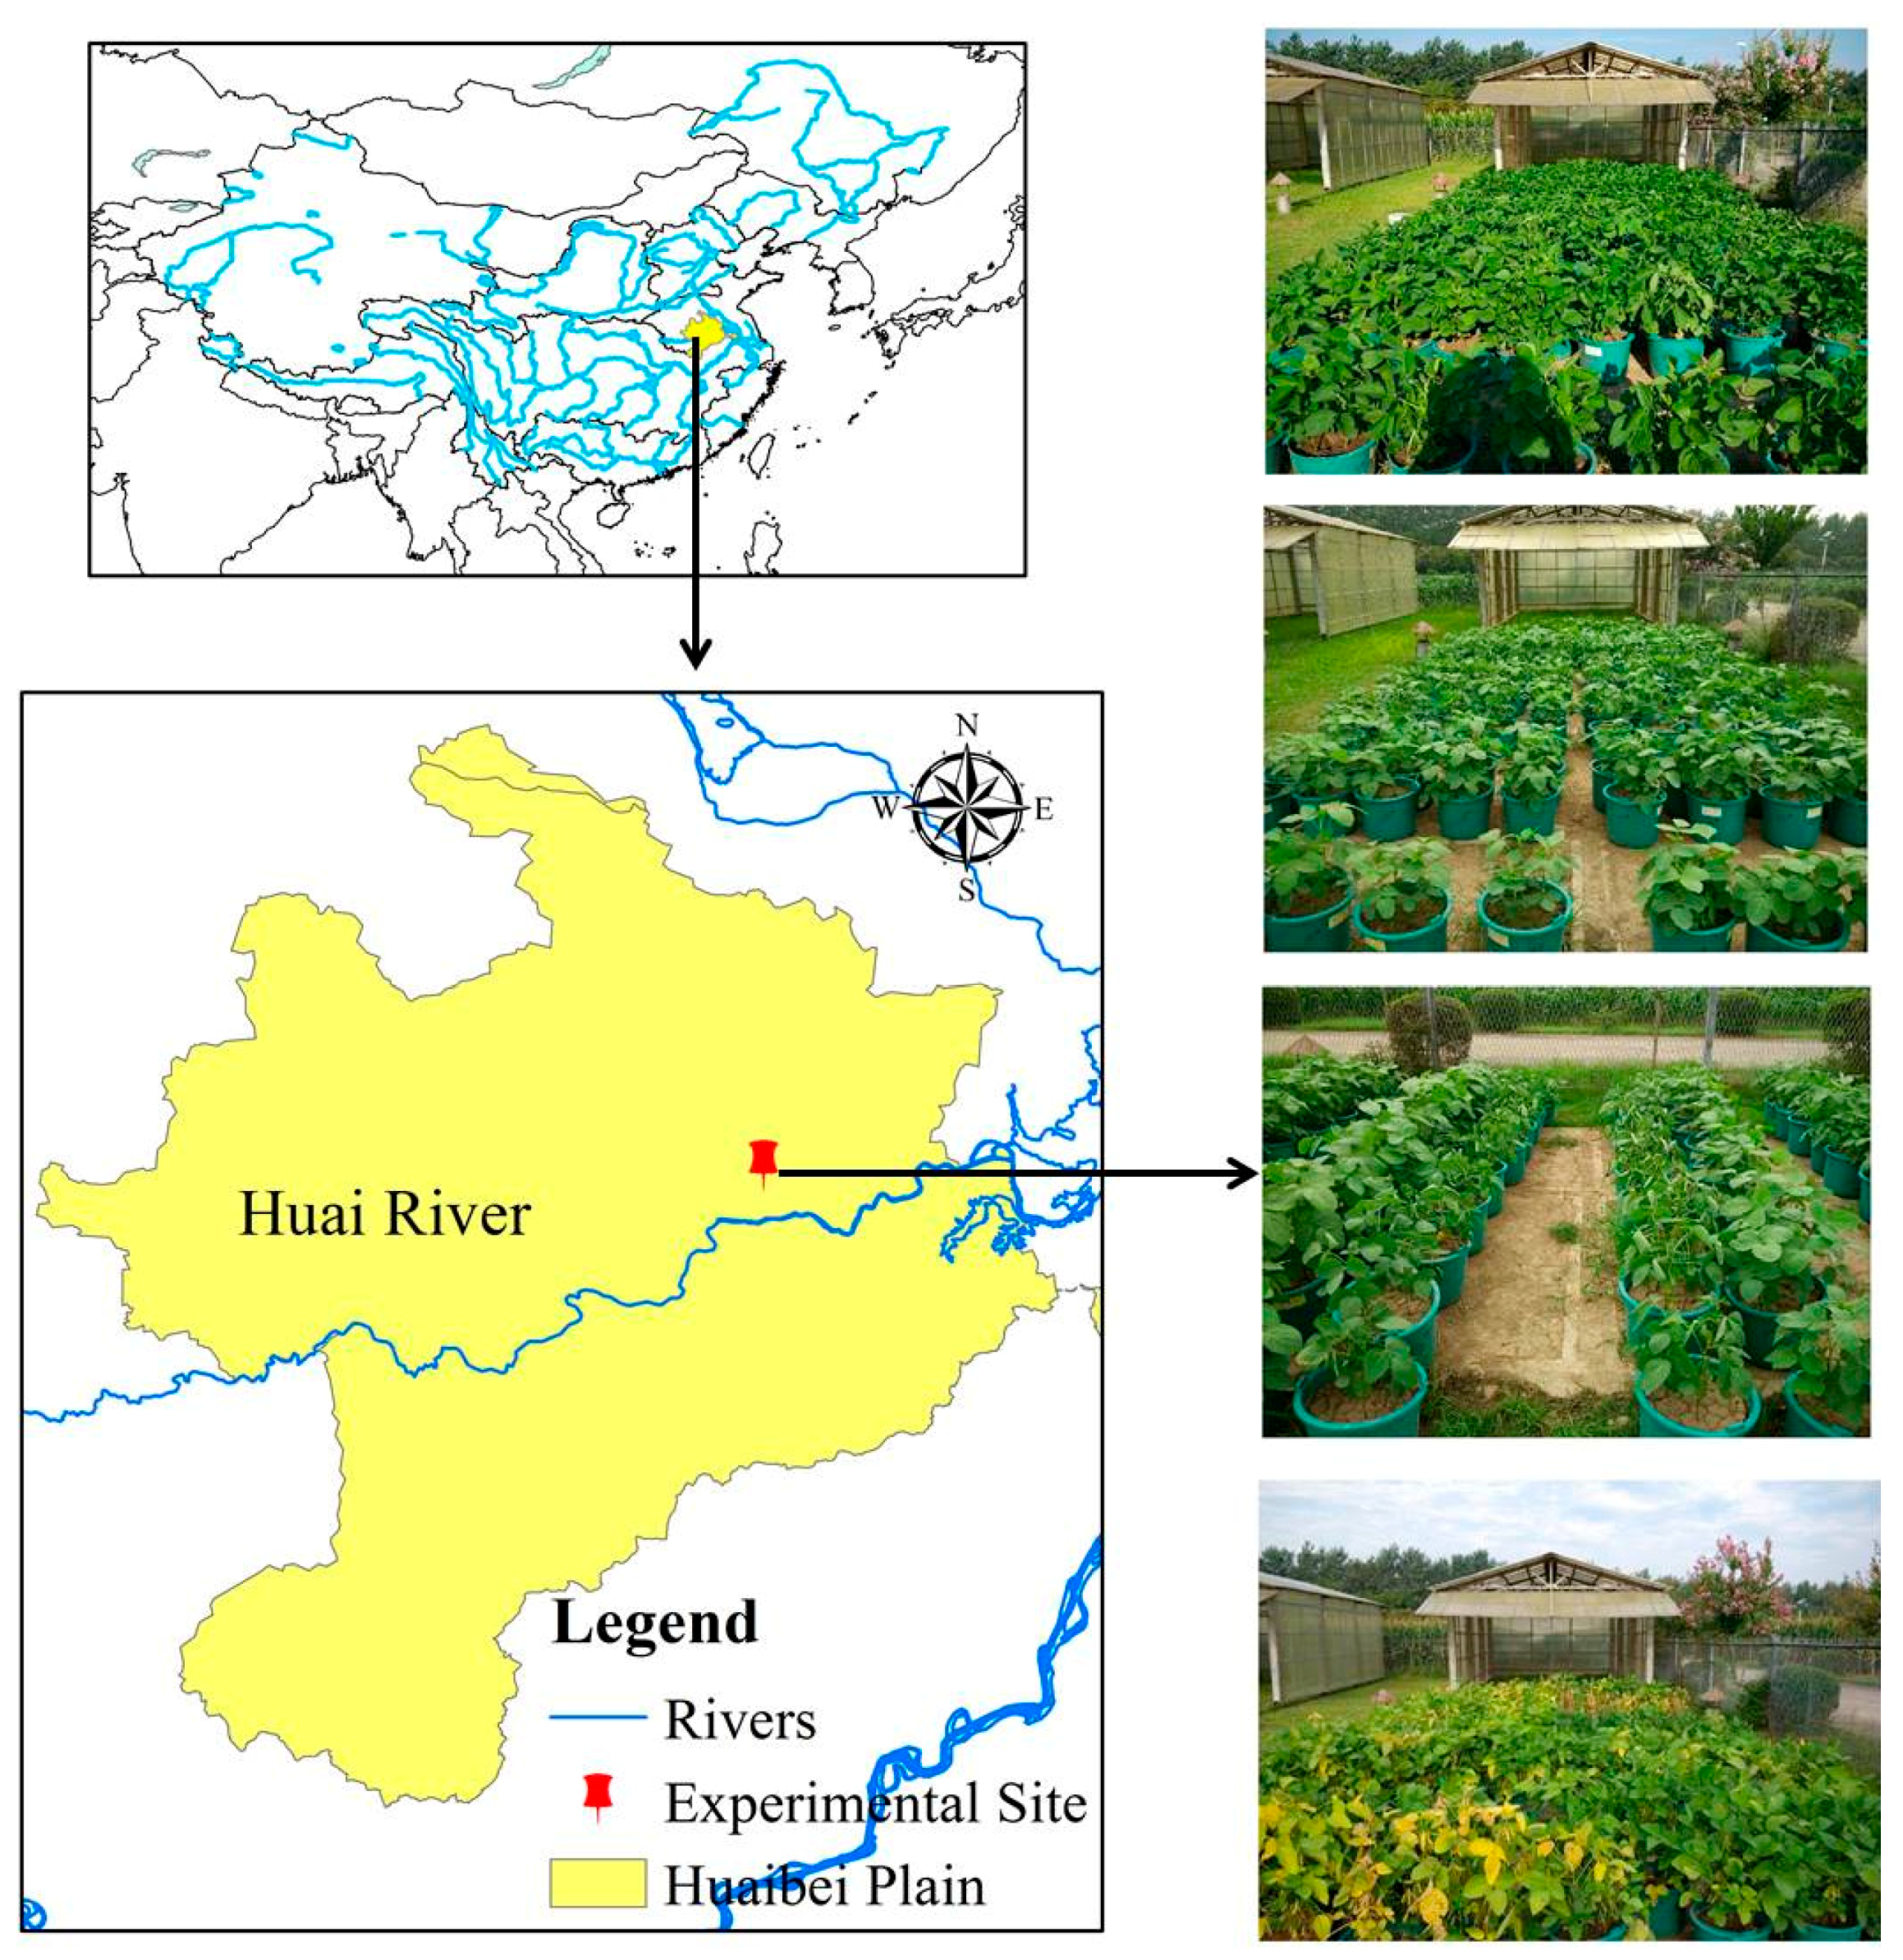
Figure 2.
Daily meteorological elements at the station during the experimental periods of soybean in (a) 2015 season and (b) 2016 season.
Figure 2.
Daily meteorological elements at the station during the experimental periods of soybean in (a) 2015 season and (b) 2016 season.

Figure 3.
Daily soil water content of soybean pot during four growth stages under different treatments (T1–T8 and CK) in (a) the 2015 season and (b) the 2016 season. The constant horizontal dashed lines from top to bottom indicate the lower limits of no drought stress, mild drought stress, and severe drought stress, respectively. Stage I: seedling stage, Stage II: branching stage, Stage III: flowering-podding stage, Stage IV: seed filling stage. Volume water content (cm3 × cm−3) was converted from weight water content (g × g−1) according to the density of water.
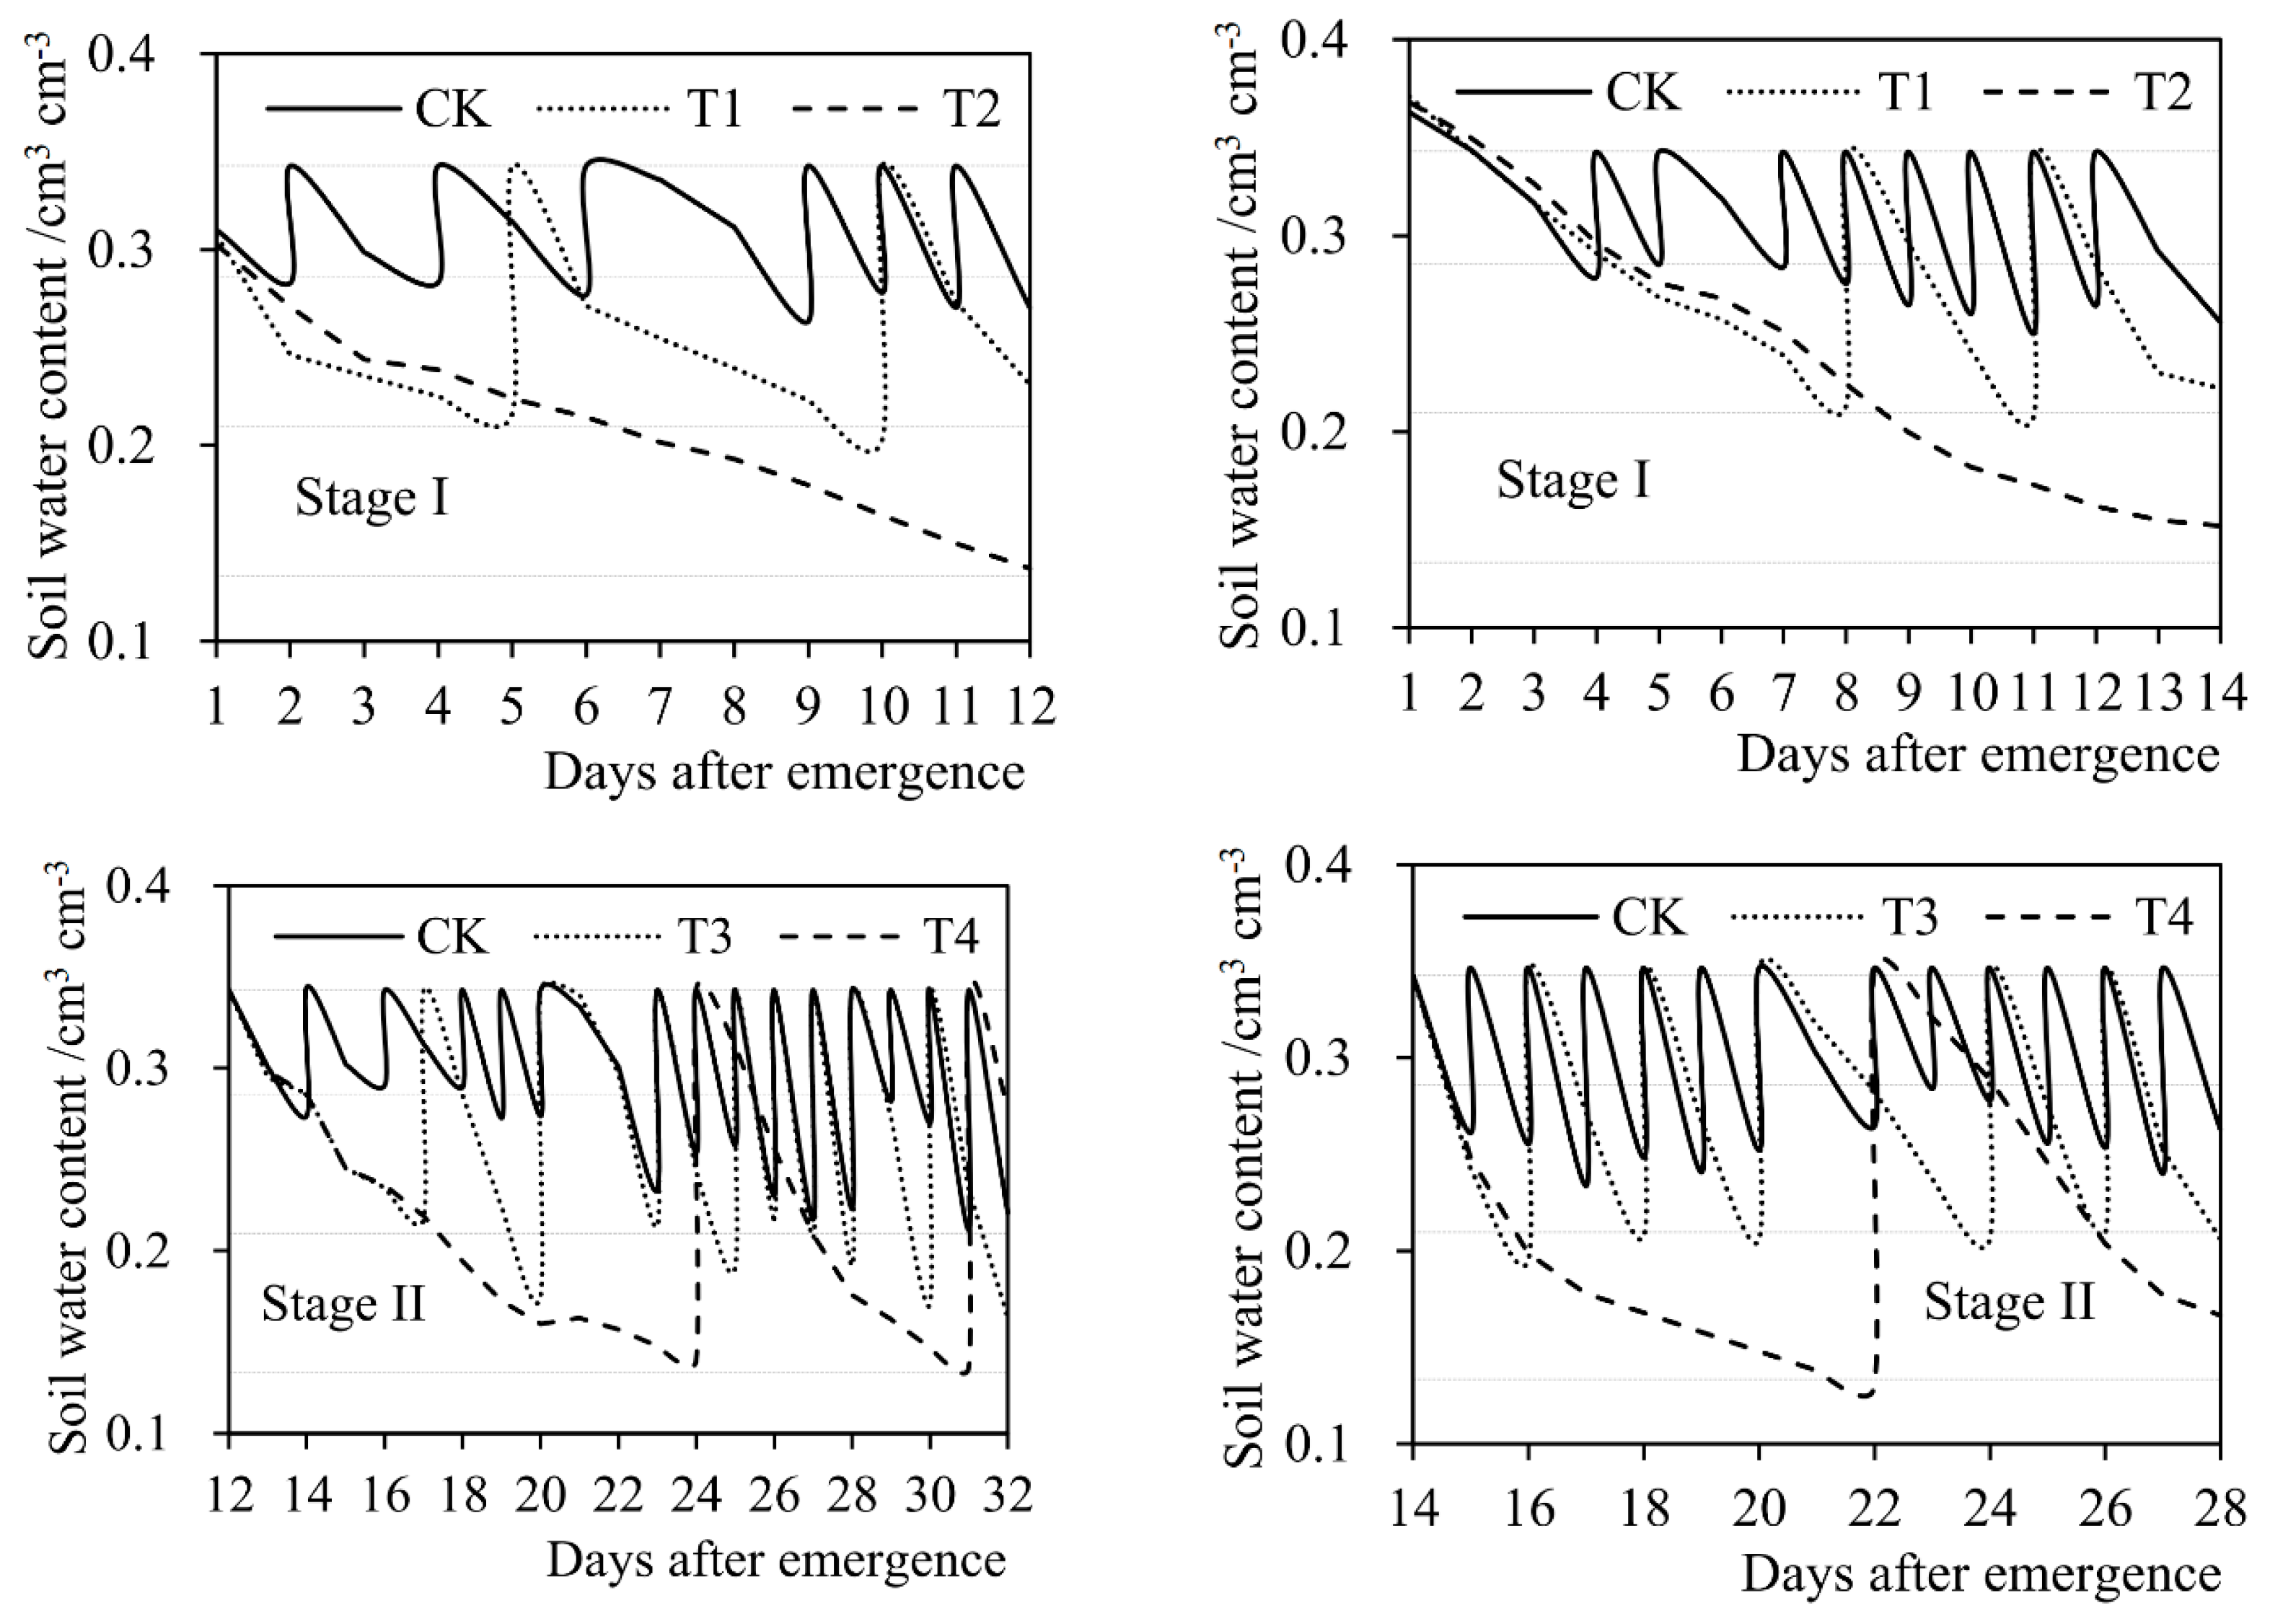

Figure 4.
The decreased percentages of soybean evapotranspiration (ET) during each growth stage caused by drought stress at (a) Stage I, (b) Stage II, and (c) Stage III, respectively, compared with full irrigation in 2015 and 2016 seasons. Stage I: seedling stage, Stage II: branching stage, Stage III: flowering-podding stage, Stage IV: seed filling stage. T1–T6: experimental treatments.

Figure 5.
Aboveground biomass accumulation process of soybean plants at each growth stage under different treatments (T1–T8 and CK) in (a) 2015 season and (b) 2016 season. Stage I: seedling stage, Stage II: branching stage, Stage III: flowering-podding stage, Stage IV: seed-filling stage.
Figure 5.
Aboveground biomass accumulation process of soybean plants at each growth stage under different treatments (T1–T8 and CK) in (a) 2015 season and (b) 2016 season. Stage I: seedling stage, Stage II: branching stage, Stage III: flowering-podding stage, Stage IV: seed-filling stage.
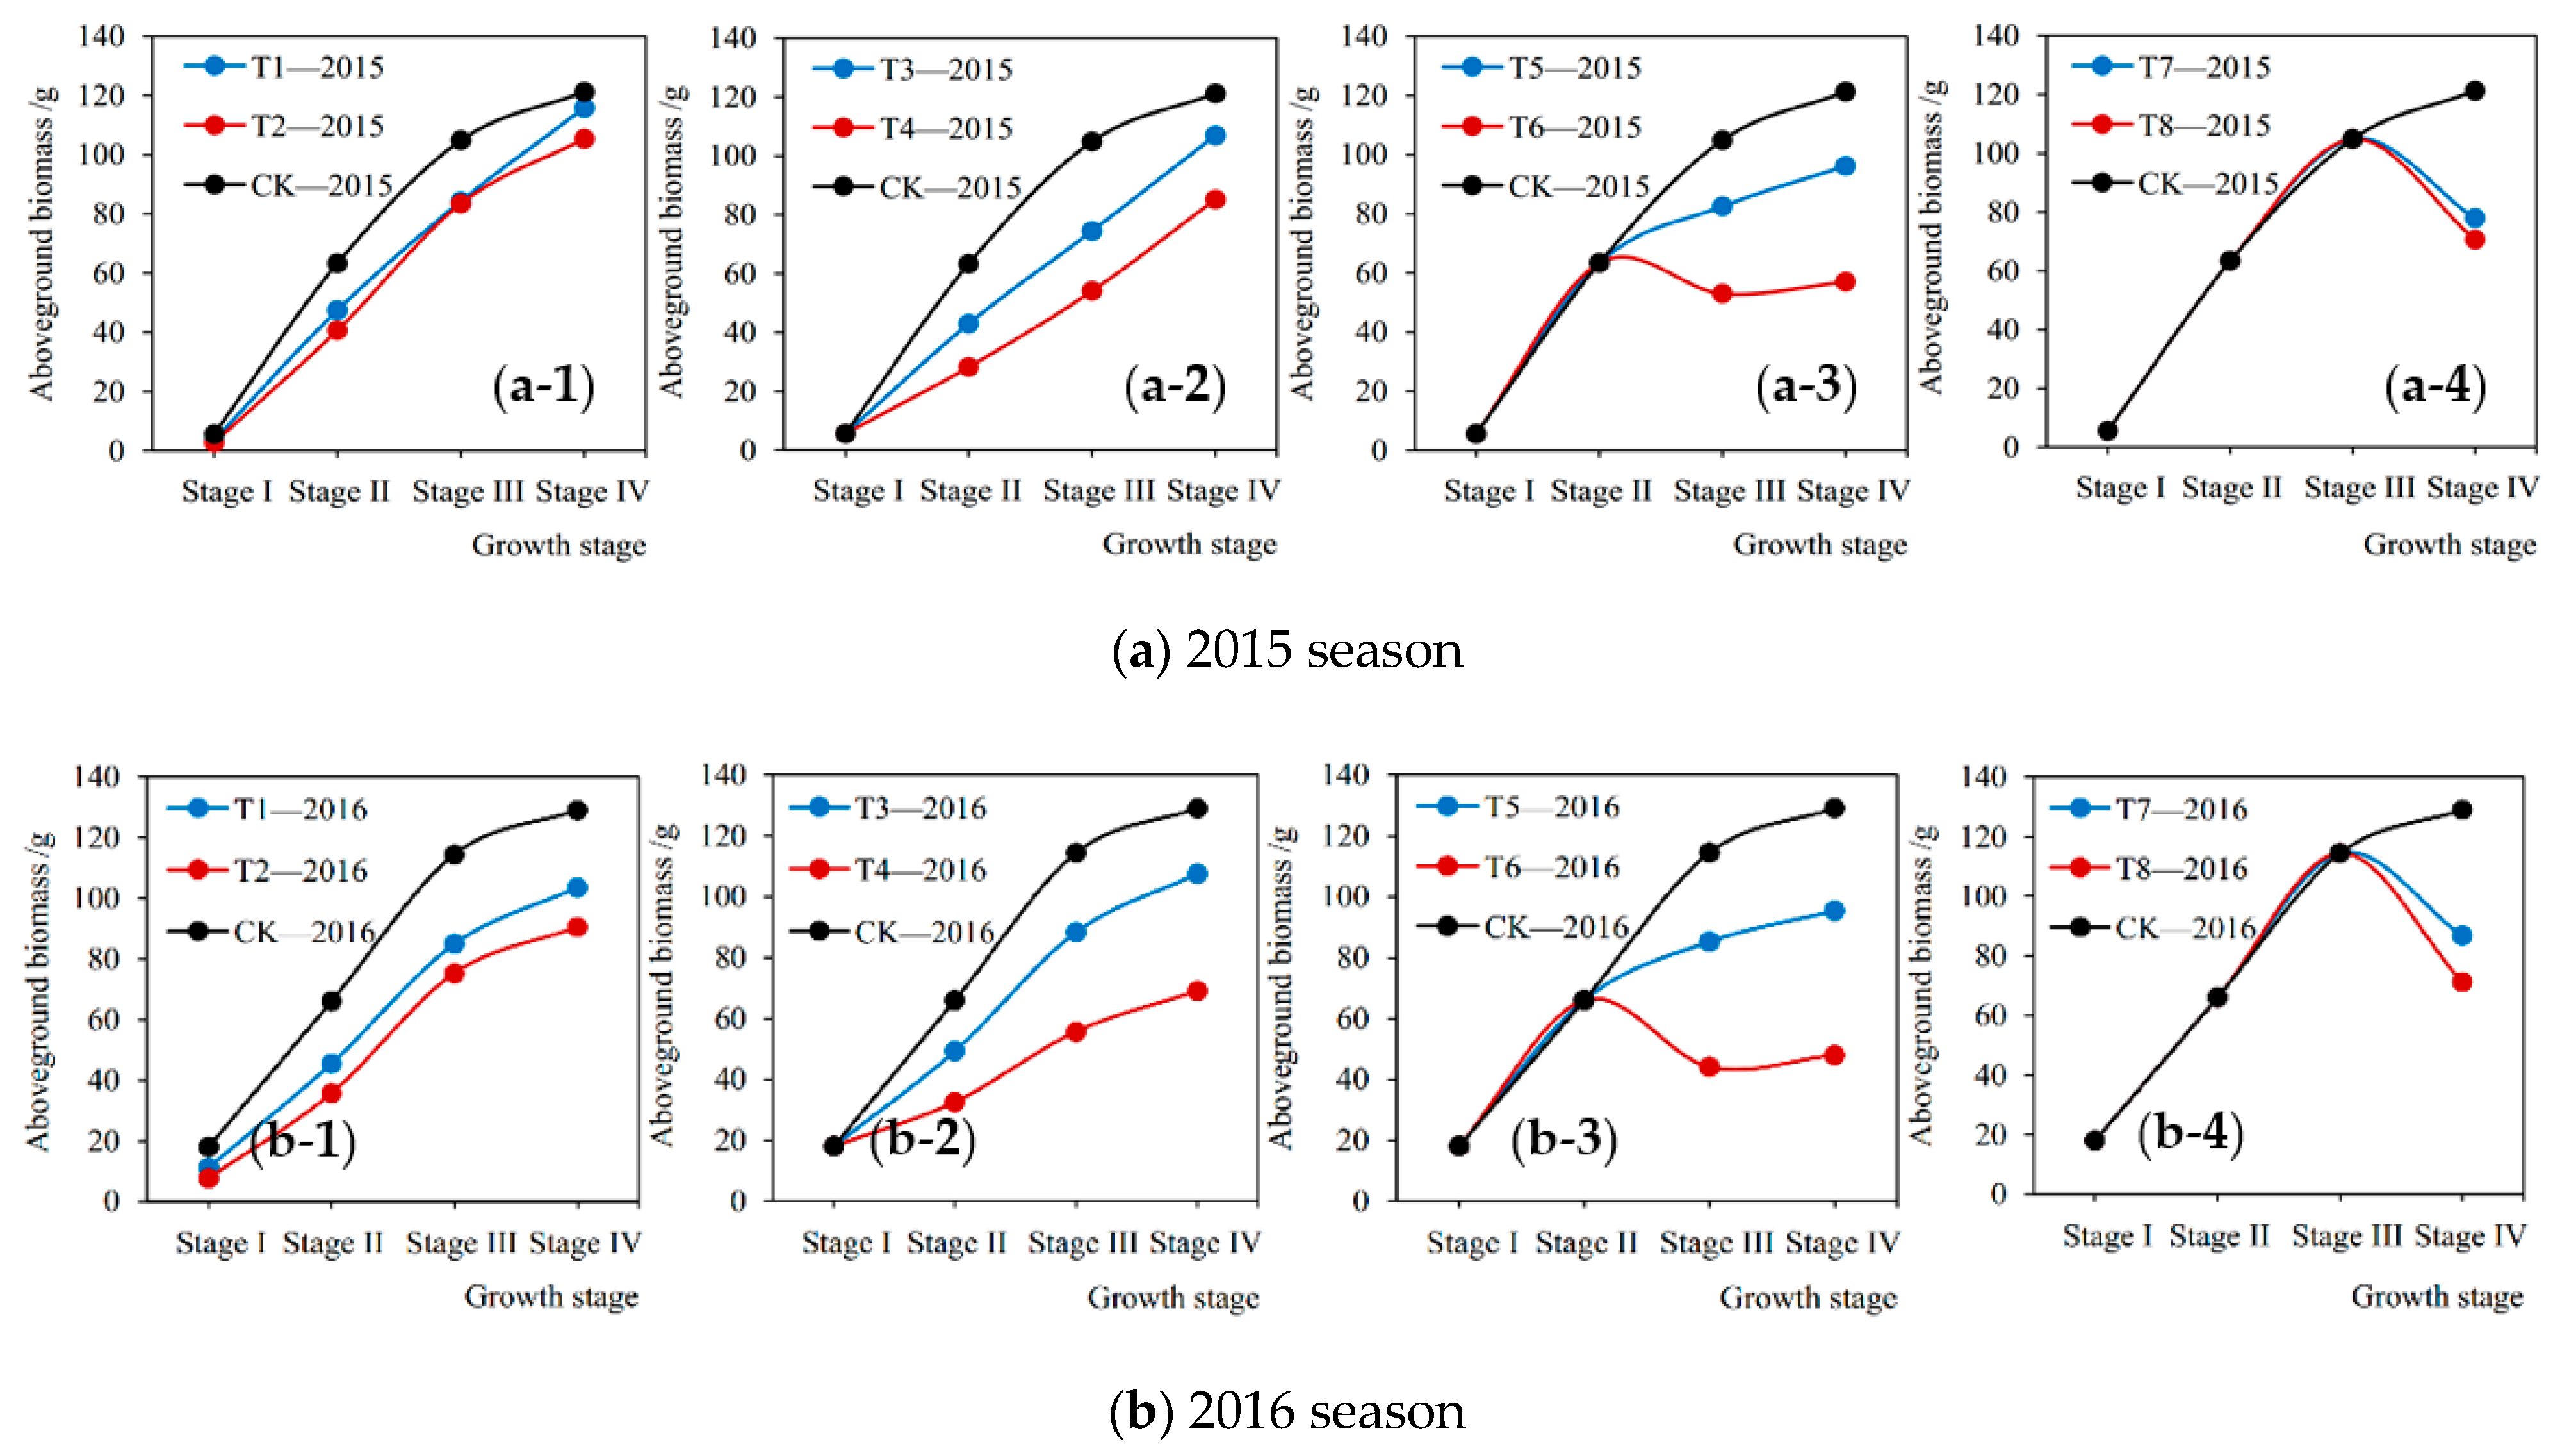
Figure 6.
The decreased percentages of soybean aboveground biomass accumulation (ABa) during each growth stage caused by drought stress at (a) Stage I, (b) Stage II, and (c) Stage III, respectively, compared with sufficient irrigation in the 2015 and 2016 seasons. Stage I: seedling stage, Stage II: branching stage, Stage III: flowering-podding stage, Stage IV: seed filling stage. T1–T6: experimental treatments.

Table 1.
Characteristics of the experimental soil at the upper layer (0–50 cm).
| Soil Characteristics | Values |
|---|---|
| Sand (%) | 3.45 |
| Silt (%) | 70.52 |
| Clay (%) | 26.03 |
| pH (in water solution) | 7.5 |
| Organic matter (%) | 0.85 |
| Bulk density (g/cm3) | 1.36 |
| Field capacity at −0.03 MPa (cm3/cm3) | 0.38 |
| Wilting point at −1.5 MPa (cm3/cm3) | 0.12 |
Table 2.
Divisions of the whole soybean growth periods in 2015 and 2016 seasons.
| Description of Growth Stage | 2015 Season | 2016 Season |
|---|---|---|
| germination stage, from sowing to seed germination | 20 June to 3 July, 14 days | 29 June to 14 July, 16 days |
| seedling stage (Stage I), from seed germination to plants with four fully expanded leaves | 4 July to 14 July, 11 days | 15 July to 27 July, 13 days |
| branching stage (Stage II), from plants with four fully expanded leaves to first flower appearance | 15 July to 3 August, 20 days | 28 July to 10 August, 14 days |
| flowering-podding stage (Stage III), from first flower appearance to the beginning of pod filling | 4 August to 20 August, 17 days | 11 August to 31 August, 21 days |
| seed filling stage (Stage IV), from the beginning of pod filling to plant maturation | 21 August to 20 September, 31 days | 1 September to 27 September, 27 days |
Table 3.
Percentage of lower limits of soil water content relative to field capacity at each soybean growth stage for different experimental treatments in 2015 and 2016 seasons.
Table 3.
Percentage of lower limits of soil water content relative to field capacity at each soybean growth stage for different experimental treatments in 2015 and 2016 seasons.
| Cropping Season | Treatment | Seedling Stage (Stage I) | Branching Stage (Stage II) | Flowering-Podding Stage (Stage III) | Seed Filling Stage (Stage IV) |
|---|---|---|---|---|---|
| 2015 and 2016 | T1 | 55% | 75% | 75% | 75% |
| T2 | 35% | 75% | 75% | 75% | |
| T3 | 75% | 55% | 75% | 75% | |
| T4 | 75% | 35% | 75% | 75% | |
| T5 | 75% | 75% | 55% | 75% | |
| T6 | 75% | 75% | 35% | 75% | |
| T7 | 75% | 75% | 75% | 55% | |
| T8 | 75% | 75% | 75% | 35% | |
| CK | 75% | 75% | 75% | 75% |
Table 4.
Irrigation amount (IA) and irrigation times (IT) at each growth stage of soybean under different treatments in 2015 and 2016 seasons.
Table 4.
Irrigation amount (IA) and irrigation times (IT) at each growth stage of soybean under different treatments in 2015 and 2016 seasons.
| Cropping Season | Treatment | Seedling Stage (Stage I) | Branching Stage (Stage II) | Flowering-Podding Stage (Stage III) | Seed Filling Stage (Stage IV) | ||||
|---|---|---|---|---|---|---|---|---|---|
| IA (mm) | IT | IA (mm) | IT | IA (mm) | IT | IA (mm) | IT | ||
| 2015 | T1 | 44.20 | 2 | 209.61 | 11 | 217.84 | 13 | 430.16 | 26 |
| T2 | 0 | 0 | 240.83 | 13 | 245.35 | 15 | 446.85 | 26 | |
| T3 | 69.87 | 6 | 157.17 | 9 | 225.26 | 11 | 436.33 | 26 | |
| T4 | 65.46 | 5 | 63.40 | 3 | 185.23 | 9 | 424.80 | 28 | |
| T5 | 63.77 | 6 | 235.32 | 14 | 157.61 | 8 | 385.67 | 26 | |
| T6 | 66.78 | 6 | 239.88 | 15 | 84.49 | 3 | 206.45 | 13 | |
| T7 | 60.69 | 6 | 231.94 | 14 | 248.40 | 15 | 281.63 | 12 | |
| T8 | 65.90 | 6 | 246.05 | 15 | 248.40 | 14 | 46.00 | 2 | |
| CK | 71.93 | 6 | 261.84 | 15 | 277.54 | 15 | 466.82 | 27 | |
| 2016 | T1 | 40.96 | 2 | 153.07 | 11 | 295.90 | 17 | 338.00 | 25 |
| T2 | 0 | 0 | 124.94 | 10 | 272.37 | 17 | 326.77 | 25 | |
| T3 | 92.65 | 8 | 135.62 | 6 | 282.53 | 17 | 330.72 | 24 | |
| T4 | 89.24 | 8 | 50.92 | 2 | 239.35 | 16 | 312.94 | 23 | |
| T5 | 82.38 | 7 | 171.86 | 11 | 205.82 | 9 | 291.43 | 23 | |
| T6 | 84.89 | 8 | 171.31 | 12 | 107.73 | 4 | 183.62 | 16 | |
| T7 | 95.02 | 8 | 164.62 | 12 | 300.91 | 17 | 176.30 | 11 | |
| T8 | 87.86 | 8 | 165.21 | 12 | 320.79 | 18 | 64.95 | 4 | |
| CK | 94.09 | 8 | 177.11 | 13 | 332.72 | 18 | 340.86 | 26 | |
Table 5.
Evapotranspiration (ET) and average daily evapotranspiration intensity (ETd) of soybean at each growth stage under different treatments in the 2015 and 2016 seasons.
Table 5.
Evapotranspiration (ET) and average daily evapotranspiration intensity (ETd) of soybean at each growth stage under different treatments in the 2015 and 2016 seasons.
| Cropping Season | Treatment | Seedling Stage (Stage I) | Branching Stage (Stage II) | Flowering-Podding Stage (Stage III) | Seed Filling Stage (Stage IV) | ||||
|---|---|---|---|---|---|---|---|---|---|
| ET (mm) | ETd (mm d−1) | ET (mm) | ETd (mm d−1) | ET (mm) | ETd (mm d−1) | ET (mm) | ETd (mm d−1) | ||
| 2015 | T1 | 50.37 | 4.58 | 233.82 | 11.69 | 237.72 | 13.98 | 434.81 | 14.03 |
| T2 | 30.06 | 2.73 | 234.79 | 11.74 | 248.50 | 14.62 | 454.86 | 14.67 | |
| T3 | 77.67 | 7.06 | 178.73 | 8.94 | 226.23 | 13.31 | 435.79 | 14.06 | |
| T4 | 70.36 | 6.40 | 82.54 | 4.13 | 196.69 | 11.57 | 435.30 | 14.04 | |
| T5 | 69.54 | 6.32 | 253.31 | 12.67 | 166.39 | 9.79 | 385.67 | 12.44 | |
| T6 | 67.43 | 6.13 | 252.50 | 12.63 | 114.23 | 6.72 | 205.78 | 6.64 | |
| T7 | 69.54 | 6.32 | 241.45 | 12.07 | 255.10 | 15.01 | 285.65 | 9.21 | |
| T8 | 73.61 | 6.69 | 257.70 | 12.89 | 251.53 | 14.80 | 71.82 | 2.32 | |
| CK Significance | 78.16 *** | 7.11 *** | 274.44 *** | 13.72 *** | 273.95 *** | 16.11 *** | 461.43 *** | 14.88 *** | |
| 2016 | T1 | 68.31 | 5.69 | 147.08 | 10.51 | 302.84 | 14.42 | 330.48 | 12.24 |
| T2 | 40.43 | 3.37 | 134.86 | 9.63 | 277.97 | 13.24 | 314.86 | 11.66 | |
| T3 | 115.50 | 9.62 | 127.67 | 9.12 | 286.67 | 13.65 | 312.32 | 11.57 | |
| T4 | 116.11 | 9.68 | 67.71 | 4.84 | 225.55 | 10.74 | 337.92 | 12.52 | |
| T5 | 113.10 | 9.43 | 157.26 | 11.23 | 207.85 | 9.90 | 277.02 | 10.26 | |
| T6 | 110.09 | 9.17 | 166.53 | 11.89 | 103.59 | 4.93 | 169.84 | 6.29 | |
| T7 | 109.47 | 9.12 | 165.68 | 11.83 | 322.55 | 15.36 | 200.89 | 7.44 | |
| T8 | 106.31 | 8.86 | 177.20 | 12.66 | 330.74 | 15.75 | 73.02 | 2.70 | |
| CK Significance | 111.55 *** | 9.30 *** | 176.66 *** | 12.62 *** | 344.74 *** | 16.42 *** | 359.03 *** | 13.30 *** | |
*** Significant at p ≤ 0.001 level.
Publisher’s Note: MDPI stays neutral with regard to jurisdictional claims in published maps and institutional affiliations. |
© 2020 by the authors. Licensee MDPI, Basel, Switzerland. This article is an open access article distributed under the terms and conditions of the Creative Commons Attribution (CC BY) license (http://creativecommons.org/licenses/by/4.0/).
Share and Cite
MDPI and ACS Style
Cui, Y.; Ning, S.; Jin, J.; Jiang, S.; Zhou, Y.; Wu, C. Quantitative Lasting Effects of Drought Stress at a Growth Stage on Soybean Evapotranspiration and Aboveground BIOMASS. Water 2021, 13, 18. https://doi.org/10.3390/w13010018
AMA Style
Cui Y, Ning S, Jin J, Jiang S, Zhou Y, Wu C. Quantitative Lasting Effects of Drought Stress at a Growth Stage on Soybean Evapotranspiration and Aboveground BIOMASS. Water. 2021; 13(1):18. https://doi.org/10.3390/w13010018
Chicago/Turabian StyleCui, Yi, Shaowei Ning, Juliang Jin, Shangming Jiang, Yuliang Zhou, and Chengguo Wu. 2021. "Quantitative Lasting Effects of Drought Stress at a Growth Stage on Soybean Evapotranspiration and Aboveground BIOMASS" Water 13, no. 1: 18. https://doi.org/10.3390/w13010018
Note that from the first issue of 2016, this journal uses article numbers instead of page numbers. See further details here.