The Role of Traditional Knowledge in Coastal Adaptation Priorities: The Pamunkey Indian Reservation


Department of Political Science and Geography, Old Dominion University, Norfolk, VA 23529, USA
*
Author to whom correspondence should be addressed.
Water 2020, 12(12), 3548; https://doi.org/10.3390/w12123548
Submission received: 24 November 2020
/
Revised: 10 December 2020
/
Accepted: 15 December 2020
/
Published: 17 December 2020
(This article belongs to the Special Issue Coastal Hazards Management)
Abstract
:Coastal reservations are increasingly vulnerable to hazards exacerbated by climate change. Resources for restoration projects are limited. Storm surge, storms, tidal flooding, and erosion endanger artifacts and limit livelihoods of tribes in coastal Virginia. GIS offers a platform to increase communication between scientists, planners, and indigenous groups. The Pamunkey Indian Tribe engaged in a participatory mapping exercise to assess the role of traditional ecological knowledge (TEK) in coastal management decision-making and its capacity to address flooding. Priorities and strategies were spatially referenced using maps of potential sea level rise for 2040, 2060, and 2080, input into a resilience matrix to identify benchmarks for each phase of disaster resilience building, and contextualized with oral histories. Results highlight increased immediacy to protect housing and heritage sites along the shoreline as well as maintain access to the Reservation. Preferences toward structural solutions guided by and facilitating TEK options were expressed. Additional community capacities, tribal council support, federal assistance, impact assessments, and coordination would facilitate risk reduction project implementation. The screening process integrates TEK with planning and is transferable to neighboring tribes.
1. Introduction
Coastal, estuarine, and intertidal flooding and consequently the risk posed to coastal populations are exacerbated by climate change and development worldwide [1,2,3,4]. Since sea hazards such as storm surge and sea level rise (SLR) are not evenly distributed [5,6], interactions with and development of appropriate high resolution spatiotemporal modeling is needed to prepare coastal residents by identifying which hazards will have the most impact and how they may be more extreme (e.g., duration, frequency). Although models account for physical scaling and some compounding hazards, such as tides, through numeric modeling of formation, frequency, and intensity [7,8], the distribution of monitoring equipment (e.g., tide gauges and satellite altimeters) is uneven, making local analysis more exact than regional or global models [7,9]. The inclusion of subsidence in relative SLR calculations also continues to present challenges [7,8]. Additional monitoring of storm-surge-prone areas is needed to account for climate change in historic trends and future projections [9].
Effective defenses against flooding include both structural (i.e., sea walls, flood gates, break waters) and natural (i.e., living shorelines, marshes expansion, dune renourishment) measures [2]. Structural ‘grey’ solutions redistribute water flow and usually utilize less area than natural solutions but require maintenance to combat the effects of weathering and ensure long-term protection [10,11,12]. Natural, otherwise known as ‘green,’ ‘blue-green,’ or ‘blue,’ solutions, restore and expand ecosystem function to complement the original morphology and reduce hazard impacts [1,13,14]. Additional benefits of natural solutions include improved water quality and fishery production as the vegetation takes hold [15]. Both types of measures can be used together and may require a gradual approach to reach maximum benefit [1,2].
Coastal communities have limited resources to address hazards and climate change is weakening their economies due to proximity to and dependence upon the sea [1,3,16]. Community engagement with natural scientists and emergency management increases capacity to proactively anticipate, reduce damages from, and cope with flooding [10,17]. An understanding of the risk perceptions and tolerance of the implementing community is needed to assess the feasibility of adaptation or mitigation options [2,10,16]. Sustained stakeholder consultation and participation should guide priority setting, scenario evaluation, solution design, and resource allocation [16,18,19,20,21]. Further, societal and ecosystem valuations should be conducted and periodically reviewed and realigned for the range of hazards present [16,18,22].
Indigenous communities across the world are especially vulnerable to climate change because of their locations, traditional livelihoods, and histories of colonization [23]. Traditional Ecological Knowledge (TEK) is the generational and cultural transmission of human and environmental adaptations. Key characteristics of TEK include biodiversity and ecosystem services conservation, mobility, and sharing resources [24]. Traditional resource-driven livelihoods, such as those of the Inuit and Australian Aborigines, are flexible, avoid hazards, and prepare for emergencies [23,25]. Consequently, TEK guided adaptation processes are incremental and balances flood management, ecological conservation, and resource needs through production and landscape management [26].
Gomez-Baggenthum et al.’s [24] comparative study of TEK across multiple continents shows hybridization with new technologies as economies and lifestyles modernize. The direct contributors to and immediate impacts of local climate change, such as pollution and erosion, are still readily identified by TEK and align with scientific data collected with instruments [24,25]. Therefore, traditional language, reference points, and values can serve as indicators of culturally appropriate mitigation and adaptation strategies [27].
Although TEK’s utility in restoration planning is growing in recognition, it is underutilized because qualitative data are not compatible with environmental modeling [28]. For example, the United States National Park Service holds that indigenous cultures are valid and conservation efforts should hold them central to prioritizing significant landscapes [29]. TEK can inform the elements and locations of flood management projects on tribal reservations and along connected shorelines [28]. Native groups both shaped and were influenced by local environments [29]. By integrating TEK into planning decisions, cultural and socio-economic assets can be prioritized for preservation and relocation.
Bethel et al. [28] used georeferenced TEK and land cover change maps to assess the impact of ecosystem degradation on community viability with indigenous coastal populations in Louisiana where the most dramatic marsh loss in the United States is occurring. A vulnerability mapping system linked remote sensing imagery with ecosystem dependent livelihoods [28]. Applying the Sci-TEK logic modeling process to these results shows that shoreline protection, island formation, freshwater input, and marsh creation are the environmental themes of concern to TEK holders, which is different from the those listed in the literature [30]. Participants identified marsh fragmentation and vegetation health as important indicators for ecosystem function. Protection priorities included burial grounds, homes, and the whole area as important because the ecosystem functions as a whole to reduce storm impacts upon these important cultural features. The prioritized locations and features were associated with their TEK attributes through coding stakeholder transcripts collected on participant guided boat tours of the marsh [28]. Existing policies and programs were considered by the TEK holders to be insufficient because they did not consider their recommendations. These processes should be conducted in advance of or coincident with planning efforts not after to improve effectiveness [30]. TEK associated with future SLR horizons has yet to be digitized into spatial data.
The Pamunkey Indian Reservation is located on a peninsula in King William County, Virginia, along the Pamunkey River, a tributary to the York River that empties into to the Chesapeake Bay (Figure 1). Two other tribes, the Upper Mattaponi and Mattaponi are also part of the York River drainage area. The Pamunkey Reservation is 0–4.8 m (16 feet) in elevation relief [31] (p. 5). The riverine shoreline of the Reservation is 21 km long (~13 miles) [31] (p. 8) and situated at the upper end of tidal influence of the Chesapeake Bay. Approximately 90 residents occupy approximately 30 residences on the 445ha (1100 acres) that make up the current Reservation, which is reduced from its original size, but up to 600 visit annually [31] (p. 2). Diaspora populations are present in Philadelphia, PA and Richmond, VA [29]. Although the county falls within the Middle Peninsula Planning District (MPPD) regional government, there are no specific guidelines for the Pamunkey Indian Tribe in the MPPD’s All Hazards Mitigation Plan. This plan notes that there fish hatcheries on the Pamunkey and Mattaponi reservations that are important for species propagation but only provides goals and objectives for the county [32]. The Pamunkey Tribe receives support from Virginia Department of Game and Inland Fisheries and Virginia Marine Resources Commission to support the hatchery [29]. The shoreline and tributary creeks are excellent spawning and nursery habitat for herring, shad, and bass. The coastal vegetation ranges from brackish and tidal marshes to forested swamp. The typical tidal range is 0.85 m (2.8 feet) mean low water (MLW) but reaches 2.5 m (8.2 feet) during storm surge events [31] (p. 6). The river is 9–12 m (30–40 feet) deep in front of the Reservation. The depth provides passage for sturgeon, which are now endangered and the subject of a three-year National Oceanic and Atmospheric Administration (NOAA) Species Recovery Grant held by the Pamunkey to water quality and track populations that started in 2018 [31] (p. 6).
The tributaries of the York River have already experienced extensive changes from water resource development. In particular, the Lake Ana Dam restricted the culturally relevant livelihood practices of the tribes, such as fishing and pottery making on which they subsisted in the late 1800s and early 1900s, as well as hunting, trapping, and foraging [33] (Figure 2). Conservation interests of tribes throughout the York River drainage area identified through driving tours and meetings and mapped by Strickland et al. [29] include ceremonial, ancestral, viewshed, and ecologically or archaeologically significant areas. As 3 of at least 39 tribes originally documented in the area by John Smith in 1608, the full range of artifacts, burial locations, and heritage sites remains unclear. For example, archaeological research has only partially surveyed and excavated the Pamunkey Indian Reservation [29].
The Pamunkey India Tribe is recognized by the state and federal government making it eligible for financial and technical assistance for development and mitigation planning. For example, consultation with the United States Army Corps of Engineers (USACOE), although not designated as a federally recognized tribe at the time, blocked the Newport News King William Reservoir from being built 4.8 km (3 miles) upstream [29].
Without proactive shoreline management, cultural assets will be lost, socio-economic opportunities limited, and vulnerability to hazards increased on Virginia’s coast [34]. Future SLR has negative implications for the area, including shoreline loss from sustained and more frequent high water levels coupled with increased precipitation from storms including hurricanes in the Chesapeake Bay area [35]. Much of the Reservation would be submerged with 0.6 m (2 feet) of relative SLR [36]. SLR is 4.76 mm per year as measured by the nearest gauge at Yorktown and the rate of subsidence is 3.2 mm per year [31] (p. 7). The marshland offshore is disappearing at a rate of 0.3–1.5 m per year (1–5 feet per year) while erosion along the shoreline was 0–0.3 m/year (0–1 feet). The railroad was the exception, in part due to its embankment. The railroad was a critical component of travel and trade for the Reservation prior to its sale to Norfolk Southern and subsequent use for material transportation. The nearby station linked the Reservation to Richmond and fostered eight work, religious, and other sites in Lester Manor and Old Town that remain culturally significant [29].
The Governor of Virginia’s Executive Order No. 24 requires a Coastal Resilience Master Plan [37]. Maps of SLR and recurrent flooding developed by the Commonwealth Center for Recurrent Flooding Resiliency [38] for the Plan show that the Middle Peninsula, a rural area, is among the most severely and disproportionately affected. The low elevations in southeast portions of the MPPD have a high water-tables limiting drainage and increasing susceptibility to flooding and storms. Water infrastructure exacerbates the issue by over drawing ground water [32]. Climate sensitive coastal hazards include tidal flooding, storm surge, salt intrusion, and rainfall compounded by SLR [39]. Tidal areas, such as the Albemarle Sound and Chowan River have increasing algal blooms [40]. Minor tidal flooding, also known as ‘nuisance’ flooding, is expected to worsen with wetlands, septic systems, wells, and roadways experiencing increased damage from salinity associated with more frequent and longer duration inundation [41,42]. Buildings at or below the tidelines are expected require relocation or demolition [38]. The MPPD coordinates efforts with Virginia Department of Emergency Management (VDEM) and Federal Emergency Management Agency (FEMA), both of which are also available to the Pamunkey. Specifically, the Commonwealth’s Hazards Mitigation Program and federal Disaster Mitigation Act, Hazard Mitigation Assistance, Pre-Disaster Mitigation Program, Hazard Mitigation Grant Program, Community Rating System, and National Flood Insurance Program could be applicable to both the Pamunkey and MPPD [43]. Further, the Reservation is a National Historic Landmark with several buildings on the National Register of Historic Places, which may facilitate protective measures [29]. SLR modeling should be combined with detailed asset inventories to identify risk and potential costs of resilience building measures [38].
Although a plethora of organizations address Chesapeake Bay conservation, the priorities are driven by primarily ecological characteristics. Small projects like those pertinent to the Reservation need to be tailored to socio-economic and cultural priorities. A National Fish and Wildlife Federation (NFWF) erosion evaluation [31] based on environmental data prioritized, permitted, and installed living shoreline at two locations to protect against coastal hazards and mitigate SLR through habitat restoration: i) The boat ramp and ii) the fish hatchery and associated buildings including fishing huts and residences on the shoreline. Other inhabited areas and eroding uplands received management recommendations, such as living shoreline extension in unprotected areas and marsh extension in front of the bulkhead, but other areas were advised to do nothing. Plans can be but were not modified to preserve clay soils for pottery making through revetment or distance. The full implementation of these natural solutions would create 0.5ha (57,700 sq. feet) and enhance 0.02ha (20,000 sq. feet) of marsh. The combined project costs are US$1,005,000. Consequently, the project remains partially complete [31] (p. 16).
Geographic visualizations facilitate the integration of SLR projections into project planning. In a study of two coastal communities, Charleston, SC and Morehead, NC, Allen et al. [39] determined that pairing maps of SLR influenced coastal flooding with the resilience matrix provides unique insights, a better introduction, and faster interaction than the specific judgements and consensus perceived to be required by participants to evaluate maps or a specific hazard scenario exclusively. This is especially pertinent to TEK holders, who are unlikely to make judgements outside their knowledge base [30]. The resilience matrix originated to support the potentially conflicting goals of reducing housing and habitat recovery timelines in Jamaica Bay after Hurricane Sandy [44]. The recommendations for protections on the Atlantic side intended to protect both human and ecological systems from future storms would have limited effect without complementary protections on the Bay side but were perceived to be in competition with each other for financing and implementation time slots. The matrix facilitated joint planning efforts to achieve mutual environmental and socio-economic improvements on an accelerated timeline [44]. This process is in alignment with other planning processes, such as that of the MPPD, which includes hazard mitigation goals linking loss prevention with community and emergency services capacity, education, and coordination with other planning entities [43].
This study uses a participatory mapping process to assesses the role of TEK in sustaining the relationship of the Pamunkey Indian Tribe with the Pamunkey River. We seek to address two research questions:
- How does TEK factor into past or future flood management decisions?
- How do GIS visualizations of SLR influence flood management priorities?
Through temporal and spatial analysis of shoreline use and tribal resources, we will present TEK informed strategies to address long-term SLR and short-term coastal hazards. We will also propose a research agenda to establish a framework for integrating TEK into planning for tribes here and elsewhere.
2. Methods
This study integrates concise Sci-Tek and Resilience Matrix techniques to engage the Pamunkey Indian Tribe in a coastal management priority setting exercise. Working within the boundary of the Reservation, participants delineated coastal threats by recounting hazard and socio-economic experiences and viewing maps of projected SLR over the next 60 years. Participants identified critical features for protection in an interactive web app and indicators of progress in the resilience matrix.
The Sci-TEK process [30] records participant explanations and GPS coordinates of priority locations for protection while touring marshes on a participant set route. The TEK is then combined with environmental data, such as turbidity, nutrient levels, marsh fragmentation and loss, and existing protective structures, by digitizing data collected on the tour and drawn by the participant or on their behalf on maps of land cover change. Drawings are linked with verbal explanations of logic behind the choices and preferred protective solution(s). From this, a logic model including weighting can be derived delineating suitable locations for various restoration projects. Suitable locations can be compared to existing plans or areas identified through other means for future plans to explore and potentially reconcile variances [30].
This study uses the Coastal Virginia Sea Level with Minor and Moderate Flooding maps for SLR showing NOAA’s Intermediate-High Scenarios for 2040, 2060, and 2080, which reflect common planning metrics and timelines for the nearby Hampton Roads Coastal Resilience Working Group [38]. Compound flooding involving SLR coupled with increased extreme precipitation [45]. ‘King’ tides, limited drainage, and indirect impacts, such as fish passage limitations and stormwater runoff, are beyond the scope of the maps utilized for this study, which account for elevation but are not hydro-corrected [46]. However, these maps are relevant screening level tools for planning [38].
The resilience matrix [44] is a 4 × 4 matrix designed as a screening and decision-making tool to guide further action, facilitate conversations between governments and residents, and foster partnerships between agencies. Stakeholder informed metrics are produced at the stages of disaster resilience: Prepare, absorb, recover, and adapt. This tool is intended to prioritize investments and collaborations for systems with strong social components that require trade-offs to achieve resilience, especially those without a single management authority that defines its optimal function. It is also useful when risk reduction measures are voluntary, outside policy requirements, or culturally unpopular. Resources are categorized into four domains from the United States Army’s Network-Centric Warfare Doctrine: Physical, information, cognitive, and social. These reflect interdependencies between social, technological, and ecological systems and offer a broader perspective than resilience characteristics or system categories would. By identifying which resources apply to each phase of disaster resilience community specific thresholds can be set and indicators identified across the full range of need. Resultant benchmarks are internal not relative to the performance of neighboring communities or larger-scale state or national performance for which no definitive external validation method is currently accepted. Associated projects are acceptable to the local community. Strategies that conflict can be identified and reassessed to determine the highest cost/benefit for the desired timeframe and outcome [44].
2.1. Coastal Adaptation Survey
From July to September 2020, researchers at Old Dominion University (ODU) conducted a survey of tribal members with TEK of the Pamunkey River and Reservation. The ODU Arts and Letters Human Subjects Committee declared the study exempt research (Project #1420168-2). A representative of the Pamunkey Indian Tribal Resource Center known to ODU through the Hampton Roads Adaptation Forum, a quarterly stakeholder meeting focused on sharing coastal management strategies, acted as liaison between the researchers and the Pamunkey and received compensation as a consultant. The liaison’s role was as follows: (i) Assist in development of the survey questions to ensure language, examples, and reference points were appropriate, (ii) identify participants, (iii) distribute the surveys in hard copy with optional web links, (iv) collect survey responses, (v) disseminate participant compensation, and (vi) verify coding and interpretation of the responses. Eleven TEK holders with histories of extensive river interaction were identified for the sample. Nine of those individuals participated, constituting a representative sample.
Although best practices for research with indigenous populations include long-term relationships and multiple visits, the methods for this study were adapted and condensed due to social distancing requirements associated with COVID-19, research restrictions at ODU, and access restrictions on the Reservation limiting entry to tribal members. The researchers met with the liaison for a driving tour of the Reservation and to review data from related projects prior to lockdown but were unable to convene participants. By working through the liaison, trust was already established with the participants and familiarity with locations was ensured. Further, the liaison was familiar with the mapping and surveying techniques from participation in previous studies of the Reservation i.e., [29,31].
The survey included four parts: History collection, SLR visualization interaction, assessment of the visualizations, and management resources and strategy identification. Part 1 assessed the relationship between the Pamunkey Tribe and the Pamunkey River and management measures from current and past generations, as well as perceived urgency in addressing existing flooding on the Reservation and relevance of TEK in management. Part 2 included a map for SLR in 2040, 2060, and 2080 and sample priority markings of the boat ramp and fishing huts from [31]. The small size of the map 28 × 43 cm (11 × 17 inches) may have altered participant perceptions of scale and distance. Part 3 identified influence upon perceived risk, timelines for action, and the role of TEK in management. Part 4 assessed what resources were available and at when they might be useful. Participants completed the resilience matrix [39,44] by filling in cells with resources needed for the combined SLR influenced hazards identified in Part 1 of the survey.
Responses were input into Qualtrics and a web app either by the tribal liaison or researchers. Digitizing may have caused data generalization. Parts 1 and 3 were qualitatively analyzed. Part 2 was used to spatially ground the evaluation. Parts 3 and 4 were manually coded based on the uses identified by [29] or the resilient components from [44], respectively, and qualitatively analyzed to identify management priorities and resources. Quotes were included to illustrate themes throughout the survey. The tiered representation of SLR over the next 60 years allowed for gradational assessment that complemented the systemic approach of the matrix. The matrix can be scored based on the capacity of a given cell, row, column, or matrix to perform accordingly at the time of an emergency or analyzed to identify gaps and monitor progression. Because these are desired attributes, no score was provided, rather the output is intended to serve as an evaluation tool for use as priorities are implemented. However, upper and lower bounds of success and failure were determined from the histories collected.
2.2. Web App
The Pamunkey Coastal Adaptation Survey App, developed to aid in survey data collection, was password protected and provided instruction on how to create new features and utilize basic tools such as zooming in and out, accessing the legend, and turning on and off the various data layers (Figure 2). The objective of the application was to allow users to draw shapes (points, lines, or polygons) on or around areas of concern. The attribute table allowed participants to pair the shape entries with explanations and number them in order of their priorities. The application used Esri’s Web AppBuilder Application Programming Interface (API) as its platform. The 18 layers showed community uses, sea level rise (2040, 2060, 2080), and infrastructure. Six are from authoritative sources [47,48]. Eight are hosted by the Pamunkey [29] including residences and cemeteries that were only provided to participants through printed maps or the web app but were removed prior to data distribution to protect privacy. Four were generated for this project to delineate the study area and incorporate participant input. Data were integrated into the Coastal Adaptation Priorities story map using ArcGIS StoryMaps to visualize the research process and priorities identified geospatially and qualitatively (Supplementary Materials).
3. Results
Flood damage to the Reservation currently manifests as erosion, road blockages, lawn and crop shock, and building foundation destabilization. Flood waters restrict access to the Reservation. External sources of concern include run-off from the nearby county waste management facility and private farms from which Reservation residents receive the highest levels of pollution due to shoreline interaction and wash outs of the privately held railroad that could cause health risks in the event of a derailment. Although, responses characterizing flooding as problematic ranged from “tremendous” to “minimal,” the majority (%) of participants agreed that flooding is a “big problem.” All respondents expected increased flooding occurrences and associated damages in the future. Additional impacts, such as land loss, stranding, and forced relocation concerned all but one participant.
3.1. TEK in Past and Future Shoreline Management
Both current and past generations engaged in coastal management; however, participants debated if the intent of prior practices was for that purpose. For example, irrigation ditches installed between farms hundreds of years ago provide flood control. Further, erosion was reduced and irrigation projects maintained by more frequent hunting and trapping of beaver and muskrat by previous generations. Projects installed within the participants lifetime ranged from living shorelines, to rip rap, to a bulkhead. Protective and preventative efforts were perceived by some to be effective except for instances when non-native vegetation usage and heritage structures removal.
Participants used TEK to describe discrepancies in the scale and materials of shoreline preservation actions and desired outcomes. One participant stated that the entire shoreline should have been protected earlier. Another participant clarified why holding the existing shoreline was not sufficient, stating “I wish they could have done something because I’ve seen pictures and heard stories about how much it has changed from the 1900s. The shoreline used to be past the sycamore trees.” Other participants remembered seeing changes in the low tide line themselves including increased marsh, fallen survey poles from the 1960s, retreating lawns along the river, and recurrent flooding sometimes necessitating closure of the fish hatchery. Several participants suggested using traditional knowledge to identify appropriate vegetation to stabilize shorelines, such as cypress and native grasses, or relocation options that used to be Reservation land. Selective material sourcing and project expansion was expected to be cost restrictive but necessary.
Although one participant specifically stated that modern solutions were most appropriate, others thought that preserving traditions, such as fishing, digging clay, and honoring the dead, was important in selecting management options. Traditional practices could be used to justify limitations and expansion of flood and erosion prevention projects. On the one hand, a respondent stated, “If mitigation for shoreline restoration or adaptation is done in certain areas we may lose where we dig for clay.” Another socio-economically and culturally important impact of management decisions shared was, “Everything is positive except for taking down –’s shanty. He was the only fisherman left and they made him stop. That was the worst part.” On the other hand, a participant perceived existing projects to be insufficient for fish stocks, stating “When the soil is not eroding, [it] is cleaner and the fish can make their beds.” Another participant explained the cultural implications of land loss stating, “Near Powhatan’s burial ground it is eroding fast and we are going to lose burials along with Powhatans. The river is getting more shallow and muddier and it’s making it hard for wildlife to survive.” The need to balance environmental and heritage concerns was also expressed as, “The oldest shanty was hastily destroyed because some people thought it was impacting the shoreline and creating more erosion at a faster pace. Had there been any thought to it, the structure could have been preserved and relocated or the land beneath the shanty could have been protected with barriers.” Despite the concerns with where and how to address erosion and flooding, participants agreed that more needed to be done urgently.
Proposals for what to include and how to add to existing efforts varied. Areas of potential focus included actively eroding areas, houses, roads, burial and other sacred sites, historic structures, and wetlands. The longevity suggested for solutions ranged from addressing current flood levels to those for generations to come. Structural solutions were suggested more frequently than natural options. Different respondents proposed expanding either the living shoreline or the bulkhead around the entire Reservation. Elevating homes, dredging the river to renourish the shoreline, wetland restoration, and switching to organic farming methods were also recommended. These recommendations were not without concerns about unintended consequences that could affect the interests of the Pamunkey and its neighbors. One participant noted that utilization of extensive flood control structures would alter water flow and potentially cause ecological damage in other parts of the river. Another participant stated that dredging and regrading could interfere with wildlife breeding if not timed appropriately.
Participants suggested policy opportunities and challenges unique to the Reservation. Land distribution decisions exclude flood risk, which has placed some newer residents in vulnerable areas and increased flooding at exiting residences. Further many buildings on the Reservation are mobile homes because residents do not own the land and are therefore ineligible for mortgages. Potable water distribution and waste management rely upon wells and septic systems. Federal fuds have been used to improve housing and water and waste systems, but they remain at risk from the rising water table and recurrent inundation with salt water. A participant also stated that only one home carried flood insurance. The continuation of management projects by means of support from and negotiations with government officials and private landholders requires Chief and Council involvement, which has fluctuated from one administration to the next. One participant suggested that additional education on the effectiveness of existing and potential flood management options may facilitate buy-in amongst tribal leadership and empower residents.
3.2. Using Visualizations to Set Management Priorities
Participants stated that the SLR map increased urgency, reframed how SLR would affect the Reservation, and elevated interest in geospatial information. A respondent stated that it looked like SLR was “putting people on island and peninsulas.” Other participants questioned if a bulkhead would be able to stop long-term SLR or preferred a focus on preparation because adaptation seemed impossible. Several participants indicated that the dates of the three SLR projections helped contextualize the extent of and urgent need to address the problem. One participant explained how land rights may alter the timeline required to address SLR, “a lot will happen in 20 years and we need to be planning now. Even if the plan is to relocate-we need to know if we can buy land elsewhere; the cost of moving, buying a house or building a house, renting. Everyone on the Reservation either built/bought their home or inherited it. We do not have mortgages on the Reservation and cannot sell our homes to non-tribal members so there is more planning and effort involved than the average person who is looking to move.” This assessment is particularly relevant considering another respondent’s reflection on how TEK might be used to react to the scenarios shown in the map, “It tells us that we need to move. That is what we did for centuries.” Additional information was desired to inform and support decision-making including storm surge, elevation, depth, previously held territory, and projected erosion, marshland, and wetland advancement. Simulations of how various management strategies would shift flood extents were also requested.
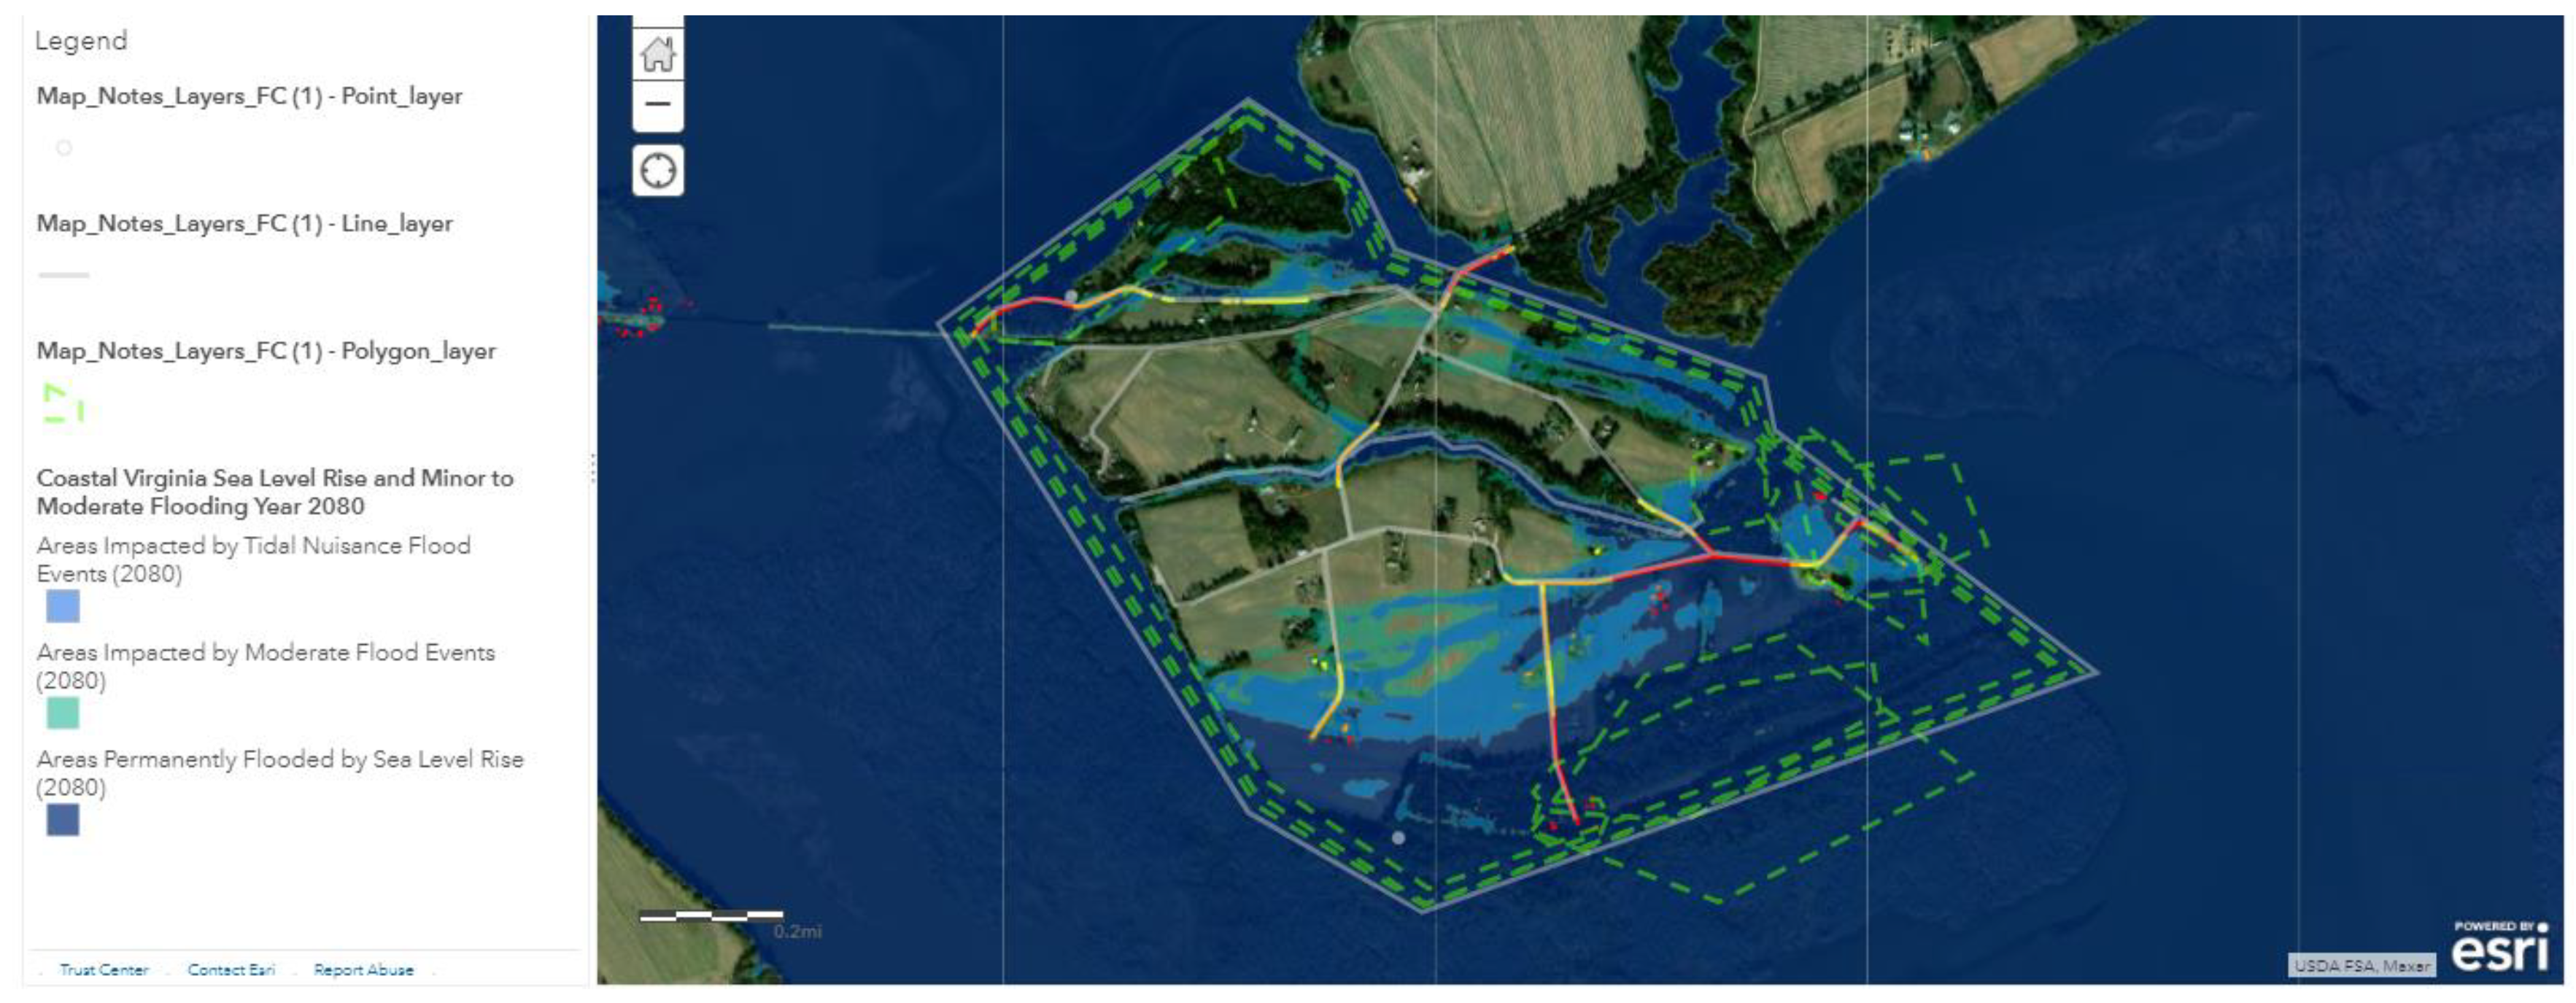
Priorities entered into the Web App appear in Figure 3 and Table 1. Top priorities included: Roads and areas with the most erosion, as well as residences, structures, and burial sites along the shoreline. Some of these priorities were near the fishing huts and boat ramp, which were partially protected by existing flood mitigation structures. The road linking the peninsula to the mainland, community sites, residences, and fishing locations along the shoreline were prioritized by additional participants at a lower level. Some respondents also prioritized a ditch or creek running the length of the Reservation that consistently has a between half to one and a half meters of water flowing through it or the entire Reservation because of artifacts and graves, some of which remain undiscovered. Figure 3 shows these priorities in relation to SLR in 2080.
3.3. Utilizing the Resilience Matrix to Set Risk Reduction Strategies
Table 2 shows the strategies proposed by the participants to reduce flood risk by emergency phase and resource type with the number of participants mentioning each strategy noted (n=#). Participants identified a need for a flood control plan, potable water distribution plan, improved property level flood maps, and additional management technology to facilitate the implementation of risk reduction strategies. Specifications on the proposed plans from two different participants were that it should span seven generations and have livable land for at least 100 people. Examples of additional management technologies not mentioned prior to strategy formation include embankments, flood gates, levees, pump stations, and an access road or using the railroad for access. However, structural projects were often too costly and technical to install without support. Participants reiterated the need to involve a range of tribal, government, private, and nonprofit stakeholders in capacity building and planning efforts.
4. Discussion
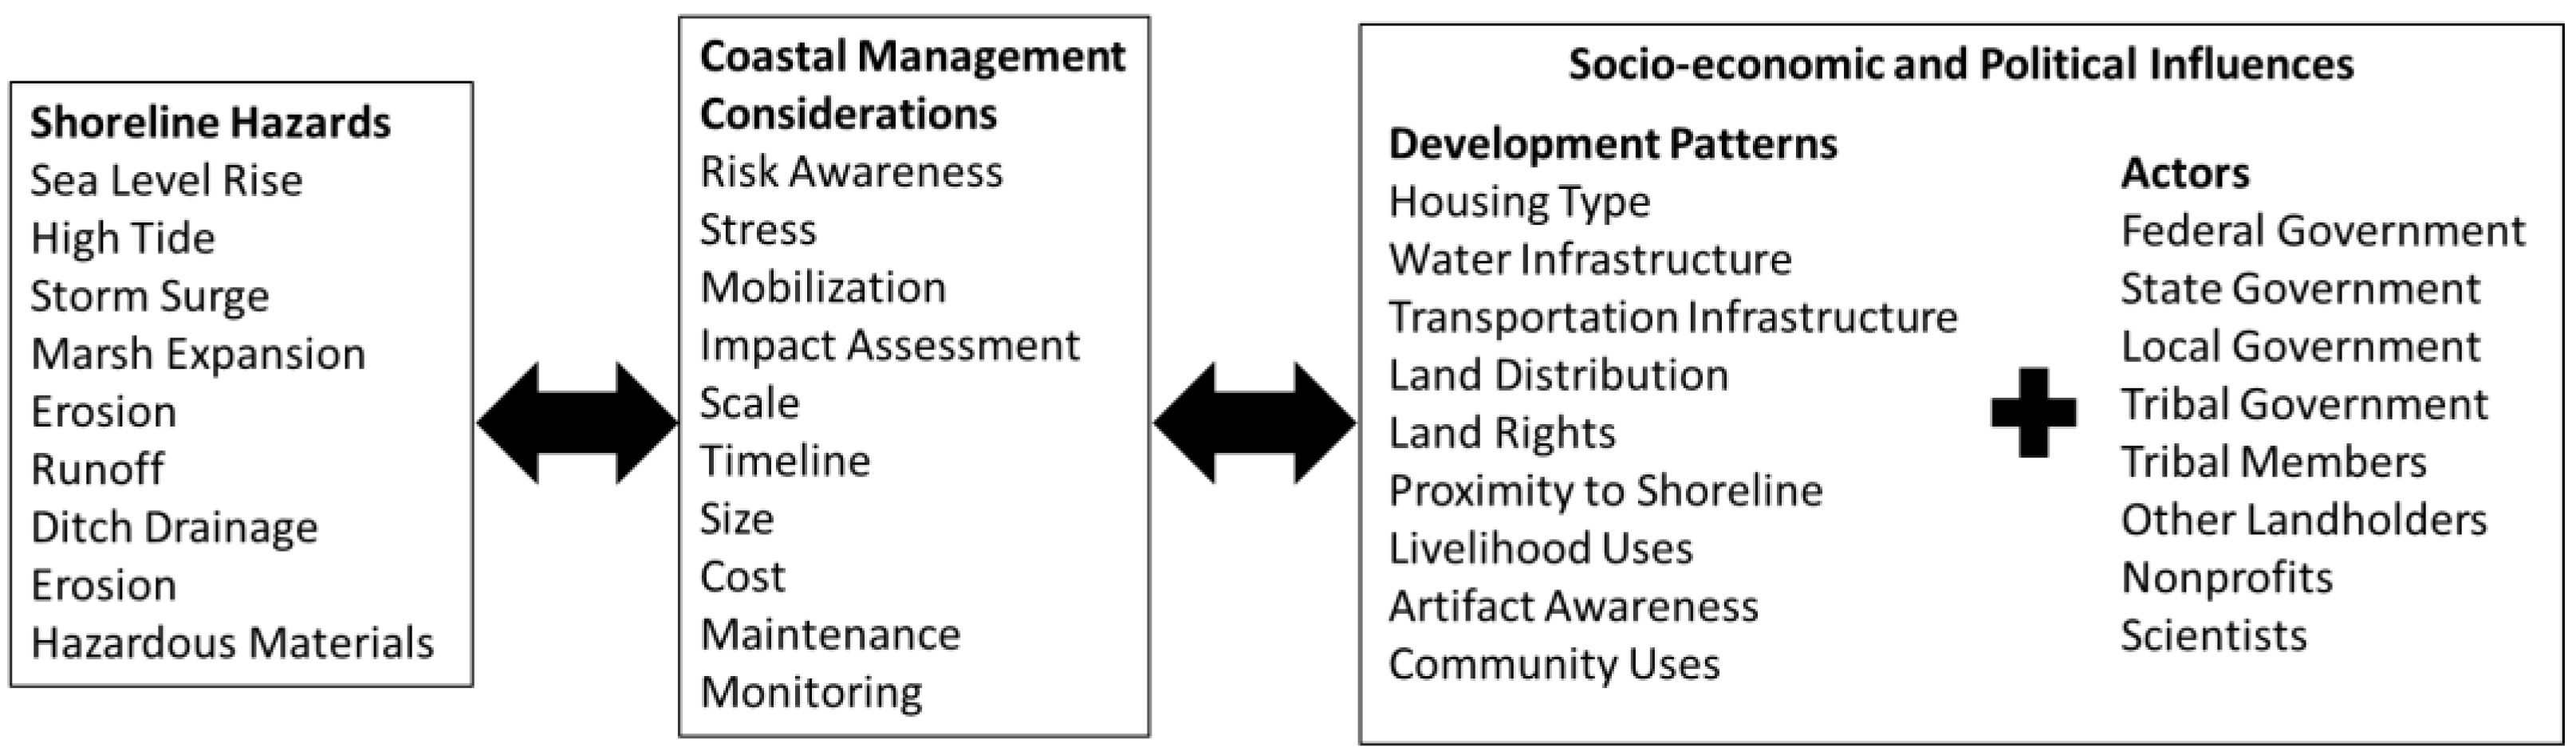
Participants expressed that building community capacity to address the long-term effects of sea level rise while dealing with ongoing threats of storm surge and tidal flooding was a benchmark of success for resource acquisition and emergency management. Flooding was perceived to cause individuals and the community stress and reducing that was a goal embedded within these management strategies. Figure 4 shows the hazards identified by participants and their associations with coastal management considerations. The MPPD also lists these hazards except for erosion, run-off, and marsh expansion but adds dam failure, subsidence, soil shrinking/swelling, and river flooding [32]. Although SLR is not a comprehensive representation of shoreline management priorities, it does exacerbate all of these.
Participants proposed forming a flood management and planning committee to coordinate risk reduction efforts and communication. The MPPD recommendations include similar guidance regarding coordinated emergency services, increased risk awareness, improved communication, and mutual aid for electricity provision [43]. Additional data needed to be acquired by the Pamunkey and integrated into trainings and workshops. This aligns with findings from Bethel et al. [30] that TEK holders are unlikely to make judgements outside their knowledge base and from Gomez-Baggenthum et al. [24] that TEK is hybridized based on interaction with modern development practices. Participants expressed interest in waterproofing and reinforcing buildings and infrastructure, maintenance, and monitoring of management projects, and the effects of and ability to reduce recurrent flooding including limitations to reduce ecological and socio-economic vulnerability. Rebuilding and remediation standards were also desired as an interim step before larger management projects could be funded and sourced. Waterproofing, monitoring, maintenance, damage prevention, evacuation routes, building regulation, zoning, storm water management, and GIS analysis were among the MPPD’s priorities as well though the exact projects were remanded to the localities [43].
If the Tribe is able to collaborate with the MPPD, the resilience matrix can both prioritization reconciliation and project development. Interested members of the Tribe may also collect their own monitoring data with sufficient training [15]. Although the utility of citizen science, such as crowdsourcing, in long-term data collection is not always reliable, tribes are expected to have above average results because of their sense of community and documented alignment of their perceived environmental contributors to and impacts of climate exacerbated hazards with data collected from instruments [18,20]. Though the attention on local hazards may not align fully with the approach of other scientific and government monitoring and mitigation approaches, the environmental data could be useful in relation to other collections, improving early warning systems, and other aspects of preparation and mitigation [10,17,24,25]. Further, the cultural perspective could improve gradual approaches to long-term planning [26].
Participants perceived TEK to be complementary to but not a replacement for structural and natural solutions. On the one hand, TEK indicates that using non-native species for living shorelines, destabilizing clays, harming wildlife or its habitat, and demolishing fishing huts is not acceptable. On the other hand, TEK helps to determine the rate of loss, goals for restoration, and long-term relocation options. Despite strong linkages to traditional practices, relocation was viewed as an extreme option for when the Reservation cannot support the appropriate population and activities. This may be associated with stress about how tribal lands have been reduced from their original treaty allocation [29]. The application of TEK to shoreline management is similar to Bethel et al. [30] wherein TEK holders suggested working inward by prioritizing: (i) Barrier islands and remnant marshes not too degraded to restore as storm surge barriers that prevent land loss, (ii) natural ridges and remnant land for the same reason, and (iii) waterways and canals for navigation. Although the location of the Reservation within a tributary to the Chesapeake Bay instead of at the mouth of the Mississippi Delta changes the fish species and soil structure present, it does not reduce the concerns with storm surge and vegetation shifts associated with salinity changes. These TEK-based performance measures can be used to evaluate coastal management solutions as awareness increases and opportunities arise. The inclusion of SLR in this exploratory analysis provides precursory inputs to expand in-depth analysis of how visualizations influence and capture TEK-based recommendations for coastal management. The overall priorities of the stakeholders are not expected to change based on the type of climate exacerbated flooding visualized [9].
The utilization of SLR visualization to complete the Resilience Matrix through a reiterative past and future strategy assessment provides a tool to communicate and evaluate progress toward mitigation and adaptation goals. Viewing TEK through the resilience matrix also explains why recent living shoreline projects that relied on environmental analysis exclusively are viewed as insufficient or misaligned in some way. Management options have to be co-produced through engagement citizen engagement, including TEK holders when available, external agencies, and tribal government [41]. For example, the history of federal and tribal council support shows fluctuations over time that require alignment to progress. Results of this study align with those of Strickland et al. [29] who recommend reconnecting tribes with 18th and 19th century landscapes, more oral history and spatial data collection, expanding the focus on watersheds including increased archaeological surveys along the rivers, and leveraging the diaspora, historic designations, and government to government relationships [29].
5. Conclusions and Recommendations
SLR has caused land loss on the Reservation, encroached upon heritage sites, and limited livelihood options. Erosion, saltwater intrusion, and flooding reduce fish stocks, limit the fishing culture, reduce crop productivity, damage yards and structures, and restrict roadway access. Some hazard exposures may exist that the Tribe has not directly associated with SLR or addressed in the proposed risk reduction strategies, such as waste and water supplies and water quality. Living shorelines and a bulkhead protect some residential, community, and ecological features. However, some management efforts, such as the removal of the fishing hut, were culturally insensitive. Future shoreline management efforts may limit access to clay soils, shift erosion to other areas, reduce wildlife populations, or change the dominant plant species if TEK is not incorporated. Commonalities in performance measures between this study and Bethel et al. [30] indicate that findings are applicable to other coastal tribes in the southeastern United States.
SLR maps reinforced immediacy and the focus onto residences and ceremony grounds along the shoreline that appeared to be most affected. However, SLR was not considered to be an all-encompassing indicator of risk to the Reservation’s coast. Solutions need to be capable of supporting both residents and the diaspora that visit the Reservation. Preferences toward investigating structural solutions and expanding existing barriers may be reflective of recent experiences or lack thereof. They offer short-term implementation options that protect artifacts, residences, and access to the Reservation in conjunction with traditional practices regarding ditch management, hunting and trapping, and livelihood continuation until longer-term relocation options are explored. These results prepare the Pamunkey to increase engagement with coastal hazard planning internally and externally and could be used to advocate for inclusion in emergency management during hazardous events. The resilience matrix serves as a checklist and screening tool to align proposed solutions with TEK. Findings prepare the Pamunkey to develop and update mitigation plans for submission to the VDEM post-disaster Hazard Mitigation Grant program and prioritize other grant proposals to federal agencies, such as FEMA, NOAA, NFWF, and the Environmental Protection Agency. Table-top exercises should be also conducted to assess situational community capacity, integration with local authorities, and support from the federal government as projects are implemented.
Future studies should expand the utilization of GIS and the participants involved in the process. Storm surge, erosion rates, habitat loss, wildlife ranges, elevation, and models of SLR with various management projects implemented need to be available in participatory GIS web applications to visualize both past and future land losses. Factors associated with coastal management should be weighted and indicators linked to each individually to further operationalize the resilience matrix. Discrepancies between the MPPD’s priorities and those of the Pamunkey require additional exploration. Coding should be compared to other systems to identify comparability. External stakeholders such as recreationalists, surrounding land holders, nonprofit organizations, and local, state, and federal officials with expertise in planning, emergency management, and tribal affairs need to be invited to assess feasibility of the TEK informed management priorities. The study area should be expanded to identify upstream contributors to land loss on the Reservation. The study should also be repeated with other tribes to develop a framework to integrate TEK with planning on reservations and in connected municipalities inclusive of different tribal recognition mechanisms, shoreline utilizations, and management priorities with for example, the Rappahannock, Nansemond, and Chickahominy, which are also located in coastal Virginia.
Supplementary Materials
The following are available online, Story Map S1: Coastal Adaptation Priorities–Results from a participatory mapping process with the Pamunkey Indian Tribe (https://arcg.is/1qSXq1).
Author Contributions
Conceptualization, data curation, formal analysis, writing—review and editing, visualization, and funding acquisition, N.S.H. and T.R.A. Methodology, investigation, writing—original draft preparation, project administration, N.S.H. Resources and supervision, T.R.A. All authors have read and agreed to the published version of the manuscript.
Funding
This research was funded by a grant from the University of Colorado Natural Hazards Center through its Mitigation Matters grant program, which is supported by National Science Foundation Grant #1635593 through supplemental funding from the Federal Emergency Management Agency (FEMA). Any opinions, findings, conclusions, or recommendations expressed in this material are those of the author(s) and do not necessarily reflect the views of NSF, FEMA, or the Natural Hazards Center.
Acknowledgments
The authors would like to thank George McLeod, Maruf Sakib, and Shelia Hutt of the Old Dominion University Center for Geospatial Science, Education and Analytics for web app development, the Commonwealth Center for Recurrent Flooding Resiliency for utilization of the Coastal Virginia Sea Level with Minor and Moderate Flooding web app, Lauren Fox formerly of the Pamunkey Indian Tribal Resource Center for coordinating the survey, and the participants from the Pamunkey Indian Tribe for their time.
Conflicts of Interest
The authors declare no conflict of interest.
References
- Maiolo, M.; Mel, R.A.; Sinopoli, S. A Stepwise Approach to Beach Restoration at Calabaia Beach. Water 2020, 12, 2677. [Google Scholar] [CrossRef]
- Jongman, B. Effective adaptation to rising flood risk. Nat. Commun. 2018, 9, 1986. [Google Scholar] [CrossRef] [PubMed] [Green Version]
- Fedorov, G.M.; Kuznetsova, T.Y.; Razumovskii, V.M. How the proximity of the sea affects development of economy and the settlement pattern in Kaliningrad oblast. Reg. Res. Russ. 2017, 7, 352–362. [Google Scholar] [CrossRef]
- Arnell, N.W.; Gosling, S.N. The impacts of climate change on river flood risk at the global scale. Clim. Chang. 2016, 134, 387–401. [Google Scholar] [CrossRef] [Green Version]
- Mel, R.; Sterl, A.; Lionello, P. High resolution climate projection of storm surge at the Venetian coast. Nat. Hazards Earth Syst. Sci. 2013, 13, 1135–1142. [Google Scholar] [CrossRef] [Green Version]
- Woth, K.; Weisse, R.; von Storch, H. Climate change and North Sea storm surge extremes: An ensemble study of storm surge extremes expected in a changed climate projected by four different regional climate models. Ocean Dynam. 2006, 56, 3–15. [Google Scholar] [CrossRef]
- Resio, D.; Irish, J.; Cialone, M. A surge response function approach to coastal hazard assessment—Part 1: Basic concepts. Nat. Hazards 2009, 51, 163–182. [Google Scholar] [CrossRef]
- Heaps, N.S. Storm surges 1967–1982. Geophys. J. Int. 1983, 74, 331–376. [Google Scholar] [CrossRef] [Green Version]
- Tao, J.; Guosheng, L. Contemporary monitoring of storm surge activity. Prog. Phys. Geogr. Earth Environ. 2019, 44. [Google Scholar] [CrossRef]
- Mel, R.; Viero, D.P.; Carniello, L.; D’Alpaos, L. Optimal floodgate operation for river flood management: The case study of Padova (Italy). J. Hydrol. Reg. 2020, 30, 100702. [Google Scholar] [CrossRef]
- Martins, G.M.; Amaral, A.F.; Wallenstein, F.M.; Neto, A.I. Influence of a breakwater on nearby rocky intertidal community structure. Mar. Environ. Res. 2009, 67, 237–245. [Google Scholar] [CrossRef] [Green Version]
- Board, M. Beach Nourishment and Protection; National Academies Press: Washington, DC, USA, 1995. [Google Scholar]
- Vousdoukas, M.I. Observations of wave run-up and groundwater seepage line motions on a reflective-to-intermediate, meso-tidal beach. Mar. Geol. 2014, 350, 52–70. [Google Scholar] [CrossRef]
- Vousdoukas, M.I.; Almeida, L.P.; Ferreira, Ó. Beach erosion and recovery during consecutive storms at a steep-sloping, meso-tidal beach. Earth Surf. Process. Landf. 2012, 37, 583–691. [Google Scholar] [CrossRef]
- Temmerman, S.; Meire, P.; Bouma, T.J.; Herman, P.M.J.; Ysebaert, T.; De Vriend, H.J. Ecosystem-based coastal defence in the face of global change. Nature 2013, 504, 79–83. [Google Scholar] [CrossRef] [PubMed]
- Turner, R.K. Integrating natural and socio-economic science in coastal management. J. Mar. Syst. 2000, 25, 447–460. [Google Scholar] [CrossRef]
- Rapant, P.; Unucka, J.; Vondrák, I. Regional flood early warning system. Geosci. Eng. 2010, 4, 87–103. [Google Scholar]
- Coelho, C.; Narra, P.; Marinho, B.; Lima, M. Coastal Management Software to Support the Decision-Makers to Mitigate Coastal Erosion. J. Mar. Sci. Eng. 2020, 8, 37. [Google Scholar] [CrossRef] [Green Version]
- Mazzoleni, M.; Cortes, J.; Wehn, U.; Alfonso, L.; Norbiato, D.; Monego, M.; Ferri, M.; Solomatine, D. Exploring the influence of citizen involvement on the assimilation of crowdsourced observations: A modelling study based on the 2013 flood event in the Bacchiglione catchment (Italy). Hydrol. Earth Syst. Sci. 2018, 33. [Google Scholar] [CrossRef] [Green Version]
- Ostrom, E. A general framework for analyzing sustainability of social-ecological systems. Science 2009, 325, 419–422. [Google Scholar] [CrossRef]
- Silvertown, J. A new dawn for citizen science. Trends Ecol. Evol. 2009, 24, 467–471. [Google Scholar] [CrossRef]
- Ye, G.; Chou, L.M.; Yang, S.; Wu, J.; Liu, P.; Jin, C. Is integrated coastal management an effective framework for promoting coastal sustainability in China’s coastal cities? Mar. Policy 2015, 56, 48–55. [Google Scholar] [CrossRef]
- Pearce, T.; Ford, J.; Willox, A.C.; Smit, B. Inuit traditional ecological knowledge (TEK), subsistence hunting and adaptation to climate change in the Canadian Arctic. Arctic 2015, 66, 233–245. [Google Scholar] [CrossRef] [Green Version]
- Gómez-Baggethun, E.; Esteve, C.; Victoria, R.-G. Traditional ecological knowledge and global environmental change: Research findings and policy implications. Ecol. Soc. A J. Integr. Sci. Resil. Sustain. 2013, 18. [Google Scholar] [CrossRef] [PubMed] [Green Version]
- Leonard, S.; Parsons, M.; Olawsky, K.; Kofod, F. The role of culture and traditional knowledge in climate change adaptation: Insights from East Kimberley, Australia. Glob. Environ. Chang. 2013, 23, 623–632. [Google Scholar] [CrossRef]
- Vogt, N.; Miguel, P.-V.; Eduardo, S.; Brondízio, F.G.; Rabelo, K.F.; Oriana, A.; Sergio, R.; Peter, J.D.; Yue, D. Local ecological knowledge and incremental adaptation to changing flood patterns in the Amazon delta. Sustain. Sci. 2016, 11, 611–623. [Google Scholar] [CrossRef]
- McMillen, H.; Ticktin, T.; Springer, H.K. The future is behind us: Traditional ecological knowledge and resilience over time on Hawai ‘I Island. Reg. Environ. Chang. 2017, 17, 579–592. [Google Scholar] [CrossRef]
- Bethel, M.B.; Brien, L.F.; Danielson, E.J.; Laska, S.B.; Troutman, J.P.; Boshart, W.M.; Giardino, M.J.; Phillips, M.A. Blending geospatial technology and traditional ecological knowledge to enhance restoration decision-support processes in Coastal Louisiana. J. Coast. Res. 2011, 27, 555–571. [Google Scholar]
- Strickland, S.M.; King, J.A.; McCartney, M. Defining the Greater York River Indigenous Cultural Landscape. Available online: https://chesapeakeconservancy.org/wp-content/uploads/2020/02/York-ICL-Final.pdf (accessed on 23 November 2020).
- Bethel, M.B.; Brien, L.F.; Esposito, M.M.; Miller, C.T.; Buras, H.S.; Laska, S.B.; Philippe, R.; Peterson, K.J.; Parsons Richards, C. Sci-TEK: A GIS-based multidisciplinary method for incorporating traditional ecological knowledge into Louisiana’s coastal restoration decision-making processes. J. Coast. Res. 2014, 30, 1081–1099. [Google Scholar] [CrossRef]
- Milligan, D.A.; Hardaway, C.S., Jr.; Wilcox, C.A. Pamunkey Indian Reservation Shoreline Management Plan. Available online: https://doi.org/10.25773/fsaf-rz10 (accessed on 23 November 2020).
- Middle Peninsula Planning District. All Hazards Mitigation Plan Update. Available online: https://www.mppdc.com/articles/reports/AHMP_2016_FEMA_Approved_RED.pdf (accessed on 23 November 2020).
- Spivey, A. Knowing the River, Working the Land, and Digging for Clay: Pamunkey Indian Subsistence Practices and the Market Economy 1800–1900. Available online: https://scholarworks.wm.edu/etd/1516639670/ (accessed on 23 November 2020).
- Yin, J.; Goddard, P.B. Oceanic control of sea level rise patterns along the East Coast of the United States. Geophys. Res. Lett. 2013, 40, 5514–5520. [Google Scholar] [CrossRef]
- Ezer, T. The Increased Risk of Flooding in Hampton Roads: On the Roles of Sea Level Rise, Storm Surges, Hurricanes, and the Gulf Stream. Mar. Technol. Soc. J. 2018, 52, 34–44. [Google Scholar] [CrossRef] [Green Version]
- Virginia Department of Environmental Quality. Virginia Coastal Geospatial and Educational Mapping System (GEMS). Available online: http://www.coastalgems.org/ (accessed on 23 November 2020).
- Commonwealth of Virginia. Virginia Coastal Resilience Master Planning Framework. Available online: https://www.governor.virginia.gov/media/governorvirginiagov/governor-of-virginia/pdf/Virginia-Coastal-Resilience-Master-Planning-Framework-October-2020.pdf (accessed on 23 November 2020).
- Commonwealth Center for Recurrent Flooding Resiliency. Future Sea Level and Recurrent Flooding Risk for Coastal Virginia. Available online: https://www.floodingresiliency.org/wp-content/uploads/2020/03/Future-Sea-Level-and-Recurrent-Flooding-Risk-for-Coastal-Virginia-Final-Version.pdf (accessed on 23 November 2020).
- Allen, T.; Crawford, T.; Montz, B.; Whitehead, J.; Lovelace, S.; Hanks, A.; Christensen, A.; Kearney, G. Linking Water Infrastructure, Public Health, and Sea Level Rise: Integrated Assessment of Flood Resilience in Coastal Cities. Public Work. Manag. Policy 2019, 24, 110–139. [Google Scholar] [CrossRef]
- Lin, J.; Xie, L.; Pietrafesa, L.J.; Ramus, J.S.; Paerl, H.W. Water quality gradients across Albemarle-Pamlico estuarine system: Seasonal variations and model applications. J. Coast. Res. 2007, 23, 213–229. [Google Scholar] [CrossRef]
- Etheridge, J.R.; Manda, A.K.; Grace-McCaskey, C.; Allen, T.; Hao, H. Lessons learned from public participation in hydrologic engineering projects. Hydrol. Sci. J. 2020, 65, 325–334. [Google Scholar] [CrossRef]
- Manda, A.K.; Etheridge, J.R.; Grace-McCaskey, C.; Allen, T.R.; Howard, R. Are groundwater level data collected by citizen scientists trustworthy? A cautionary tale. Groundwater 2020. [Google Scholar] [CrossRef]
- Middle Peninsula Planning District. All Hazards Mitigation Plan. Available online: https://www.mppdc.com/articles/reports/FEMA_Approved_Final_Plan_RED_Part1.pdf (accessed on 23 November 2020).
- Fox-Lent, C.; Bates, M.E.; Linkov, I. A matrix approach to community resilience assessment: An illustrative case at Rockaway Peninsula. Environ. Syst. Decis. 2015, 35, 209–218. [Google Scholar] [CrossRef]
- Allen, M.J.; Allen, T.R. Precipitation Trends across the Commonwealth of Virginia (1947–2016). Va. J. Sci. 2019, 70, 4. [Google Scholar]
- Allen, T.R.; Howard, R. Improving low-relief coastal LiDAR DEMs with hydro-conditioning of fine-scale and artificial drainages. Front. Earth Sci. 2015, 3, 72. [Google Scholar] [CrossRef] [Green Version]
- National Oceanic and Atmospheric Administration. Continually Updated Shoreline Product (CUSP). Available online: https://www.ngs.noaa.gov/CUSP/ (accessed on 23 November 2020).
- Virginia Geographic Information Network (VGIN) VITA. Virginia GIS Clearinghouse. Available online: https://vgin.maps.arcgis.com/home/index.htm (accessed on 23 November 2020).
Figure 1.
Study Area.
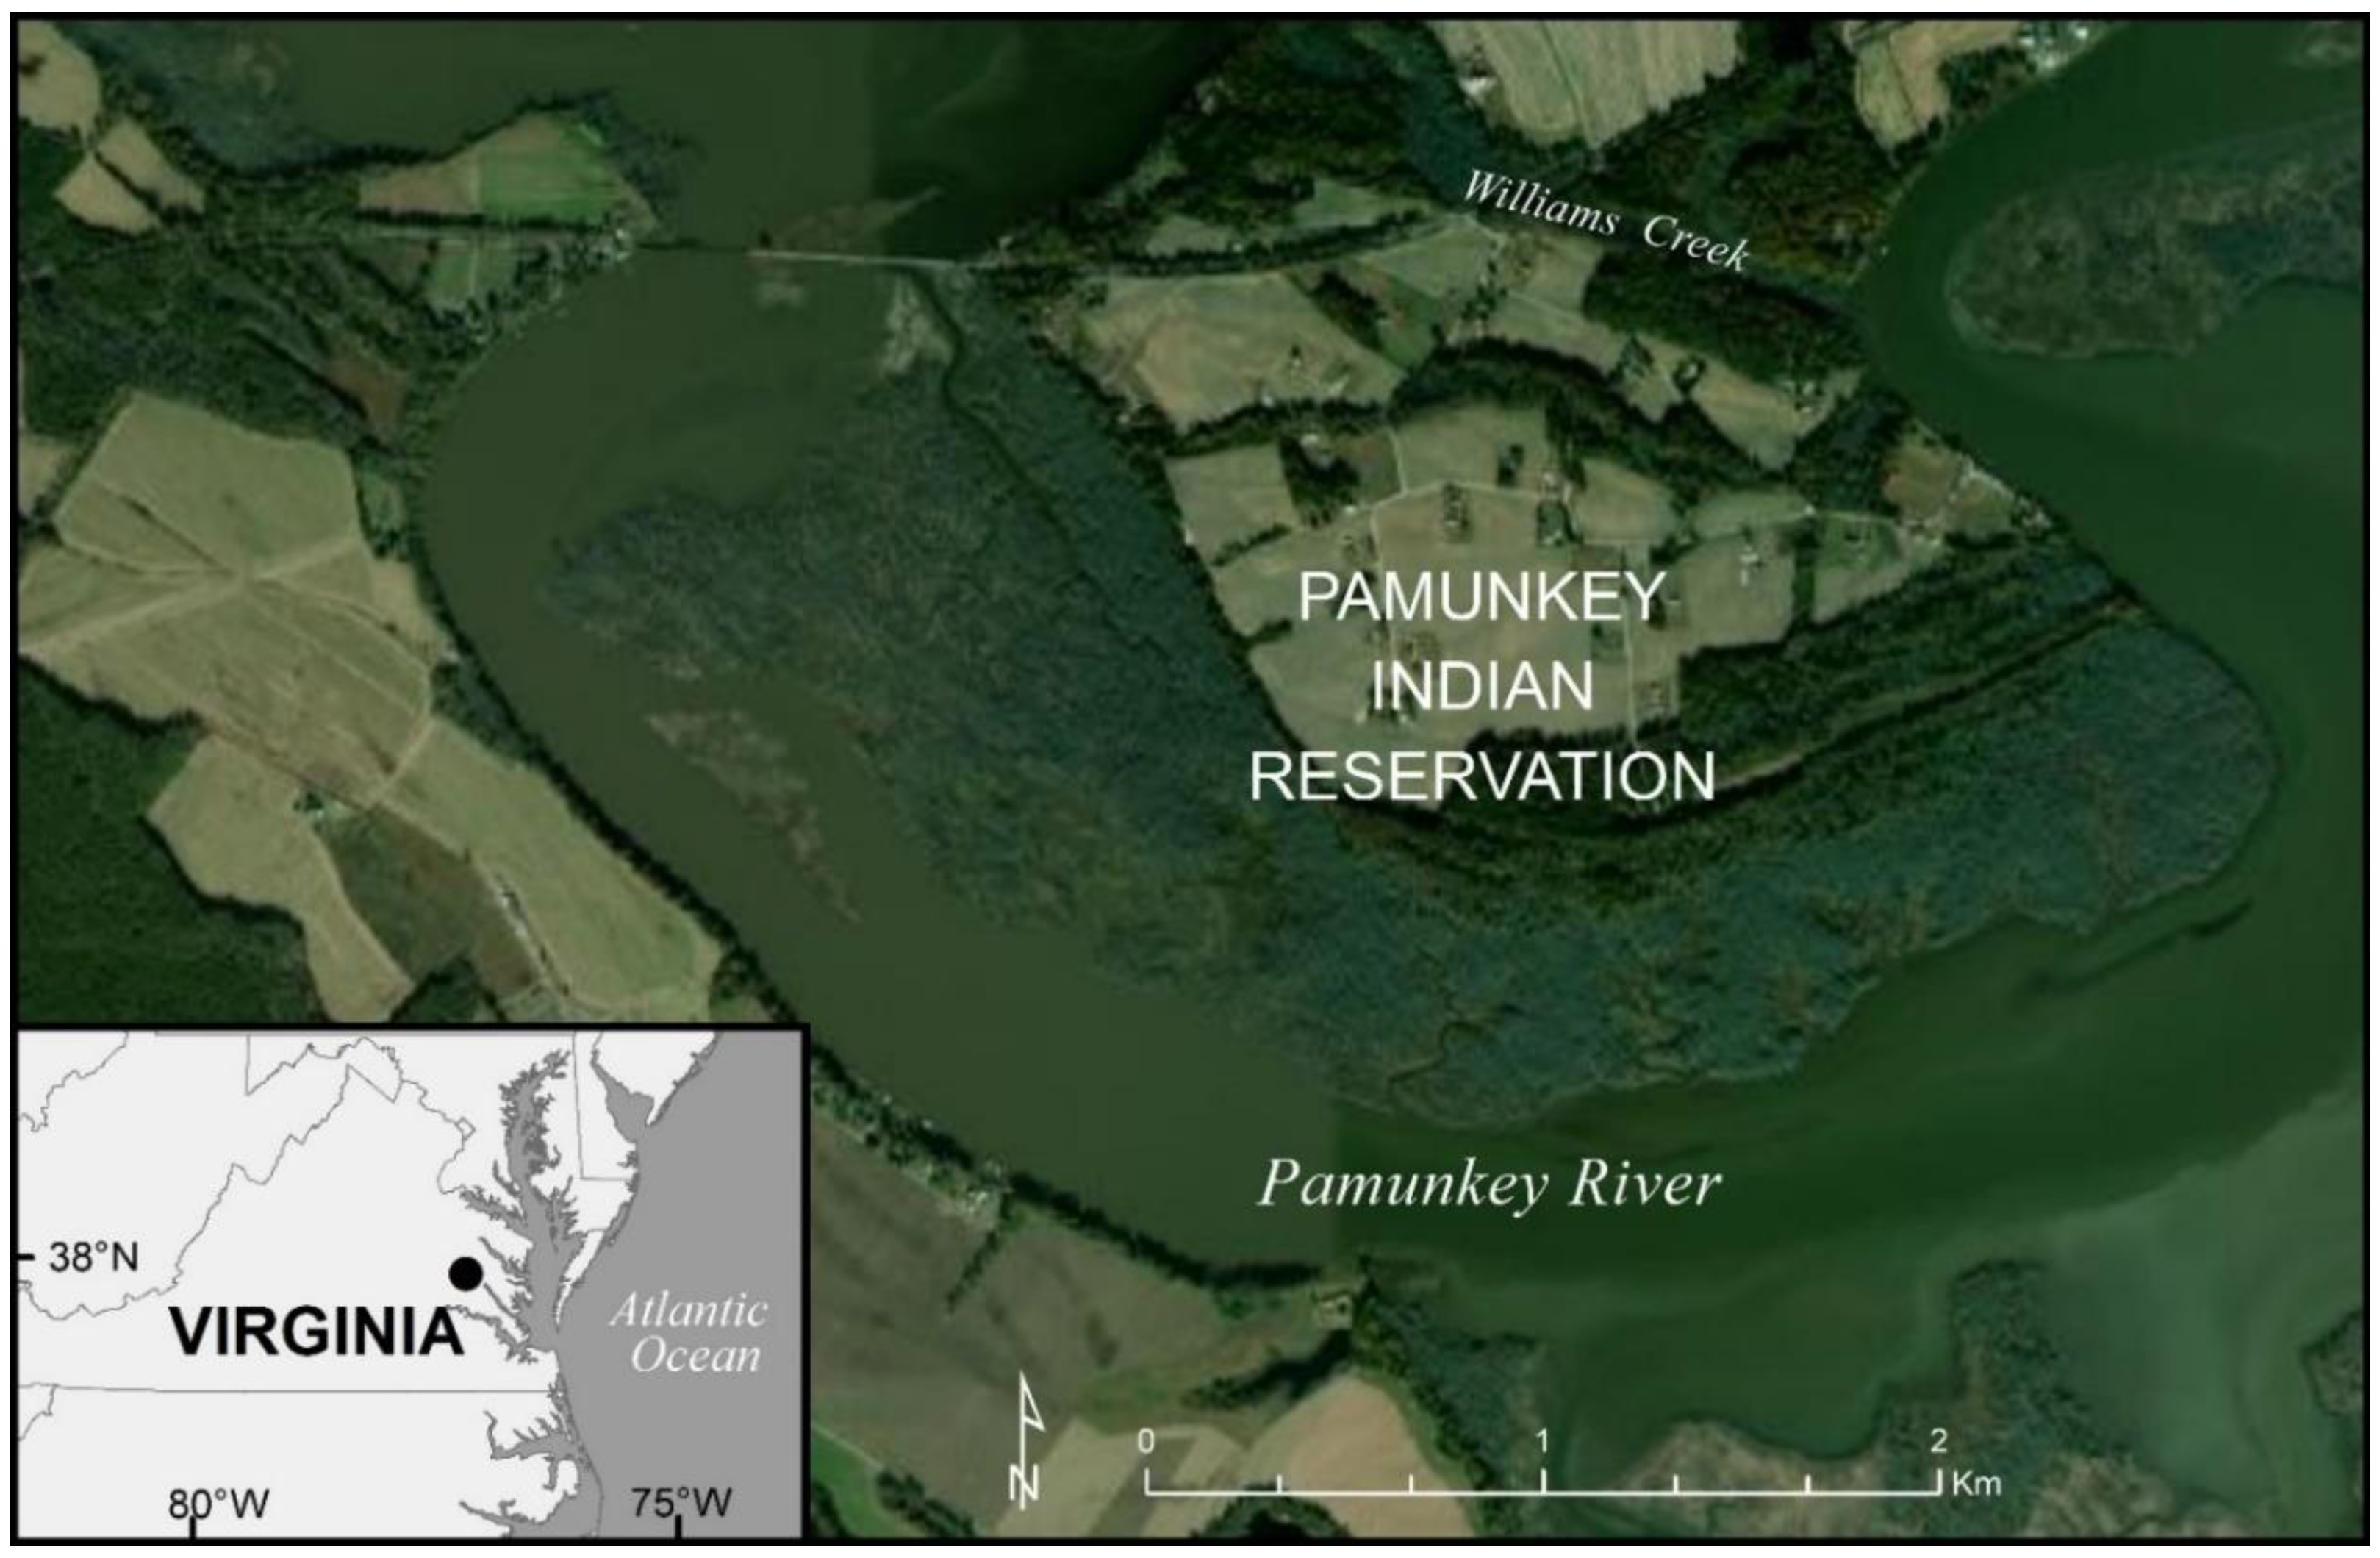
Figure 2.
Heritage Sites and Shoreline of the Pamunkey Reservation Study Area and Confluence of Tributaries into the York River from the Web App.
Figure 2.
Heritage Sites and Shoreline of the Pamunkey Reservation Study Area and Confluence of Tributaries into the York River from the Web App.
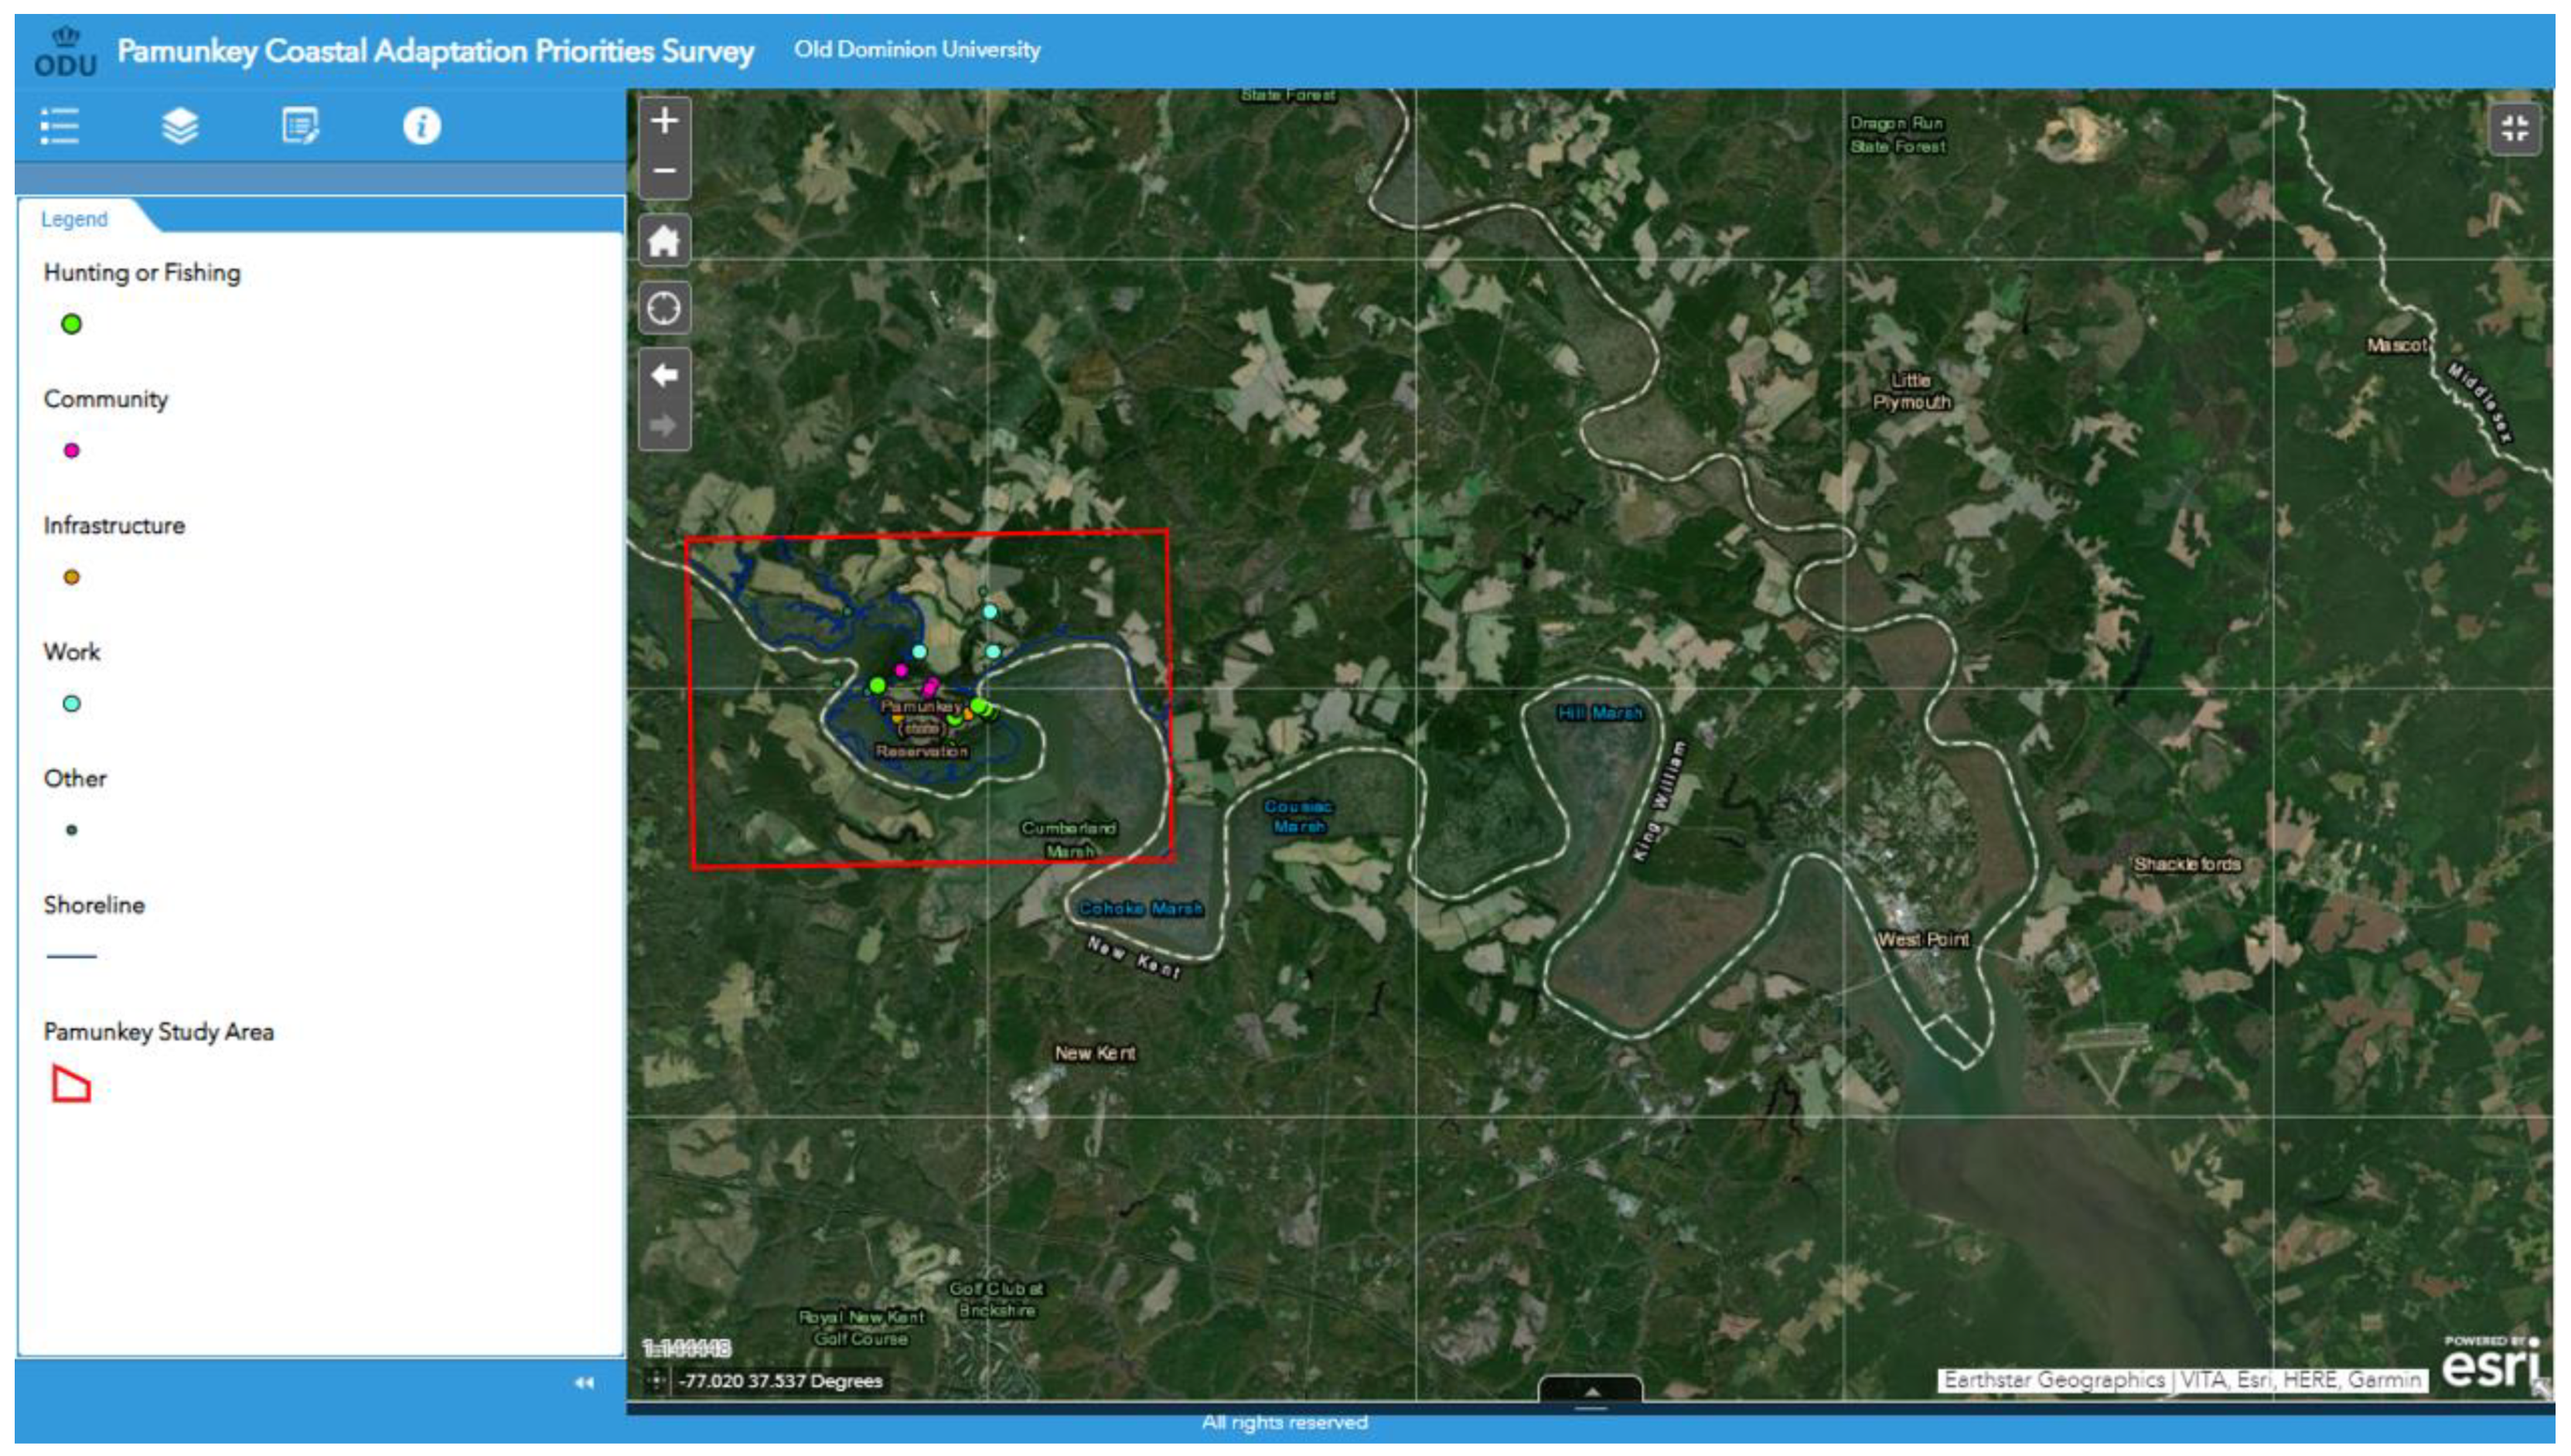
Figure 3.
Web app input with 2080 SLR.

Figure 4.
Contributors to management considerations on coastal reservations.


Table 1.
Web app input descriptions.
| Title | Type | Description |
|---|---|---|
| Priority 1/2 U1 | Polygon | Residences and homes along shoreline |
| Priority 2/2 U1 | Line | Entrance and exit |
| Priority 1/1 U2 | Polygon | No annotation |
| Priority 1/2 U3 | Polygon | No annotation |
| Priority 2/2 U3 | Line | Already has 1–4 feet of water running through it |
| Priority 1/3 U4 | Point | Burial grounds along shoreline (example–other locations redacted for privacy) |
| Priority 2/3 U4 | Point | Community sites along shoreline (example–other locations redacted for privacy) |
| Priority 3/3 U4 | Polygon | Residences and fishing locations along shoreline |
| Priority 1/3 U5 | Polygon | Bulkhead extended past --’s residence. |
| Priority 2/3 U5 | Polygon | Creek floods after rain into field. |
| Priority 3/3 U5 | Polygon | Looks like that’s where the Reservation is losing most the land. |
| Priority 1/5 U6 | Line | Roads-need access |
| Priority 2/5 U6 | Line | Shoreline-erosion prevents saving resources ex. hatchery and boat ramp |
| Priority 3/5 U6 | Polygon | Residences-need access |
| Priority 4/5 U6 | Polygon | Community use areas and archaeology-artifacts are spread across the whole Reservation -- want to save everything before it goes away |
| Priority 5/5 U6 | Polygon | Graves-marked and unmarked |
Table 2.
Risk reduction strategies (adapted by authors from Fox-Lent et al. [44]).
Table 2.
Risk reduction strategies (adapted by authors from Fox-Lent et al. [44]).
| Risk | Physical | Information | Cognitive | Social |
|---|---|---|---|---|
| Prepare |
|
|
|
|
| Absorb |
|
|
|
|
| Recover |
|
|
|
|
| Adapt |
|
|
|
|
Publisher’s Note: MDPI stays neutral with regard to jurisdictional claims in published maps and institutional affiliations. |
© 2020 by the authors. Licensee MDPI, Basel, Switzerland. This article is an open access article distributed under the terms and conditions of the Creative Commons Attribution (CC BY) license (http://creativecommons.org/licenses/by/4.0/).
Share and Cite
MDPI and ACS Style
Hutton, N.S.; Allen, T.R. The Role of Traditional Knowledge in Coastal Adaptation Priorities: The Pamunkey Indian Reservation. Water 2020, 12, 3548. https://doi.org/10.3390/w12123548
AMA Style
Hutton NS, Allen TR. The Role of Traditional Knowledge in Coastal Adaptation Priorities: The Pamunkey Indian Reservation. Water. 2020; 12(12):3548. https://doi.org/10.3390/w12123548
Chicago/Turabian StyleHutton, Nicole S., and Thomas R. Allen. 2020. "The Role of Traditional Knowledge in Coastal Adaptation Priorities: The Pamunkey Indian Reservation" Water 12, no. 12: 3548. https://doi.org/10.3390/w12123548
Note that from the first issue of 2016, this journal uses article numbers instead of page numbers. See further details here.