Article

Structural Characteristics and Driving Factors of the Planktonic Eukaryotic Community in the Danjiangkou Reservoir, China

1
International Joint Laboratory for Watershed Ecological Security in the Source Area of the Middle Route of The South-to-North Water Diversion Project of Henan Province, Innovation Center of Water Security for Water Source Region of Mid-route Project of South-North Water Diversion of Henan Province, Henan Engineering Technology Research Center for Mushroom-based Foods, School of Water Resources and Environment, Nanyang Normal University, Nanyang 473061, China
2
Department of Hydrology and Water Resources Management, Kiel University, 24098 Kiel, Germany
3
Ecological Complexity and Modelling Laboratory, Department of Botany and Plant Sciences, University of California, Riverside, CA 92521, USA
*
Authors to whom correspondence should be addressed.
These authors contributed equally to this work.
Water 2020, 12(12), 3499; https://doi.org/10.3390/w12123499
Submission received: 21 October 2020 / Revised: 7 December 2020 / Accepted: 7 December 2020 / Published: 12 December 2020
(This article belongs to the Special Issue Microbial Communities in Water Environments: Dynamics and Interaction)

Abstract

:
Planktonic eukaryotes are widespread in aquatic ecosystems, and the study of their community composition and driving factors is of great significance to protecting and maintaining the balance of these ecosystems. This study evaluates five typical ecological sites in the Danjiangkou Reservoir—the water source for the project. This was done to comprehensively understand the composition of Danjiangkou Reservoir planktonic eukaryotes, and ensure the ecological balance of the water source for the South-to-North Water Diversion Project. The diversity of the planktonic eukaryotes in surface water and the factors driving changes in their abundance are analyzed with an 18S ribosomal DNA sequencing approach. Monitoring shows that the Danjiangkou Reservoir has good water quality. The Danjiangkou Reservoir planktonic eukaryote community is mainly composed of 11 phyla, of which Cryptomonadales is dominant, accounting for an average percentage of 65.19% of the community (47.2–84.90%). LEFSe analysis shows significant differences among samples in the abundances of 13 phyla, 20 classes, 23 orders, 26 families, and 27 genera, and there are also significant differences in the diversity of planktonic eukaryotes at different temporal and spatial scales. Redundancy analysis (RDA) show that water temperature, DO, SD, TN, and Chla are significant factors that affect the composition of the planktonic eukaryote community. Spearman rank correlation analysis combined with taxonomic difference analysis shows that Kathablepharidae and Choanoflagellida are not sensitive to environmental or physicochemical factors and that the interannual variations in their abundance are not significant. Network analysis shows that Protalveolata, Basidiomycota, P1-31, Bicosoecida, and Ochrophyta represent important nodes in the single-factor network, while Chytridiomycota, P1-31, Cryptomycota, Ochrophyta, Ichthyosporea, Bicosoecida, Protalveolata, and physicochemical factors (ORP, TN, WT, DO, SD, NH3-N, and NO3-N) represent important nodes in the two-factor network.

1. Introduction

Planktonic eukaryotes are important taxa in aquatic communities and perform critical ecological functions [1,2,3,4]. They play a vital role in lake ecosystems as major participants in material and energy cycles [4,5]. Research on the diversity of planktonic eukaryotes is helpful for understanding their distribution characteristics in lakes and their functions in lake ecosystems, which is of great significance for further research on the ecological environment of lakes [6].
At present, planktonic eukaryotes in lakes are mainly observed through microscopes; this method is not only affected by sampling conditions and preservation techniques, but also subject to great variation and disagreements in the identification of these organisms. With the advent and improvement of high-throughput sequencing technology [7], eukaryotic diversity can be evaluated. High-throughput sequencing of specific PCR products, such as eukaryotic 18S rDNA genes, on such platforms, can be used to obtain information on eukaryotic community structure, evolutionary relationships, and correlations between eukaryotic plankton and the environment [8,9,10,11]. Molecular biology has been widely used in studying plankton in water [12,13,14,15,16]. Current research has focused on the communities, distribution, and function of phytoplankton, archaea, plant and animal taxa, and their relationships with water quality [8,17,18,19]. High-throughput sequencing technology enables the efficient and rapid acquisition of specific DNA fragments and provides a more comprehensive picture of the composition of the community than other methods [20]. Its application in water quality monitoring has attracted the attention of an increasing number of researchers [21], who currently use this method to study the composition, distribution characteristics, and factors influencing the microplankton eukaryotic community [19,22]. In the Danjiangkou Reservoir, alterations in water quality and the related structure of the phytoplanktonic eukaryote community seem particularly important for studying temporal and spatial changes in sediment nutrients, heavy metal concentrations, and phytoplanktonic, macroscopic algal, bacterial and fungal taxa [8,23,24,25,26]. Many studies have shown that dissolved oxygen (DO), chlorophyll a (Chla), water temperature (WT), pH, and ammonia nitrogen (NH3-N) may be the main factors affecting planktonic eukaryotes [27,28,29,30]. However, the structural characteristics and driving factors of the planktonic eukaryotic community in the Danjiangkou Reservoir have rarely been studied.
By investigating the structure and composition of the eukaryotic plankton community and the physicochemical conditions in the Danjiangkou Reservoir, the community structure characteristics and driving factors of eukaryotic plankton at various sites and during different periods were clarified to provide a reference for studying these organisms and environmental variables in aquatic ecosystems.

2. Materials and Methods

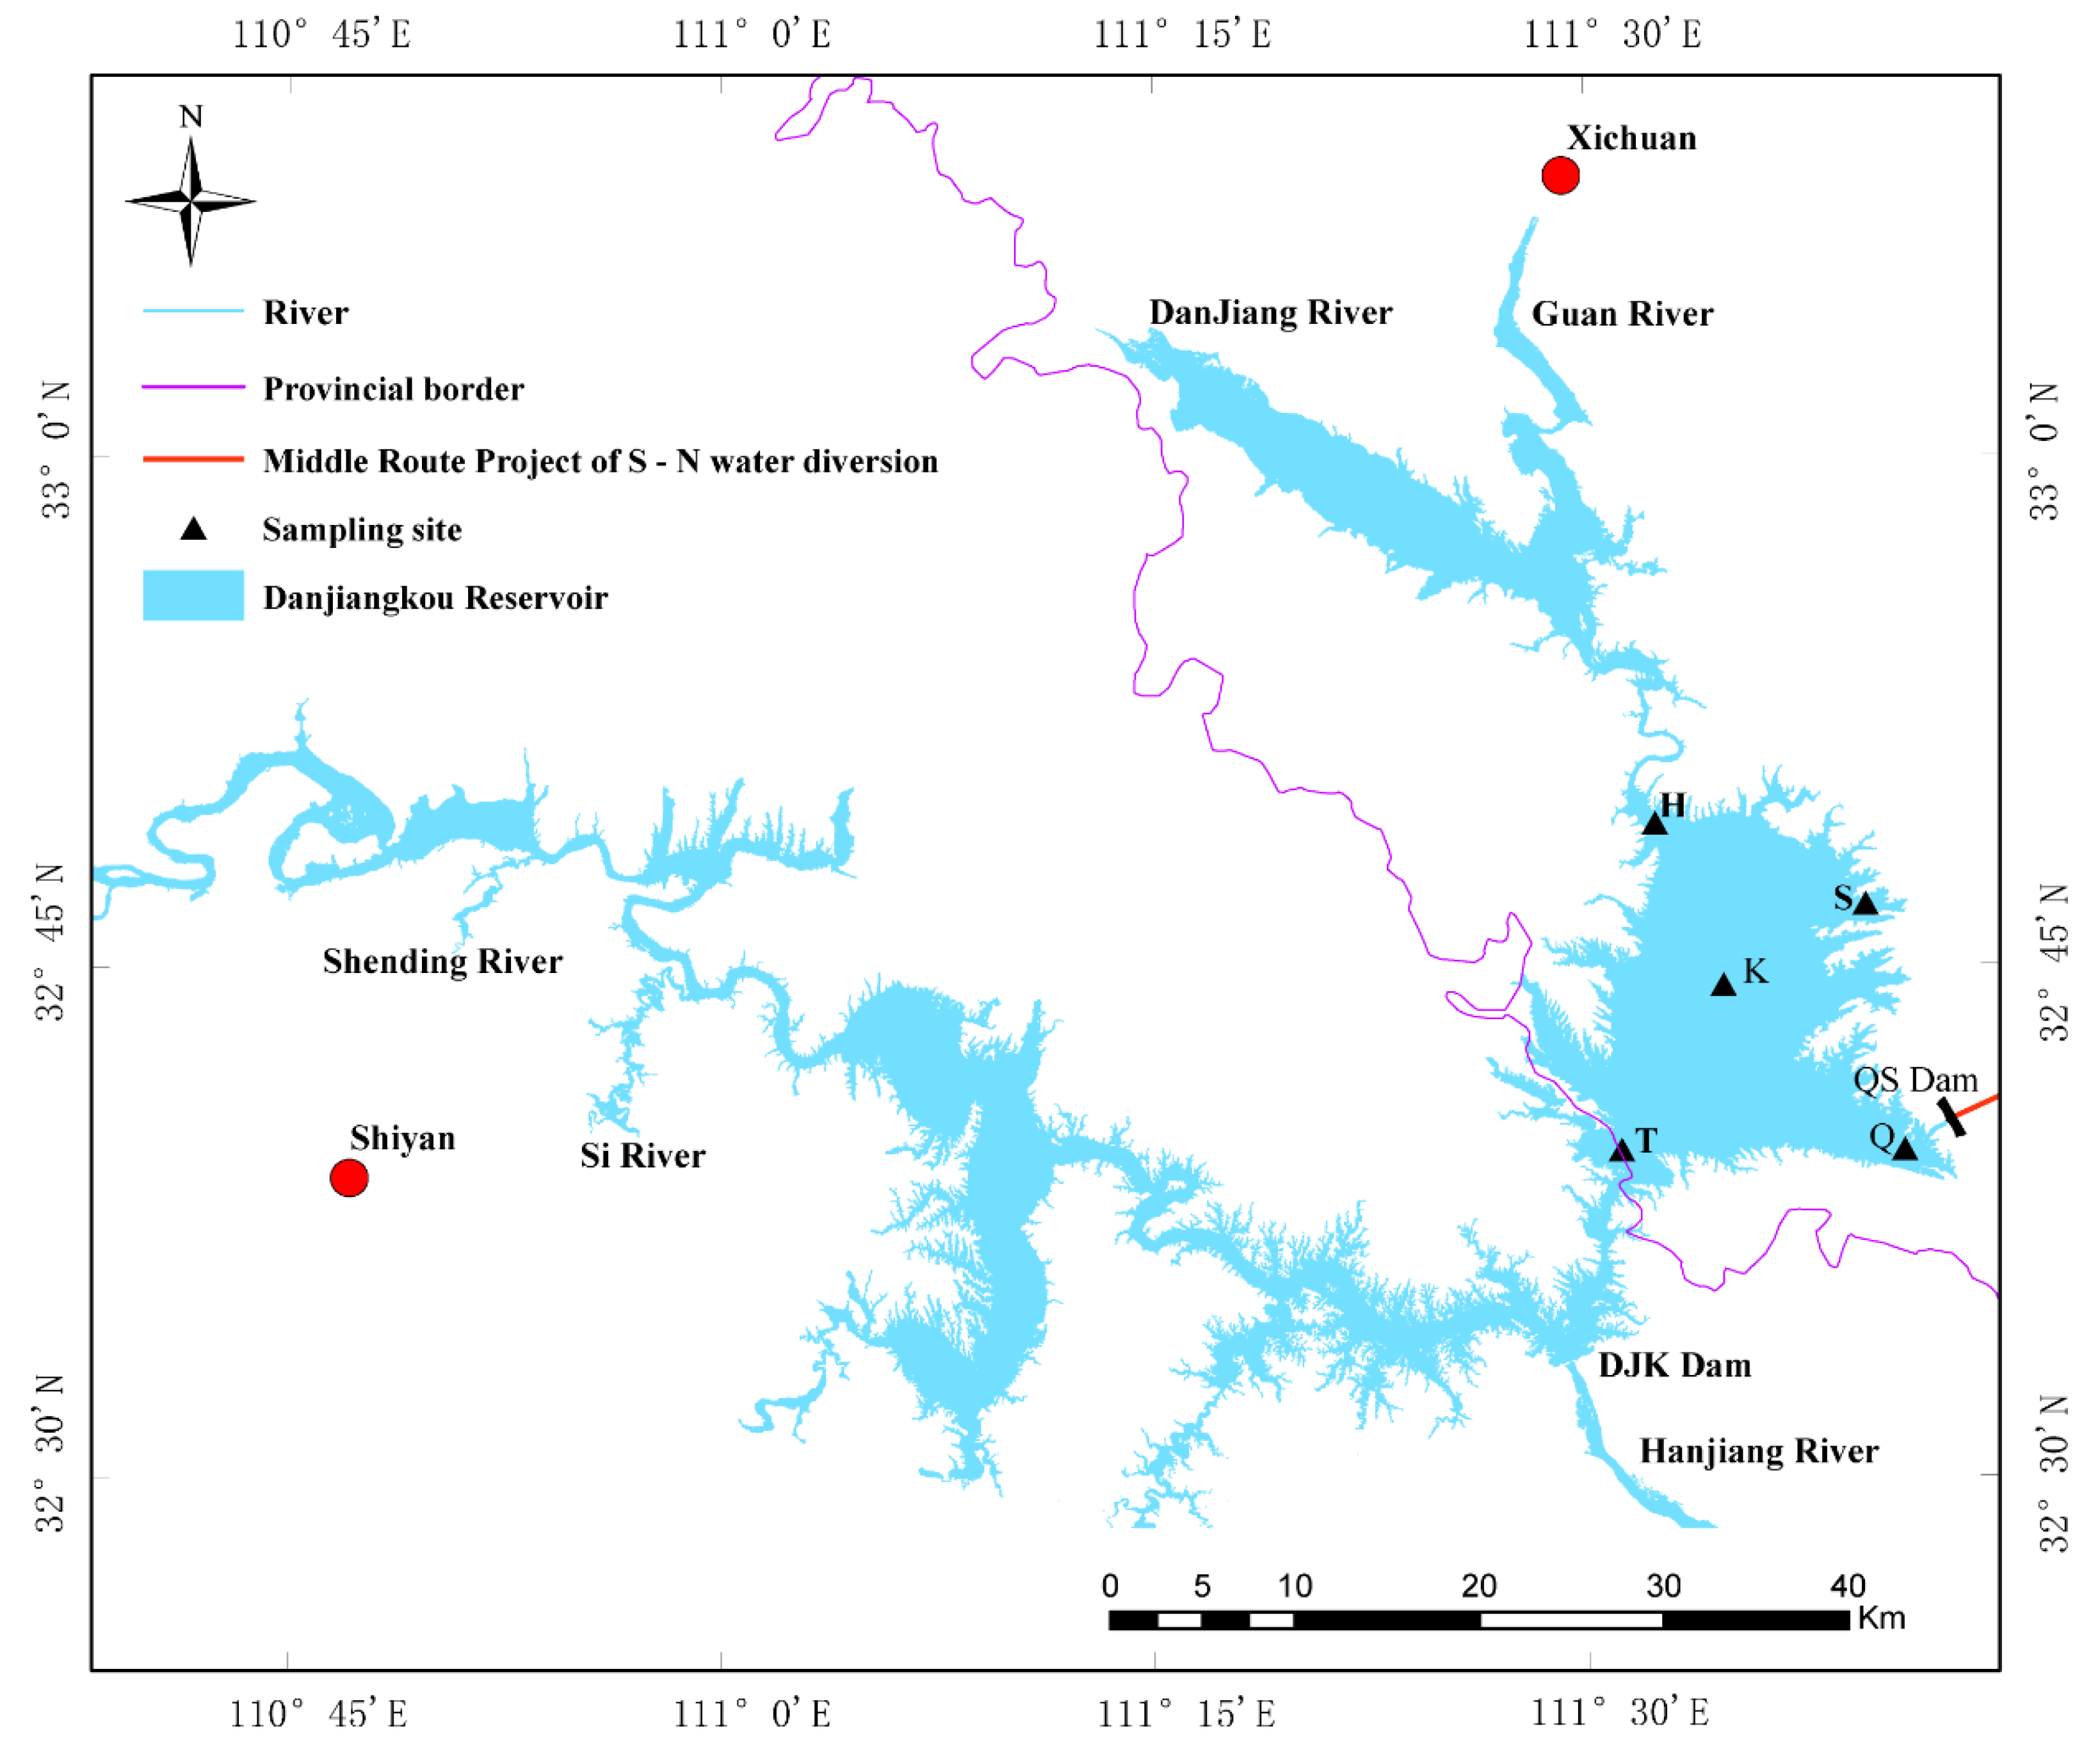
2.1. Sample Collection and Physicochemical Factor Determination in the Danjiangkou Reservoir

The Danjiangkou Reservoir, located in the upper and middle reaches of the Han River, is located in Danjiangkou city, Hubei Province and Xichuan County, Nanyang city, Henan Province, in China. Its waters span Hubei and Henan provinces. It is also the largest artificial freshwater lake in Asia. Many changes occur in the reservoir each spring: The reservoir capacity declines, the frequency of water exchange decreases, and as temperatures rise, most of the plankton begin to reproduce rapidly. According to the geographical characteristics of the Danjiangkou Reservoir [11], five sampling sites in the Henan area of the reservoir were selected for sampling in May 2017 and May 2018. Kuxin (K) is located in the center of the Danjiangkou Reservoir. Qushou (Q) is located 100 m upstream from the intake of the Mid-line Project of the South-to-North Diversion Project. Heijizui (H) is located at the confluence of the Guan River and Danjiang tributaries. Songgang (S) is located in a reservoir bay where fishing and pleasure boats are docked. Taizishan (T) is located at the junction of the Hubei and Henan provinces in the reservoir. Specific information on these sites is provided in Table 1 and Figure 1. Three sets of samples were simultaneously collected from each sampling site.
According to the methods described in the literature [31], the WT, pH, DO, and oxidation-reduction potential (ORP) at each sampling site were measured with a YSI 6920 sonde (YSI Inc., Yellow Springs, OH, USA), and the water level (Level) was measured according to GPS data in early May 2017 and early May 2018. At the same time, 5 L samples were collected from 0.5 m below the water surface with a stainless steel cylindrical water sampler. The samples were placed in a presterilized container and stored in an icebox for transport to the laboratory. From these samples, 1500 mL subsamples were removed and used to extract planktonic eukaryotic DNA. The remaining portions of the water samples were used to determine other variables, such as the total nitrogen (TN), nitrate nitrogen (NO3-N), NH3-N, total phosphorus (TP), and Chla contents, according to previously described methods.

2.2. Genomic DNA Extraction from Planktonic Eukaryotes

The water subsamples (1500 mL) were filtered with 0.22 µm sterile microporous membranes (Pall Life Sciences, Mumbai, India) for eukaryotic plankton collection. Each sample was used for three replicates. After filtration, the membrane was cut into pieces and placed in a 50 mL sterile centrifuge tube. The total DNA in the sample was extracted with the Omega Water DNA Kit (Omega Bio-Tek, Norcross, GA, USA). The extracted DNA was analyzed with a micro-ultraviolet spectrophotometer (NanoDrop ND-1000, Wilmington, DE, USA) to determine concentration and purity.

2.3. Eukaryotic PCR Amplification and High-Throughput Sequencing

The V4 region of the planktonic eukaryotic 18S rRNA gene was amplified using the general primers SSU0817F (5’-TTAGCATGGAATAATRRAATAGGA-3´) and 1196R (5´-TCTGGACCTGGTGAGTTTCC-3´) to obtain the target DNA sequences from the different samples. PCR was carried out using the TransGen AP221-02: TransStart FastPfu DNA Polymerase, 20 µL reaction system. The reaction conditions for PCR amplification were 95 °C, 3 min, 35× (95 °C, 30 s; 55 °C, 30 s; 72 °C, 45 s); 72 °C, 10 min, and 10 °C until stopped. The PCR amplification system included 5×FastPfu Buffer (4 μL), 2.5 mM dNTPs (2 μL), 5 μM forward primer (0.8 μL), 5 μM reverse primer (0.8 μL), FastPfu Polymerase (0.4 μL), BSA (0.2 μL), and DNA template (10 ng), with ddH2O added to attain a total volume of 20 μL. The PCR amplification products of the different samples were homogenized to a concentration of 10 nmol·L−1 and then mixed in the same volume, and the sequencing was completed by Shanghai Meiji Biomedical Technology Co., Ltd.

2.4. Analysis of Planktonic Eukaryote High-Throughput Data

MiSeq amplification was performed for the 18S V4 region, and the raw data obtained from the sequencing procedure were spliced and quality controlled, and chimeras were removed to obtain optimized sequences. Based on the comparison of the optimized sequences and the Silva 128/18S eukaryota database, OTU clustering was conducted, and an OTU abundance table was constructed for subsequent analysis. QIIME (Quantitative Insights into Microbial Ecology) was used for bioinformatics analysis. In accordance with sequence similarity, the RDP classifier algorithm was used for the taxonomic analysis of OTUs with a similarity level of 97% [32], and the community composition of each sample was evaluated at each classification level. The SILVA database was used to select OTUs with a similarity percentage of 97% to generate a dilution curve. In addition, mothur was used to calculate the Chao1, ACE, Simpson, Shannon, and coverage index values for alpha diversity analysis [33]. STAMP software was used to compare and analyze the differences in the phytoplankton eukaryotic community structure in the different samples (p < 0.05). UPGMA was used for phytoplankton eukaryotic community distribution and cluster analysis. Non-metric multidimensional scaling (NMDS) and correlation analyses were used to assess the community distribution and perform principal component and cluster analysis of the planktonic eukaryotes.

2.5. Analysis of Experimental Data

The analysis of the relationships between planktonic eukaryote community diversity and environmental factors and the one-way ANOVA of environmental factors among the different sampling sites were completed in SPSS 22.0 (p < 0.05). The relevant figures were drawn with Excel and Origin 9.0. Redundancy analysis (RDA) was completed in Canoco5. Network analysis was completed in Cytoscape v3.7.1. (taxonomic abundance ≥ 50, Spearman correlation coefficient > 0.5 and p < 0.05)

3. Results and Analysis

3.1. Analysis of Physicochemical Properties in the Danjiangkou Reservoir

The physicochemical variables were analyzed at five sites (K, Q, S, H, and T) in the Danjiangkou Reservoir in May 2017 and May 2018 according to the “surface water environment quality standard” (GB 3838-2002) (Table S1). It can be seen from Table 2 that the pH ranged between 6 and 9, conforming with the surface water environment quality standard. The DO values at all sites were in accordance with the annual type I surface water standard in 2017. Only the DO at site H corresponded with this standard in 2018, while the DO at the other sites in that year corresponded with the type II surface water standard. In addition, the average DO content in 2017 was higher than that in 2018, and the decrease in DO content in May 2018, shown in Table 1, may be related to the increase in WT during the same period. Except for 17S NH3-N, which met the Class II water standard, the other sampling points met the Class I water quality standard for NH3-N. This is basically consistent with the changing trend of the TN data, indicating that the Danjiangkou Reservoir has slightly high nitrogen nutrient levels. Although China’s national surface water assessment standards do not include a standard for TN, TN still represents a certain degree of ecological risk. Long-term monitoring showed that the water quality of the Danjiangkou Reservoir corresponded overall with the type II drinking water standard, consistent with previous results [34,35].

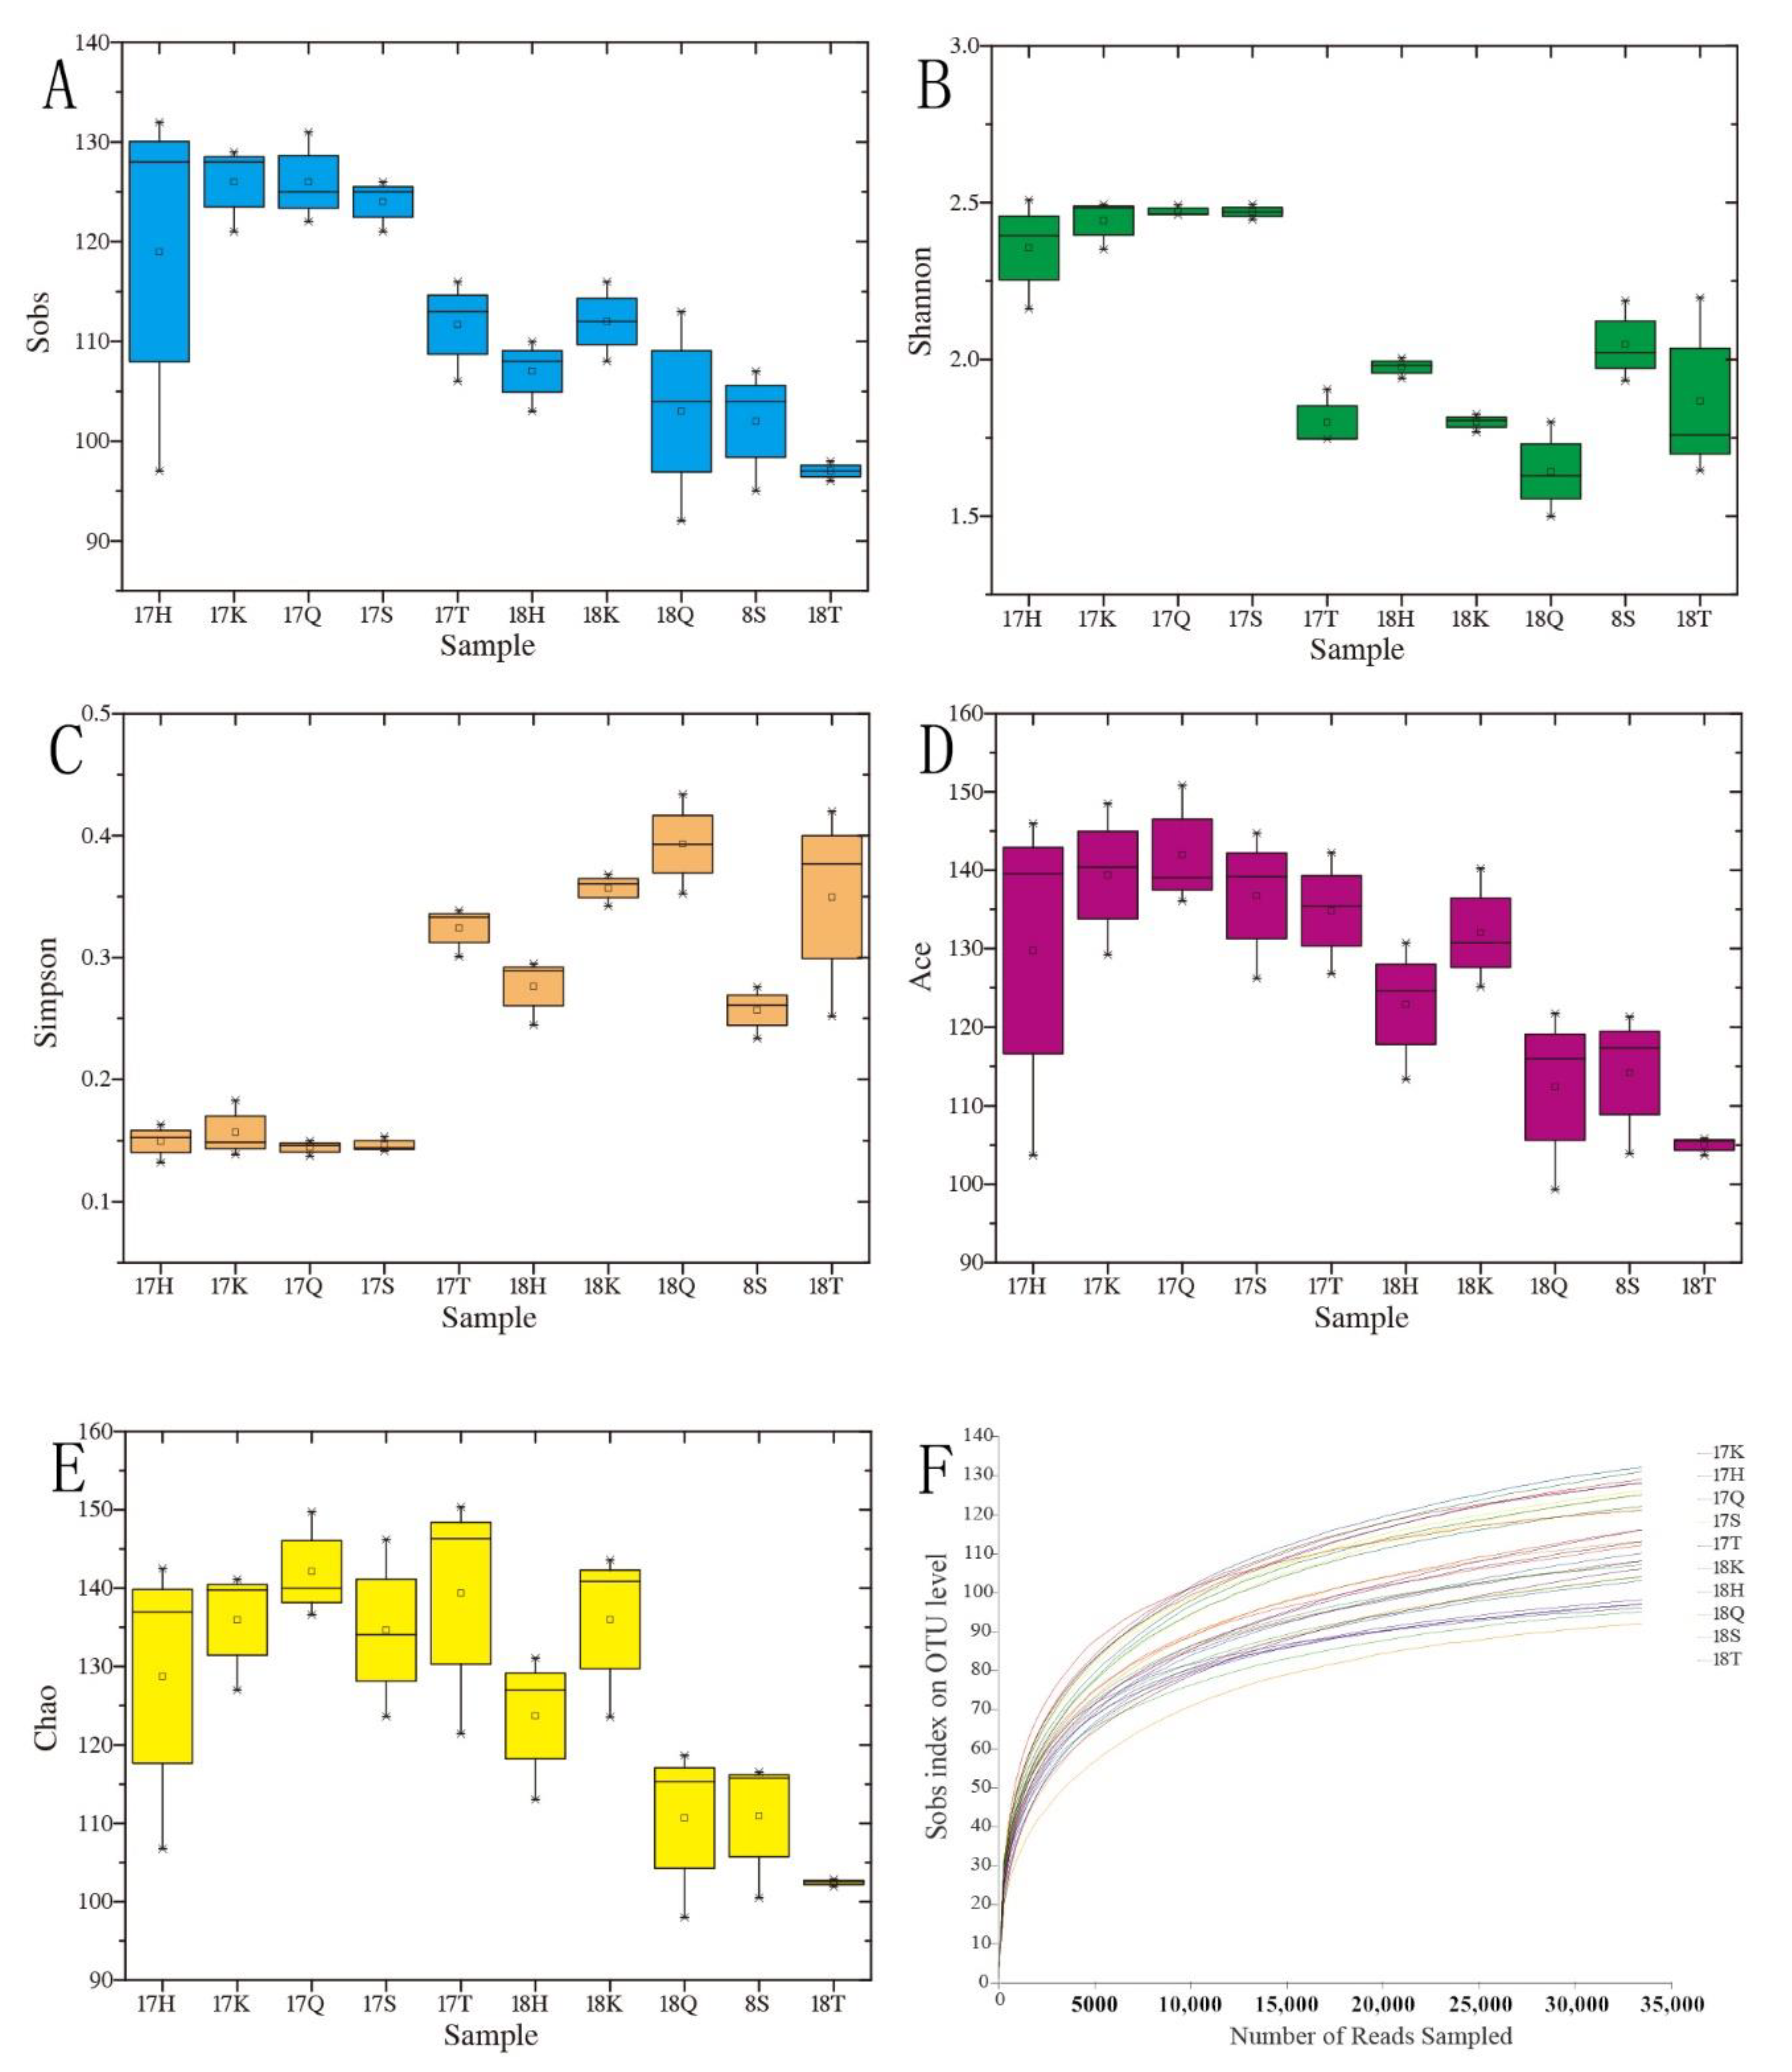
3.2. Analysis of the Alpha Diversity of Planktonic Eukaryotes

Over the two years of the study, 1,397,938 valid sequences were obtained from 30 samples, with an average length of 399 bp, and the average number of sequences after extraction was 33,508. The rarefaction curves of the different samples are shown (Figure 2F). When the number of sequencing reads reaches 15,000, the rarefaction curves gradually become stable, indicating that the sequencing data volume is adequate, and that the taxa richness is sufficiently high to cover all groups.
The abundance and diversity of the planktonic eukaryotes in the Danjiangkou Reservoir were evaluated, and the results show that community abundance and diversity were highest in different years and at different sampling sites. Figure 2A–E shows that the Shannon, Sobs, and Ace index values at all sampling sites in 2017 were greater than those in 2018, while the values of the Simpson index in 2017 were less than those in 2018, indicating that the community richness of the Danjiangkou Reservoir in 2017 was greater than that in 2018. The community abundance and diversity index values at the different sampling sites showed the order of Q > K, S > H and T in 2017, and K > H > S > Q > T in 2018. This result indicates the spatiotemporal heterogeneity in the planktonic eukaryote community structure (Figure 2A–E).

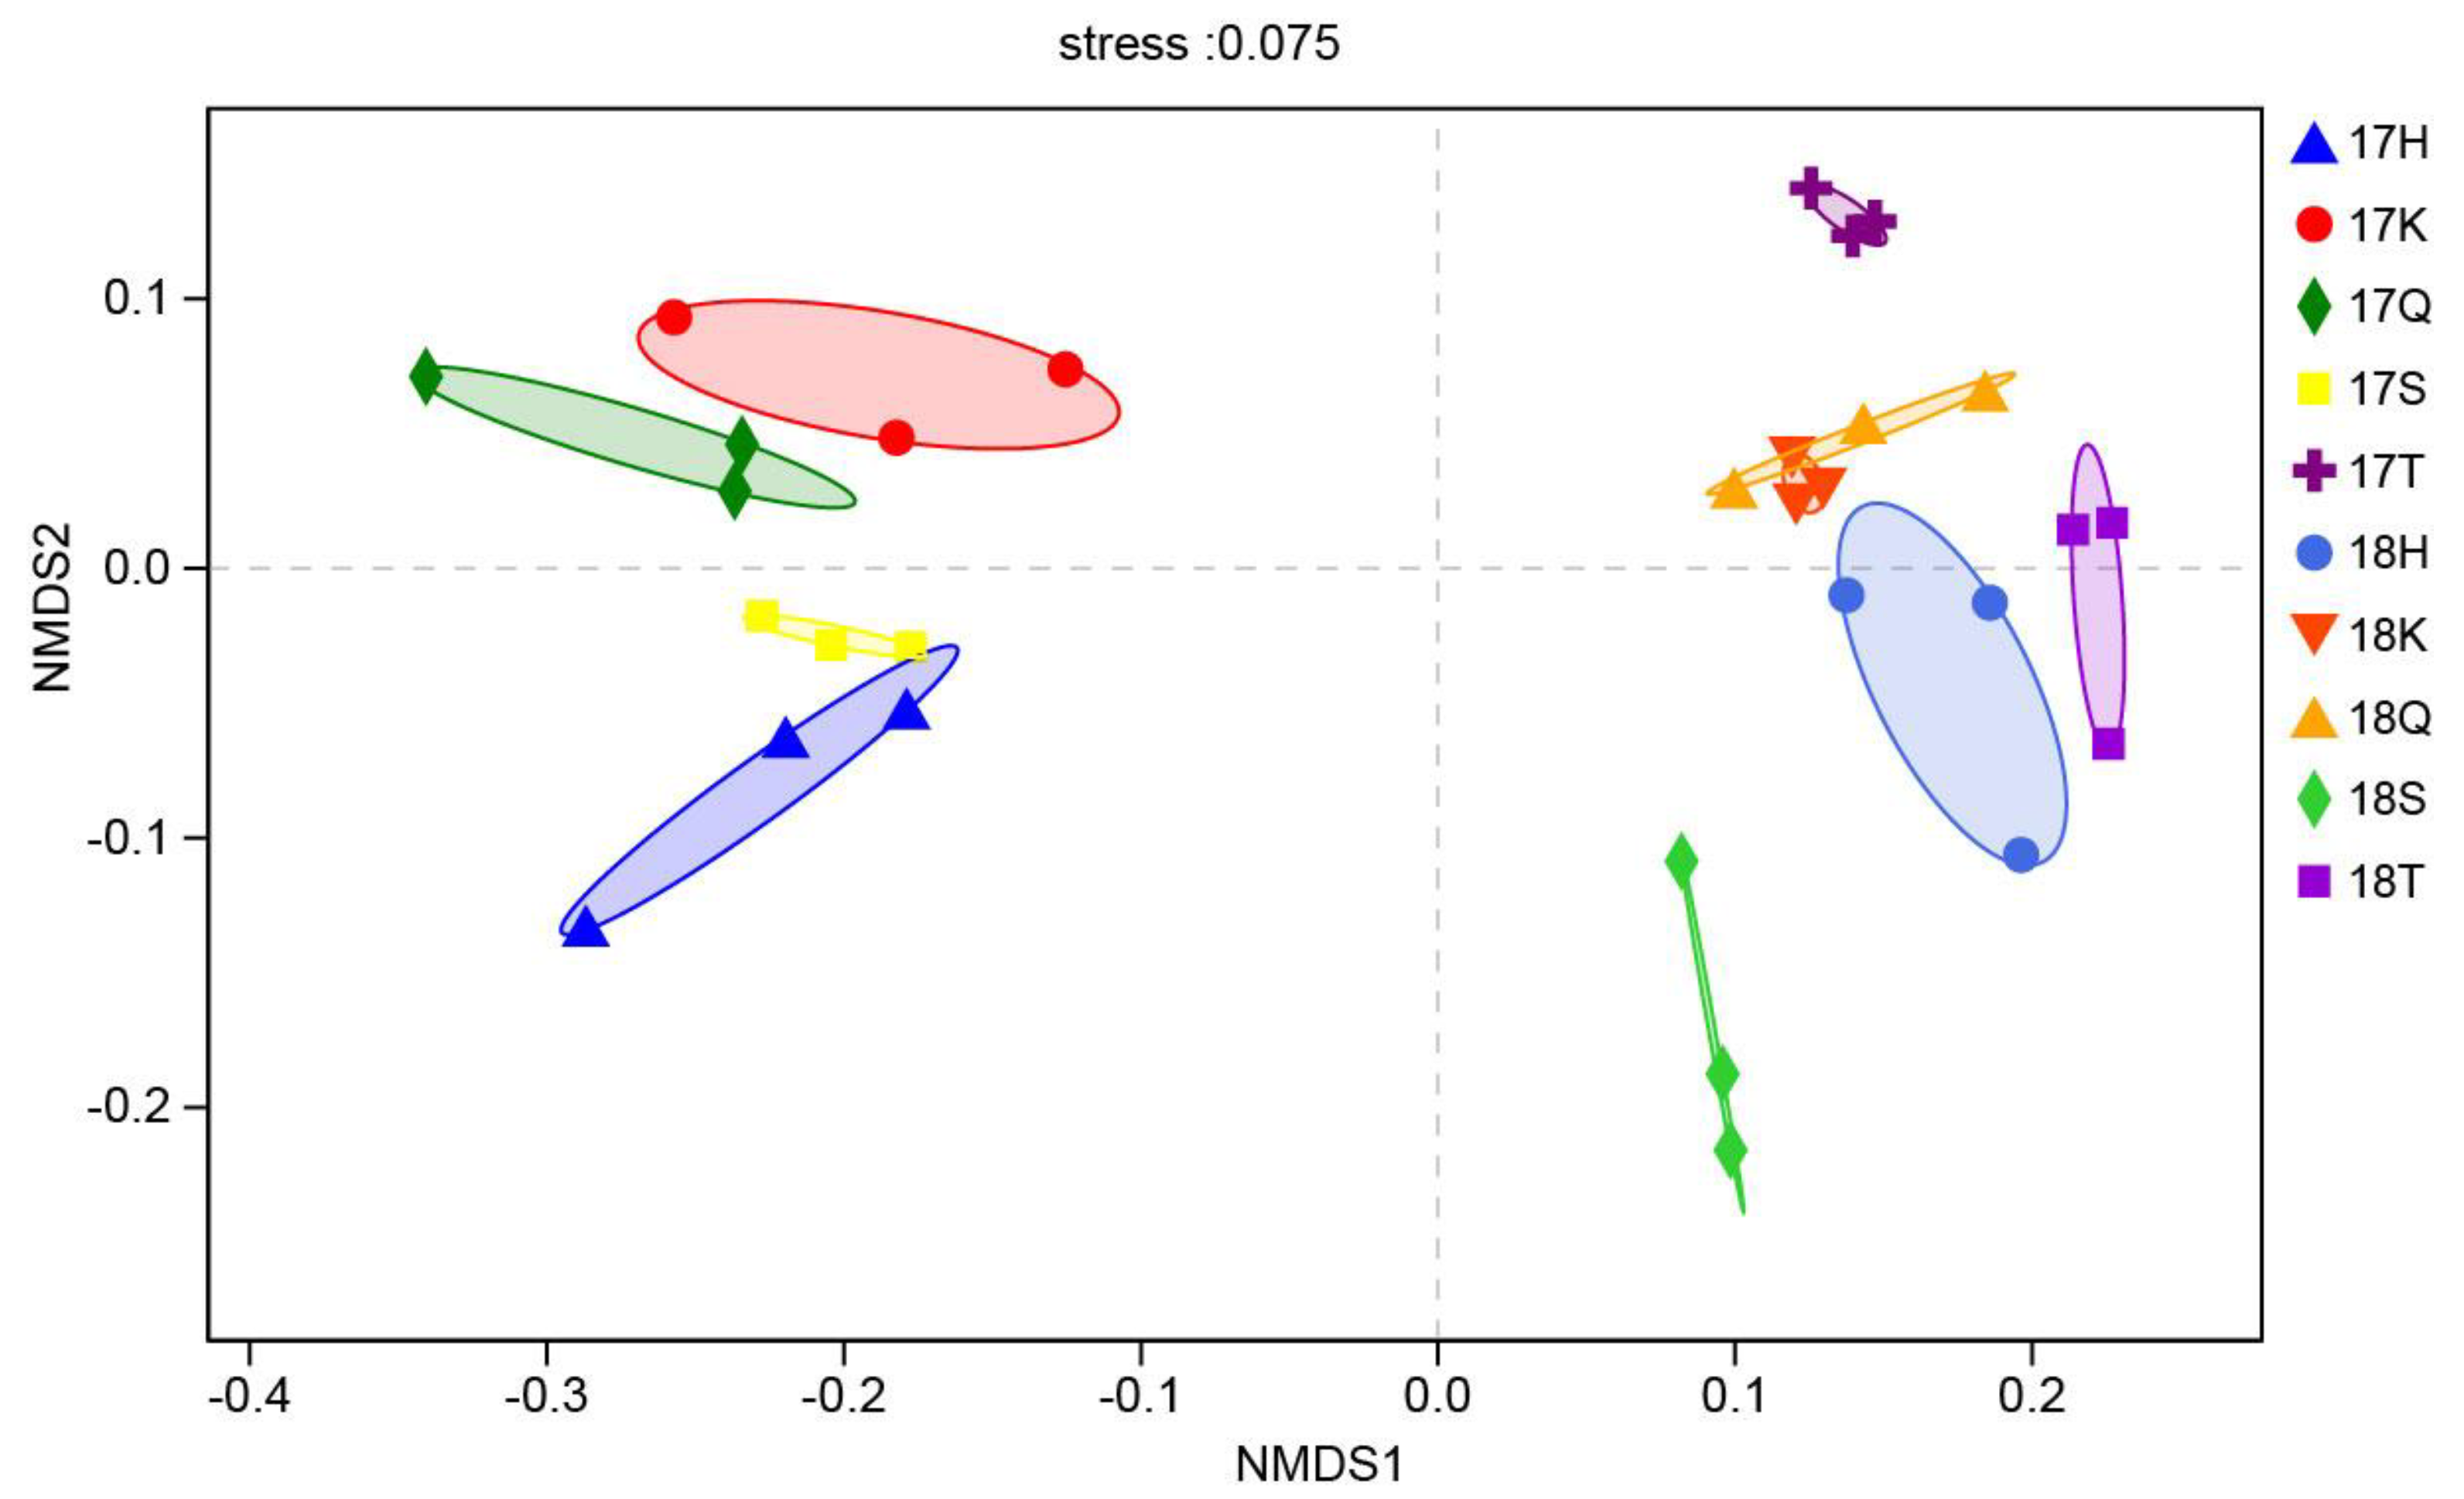
3.3. Analysis of the Beta Diversity of Planktonic Eukaryotes

The NMDS analysis of the Bray-Curtis distance matrix of all samples (Figure 3) shows that the samples could be divided into two distinct clusters, which can be observed on the left and right sides of the plot. The samples from each site can be clustered together with good similarity. The samples collected from all sites except for T were divided into groups representing 2017 and 2018, indicating that the taxonomic composition in each year was relatively similar. However, there were some differences in taxonomic composition at the various sites between the two years. In 2017, Q, S, H, and K were the most similar, while the community composition at T was slightly less similar to that in the other samples. In 2018, the community composition at Q, H, K, and T was the most similar to that at site S. The similarity in taxonomic composition at site T in the two years was clearly higher than that at the other sites, which may be related to its location. T is located at the junction of Dan Reservoir in Henan Province and Han Reservoir in Hubei Province. A large amount of water flows from Hubei to the Danjiangkou Reservoir in Henan Province, and this stable runoff causes stability in community composition at site T.

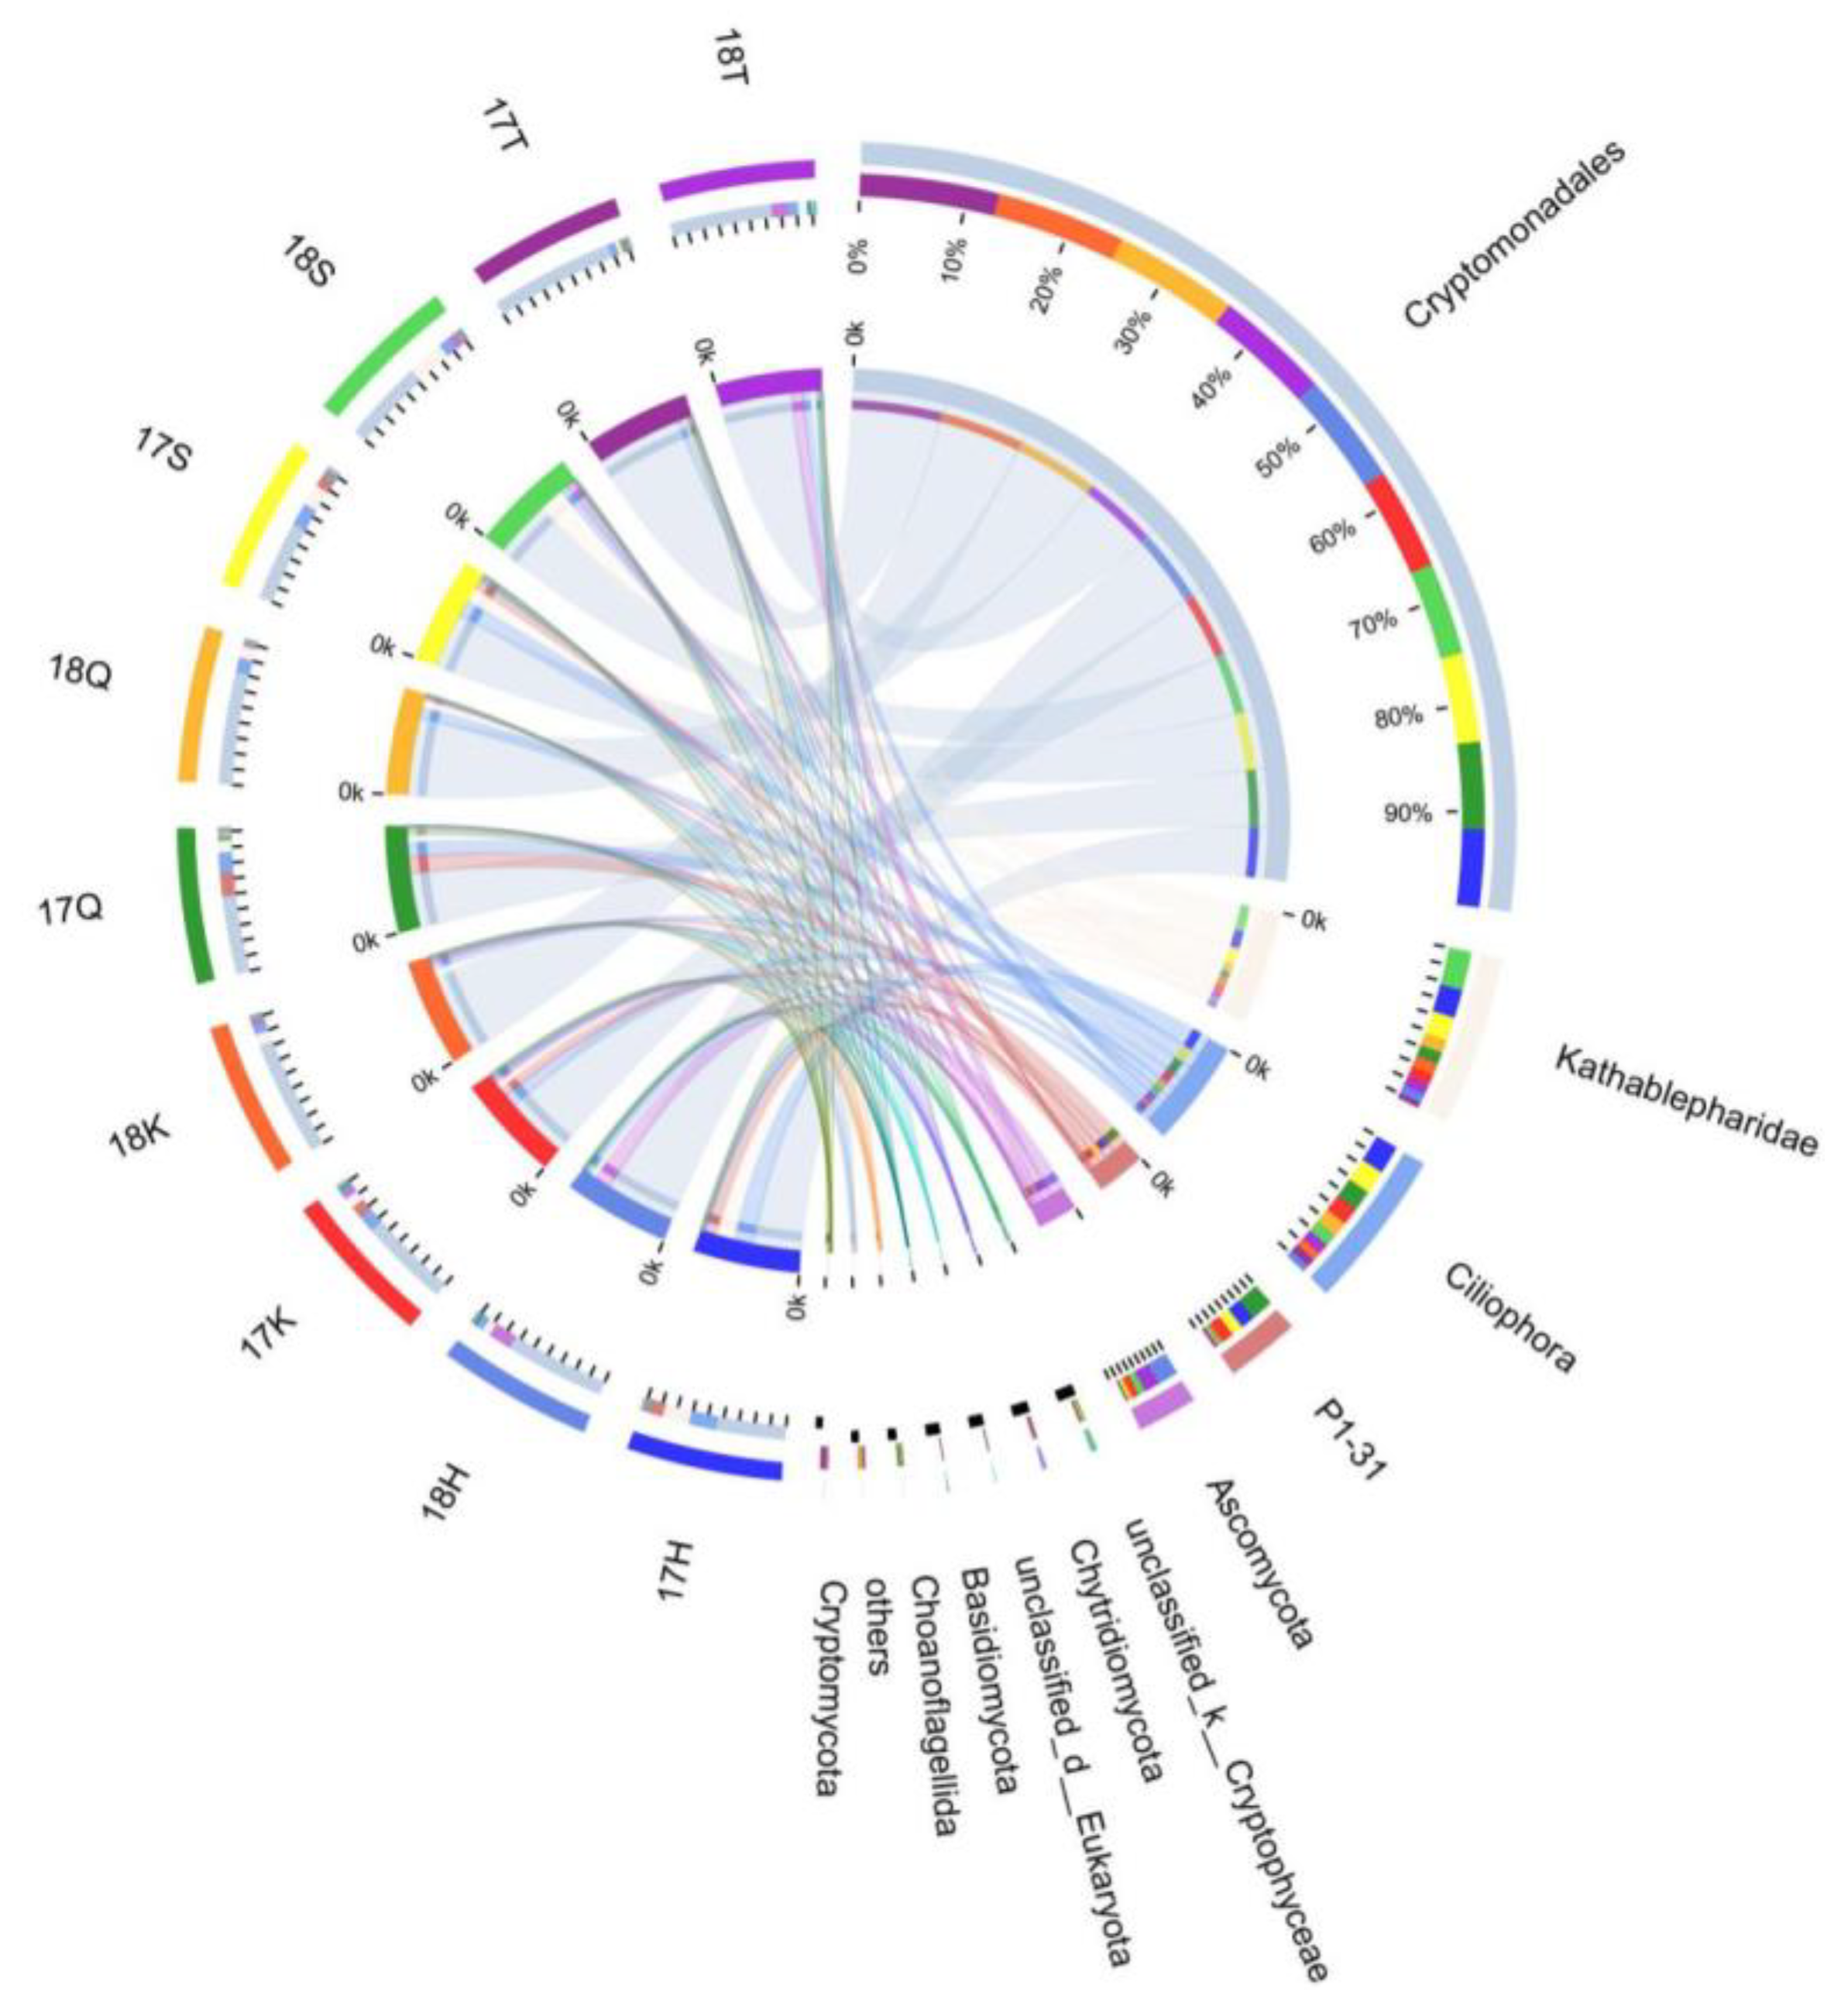
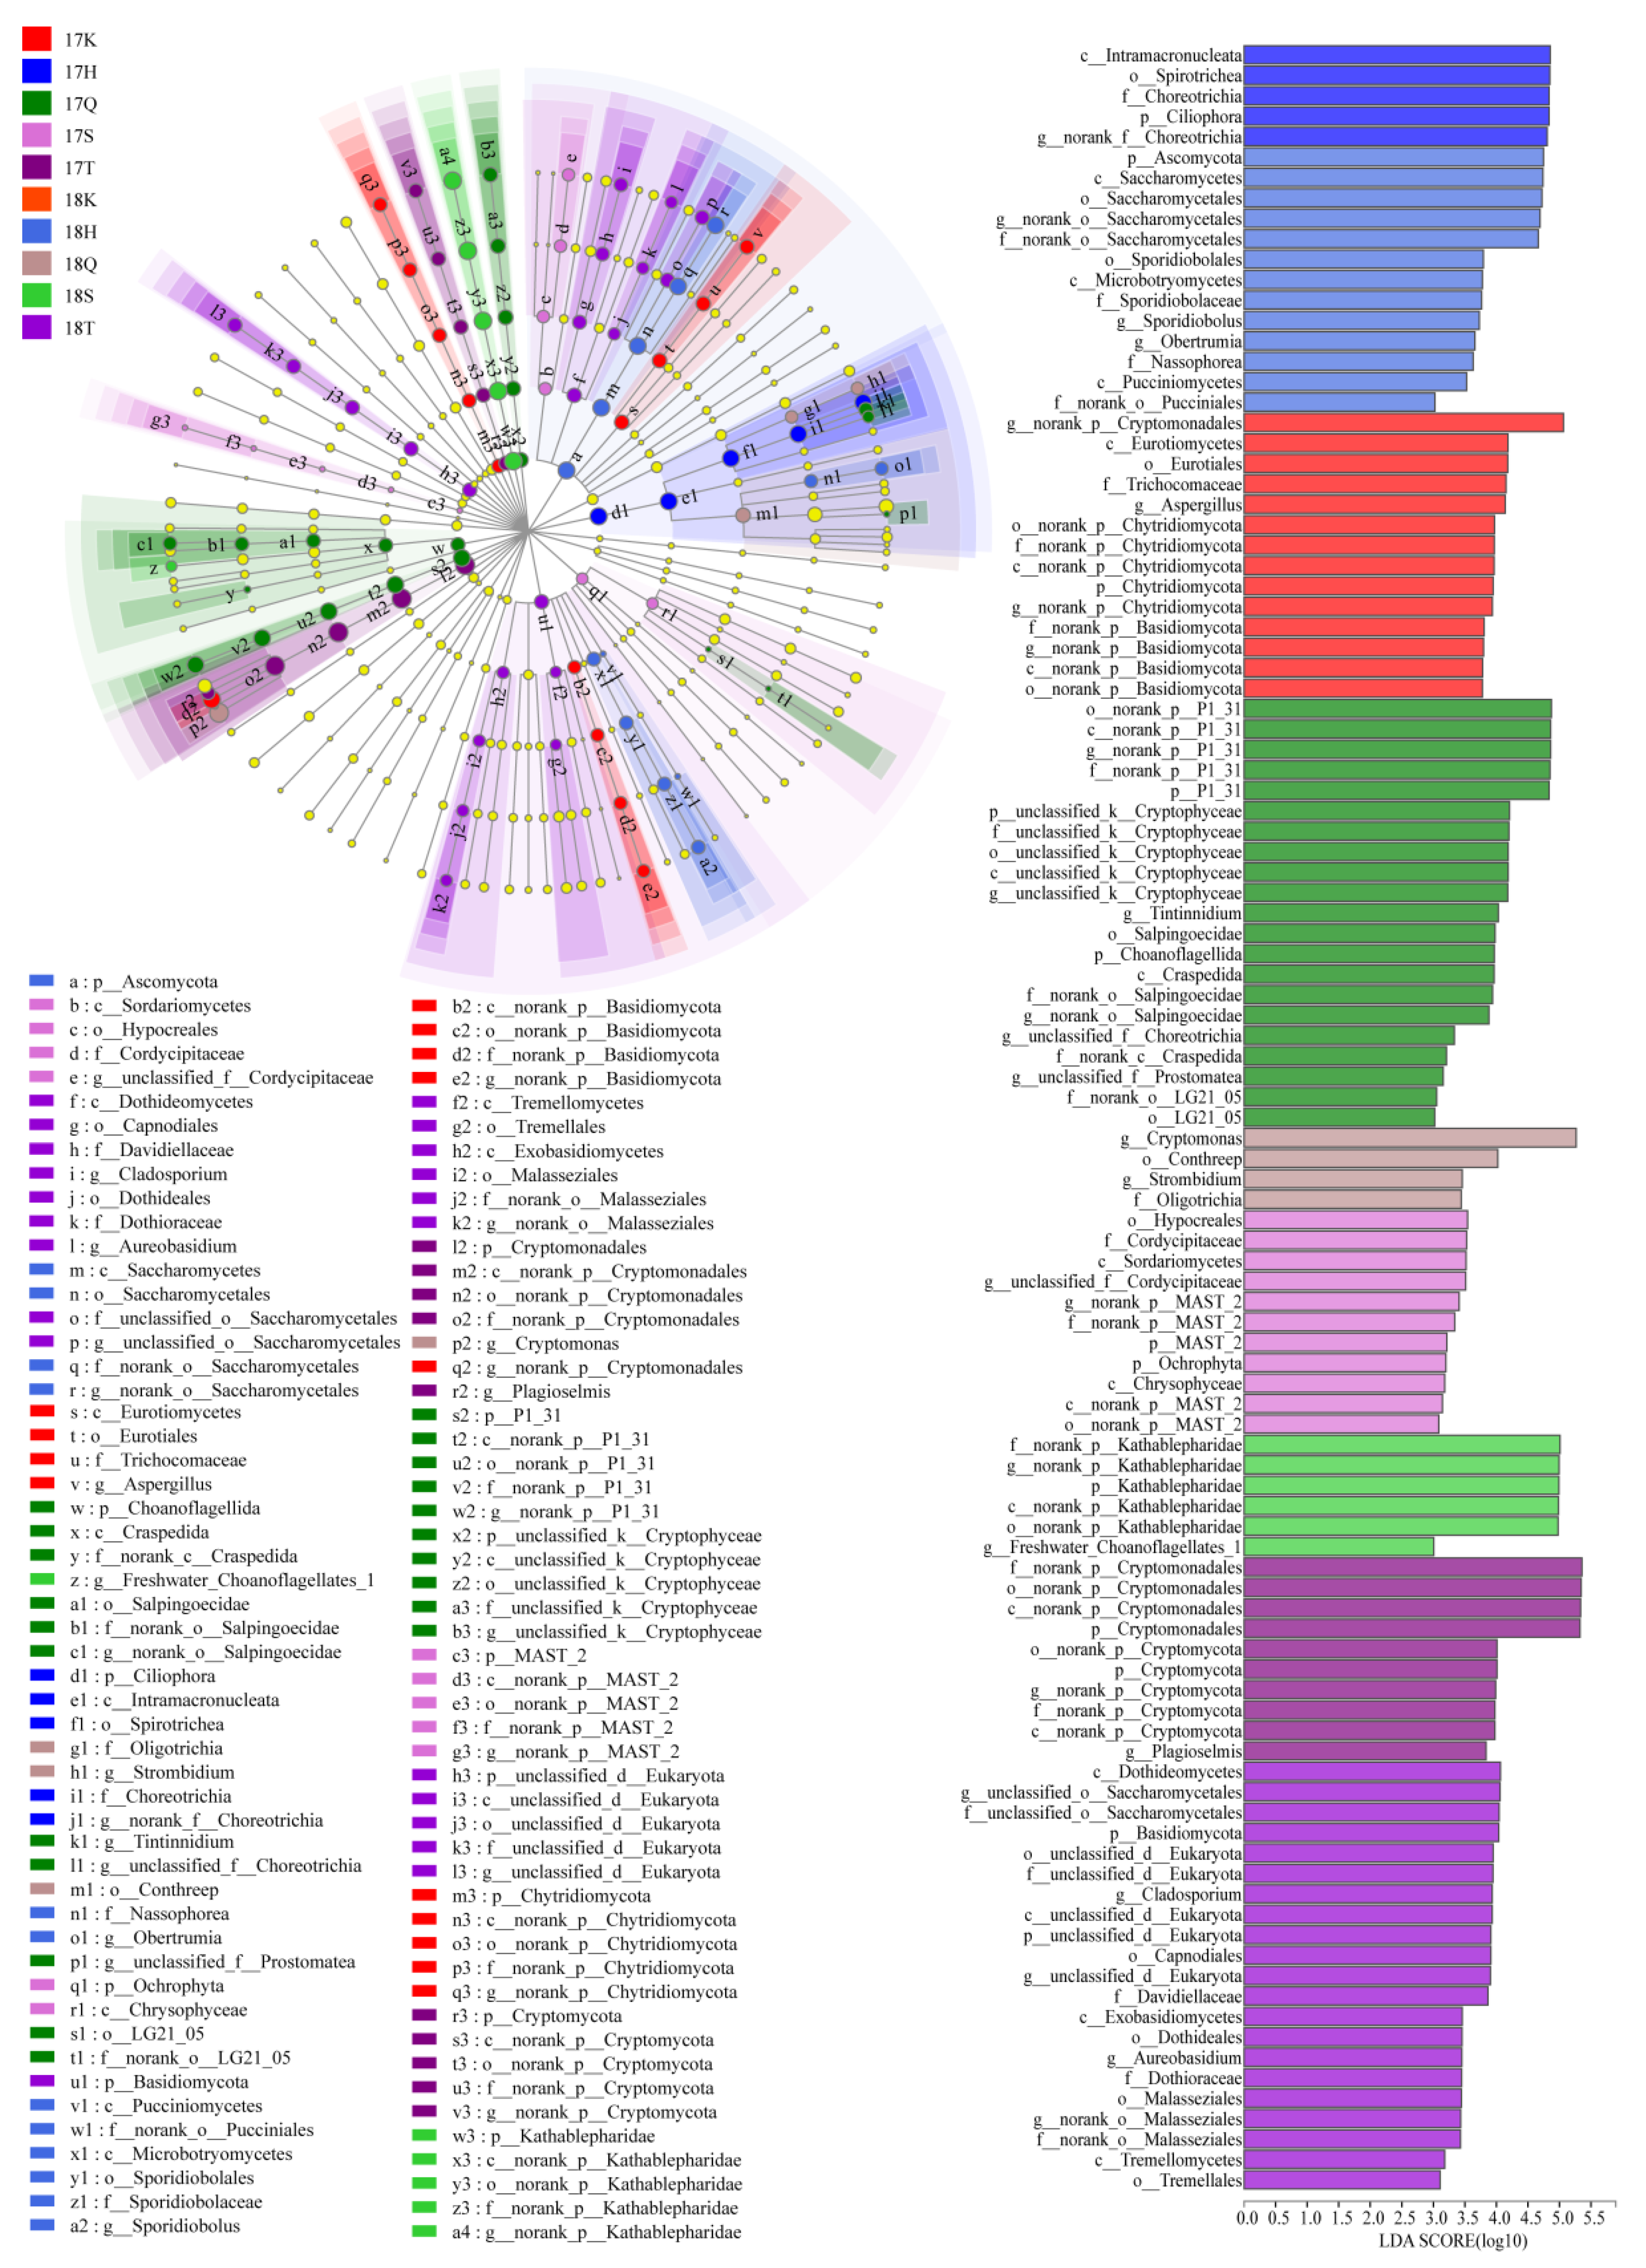
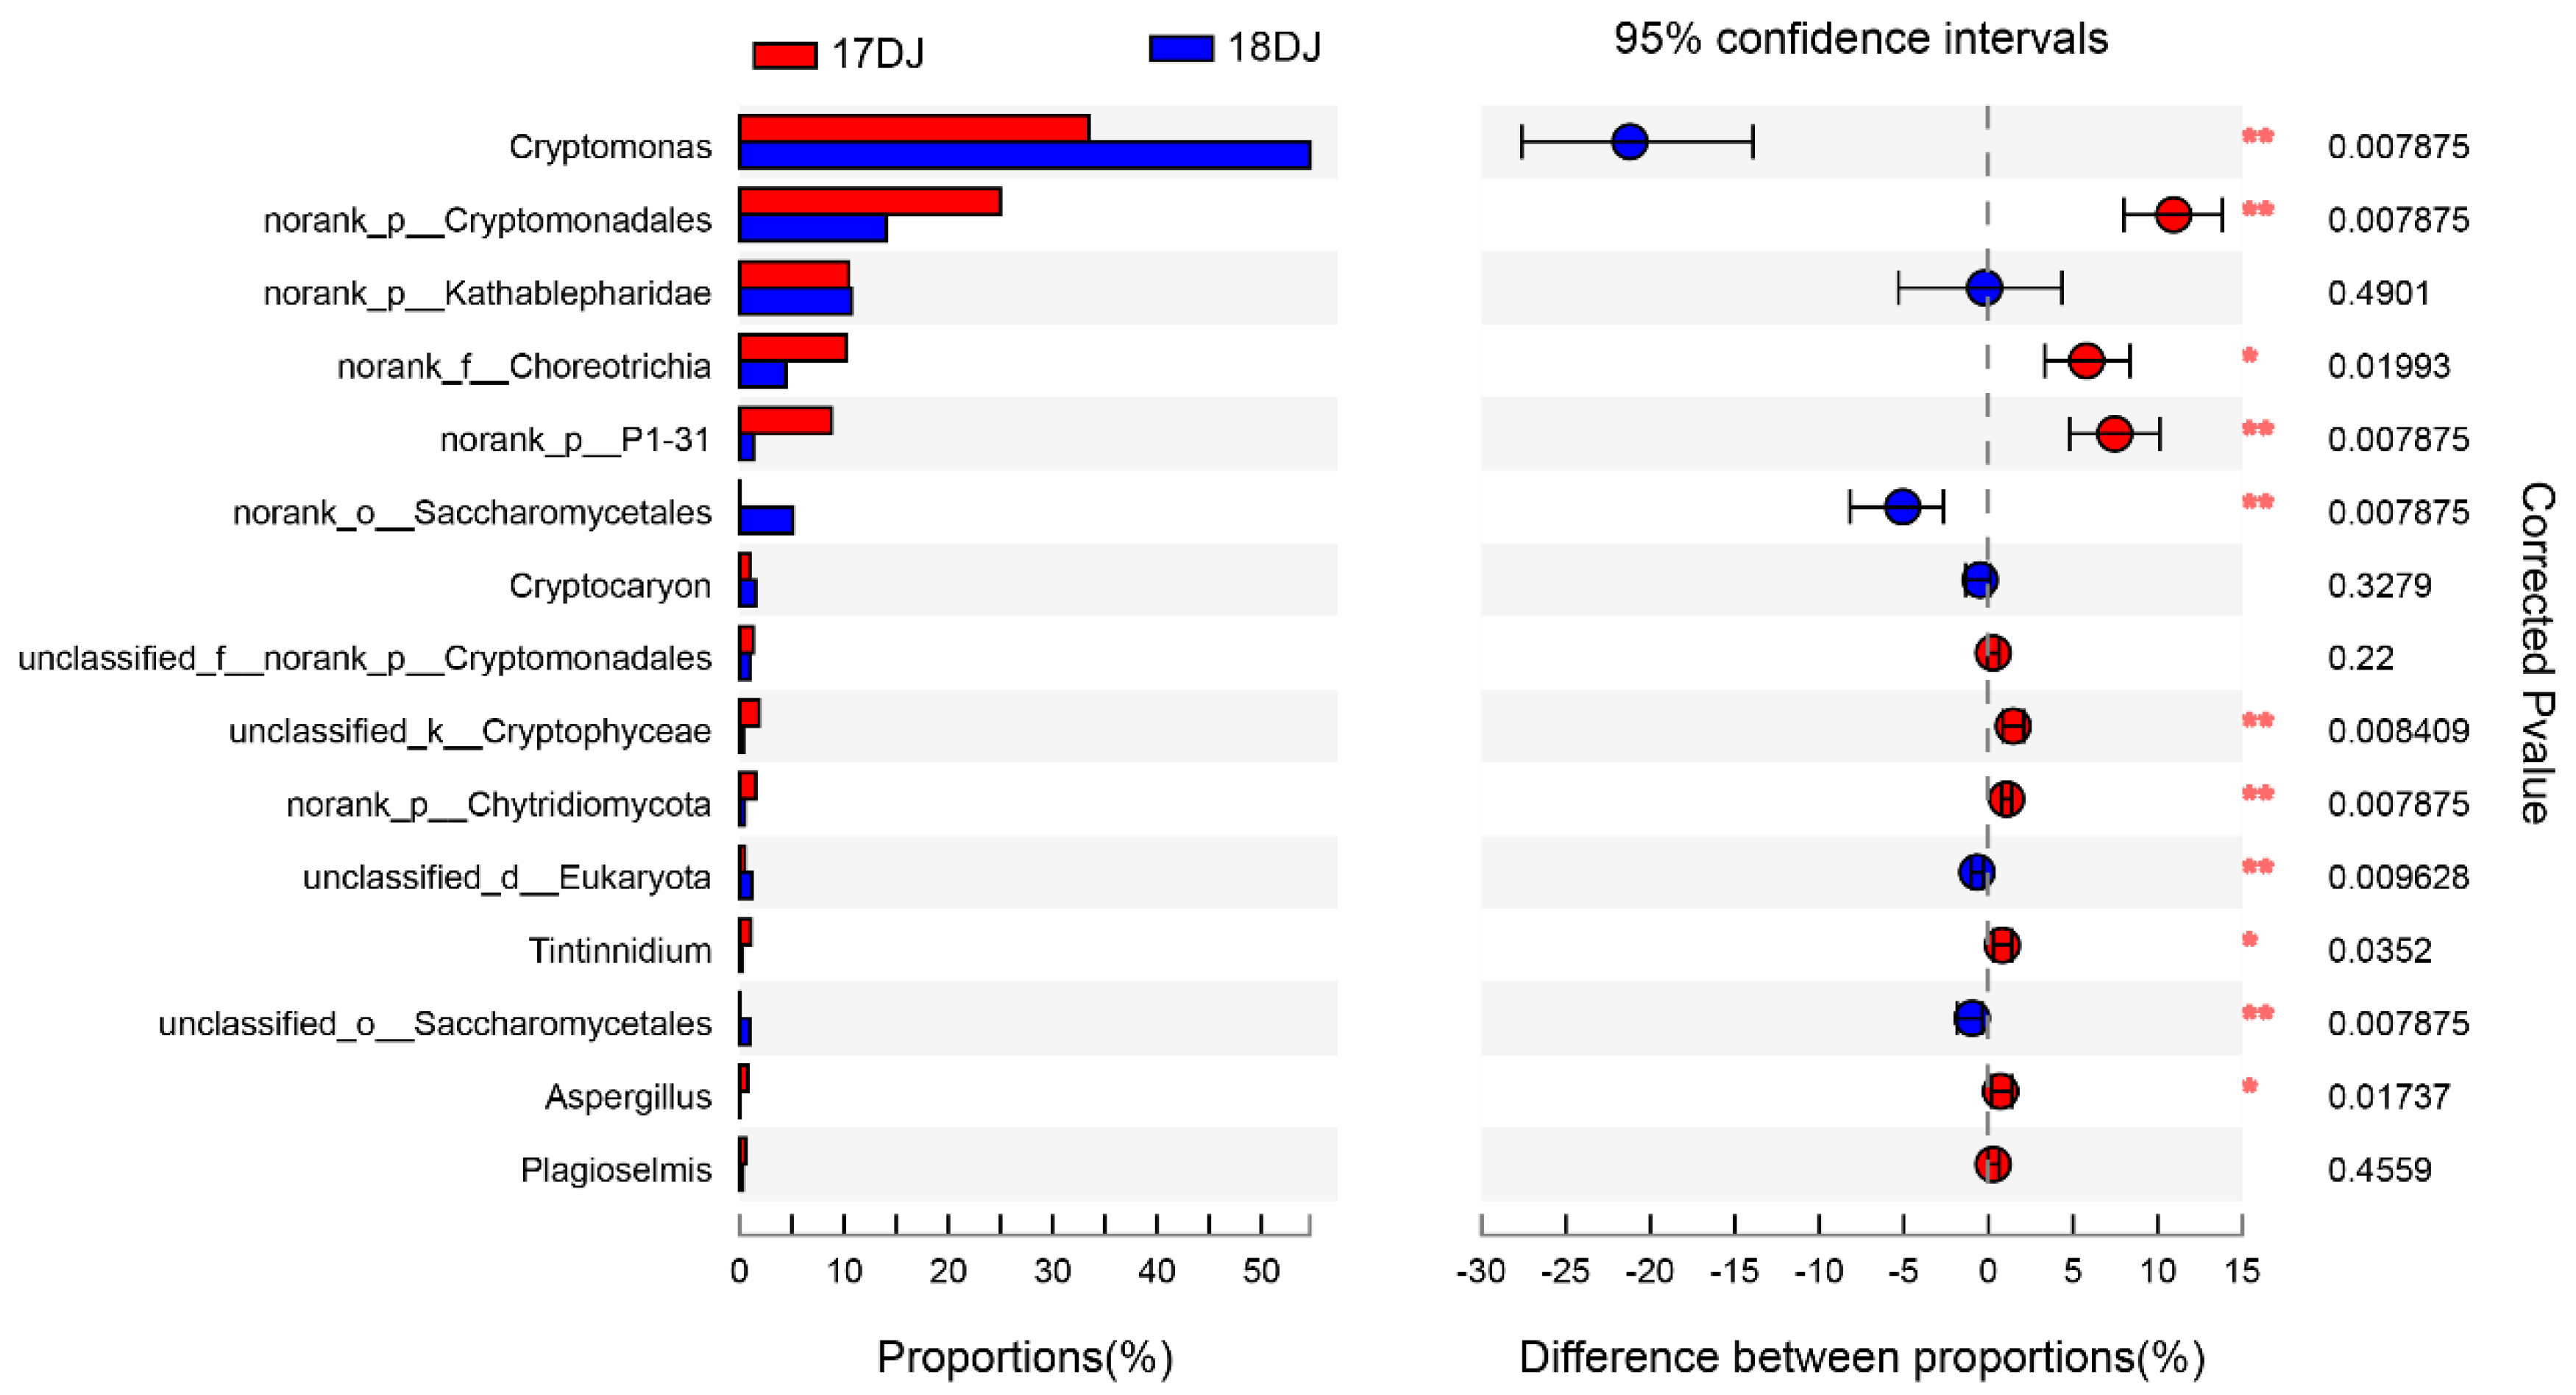
3.4. Taxonomic Composition and Analysis of the Differences in Planktonic Eukaryotes

Analysis of the Circos diagram of planktonic eukaryotic community composition at the phylum level (Figure 4) revealed that the planktonic eukaryotic taxa in all the samples consisted of Cryptomonadales, Kathablepharidae, Ciliophora, P1-31, Ascomycota, Chytridiomycota, Basidiomycota, Choanoflagellida, Cryptomycota, unclassified Cryptophyceae and unclassified Eukaryota. The average content of Cryptomonadales in all samples was as high as 65.19%, with the content of this taxon at 17T reaching 84.90%. The content of this taxon was lowest at site 17H but still reached 47.2% of the total, indicating that Cryptomonadales is the dominant taxon in the Danjiangkou Reservoir. The content of Cryptomonadales at a single sampling site in 2018 was significantly higher than that in 2017. The content of Kathablepharidae was the highest at 18S and the lowest at 17T. The interannual change in Kathablepharidae at sites K and Q was not significant, but the content of this taxon showed a significant decrease at H and a significant increase at S. The interannual change in Ciliophora was the largest at H, and the percentage of this taxon in all samples decreased from 18.71% in 2017 to 4.82% in 2018. In addition, its content slightly increased at T and decreased at Q, S, and K. In addition to the increase in the content of Ascomycota and unclassified Eukaryota at some sampling sites in 2018 compared with that in the previous year, the percentages of P1-31, Chytridiomycota, and unclassified Cryptophyceae were significantly lower in 2018 than in 2017.
Linear discriminant analysis (LDA) effect size (LEfSe) can be used to determine the differences in all samples from the phylum to genus levels. LEfSe first uses the non-parametric factorial Kruskal-Wallis (KW) sum-rank test to detect the characteristics of significant differences in abundance and finds taxa that exhibit significant differences in abundance. Finally, LEfSe uses LDA to estimate the impact of the abundance of each component (taxon) on the difference. The taxa with LDA values greater than or equal to 3 are shown on the right side of Figure 5. The LDA histogram shows that there are significant differences among planktonic eukaryotes in 13 phyla, 20 classes, 23 orders, 26 families, and 27 genera from samples taken in the Danjiangkou Reservoir in spring. For the samples collected in May 2017, at the genus level, significant differences were observed for Aspergillus at site K, Tintinnidium at site Q, and Plagioselmis at site T. At the phylum level, significant differences were observed for Ciliophora at site H, Basidiomycota, and Chytridiomycota at site K, Choanoflagellida, P1-31, and unclassified Cryptophyceae at site Q, Ochrophyta and MAST-2 at site S, and Cryptomonadales and Cryptomycota at site T. For the May 2018 samples, significant differences were observed at the genus level for Obertrumia and Sporidiobolus at site H, Strombidium and Cryptomonas at site Q, freshwater Choanoflagellates-1 at site S, and Cladosporium and Aureobasidium at site T. At the phylum level, significant differences were observed for Ascomycota at site H, Kathablepharidae at site S, and Basidiomycota and unclassified Eukaryota at site T. Information on the differences for other taxa of planktonic eukaryotes are shown in Figure 5.
To observe the interannual variation in the eukaryotic plankton community structure, the samples from the two years were divided into two groups (DJ17 and DJ18). The Wilcoxon signed-rank test was adopted in this study, and false discovery rate (FDR) multiple-check adjusted p values (p < 0.05) were used to detect differences in richness between the two groups. Hypothesis tests were performed to assess the observed differences, with the organisms arranged in order of abundance from top to bottom at the genus level (Figure 6). Cryptomonas of Cryptomonadales, norank_o_Saccharomycetales of Ascomycota, unclassified_d_Eukaryota of Ascomycota, unclassified_d_Eukaryota of unclassified Eukaryota, and unclassified_o__Saccharomycetales of Ascomycota were significantly higher in abundance than in 2017 (p < 0.05). Among them, the content of Cryptomonas, with the highest abundance in 2018, was still significantly higher than that in 2017 (p < 0.01). The contents of norank_p_Cryptomonadales of Cryptomonadales, norank_f_Choreotrichia of Ciliophora, norank_p_P1-31 of P1-31, unclassified_k_Cryptophyceae of unclassified Cryptophyceae, norank_p_Chytridiomycota of Chytridiomycota, Tintinnidium of Alveolata, and Aspergillus of Ascomycota decreased significantly in 2018. The contents of norank_p_Cryptomonadales of Cryptomonadales, norank_p_P1-31 of P1-31, unclassified_k_Cryptophyceae of unclassified Cryptophyceae and norank_p_Chytridiomycota of Chytridiomycota also decreased significantly (p < 0.01).

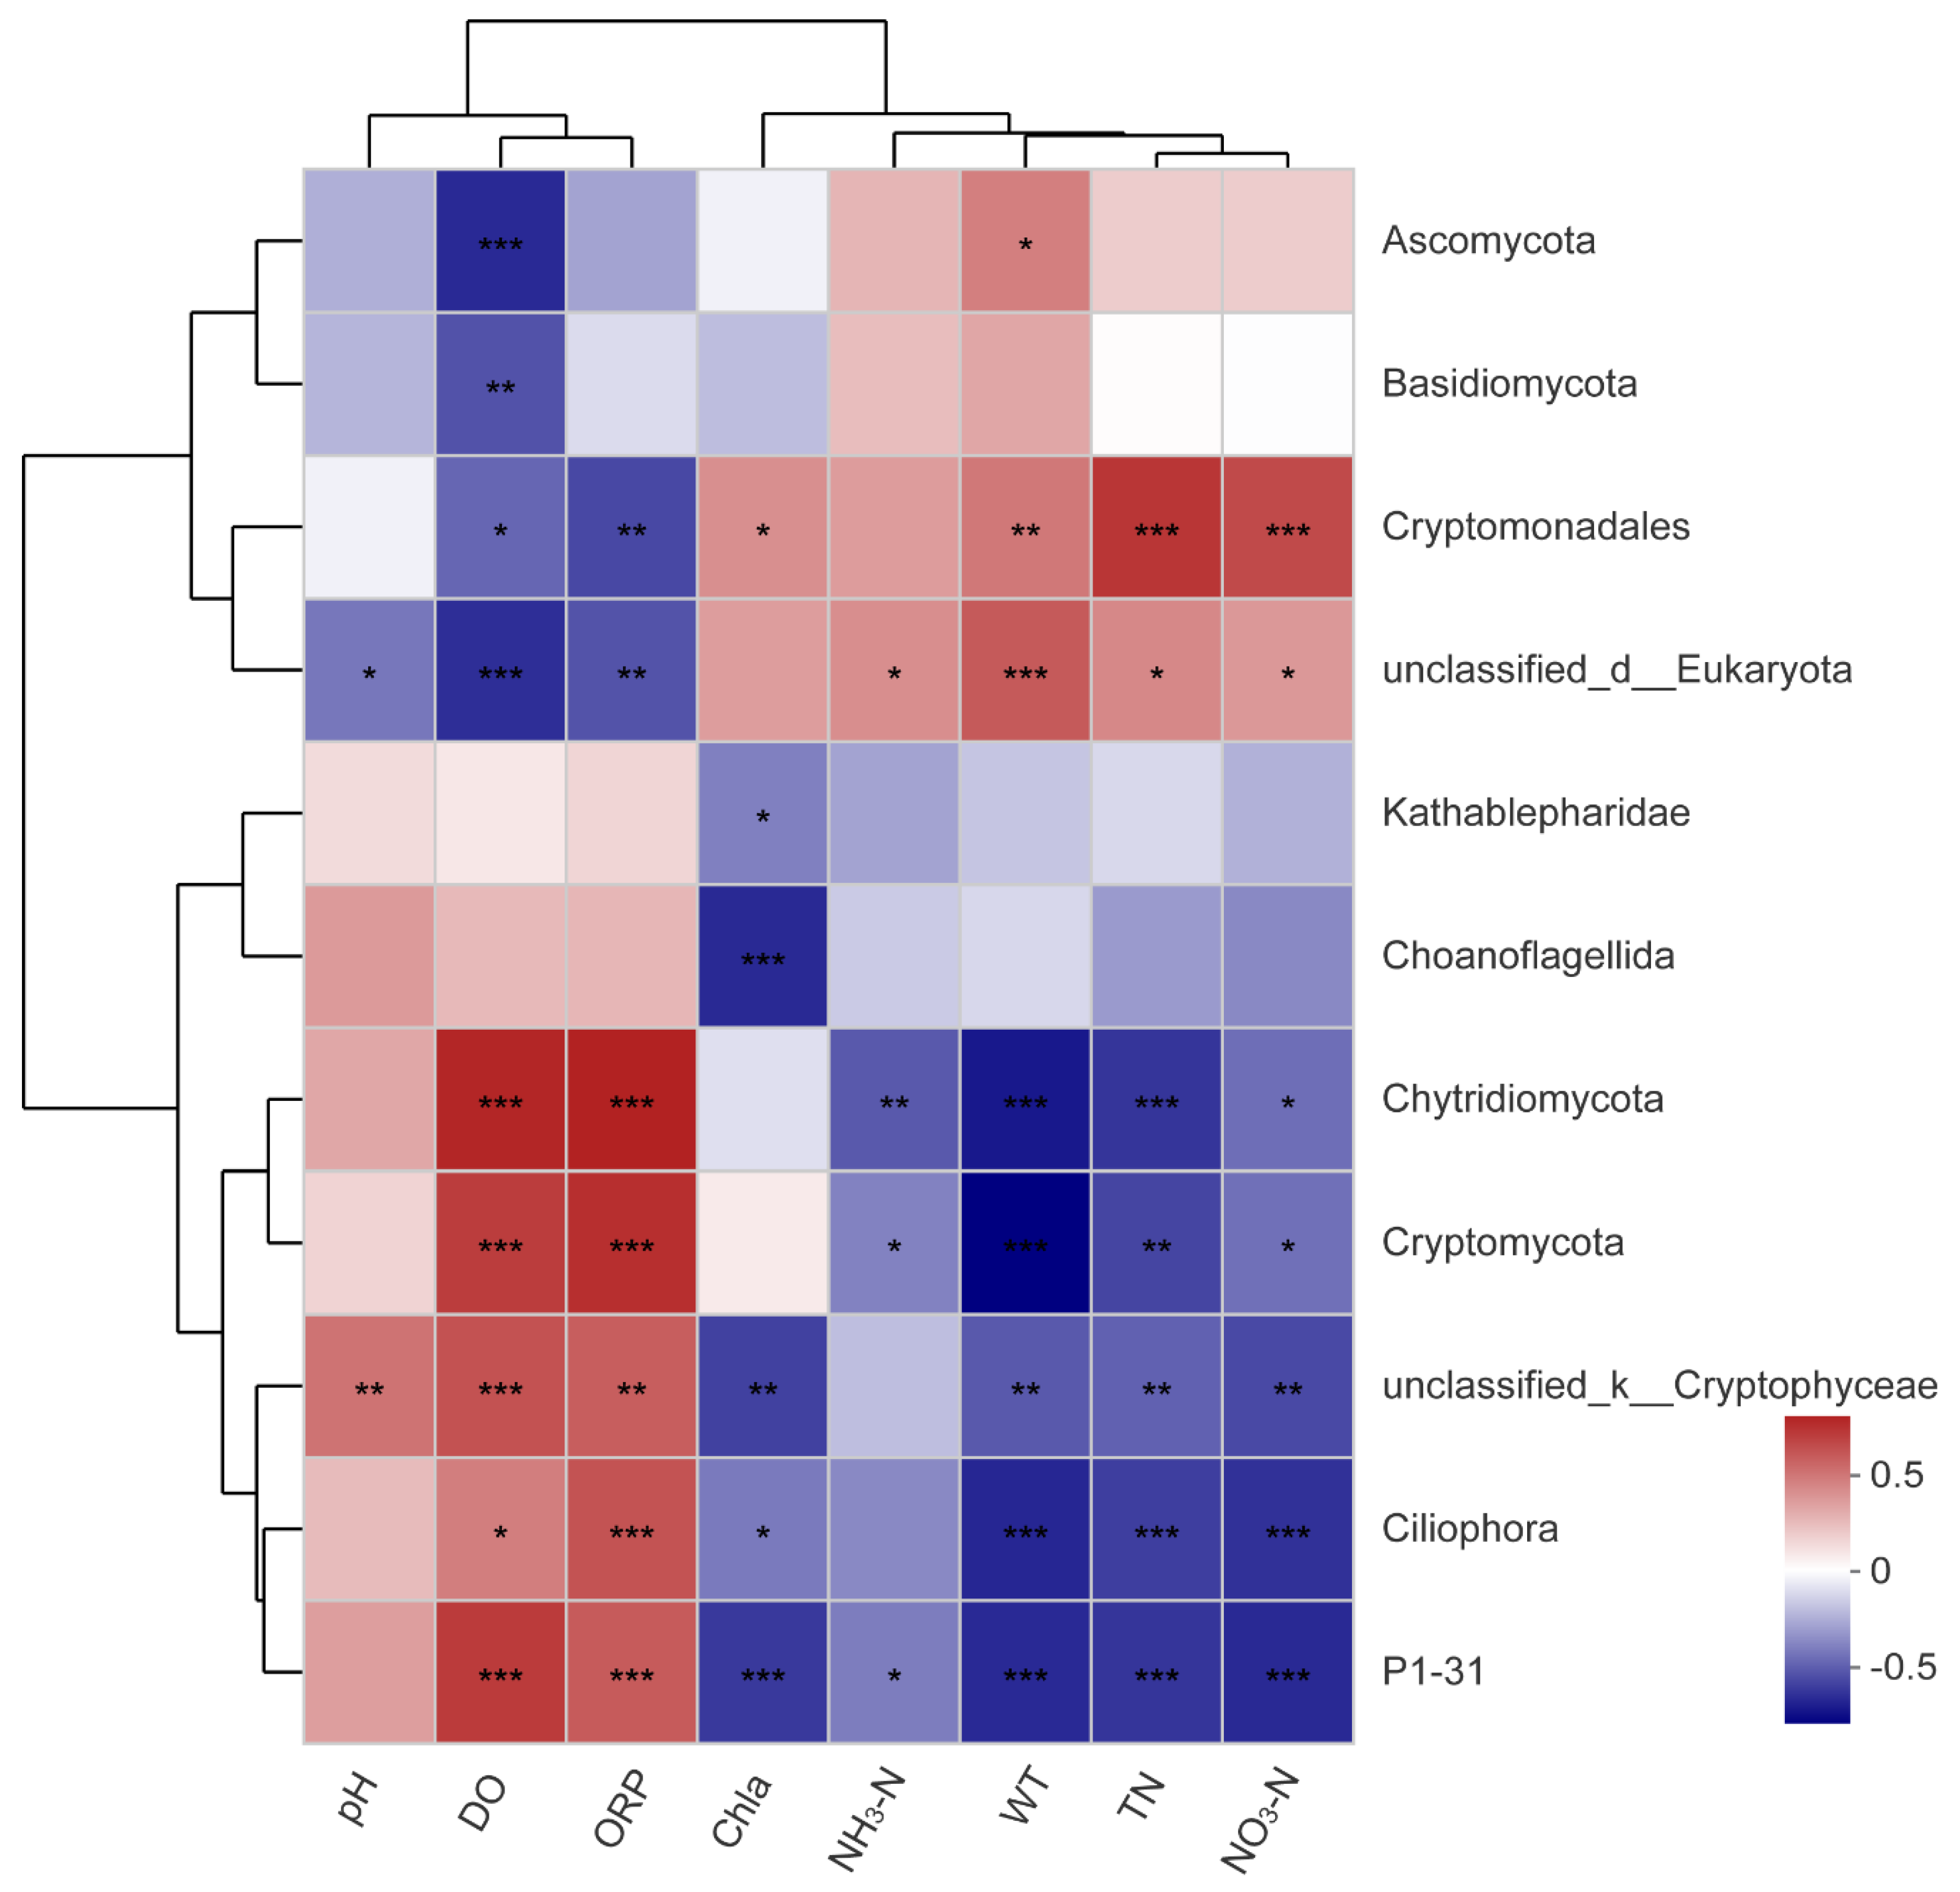
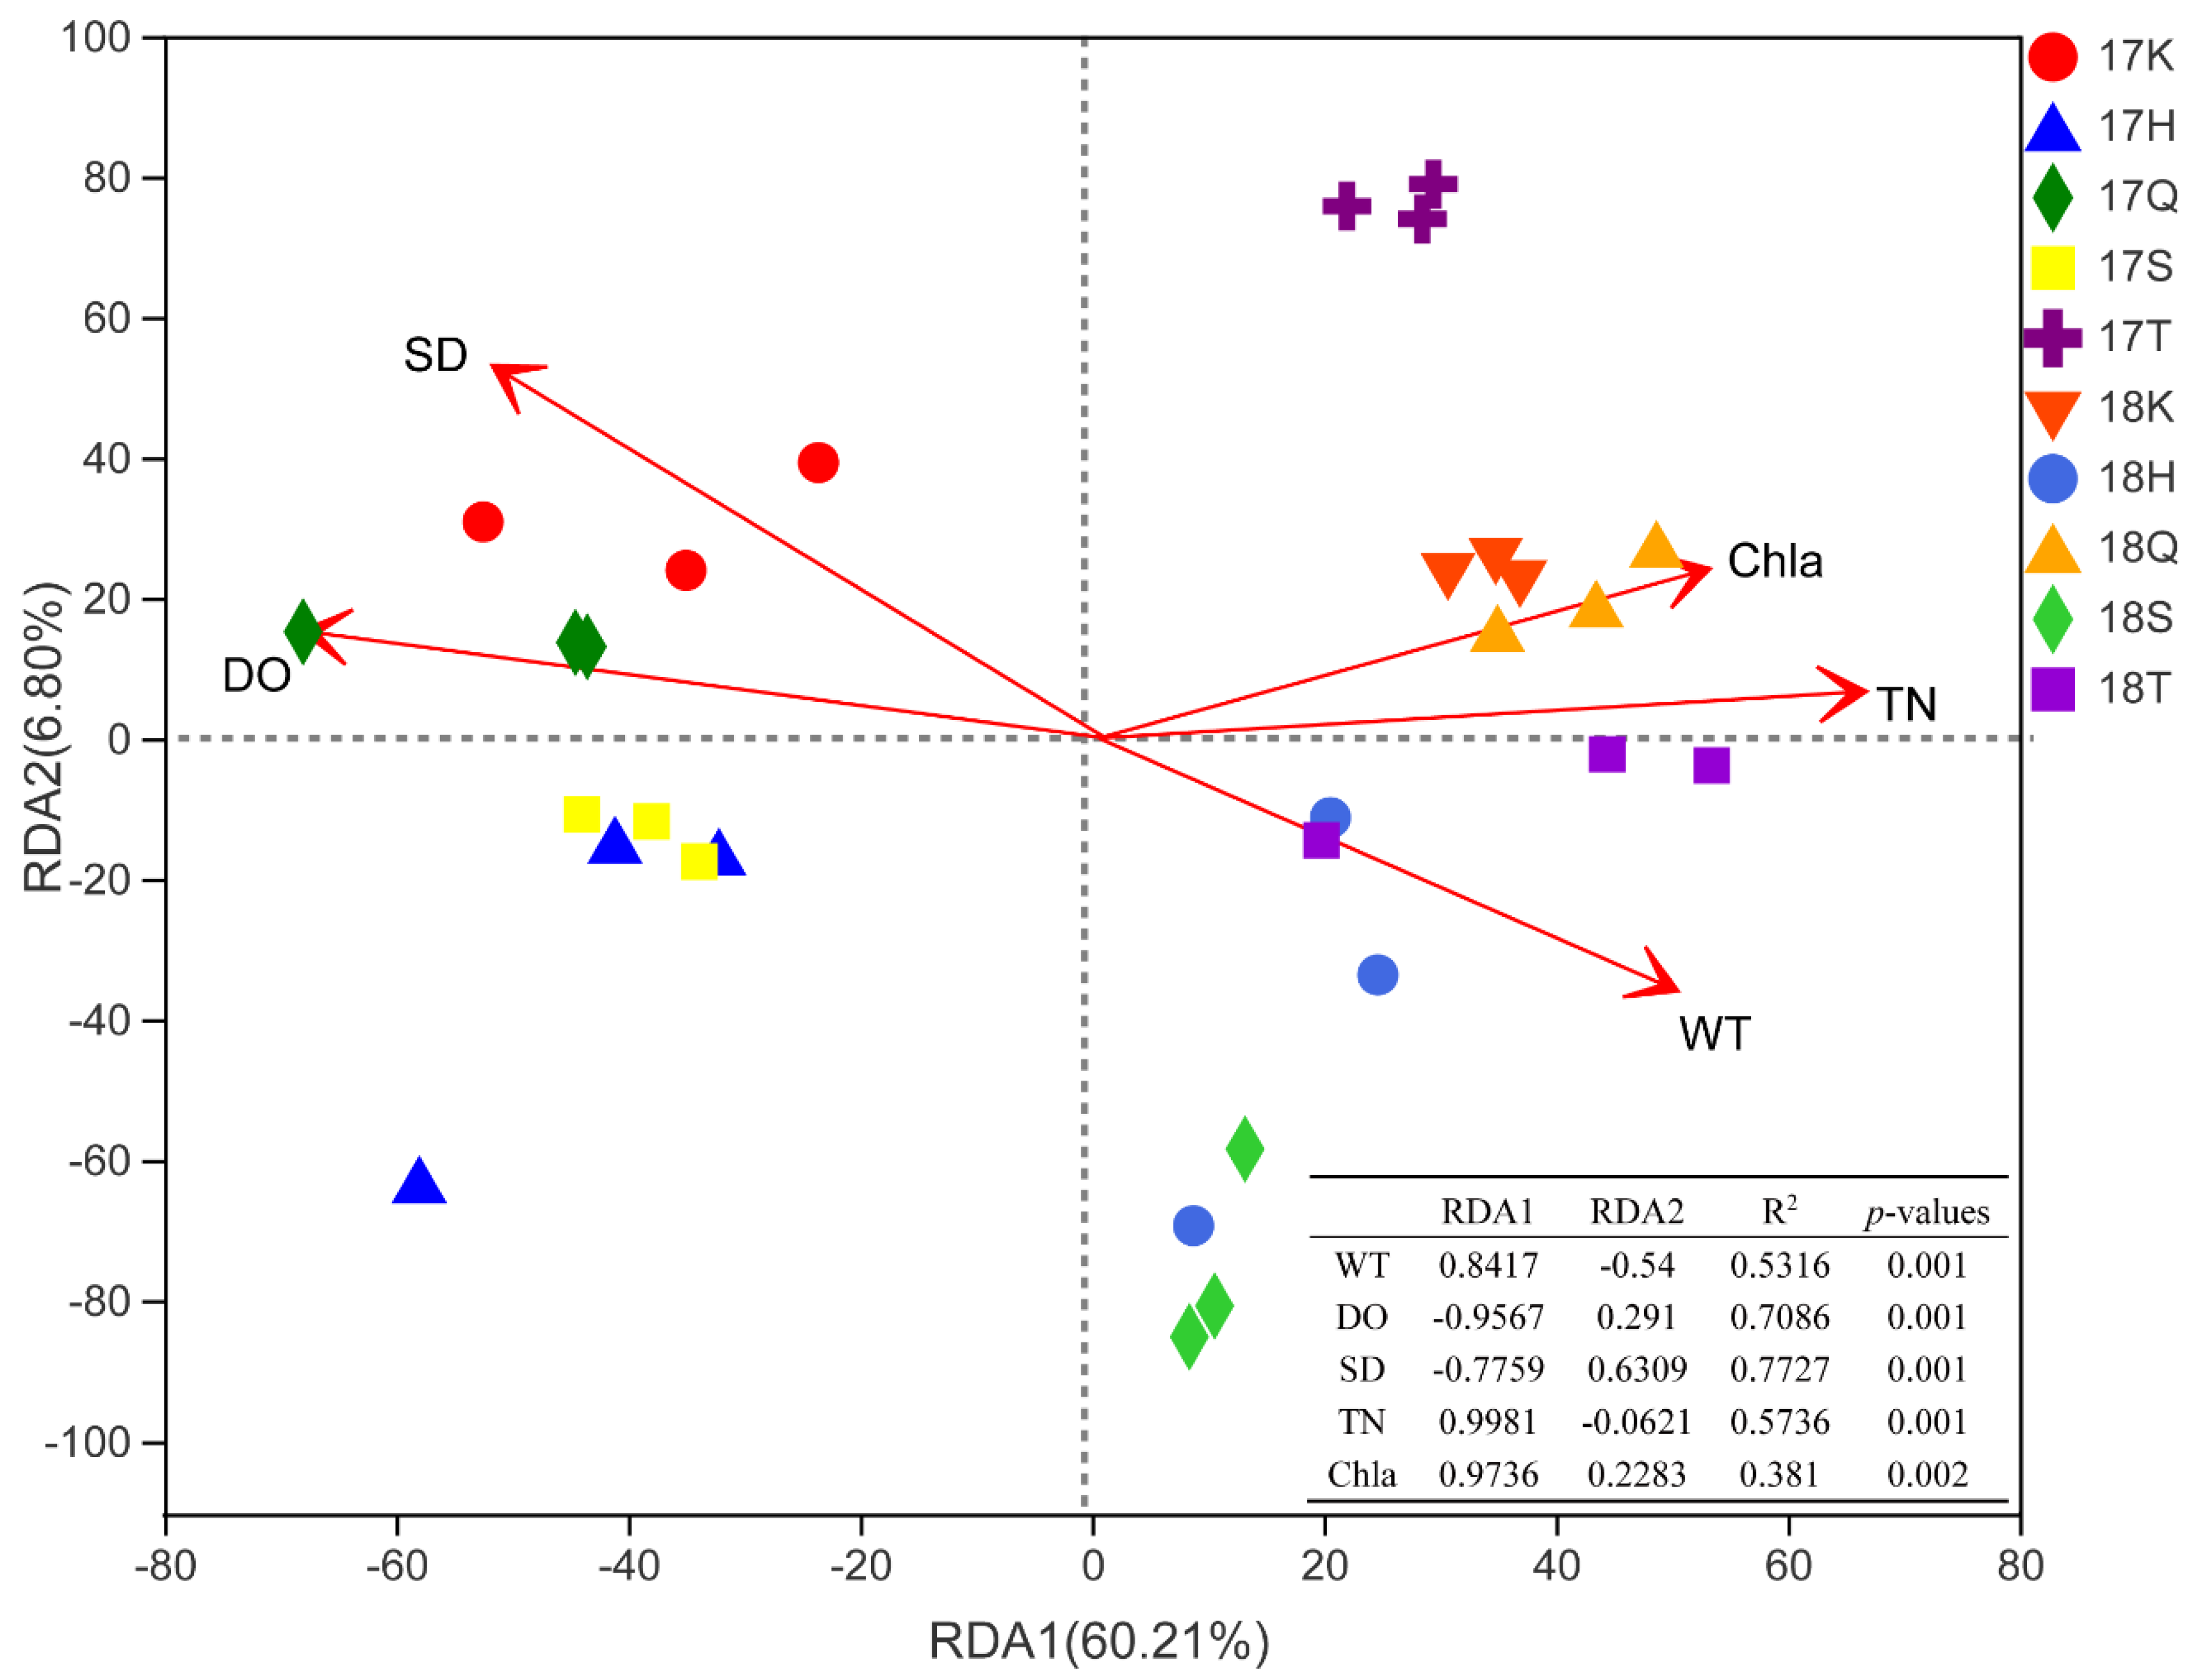
3.5. Analysis of Correlations between Planktonic Eukaryotic Taxa and the Environment

The variance inflation factor (VIF) was used to analyze the environmental factors, and the environmental factors with p > 0.05 or VIF > 10 were removed from the subsequent analysis. The factors with relatively low collinearity were retained, and Canoco 5 software was used to perform detrended correspondence analysis (DCA) on the planktonic eukaryotes at the out level. The results showed that the largest eigenvalue of the four axes was 1.513, and the RDA of the linear model was selected for follow-up analysis. The RDA results are shown in Figure 7. The percentages of variance explained by the 1st and 2nd axes were 60.21% and 6.80%, respectively, and WT, DO, Secchi depth (SD), TN, and Chla were found to be significantly related to the first sequence axis (p < 0.05). SD and DO significantly affected all the samples except 17T in 2017, and SD had a higher impact on 17K and 17Q than on other sites. WT, TN, and Chla significantly affect the distribution of samples in 2018; Chla and TN had the most significant influence on the locations of 18K, 18T, and 18Q, and 18T was more sensitive to WT than the other sites.
Spearman correlation analysis can also be used to determine the specific relationships between environmental factors and taxa. As shown in Figure 8, no taxa were significantly correlated with Level. Ascomycota was significantly positively correlated with WT and negatively correlated with DO. Basidiomycota was negatively correlated with DO. Cryptomonadales was significantly positively correlated with WT, TN, NO3-N, and Chla and negatively correlated with ORP and DO. Unclassified Eukaryota was significantly positively correlated with WT, TN, NO3-N, and NH3-N, and negatively correlated with ORP, pH, and DO. Kathablepharidae and Choanoflagellida were significantly negatively correlated with Chla; Chytridiomycota and Cryptomycota were significantly positively correlated with ORP, and DO and significantly negatively correlated with WT, TN, NO3-N, and NH3-N. Ciliophora was significantly positively correlated with DO and ORP and negatively correlated with WT, TN, NO3-N, and Chla. P1-31 was significantly positively correlated with ORP and DO and negatively correlated with WT, TN, NH3-N, NO3-N, and Chla. Unclassified Cryptophyceae was significantly positively correlated with ORP, pH, and DO and negatively correlated with WT, TN, NO3-N, and Chla.
The Spearman correlation analysis showed that the effects of the different environmental factors on the group of taxa of Cryptomonadales, Ascomycota, unclassified Eukaryota, and Ciliophora and on the group of P1-31, Chytridiomycota, and unclassified Cryptophyceae were essentially opposite. With the increase in the abundance of Cryptomonadales in the reservoir, the contents of Ascomycota and unclassified Eukaryota increased, while the abundance of Ciliophora, P1-31, Chytridiomycota, and unclassified Cryptophyceae decreased.

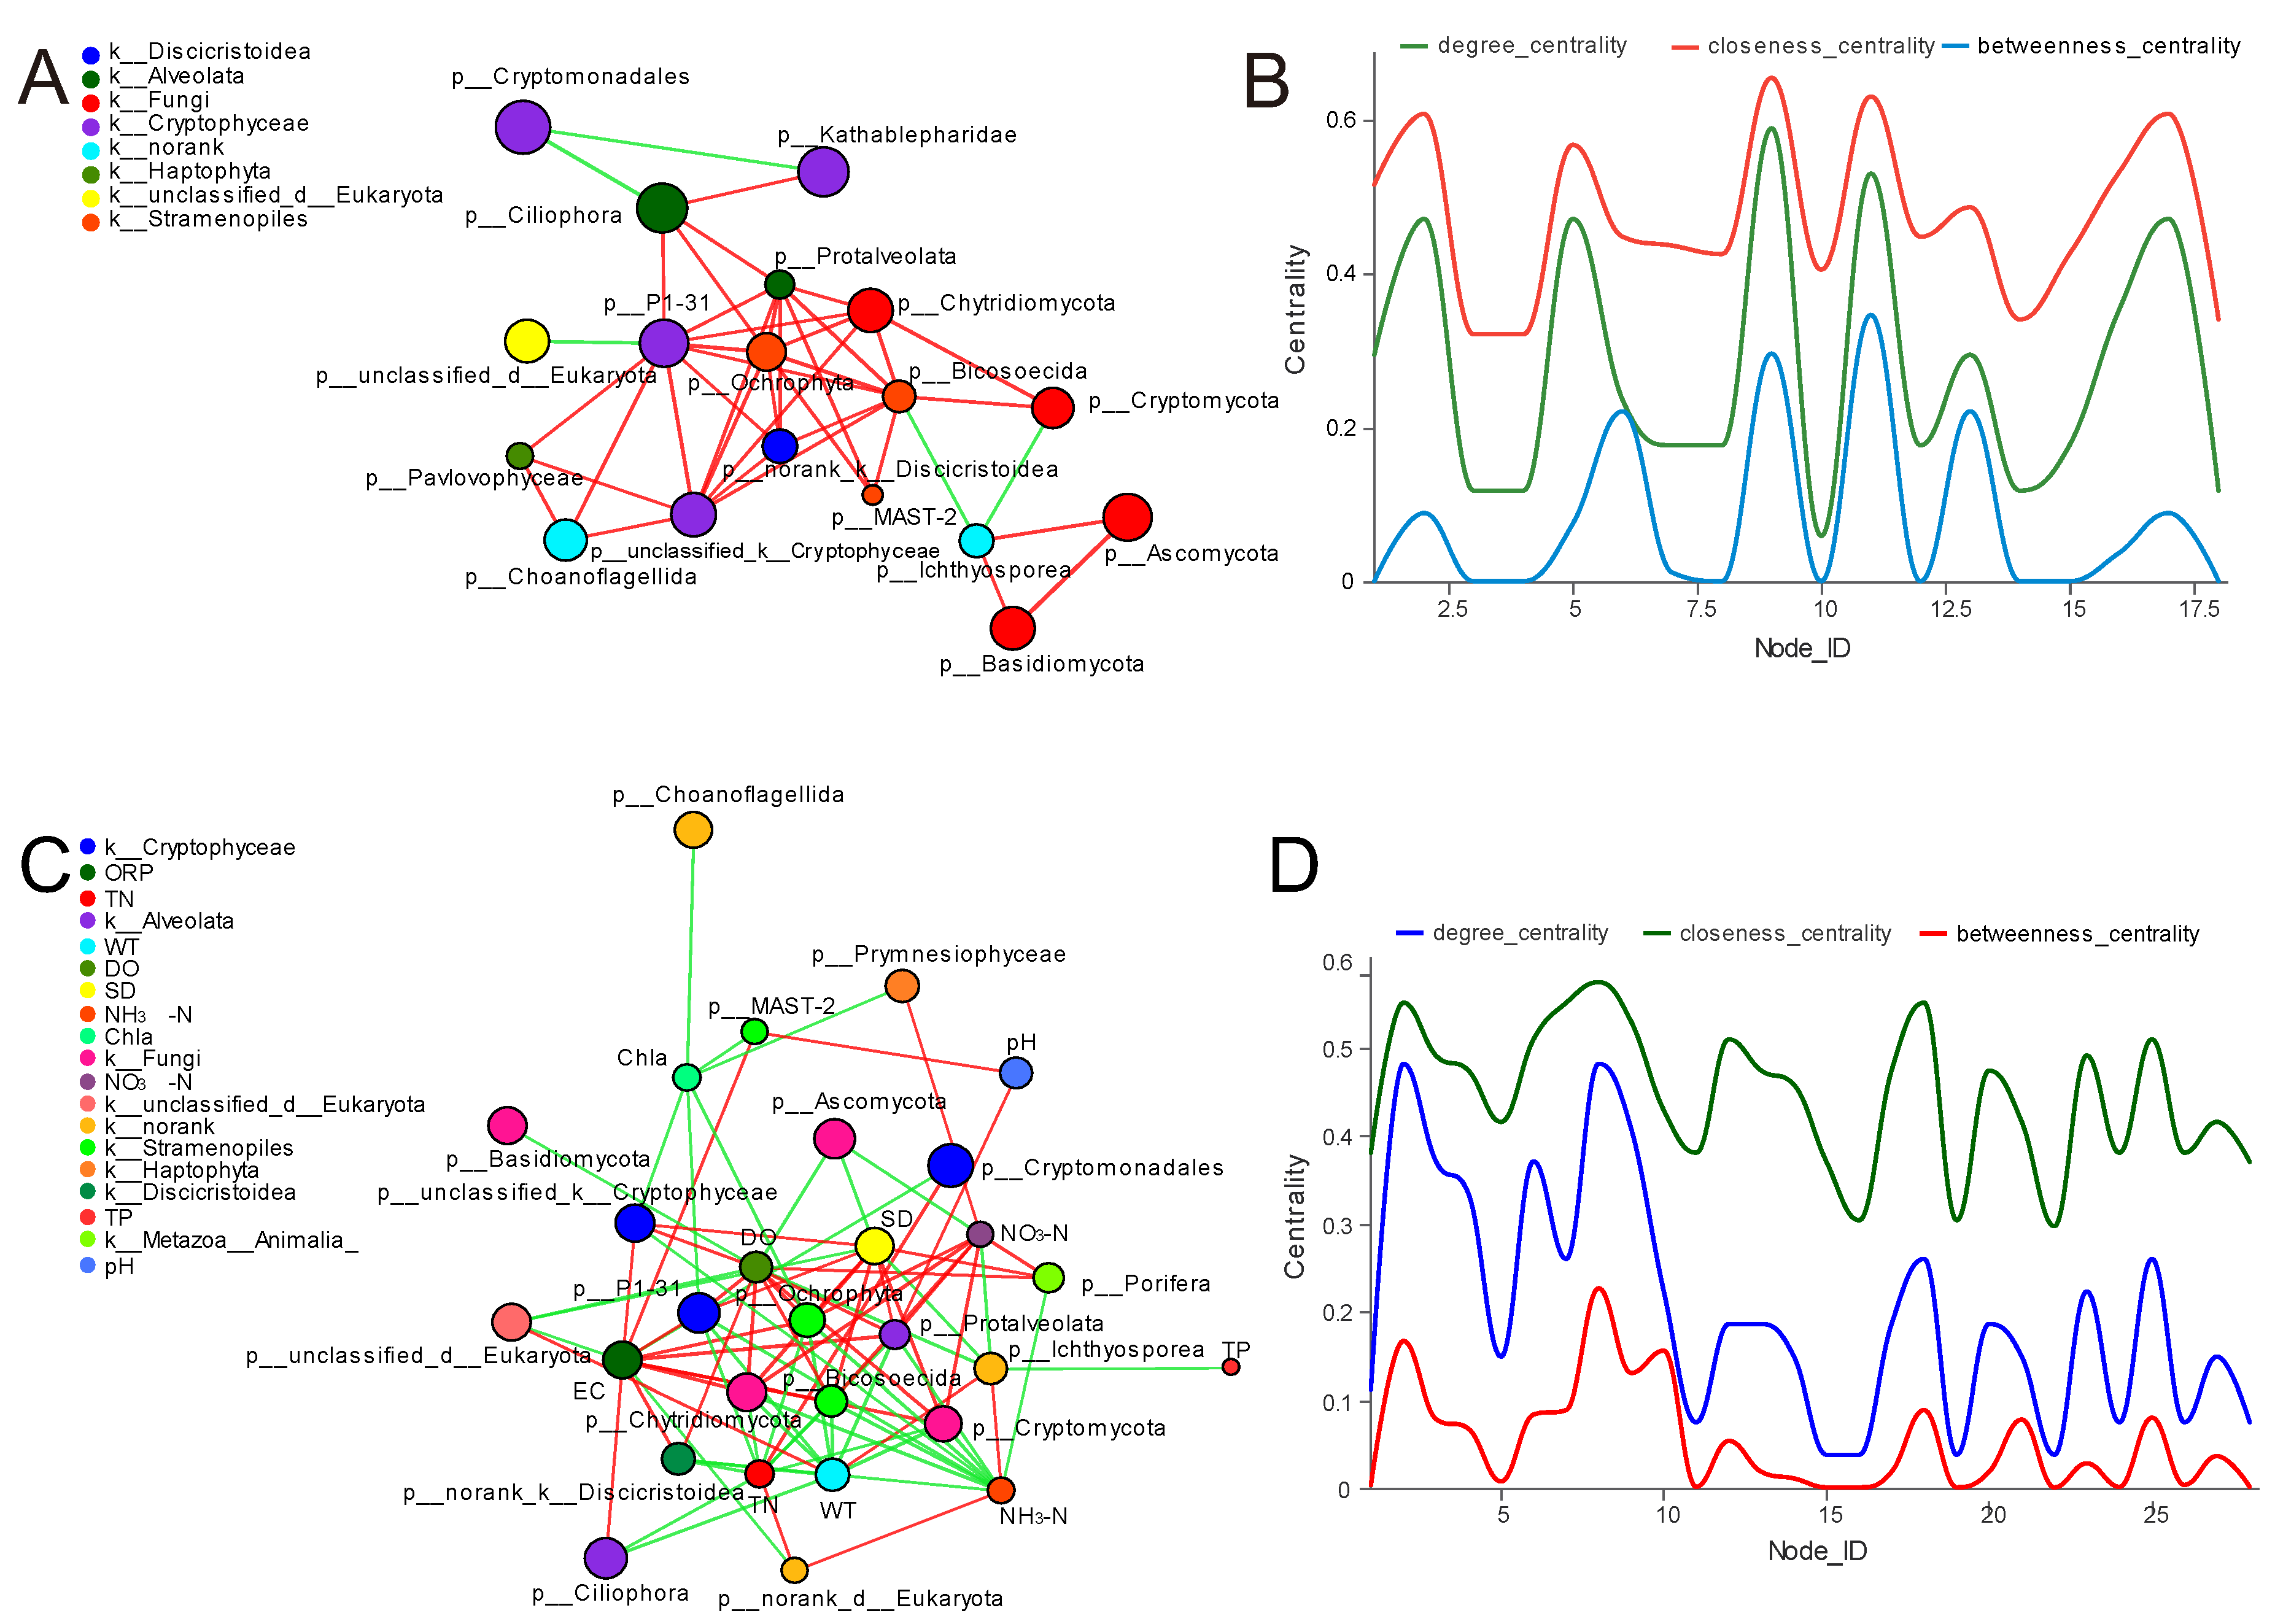
3.6. Network Analysis of Planktonic Eukaryotes

For the 30 samples collected at five sites in the Danjiangkou Reservoir area in two years, single-factor network analysis of the relationships among taxa identified 18 nodes and 42 edges, an average shortest path length of 2.229, and a network diameter of 5 (Figure 9A,B). Two-factor network analysis of the relationships between taxa and environmental factors identified a total of 28 nodes and 86 edges. The average shortest path length was 2.325, and the network diameter was 5 (Figure 9C,D). The circles of different colors represent different taxa, circle size represents the taxonomic abundance, green lines represent negative correlations, red lines represent positive correlations, and line thickness represents the strength of the correlation, with thicker lines indicating stronger correlations.
The results showed that the connectivity between taxa and environmental factors, as well as among taxa was relatively high in the Danjiangkou Reservoir. The nodes in the single-factor network were divided into 18 phyla, and the central coefficient values of all nodes in the network indicated that Protalveolata, Basidiomycota, P1-31, Bicosoecida, and Ochrophyta represented important nodes in the whole network. There were a total of 28 nodes in the two-factor network analysis, among which 19 represented taxa and 10 represented environmental variables. The center coefficient values of all nodes in the network indicated that six taxa (Chytridiomycota, P1-31, Cryptomycota, Ochrophyta, Ichthyosporea, Bicosoecida, and Protalveolata) and seven physicochemical factors (ORP, TN, WT, DO, SD, NH3-N, and NO3-N) represent important nodes in the network.

4. Discussion

4.1. Composition of the Planktonic Eukaryotic Community in the Danjiangkou Reservoir

Microeukaryotes play many roles as primary producers, secondary producers, and decomposers in aquatic ecosystems, influencing the structure of aquatic food webs from the aspects of taxonomic composition, abundance, biomass, and biodiversity [36]. However, studies of the composition, distribution characteristics, and functions of planktonic eukaryotes and their relationship with water quality are relatively few at present [17,18,19]. Compared with the traditional approach of microscopic detection of planktonic eukaryotes, high-throughput sequencing technology has greatly promoted research on plankton diversity, especially micro and ultra-micro plankton [21]. The investigation of phytoplankton diversity with high-throughput sequencing showed that V4 primers are most efficient in identifying micro and ultra-micro phytoplanktonic taxa [37]. The eukaryotic community was composed of Cryptomonadales, Kathablepharidae, Ciliophora, P1-31, Ascomycota, Chytridiomycota, Basidiomycota, Choanoflagellida, Cryptomycota, unclassified Cryptophyceae, and unclassified Eukaryota. Li et al. [38] identified 3 phyla and 17 genera based on the traditional separation culture method, and Kagami et al. [39] detected 3 phyla and 15 genera with polymerase chain reaction-denaturing gradient gel electrophoresis (PCR-DGGE). High-throughput sequencing, in contrast, can provide more information on eukaryotic plankton taxa. Gao et al. [9] suggested that DNA sequencing can be used as a promising method for establishing a consistent and accurate long-term ecological monitoring database for drinking water quality, and the research results are better than those of Khomich et al. [40]. The results related to the vesicle-dominated plankton taxa in the lakes south of Scandinavia have been more accurate and have been determined to be technically superior. In an evaluation of the eukaryotic biodiversity of German oligotrophic lakes, the main groups were determined to be Chlorophyta, Cryptophyta, diatoms and Chrysophyta [41]. Cryptomonadales is the dominant taxon of planktonic eukaryotes in the Danjiangkou Reservoir, accounting for 65.19% of the total abundance on average. Cryptophyta mainly includes photoautotrophs [42]. Water at the surface is easily exposed to sunlight, promoting the reproduction and growth of Cryptomonadales. Cryptophyta is the dominant taxon because it contains typical freshwater ultra-micro eukaryotes and has a high abundance in all types of freshwater ecosystems. This differs from the results of a previous study showing that the tributaries of the Danjiangkou Reservoir are dominated by diatoms [43], that the dominant functional groups mainly belong to Chlorophyta and Bacillariophyta, and that the content of Cryptophyta is low. This may be related to the internal differences in the composition of the ultra-micro eukaryotes community in freshwater ecosystems caused by differences in environmental conditions and biogeography [44,45]. Using high-throughput sequencing technology, the community structure information of phytoplankton, zooplankton, and other planktonic eukaryotes can be obtained quickly, accurately, and standardly, and the links among different species in planktonic eukaryotes can be accelerated and integrated. Compared with the study of eukaryotes (such as phytoplankton and zooplankton) alone, it is more beneficial to understand the integrity of plankton community structure in Danjiangkou Reservoir, which provides better technical support for the formulation of a water quality protection policy for the water source area of the middle route of the South-to-North Water Diversion Project.

4.2. Relationships between Eukaryotes and Environmental Factors

The RDA showed that WT, DO, SD, TN, and Chla were the significant factors affecting the community distribution of planktonic eukaryotes in the Danjiangkou Reservoir. Phytoplankton taxa in water bodies are affected by WT, DO, Chla, EC, N, P, organic matter, and other physicochemical parameters [22,46].
Cryptomonadales is the dominant order in the Danjiangkou Reservoir, but its abundance varies greatly among the different sites; its abundance at the 17H sampling site is the lowest. Spearman correlation analysis shows that TN is significantly positively correlated with Cryptomonadales and unclassified Eukaryota, which is consistent with the low TN content at the 17H sampling site. At the same time, the significant differences between groups showed that the abundances of Cryptomonadales and unclassified Eukaryota increase significantly with increasing TN content in the reservoir. Long-term monitoring shows that all the variables in the Danjiangkou Reservoir except TN meet the requirements of class I or II water standards. Exceeding the standard for TN is an important environmental problem in the reservoir area and watershed [8,11,35]. Although the TN content is not included in the national evaluation standards for surface water in China, nitrogen, and phosphorus nutrient sources are the most important cause of lake eutrophication. The nitrogen content in the Danjiangkou Reservoir shows an obvious upward trend and represents a certain degree of ecological risk.
The two-year data show that DO decreases with increasing WT. Generally, the DO concentration can reflect the pollution level of water, especially pollution related to the content of organic compounds, and is an important indicator when measuring water quality [47]. Chytridiomycota, Cryptomycota, Ciliophora, P1-31, and unclassified Cryptophyceae are significantly positively correlated with DO, so these taxa can be used as important biological reference indicators to measure the water quality in the Danjiangkou Reservoir. One study found that WT is the main factor influencing the structure of the bacterial community in the Yangtze River and its sediments [48]. In addition, in the Danjiangkou Reservoir in 2018, WT increased significantly in May, and the abundance of Cryptomonadales, Ascomycota, and unclassified Eukaryota, which were significantly positively correlated with WT, increased significantly; whether at the species level (cells or communities become smaller) or at the community level (the transition to smaller species), the size of freshwater phytoplankton decreases with increasing temperature [49]. The abundance of Cryptomonadales, as the dominant taxon, significantly increased from 2017 to 2018, which was related to the increase in temperature.
Among all sampling points in the Danjiangkou Reservoir, the Chla content was highest at 17T, and the abundance of Cryptomonadales was also the highest according to the taxonomic composition analysis; these results are consistent with the Spearman correlation analysis. Studies on the Weihe River Basin show that the chlorophyll content has the most significant correlation with the presence of organisms and that it is the main driving force for the biological community in the basin [50]. Spearman correlation analysis between taxa and environmental factors showed that Kathablepharidae and Choanoflagellida were significantly negatively correlated only with Chla. These taxa are not sensitive to other environmental or physicochemical factors, and combined with the analysis of significant differences among groups, and it was found that the abundance of these taxa remains stable in the Danjiangkou Reservoir.
Lake microorganisms can be used to monitor and evaluate water pollution because they are sensitive to changes in water quality [46,51,52]. Gaedke et al. [53] found that the community structures of microeukaryotes in different lakes were closely related to the level of freshwater nutrients, and Chen et al. [54] found that the genetic diversity of microplanktonic eukaryotes in different areas of Taihu Lake was significantly correlated with the total phosphorus concentration. There are complex relations between environmental factors and organisms that restrict and promote each other. Understanding the detailed corresponding relations between them is conducive to maintaining and improving the ecosystem balance of the Danjiangkou Reservoir. In recent years, high-throughput sequencing technology has been applied to analyze the composition and structure of planktonic taxa, and its application to the biological monitoring of water quality has attracted increasing attention [20,21] The study of planktonic eukaryotes based on high-throughput sequencing provides a good basis for revealing the composition and function of planktonic eukaryotes in aquatic ecosystems and provides a reference for the use of planktonic eukaryotes as indicators for the evaluation of water quality in freshwater lakes.

4.3. Changes in Planktonic Eukaryotic Community Structure

Based on the NMDS analysis of the planktonic eukaryotes at five sites in the Danjiangkou Reservoir in 2017 and 2018, the samples were roughly divided into two parts according to year. This result indicates that the community composition changed significantly over time, which is essentially consistent with the results of most previous studies [55,56,57]. However, the community structure in the samples from site T was similar in the two years, which may be related to its location. Site T is located at the junction of the Dan Reservoir in Henan Province and the Han Reservoir in Hubei Province. A large amount of water flows from the Hubei to the Henan area of the Danjiangkou Reservoir. This stability in runoff causes stability in the community composition at site T, and the hydraulic retention time may have a significant impact on the lake biochemistry [58,59]. Lindström and Bergström found that bacterial plankton was more similar in lakes with shorter hydraulic retention times [60].
The LDA histogram showed significant differences among samples of 13 phyla, 20 classes, 23 orders, 26 families, and 27 genera of planktonic eukaryotes in the Danjiangkou Reservoir in spring. The RDA showed that DO and SD significantly affected the sample distribution of planktonic eukaryotes in 2017. WT, TN, and Chla were significant factors affecting the community distribution of planktonic eukaryotes in 2018. The results showed that the community structure of planktonic eukaryotes changed significantly with temporal and spatial changes; the temporal changes caused corresponding changes in WT, DO, and other physical and chemical factors in the reservoir area and led to corresponding changes in the community structure and diversity of the planktonic eukaryotes [61]. The change in the central node between the single-factor and two-factor network analysis also illustrates this point. The results indicate that the physicochemical factors significantly affected the composition of the planktonic eukaryote community and the influence of rare plankton diversity (abundance less than 1%) on the community and that the number of rare taxa represented by the network nodes was higher than that represented by high-abundance taxa. This result reveals the key role of rare taxa in the community. The synergistic effect of rare and nonrare taxa may play a central role in maintaining the stability and ecological function of eukaryotic communities [62].
Nutrient retention in lakes; denitrification; nutrient absorption by submerged plants, emergent plants, aquatic plants, and microorganisms; and nutrient deposition and binding in sediments are important regulatory factors affecting nutrient abundance in water [63]. The intensity of nutrient cycling depends on the availability of nutrients (mainly nitrogen and phosphorus) and is strongly related to the oxygen content in the water body [64]. The planktonic eukaryotes were abundant in the two evaluated years, which is related to the high content of nitrogen in the Danjiangkou Reservoir. There are significant temporal and spatial differences in taxonomic composition and abundance (i.e., from phylum to genus) between the two years. There are significant seasonal and annual differences in eukaryotic plankton community structure in the eastern North Pacific Ocean [65] and significant differences in eukaryotic microbial community structure associated with the Zhoushan, Qingdao, and Xiamen coastal waters [66]; the similarity of eukaryotic microbial communities in different sites in Yellowstone Park in the United States is low [67]. The results show that the structure of the planktonic eukaryote community is sensitive to changes in the living environment, and such temporal and spatial differences are universal among ecosystems.
The environmental factors TN, WT, Chla, and DO significantly promoted the abundance of Cryptomonadales. Cryptomonadales abundance significantly increased in 2018 with the increase in physical and chemical factors. The overall abundance of Kathablepharidae did not change significantly, but its abundance was highest at 18S, which was significantly higher than that at 17S. At 18H, its abundance was significantly lower than that at 17H (the lowest observed abundance of Kathablepharidae); this change was significantly affected by Chla. Moreover, the increased TN, NH3-N, and WT contents resulted in Ciliophora exhibiting the most significant interannual change. One study found that Ciliophora are mainly considered to be predators of bacteria [68], and Actinobacteria, Proteobacteria, and Bacteroidetes were the most abundant bacterial taxa at site H [69]. Furthermore, Ciliophora exhibits plastid retention and engages in symbiosis with algae and Cryptophyta [42,70,71], indicating that Ciliophora is not only related to environmental factors, but is also affected by biological factors.
The abundances of Ascomycota and unclassified Eukaryota in 2018 were higher than those in the previous year, and the abundances of P1-31, Chytridiomycota, and unclassified Cryptophyceae in 2018 were significantly lower than those at the same time in 2017. Although the planktonic eukaryotes could be roughly divided into two groups according to year, the community structures at different sites in the same year exhibited significant differences. Some of the physicochemical factors at the different sites changed significantly between years (Table 2). Different environmental conditions can lead to variations in water characteristics and then to spatial differences in the distribution of the main groups of ultramicroplanktonic eukaryotes; this may be the reason for the changes in community structure at the five sites between 2017 and 2018 according to the alpha diversity analysis results in this study. The community composition of planktonic eukaryotes in the Danjiangkou Reservoir changes significantly over time and space. Due to the sensitivity of plankton eukaryotes to environmental factors, the significance of the temporal and spatial changes of the plankton eukaryotic community composition in Danjiangkou Reservoir is determined. Therefore, rapid, accurate, and standardized access to community structure composition information and long-term monitoring is beneficial to providing a basis for understanding the evolution of planktonic eukaryotes in the reservoir.

5. Conclusions

Research shows that the water quality of the Danjiangkou Reservoir is generally good, in accordance with the class II drinking water standard, while the TN content is still high. By using high-throughput sequencing technology to study the planktonic eukaryotic community in the Danjiangkou Reservoir, it was found that the community has a high degree of abundance and diversity, it is mainly composed of 11 phyla, of which Cryptomonadales was dominant, and the spatial and interannual changes in community structure were significant. RDA showed that WT, DO, SD, TN, and Chla were significant factors affecting the composition of the plankton eukaryotic community (p < 0.05). Cryptomonadales, the dominant taxon of planktonic eukaryotes, was positively correlated with changes in the abundances of Ascomycota and unclassified Eukaryota, and negatively correlated with changes in the abundances of Ciliophora, P1-31, Chytridiomycota, and unclassified Cryptophyceae. Furthermore, the rare taxa (abundance less than 1%) significantly affected the community structure, which was mainly influenced by physicochemical factors (WT, DO, ORP, TN, NO3- N, NH3-N, and Chla) and the interactions among organisms. Although it is possible to analyze the relationships among phytoplankton, fungi, zooplankton, and physicochemical factors, as well as certain relationships among different planktonic eukaryotic taxa, there are still many complex and unknown factors worth exploring.

Supplementary Materials

The following are available online at https://www.mdpi.com/2073-4441/12/12/3499/s1, Table S1: The classification standards for lake water quality and water function in China (GB3838-2002).

Author Contributions

Conceptualization: Z.-J.C., Y.-Y.L., B.-L.L.; Methodology, B.-H.Z., Z.-J.C., Y.Z.; Investigation, B.-H.Z., Z.-J.C., Y.-Y.L., D.-Y.W., X.-Y.Y.; Writing—Original Draft Preparation, B.-H.Z., Z.-J.C., Y.-Y.L.; Writing—Review & Editing, Z.-J.C., Y.-Y.L., N.F., B.-L.L.; Funding Acquisition, Y.-Y.L. All authors have read and agreed to the published version of the manuscript.

Funding

This research was funded by the National Natural Science Foundation of China, grant number 51879130, U2004145 and U1704124.

Conflicts of Interest

The authors declare no conflict of interest.

References

  1. Jiang, Y.; Xu, H.; Zhu, M. Use of planktonic protists for assessing water quality in Jiaozhou Bay, northern China. Protistology 2012, 7, 34–41. [Google Scholar]
  2. Filker, S.; Sommaruga, R.; Vila, I.; Stoeck, T. Microbial eukaryote plankton communities of high-mountain lakes from three continents exhibit strong biogeographic patterns. Mol. Ecol. 2016, 25, 2286–2301. [Google Scholar] [CrossRef] [PubMed] [Green Version]
  3. Foissner, W. Biogeography and dispersal of microorganisms: A review emphasizing protists. Acta Protozoologica 2006, 45, 111–136. [Google Scholar]
  4. Zubkov, M.; Tarran, G.A. High bacterivory by the smallest phytoplankton in the North Atlantic Ocean. Nat. Cell Biol. 2008, 455, 224–226. [Google Scholar] [CrossRef]
  5. Caron, D.A. Inorganic nutrients, bacteria, and the microbial loop. Microb. Ecol. 1994, 28, 295–298. [Google Scholar] [CrossRef]
  6. Bunse, C.; Pinhassi, J. Marine Bacterioplankton Seasonal Succession Dynamics. Trends Microbiol. 2017, 25, 494–505. [Google Scholar] [CrossRef] [Green Version]
  7. Simon, M.; López-García, P.; Deschamps, P.; Moreira, D.; Restoux, G.; Bertolino, P.; Jardillier, L. Marked seasonality and high spatial variability of protist communities in shallow freshwater systems. ISME J. 2015, 9, 1941–1953. [Google Scholar] [CrossRef] [Green Version]
  8. Sun, Z.; Li, G.; Wang, C.; Jing, Y.; Zhu, Y.; Zhang, S.; Liu, Y. Community dynamics of prokaryotic and eukaryotic microbes in an estuary reservoir. Sci. Rep. 2014, 4. [Google Scholar] [CrossRef]
  9. Gao, W.; Chen, Z.; Li, Y.; Pan, Y.; Zhu, J.; Guo, S.; Hu, L.; Huang, J. Bioassessment of a Drinking Water Reservoir Using Plankton: High Throughput Sequencing vs. Traditional Morphological Method. Water 2018, 10, 82. [Google Scholar] [CrossRef] [Green Version]
  10. Keck, F.; Millet, L.; Debroas, D.; Etienne, D.; Galop, D.; Rius, D.; Domaizon, I. Assessing the response of micro-eukaryotic diversity to the Great Acceleration using lake sedimentary DNA. Nat. Commun. 2020, 11, 3831. [Google Scholar] [CrossRef]
  11. McInnes, A.S.; Laczka, O.F.; Baker, K.G.; Larsson, M.E.; Robinson, C.M.; Clark, J.S.; Laiolo, L.; Alvarez, M.; Laverock, B.; Kremer, C.T.; et al. Live cell analysis at sea reveals divergent thermal performance between photosynthetic ocean microbial eukaryote populations. ISME J. 2019, 13, 1374–1378. [Google Scholar] [CrossRef] [PubMed] [Green Version]
  12. Der Staay, S.Y.M.-V.; De Wachter, R.; Vaulot, D. Oceanic 18S rDNA sequences from picoplankton reveal unsuspected eukaryotic diversity. Nat. Cell Biol. 2001, 409, 607–610. [Google Scholar] [CrossRef]
  13. López-García, P.; Rodríguez-Valera, F.; Pedrós-Alió, C.; Moreira, D. Unexpected diversity of small eukaryotes in deep-sea antarctic plankton. Nature 2001, 409, 603–607. [Google Scholar] [CrossRef] [PubMed]
  14. Nagarkar, M.; Countway, P.D.; Du Yoo, Y.; Daniels, E.; Poulton, N.; Palenik, B. Temporal dynamics of eukaryotic microbial diversity at a coastal Pacific site. ISME J. 2018, 12, 2278–2291. [Google Scholar] [CrossRef]
  15. Santoferrara, L.F.; Grattepanche, J.D.; Katz, L.A.; McManus, B. Patterns and processes in microbial biogeography:do molecules and morphologies give the same answers quest. ISME J. 2016, 10, 1779–1790. [Google Scholar] [CrossRef]
  16. Needham, D.M.; Fichot, E.B.; Wang, E.; Berdjeb, L.; Cram, J.A.; Fichot, C.G.; A Fuhrman, J. Dynamics and interactions of highly resolved marine plankton via automated high-frequency sampling. ISME J. 2018, 12, 2417–2432. [Google Scholar] [CrossRef] [Green Version]
  17. Wurzbacher, C.M.; Bärlocher, F.; Grossart, H.-P. Fungi in lake ecosystems. Aquat. Microb. Ecol. 2010, 59, 125–149. [Google Scholar] [CrossRef] [Green Version]
  18. Nagano, Y.; Nagahama, T. Fungal diversity in deep-sea extreme environments. Fungal Ecol. 2012, 5, 463–471. [Google Scholar] [CrossRef]
  19. Taylor, J.D.; Cunliffe, M. Multi-year assessment of coastal planktonic fungi reveals environmental drivers of diversity and abundance. ISME J. 2016, 10, 2118–2128. [Google Scholar] [CrossRef] [Green Version]
  20. Van Dijk, E.L.; Auger, H.; Jaszczyszyn, Y.; Thermes, C. Ten years of next-generation sequencing technology. Trends Genet. 2014, 30, 418–426. [Google Scholar] [CrossRef]
  21. Etan, B.; Ng, C.M.; Nshimyimana, J.P.; Eloh, L.-L.; Gin, K.Y.-H.; Thompson, J.R. Next-generation sequencing (NGS) for assessment of microbial water quality: Current progress, challenges, and future opportunities. Front. Microbiol. 2015, 6. [Google Scholar] [CrossRef]
  22. Reich, M.; Wichels, A.; Panzer, K.; Krause, E.; Giménez, L.; Gerdts, G. Impacts of a reduction in seawater pH mimicking ocean acidification on the structure and diversity of mycoplankton communities. Aquat. Microb. Ecol. 2017, 79, 221–233. [Google Scholar] [CrossRef] [Green Version]
  23. Jiang, Y.-J.; He, W.; Liu, W.-X.; Qin, N.; Ouyang, H.-L.; Wang, Q.-M.; Kong, X.-Z.; He, Q.-S.; Yang, C.; Yang, B.; et al. The seasonal and spatial variations of phytoplankton community and their correlation with environmental factors in a large eutrophic Chinese lake (Lake Chaohu). Ecol. Indic. 2014, 40, 58–67. [Google Scholar] [CrossRef]
  24. Wang, S.; Zhang, Q.; Yang, T.; Zhang, L.; Li, X.; Chen, J. River health assessment: Proposing a comprehensive model based on physical habitat, chemical condition and biotic structure. Ecol. Indic. 2019, 103, 446–460. [Google Scholar] [CrossRef]
  25. Wang, X.; Liu, Y.; Yin, X.; Zhao, X.; Guo, R.; Zheng, B. Development and evaluation of a Planktonic Integrity Index (PII) for Jingpo Lake, China. J. Limnol. 2019, 78, 135–146. [Google Scholar] [CrossRef]
  26. Zhang, Y.; Ban, X.; Li, E.; Wang, Z.; Xiao, F. Evaluating ecological health in the middle-lower reaches of the Hanjiang River with cascade reservoirs using the Planktonic index of biotic integrity (P-IBI). Ecol. Indic. 2020, 114. [Google Scholar] [CrossRef]
  27. Li, S.; Xu, Z.; Cheng, X.; Zhang, Q. Dissolved trace elements and heavy metals in the Danjiangkou Reservoir, China. Environ. Earth Sci. 2007, 55, 977–983. [Google Scholar] [CrossRef]
  28. Tropical and Sub-Tropical Reservoir Limnology in China. Lake Chad 2012, 91, 370. [CrossRef]
  29. Chen, Z.; Yuan, J.; Sun, F.; Zhang, F.; Chen, Y.; Ding, C.; Shi, J.; Li, Y.; Yao, L. Planktonic fungal community structures and their relationship to water quality in the Danjiangkou Reservoir, China. Sci. Rep. 2018, 8, 1–11. [Google Scholar] [CrossRef] [Green Version]
  30. Dang, C.; Liu, W.; Lin, Y.; Zheng, M.; Jiang, H.; Chen, Q.; Ni, J. Dominant role of ammonia-oxidizing bacteria in nitrification due to ammonia accumulation in sediments of Danjiangkou reservoir, China. Appl. Microbiol. Biotechnol. 2018, 102, 3399–3410. [Google Scholar] [CrossRef]
  31. State Environmental Protection Administration. Monitoring and Analysis Methods of Water Waste Water, 4th ed.; Environmental Science Press: Beijing, China, 2002. [Google Scholar]
  32. Caporaso, J.G.; Kuczynski, J.; Stombaugh, J.; Bittinger, K.; Bushman, F.D.; Costello, E.K.; Fierer, N.; Peña, A.G.; Goodrich, J.K.; Gordon, J.I.; et al. QIIME allows analysis of high-throughput community sequencing data. Nat. Methods 2010, 7, 335–336. [Google Scholar] [CrossRef] [PubMed] [Green Version]
  33. Schloss, P.D.; Westcott, S.L.; Ryabin, T.; Hall, J.R.; Hartmann, M.; Hollister, E.B.; Lesniewski, R.A.; Oakley, B.B.; Parks, D.H.; Robinson, C.J.; et al. Introducing mothur: Open-Source, Platform-Independent, Community-Supported Software for Describing and Comparing Microbial Communities. Appl. Environ. Microbiol. 2009, 75, 7537–7541. [Google Scholar] [CrossRef] [PubMed] [Green Version]
  34. Li, S.; Gu, S.; Tan, X.; Zhang, Q. Water quality in the upper Han River basin, China: The impacts of land use/land cover in riparian buffer zone. J. Hazard. Mater. 2009, 165, 317–324. [Google Scholar] [CrossRef] [PubMed]
  35. Chen, P.; Li, L.; Zhang, H. Spatio-Temporal Variations and Source Apportionment of Water Pollution in Danjiangkou Reservoir Basin, Central China. Water 2015, 7, 2591–2611. [Google Scholar] [CrossRef] [Green Version]
  36. Tan, X.; Shi, X.; Liu, G.; Xu, H.; Nie, P. An approach to analyzing taxonomic patterns of protozoan communities for monitoring water quality in Songhua River, northeast China. Hydrobiologia 2009, 638, 193–201. [Google Scholar] [CrossRef] [Green Version]
  37. Penna, A.; Casabianca, S.; Guerra, A.F.; Vernesi, C.; Scardi, M. Analysis of phytoplankton assemblage structure in the Mediterranean Sea based on high-throughput sequencing of partial 18S rRNA sequences. Mar. Genom. 2017, 36, 49–55. [Google Scholar] [CrossRef] [PubMed]
  38. Li, L.; Singh, P.; Liu, Y.; Pan, S.Q.; Wang, G. Diversity and biochemical features of culturable fungi from the coastal waters of Southern China. AMB Express 2014, 4. [Google Scholar] [CrossRef] [Green Version]
  39. Kagami, M.; Amano, Y.; Ishii, N. Community Structure of Planktonic Fungi and the Impact of Parasitic Chytrids on Phytoplankton in Lake Inba, Japan. Microb. Ecol. 2011, 63, 358–368. [Google Scholar] [CrossRef]
  40. Khomich, M.; Kauserud, H.; Logares, R.; Rasconi, S.; Andersen, T. Planktonic protistan communities in lakes along a large-scale environmental gradient. FEMS Microbiol. Ecol. 2016, 93. [Google Scholar] [CrossRef] [Green Version]
  41. Luo, W.; Bock, C.; Li, H.R.; Padisák, J.; Krienitz, L. Molecular and microscopic diversity of planktonic eukaryotes in the oligotrophic Lake Stechlin (Germany). Hydrobiologia 2010, 661, 133–143. [Google Scholar] [CrossRef]
  42. Grujcic, V.; Nuy, J.K.; Salcher, M.M.; Shabarova, T.; Kasalicky, V.; Boenigk, J.; Jensen, M.; Simek, K. Cryptophyta as major bacterivores in freshwater summer plankton. ISME J. 2018, 12, 1668–1681. [Google Scholar] [CrossRef] [PubMed] [Green Version]
  43. Li, Y.Y.; Li, J.Z.; Liang, Z.A.; Yin, W.; Hu, L.Q.; Shi, J.W.; Wang, Y. Planktonic Algae and Epilithic Algae in Typical Rivers of Danjingkou Reservoir. Adv. Mater. Res. 2011, 356, 59–62. [Google Scholar] [CrossRef]
  44. Callieri, C. Picophytoplankton in Freshwater Ecosystems: The Importance of Small-Sized Phototrophs. Freshw. Rev. 2008, 1, 1–28. [Google Scholar] [CrossRef]
  45. Lepère, C.; Isabelle, D.; Taïb, N.; Mangot, J.-F.; Bronner, G.; Delphine, B.; Dider, D. Geographic distance and ecosystem sizedetermine the distribution of smallest protists in lacustrine ecosystems. FEMS Microbiol. Ecol. 2013, 85, 85–94. [Google Scholar]
  46. Cudowski, A.; Pietryczuk, A.; Hauschild, T. Aquatic fungi in relation to the physical and chemical parameters of water quality in the Augustów Canal. Fungal Ecol. 2015, 13, 193–204. [Google Scholar] [CrossRef]
  47. Diaz, R.J.; Rosenberg, R. Spreading Dead Zones and Consequences for Marine Ecosystems. Science 2008, 321, 926–929. [Google Scholar] [CrossRef]
  48. Liu, T.; Ni Zhang, A.; Wang, J.; Liu, S.; Jiang, X.; Dang, C.; Ma, T.; Liu, S.; Chen, Q.; Xie, S.; et al. Integrated biogeography of planktonic and sedimentary bacterial communities in the Yangtze River. Microbiome 2018, 6, 1–14. [Google Scholar] [CrossRef] [Green Version]
  49. Zohary, T.; Flaim, G.; Sommer, U. Temperature and the size of freshwater phytoplankton. Hydrobiologia 2020, 1. [Google Scholar] [CrossRef]
  50. Wan, X.; Yang, T.; Zhang, Q.; Wang, W.; Wang, Y. Joint effects of habitat indexes and physic-chemical factors for freshwater basin of semi-arid area on plankton integrity—A case study of the Wei River Basin, China. Ecol. Indic. 2020, 120. [Google Scholar] [CrossRef]
  51. Edberg, S.; Rice, E.; Karlin, R.; Allen, M. Escherichia coli: The best biological drinking water indicator for public health protection. J. Appl. Microbiol. 2000, 88, 106S–116S. [Google Scholar] [CrossRef]
  52. Parmar, T.K.; Rawtani, D.; Agrawal, Y.K. Bioindicators: The natural indicator of environmental pollution. Front. Life Sci. 2016, 9, 110–118. [Google Scholar] [CrossRef] [Green Version]
  53. Gaedke, U.; Seifried, A.; Adrian, R. Biomass Size Spectra and Plankton Diversity in a Shallow Eutrophic Lake. Int. Rev. Hydrobiol. 2004, 89, 1–20. [Google Scholar] [CrossRef]
  54. Chen, M.; Chen, F.; Yu, Y.; Ji, J.; Kong, F. Genetic Diversity of Eukaryotic Microorganisms in Lake Taihu, a Large Shallow Subtropical Lake in China. Microb. Ecol. 2008, 56, 572–583. [Google Scholar] [CrossRef] [PubMed]
  55. Breuer, F.; Janz, P.; Farrelly, E.; Ebke, K.-P.; Breuer, F.; Janz, P.; Farrelly, E.; Ebke, K.-P. Environmental and structural factors influencing algal communities in small streams and ditches in central Germany. J. Freshw. Ecol. 2016, 32, 65–83. [Google Scholar] [CrossRef] [Green Version]
  56. Belykh, O.I.; Ekaterina, G.; Sorokovikova, T.; Saphonova, A.; Tikhonova, I.V. Autotrophic picoplankton of Lake Baikal: Composition, abundance and structure. Hydrobiologia 2006, 568, 9–17. [Google Scholar] [CrossRef]
  57. Barkmann, S. The significance of photoautotrophic picoplankton in the eutrophic Lake Belau (Bornhöveder Seenkette, North Germany). Limnologica 2000, 30, 95–101. [Google Scholar] [CrossRef] [Green Version]
  58. Soballe, D.M.; Kimmel, B.L. A Large-Scale Comparison of Factors Influencing Phytoplankton Abundance in Rivers, Lakes, and Impoundments. Ecology 1987, 68, 1943–1954. [Google Scholar] [CrossRef]
  59. Schallenberg, M.; Burns, C.W. Phytoplankton biomass and productivity in two oligotrophic lakes of short hydraulic res idence time. New Zeal. J. Mar. 1997, 31, 119–134. [Google Scholar] [CrossRef] [Green Version]
  60. Lindström, E.S.; Bergström, A.K. Influence of inlet bacteria on bacterioplankton assemblage composition in lakes of different hydraulic retention time. Limnol. Oceanogr. 2004, 49, 125–136. [Google Scholar] [CrossRef]
  61. Lv, H.; Yang, J.; Liu, L. Temporal pattern prevails over spatial variability in phytoplankton communities from a subtropical water supply reservoir. Oceanol. Hydrobiol. Stud. 2013, 42, 420–430. [Google Scholar] [CrossRef]
  62. Xue, Y.; Chen, H.; Yang, J.; Liu, M.; Huang, B. Distinct patterns and processes of abundant and rare eukaryotic plankton communities following a reservoir cyanobacterial bloom. ISME J. 2018, 12, 2263–2277. [Google Scholar] [CrossRef] [PubMed] [Green Version]
  63. Hein, T.; Baranyi, C.; Reckendorfer, W.; Schiemer, F. The impact of surface water exchange on the nutrient and particle dynamics in side-arms along the River Danube, Austria. Sci. Total. Environ. 2004, 328, 207–218. [Google Scholar] [CrossRef] [PubMed]
  64. GoŁdyn, R.; Szela̧g-Wasielewska, E. Changes in the phytoseston of a river-lake system in Drawieński National Park. Oceanol. Hydrobiol. Stud. 2004, 33, 17–28. [Google Scholar]
  65. Kim, D.Y.; Countway, P.D.; Jones, A.C.; Schnetzer, A.; Yamashita, W.; Tung, C.; Caron, D.A. Monthly to interannual variability of microbial eukaryote assemblages at four depths in the eastern North Pacific. ISME J. 2014, 8, 515–530. [Google Scholar] [CrossRef] [PubMed] [Green Version]
  66. Zhang, W.; Pan, Y.; Yang, J.; Chen, H.; Holohan, B.; Vaudrey, J.; Lin, S.; McManus, G.B. The diversity and biogeography of abundant and rare intertidal marine microeukaryotes explained by environment and dispersal limitation. Environ. Microbiol. 2017, 20, 462–476. [Google Scholar] [CrossRef]
  67. Meadow, J.F.; Zabinski, C.A. Spatial heterogeneity of eukaryotic microbial communities in an unstudied geothermal diatomaceous biological soil crust: Yellowstone National Park, WY, USA. FEMS Microbiol. Ecol. 2012, 82, 182–191. [Google Scholar] [CrossRef] [Green Version]
  68. Lefranc, M.; Thénot, A.; Lepère, C.; Debroas, D. Genetic Diversity of Small Eukaryotes in Lakes Differing by Their Trophic Status. Appl. Environ. Microbiol. 2005, 71, 5935–5942. [Google Scholar] [CrossRef] [Green Version]
  69. Chen, Z.; Xu, G.; Ding, C.-Y.; Zheng, B.-H.; Chen, Y.; Han, H.; Li, Y.; Shi, J.-W.; Hu, L.-Q. Illumina MiSeq sequencing and network analysis the distribution and co-occurrence of bacterioplankton in Danjiangkou Reservoir, China. Arch. Microbiol. 2020, 202, 859–873. [Google Scholar] [CrossRef]
  70. Stoecker, D.K.; Lavrentyev, P.J. Mixotrophic Plankton in the Polar Seas: A Pan-Arctic Review. Front. Mar. Sci. 2018, 5. [Google Scholar] [CrossRef]
  71. Stoecker, D.K.; Hansen, P.J.; Caron, D.A.; Mitra, A. Mixotrophy in the Marine Plankton. Annu. Rev. Mar. Sci. 2017, 9, 311–335. [Google Scholar] [CrossRef] [Green Version]
Figure 1. Map of the locations of the sampling sites in the Danjiangkou Reservoir.
Water 12 03499 g001
Figure 2. Alpha diversity assessment (AE): Sobs (A) is the observed OTU number, the Shannon (B) and Simpson (C) indexes were used to represent community diversity, and the ACE (D) and Chao (E) indexes and rarefaction curves (F) were used to represent community taxa richness.
Water 12 03499 g002
Figure 3. NMDS analysis of planktonic eukaryote community diversity.
Water 12 03499 g003
Figure 4. Samples correspond to the relative abundance of planktonic eukaryote sequences at the phylum level. In the Circos diagram, the small semicircle on the left represents the phylum composition of the sample, the color of the outer band represents the sampling site, the color of the inner band represents the phylum, and the length represents the relative abundance of the phylum in the corresponding sample. The large semicircle on the right represents the proportional distribution of each phyla in the different samples, the outer band represents the phyla, the inner band represents the different sites, and the length represents the proportional distribution of the sequences of each phylum that were from each sample.
Water 12 03499 g004
Figure 5. LEfSe multistage discriminant analysis of taxonomic differences. In the figure on the left, the circular diagram represents the classification level, from phylum to genus, from the inside to the outside. The nodes in different colors represent the microbial groups that are enriched significantly in the corresponding group and have a significant influence on the difference between the groups. The light yellow nodes represent the microbial groups that are not significantly different among different groups or have no significant influence on the difference between groups. The LDA histogram shows the number of microbial groups that have significant effects in multiple groups. The LDA scores were obtained through LDA. The larger the LDA score is, the greater the impact of the abundance of that taxon on the observed difference.
Water 12 03499 g005
Figure 6. Analysis of significant differences between groups. (* indicates significant correlation at the 0.05 level; ** indicates significant correlation at the 0.01 level; *** indicates significant correlation at the 0.001 level).
Water 12 03499 g006
Figure 7. RDA ordination biplot of planktonic eukaryote taxa and environmental factors. The RDA table for the environmental factors is shown in the lower right of the figure.
Water 12 03499 g007
Figure 8. Heatmap of Spearman correlation coefficients between planktonic eukaryotic taxa and environmental factors (* indicates significant correlation at the 0.05 level; ** indicates significant correlation at the 0.01 level; *** indicates significant correlation at the 0.001 level).
Water 12 03499 g008
Figure 9. Single- and two-factor network analysis of planktonic eukaryotes. Note: Single-factor network analysis (A) and network center coefficient distribution diagram (B); two-factor network analysis (C) and network center coefficient distribution diagram (D). Taxa with p < 0.05 are shown by default. The size of the nodes in the figure indicates the abundance of taxa, and different colors indicate different taxa. The color of the line indicates the type of correlation; red indicates a positive correlation, and green indicates a negative correlation. The thickness of the line indicates the size of the correlation coefficient; the thicker the line is, the higher the correlation between taxa. The more lines there are, the closer the connection between the nodes is.
Water 12 03499 g009
Table 1. Sample number and distribution information.
SampleAbbreviation2017
Abbreviation
2018
Abbreviation
LatitudeLongitude
KuxinK17K18K32°45′06″ N111°34′45″ E
QushouQ17Q18Q32°40′03″ N111°37′47″ E
SonggangS17S18S32°46′06″ N111°36′40″ E
HeijizuiH17H18H32°48′37″ N111°33′17″ E
TaizishanT17T18T32°40′42″ N111°32′01″ E
Table 2. Physical and chemical properties in the Danjiangkou Reservoir.
SampleLevel
/m
WT
/°C
pHDO
/mg·L−1
ORP
/mv
TP
/mg·L−1
TN
/mg·L−1
NO3-N
/mg·L−1
NH3-N
/mg·L−1
Chla
/mg·m3
Water Quality Classification
17Q156.00 ± 1.0016.90 ± 0.10 b8.45 ± 0.01 c9.79 ± 0.02 i335.00 ± 1.00 f0.02 ± 0.01 d0.90 ± 0.02 b0.70 ± 0.01 c0.05 ± 0.00 d0.60 ± 0.01 deClass II
17K156.33 ± 1.1516.53 ± 0.15 a8.49 ± 0.01 c8.70 ± 0.10 g346.00 ± 1.00 h0.01 ± 0.00 a0.95 ± 0.03 c0.76 ± 0.04 d0.03 ± 0.00 b0.50 ± 0.01 cClass I
17S156.00 ± 1.0016.65 ± 0.01 a8.64 ± 0.01 d8.50 ± 0.10 f340.00 ± 1.00 g0.02 ± 0.01 d1.01 ± 0.01 d0.51 ± 0.03 a0.15 ± 0.01 h0.42 ± 0.01 bClass II
17H156.00 ± 1.0016.66 ± 0.02 a8.20 ± 0.10 a9.63 ± 0.01 h335.00 ± 1.00 f0.01 ± 0.01 ab0.78 ± 0.03 a0.66 ± 0.02 b0.02 ± 0.00 a0.56 ± 0.01 dClass I
17T156.00 ± 1.0017.20 ± 0.10 c8.44 ± 0.01 bc8.80 ± 0.10 g302.00 ± 1.00 e0.02 ± 0.01 d1.21 ± 0.01 f1.08 ± 0.00 h0.07 ± 0.01 e1.28 ± 0.01 hClass II
18Q155.00 ± 1.0018.00 ± 0.10 d8.40 ± 0.10 bc5.40 ± 0.10 c267.00 ± 1.00 a0.01 ± 0.00 bc1.59 ± 0.00 h1.35 ± 0.00 i0.07 ± 0.00 e1.15 ± 0.01 gClass II
18K156.00 ± 1.0022.20 ± 0.10 h8.40 ± 0.10 bc5.20 ± 0.10 b266.00 ± 1.00 a0.01 ± 0.00 abc1.58 ± 0.01 h0.98 ± 0.00 f0.10 ± 0.00 g0.35 ± 0.01 aClass II
18S156.00 ± 1.0021.60 ± 0.10 g8.40 ± 0.10 bc5.80 ± 0.10 d278.00 ± 1.00 c0.01 ± 0.00 abc1.46 ± 0.00 g1.10 ± 0.00 h0.04 ± 0.00 c0.86 ± 0.01 fClass II
18H156.00 ± 1.0020.00 ± 0.06 f8.30 ± 0.06 ab7.90 ± 0.10 e271.00 ± 0.58 b0.02 ± 0.00 cd1.17 ± 0.00 f1.04 ± 0.00 g0.09 ± 0.00 f0.62 ± 0.01 eClass II
18T156.00 ± 1.0018.20 ± 0.10 e8.20 ± 0.10 a4.50 ± 0.10 a281.00 ± 1.00 d0.01 ± 0.00 abc1.09 ± 0.00 e0.95 ± 0.00 e0.09 ± 0.01 fg1.20 ± 0.10 gClass II
Note: Physicochemical properties at five sites (mean ± standard deviation for the different sampling sites).
Publisher’s Note: MDPI stays neutral with regard to jurisdictional claims in published maps and institutional affiliations.

