Analysis of Water Droplet Distribution in Wind for the Fluidic Sprinkler
by
Frank Agyen Dwomoh
1,2,*, 
Shouqi Yuan
1,
Hong Li
1,
Xingye Zhu
1,
Junping Liu
1,
Richard Mensah
2 and
Alexander Fordjour
1,2 1
Research Centre of Fluid Machinery Engineering and Technology, Jiangsu University, Zhenjiang 212013, China
2
Faculty of Engineering, Koforidua Technical University, P.O. Box 981, Koforidua 03420, Ghana
*
Author to whom correspondence should be addressed.
Water 2020, 12(12), 3320; https://doi.org/10.3390/w12123320
Submission received: 30 September 2020
/
Revised: 20 November 2020
/
Accepted: 20 November 2020
/
Published: 26 November 2020
(This article belongs to the Section Water, Agriculture and Aquaculture)
Abstract
:The fluidic sprinkler, a relatively new type of rotating sprinkler, has been the subject of quite a lot of research about its structural parameters, hydraulic characteristics, and water distribution profile, albeit under indoor conditions. The fluidic sprinkler’s performance in terms of water distribution profile and droplet size distribution pattern in wind has seen little investigation. To obtain information about its droplet size distribution in wind, the Thiess Clima Laser Precipitation Monitor was employed. Drop diameter, drop velocity, and the number of drops at varying distances from the fluidic sprinkler were measured in both wind and no wind at three operating pressures of 250, 300, and 350 kPa. The logistic model was adopted to fit a relationship between the drop diameter and the cumulative numeric frequency (CNF) and the cumulative volumetric frequency (CVF) values resulting in very high correlation coefficient (R2) values of above 0.99 for all conditions. At 250, 300, and 350 kPa, drops traveled 0.6, 1.0, and 1.3 m, respectively, farther in wind than in no wind along the direction of throw. Drops exhibited a spectrum of velocities and diameters at a given radial distance from the sprinkler. Up to two-thirds of the radius of throw, the proportion of drops with diameters ranging from 0.125 mm to 1.00 mm were above 80% at 300 and 350 kPa.
1. Introduction
The fluidic sprinkler is a new type of rotating sprinkler with the prospect of having significant advantages. It has been the subject of quite a number of studies about its structural characteristics, water distribution pattern, and droplet distribution performance, albeit under indoor (no wind) conditions [1,2,3]. Studies on its water distribution performance and droplet size distribution in the field (in wind) still remain scanty [4].
Meanwhile, water droplet distribution in the field under the influence of wind is one of the important performance indicators of sprinkler water application quality [5]. Water droplet distribution has several implications that account for the efficiency and uniformity of sprinkler irrigation systems. Soil infiltration rate, run-off, distortion of spray pattern, wind drift, and evaporation losses are directly linked to the characteristics of the droplet size distribution of a given sprinkler irrigation system [6,7,8,9,10]. Droplet size distribution is therefore an essential characteristic of the performance of the sprinkler system that can influence sprinkler selection [11].
Several factors, including the nozzle configuration, operating pressure, jet break up mechanisms as well as wind characteristics (in terms of wind speed and direction) account for drop size distribution. Many studies have been done to describe droplet size distribution from different types of irrigation sprinklers using a variety of techniques such as the pellet, stain, and photographic methods with varying degrees of accuracy [9,12,13,14]. These methods, though simple, are quite time-consuming. The advent of laser equipment, have made it possible for high-speed data collection with high accuracy in comparison to earlier methods. Laser equipment has been used in several studies for drop diameter measurements [8,15,16] using several known sprinklers and their data reported under indoor conditions. These data aid in drop size distribution modeling and analysis of fundamental transport phenomena that affect the efficiency of sprinkler systems.
The laser method has its own problems. Two major sources of measurement errors have been identified; coincidence and edge effects [11,17,18]. Studies have shown that coincidence error could be minimized by using movable shields or splash guards [19]. However, the use of movable shields to minimize the occurrences of coincidence errors also introduces a high probability of the occurrence of edge effect errors. Error reduction methods used by [15] and [18] are usually employed to minimize errors in data sets.
The fluidic sprinkler’s droplet distribution pattern under the influence of wind is necessary to ascertain its performance, at varying operating pressures for a holistic description. This is highly essential especially as the fluidic sprinkler is still undergoing several studies to improve its performance. The objective of this study, therefore, was to analyze the drop size distribution of the fluidic sprinkler under wind situations in the field and to compare it with the drop size distribution pattern under no wind situations. The study also sought to compare results with already established findings from previous works as part of efforts to ascertain its quality of performance.
2. Materials and Methods
2.1. Experimental Set-Up
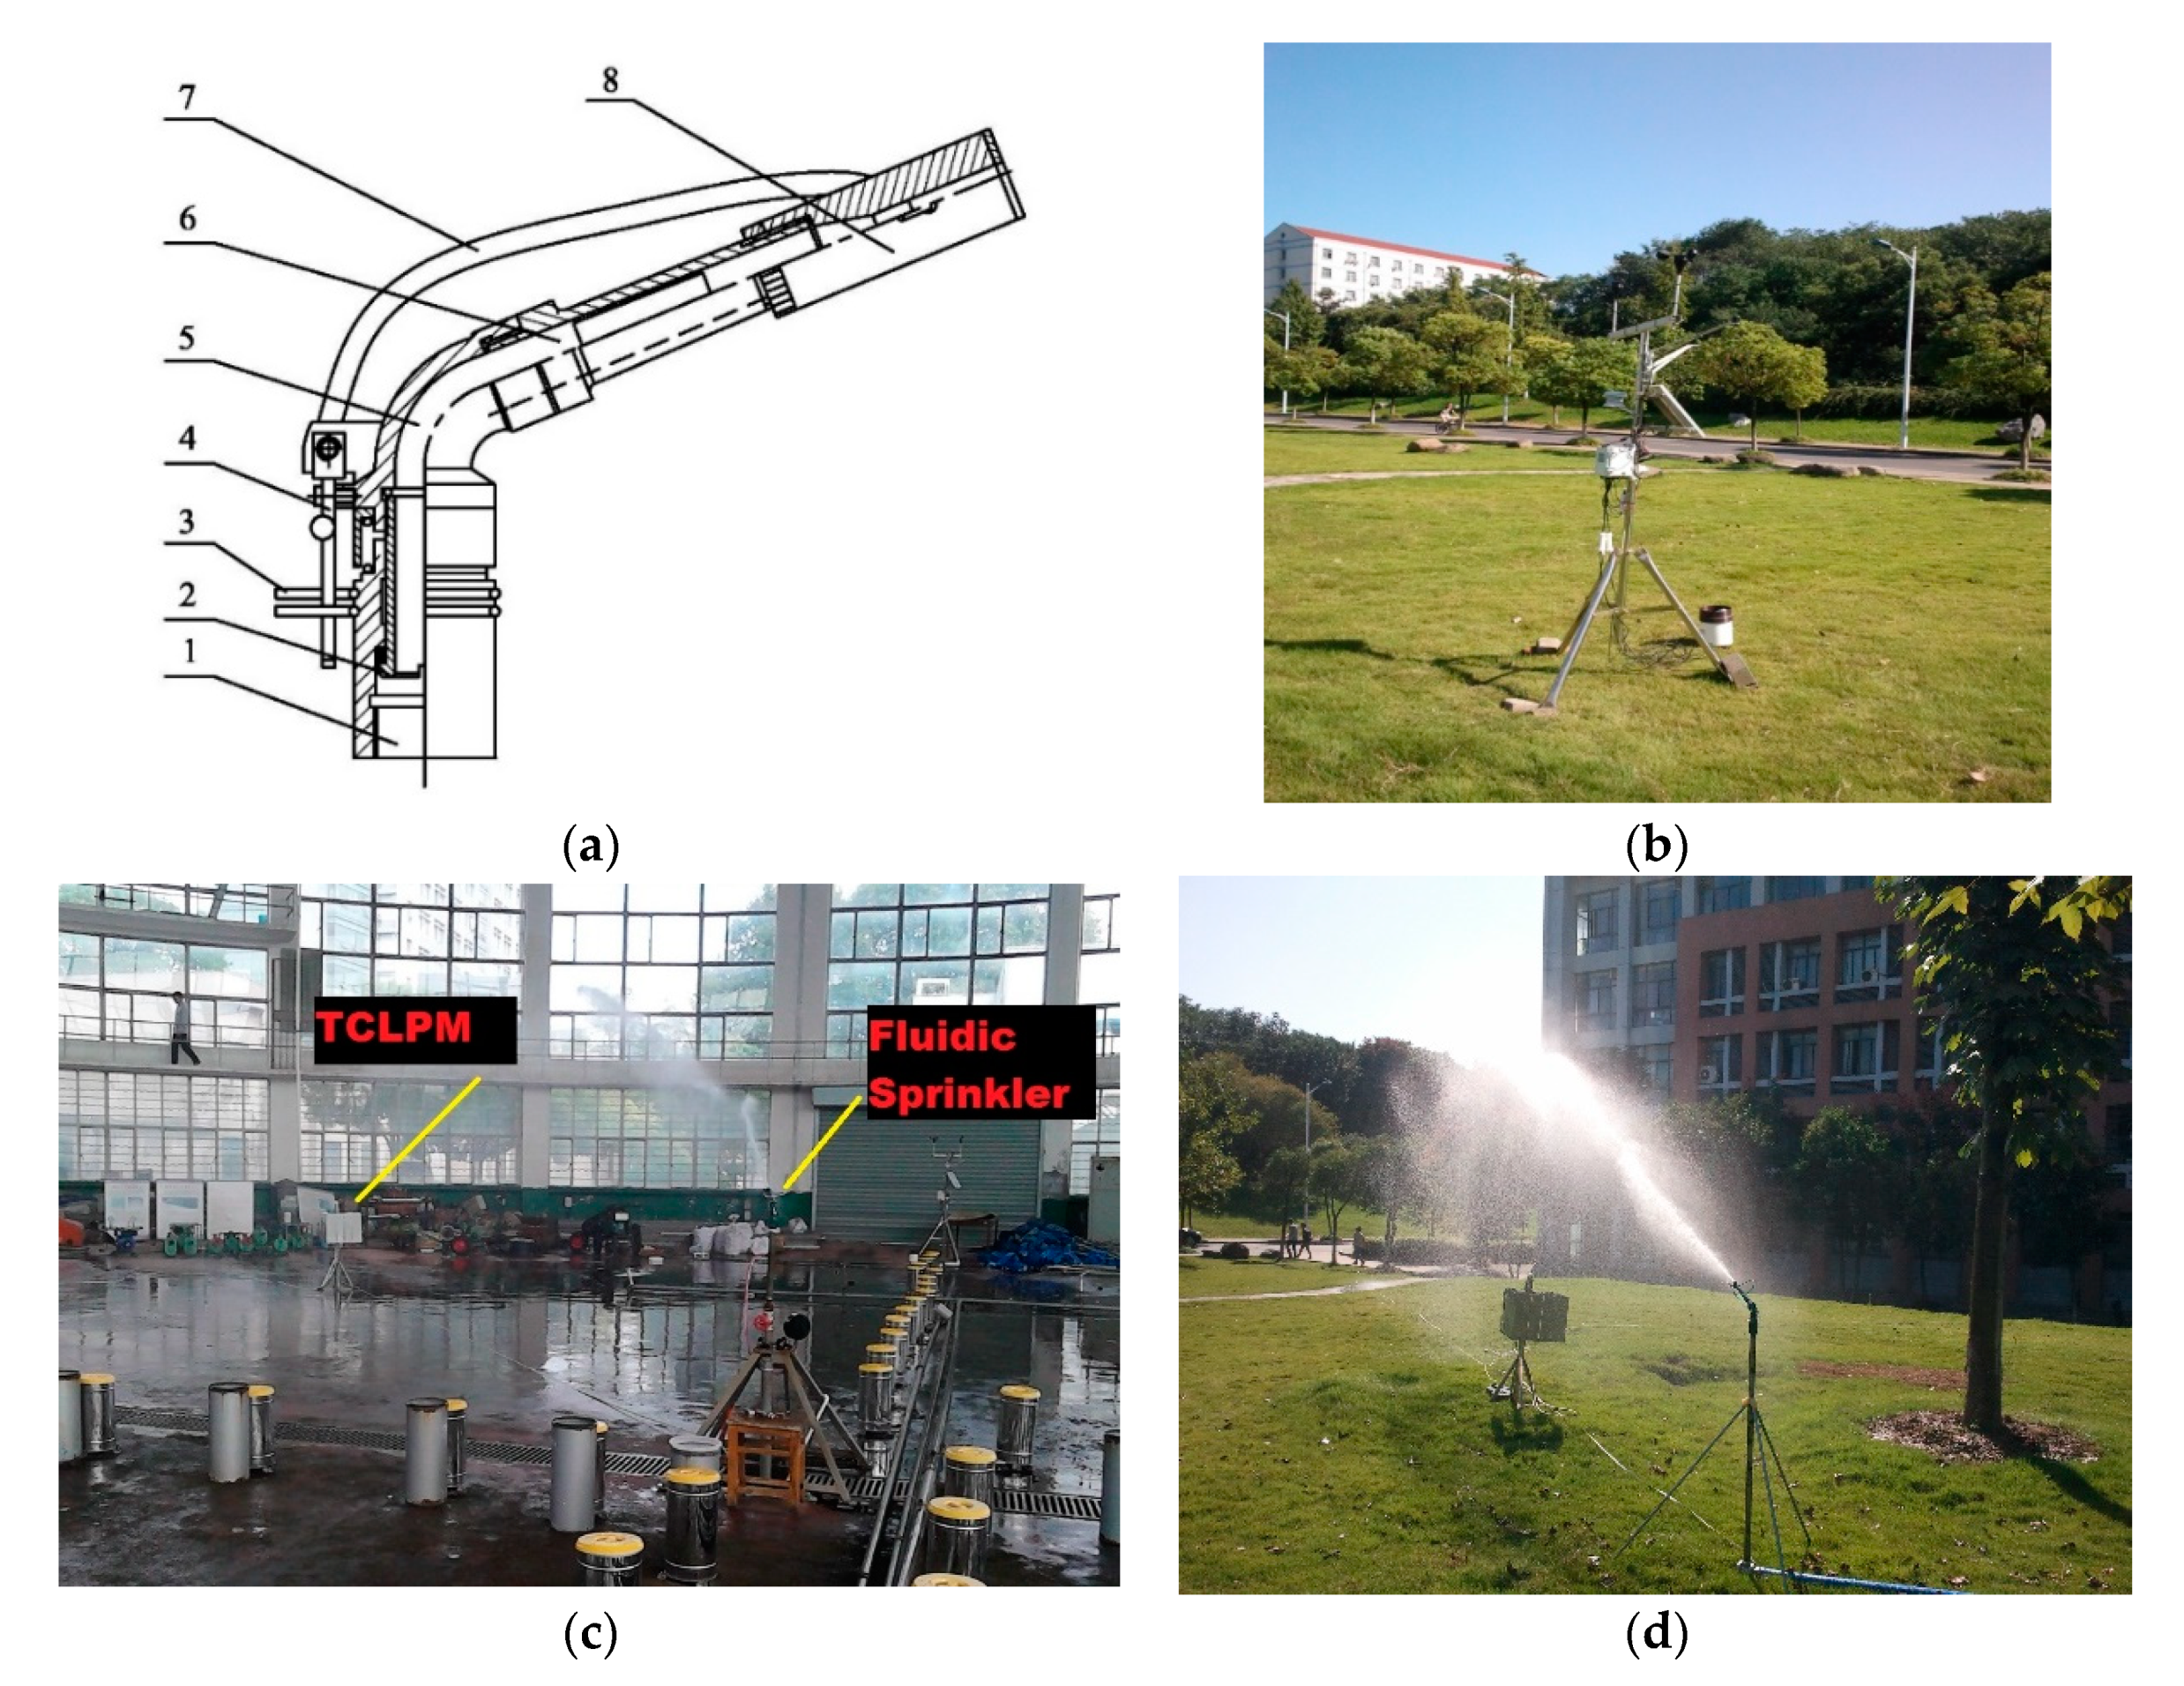
The set-up of the experiment consisted of the 20PXH model of the fluidic sprinkler (The 20PXH fluidic sprinkler used was manufactured by Shanghai Watex Water-economizer Technology Co. Ltd, China. The specifications of the 20PXH sprinkler used are shown in Table 1). The design features and the operating principles of the fluidic sprinkler have been captured in detail by [1,2,3,4,20]. The Thiess Clima Laser Precipitation Monitor (TCLPM) manufactured by Adolf Thiess GMBH and Co. KG, Gottingen, Germany [18], flow meter, pressure gauge, and connecting pipes to the source of water were used. Drop size measurements were performed using the TCLPM in both no wind conditions inside a circular building facility of 44 m diameter, shown in Figure 1c and in wind conditions, shown in Figure 1b,d [21,22], for comparison purposes. The TCLPM works such that a laser-optical beaming source produces a parallel light-beam (infrared, 785 nm). When a water drop falls through the measuring area, the receiving signal is reduced. The diameter of the drop is calculated from the amplitude of the reduction, while the drop velocity is calculated from the duration of the reduced signal. Error reduction techniques used in this experiment have been highlighted by [15,17,18,23].
The nozzle height of the sprinkler above the TCLPM was 0.8 m and the height of the TCLPM above ground level was 0.7 m. Drop size and velocity measurements were performed for three operating pressure conditions; 250, 300, and 350 kPa. The operating pressures were within ±5 KPa of the nominal pressure configuration. Discharge from the pump through the connecting tubes to the sprinkler was measured by means of a flow meter (accuracy tolerance of 0.5%). For each operating pressure, the drop size distributions were measured at 2 m intervals along a radial transect starting at 2 m from the sprinkler and ending at the farthest possible distance droplets could be collected. The sprinkler was allowed to rotate over the TCLPM five times (approximately 3 min) to ensure a sufficient number of drops passed through the measuring area. However, at the distal end of the range, beyond 90% of maximum throw distance, due to the difficulty in getting enough samples for measurements, ten rotations (approximately 5 min) were allowed over the measuring area to ensure enough samples were captured. By means of an RS 485/422 interface, the measured data were accessed on a computer. The data were ordered into cells according to the number of drops collected, drop diameter, and their corresponding measured velocity at each radial transect.
2.2. Modeling Cumulative Numeric Frequency and Cumulative Volumetric Frequency Curves
To fit a model to the droplet size distribution curves generated with the PXH20 along the radial transect, the logistic model was found to fit the experimental data very well. The logistic model is of the form;
where; are parameters. D50 is the median drop diameter size. is the cumulative percentage representing a drop diameter less than (mm). Using the software ORIGIN Pro 2018, the logistic model was used to fit the cumulative numeric frequency (CNF) and the cumulative volumetric frequency (CVF) curves generated at the three operating pressures.
3. Results and Discussion
3.1. Velocity, Number of Drops and Drop Diameter Relationship
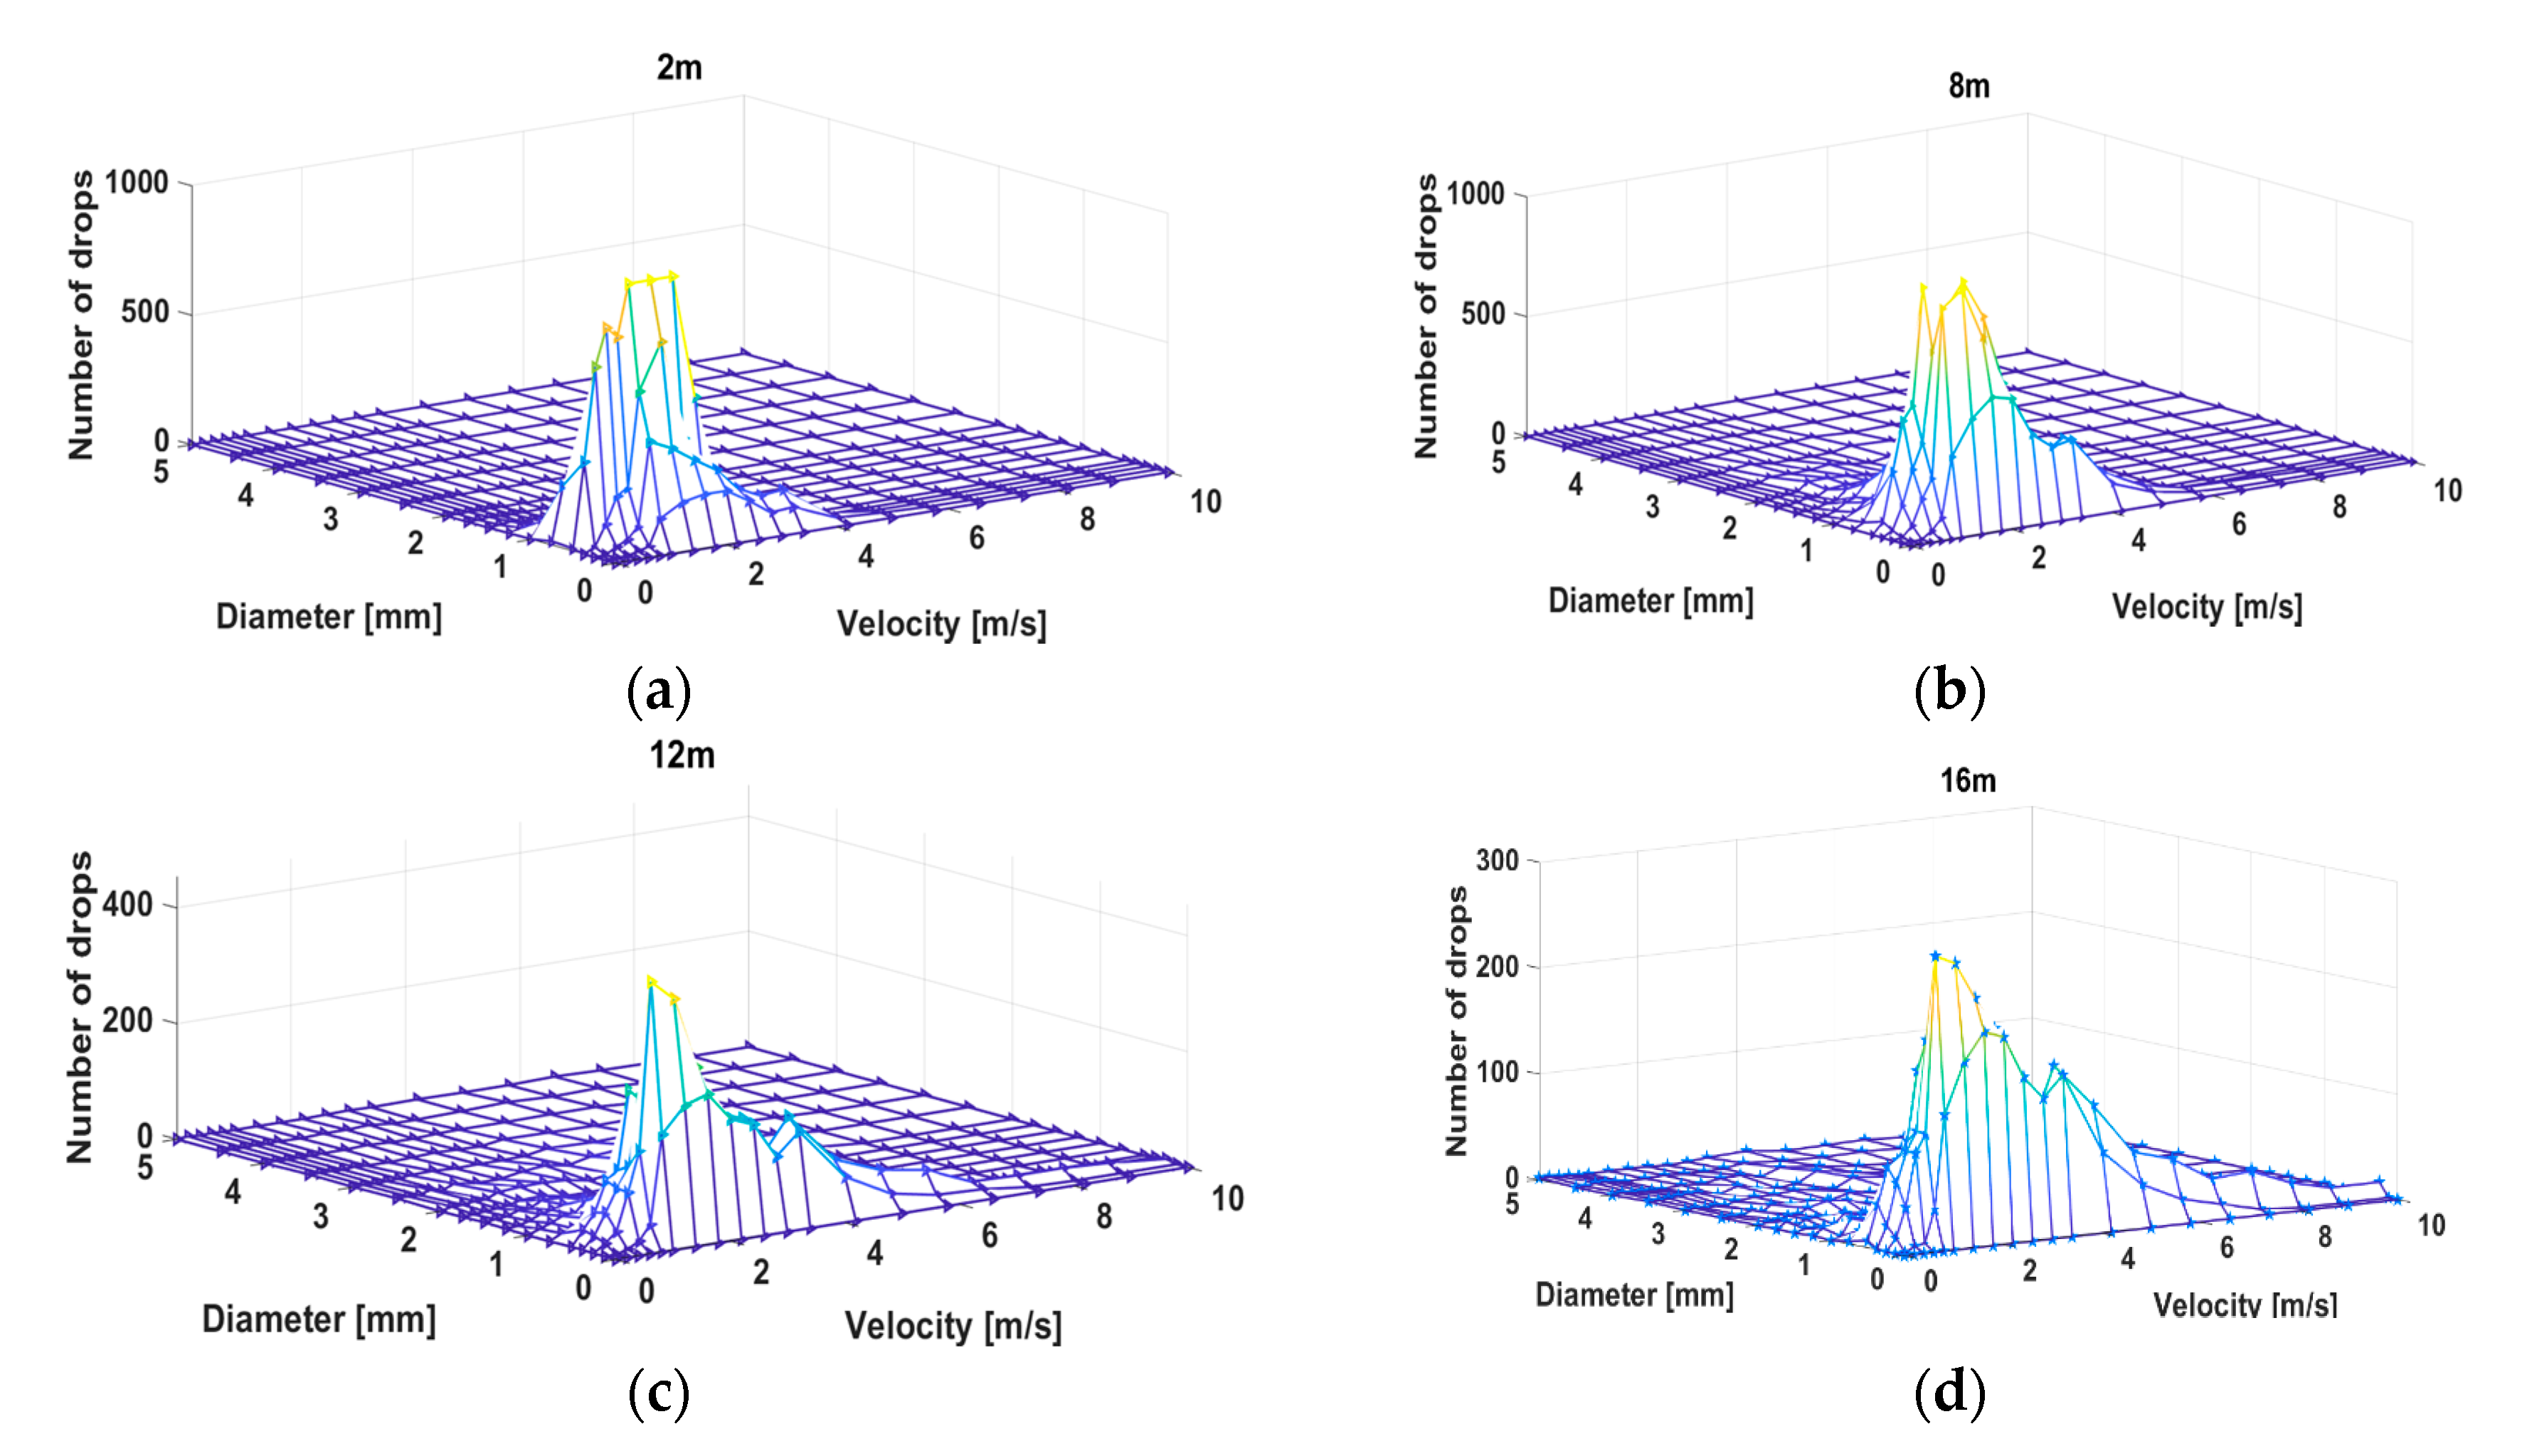
Figure 2 shows the graphical relationship between the number of drops collected, drop velocity, and drop diameter along the radial transect in wind at selected distances of 2 m, 8 m, 12 m, and 16 m, respectively, from the sprinkler nozzle at operating pressure of 300 kPa. Figure 2 shows quite significant differences in the distribution of the drop diameters, number of drops collected, and the velocity of the drops at different distances from the sprinkler. In general, a greater number of drops were collected near the sprinkler than further away from the sprinkler nozzle. This agrees with the results of [14,24,25] that the density of drops decreased with increasing radial distances.
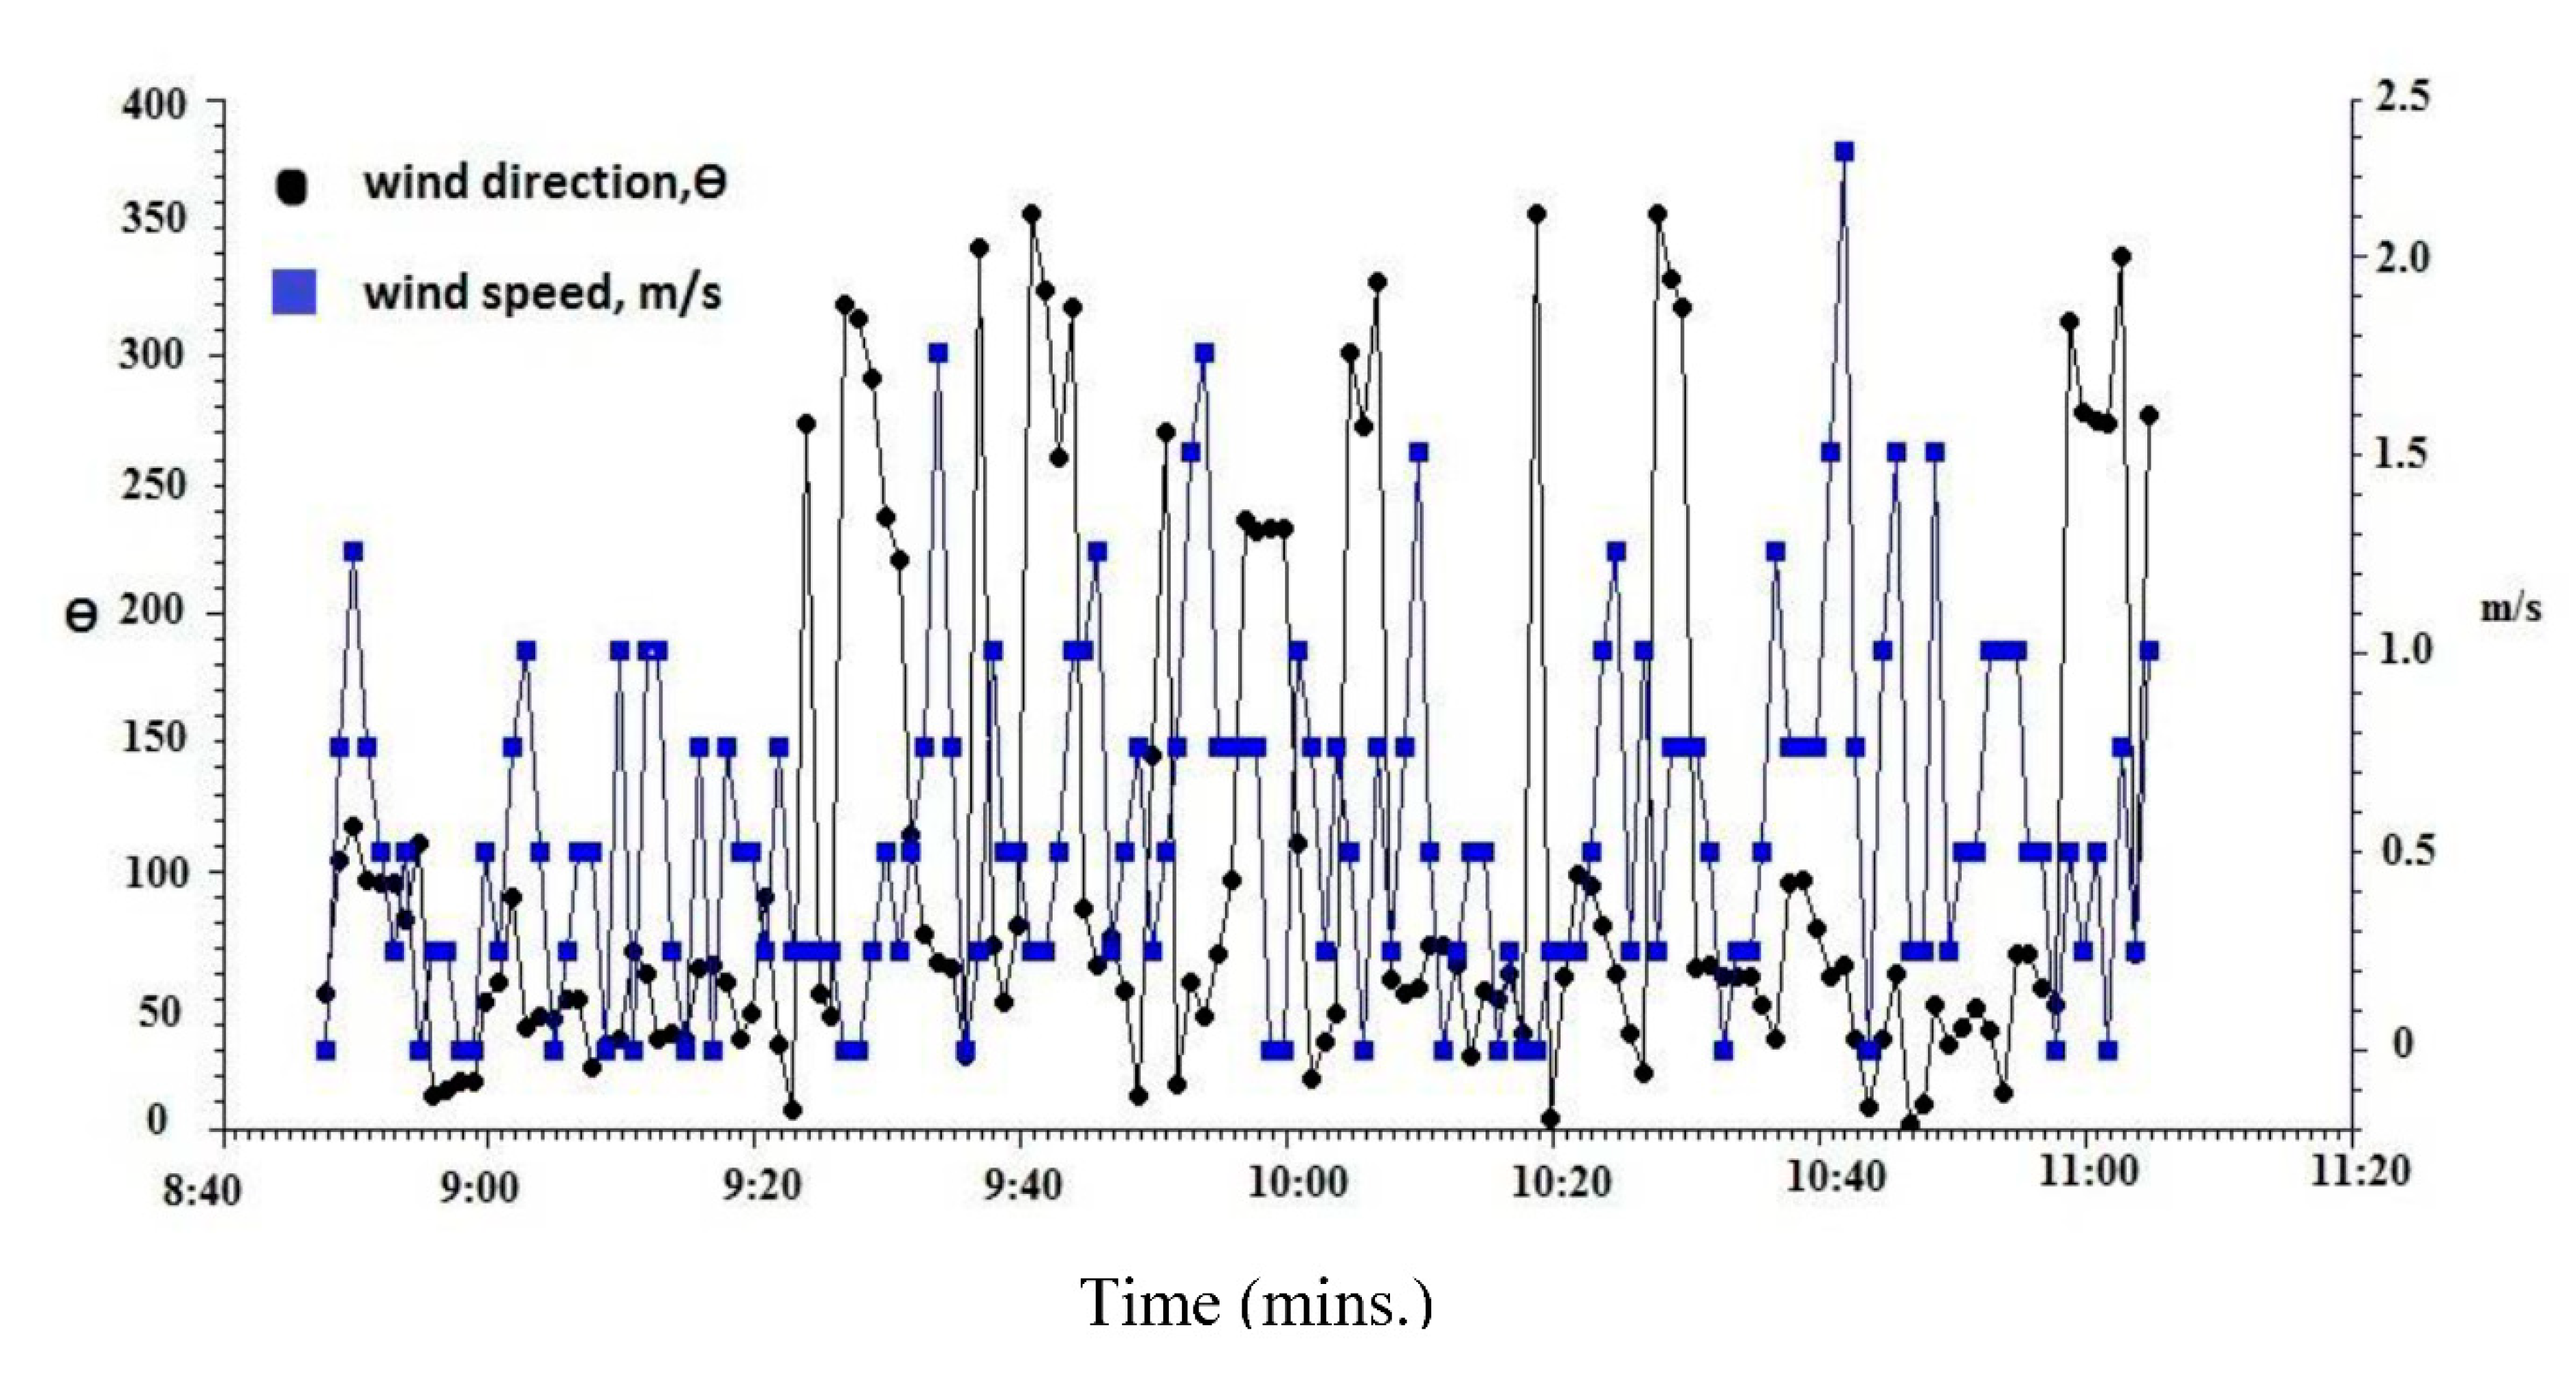
It is important to highlight that even though the prevailing wind condition had a wind direction of 10° to 300° (Figure 3), it was ensured that measurements were taken only when the wind direction was parallel to and not contrary to the direction of the throw of water. The rationale behind that was to study the impact of wind on increasing the radius of throw.
For a particular drop diameter, different velocities were measured at the same radial distance. For example, at a radial distance of 4m from the sprinkler, for a drop diameter of 0.25 mm at operating pressure of 300 kPa, the following drop velocities: 0.4 m/s, 0.8 m/s, 1.0 m/s, 1.4 m/s and their corresponding number of drops: 41, 152, 557, 365 were recorded with the TLCPM, respectively.
Additionally, at 10 m radial distance from the sprinkler drops with a diameter of 0.75 mm at operating pressure of 250 kPa, recorded velocities of 0.2 m/s, 0.6 m/s, 1.8 m/s, 3.0 m/s, 3.4 m/s and their corresponding number of drops of 28, 131, 126, 305, and 358, respectively were measured. A similar trend was observed at an operating pressure of 350 kPa. These observations show that drops exhibit a spectrum of velocity at the same radial distance and also at varying radial distances from the sprinkler [11,21]. The variability of velocity for a particular drop diameter along the radial transect can be related to the phenomenon that drop break up is a continuous process aided by aerodynamic drag and perturbations on the water jet as it exits from the sprinkler nozzle [25,26].
Figure 2 shows clearly a strong relationship between drop diameter and velocity at each point along the radial transect. From Figure 2, it is evident that fine drops had smaller velocities than drops with larger diameters. This phenomenon has been clearly collaborated by earlier researchers who used other types of rotating sprinklers [27,28]. This situation has implications on the evaporation of smaller drops as they are more likely to stay in the air for a longer duration than larger diameter drops and, therefore, are more prone to evaporation and wind drift. According to [29], for droplets to drift, the drifting droplets should have velocities much less than the prevailing average wind speed and, as a rule of thumb, drops having velocities less than 10% of the average wind speed can be considered wind drift-prone. On the other hand, comparatively larger drops with high velocities also have negative implications with regard to the kinetic energy of impact [30]. It has already been established by [31] that increasing operating pressure leads to increasing the production of smaller droplets in the sprinkler droplet spectrum. The reverse is also true. Optimization of the operating pressure is therefore important to ensure the production of an appreciable spectrum of drops of different diameters along the radial transect to reduce the negative effects of wind drift, evaporation, and kinetic energy of impact of drops, in agreement with [32,33].
3.2. Analysis of the Cumulative Distribution Curves
Figure 4 shows the variation of cumulative numeric frequency (CNF) curves and the cumulative volumetric frequency (CVF) curves with drop diameter measured at increasing radial distance from the sprinkler for 250 kPa, 300 kPa, and 350 kPa operating pressures in wind with prevailing conditions as shown in Figure 3. However, measurements were taken only when the wind was along the direction of throw.
From Figure 4, at each radial distance from the sprinkler, the curves increased steadily until it began to plateau. The CNF and CVF curves show the diameters of the drops varied at the same radial distance. For instance, at 350 kPa and at 2 m radial distance, 96% of the drops had a diameter less than 0.75 mm and out of that, 11.8% had a diameter less than 0.125 mm, which is classified as within the extremely fine and fine range according to ASABE S572.1 Droplet Size Classification [34,35]. At 19 m radial distance, 99.9% of the measured drops had a diameter less than 4 mm and out of that, 21.3% had a diameter less than 0.125 mm.
Similar observations were also made for the 250 kPa and 300 kPa operating pressures. The curves indicate a spectrum of droplet sizes at any given radial distance, which is in agreement with conclusions drawn by earlier researchers [21,36]. Therefore, it becomes simplistic to assign a definite droplet diameter to respective distances from the sprinkler as it is usually the case for the ballistic model.
Careful consideration of the drop distribution on the radial transect (Figure 4), showed a relatively higher frequency of smaller (fine) drops near the sprinkler and an increasing frequency of larger drops away from the sprinkler. For instance, from Figure 4 at 350 kPa, and radial distances of 2 m, 6 m, 10 m, and 16 m, CNF value of 96.07% correspond to drops with diameters less than 0.75 mm, 99.85% had diameters less than 2.5 mm, 99.32% had diameters less than 3 mm, and 99.87% had diameters less than 3.5 mm, respectively. This also supports the fact that fine drops begin to split from the surface of the jet immediately after the water leaves the exit of the nozzle and continuously disintegrate along its path [11,31]. Comparing the droplet size distribution of the 20PXH fluidic sprinkler obtained with data detailed in [37,38] for the impact sprinkler and also data from [18], the shape of the profiles are similar, however, the diameter of the drops obtained with the fluidic sprinkler are much smaller. Specifically, at 250 kPa at radial distances of 2 m, 6 m, 10 m, and 12 m from the sprinkler nozzle, d50 values of 0.465, 1.423, 1.670, and 2.051 mm, respectively, were obtained with the 20PXH fluidic sprinkler compared to d50 values of 1.05, 1.40, 1.92, and 3.59 mm, at radial distances of 3, 6, 9, and 12 m, respectively, at 200 kPa with the impact sprinkler (VYRSA with a straightening vane, 4.8 mm nozzle) [38].
3.3. Drop Diameter Distribution
The regression parameters as well as the adjusted R2 values of CNF at different radial distances from the sprinkler for operating pressure of 250, 300, and 350 kPa are given in Table 2.
The drop diameters under size D50 are also shown in Table 2. The adjusted R2 values for the model at different radial transects for the three operating pressures were very high ranging between 0.99338 to 0.99898 and 0.99681 to 0.99884 at radial distances of 10 m and 16 m respectively for CNF at 300 kPa. Table 3 shows the results of the model for CVF with the adjusted R2 values ranging from 0.98813 to 0.99884 at radial distances of 14 m and 6 m respectively at 300 kPa.
Similarly high adjusted R2 values were recorded at 250 kPa and 350 kPa operating pressures for CVF as shown in Table 3. Generally the D50 drop diameter sizes for CNF were less than 0.6 mm for all the operating pressures. Specifically at 350 kPa, the D50 drop diameter sizes ranged from 0.168 mm to 0.417 mm. At 300 kPa the D50 drop diameter values ranged between 0.1761 mm to 0.5912 mm and at operating pressure of 250 kPa, the D50 drop diameter sizes ranged from 0.1913 to 0.447 mm.
A comparative assessment of the Median (D50) of CNF and CVF of Table 2 and Table 3 shows that at distances near the sprinkler from 2 to 6 m, where the distribution of smaller diameter drops are high, the ratio of D50 of CVF to D50 of CNF ranged from 1.2 to 3.6 at 250 kPa, 0.6 to 1.26 at 300 kPa, and 0.98 to 1.66 at 350 kPa, respectively. However, from the middle of the radial transect to the farthest distance from the sprinkler from 10–18 m, where the frequency of larger drops increases, the ratio of the median (D50) CNF to CVF at 250, 300, and 350 kPa ranged from 4.12 to 12.6, 4.48 to 11.88, and 5.7 to 10.56, respectively. The above analyses indicate that the relationship between CNF and CVF along the radial transect is strongly affected by the distribution of the number of drops and the different sizes of the drops. This is in agreement with the deductions by [39] who used the Nelson F32 sprinkler with a 3.18 mm nozzle diameter at 400 kPa and concluded that the volume median diameter is three times greater than the numeric median diameter.
3.4. Comparison Between Droplet Distribution in Wind and No Wind Conditions
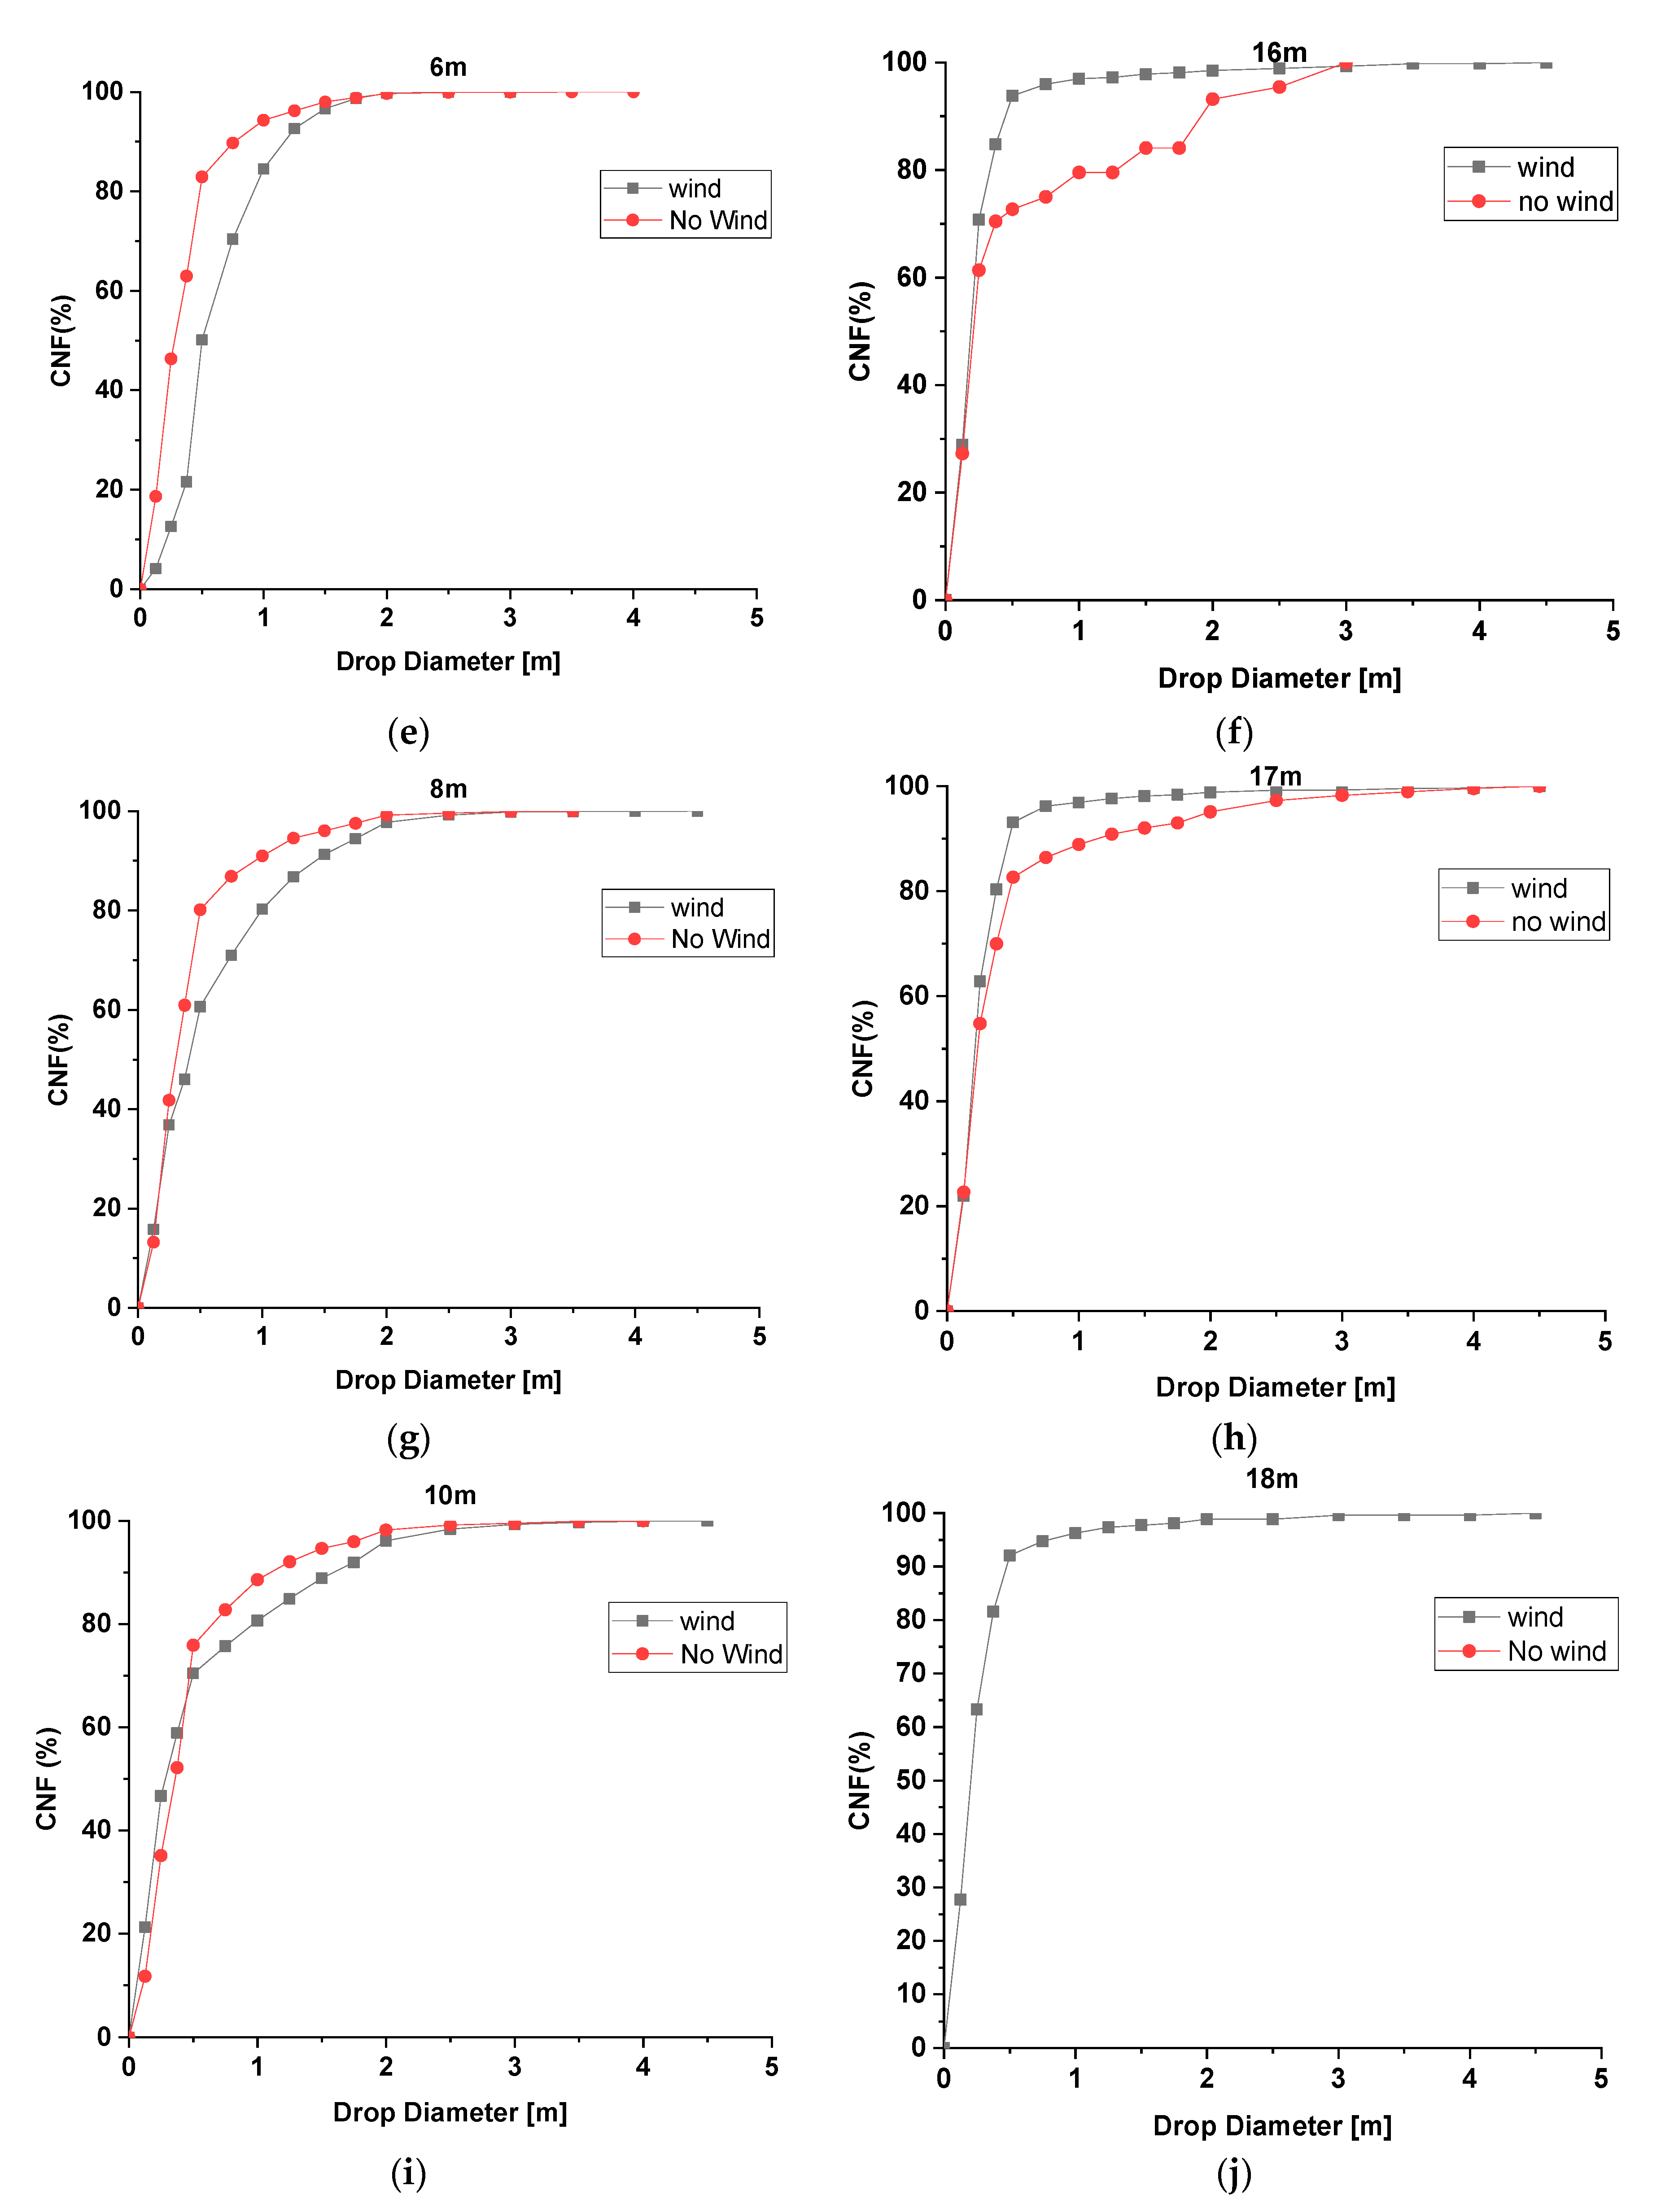
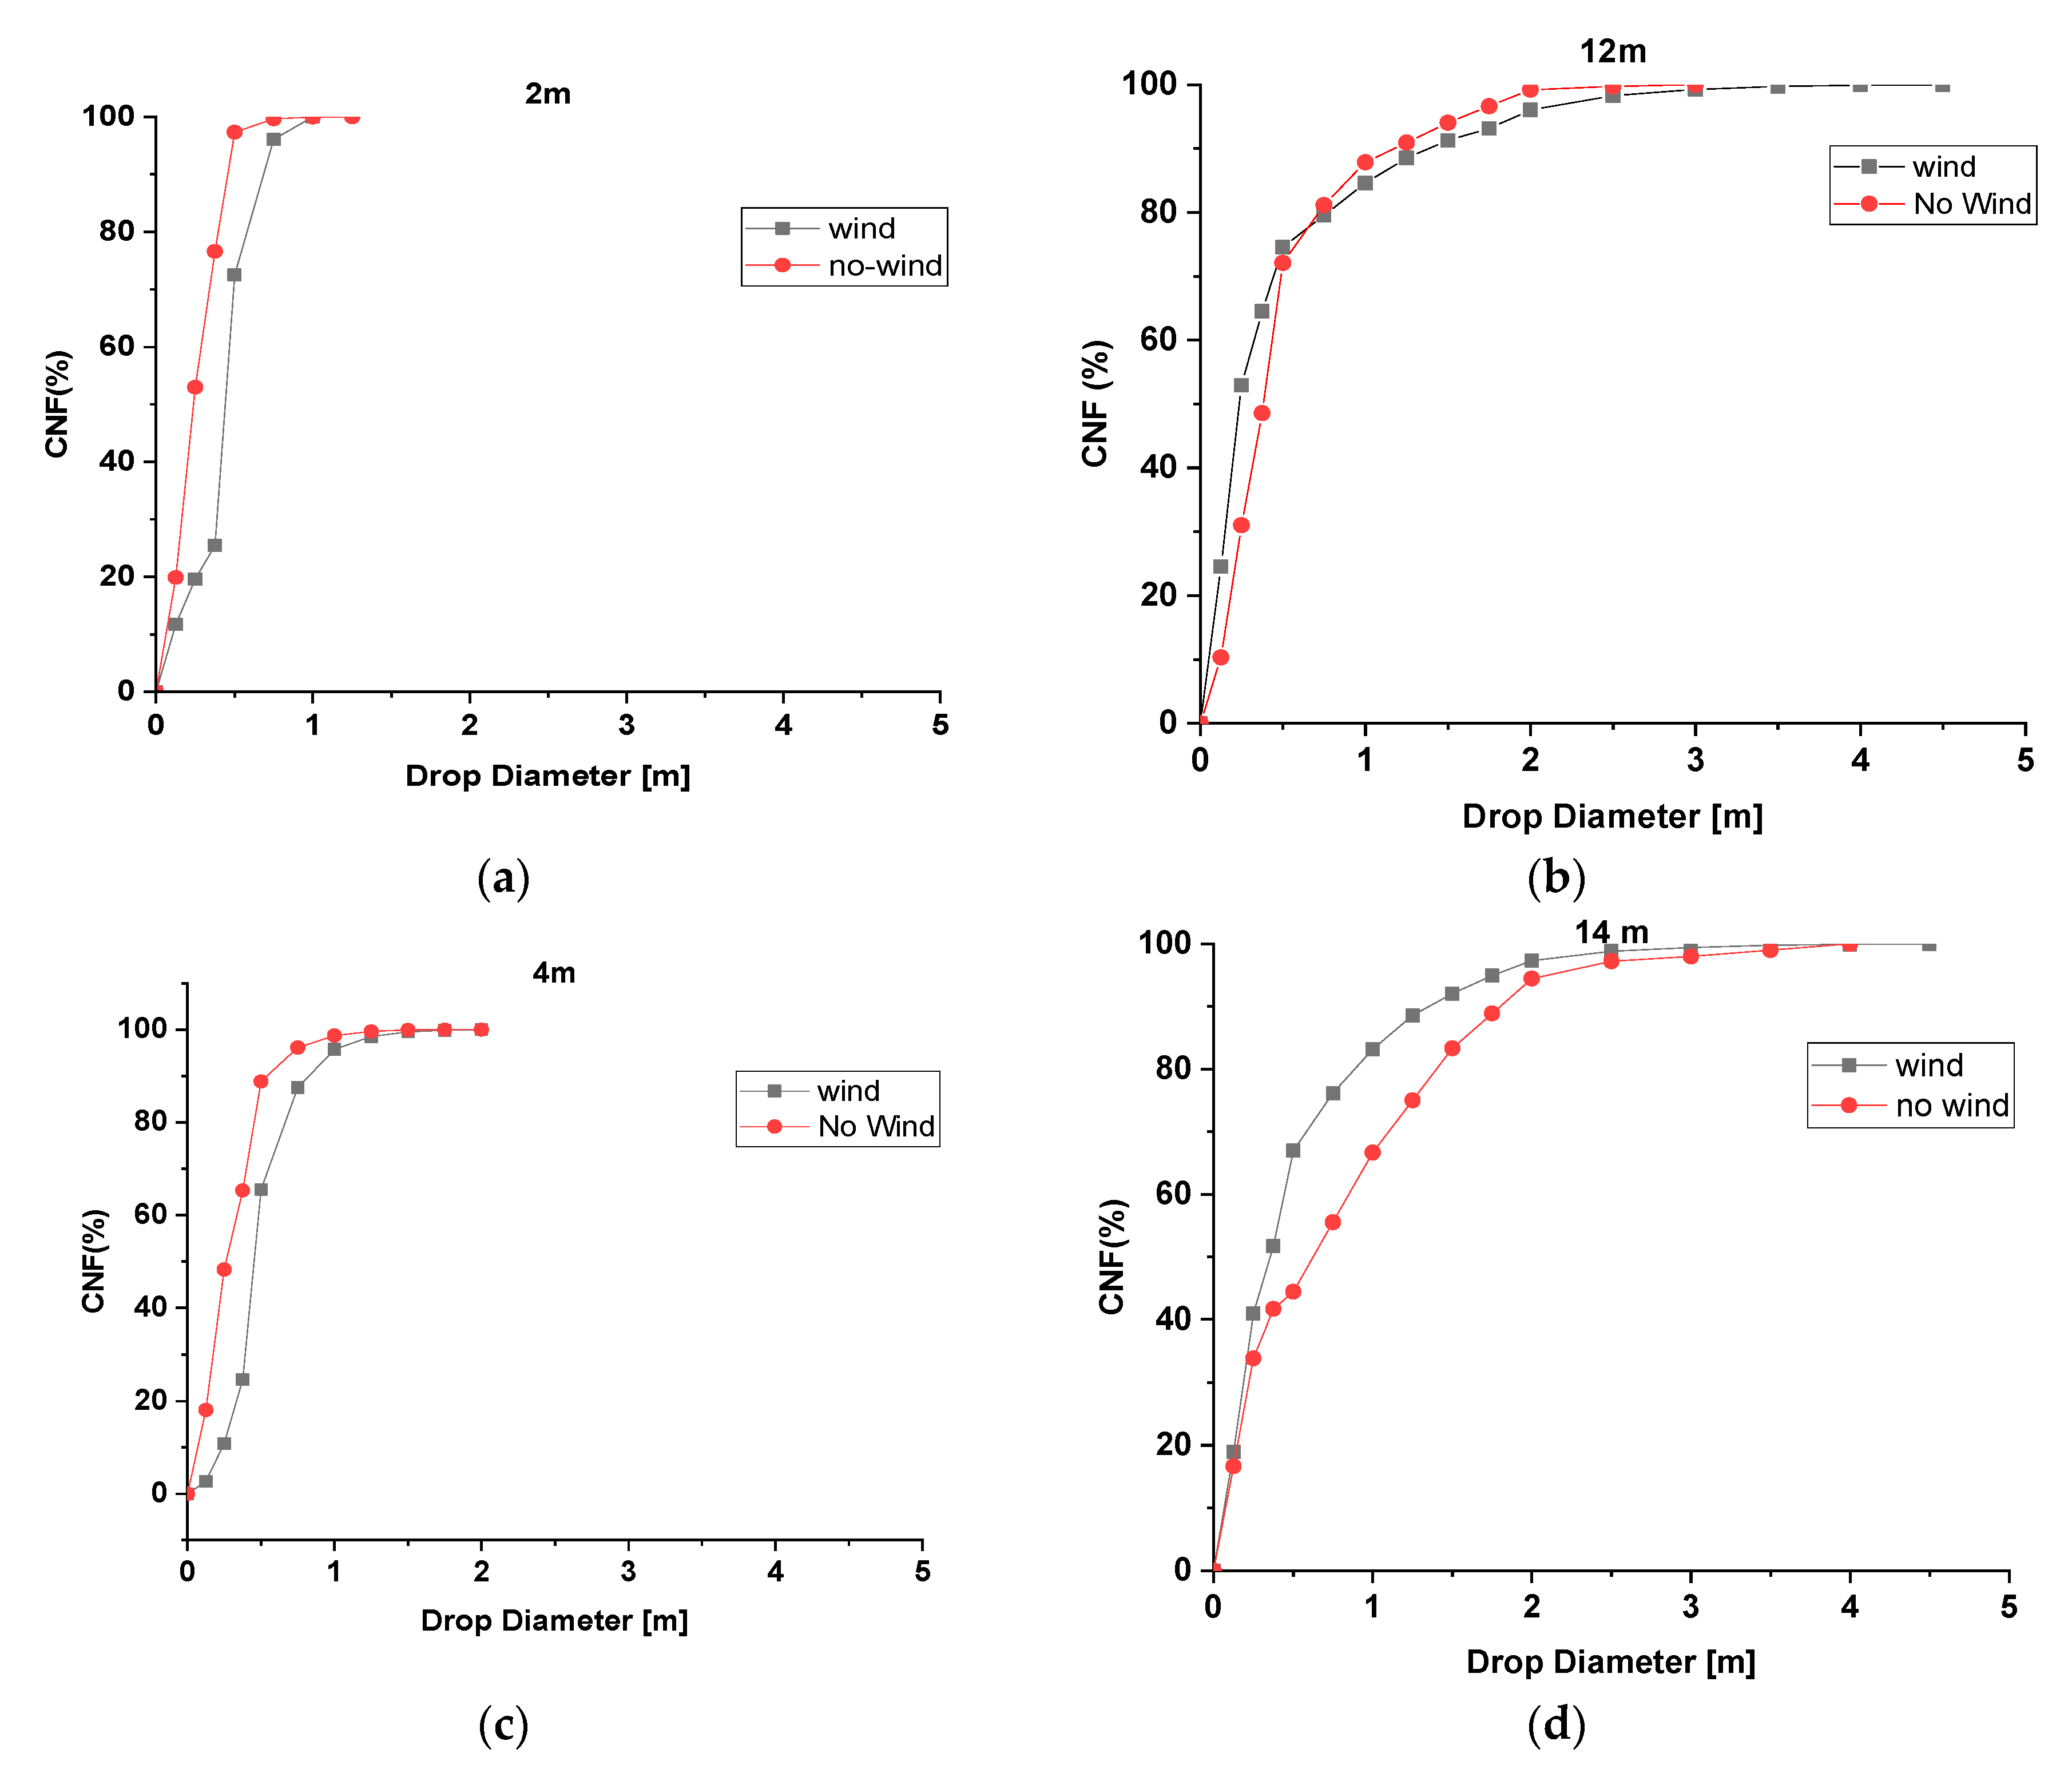
Figure 5 shows the comparison of the CNF curves for no wind and wind conditions at different distances on the sprinkler radial transect from the nozzle at an operating pressure of 300 kPa. According to [11,40], most droplet diameters in sprinkler irrigation are in the range of 0.3–3 mm. Figure 5 shows that for the fluidic sprinkler in both wind and no-wind conditions, more than 95% of the measured drops were between 0.125 to 3 mm.
In general, as shown in Figure 5, at each distance along the radial transect up to 12 m, the CNF values of no wind were higher than the wind situation. Specifically, at 2, 4, 6, 8, and 10 m along the radial transect, the CNF values recorded for the 0.5 mm droplet diameter were 72.54% against 97.3%, 65.5% against 88.8%, 50.1% against 82.9%, 60.6% against 80.1%, and 70.4% against 75.89% for the wind and no wind conditions, respectively. However, at 12 m up to the distal end on the radial transect, the reverse was observed as the CNF values for wind were generally higher than the no wind condition.
This can be attributed to the fact that up to 12 m distance from the sprinkler, the proportion of drops with a smaller diameter (0.125–1.00 mm) were higher (mostly above 80% of the spectrum) and, therefore, are wind drift-prone. However, drop break up had not been completed and therefore the larger drops traveled along the radial transect due to their high momentum in the wind direction.
The radius of throw for the PXH 20 at 300 kPa ranges between 16 to 17 m from the sprinkler depending on the discharge. A substantial number of drops were measured up to 17 m from the sprinkler for the no wind condition (Figure 5). However, in wind, a substantial number of drops were measured up to 18 m distance from the sprinkler. This observation might be attributed to the wind drift of the droplets as the percentage of drop diameters between 0.125 to 0.5 mm were more than 90% of the spectrum of drops measured at the distal end. The effects of wind on the droplets’ travel distance at 250, 300, and 350 kPa were significant as drops traveled 0.6, 1.0, and 1.3 m, respectively, farther in wind than the indoor situation along the direction of throw.
4. Conclusions
Analysis of the droplet distribution characteristics of the fluidic sprinkler in wind has been established. Droplet distribution profiles in wind and in no wind at the same operating pressures were compared to ascertain the effect of wind on the distribution.
Under average wind speed of 1.25 m/s with the wind along the direction of throw at 250, 300, and 350 kPa, droplets traveled 0.6, 1.0, and 1.3 m farther in wind than the indoor situation, respectively.
Up to 12 m, which is two-thirds of the distance from the fluidic sprinkler nozzle, the proportion of drops with diameters ranging from 0.125 mm to 1.00 mm were above 80% of the spectrum at operating pressures of 300 and 350 kPa.
Drops exhibited a spectrum of velocities as well as a spectrum of diameters at a given radial distance and along the radial transect. The logistic model was adopted to fit the relationship between drop diameter and CNF and CVF using the ORIGIN Pro 2018 version with very high correlation coefficient (R2) values of above 0.99 for all operating conditions along the radial transect.
The relationship between CNF and CVF along the radial transect is affected by the distribution of the number of drops, the different sizes of the drops, and the distance from the sprinkler nozzle.
Author Contributions
F.A.D. experimental design, data acquisition, analysis and writing the original manuscript; X.Z. supervision and revision; S.Y. main supervisor and acquisition of funding; H.L. supervision; and J.L. data acquisition; R.M. data analysis and visualization; A.F. revision. All authors have read and agreed to the published version of the manuscript.
Funding
This research was funded by the National Natural Science Foundation of China (number 51679109, 51939005), the National Key Research and Development Program, (No.2016YFC0400202), and the Priority Academic Program Development of Jiangsu Higher Education Institutions (No. PAPD-2018-87).
Acknowledgments
The authors highly acknowledge the support from the Management of Jintan Wang-da Sprinkler Co. Ltd., Staff and students of the Sprinkler Group of the Technical Research Centre of Fluid Machinery Engineering, Jiangsu University for assistance during the field test.
Conflicts of Interest
The authors declare no conflict of interest.
References
- Zhu, X.; Yuan, S.; Li, H.; Liu, J. Orthogonal Tests and Precipitation Estimates for the Outside Signal Fluidic Sprinkler. Irrig. Drain. Syst. 2009, 23, 163–172. [Google Scholar] [CrossRef]
- Li, H.; Yuan, S.-Q.; Xiang, Q.-J.; Wang, C. Theoretical and Experimental Study on Water Offset Flow in Fluidic Component of Fluidic Sprinklers. J. Irrig. Drain. Eng. 2011, 137, 234–243. [Google Scholar] [CrossRef]
- Zhu, X.; Yuan, S.; Jiang, J.; Liu, J.; Liu, X. Comparison of Fluidic and Impact Sprinklers Based on Hydraulic Performance. Irrig. Sci. 2015, 33, 367–374. [Google Scholar] [CrossRef]
- Dwomoh, F.A.; Shouqi, Y.; Hong, L. Field Performance Characteristics of Fluidic sprinkler. Appl. Eng. Agric. 2013, 29, 529–536. [Google Scholar]
- Molle, B. Characterizing Droplet Distribution of an Irrigation Sprinkler Using Optical method. Ingénieries 2002, 31, 57–68. [Google Scholar]
- Burke, M.; Thompson, S.; Elcombe, C.R.; Halpert, J.; Haaparanta, T.; Mayer, R.T. Ethoxy-, Pentoxy- and Benzyloxyphenoxazones and Homologues: A Series of Substrates to Distinguish Between Different Induced Cytochromes P-450. Biochem. Pharmacol. 1985, 34, 3337–3345. [Google Scholar] [CrossRef]
- Thompson, A.L.; Gilley, J.R.; Norman, J.M. A Sprinkler Water Droplet Evaporation and Plant Canopy Model: II. Model Application. Trans. ASAE 1993, 36, 743–750. [Google Scholar] [CrossRef]
- King, B.A.; Bjorneberg, D.L. Characterizing Droplet Kinetic Energy Applied by Moving Spray-Plate Center-Pivot Irrigation Sprinklers. Trans. ASABE 2010, 53, 137–145. [Google Scholar] [CrossRef]
- Hills, D.J.; Gu, Y. Sprinkler Volume Mean Droplet Diameter as a Function of Pressure. Trans. ASAE 1989, 32, 0471–0476. [Google Scholar] [CrossRef]
- Von Bernuth, R.D. Effect of Trajectory Angle on Performance of Sprinklers in Wind. J. Irrig. Drain. Eng. 1988, 114, 579–587. [Google Scholar] [CrossRef]
- Kincaid, D.C. Spraydrop Kinetic Energy from Irrigation Sprinklers. Trans. ASAE 1996, 39, 847–853. [Google Scholar] [CrossRef] [Green Version]
- Laws, J.; Parson, D. The Relationship of Raindrop Siza to Intensity. Trans. Am. Geophys. 1943, 24, 452–460. [Google Scholar] [CrossRef]
- Kohl, R.A.; DeBoer, D.W.; Evenson, P.D. Kinetic Energy of Low Pressure Spray Sprinklers. Trans. ASAE 1985, 28, 1526–1529. [Google Scholar] [CrossRef]
- Li, J.; Kawano, H.; Yu, K. Droplet Size Distributions from Different Shaped Sprinkler Nozzles. Trans. ASAE 1994, 37, 1871–1878. [Google Scholar] [CrossRef]
- Kincaid, D.C.; Solomon, K.H.; Oliphant, J.C. Drop Size Distributions for Irrigation Sprinklers. Trans. ASAE 1996, 39, 839–845. [Google Scholar] [CrossRef]
- Molle, B. Characterising Droplet Distribution of an Irrigation Sprinkler Water application. In Proceedings of the Congrès ICID, Montréal, QC, Canada, 22–27 July 2002; p. 13. [Google Scholar]
- Kohl, R.A.; Von Bernuth, R.D.; Huebner, G. Drop Size Distribution Measurement Problems Using a Laser Unit. Trans. ASAE 1985, 28, 190–192. [Google Scholar] [CrossRef]
- King, B.A.; Winward, T.W.; Bjorneberg, D.L. Laser Precipitation Monitor for Measurement of Drop Size and Velocity of Moving Spray-Plate Sprinklers. Appl. Eng. Agric. 2010, 26, 263–271. [Google Scholar] [CrossRef]
- Evans, R.G.; A King, B. Site-Specific Sprinkler Irrigation in a Water Limited Future. In Proceedings of the 5th National Decennial Irrigation Conference, Phoenix Convention Center, Phoenix, AZ, USA, 5–8 December 2010; p. 1. [Google Scholar]
- Liu, J.; Yuan, S.; Li, H.; Zhu, X.Y. Numerical Simulation and Experimental Study on a New Type of Variable-Rate Fluidic Sprinkler. J. Agric. Sci. Technol. 2013, 15, 569–581. [Google Scholar]
- Zhu, X.; Fordjour, A.; Yuan, S.; Dwomoh, F.; Ye, D. Evaluation of Hydraulic Performance Characteristics of a Newly Designed Dynamic Fluidic Sprinkler. Water 2018, 10, 1301. [Google Scholar] [CrossRef] [Green Version]
- Dwomoh, F.A.; Shouqi, Y.; Hong, L. Sprinkler Rotation and Water Application Rate for the New Type Complete Fluidic Sprinkler and Impact sprinkler. Int. J. Agric. Biol. Eng. 2014, 7, 38–46. [Google Scholar]
- Solomon, K.; Zoldoske, D.; Oliphant, J. Laser Optical Measurement of Sprinkler Drop Sizes; American Society of Agricultural Engineers: St. Joseph, MI, USA, 1991. [Google Scholar]
- Dwomoh, F.A. Droplet Size Characterization of the New Type Complete Fluidic Sprinkler. IOSR J. Mech. Civ. Eng. 2014, 11, 70–73. [Google Scholar] [CrossRef]
- Hong, H.; Jiang, Y.; Tang, P.; Chao, C.; Fordjour, A. Comparative Evaluation on Performance Characteristics of an Impact Sprinkler with Nozzle-Dispersion Devicesand Rotary Plate Sprinkler. Appl. Eng. Agric. 2020, 36, 321–329. [Google Scholar] [CrossRef]
- Li, H.; Issaka, Z.; Jiang, Y.; Tang, P.; Chen, C. Influence of a fixed water dispersion device on jet dispersion and range from an impact sprinkler. Irrig. Drain. 2019, 68, 669–678. [Google Scholar] [CrossRef]
- Nuyttens, D.; De Schampheleire, M.; Verboven, P.; Brusselman, E.; DeKeyser, D. Droplet Size and Velocity Characteristics of Agricultural Sprays. Trans. ASABE 2009, 52, 1471–1480. [Google Scholar] [CrossRef]
- Sidahmed, M.M. A Theory for Predicting the Size and Velocity of Droplets from Pressure Nozzles. Trans. ASAE 1996, 39, 385–391. [Google Scholar] [CrossRef]
- Holterman, H.J. Kinetics and Evaporation of Water Drops in Air; IMAG: Wageningen, The Netherlands, 2003. [Google Scholar]
- Ge, M.; Wu, P.; Zhu, D.; Zhang, L. Application of Different Curve Interpolation and Fitting Methods in Water Distribution Calculation of Mobile Sprinkler Machine. Biosyst. Eng. 2018, 174, 316–328. [Google Scholar] [CrossRef]
- Li, J. Effect of Pressure and Nozzle Shape on the Characteristics of Sprinkler Droplet Spectra. J. Agric. Eng. Res. 1997, 66, 15–21. [Google Scholar] [CrossRef]
- Martín-Benito, J.T.; Gómez, M.V.; Pardo, J.L. Working Conditions of Sprinkler to Optimize Application of Water. J. Irrig. Drain. Eng. 1992, 118, 895–913. [Google Scholar] [CrossRef]
- Li, H.; Issaka, Z.; Jiang, Y.; Tang, P.; Chen, C. Overview of Emerging Technologies in Sprinkler Irrigation to Optimize Crop Production. Int. J. Agric. Biol. Eng. 2019, 12, 1–9. [Google Scholar] [CrossRef] [Green Version]
- Fritz, B.K.; Hoffmann, W.C.; Czaczyk, Z.; Bagley, W.; Kruger, G.R.; Henry, R.S. Measurement and Classification Methods Using the ASAE S572.1 Reference Nozzles. J. Plant Prot. Res. 2012, 52, 447–457. [Google Scholar] [CrossRef]
- Butts, T.R.; Samples, C.A.; Franca, L.X.; Dodds, D.M.; Reynolds, D.B.; Adams, J.W.; Zollinger, R.K.; Howatt, K.A.; Fritz, B.K.; Hoffmann, W.C.; et al. Spray Droplet Size and Carrier Volume Effect on Dicamba and Glufosinate Efficacy. Pest Manag. Sci. 2018, 74, 2020–2029. [Google Scholar] [CrossRef] [PubMed]
- Xiang, Q.; Qureshi, W.A.; Tunio, M.H.; Solangi, K.A.; Xu, Z.; Lakhiar, I.A. Low-Pressure Drop Size Distribution Characterization of Impact Sprinkler Jet Nozzles with and Without Aeration. Agric. Water Manag. 2021, 243, 106458. [Google Scholar] [CrossRef]
- Zhu, X.; Yuan, S.-Q.; Liu, J.; Liu, X. Comparison of Droplet Distributions from Fluidic and Impact Sprinklers. Front. Agric. Sci. Eng. 2015, 2, 53–59. [Google Scholar] [CrossRef]
- Salvador, R.; Bautista-Capetillo, C.F.; Burguete, J.; Zapata, N.; Serreta, A.; Playán, E. A Photographic Method for Drop Characterization in Agricultural Sprinklers. Irrig. Sci. 2009, 27, 307–317. [Google Scholar] [CrossRef]
- Friso, D.; Bortolini, L. Numerical and Volumetric Frequency of Sprinkler Drop-Size from Water Distribution Radial Curve Part II: Experimental Validation. J. Eng. Appl. Sci. 2006, 12, 2672–2677. [Google Scholar]
- Bautista-Capetillo, C.F.; Salvador, R.; Burguete, J.; Montero, J.; Tarjuelo, J.M.; Zapata, N.; González, J.; Playán, E. Comparing Methodologies for the Characterization of Water Drops Emitted by an Irrigation Sprinkler. Trans. ASABE 2009, 52, 1493–1504. [Google Scholar] [CrossRef]
Figure 1.
Schematic and pictorial views of fluidic sprinkler and experimental set-up. (a) Schematic view of the fluidic sprinkler. 1-Swivel connection; 2-Connecting sleeve; 3-Limiting mechanism; 4-Reversing mechanism; 5-Body sprayer; 6-Pipe sprayer; 7-Plastic tube; 8-fluidic component; (b) Campbell Scientific-WxPRO Research Grade Entry Level -Weather Station; (c) Measurement in no wind [24]; (d) Measurement in wind.

Figure 2.
Graphical representation of the relationship between the number, diameter, and velocities of drops collected with the Thiess Clima Laser Precipitation Monitor (TLCPM) at different distances from the sprinkler nozzle... (a) Measured at 2 m, (b) measured at 8 m, (c) measured at 12 m and (d) measured at 16m respectively from the sprinkler at operating pressure of 300 kPa.

Figure 3.
Wind characteristics during the field experiment.

Figure 4.
Plot of cumulative numeric frequency (CNF) (%) and cumulative volumetric frequency (CVF) (%) against the diameter of drops (mm) at 250 kPa, 300 kPa, and 350 kPa respectively. Where (a) is CNF vs. Drop diameter at 250 kPa; (b) CVF vs. Drop diameter at 250 kPa; (c) CNF vs. Drop diameter at 300 kPa; (d) CVF vs. Drop diameter at 300kPa; (e) CNF vs. Drop diameter at 350 kPa; (f) CVF vs. Drop diameter at 350 kPa.
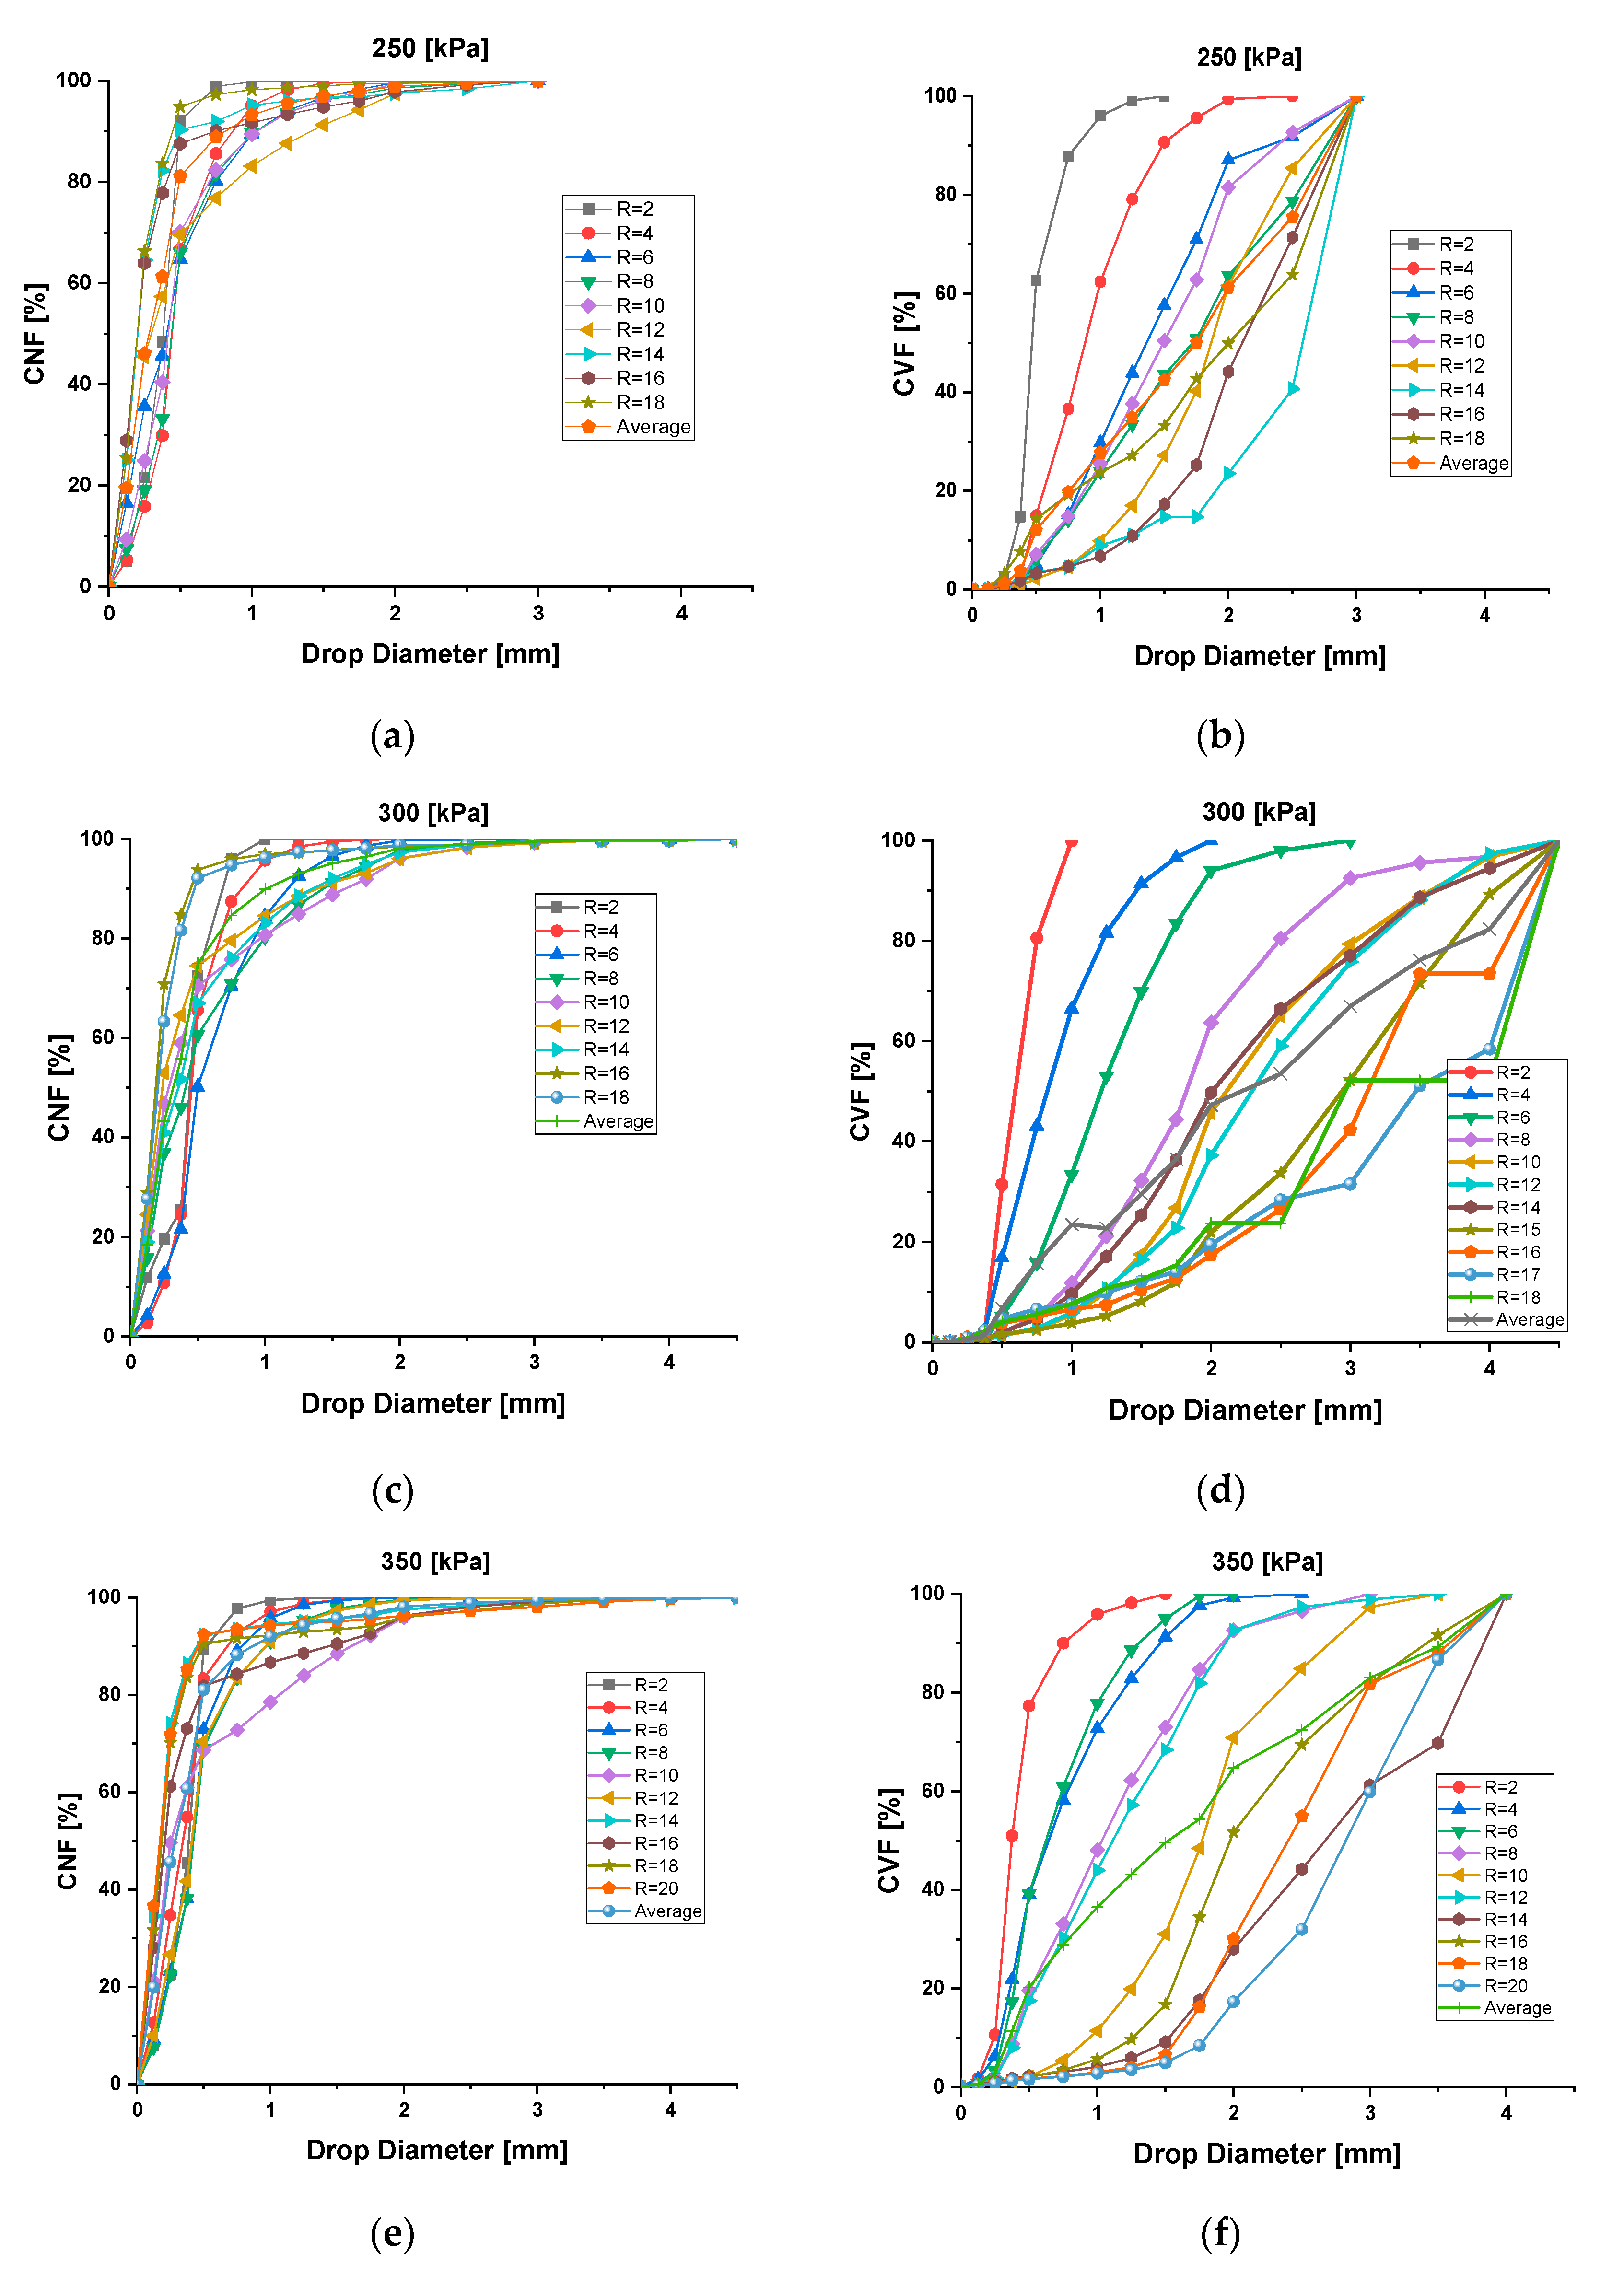
Figure 5.
Comparison between the cumulative numeric frequency (CNF) droplet distribution curves in wind (wind speed: ranged between 0 to 2 m/s, average wind speed at 1.25 m/s with wind direction along the direction of throw) and in no-wind at different distances from the sprinkler at 300 kPa. Where (a) is CNF vs. Drop diameter at 2 m; (b) CNF vs. Drop diameter at 12 m; (c) CNF vs. Drop diameter at 4 m (d) CNF vs. Drop diameter at 4 m (e) CNF vs. Drop diameter at 6 m (f) CNF vs. Drop diameter at 16 m; (g) CNF vs. Drop diameter at 8 m; (h) CNF vs. Drop diameter at 17 m; (i) CNF vs. Drop diameter at 10 m; (j) CNF vs. Drop diameter at 18 m.


Table 1.
Design specifications of the fluidic sprinkler used.
| S/N | Characteristic Features | Symbols | PXH20 |
|---|---|---|---|
| 1 | Inner Contraction angle | Θ ([0) | 20 |
| 2 | Offset lengths | S (mm) | 2.8 |
| 3 | Working area Length | L (mm) | 28 |
| 4 | Basic Hole diameter | D (mm) | 8 |
| 5 | Wetted Radius | R (m) | 17–20 |
Table 2.
Regression parameters A1, A2, λ, D50 and R2 for the model equation using the CNF at 250, 300, and 350 kPa operating pressures along the radial transect.
Table 2.
Regression parameters A1, A2, λ, D50 and R2 for the model equation using the CNF at 250, 300, and 350 kPa operating pressures along the radial transect.
| P (kPa) | R (m) | A1 | A2 | λ | D50 | R2 |
|---|---|---|---|---|---|---|
| 2 | 4.35074 | 101.13699 | 5.36928 | 0.36946 | 0.98428 | |
| 4 | 2.88752 | 99.94652 | 3.85044 | 0.44777 | 0.99335 | |
| 6 | 1.69551 | 104.99942 | 1.7467 | 0.39513 | 0.99516 | |
| 8 | 2.5024 | 99.02599 | 2.98966 | 0.44008 | 0.99227 | |
| 250 | 10 | 1.86698 | 100.20939 | 2.52046 | 0.40547 | 0.99278 |
| 12 | −0.85133 | 104.69056 | 1.31335 | 0.32243 | 0.99564 | |
| 14 | −0.1407 | 97.6805 | 2.45775 | 0.1912 | 0.99825 | |
| 16 | −0.32141 | 97.52474 | 2.01172 | 0.18659 | 0.99563 | |
| 2 | −0.8763 | 104.28791 | 5.59177 | 0.59115 | 0.99379 | |
| 4 | 2.0104 | 99.55765 | 4.76936 | 0.4573 | 0.99593 | |
| 6 | 1.30004 | 100.96095 | 2.85829 | 0.54546 | 0.99614 | |
| 8 | 0.23674 | 105.59931 | 1.4126 | 0.42248 | 0.99686 | |
| 300 | 10 | −0.98784 | 104.27079 | 1.21641 | 0.31175 | 0.99338 |
| 12 | −0.88509 | 101.98693 | 1.30446 | 0.25463 | 0.99452 | |
| 14 | −0.03001 | 103.90991 | 1.41498 | 0.35347 | 0.99797 | |
| 16 | −0.1027 | 98.99158 | 2.52459 | 0.17618 | 0.99898 | |
| 18 | 0.1686 | 99.3514 | 2.29874 | 0.19175 | 0.99883 | |
| 2 | 6.05989 | 100.59838 | 5.34356 | 0.37972 | 0.98388 | |
| 4 | 2.95144 | 100.89556 | 2.81991 | 0.32918 | 0.99261 | |
| 6 | 4.3256 | 100.52678 | 3.41895 | 0.41152 | 0.99063 | |
| 8 | 2.05796 | 100.21004 | 2.81285 | 0.41711 | 0.99433 | |
| 350 | 10 | −1.1916 | 106.69928 | 1.09705 | 0.32141 | 0.98744 |
| 12 | 2.21099 | 100.60703 | 2.52162 | 0.39871 | 0.99447 | |
| 14 | −0.19118 | 97.81052 | 2.3766 | 0.15883 | 0.99656 | |
| 16 | −0.99357 | 98.59122 | 1.51007 | 0.19818 | 0.98673 | |
| 18 | −0.31208 | 96.87356 | 2.2641 | 0.16788 | 0.99237 |
Table 3.
Regression parameters A1, A2, λ, D50 and R2 for the model equation using the CVF at 250, 300, 350 kPa operating pressure along the radial transect
Table 3.
Regression parameters A1, A2, λ, D50 and R2 for the model equation using the CVF at 250, 300, 350 kPa operating pressure along the radial transect
| P (kPa) | R (m) | A1 | A2 | λ | D50 | R2 |
|---|---|---|---|---|---|---|
| 250 | 2 | 0.08856 | 96.848411 | 7.26594 | 0.46555 | 0.99421 |
| 4 | −0.42105 | 104.41339 | 3.44243 | 0.88705 | 0.99881 | |
| 6 | 0.05231 | 111.11761 | 2.99371 | 1.42368 | 0.99676 | |
| 8 | −1.59095 | 238.02521 | 1.67524 | 1.65432 | 0.99741 | |
| 10 | 0.45277 | 122.62697 | 2.70279 | 1.67021 | 0.99554 | |
| 12 | 1.06059 | 122.93157 | 3.95813 | 2.05172 | 0.99721 | |
| 14 | 3.95472 | 6.72054E5 | 4.18789 | 2.09845 | 0.97431 | |
| 16 | 1.51554 | 172.42044 | 3.68582 | 2.35884 | 0.99669 | |
| 18 | 3.11196 | 2.32762E6 | 1.51411 | 2.45469 | 0.97306 | |
| 300 | 2 | −0.01509 | 97.40207 | 4.66525 | 0.37324 | 0.99804 |
| 4 | −1.27027 | 107.78744 | 2.16983 | 0.68425 | 0.99804 | |
| 6 | −1.54117 | 105.75077 | 2.59613 | 0.64925 | 0.99884 | |
| 8 | −0.28941 | 113.47855 | 2.20843 | 1.11596 | 0.99681 | |
| 10 | 1.41597 | 105.89393 | 4.44662 | 1.79166 | 0.99804 | |
| 12 | 0.59313 | 110.80845 | 2.36416 | 1.16741 | 0.99731 | |
| 14 | 0.38831 | 232.47864 | 2.57067 | 1.58233 | 0.98813 | |
| 16 | 0.80295 | 103.08389 | 4.25144 | 2.09048 | 0.99804 | |
| 18 | 1.06507 | 105.26508 | 5.26081 | 2.43845 | 0.99407 | |
| 350 | 2 | −0.01509 | 97.40207 | 4.66525 | 0.37324 | 0.99651 |
| 4 | −1.27027 | 107.78744 | 2.16983 | 0.68425 | 0.99661 | |
| 6 | −1.54117 | 105.75077 | 2.59613 | 0.64925 | 0.99621 | |
| 8 | −0.28941 | 113.47855 | 2.20843 | 1.11596 | 0.99681 | |
| 10 | 1.41597 | 105.89393 | 4.44662 | 1.79166 | 0.99611 | |
| 12 | 0.59313 | 110.80845 | 2.36416 | 1.16741 | 0.99407 | |
| 14 | 0.38831 | 232.47864 | 2.57067 | 1.58233 | 0.98813 | |
| 16 | 0.80295 | 103.08389 | 4.25144 | 2.09048 | 0.99572 | |
| 18 | 1.06507 | 105.26508 | 5.26082 | 2.43845 | 0.99731 | |
| 20 | 1.43634 | 129.69815 | 4.93339 | 3.10043 | 0.99791 |
Publisher’s Note: MDPI stays neutral with regard to jurisdictional claims in published maps and institutional affiliations. |
© 2020 by the authors. Licensee MDPI, Basel, Switzerland. This article is an open access article distributed under the terms and conditions of the Creative Commons Attribution (CC BY) license (http://creativecommons.org/licenses/by/4.0/).
Share and Cite
MDPI and ACS Style
Dwomoh, F.A.; Yuan, S.; Li, H.; Zhu, X.; Liu, J.; Mensah, R.; Fordjour, A. Analysis of Water Droplet Distribution in Wind for the Fluidic Sprinkler. Water 2020, 12, 3320. https://doi.org/10.3390/w12123320
AMA Style
Dwomoh FA, Yuan S, Li H, Zhu X, Liu J, Mensah R, Fordjour A. Analysis of Water Droplet Distribution in Wind for the Fluidic Sprinkler. Water. 2020; 12(12):3320. https://doi.org/10.3390/w12123320
Chicago/Turabian StyleDwomoh, Frank Agyen, Shouqi Yuan, Hong Li, Xingye Zhu, Junping Liu, Richard Mensah, and Alexander Fordjour. 2020. "Analysis of Water Droplet Distribution in Wind for the Fluidic Sprinkler" Water 12, no. 12: 3320. https://doi.org/10.3390/w12123320
Note that from the first issue of 2016, this journal uses article numbers instead of page numbers. See further details here.