Long-Term Ecological Health Assessment of a Restored Urban Stream Based on Chemical Water Quality, Physical Habitat Conditions and Biological Integrity


Department of Bioscience and Biotechnology, Chungnam National University, Daejeon 34134, Korea
*
Author to whom correspondence should be addressed.
Water 2019, 11(1), 114; https://doi.org/10.3390/w11010114
Submission received: 22 October 2018
/
Revised: 7 January 2019
/
Accepted: 7 January 2019
/
Published: 10 January 2019
(This article belongs to the Special Issue Human-Induced Changes to Aquatic Communities: Monitoring and Ecological Restoration)
Abstract
:We studied the chemical water quality, physical habitat and biotic integrity of an urban stream subjected to restoration measures in South Korea. We used the water pollution index (WPI), qualitative habitat evaluation index (QHEI) and index of biotic integrity (IBI) on the water quality, physical habitat and fish assemblage data respectively, during 2007–2016 in Gap Stream to evaluate the ecological health before and after restoration measures. The results revealed annual mean total phosphorus (TP) dramatically decreased by 13-fold for 10 years and the values of biological oxygen demand (BOD) and chemical oxygen demand (COD) also decreased by >50% over the time, indicating decrease in nutrient enrichment and organic matter pollution after restoration measures. In the meantime, biological health analyses using IBI indicated no major transformation in fish assemblages under restoration impact. However, the proportion of sensitive species increased, and tolerant species decreased after restoration. Gap stream is home to 50 distinct fish species. QHEI proposed that the physical habitat health was in ‘good’ condition during the study period. WPI showed the chemical water quality status remained ‘poor’ during and before restoration but improved to ‘fair-good’ condition in the ensuing years after restoration. The IBI results, however, indicated ‘very poor-poor’ biotic integrity irrespective of restoration measures. CHL-a and TP showed strong (r < 0.7) to moderately strong (r = 0.5–0.7) correlation with significantly important water quality factors. Spatially significant pattern change in TN and TP was obvious as measured levels were significantly higher (p < 0.01) in downstream than upstream. Principal component analysis successfully indicated the placement of water quality factors and indices used as in three distinct stream compartments. The higher pollutant levels in the downstream mainly linked to the nutrient-rich effluents from emerging from the wastewater treatment plants (WWTPs) and industrial complexes operative in the stream catchment. Overall, restoration measures indicated minor impact on fish assemblages and physical habitat due to slow and steady improvement, however, water quality improved due to a decline of nutrients and chemicals downstream. This indicated a positive tendency of improvements in physical habitat and richness of fish assemblages in Gap Stream.
1. Introduction
The deteriorating ecological health of streams and rivers flowing through urban regions has become a significant research topic in freshwater ecology. High vulnerability of urban streams to anthropogenic disturbances is bringing about restricted utilization of the historically pristine natural resources [1,2,3]. The environmental degradation ensuing anthropogenic actions is now instigating a progressive decline in regional aquatic biodiversity [4,5,6,7,8]. The leading cause of worsening aquatic environment is nutrient enrichment [9,10] and high organic matter loadings [11,12] originating from surface run-off and massive discharges of waste water treatment plants (WWTP) as well as industrial complexes [13]. With the intent of minimizing the impacts of ecological degradation on aquatic biodiversity sustained in urban streams, ecosystem restoration is used as a tool in different parts of the modern world to mitigate and restore the urban stream [14,15].
Stream restoration, also termed as river reclamation, inhere a set of actions completed to recover the environmental health of a besmirched or degrading stream [14,15]. The actions are targeted at restoration to near natural state, as well as functionality of the stream system to support a wider range of biodiversity, landscape development, restitution, flood mitigation and so on [14]. The activities carried out under the name of restoration can be seen as an improvement in fauna and flora, reconstruction of run, riffle and pools at physical habitat level and water quality [10,15]. In order to assess the success of restoration measures in terms of water quality, several chemical approaches have been frequently used for the assessment of contaminants in aquatic environments because of cost-effectiveness and the ease of estimating the degree of pollution [16]. Nutrients (N, P) enrichment and organic matter pollutants such as biological oxygen demand (BOD) and chemical oxygen demand (COD) frequently used as key determinants of chemical pollution assessment along with toxic contaminants viz. heavy metals and persistent organic pollutants [17,18,19,20,21]. Some problems and the ambiguity of the chemical measurements such as high spatial variation (microhabitat changes) and temporal variations (diel changes) were pointed out in other researches [18,22].
The physical approach to estimate the habitat disturbance employed to estimate the extent habitat could render sustainable environment to the biota in the aquatic environments [23,24]. Physical habitat disturbances frequently observed in the urban streams due to structural modification such as channelization and flow modifications by weir or dam constructions in the stream [25,26]. These habitat modifications are closely associated with land-use patterns [18,27] and this disturbance resulted in the habitat simplification [23,28], which may not be adaptable to certain aquatic organisms. Generally, some parameters on structural and hydrological characteristics of streams and rivers are used for the habitat evaluations. In particular, the multimetric model of Qualitative Habitat Evaluation Index (QHEI) adopted by US EPA [29] has been widely used for the habitat evaluations of North American and European waterbodies [30,31,32,33].
In the meantime, the use of biological integrity is the most widely used approach in the stream health assessment using representative fish assemblages. As reflected by recent research, the biological assessment could be carried out by a variety of methods depending on the targeted fauna. For instance, using periphyton as a primary producer, macroinvertebrate as primary consumers and fishes as primary to tertiary consumers is the preferred method. That is why it is considered one of the most appropriate and widely acceptable methods to evaluate the biological integrity and environmental degradation in streams and rivers [30,31,34]. The characteristic index used to assess the biological health is widely known as index of biotic integrity (IBI).
Gap Stream is an urban stream subjected to restoration measures during 2011–2012. It is a tributary in Geum River watershed and is a typical urban stream with a basin area of 648.87 square kilometers. Key point sources of wastewater treatment plants (WWTPs) and industrial complexes as well as non-point sources such as urban road and agricultural run-off directly and indirectly influence the ecological health of Gap Stream. Also, urban constructions and commercial activities near the stream caused chemical pollution [13], disturbed the fish biodiversity [22,35], and degraded the habitat quality. Keeping in view the above problems, a restoration project carried out in the stream during 2011–2012 that included major restorations and repair of stream banks, sediment dredging and the re-construction of the riparian zone and artificial riffles, run and pool complexes [3]. In addition, new wastewater treatment plants were installed in the upstream to reduce the nutrients and pollutant loads downstream. Several weirs and fish ways were constructed along with the construction of crossing ways across the urban stretch.
Considering the imposing significance of restoration measures and declining ecological health of Gap Stream, this study planned with the objectives to assess the water quality status, physical habitat and biotic integrity in relation with the restoration measures. It also intended to estimate the extent and success of restoration efforts in the end.
2. Materials and Methods
2.1. Sampling Area Description
The study targeted the Gap Stream, which is one of the major tributaries of Geum River with a length of 73.7 km and watershed area of 648.87 km2. With an approximately 10 km stretch across Daejeon metropolitan, this stream is providing open places for relaxation, entertainment and recreation, having public facilities developed for cycling, jogging and exercising along its bank. The total study duration lasted during 2007–2016 that included the duration before restoration (BR; 2007–2010), during and after restoration (AR; 2013–2016) measures in the Gap Stream. Fish sampling carried at five sites from an upstream of Bonggok-dong (B1) to the downstream connecting the Geum-River B5 (Table 1). In addition, surface water samples were collected at six sites ranging from the upstream (W1) to downstream (W6). Out of six sites, two sites (W1 and B1) are in the Gap Stream upper reach and surrounded by farmland and mountainous regions and stream order is 3rd order to 4th order based on the criteria of Strahler [36]. The site 2 (W2 and B2) is located in the urban area upside and downside of a constructed weir where the mean water flow velocity is low (<1 m/s). Site 3 (B3 and W3) is in Wolpyeong Park that is a preservation site. Site 4 (B4 and W4) is located in the middle of Daejeon city after passing through Wolpyeong Park. Site 5 (B5, W6) is a 5th order stream and is directly influenced by effluents of wastewater treatment plants (WWTPs). The S5 and W6 sites are the most downstream and the WWTPs at W5 site influence these sites. The geographical placement of fish sampling and water quality monitoring sites along with the placement of WWTPs are shown in Figure 1. The exact address and latitude longitude coordinates are mentioned in Table 1.
2.2. Physicochemical Water Quality
Physicochemical water quality data set for the Gap Stream was procured from the Korean Ministry of Environment which was collected on a monthly basis. Electrical conductivity (EC) was determined by using a portable multi-parameter analyzer (YSI Sonde Model 6600, YSI Incorporated Yellow Springs, OH, USA). Total phosphorus (TP), total nitrogen (TN), biological oxygen demand (BOD), chemical oxygen demand (COD) and total suspended solids (SS) were measured by a chemical testing protocol of the Ministry of Environment, Korea [37]. Chlorophyll-a (CHL-a) concentration was measured by using a spectrophotometer analytical method (Beckman Model DU-65, Beckman Coulter, Inc., Brea, CA, USA) after extraction in hot ethanol [38]. Nutrients and relevant parameters analyses were done in triplicates to confirm the rationality while the estimation of BOD was performed in duplicates [39,40].
2.3. Water Pollution Index (WPI)
With the purpose of accomplishment of the chemical water quality status, we used a modified approach of multi-metric model WPI that was recently developed and modified from the nutrient pollution index by [13]. Comprising of seven metrics in total, the WPI metrics were defined as follows. M1: TN, mg/L; M2: TP, µg/L; M3: TN:TP ratio; M4: BOD, mg/L; M5: TSS, mg/L; M6: EC, µS/cm and M7: CHL-a (µg/L). The scoring criteria for each metric was established for limits set by the third of the observed distributions of obtained values. Consequently, the allocated scoring benchmarks for each metric were scores of 5, 3 and 1, respectively. The final chemical health status of each study site in the Gap Stream was evaluated after attaining the aggregated score. This aggregated score led to the final categorization of each site from excellent (31–35), good (25–29), fair (19–23), poor (13–17) to very poor (07–11).
2.4. Qualitative Habitat Evaluation Index (QHEI)
The physical habitat study was based on the Qualitative habitat evaluation index (QHEI). This index was used to assess the physical health status of the habitat condition before and after the application of restoration measures in the stream. We used QHEI developed by Plafkin et al. [30], modified by Barbour et al. [31] and complemented by An et al. [41] for its application in the Korean stream environment. It was composed of a total of 11 metrics (M1: Substrate/Instream cover, M2: Embededness, M3: Flow velocity/depth combination, M4: Bottom scouring and sediment deposition, M5: Channel flow status, M6: Channel alteration, M7: Frequency of riffles or bends, M8: Bank stability, M9: Bank vegetative protection, M10: Riparian vegetative zone width, M11: Dam construction impact). Each metric maximum given score was 20 and the model output was the sum of all the individual metric scores obtained after careful study of each site and QHEI total score let to categorize the study sites as either excellent (182–220), good (124–168), fair (64–110), or poor (8–52).
2.5. Fish Sampling
Fish sampling was carried out as per Ohio EPA sampling method [42] targeting all the available microhabitats such as riffles, pools, run areas within 200 m stretch around the survey point for approximately 90 min in duration. Casting net (5 mm × 5 mm) and kick net (4 mm × 4 mm) were used depending on the sampling site habitat for fish collections. Casting net was used for a number of individuals, whereas kick net was used to retrieve the maximum number of fish species at each site. Sampled fishes were carefully examined to see if they displayed any kind of morphological deformities, anomalies or lesions, and were recorded except for fry less than 20 mm. Later, the ecological health analysis based on fish bio-indicator model i.e., the index of biotic integrity (IBI) was estimated for the sampling efforts conducted during pre-monsoon and post-monsoon months during 2007–2016. In situ identification of each fish species was followed by instantaneous release to its natural habitat. All fish specimens were recognized by observing the prominent morphological features as described by Kim and Park [43] however Nelson’s [44] system was followed for systematic classifications.
2.6. Fish Guild Analysis
The fish community sampled from each study site required to be ascribed to different guilds. According to habitat guild (water column or riffle benthic), origin as (native or exotic), tolerance to lethal environmental changes (sensitive, tolerant or intermediate) and trophic guild (omnivorous, carnivorous, herbivorous or insectivorous). The tolerance and trophic guilds were categorized according to the national fish classification [45], originally based on the approach of US EPA [29] and Karr [46]. The tolerance guild classified into sensitive species (SS), tolerant species (TS), and intermediate species (IS). The trophic guild characteristics are the evaluation of trophic dynamics and energy flow relationships among fish communities in the stream ecosystem [47]. Trophic characteristics classified as insectivores (I) that ate aquatic invertebrates, carnivores that eat fish and other vertebrate species, herbivore (H) and carnivores (C).
2.7. Multimetric Index of Biological Integrity (IBI)
Development of IBI at regional scale applications is established on the identification of various ecological trepidations across the targeted research area, which are identified based on biological data and subsequent community analyses [46]. The biological health assessment part of this study was evaluated by using IBI based on fish assemblages. In total, eight metrics, divided into three main categories viz. species richness and composition, the trophic and tolerance guild compositions, and the fish abundance along with an acumen to physical health of each sampled fish. First, ecological indicator metrics (M1–M4) reflect the component characteristics of a species. The second set of metrics deal with the trophic level composition that reflects the trophic characteristics of fish (M5–M6), while the third category (M7–M8), reflects upon the individual health and fish abundance. The metrics (M) details are as given here. M1: total number of native species, M2: number of riffle-benthic species, M3: number of sensitive species, M4: proportion as a number of tolerant species, M5: proportion as number of omnivore species, M6: proportion as number of insectivore species, M7: total number of native individuals and M8: proportion as number of abnormal individuals. Each metric was ascribed the score of 5, 3, or 1 according to the type and characteristic of fish community it denoted. The sum of all the metric scores led to cumulative IBI values that were later used as a measure to indicate the biological integrity classes. The classes and their range of IBI scores: excellent (36–40), good (28–34), fair (20–26), poor (14–18) and very poor (8–13).
2.8. Statistical Analyses
Seasonal and annual deviances among the water quality factors and fish assemblages were accomplished on the procured datasets in Sigma Plot version 10 (Systat. Software Inc., San Jose, CA, USA) [48]. Means and standard deviations and correlation were calculated by using the SPSS software (v 22). We applied t-test to compare the water quality parameters BR and AR. We also used Pearson’s correlation, and t-test was applied to check the differences and correlation among water quality variables, WPI, QHEI and IBI. The non-parametric method of classification i.e., principal component analysis (PCA) was carried out using the PAST [49] software to assess which factors have changed along the duration and gradient of stream under study. We used PCA after normalization of the datasets and software standards were followed. The loading values indicated the strength of each factor and it was classified as strong loading (loading value >70), moderately strong (<70–>50) and weak loadings (>30–<50).
3. Results
3.1. Spatio-Seasonal Variation in Water Quality Factors
The monthly rainfall intensity that led to elucidate the seasonal trends in water quality factors is also the primary factor maneuvering the water quality variability patterns in Gap Stream (Figure 2). The summary statistics of all the water quality factors are given in Table 2.
The rainfall pattern and water quality factors interaction during 2007–2016 showed diverse fluctuations of important water quality factors e.g., pH and EC influenced the most during monsoon period. Nitrogen and phosphorus conspicuously varied under the rainfall intensity as is indicated by the decrease in TP and TN inflow during July-September. Downstream sites (W5 and W6) showed three to five times higher levels before and after monsoon season which showed that the nutrient contributing factor concentrations were diluted by the large amount of water pouring down in those areas. Similar to TN, TP, and matching with each other, BOD and COD were higher manifolds in the downstream sites i.e., W5 and W6. In the similar fashion, oxygen-demanding factors showed a dropping tendency during the monsoon season indicating higher and stronger water currents from the run-off water. However, TSS and Sestonic CHL-a level appeared to be intermixing with each other but showed an increasing tendency from upstream to downstream sites. Nonetheless, TSS and Sestonic CHL-a also revealed the dilution process during the monsoon period which is also linked with short water residence time in case of Sestonic CHL-a levels.
3.2. Annual Variability in Water Quality Factors
Inter-annual variations in water quality factors such as nutrients (N, P), oxygen demanding entities (BOD, COD), total suspended solids (SS) and CHL-a, are shown as analyzed in relation with annual rainfall during 2007–2016 (Figure 3). Based on annual rainfall amount, we could infer that the intensity of rainfall was significantly higher in 2007 and during 2010–2012 meaning thereby as flood years in the Gap Stream water basin. During lower annual rainfall, the annual mean value of pH increased and decreased during the flood years. The EC mean values sustained almost similar irrespective of the rainfall amount. Total phosphorus (TP) showed sharp declines during 2007–2016 in the stream that could be due to restoration measures carried out later during the study duration. The maximum value of TP was 2188 μg/L in 2007 and this is significantly higher than the 500 μg/L threshold for minimum allowed level in South Korea. The maximum value decreased rapidly over the years and then declined by 500 μg/L in 2013 and 156 μg/L in 2016 showing the success of restoration efforts in Gap Stream. It could be said that the WWTP working was efficient enough to reduce and treat the effluents containing higher TP levels. The concentrations of Sestonic CHL-a, BOD and COD showed increasing tendency until 2009 and then gradually decreased.
3.3. Changes in Water Quality Before and After Restoration Measures
One technique to validate the success of restoration measures taken in Gap Stream was to corroborate with results obtained from the water quality parameters and see how they have changed over the time. Therefore, the success of restoration measures was estimated by analyzing the water quality factors before restoration (BR, 2007–2010) and after restoration (AR, 2013–2016) periods and is shown in Figure 4. The results displayed the difference of mean values of pH BR and AR showed a reasonable decline apparently because of restoration measures. EC increased after restoration while TN showed minimal decline after restoration. Important factors viz. TP, BOD, COD and TSS showed significant decline because of restoration efforts carried out in Gap Stream. However, the mean values of Sestonic CHL-a maintained during BR and AR periods indicate the sustainable primary productivity level.
Except water pH, approximately all the significant parameters of water quality indicated a substantial decline from upstream to downstream sites during AR years as compared to the BR years (Figure 5). There was a significant decline in pH level from upstream to downstream. However, the transformation of EC values was overall insignificant except at W2 and W3 sites. TP showed a conspicuous decline at the downstream sites i.e., W5 and W6 indicating huge success of the restoration measures in Gap Stream, especially the working of WWTPs. In addition, TN, BOD and COD spatial changes during BR and AR reflected a reasonable decline that followed the BR line in an almost similar fashion. The restoration activities resulted in a significant difference (p < 0.01) between each study site. In addition, the TSS and Sestonic CHL-a values showed contrasting changes at each site with significant statistical differences (p < 0.01). It was found that the physicochemical parameters such as EC, TP, TN, BOD, and COD relatively increased at site W5 due to the effluents from sewage disposal plant. The role of WWTP becomes very critical in the case of TP that showed an almost similar difference in average values during BR and AR until site W4, then jumped nearly three times higher from site W5 during BR period, and declined due to restoration measures in the ensuing years. It also indicated that the sewage disposal plant in Daejeon City has a greater impact on TP level, which was installed during the restoration project.
3.4. Chemical Health Assessment
Chemical pollution assessment was carried out by the use of modified multi-metric water pollution index (WPI) and the obtained scores steered to categorize the stream water quality on annual basis and reflected the influence of restoration measures on the chemical health of Gap Stream (Table 3). WPI is constructed on seven metrics (M1–M7) and constituents of four major categories viz. nutrient regime (TN, TP and TN:TP), organic matter (BOD), ionic and solid contents (TSS and EC) and primary production indicator (CHL-a). The nutrient contributing factors i.e., TN, TP and TN:TP were, however, key determinants of the water quality and eutrophication [13,35,50,51,52]. The criteria of TN classified the stream as oligotrophic (3 mg/L), mesotrophic (1.5–3 mg/L) and eutrophic (>3 mg/L) respectively. The stream remained eutrophic during 2007–2014, except in 2009, where it was mesotrophic but during the ensuing years of AR, it turned to be mesotrophic with respect to TN. Similarly, according to TP level criteria (<30, 30–100 and >100 µg/L), during and after restoration, TP level significantly dropped and reflected the activity of municipal water treatment plant installed during the restoration years (2011–2012). TN:TP ambient ratios presented mesotrophic state during the study duration however, showed increasing trend after restoration measures. Earlier researches have shown TN:TP ambient ratios as an indirect indicator of nutrient limitation for primary productivity in freshwater bodies [53,54] and if the ratio decreased indicates higher nutrient pollution that may lead to eutrophication [55]. Although it is very rare, if the ratios increased it would reflect the opposite case. BOD significantly dropped during AR indicating decline in biodegradable components. This decline of BOD again reflected the success of restoration efforts as well as the contribution of installed WWTPs. TSS and EC annual scores maintained during the 10 years of our study duration although the annual mean levels remained fluctuating under the influence of monsoon and anthropogenic activities. There was a significant decrease noticed in suspended solids level though, which could be ascribed to the short water residence time as well as management of water flow and its speed as a result of restoration. Mean Sestonic CHL-a level dropped because of restoration efforts during 2014–2016. The CHL-a level decline could be linked with the drop in TP levels due to the restoration measures as well as with that of ambient ratios of TN:TP in the stream that again lowered the perception of eutrophication in downstream sites. Phosphorus acts as the limiting factor in primary productivity in the lotic water ecosystem in South Korea. The aggregated annual WPI scores indicated poor water quality status during BR and during restoration efforts in Gap Stream. However, later during the ensuing years in AR, it displayed an improvement from ‘fair to good’ reflecting clear effects of restoration measures in the improvement of water quality.
3.5. Physical Health Assessment
Physical habitat health evaluation based on 11 metric qualitative habitat evaluation index (QHEI) in Gap Stream during 2007–2016 showed that the physical habitat was in a ‘good’ state (Table 4). To determine the physical habitat health BR, during restoration and AR, the metric scores were aggregated on an annual basis and the results showed the physical heath remained constant and did not show any significant improvements as a result of restoration efforts. At the end of the restoration project, QHEI analysis indicated habitat degradation downstream (site B5) that could possibly be attributed to the excessive sediment deposition. This could also be linked to a decrease in water current velocity after B4 as the stream order increased from site B4 giving advantage to sediment deposition downstream. Further, the settling down of solid contents may concomitantly have triggered leaching down of alluvial pollutants as well, which may have significantly influenced chemical and biological health degradation. The channel alteration has significantly transformed the habitat due to construction of artificial structures such as concrete banks and weirs. On the other hand, channel sinuosity revealed a high degree of channel straightening in the stream AR decreasing the quick availability of microhabitats like riffles and pools. This modification may have a sequential and critical impact on the fish populations having a direct link with specific types of microhabitats and could be one of the reasons for the decrease in certain fish assemblages. The riparian and bank vegetation protection indicated poor values due to lower bank vegetation because of human activities along the bank. Further, the congested water flow at sites B2 and B4 was attributed to the small weirs, lower stream order and higher water inflow rendering an ecosystem with high riffles and pools may have caused a substantial shift in the fish populations. The physical habitat health evaluation score ranged 142–147 during 2007–2016 and all the QHEI scores fell into ‘good’ physical health category.
3.6. Fish Composition Analysis
The relative abundance (RA), total number of individuals (TNI) observed at each study site in Gap Stream along with their tolerance, trophic and habitat guilds before (BR) and after restoration (AR) displayed a remarkable disproportion (Table 5). Total number of fish species sampled during BR and AR taxonomically belong to 16 families. Prior to the restoration, a total of 45 fish species from 14 families were observed comprising 1815 individuals in total, whereas, during AR samples, 46 different species from 15 families totalled as 1013 individuals. Zacco platytus was the most frequently captured fish species and turned up as a dominant species before and after restoration, with an RA of 37.6% with 683 individuals BR, and a RA of 27.1% with 281 individuals AR. When looking at the dominant species during BR, in order of their relative abundance, they comprised of Zacco platytus, Carassius auratus, Pseudogobio esocinus, Hemibarbus labeo, Opsarichthys uncirostris amurensis, and Acheilognathus lanceolatus, encompassing 70.3% of the total sampled fishes. Zacco platytus and, Pseudogobio esocinus, Acheilognathus lanceolatus, Rhinogobius brunneus, Hemibarbus labeo, Carassius auratus appeared in order of RA during the AR samples, comprised the 60.3 % of the sampled fishes.
3.7. Changes in Fish Assemblages before and after Restoration Measures
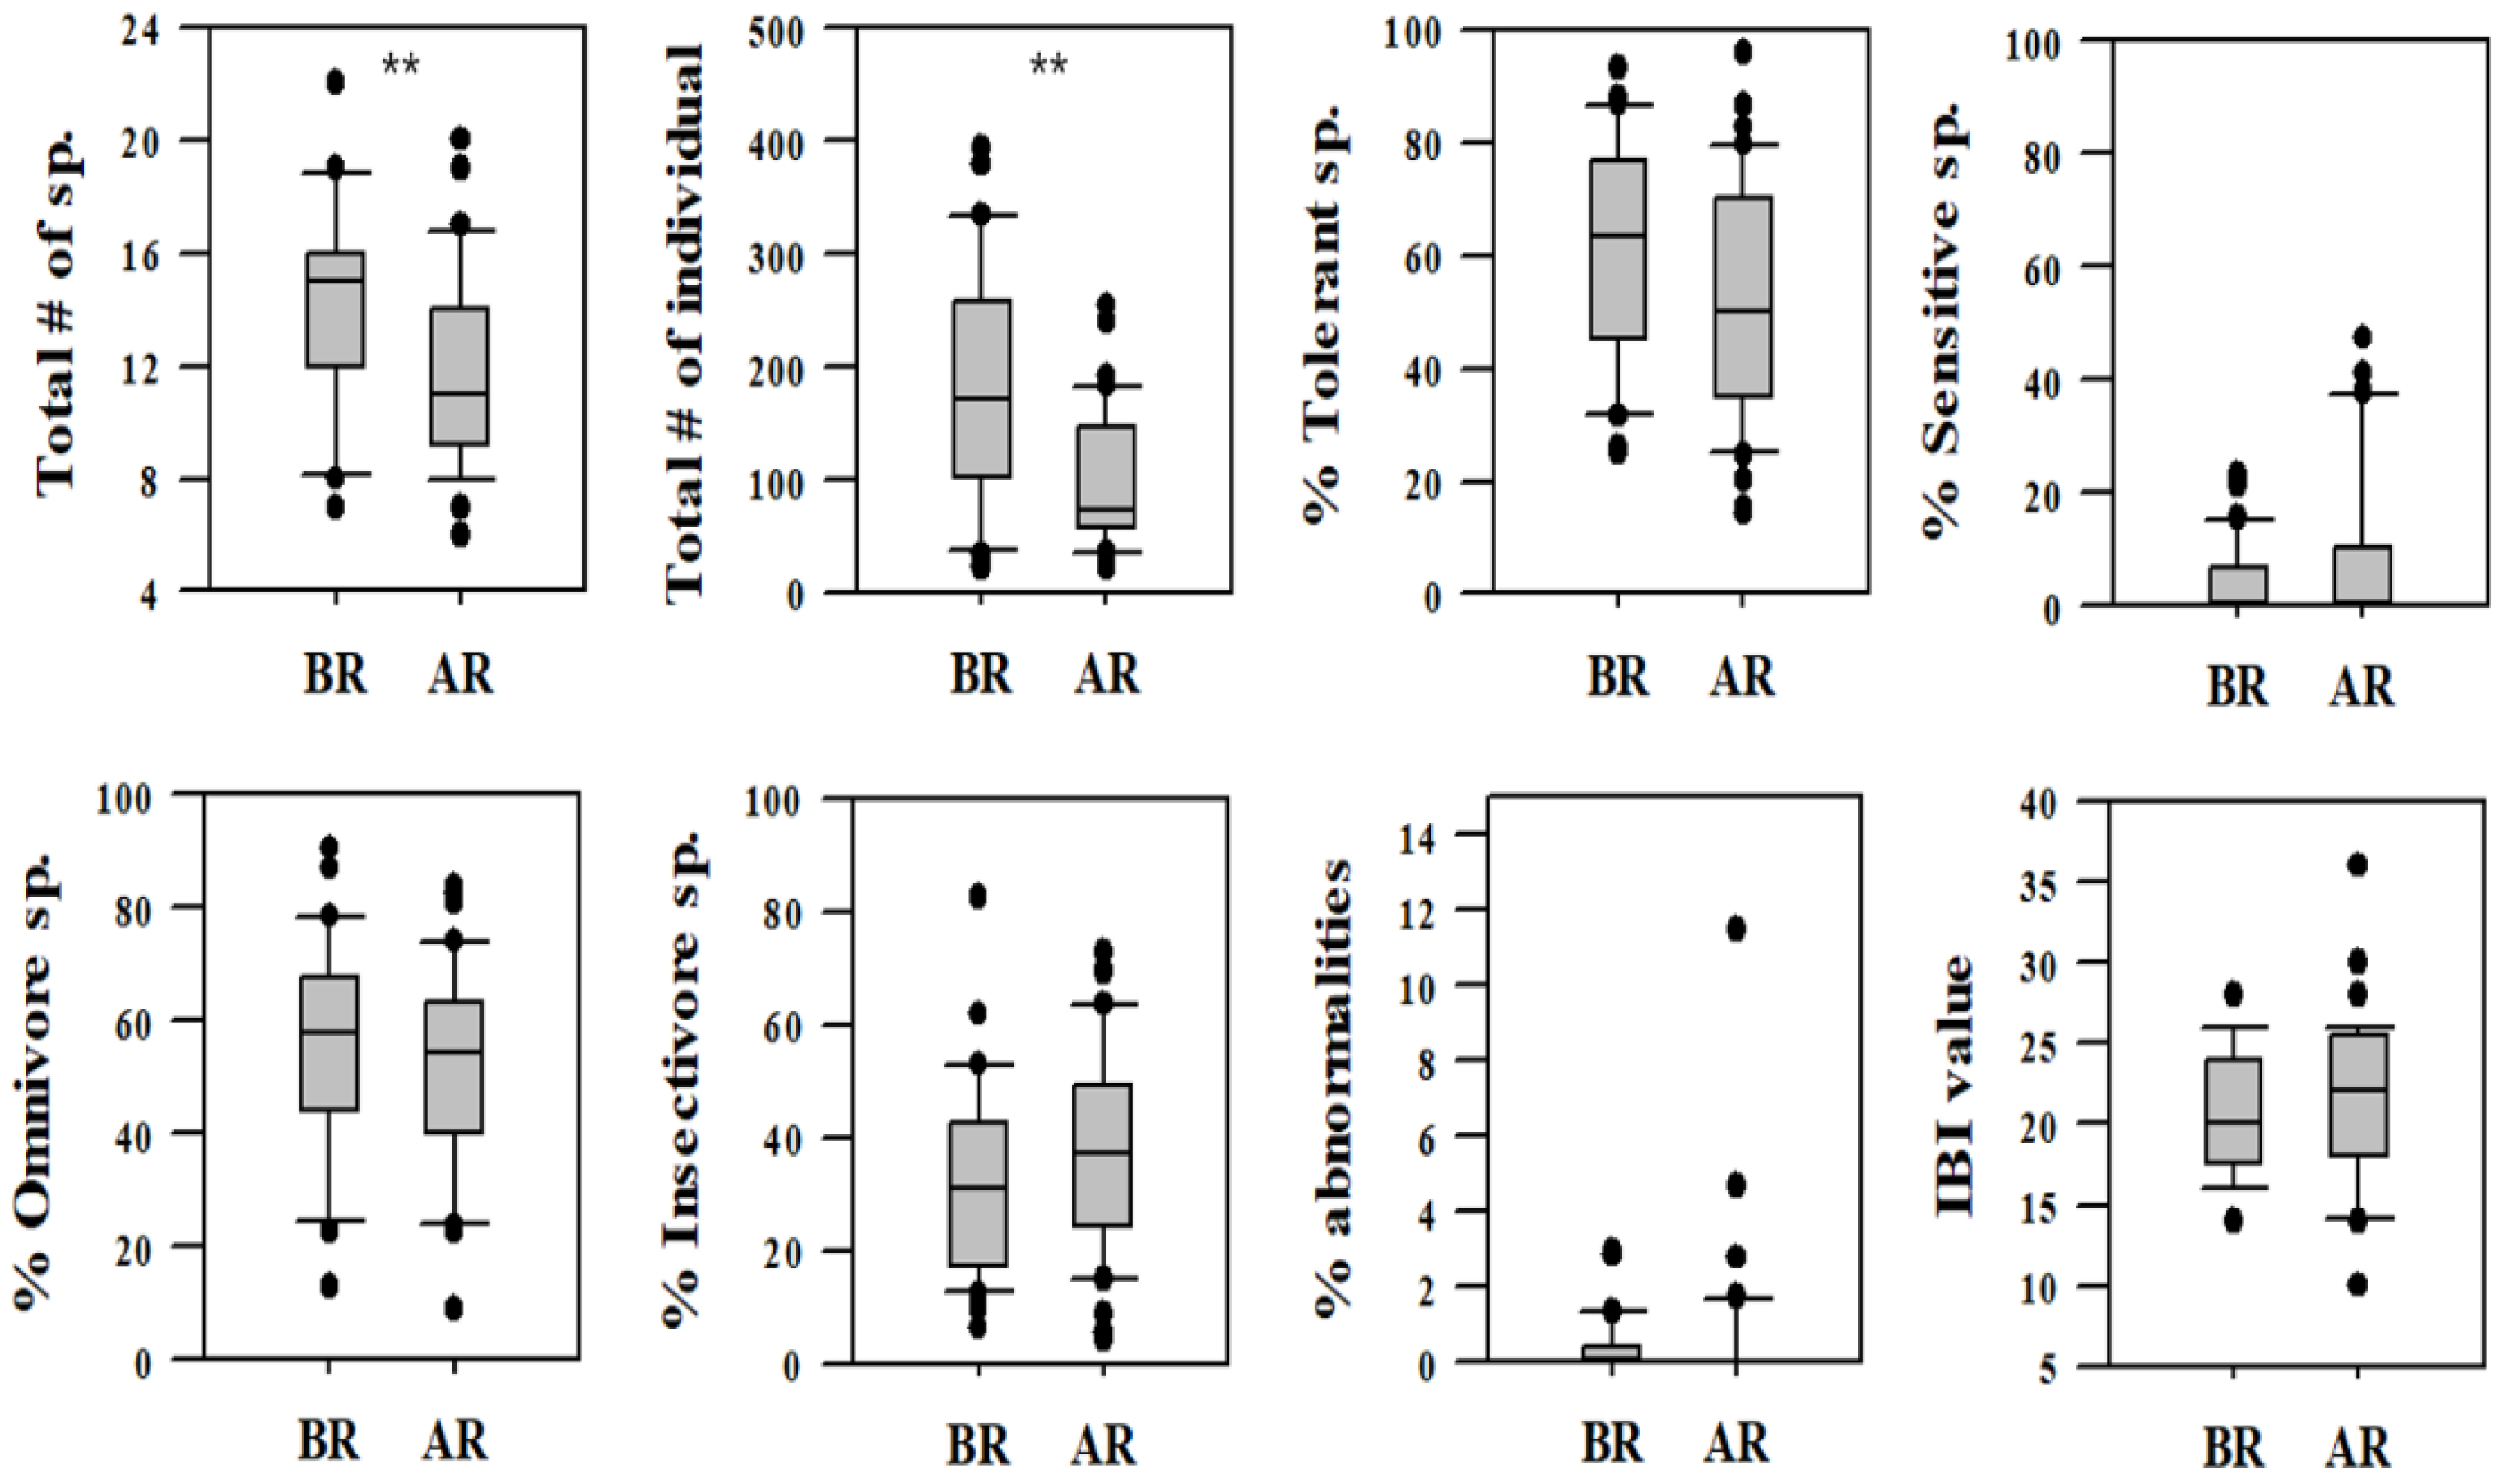
Overall modifications in various fish assemblages, as well as total fish species and total number of individuals before and after restoration measures showed significant reflections of the restoration project (Figure 6). The total number of fish species and total number of fish individuals sampled decreased significantly (p < 0.01) during the AR period. The percentage of tolerant species also decreased significantly (p < 0.01). As a good sign of success of the restoration process, percent sensitive species (SS) increased to approximately double as well as a substantial increase in the percentage of insectivore species reflected during the AR samples. On the other hand, percent abnormalities also increased during the AR samples indicating serious health concerns for the individual fishes. However, the percentage of omnivore fish species showed a slight decline during AR samples. Because of the decrease in tolerant species and increase in the percent of SS, the overall IBI values also showed a positive and slight but gradual increase in the AR samples reflecting the benefits of the restoration project.
There were significant shifts in spatial distribution patterns of various fish assemblages from upstream to downstream study sites in the wake of the restoration measures (Figure 7). The spatial comparison between mean values of different fish assemblages BR and AR measures showed statistically significant differences at different sites in Gap Stream. Except percent SS and percent insectivore (I) species, almost all other populations showed a decline during the AR samples. Therefore, interesting reflections of WWTP effluents could be seen at site B5 especially in the case of percent tolerant species. The total number of species showed a gradual increase from upstream to downstream after restoration as well as indicated stability in the total number of individuals (TNI) was noticed during AR samples reflecting positive modifications. The abnormalities percentage increased at sites B2 and B5 after restoration. The IBI results showed an upsurge after site B3 until the downstream sites indicating a positive influence of restoration on biological health. No SS were found and hence declared as absent from B2 and B4 even after the restoration project.
3.8. Biological Health Assessment
Inter-annual biological health assessment of Gap Stream performed by applying the modified multi-metric index of biotic integrity (IBI) and the results shown in Table 6. The set of eight metrics (M1–M8) categorized into three principal groups viz. species richness and composition, trophic composition and fish abundances and health condition. Over the study duration (2007–2016), native and riffle-benthic fish species indicated that the biotic health was near to excellent except in 2013 and 2016, which deciphers AR changes on a larger scale. Based on average annual scores, sensitive species (SS) maintained their level although spatially SS changed in AR era as discussed in the Section 3.7. In addition, another speculation suggested that with the prevailing pollutants downstream, SS could have escaped towards the upstream cleaner sites. The percentage of tolerant species (TS) remained low during AR period indicating the decline of pollutants. Surprisingly, the omnivore and native insectivore fish species, during the 10 year duration of research, approximated with the score obtained by tolerant species in the same manner although scoring criteria was dissimilar. The proportion of individuals with abnormalities was in the middle range that, however, presented an increase in the first two years of AR (2013–2014) but during the ensuing years (2015–2016), no individuals with physical abnormalities were found indicating thereby rehabilitation from the restoration traumas, if there would have been any. The total score obtained after 8 metric score aggregation, the IBI values drove to categorize the annual biological health status of Gap Stream as ‘poor’ except 2013–2014, when it indicated the biotic integrity as ‘very poor’.
3.9. Relationship between Water Quality and Health Indices
3.9.1. Correlation Analysis
The correlation analysis on selected water quality parameters and indices used in this study revealed a moderately strong to strong relationship between the water quality parameters and health indices in Gap Stream (Table 7). TP indicated strong positive (r ≥ 0.70) relationship with TN, BOD, COD and moderately strong negative (r = 0.50–0.70) relationship with WPI. CHL-a showed moderately strong positive (r = 0.50–0.70) relationship with TN, BOD, COD and moderately strong negative relationship with WPI (r = −0.633). QHEI and IBI showed a very weak relationship with water quality factors. However, QHEI and IBI showed a moderately strong positive relationship (r = 0.569) with each other. The WPI correlation remained very weak with QHEI and IBI.
3.9.2. Principal Component Analysis (PCA)
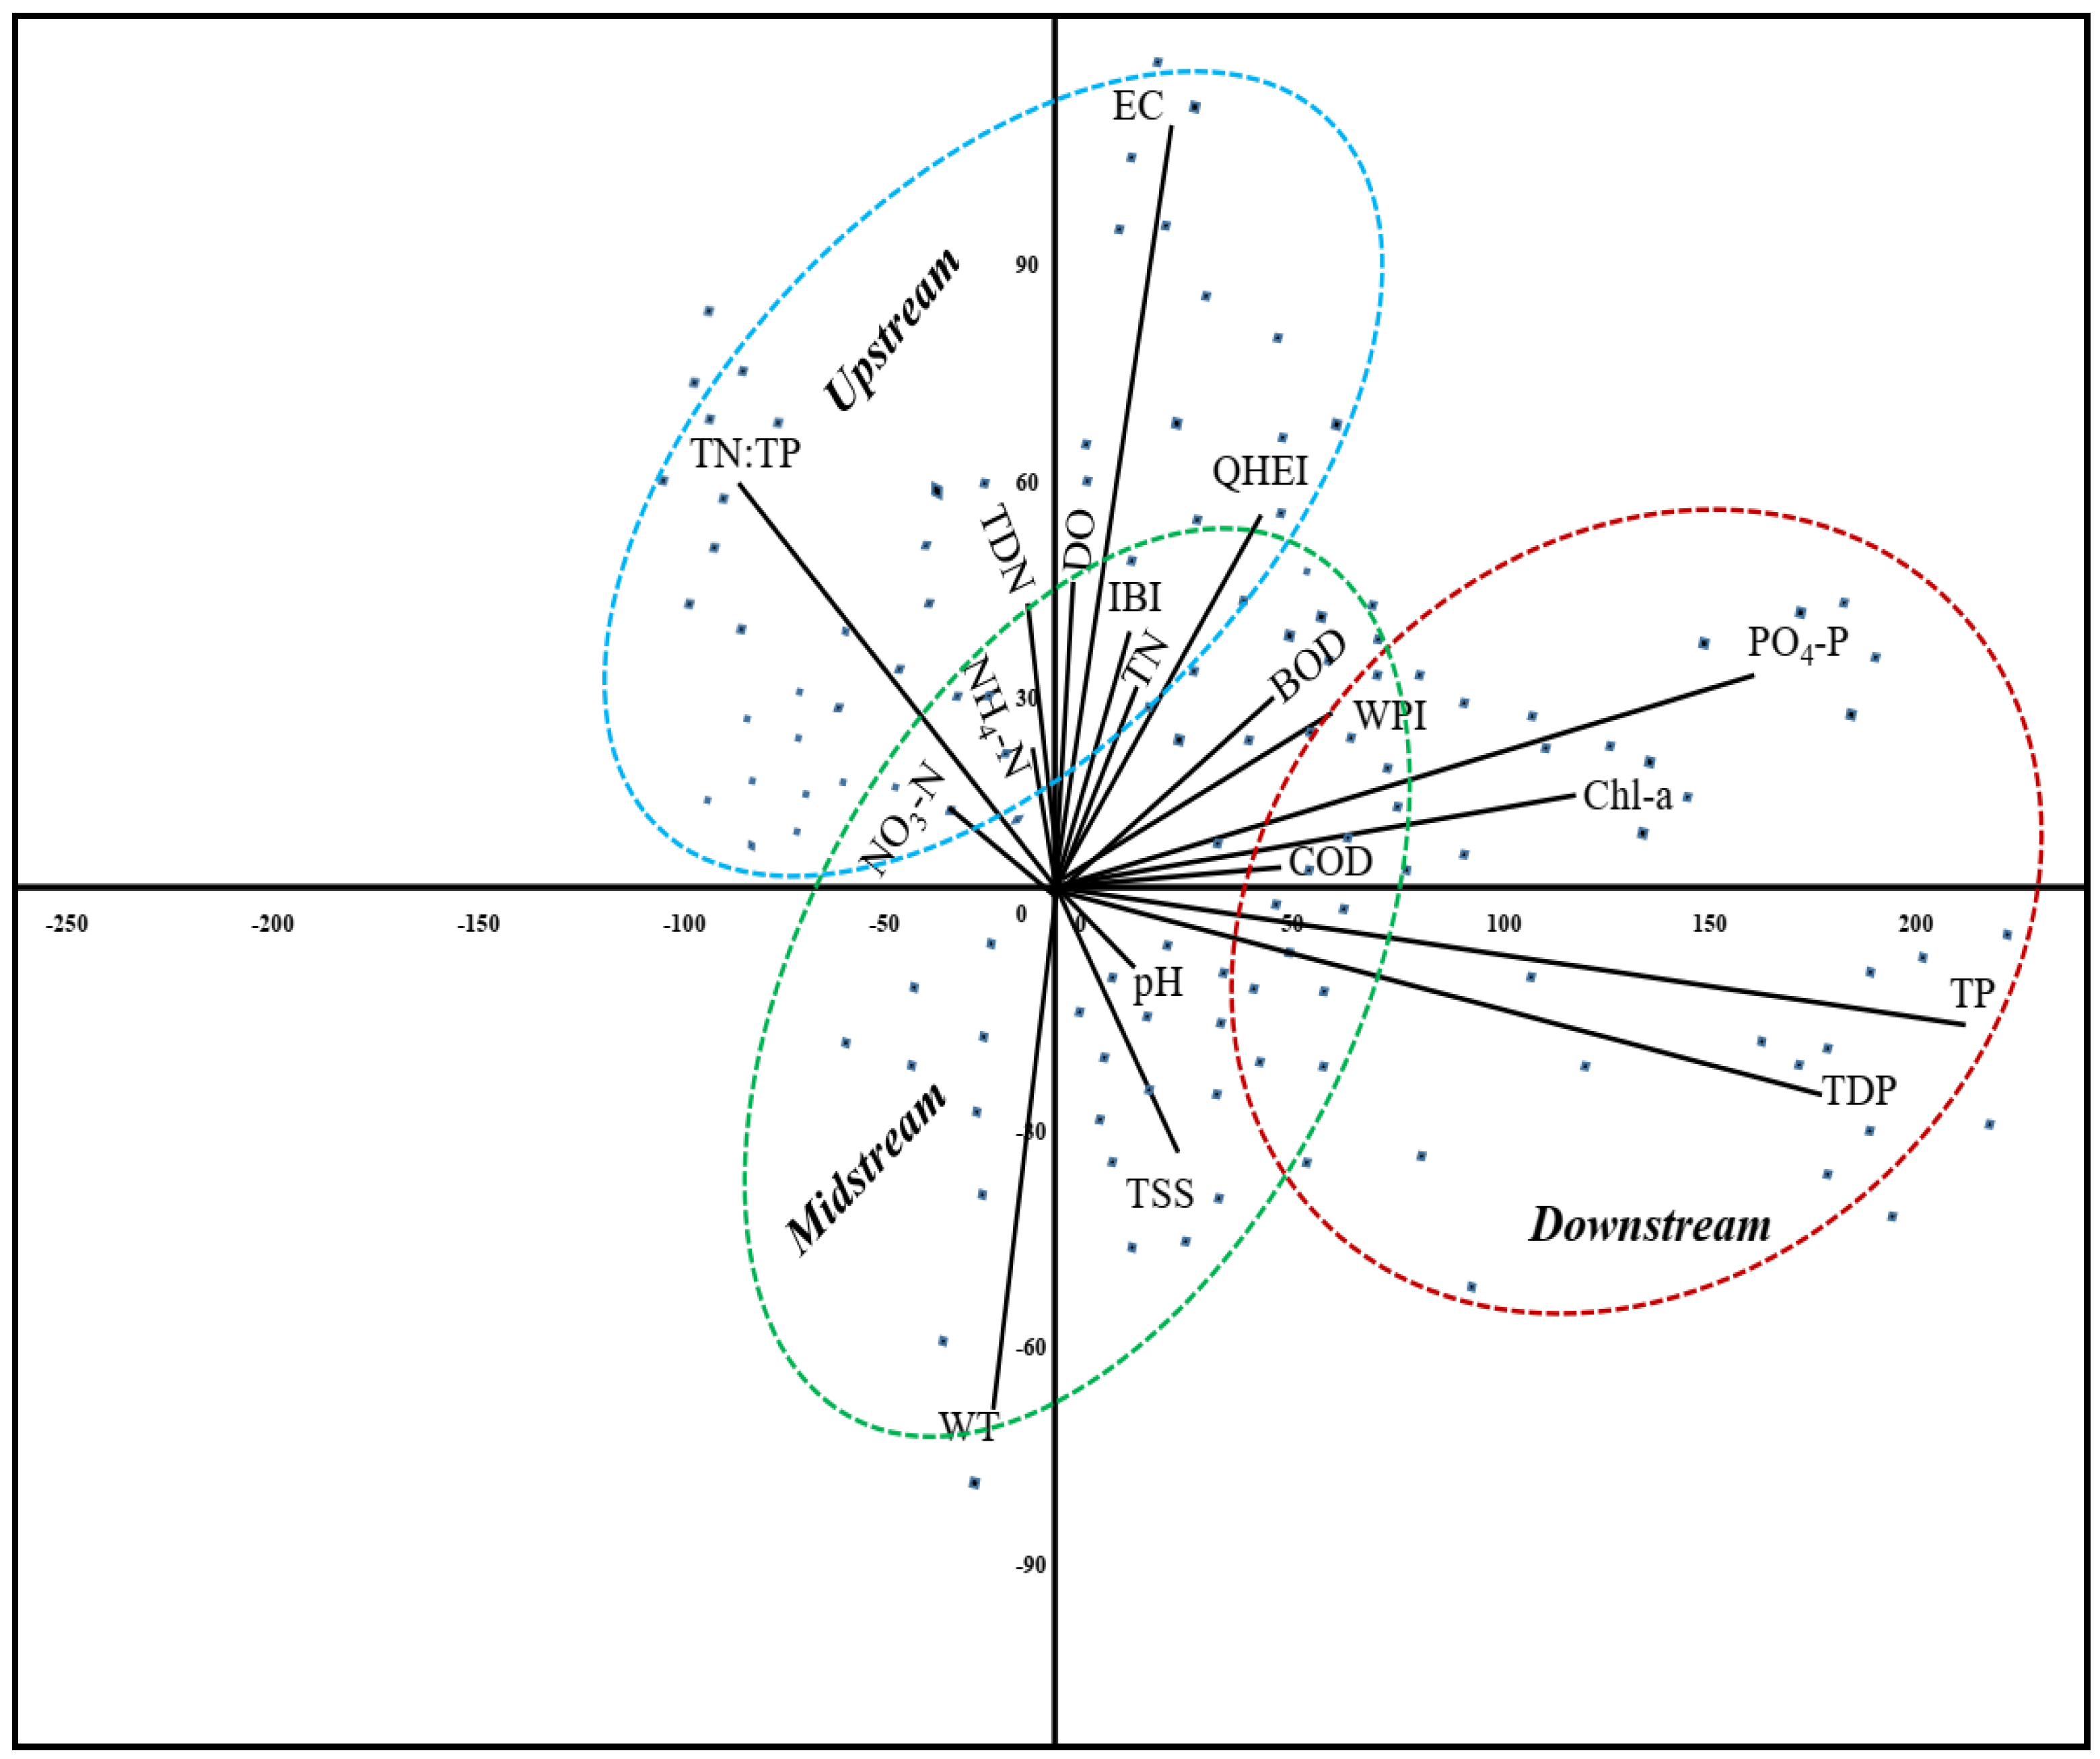
We used the principal component analysis to identify the trends and persistence of significant water quality parameters in relation with the indices used to assess the various aspects of stream ecological health. It successfully classified the influential factors significant to the health condition of Gap Stream during the study duration (Figure 8). The principal components (PC) revealed very useful information about the settlement of parameters and indices used in relation to the stream components. The PCA results showed that PC 1 and PC 2 accounted for 89.30% of the total variance in Gap Stream (Table 8). The settlement of factors used in PCA indicated that the stream could be divided into three imaginary compartments with respect to the arrangements of used factors in PCA. The imaginary components could be designated as upstream, midstream and downstream. The downstream sites largely influenced by chemical components (COD), phosphate nutrients (TP, TDP, PO4-P), and Sestonic CHL-a. The midstream component mainly accommodated the TSS, TN and allied chemical species, WPI and IBI along with pH. However, the upstream component characterized by DO, EC and QHEI indicated good ecological health status.
4. Discussion
4.1. Water Quality and Habitat
Water quality and ecological habitat play very significant roles in the very existence of sustainable fish populations. The most salient feature of Korean precipitation is the summer monsoon rainfall (the greatest intensity is usually in July–August) that mainly influences precipitation patterns in South Korea wherein almost 70% of rainfall occurs, leading to astounding hydrological variations in all types of water bodies [18,21]. The influence of monsoon could be noticed in monthly as well as inter-annual water quality modifications. The monthly changes in the water quality parameters could be related to flashfloods, water flow from upstream to downstream as well as the anthropogenic activities in the catchment area. Further, the application of fertilizers and industrial activities continuously contributing opulent TN, TP and chemical inflows to the stream ecosystem. On the other hand, the inter-annual changes in the water quality factors in relation with total rainfall in the watershed indicated that pH, TN, TP as well as Sestonic CHL-a influenced by the intensity of rainfall events individually as well as accumulatively. Therefore, it was concluded that the most important factor in the seasonal and annual water quality modifications in Gap Stream watershed was the monsoon regime which played dilution role in the case of nutrients and chemical pollutants originating from the WWTPs, industrial effluents and other anthropogenic activities [13,35]. It also indicated how rainfall patterns maneuver the water quality and carry the effects of intensive agricultural, industrial and anthropogenic activities in the watershed [21,56,57,58].
The Gap Stream was subjected to restoration measures in order to improve the water quality and habitat facilities. However, we inferred that the restoration measures did not alter the primary productivity pattern in Gap Stream that was a good sign and indicated successful restoration. The detailed analyses of changes in water quality BR and AR project revealed that the distribution range, maximum and average value of the water parameters decreased AR, especially the TP, wherein the mean values vividly decreased from 264.8 μg/L to 67.3 μg/L. The statistical analysis revealed by t-test also conformed to the statistically significant difference in all the water quality factors except conductivity. However, conductivity values already displayed normal ranges. The spatial changes from upstream to the downstream sites presented an interesting scenario when compared between BR and AR duration at each study site. Therefore, it was inferred that the restoration project yielded positive changes in water quality parameters. Further, our results are strongly supported by previous studies on stream restoration [3,10,13,17]. Some water quality factors, however, showed slight modifications after the restoration project and were believed to have been affected apparently by the discharges of the sewage treatment plant and therefore called for serious countermeasures to be considered. One important factor that needs to considered was that along the watercourse of Gap Stream, there are several small and large weirs constructed in the upper and lower regions [59], which could have played a significant role in the water quality modifications, due to increase in water residence time. Our results are widely supported by previous research [3,17,24]. It is important to mention that the leading aim of this restoration was to improve the water quality in Gap Stream due to its geographical and aesthetic importance. The results indicated the chemical water quality deterioration linked with city sewage, agricultural activities, run-off water, and the effect of restoration measures contributed significantly in improving the water quality status. The study is sumptuously supported by previous studies [3,13,18,60]. On the other hand, our study based on the QHEI suggested that physical habitat health could not immediately improve after the completion of the stream restoration project. Nevertheless, that could be substantiated by the slow and steady effect of restoration measures on habitat improvement [30,61].
4.2. Fish Assemblages and Biotic Integrity
Most fish species with high RA before and after restoration were similar, however, after restoration, the number of individuals of the Opsarichthys uncirostris amurensis decreased, the number of individuals of Rhinogobius brunneus appeared higher, and this could have been feasibly due to the construction of artificial weirs and fish ways particularly in the upstream stretches of Gap Stream. This indicated the species captured preferred to inhabit the weir environment. In the case of Iksookimia choii, designated as an endangered fish in Korea, only three individuals were collected before the restoration, but there were no sampled fish pieces of the species in the AR samples. Therefore, it could be inferred that Iksookimia choii are likely to disappear from the Gap Stream, however, further research is needed before establishing its depletion. On the other hand, the ecologically hazardous and invasive species viz. Bluegill (Lepomis macrochirus) was not observed at all during BR samples, but was confirmed to be present at various points after restoration, raising concern about native fish integrity in Gap Stream ecosystem. This calls for an immediate planning to eradicate the invasive fish before it is competing for natural resources inflicting further harms to native fish biotic integrity. There are expectations of loss of habitat and feeding grounds and environmental disturbances because of restoration measures leading to decrease certain species and increase in other fish assemblage parameters depending on the availability or changes in pertinent resources essential to their existence in the microhabitat [59]. On a larger scale, this study suggested tolerant species (TS) and intermediate species (IS) are increasing in the Gap Stream watershed which also coincided with some previous studies [3,8,13,35]. Overall, it was inferred that the restoration efforts have significant effect on the abundance and distribution of fish assemblages. However, decrease in SS at upstream sites indicated the water quality around those points was intolerable to survive. Further, due to modifications in stream flow, microhabitat, feeding and shelter grounds as well as transformation of instream covers lead to the creation of new feeding and shelter sites for fish species inhabitation [3,24,51]. The role of restoration efforts was not seen in the immediately ensuing years but it is anticipated to bring about positive changes in the stream environment in the years later.
Biological health started to decline downstream owing to worsening water quality and further deterioration caused the WWTP especially along the downstream sites. Further, it worsened due to restoration project as it may have caused severe damages to the feeding and shelter grounds of different species and their preferred habitats. The indicators included the decreasing total number of individuals as well as the total number of fish species from upstream to downstream sites. The decline of the total number of individuals (TNI) as well as fish species spatially and temporally was an additional confirmation of the deteriorating biological integrity. [13,35,41,62]. Nevertheless, the abundance of TS, SS, omnivores, native insectivores and abnormalities plus the obtained annual IBI scores showed some increasing tendency although statistically insignificant. Therefore, the anticipated improvement in biological health of Gap Stream through the restoration project did not show any clear effects [3,63]. However, it is anticipated to rehabilitate with the advent of time, as there are clear signs of improvements in water quality and habitat restoration is expected to start responding [63].
4.3. Relationship Between Water Quality and Health Indices
The Pearson correlation and PCA results led to infer that the Gap Stream’s ecological health after restoration was limited by the ecological disturbances and modifications in physical habitats, water channel modifications and feeding grounds rather than water quality. It also indicated that water chemistry improved during the restoration efforts and played a significant role in overall improvement of the ecological health of Gap Stream. The water quality relations are corroborated with the previous studies [30,61,64,65]. The biotic health of Gap Stream mainly determined by chemical water quality (in terms of WPI) degradation at the downstream stretches as well as directly determined by habitat conditions (in terms of QHEI) upstream. The principal component ordination approach is convenient in site-specific and stream region related assessments in stream restoration [66]. It successfully identified the key factors influencing the Gap Stream using the principle that the similarly changing factors will be closer to each other and settle down in one compartment of similar sites and dissimilar ones settle farther apart from each other. Distinct configurations of chemical water quality parameters in relation with the physical habitat parameters did not alter before or after stream restoration, specifying thereby chemical water quality parameters necessitate restoration measures directed towards downstream stretch. Our conclusions proposed that effective restoration measures required the implementation of nutrient attenuation in downstream reaches especially the ones directly influenced by effluents from WWTPs and the industrial activities [3,13,35,67,68,69].
5. Conclusions
We studied the ecological health of an urban stream subjected to restoration measures in terms of its chemical water quality (organic matter, TN and TP loadings), water pollution index (WPI), physical habitat health (QHEI) and biotic integrity (IBI). There was reasonable improvement in overall water quality. However, QHEI and IBI results did not improve to a significant level, but did show slight indications of improvements because of restoration. The overall stream ecological health indicated that physical habitat, chemical water quality and biological integrity results indicated the inclusive effects of stream restoration measure were minor, although chemical water quality as well as habitat health status upgraded slightly. There was remarkable reduction in TP levels that indicated a decrease in the chances of nutrient enrichment downstream. In addition, the downstream compartment indicated a decrease in effluents from WWTPs. After restoration (AR) results showed a decrease in tolerant species and increase in sensitive species indicating a promising sign of improvement downstream and corroborated with the results of water quality. However, nutrients and chemical rich inflows into the stream ecosystem indicated aggregation of pollutants that could eventually lead to severe ecological disturbance with the course of time and hence call for integrated action to mitigate the impending ecological degradation. Our study also suggested that novel and combined approach of studying the restoration of urban streams in the light of IBI, QHEI and WPI could successfully be replicated to understand the stream ecology at large and estimate the success of urban stream restoration projects in the future.
Author Contributions
J.-J.K. and U.A. procured and analyzed the data, prepared the illustrations and wrote the manuscript under the supervision of K.-G.A.
Funding
The Korean Ministry of Environment (MOE) funded this research in collaboration with Korea Environment Industry & Technology Institute (KEITI) through “Exotic Invasive Species Management Program” (Grant # RE201807019).
Acknowledgments
This work partially supported by Daejeon Green Environment Center (Year 2017). Therefore, the authors acknowledge the institution for assistance.
Conflicts of Interest
The authors declare no conflict of interest.
References
- Bordalo, A.A.; Teixeira, R.; Wiebe, W.J. A water quality index applied to an international shared river basin: The case of the Douro River. Environ. Manag. 2006, 38, 910–920. [Google Scholar] [CrossRef] [PubMed]
- Kaushal, S.S.; Lewis, W.M. Fate and transport of dissolved organic nitrogen in minimally disturbed streams of Colorado, USA. Biogeochemistry 2005, 74, 303–321. [Google Scholar] [CrossRef]
- Lee, J.H.; An, K.G. Integrative restoration assessment of an urban stream using multiple modeling approaches with physical, chemical, and biological integrity indicators. Ecol. Eng. 2014, 62, 153–167. [Google Scholar] [CrossRef]
- Boon, P.J. The development of integrated methods for assessing river conservation value. Hydrobiologia 2000, 422, 413–428. [Google Scholar] [CrossRef]
- Karr, J.R.; Heidinger, R.C.; Helmer, E.H. Effects of chlorine and ammonia from wastewater treatment facilities on biotic integrity. J. Water Pollut. Control Fed. 1985, 57, 912–915. [Google Scholar]
- Karr, J.R.; Toth, L.A.; Dudley, D.R. Fish communities of midwestern rivers: A history of degradation. BioScience 1985, 35, 90–95. [Google Scholar] [CrossRef]
- An, K.G.; Lee, J.Y.; Bae, D.Y.; Kim, J.H.; Hwang, S.J.; Won, D.H.; Lee, J.K.; Kim, C.S. Ecological assessments of aquatic environment using multi-metric model in major nationwide stream watersheds. J. Korean Water Qual. 2006, 22, 796–804. (In Korean) [Google Scholar]
- Choi, J.W.; Kumar, H.K.; Han, J.H.; An, K.G. The development of a regional multimetric fish model based on biological integrity in lotic ecosystems and some factors influencing the stream health. Water Air Soil Pollut. 2011, 217, 3–24. [Google Scholar] [CrossRef]
- Son, J.G.; Son, T.H.; Choi, J.K.; Jo, J.Y.; Goh, N.Y.; Oh, J.H. Monitoring of hydrological and water quality in Dongjin-River Hengjeong Bridge watershed for agricultural watershed non-point pollutant sources management. J. Korean Soc. Agric. Eng. 2012, 54, 55–63. [Google Scholar]
- Kim, J.H.; Oh, H.M.; Kim, I.S.; Lim, B.J.; An, K.G. Ecological Health Assessments of an Urban Lotic Ecosystem Using a Multimetric Model along with Physical Habitat and Chemical Water Quality Assessments. Int. J. Environ. Res. 2013, 7, 659–668. [Google Scholar]
- Lee, C.J.; Rasmussen, T.J. Occurrence of organic wastewater compounds in effluent-dominated streams in Northeastern Kansas. Sci. Total Environ. 2006, 371, 258–269. [Google Scholar] [CrossRef] [Green Version]
- Lee, K.B.; Kim, J.C.; Kim, J.G.; Lee, D.B.; Park, C.W.; Kim, J.D. Assessment of pollutant loads in the Dongjin River. Korean J. Environ. Agric. 2005, 24, 91–97. [Google Scholar] [CrossRef]
- Atique, U.; An, K.-G. Stream Health Evaluation Using a Combined Approach of Multi-Metric Chemical Pollution and Biological Integrity Models. Water 2018, 10, 661. [Google Scholar] [CrossRef]
- Bernhardt, E.S.; Palmer, M.A. River restoration: The fuzzy logic of repairing reaches to reverse catchment scale degradation. Ecol. Appl. 2011, 21, 1926–1931. [Google Scholar] [CrossRef] [PubMed]
- Wortley, L.; Hero, J.M.; Howes, M. Evaluating ecological restoration success: A review of the literature. Restor. Ecol. 2013, 21, 537–543. [Google Scholar] [CrossRef]
- Yoder, C.O. The Integrated Biosurvey as a Tool for 852 Evaluation of Aquatic Life use Attainment and Impairment 853 in Ohio Surface Waters; EPA 440-5-91-005; US EPA: Washington, DC, USA, 1991; pp. 110–122.
- Kim, S.; An, K.G. Nutrient regime, N:P ratios and suspended solids as key factors influencing fish tolerance, trophic compositions, and stream ecosystem health. J. Ecol. Environ. 2015, 38, 505–515. [Google Scholar] [CrossRef] [Green Version]
- Choi, J.W.; Han, J.H.; Park, C.S.; Ko, D.G.; Kang, H.I.; Kim, J.Y.; Yun, Y.J.; Kwon, H.H.; An, K.G. Nutrients and sestonic chlorophyll dynamics in Asian lotic ecosystems and ecological stream health in relation to land-use patterns and water chemistry. Ecol. Eng. 2015, 79, 15–31. [Google Scholar] [CrossRef]
- Yun, S.G.; Kim, Y.I.; Kim, J.H.; Kim, S.J.; Koh, M.H.; Eom, K.C. Evaluation of water quality characteristics on tributaries of Dongjin River watershed. Korean J. Environ. 2002, 21, 243–247. [Google Scholar] [CrossRef]
- Bernhardt, E.S.; Palmer, M.A. Restoring streams in an urbanizing world. Freshw. Biol. 2007, 52, 738–751. [Google Scholar] [CrossRef]
- Atique, U.; An, K.-G. Reservoir Water Quality Assessment Based on Chemical Parameters and the Chlorophyll Dynamics in Relation to Nutrient Regime. Pol. J. Environ. Stud. 2019. [Google Scholar] [CrossRef]
- Mamun, M.; An, K.G. Ecological Health Assessments of 72 Streams and Rivers in Relation to Water Chemistry and Land-Use Patterns in South Korea. Turk. J. Fish. Aquat. Sci. 2018, 18, 871–880. [Google Scholar] [CrossRef]
- Suren, A.M.; Riis, T.; Biggs, B.J.F.; McMurtrie, S.; Barker, R. Assessing the effectiveness of enhancement activities in urban streams: I. Habitat responses. River Res. Appl. 2005, 21, 381–401. [Google Scholar] [CrossRef]
- Richardson, C.J.; Flanagan, N.E.; Ho, M.; Pahl, J.W. Integrated stream and wetland restoration: A watershed approach to improved water quality on the landscape. Ecol. Eng. 2011, 37, 25–39. [Google Scholar] [CrossRef] [Green Version]
- Konrad, C.P.; Booth, D.B. Hydrologic Trends Associated with Urban Development for Selected Streams in the Puget Sound Basin, Western Washington; Water-Resources Investigations Report 02-4040; US Geological Survey: Denver, CO, USA, 2002.
- Poff, N.L.; Richter, D.B.; Arthington, A.H.; Bunn, S.E.; Naiman, R.J.; Kendy, E.; Acreman, M.; Apse, C.; Bledsoe, P.B.; Freeman, C.M.; et al. The ecological limits of hydrologic alteration (ELOHA): A new framework for developing regional environmental flow standards. Freshw. Biol. 2010, 55, 147–170. [Google Scholar] [CrossRef]
- Young, W.J. (Ed.) Rivers as Ecological Systems—The Murray-Darling Basin; Murray-Darling Basin Commission: Canberra, Australia, 2001. [Google Scholar]
- Gopal, B.; Vass, K.K. Impacts of regulation of river flows. In Environmental Flow; Gopal, B., Ed.; National Institute of Ecology: Rajasthan, India, 2013; pp. 81–112. [Google Scholar]
- United States Environmental Protection Agency (US EPA). Fish Field and Laboratory Methods for Evaluating the Biological Integrity of Surface Waters, Environmental Monitoring Systems Laboratory—Cincinnati Office of Modeling; EPA 600-R-92-111; Monitoring Systems, and Quality Assurance Office of Research Development, US EPA: Cincinnati, OH, USA, 1993.
- Plafkin, J.L.; Barbour, M.T.; Porter, K.D.; Gross, S.K.; Hughes, R.M. Rapid Assessment Protocols for Use in Streams and Rivers: Benthic Macroinvertebrates and Fish; EPA/444/4-89-001; Office of Water Regulations and Standards, US EPA: Washington, DC, USA, 1989.
- Barbour, M.T.; Gerritsen, J.; Snyder, B.D.; Stribling, J.B. Rapid Bioassessment Protocols for Use in Streams and Wadeable Rivers: Periphyton, Benthic Macroinvertebrates and Fish, 2nd ed.; EPA 841-B-99-002; U.S. Environmental Protection Agency, Office of Water: Washington, DC, USA, 1999.
- US Department of Commerce (USDC). Stream Corridor Restoration Project: Principles, Processes, and Practices. Federal Intergency Stream Restoration Working Group, National Technical Information Service; US Department of Commerce: Springfield, VA, USA, 1998.
- Shields, F.D.; Cooper, C.M.; Knight, S.S.; Moore, M.T. Stream corridor restoration research: A long and winding road. Ecol. Eng. 2003, 20, 441–454. [Google Scholar] [CrossRef]
- Lang, C.; Reymond, O. An improved index of environmental quality for Swiss rivers based on benthic invertebrates. Aquat. Sci. 1995, 57, 172–180. [Google Scholar] [CrossRef]
- Kim, J.Y.; An, K.G. Integrated Ecological River Health Assessments, Based on Water Chemistry, Physical Habitat Quality and Biological Integrity. Water 2015, 7, 6378–6403. [Google Scholar] [CrossRef] [Green Version]
- Strahler, A.N. Quantitative analysis of watershed geomorphology. Am. Geophys. Union Trans. 1957, 38, 913–920. [Google Scholar] [CrossRef]
- The Ministry of Environments/National Institute of Environmental Research (MOE/NIER). Researches for Integrative Assessment Methodology of Aquatic Environments (III): Development of Aquatic Ecosystem Health Assessments and Evaluation System, 1st ed.; MOE/NIER: Incheon, Korea, 2006.
- Marker, A.F.H.; Crowther, C.A.; Gunn, R.J.M. Methanol and acetone as solvents for estimating chlorophyll a and phaeopigments by spectrophotometry. Arch. Hydrobiol. Beih. Ergebn. Limnol. 1980, 14, 52–59. [Google Scholar]
- The Ministry of Environments (MOE). Standard Methods for the Examination of Water Quality Contamination; The Ministry of Environments (MOE): Gwacheon, Korea, 2000.
- American Public Health Association (APHA). Standard Methods for the Examination of Water and Wastewater, 21st ed.; American Public Health Association: New York, NY, USA, 2005. [Google Scholar]
- An, K.G.; Kim, J.H. A Diagnosis of Ecological Health Using a Physical Habitat Assessment and Multimetric Fish Model in Daejeon Stream. Korean J. Limnol. 2005, 38, 361–371. [Google Scholar]
- Environmental Protection Agency (Ohio EPA). Biological Criteria for the Protection of Aquatic Life: Volume III. Standardized Biological Field Sampling and Laboratory Method for Assessing Fish and Macroinvertebrate Communities; Division of Surface Water, Ecological Assessment Section: Ohio, OH, USA, 1989; p. 66.
- Kim, I.S.; Park, J.Y. Freshwater Fish of Korea; Kyohak Publishing: Seoul, Korea, 2002; p. 465. [Google Scholar]
- Nelson, J.S. Fishes of the World, 4th ed.; John Wiley & Sons: New York, NY, USA, 2006; p. 624. [Google Scholar]
- An, K.G.; Kim, D.S.; Kong, D.S.; Kim, S.D. Integrative assessments of a temperate stream based on a multimetric determination of biological integrity, physical habitat evaluations, and toxicity tests. Bull. Environ. Contam. Toxicol. 2004, 73, 471–478. [Google Scholar] [CrossRef] [PubMed]
- Karr, J.R. Assessment of biotic integrity using fish communities. Fisheries 1981, 6, 21–27. [Google Scholar] [CrossRef]
- Yeom, D.H.; Adams, S.M. Assessing effects of stress across levels of biological organization using an aquatic ecosystem health index. Ecotoxicol. Environ. Saf. 2006, 67, 286–295. [Google Scholar] [CrossRef] [PubMed]
- Sigma Plot Version 10. Systat Software, Inc., San Jose, California, USA. Available online: www.systatsoftware.com (accessed on 22 October 2018).
- The Past of the Future, version PAST 3.15, Oyvind Hammer; Natural History Museum, University of Oslo: Oslo, Norway, 2017.
- An, K.G.; Park, S.S. Influence of seasonal monsoon on the trophic state deviation in an Asian reservoir. Water Air Soil Pollut. 2003, 145, 267–287. [Google Scholar] [CrossRef]
- Paller, M.H.; Reichert, M.J.M.; Dean, J.M.; Seigle, J.C. Use of fish community data to evaluate restoration success of a riparian stream. Ecol. Eng. 2000, 15, 171–187. [Google Scholar] [CrossRef]
- Smith, V.H. Low nitrogen to phosphorus ratios fav or dominance by blue-green algae in Lake Phytoplankton. Science 1983, 221, 669–671. [Google Scholar] [CrossRef] [PubMed]
- Fujimoto, N.; Sudo, R. Nutrient-limited growth of Microcystis aerugimosa and phormidium tenue and competition under various N:P supply ratios and temperatures. Limnol. Oceonogr. 1997, 42, 250–256. [Google Scholar] [CrossRef]
- Seppala, J.; Tamminen, T.; Kaitala, S. Experimental evaluation of nutrient limitation of phytoplankton communities in the Gulf of Riga. J. Mar. Syst. 1999, 23, 107–126. [Google Scholar] [CrossRef] [Green Version]
- Ling, T.-Y.; Soo, C.-L.; Liew, J.-J.; Nyanti, L.; Sim, S.-F.; Grinang, J. Influence of Rainfall on the Physicochemical Characteristics of a Tropical River in Sarawak, Malaysia. Pol. J. Environ. Stud. 2017, 26, 2053–2065. [Google Scholar] [CrossRef] [Green Version]
- Calderon, M.S.; An, K.G. Spatio-temporal variabilities of nutrients and chlorophyll, and the trophic state index deviations on the relation of nutrients-chlorophyll–light availability. J. Ecol. Environ. 2016, 39, 31–42. [Google Scholar] [CrossRef]
- Geumgang Water Shed Management Committee. Water Environment Management Planning Report for Gap-stream Medium Influence Areas; Ministry of Land, Transport, and Maritime Affairs: Seoul, South Korea, 2014; pp. 25–35.
- Purcell, A.H.; Friedrich, C.; Resh, V.H. An assessment of a small urban stream restoration project in Northern California. Restor. Ecol. 2002, 10, 685–694. [Google Scholar] [CrossRef]
- Dodds, W.K.; Jones, J.R.; Welch, E.B. Suggested classification of stream trophic state: Distributions of temperate stream types by chlorophyll, total nitrogen and phosphorus. Water Res. 1998, 32, 1455–1462. [Google Scholar] [CrossRef]
- Han, J.H.; An, K.G. Chemical Water Quality and Fish Community Characteristics in the Mid- to Downstream Reach of Geum River. Korean J. Environ. Biol. 2013, 31, 180–188. [Google Scholar] [CrossRef]
- An, K.G.; Park, S.S.; Shin, J.Y. An evaluation of a river health using the index of biological integrity along with relations to chemical and habitat conditions. Environ. Int. 2002, 28, 411–420. [Google Scholar] [CrossRef]
- Bae, E.Y.; An, K.G. Stream Ecosystem Assessments, based on a Biological Multimetric Parameter Model and Water Chemistry Analysis. Korean J. Limnol. 2006, 39, 198–208. [Google Scholar]
- An, K.G.; Yeom, D.H.; Lee, S.K. Rapid bioassessments of Kap stream using the index of biological integrity. Korean J. Environ. Biol. 2001, 19, 261–269. (In Korean) [Google Scholar]
- Kleynhans, C.J. The development of a fish index to assess the biological integrity of South African rivers. Water S.A 1999, 25, 265–278. [Google Scholar]
- Joy, M.K.; Death, R.G. Application of the Index of Biotic Integrity Methodology to New Zealand Freshwater Fish Communities. Environ. Manag. 2004, 34, 415–428. [Google Scholar] [CrossRef]
- Legendre, P.; Legendre, L. Numerical Ecology (Developments in Environmental Modelling), 2nd ed.; Elsevier: Amsterdam, The Netherlands, 1998. [Google Scholar]
- Oberdorff, T.; Hughes, R.M. Modification of an index of biotic integrity based on fish assemblages to characterize rivers of the Seine Basin, France. Hydrobiologia 1992, 228, 117–130. [Google Scholar] [CrossRef]
- Hugueny, B.S.; Camara, B.; Samoura, B.; Magassouba, M. Applying an index of biotic integrity based on communities in a West African river. Hydrobiologia 1996, 331, 71–78. [Google Scholar] [CrossRef]
- Adams, S.M.; Ham, K.D.; Greeley, M.S.; LeHew, R.F.; Hinton, D.E.; Saylor, C.F. Downstream gradients in bioindicator response: Point source contaminant effects on fish health. Can. J. Fish Aquat. Sci. 1996, 53, 2177–2187. [Google Scholar] [CrossRef]
Figure 1.
Watershed area and location of water (W) quality and biological (B) sampling sites in Gap Stream, South Korea. Where B1–B5 are the biological (B) sampling sites and W1–W6 are the water (W) quality monitoring sites.
Figure 1.
Watershed area and location of water (W) quality and biological (B) sampling sites in Gap Stream, South Korea. Where B1–B5 are the biological (B) sampling sites and W1–W6 are the water (W) quality monitoring sites.
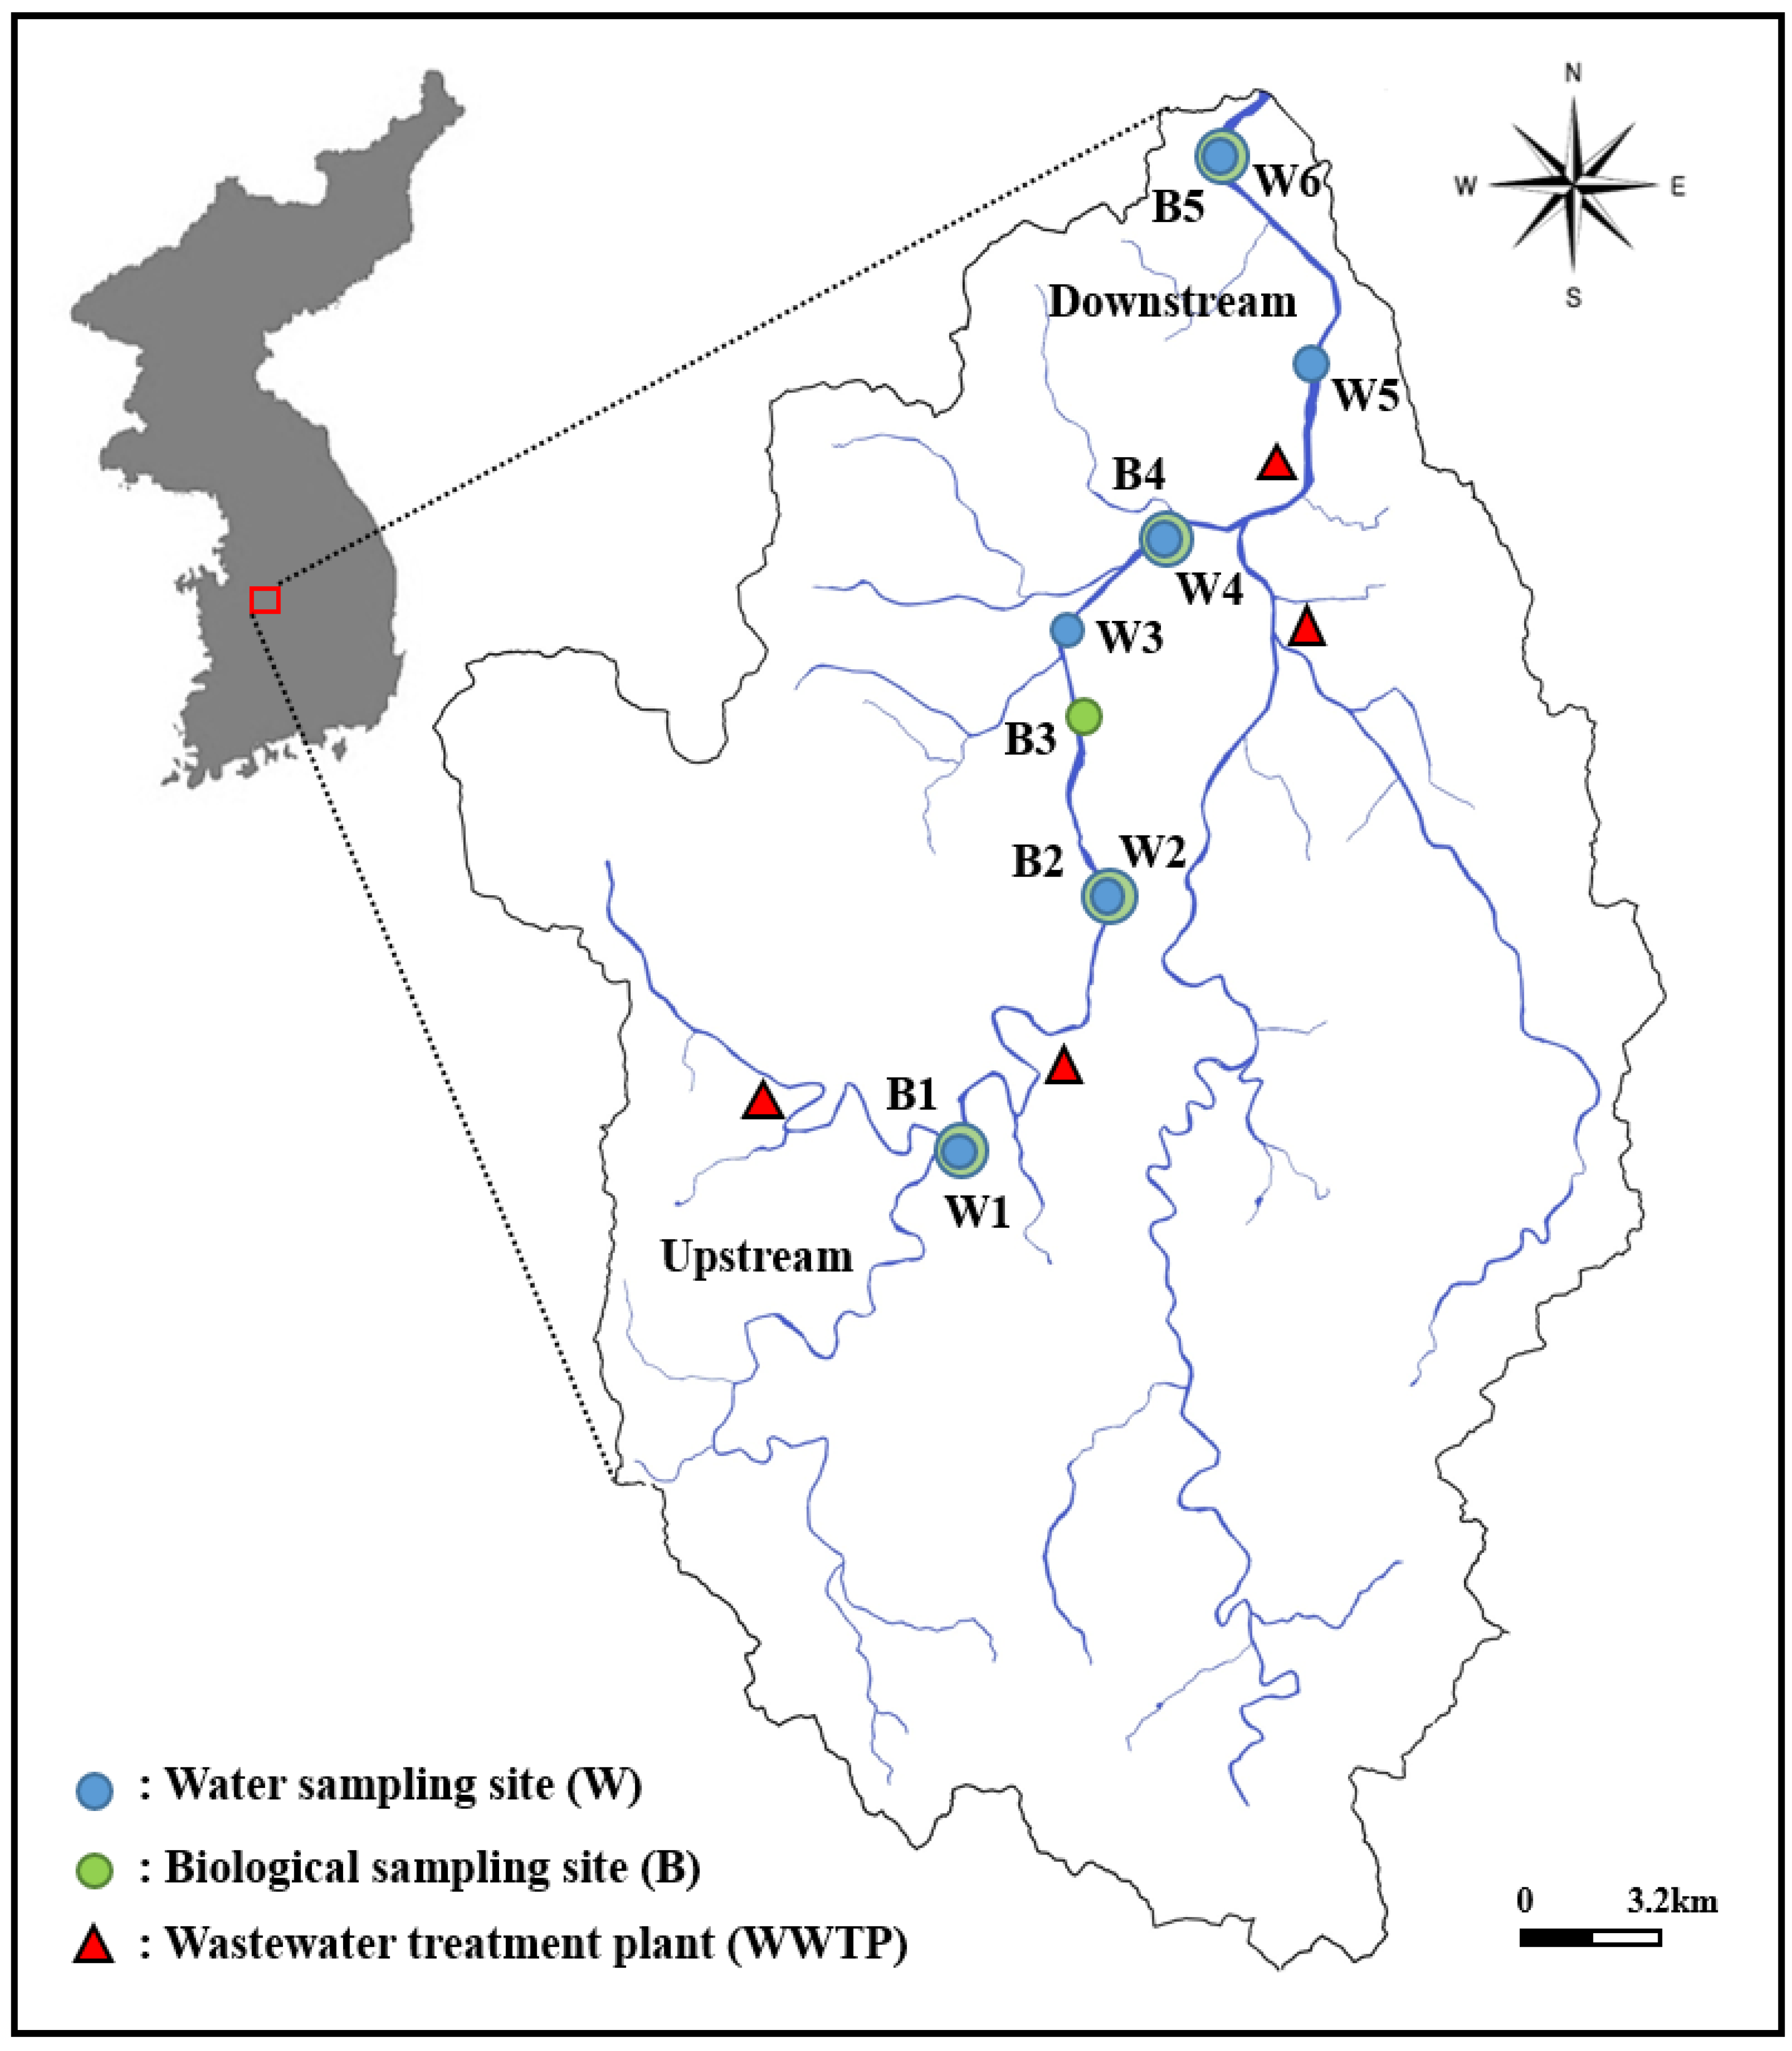
Figure 2.
Monthly variation in selected water quality parameters in relation to monthly precipitation shown as (Spline red curve) in Gap stream during 2007–2016. TN = Total nitrogen, TP = Total phosphorus, BOD = Biological oxygen demand, COD = Chemical oxygen demand, SS = Suspended solids, CHL-a = Chlorophyll-a, W1–W6 = Water quality sites.
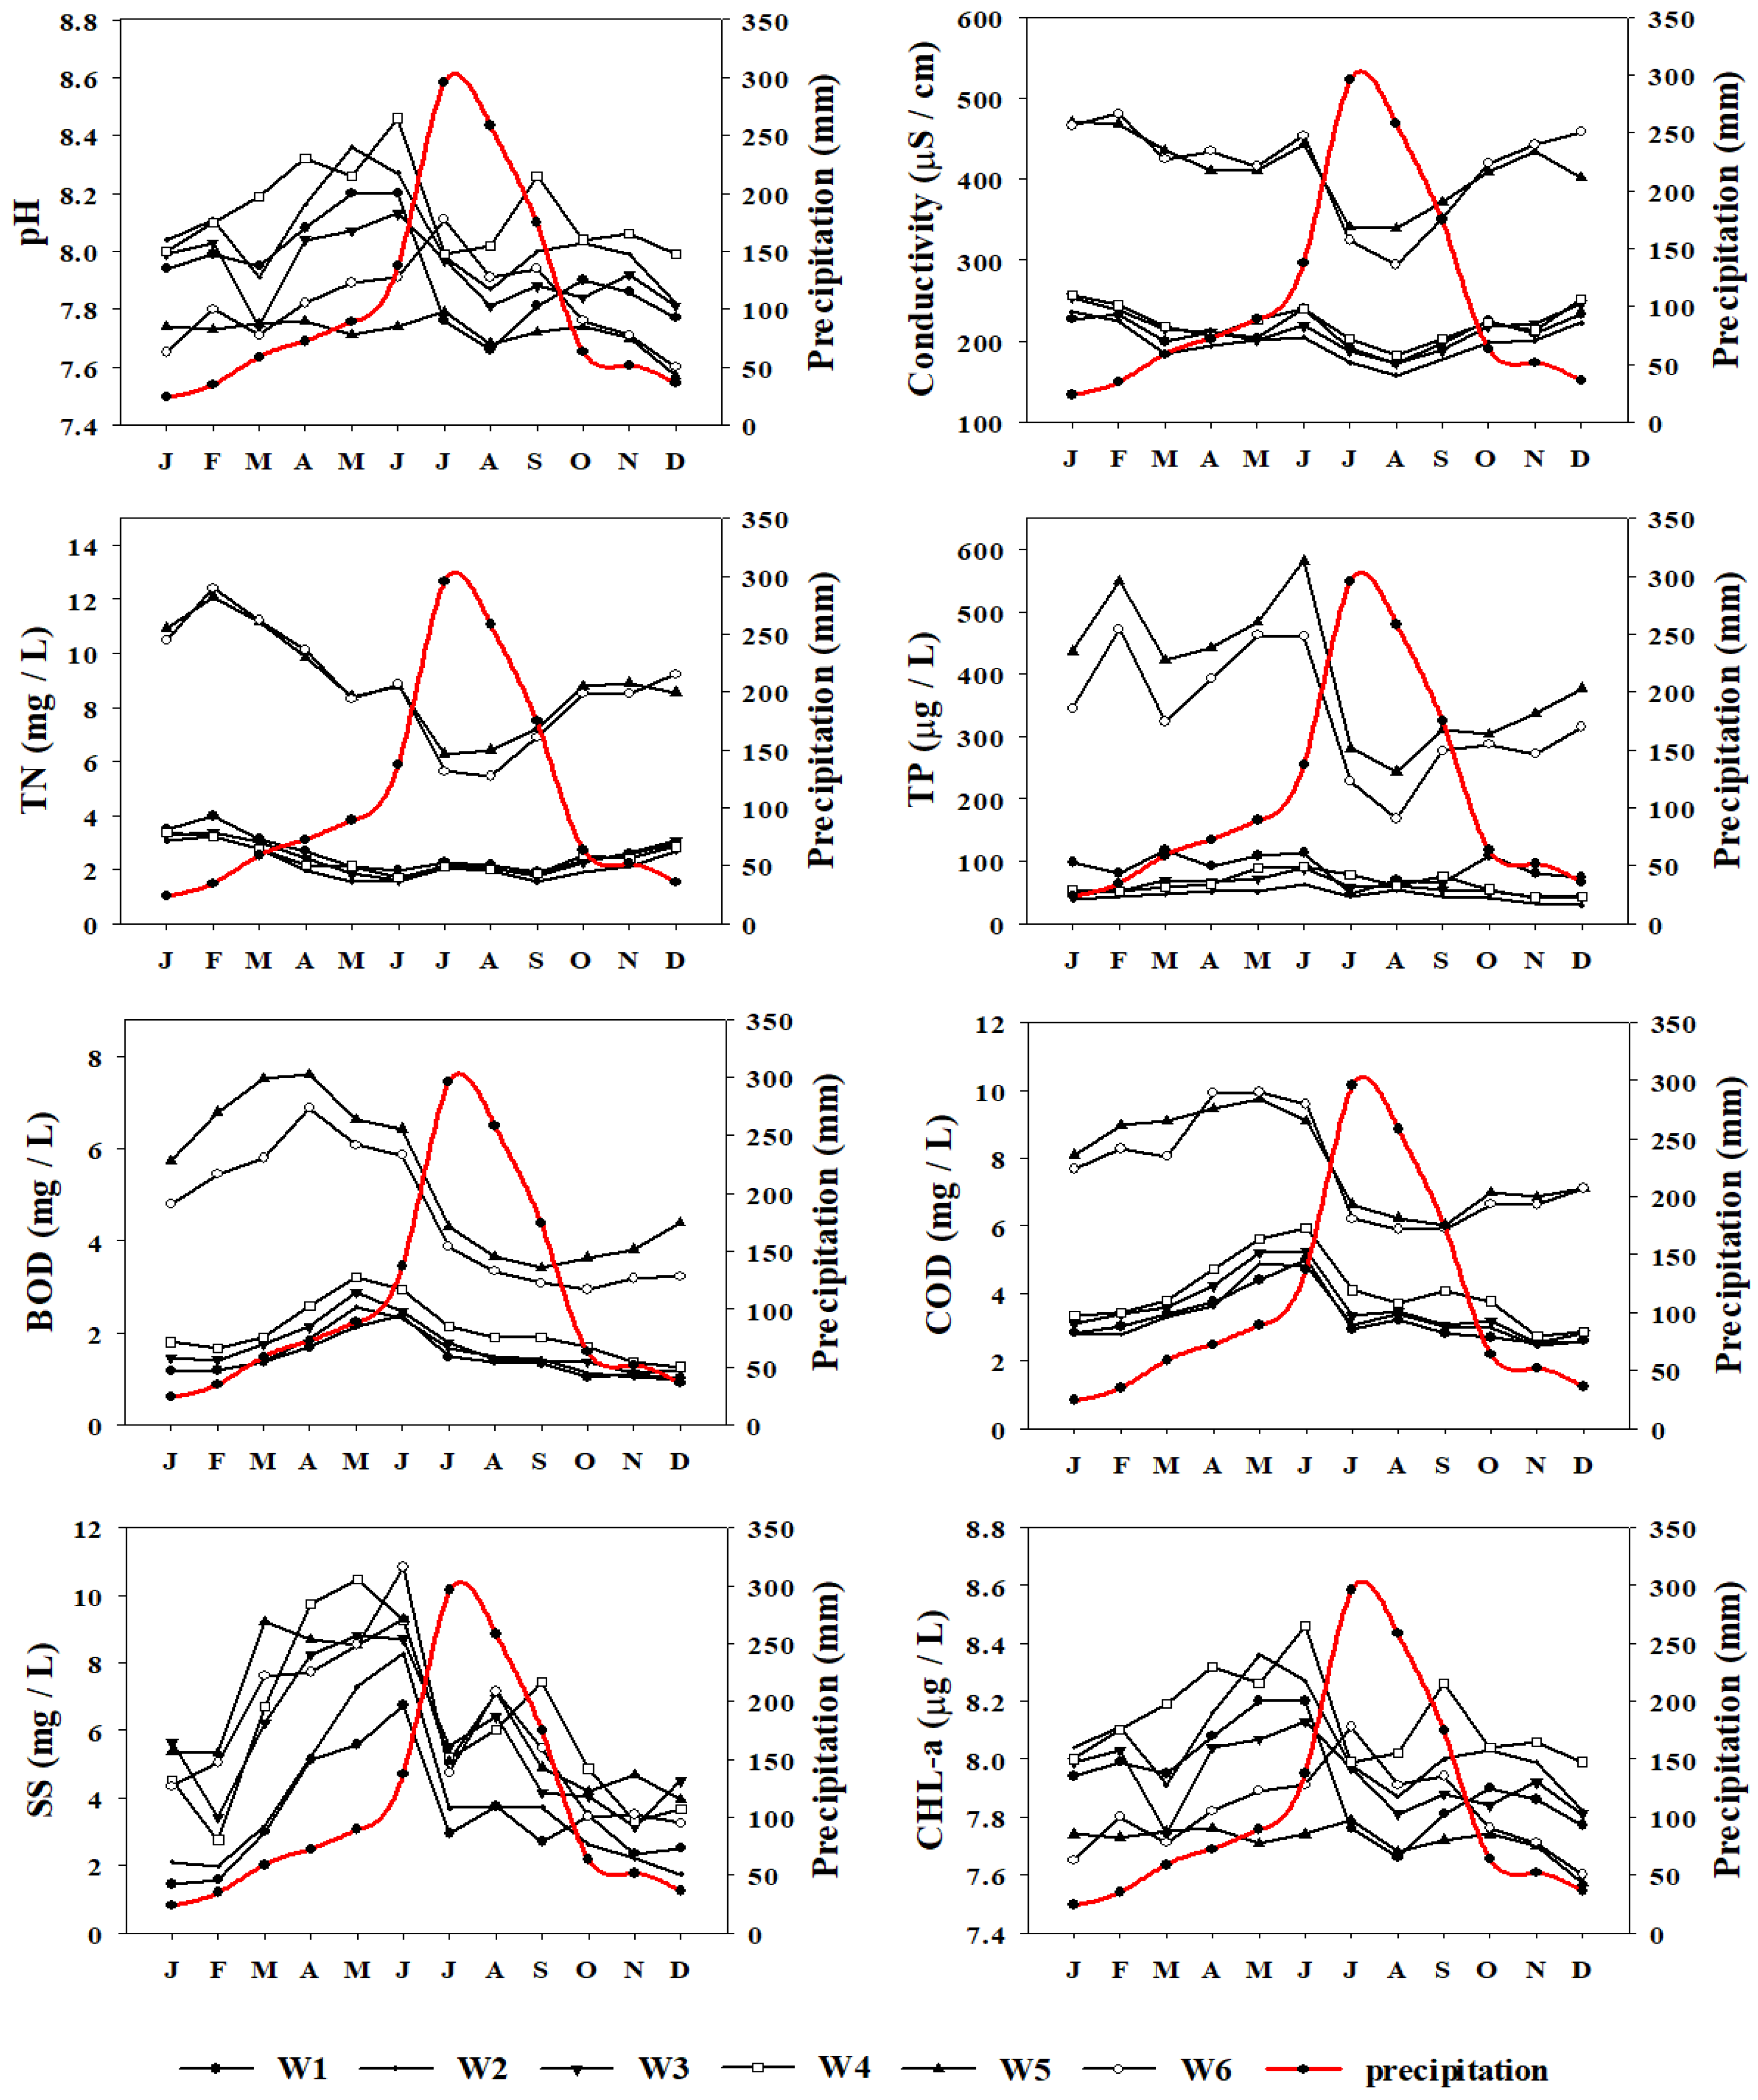
Figure 3.
Annual variation in water quality parameters in relation to annual precipitation (shown as red curve) in Gap-stream during 2007–2016 (TN = Total nitrogen, TP = Total phosphorus, BOD = Biological oxygen demand, COD = Chemical oxygen demand, SS = Suspended solids, CHL-a = Chlorophyll-a).
Figure 3.
Annual variation in water quality parameters in relation to annual precipitation (shown as red curve) in Gap-stream during 2007–2016 (TN = Total nitrogen, TP = Total phosphorus, BOD = Biological oxygen demand, COD = Chemical oxygen demand, SS = Suspended solids, CHL-a = Chlorophyll-a).
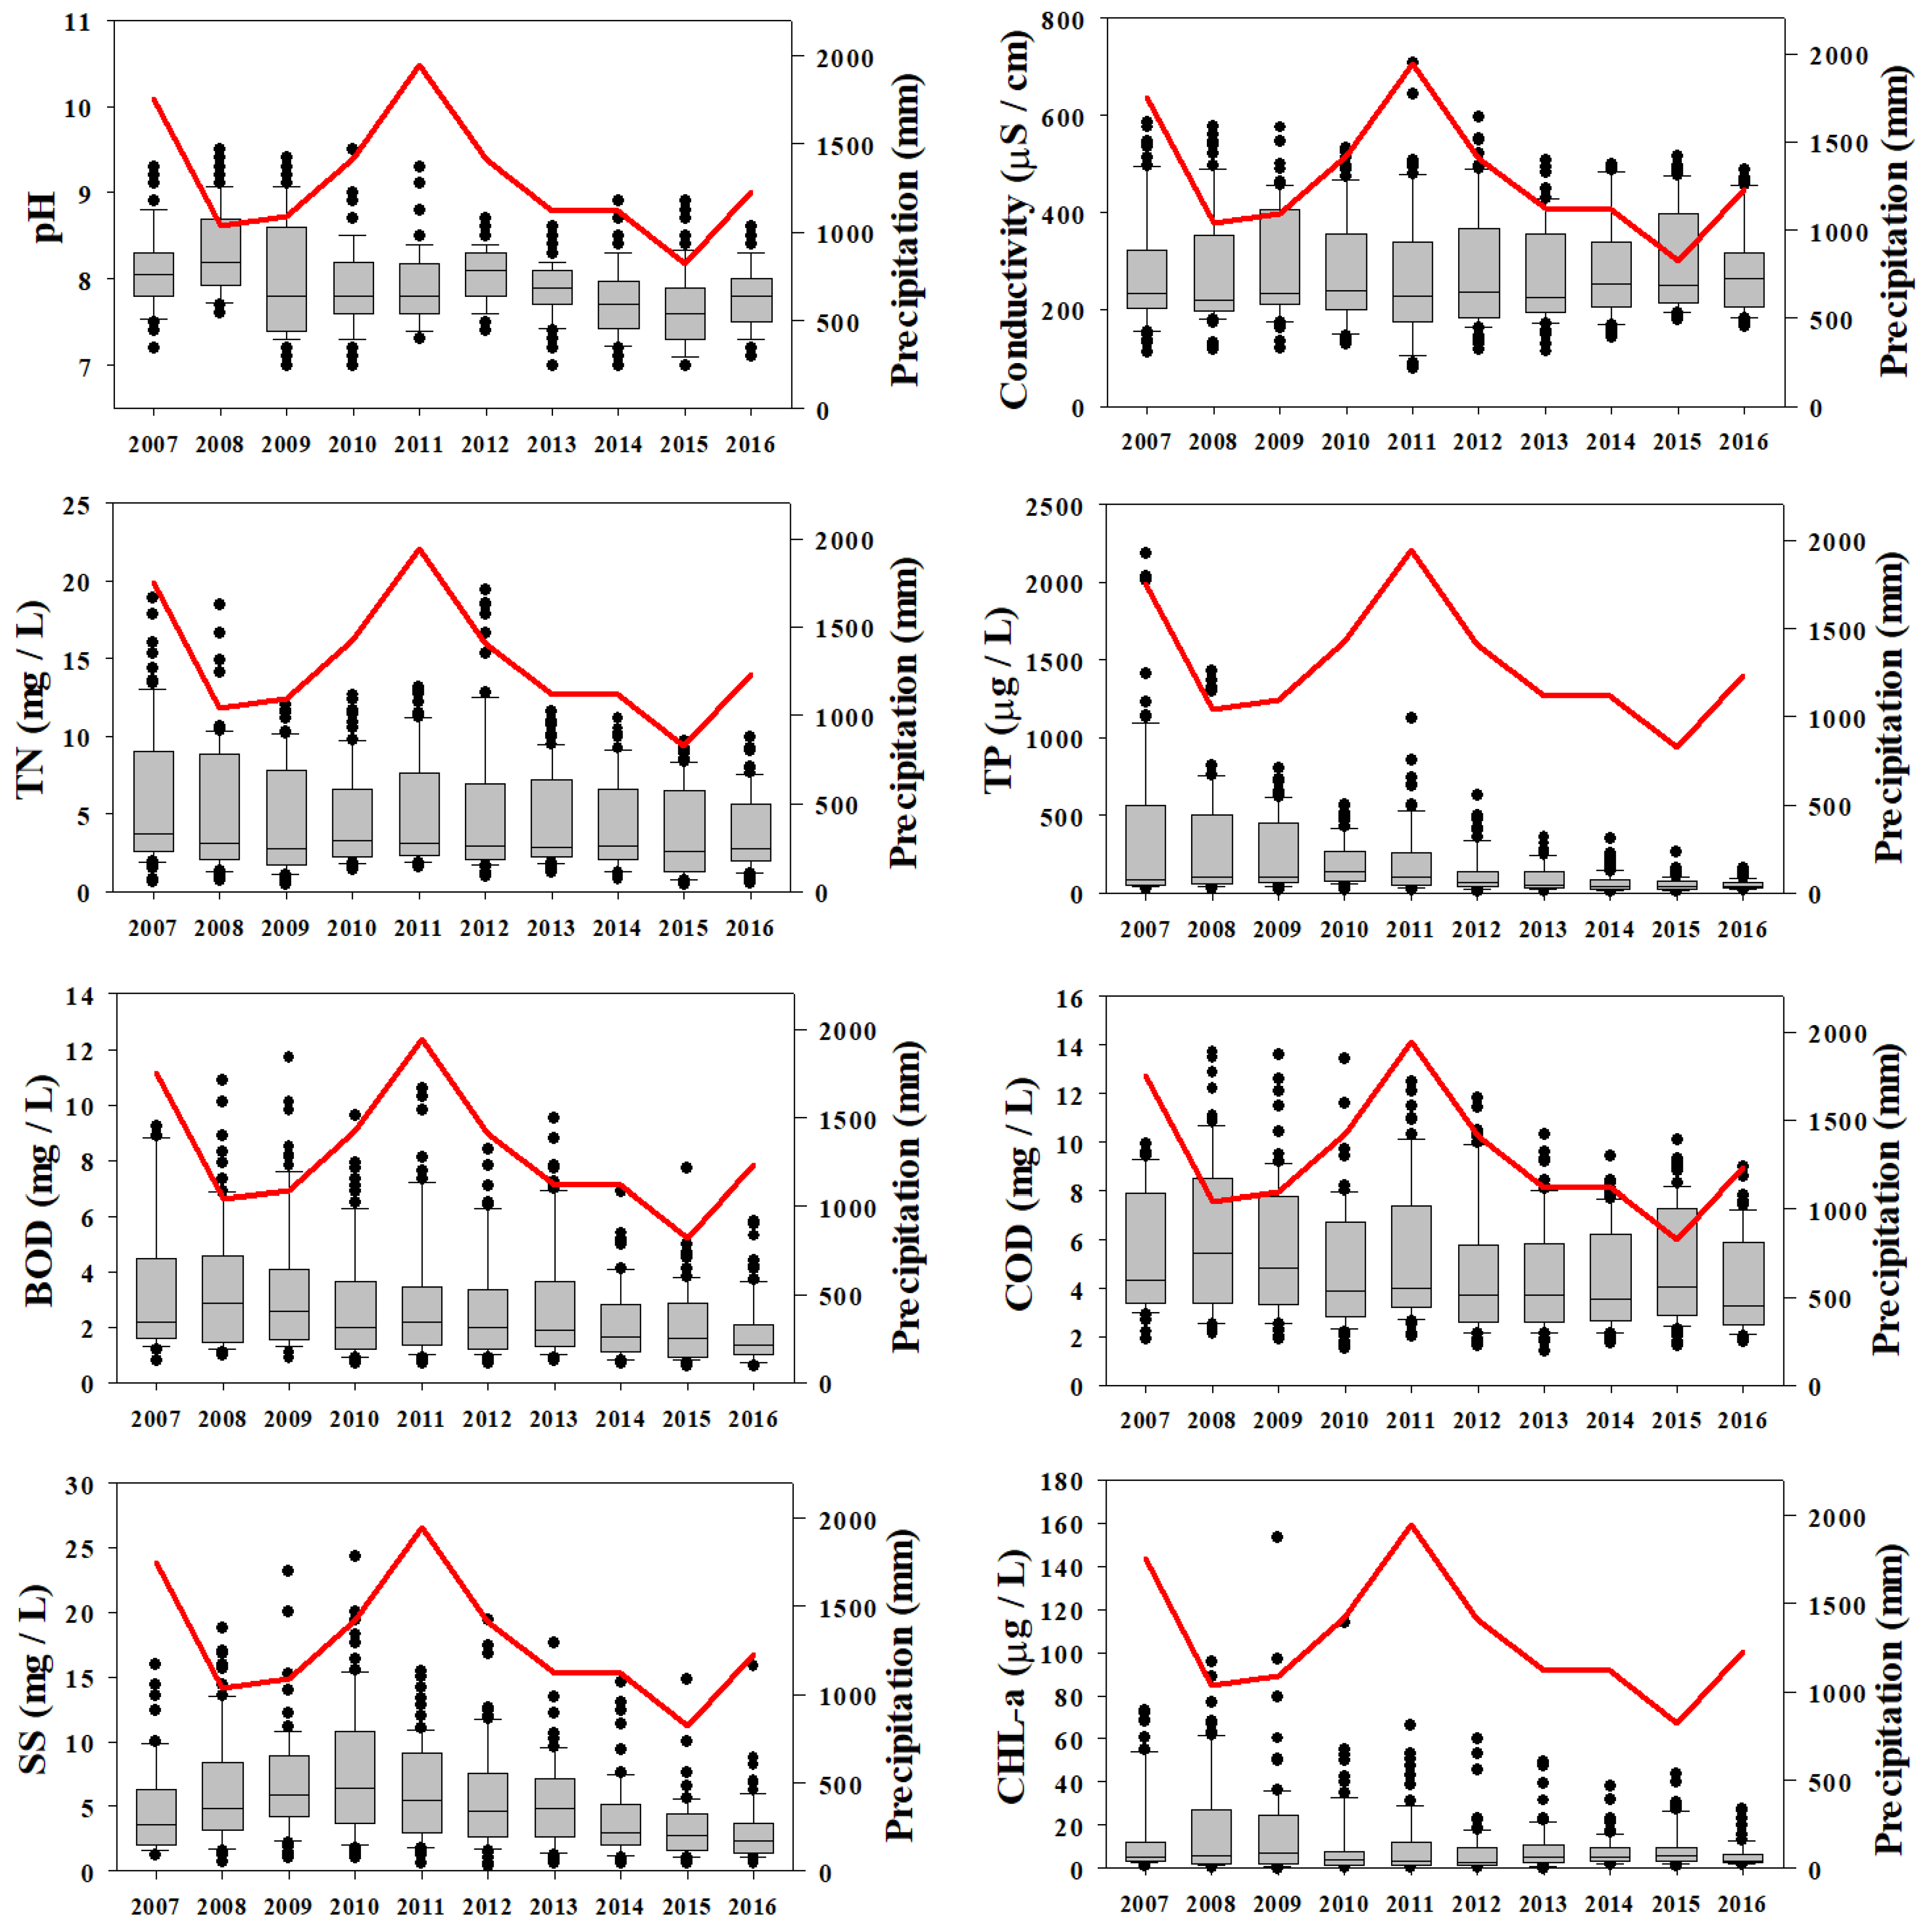
Figure 4.
Comparison of water quality parameters to estimate the effect of restoration measures in Gap-stream (BR = before restoration, 2007–2010; AR = after restoration, 2013–2016, * = p < 0.05, ** = p < 0.01).
Figure 4.
Comparison of water quality parameters to estimate the effect of restoration measures in Gap-stream (BR = before restoration, 2007–2010; AR = after restoration, 2013–2016, * = p < 0.05, ** = p < 0.01).
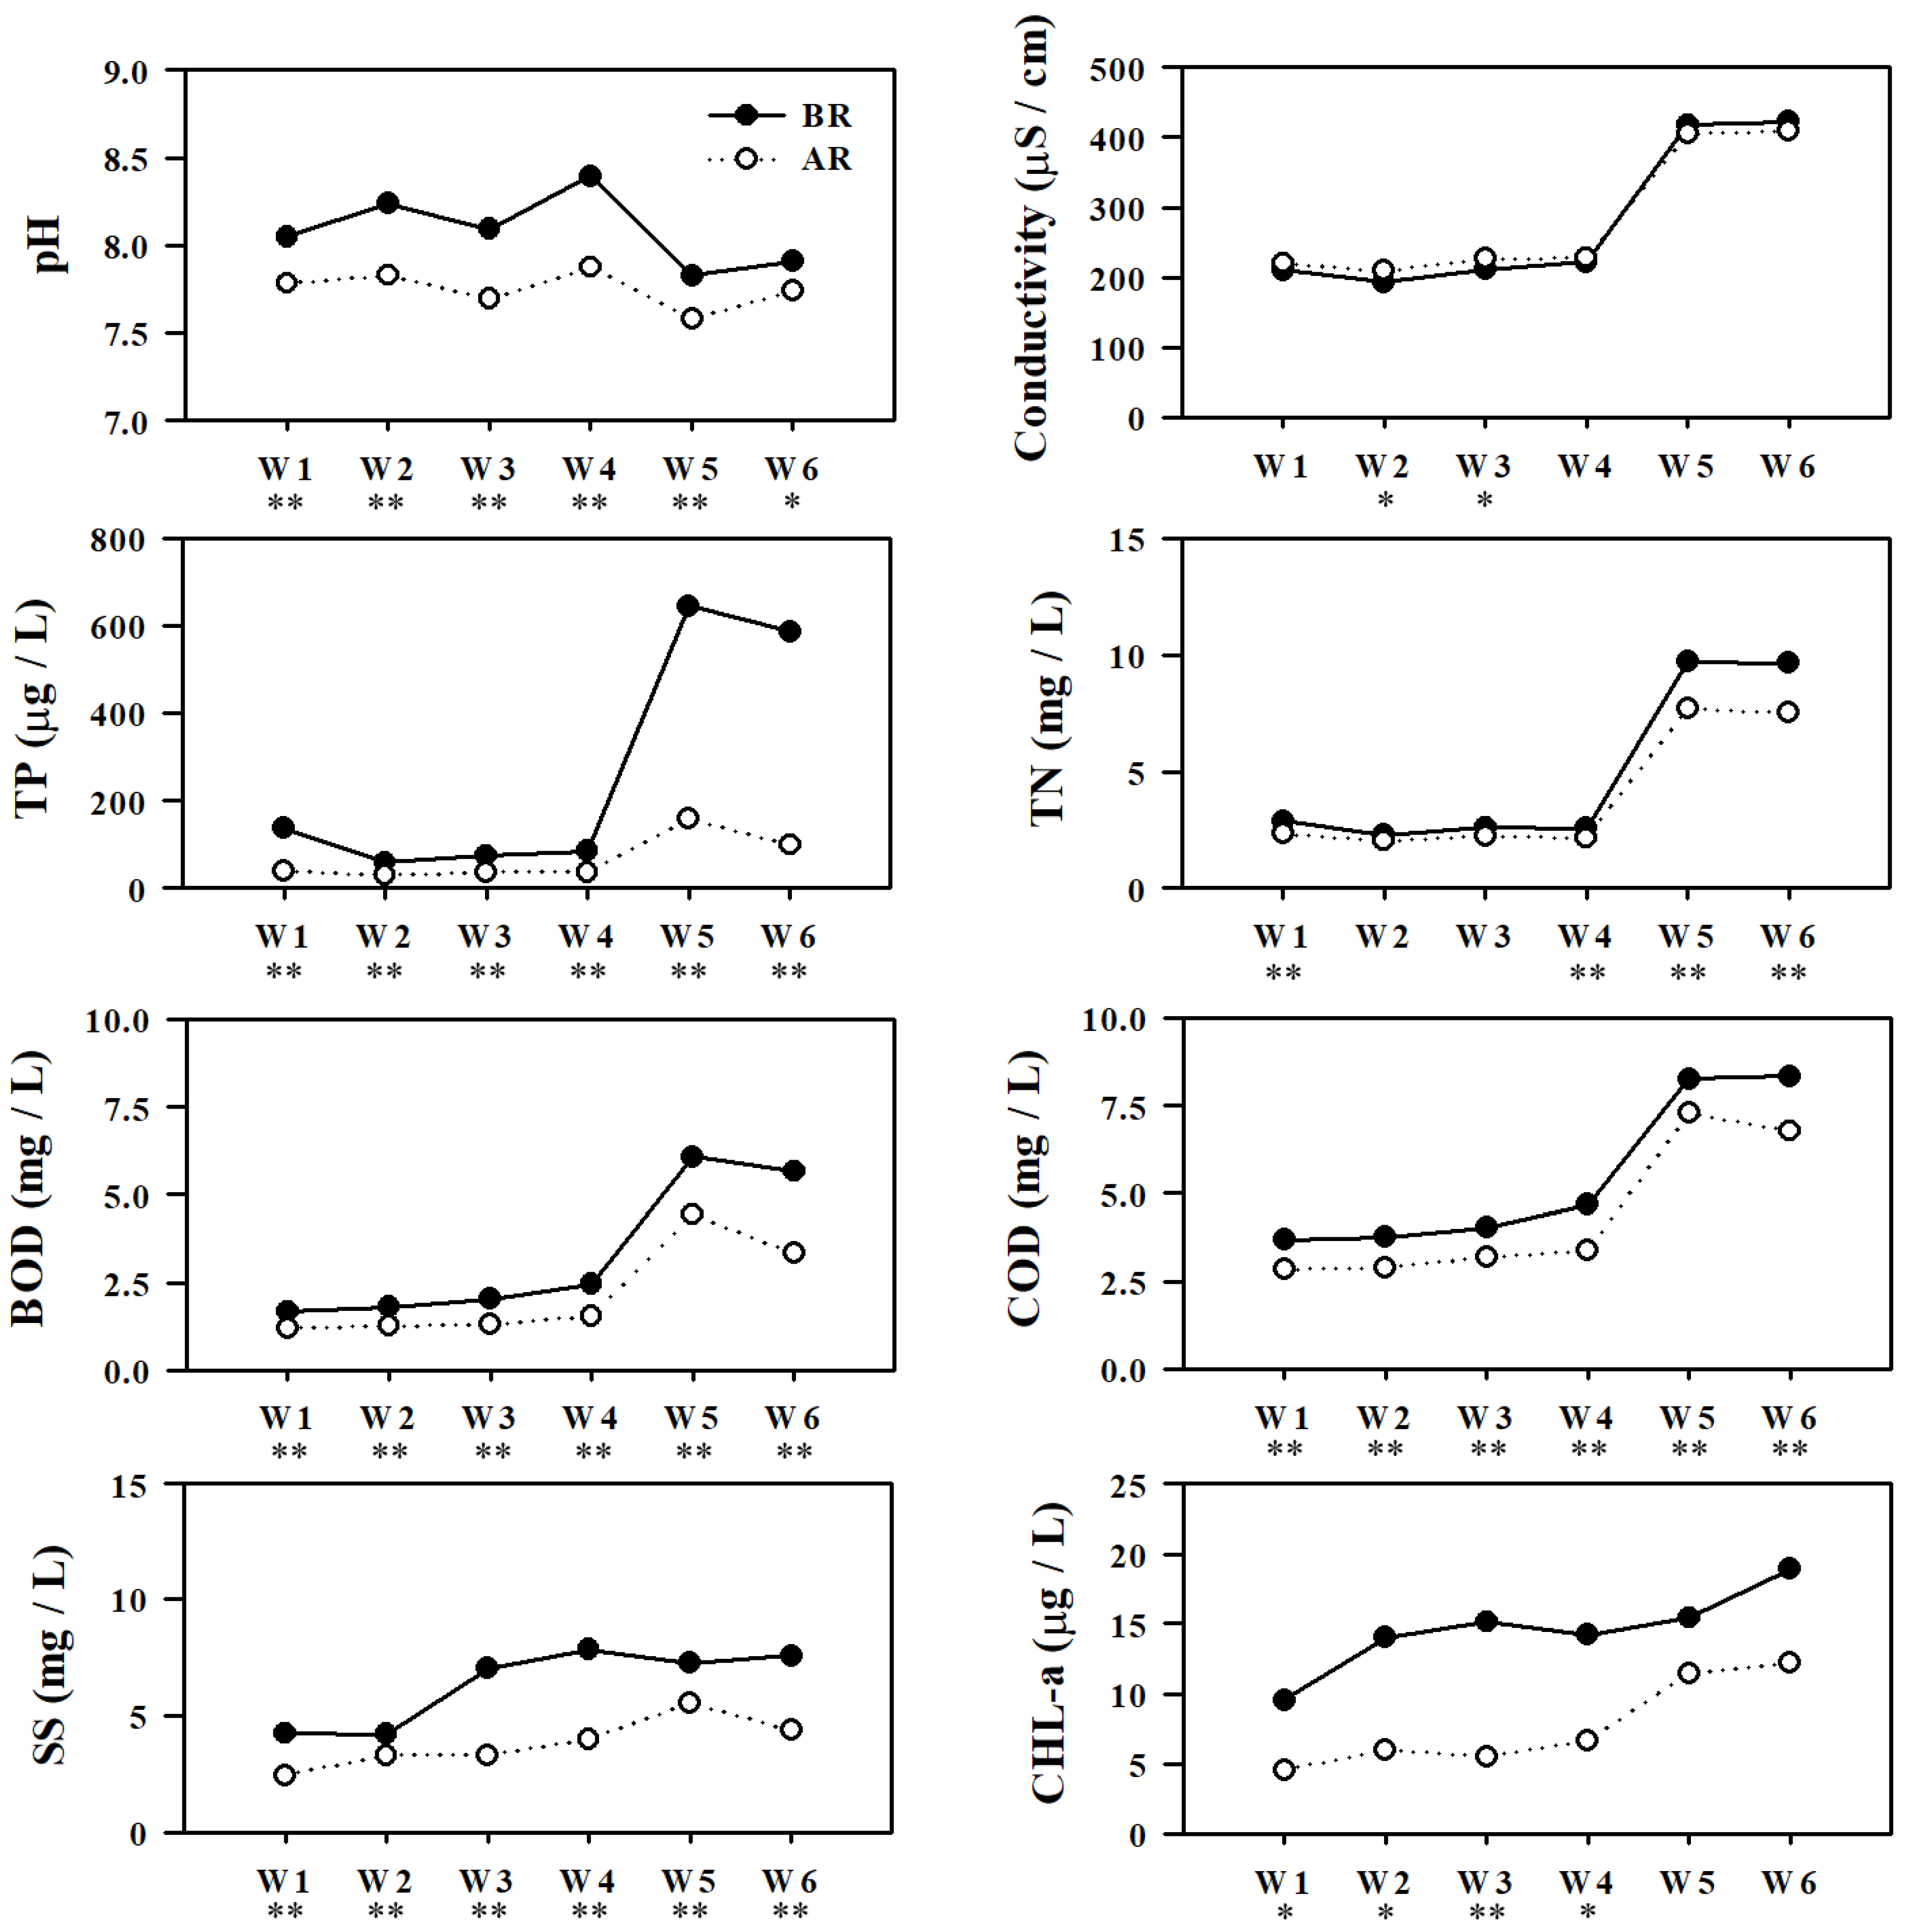
Figure 5.
Spatial variation in selected water quality parameters at each sampling site of Gap-stream because of result of restoration measures. (BR = before restoration, 2007–2010; AR = after restoration, 2013–2016, ** = p < 0.01).
Figure 5.
Spatial variation in selected water quality parameters at each sampling site of Gap-stream because of result of restoration measures. (BR = before restoration, 2007–2010; AR = after restoration, 2013–2016, ** = p < 0.01).
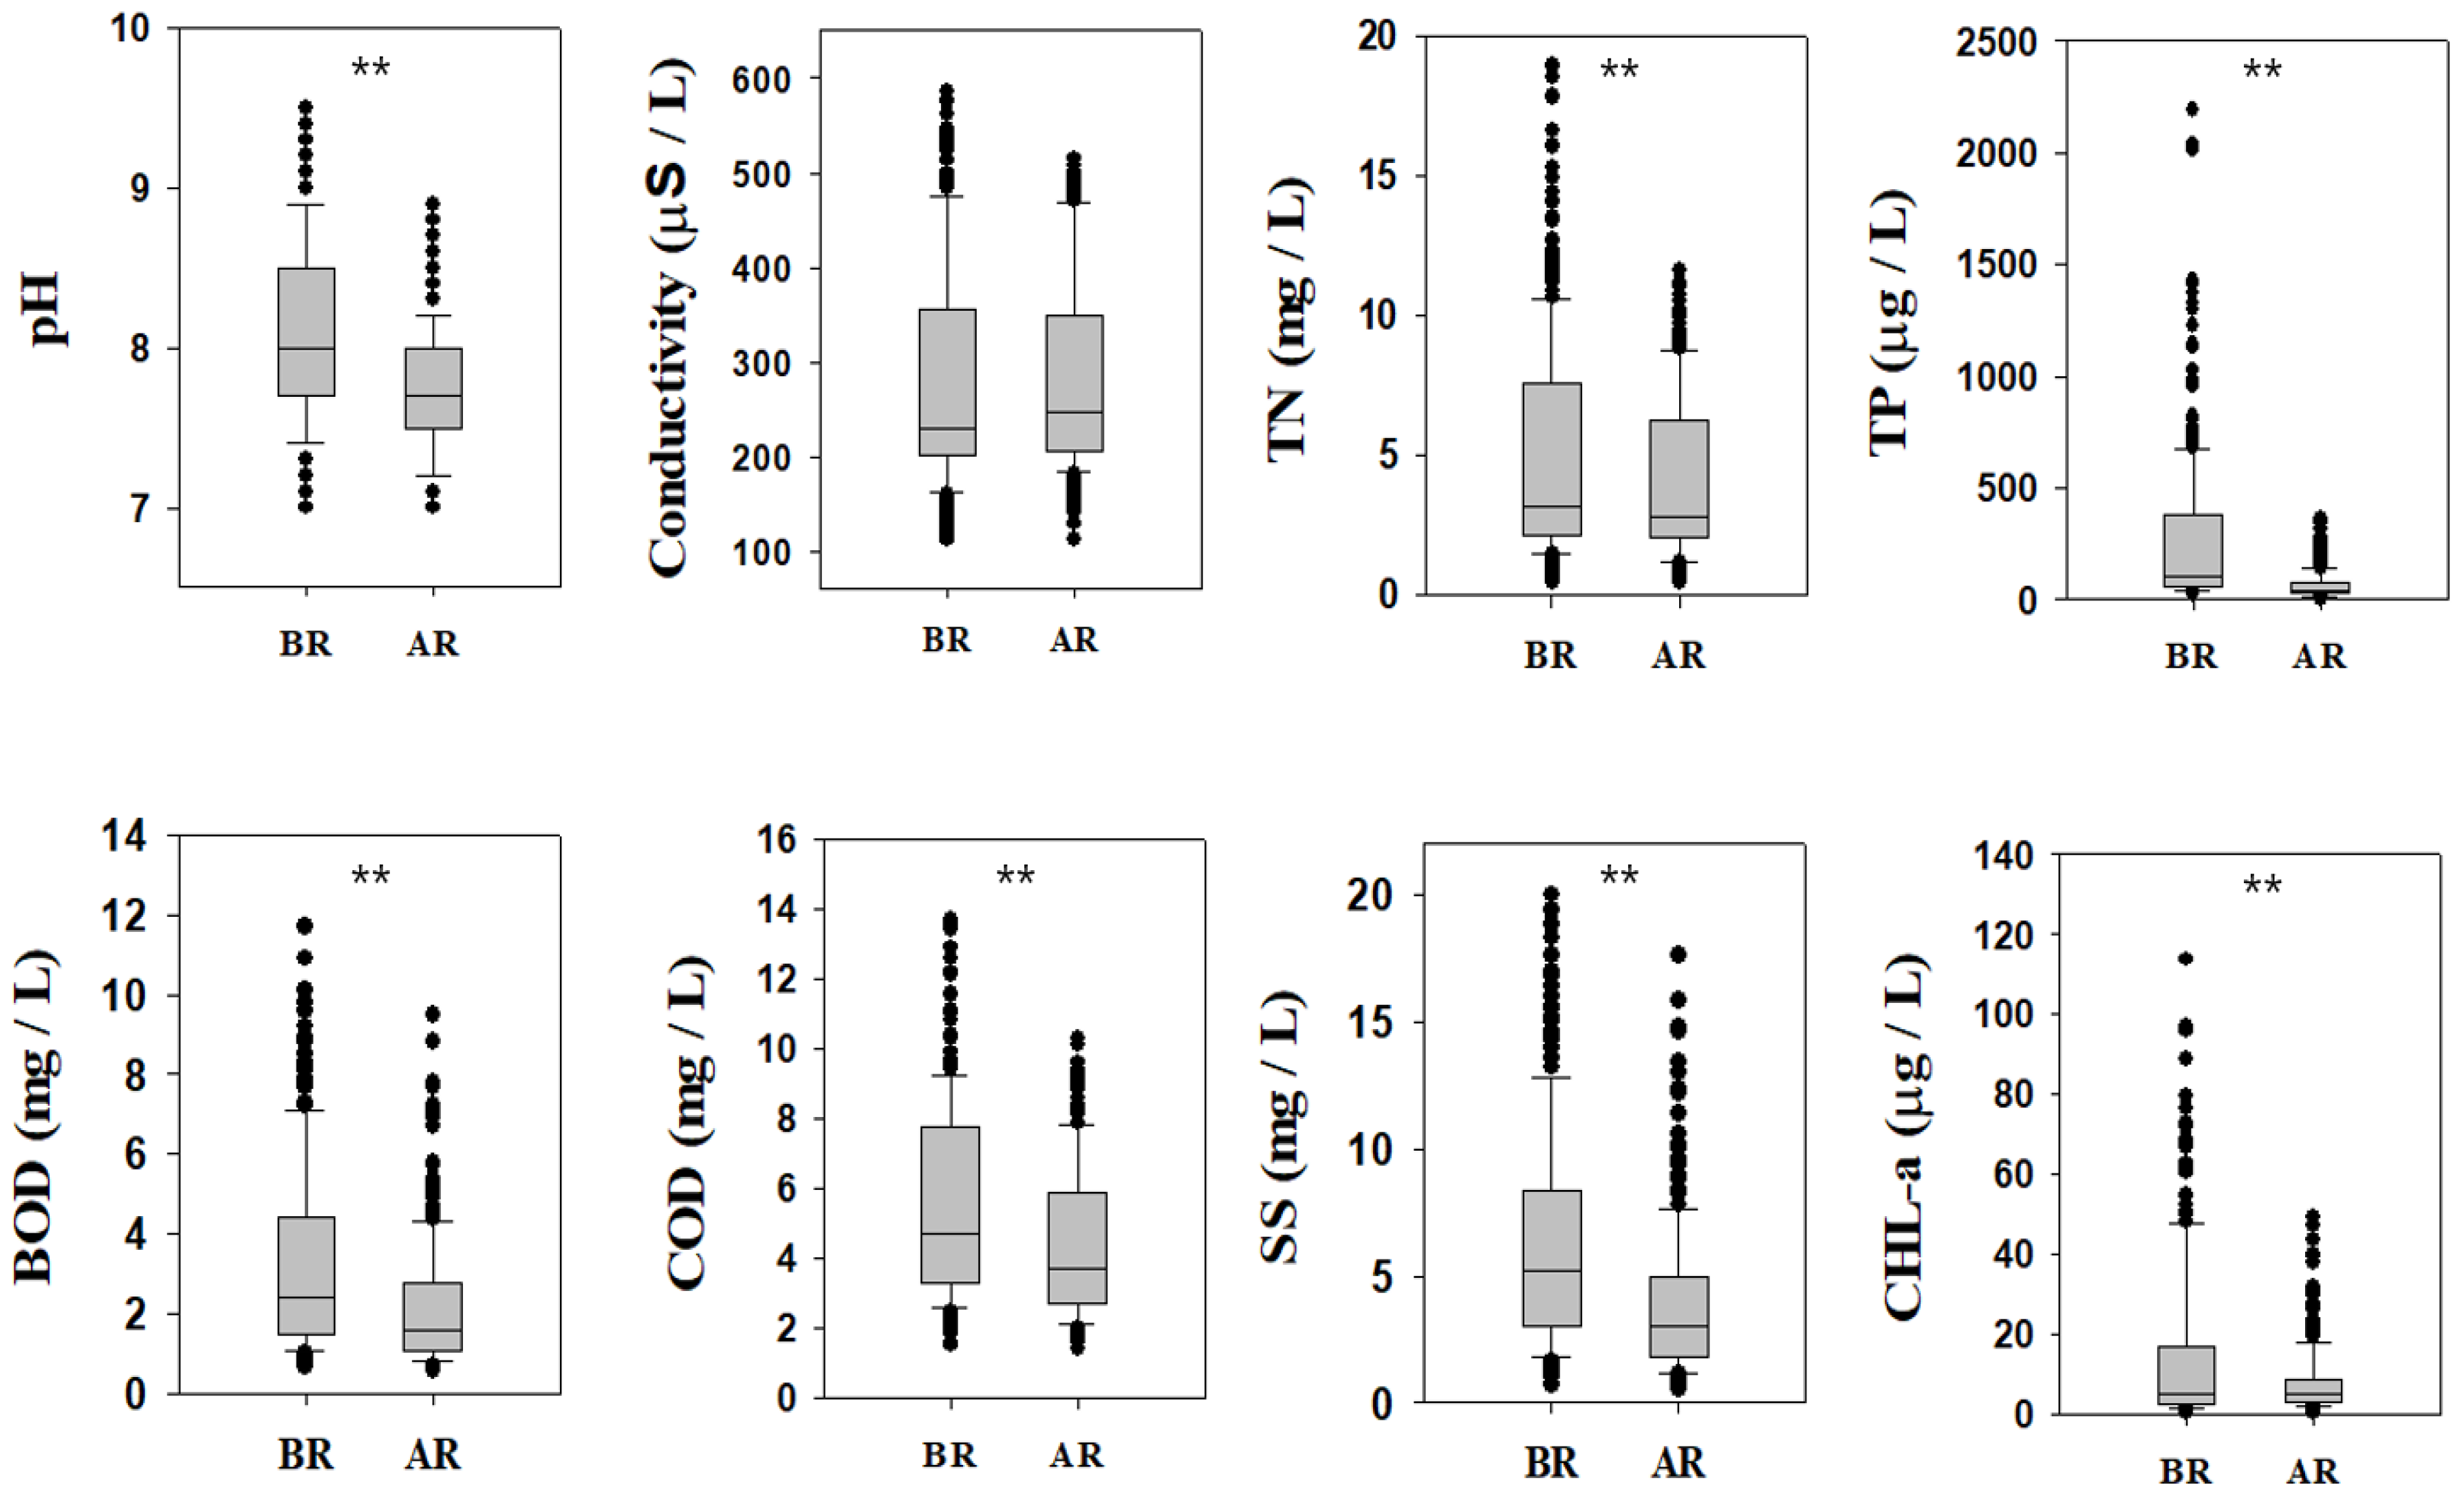
Figure 6.
Variation in different fish assemblages (trophic and tolerance guilds) as well as IBI values as ecological health parameters based on restoration measures in Gap-stream (BR = before restoration, 2007–2010; AR = after restoration, 2013–2016, ** = p < 0.01).
Figure 6.
Variation in different fish assemblages (trophic and tolerance guilds) as well as IBI values as ecological health parameters based on restoration measures in Gap-stream (BR = before restoration, 2007–2010; AR = after restoration, 2013–2016, ** = p < 0.01).

Figure 7.
Spatial variation in fish assemblages (trophic and tolerance guilds) as well as IBI values as ecological health parameters based on restoration measures in Gap-stream (BR = before restoration, 2007–2010; AR = after restoration, 2013–2016, * = p < 0.05, ** = p < 0.01).
Figure 7.
Spatial variation in fish assemblages (trophic and tolerance guilds) as well as IBI values as ecological health parameters based on restoration measures in Gap-stream (BR = before restoration, 2007–2010; AR = after restoration, 2013–2016, * = p < 0.05, ** = p < 0.01).
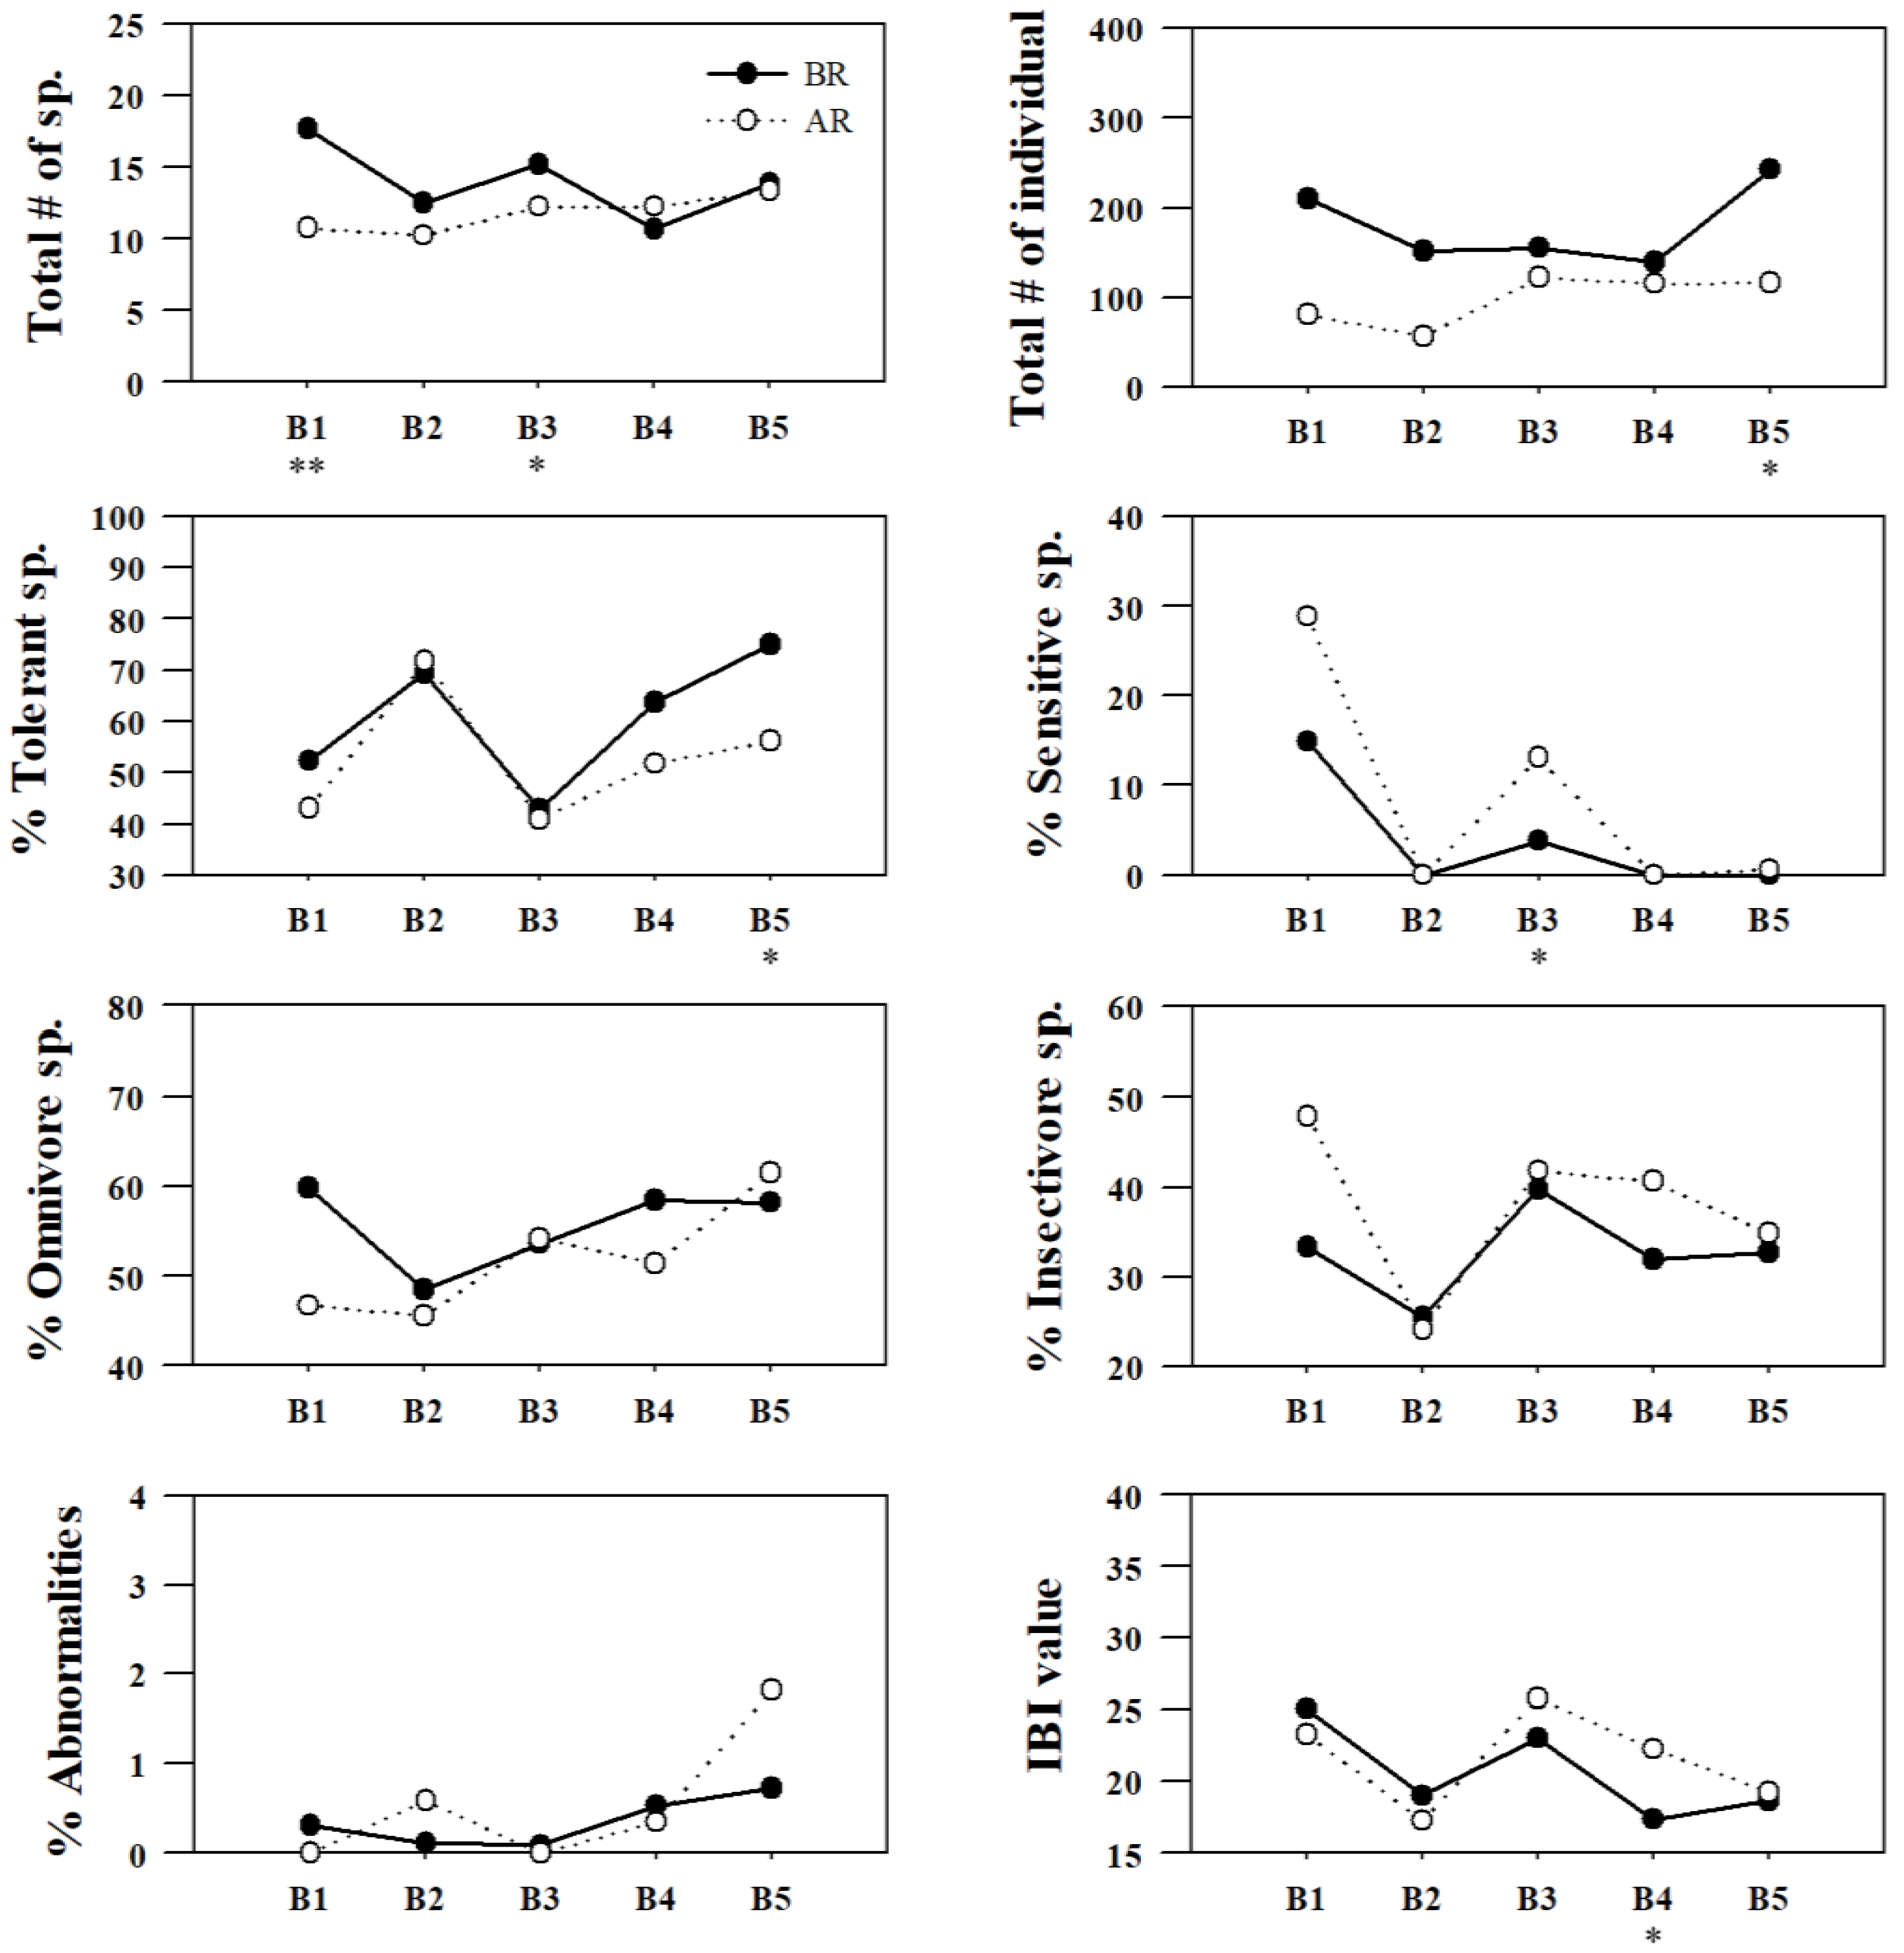
Figure 8.
PCA plot showing the settlement of water quality parameters as well as IBI, QHEI and WPI in the three main compartments of Gap Stream i.e., upstream, midstream and downstream during 2007–2016. (WT = Water temperature, EC = Electrical conductivity, DO = Dissolved oxygen, TDN = Total dissolved nitrogen, NH4-N = Ammonia nitrogen, NO3-N = Nitrate nitrogen, TN = Total nitrogen, TP = Total phosphorus, TDP = Total dissolved phosphorus, PO4-P =Phosphate phosphorus, BOD = Biological oxygen demand, COD = Chemical oxygen demand, SS = Suspended solids, CHL-a = Chlorophyll-a, WPI = Water pollution index, IBI = Index of biotic integrity, QHEI = Qualitative habitat evaluation index).


Table 1.
Geographical location coordinates of water quality monitoring and biological sampling sites in Gap Stream, South Korea.
Table 1.
Geographical location coordinates of water quality monitoring and biological sampling sites in Gap Stream, South Korea.
| Sites | Site Location | Latitude | Longitude |
|---|---|---|---|
| B1, W1 | Bonggok 2, Bonggok-dong, Seo-gu, Daejeon | 36°15′11.75″ N | 127°19′24.91″ E |
| B2, W2 | Singing bridge of Junglim-dong, Seo-gu, Daejeon | 36°18′23.67″ N | 127°21′32.29″ E |
| B3 | Wolpin Park in Gomma-dong, Seo-gu, Daejeon | 36°19′34.31″ N | 127°21′15.15″ E |
| B4, W4 | Daecheon Bridge, Samcheon-dong, Seo-gu, Daejeon | 36°22′16.24″ N | 127°22′32.09″ E |
| B5, W6 | Daejeon Metropolitan City | 36°26′48.13″ N | 127°23′23.06″ E |
| W3 | Daejeon Metropolitan City Wolpyeong-dong | 36°20′35.50″ N | 127°21′06.16″ E |
| W5 | Gapcheon Bridge in Jeonmin-dong, Yuseong-gu, Daejeon | 36°24′15.25″ N | 127°24′48.87″ E |
Table 2.
Summary statistics of water chemistry factors in Gap Stream during 2007–2016.
| Sites | Attributes | pH | DO | WT | BOD | COD | TSS | EC | TN | TP | TN:TP | TDN | NH4-N | NO3-N | TDP | PO4-P | CHL-a |
|---|---|---|---|---|---|---|---|---|---|---|---|---|---|---|---|---|---|
| W1 | Min. | 7.1 | 7.9 | 2.0 | 0.6 | 1.4 | 0.4 | 80 | 1.0 | 9.0 | 6.1 | 0.9 | 0.0 | 0.5 | 5.0 | 0.0 | 0.0 |
| Max. | 9.1 | 16.6 | 30 | 4.0 | 6.6 | 13.6 | 326 | 6.4 | 291 | 321 | 5.5 | 1.0 | 4.6 | 271 | 216 | 66 | |
| Mean | 7.9 | 11.4 | 15.5 | 1.4 | 3.3 | 3.4 | 212 | 2.6 | 87.9 | 52.9 | 2.4 | 0.1 | 1.9 | 73.5 | 50.9 | 7.3 | |
| Stand. dev. | 0.4 | 2.0 | 8.5 | 0.7 | 1.1 | 2.6 | 44 | 0.9 | 67.7 | 52.5 | 0.8 | 0.1 | 0.8 | 62.2 | 53.2 | 11.9 | |
| W2 | Min. | 7.1 | 7.2 | 0.0 | 0.6 | 1.6 | 0.6 | 78 | 0.4 | 8.0 | 7.4 | 0.3 | 0.0 | 0.1 | 3.0 | 0.0 | 0.3 |
| Max. | 9.5 | 15.6 | 30.8 | 4.1 | 8.0 | 14.6 | 298 | 5.7 | 132 | 324.5 | 4.4 | 0.3 | 3.6 | 100 | 94 | 113.7 | |
| Mean | 8.0 | 11.2 | 15 | 1.5 | 3.3 | 3.8 | 198.2 | 2.2 | 44.6 | 69.6 | 1.9 | 0.0 | 1.4 | 30.3 | 18.3 | 9.6 | |
| Stand. dev. | 0.5 | 2.2 | 9.2 | 0.7 | 1.2 | 2.8 | 39.9 | 0.9 | 23 | 62.9 | 0.9 | 0.0 | 0.8 | 20 | 18.6 | 15.9 | |
| W3 | Min. | 7.0 | 7.1 | 0.0 | 0.8 | 1.6 | 0.8 | 88 | 0.7 | 11 | 10.7 | 0.2 | 0.0 | 0.1 | 5.0 | 0.0 | 0.0 |
| Max. | 9.4 | 15.2 | 29 | 4.4 | 8.8 | 24.3 | 322 | 6.4 | 168 | 279.9 | 4.2 | 1.0 | 3.6 | 100 | 90 | 79.3 | |
| Mean | 7.9 | 10.8 | 14.4 | 1.7 | 3.6 | 5.7 | 214.6 | 2.4 | 58.6 | 58.3 | 2.1 | 0.1 | 1.6 | 36.7 | 23.7 | 9.6 | |
| Stand. dev. | 0.5 | 2.1 | 8.9 | 0.8 | 1.3 | 4.6 | 42.5 | 0.9 | 31.7 | 47.8 | 0.8 | 0.2 | 0.8 | 20.6 | 19.5 | 15.8 | |
| W4 | Min. | 7.1 | 7.4 | 1.0 | 0.8 | 2.0 | 0.8 | 104 | 0.5 | 7.0 | 7.3 | 0.4 | 0.0 | 0.0 | 2.0 | 0.0 | 0.5 |
| Max. | 9.5 | 16.5 | 31 | 5.5 | 9.7 | 19.4 | 327 | 5.2 | 235 | 356.1 | 4.2 | 1.0 | 3.5 | 230 | 211 | 95.8 | |
| Mean | 8.1 | 11.2 | 15.8 | 2.0 | 4.0 | 6.2 | 222.4 | 2.4 | 63.4 | 61.4 | 2.1 | 0.1 | 1.5 | 40.6 | 23 | 10 | |
| Stand. dev. | 0.6 | 2.2 | 9.2 | 1.0 | 1.6 | 4.6 | 44.9 | 0.9 | 42.9 | 61.9 | 0.8 | 0.2 | 0.8 | 34.7 | 29.7 | 14.6 | |
| W5 | Min. | 7.0 | 7.1 | 5.0 | 1.5 | 3.6 | 0.8 | 185 | 3.8 | 62 | 5.7 | 3.4 | 0.0 | 0.8 | 31 | 24 | 0.0 |
| Max. | 9.1 | 15.6 | 31 | 10.9 | 13.4 | 20 | 707 | 18.5 | 2188 | 103.8 | 18.3 | 15.9 | 10.3 | 1964 | 1159 | 96.8 | |
| Mean | 7.7 | 10.1 | 18.4 | 5.3 | 7.9 | 6.4 | 411.3 | 8.9 | 397.2 | 36.7 | 8.1 | 2.3 | 4.4 | 327.8 | 218.8 | 12.3 | |
| Stand. dev. | 0.4 | 1.6 | 7.7 | 2.2 | 1.9 | 3.5 | 89.6 | 2.9 | 357.3 | 24 | 2.7 | 2.7 | 1.8 | 318.7 | 206.7 | 15.9 | |
| W6 | Min. | 7.0 | 7.6 | 3.0 | 1.5 | 3.0 | 1.2 | 126 | 2.1 | 50 | 5.4 | 2.0 | 0.0 | 1.3 | 37 | 3.0 | 0.1 |
| Max. | 9.1 | 16.2 | 31.7 | 11.7 | 13.7 | 23.2 | 644 | 19.5 | 2011 | 158.3 | 18.6 | 13.7 | 10 | 1953 | 1270 | 153.4 | |
| Mean | 7.8 | 11 | 18.3 | 4.5 | 7.7 | 6.0 | 413.8 | 8.8 | 333.6 | 49.7 | 8.1 | 1.9 | 5.0 | 282.3 | 185.6 | 14.9 | |
| Stand. dev. | 0.4 | 1.6 | 8.0 | 2.2 | 2.2 | 3.9 | 100.7 | 3.2 | 336.1 | 35.8 | 3.0 | 2.7 | 1.9 | 312.8 | 216.2 | 20.3 |
Min. = Minimum, Max. Maximum, Stand. Dev. = Standard deviation, DO = Dissolved oxygen, WT = Water temperature, BOD = Biological oxygen demand, COD = Chemical oxygen demand, TSS = Total suspended solids, EC = Electrical conductivity, TN = Total nitrogen, TP = Total phosphorus, TN:TP = Ambient ratios of TN and TN, TDN = Total dissolved nitrogen, NH4-N = Ammonia nitrogen, NO3-N = Nitrate nitrogen, TDP = Total dissolved phosphorus, PO4-P =Phosphate phosphorus, CHL-a = Chlorophyll-a.
Table 3.
Annual results of water pollution index (WPI) and water quality status evaluation in Gap Stream during 2007–2016.
Table 3.
Annual results of water pollution index (WPI) and water quality status evaluation in Gap Stream during 2007–2016.
| Category | Metrics (M) | Mean and Stand. Deviation (Obtained Metric Score) | |||||||||
|---|---|---|---|---|---|---|---|---|---|---|---|
| 2007 | 2008 | 2009 | 2010 | 2011 | 2012 | 2013 | 2014 | 2015 | 2016 | ||
| Nutrient Regime | M1: Total Nitrogen (mg/L) | 5.75 ± 4.52 | 3.78 ± 3.21 | 2.88 ± 2.62 | 3.74 ± 2.23 | 3.77 ± 2.98 | 3.90 ± 4.19 | 3.50 ± 2.25 | 3.15 ± 1.91 | 2.80 ± 2.40 | 2.79 ± 1.63 |
| (1) | (1) | (3) | (1) | (1) | (1) | (1) | (1) | (3) | (3) | ||
| M2: Total Phosphorus (µg/L) | 356.2 ± 505 | 242 ± 313 | 182 ± 164 | 117 ± 63.1 | 131.2 ± 86.8 | 100 ± 82.1 | 69.6 ± 41.5 | 59.4 ± 29.8 | 45.9 ± 22.1 | 41.5 ± 19.1 | |
| (1) | (1) | (1) | (1) | (1) | (3) | (3) | (3) | (3) | (3) | ||
| M3: TN:TP ratio | 40.15 ± 35.5 | 32.2 ± 18.5 | 37.2 ± 15.9 | 44.1 ± 14.8 | 48.6 ± 24.5 | 39.4 ± 26.1 | 39.2 ± 31.1 | 37.8 ± 22.2 | 48.2 ± 22.5 | 47.2 ± 24.6 | |
| (3) | (3) | (3) | (3) | (3) | (3) | (3) | (3) | (3) | (3) | ||
| Organic Matter | M4: Biological Oxygen Demand (mg/L) | 5.35 ± 2.4 | 3.46 ± 1.83 | 3.68 ± 2.15 | 1.98 ± 1.42 | 2.83 ± 1.91 | 2.85 ± 1.33 | 2.46 ± 1.51 | 1.87 ± 0.74 | 1.89 ± 0.77 | 0.78 ± 0.99 |
| (1) | (1) | (1) | (3) | (1) | (1) | (3) | (5) | (3) | (5) | ||
| Ionic Contents & Solids | M5: Total Suspended Solids (mg/L) | 4.8 ± 3.5 | 8.21 ± 3.15 | 7.31 ± 2.54 | 8.17 ± 4.03 | 6.93 ± 2.53 | 7.31 ± 2.20 | 5.61 ± 2.50 | 5.60 ± 1.26 | 3.31 ± 0.87 | 3.36 ± 1.46 |
| (3) | (3) | (3) | (3) | (3) | (3) | (3) | (3) | (5) | (5) | ||
| M6: Electrical Conductivity (µS/cm) | 279 ± 127 | 242 ± 109 | 232.8 ± 79.2 | 208.9 ± 70.9 | 245.6 ± 110 | 236.9 ± 83.8 | 226.7 ± 72.3 | 247.9 ± 76.6 | 268.7 ± 88.7 | 242.8 ± 68.4 | |
| (3) | (3) | (3) | (3) | (3) | (3) | (3) | (3) | (3) | (3) | ||
| Primary Production | M7: Sestonic Chlorophyll-a (µg/L) | 13.42 ± 19.3 | 30.2 ± 16.2 | 26.1 ± 12.8 | 4.88 ± 4.14 | 16.7 ± 8.48 | 12.7 ± 6.74 | 11.2 ± 5.47 | 9.08 ± 3.70 | 9.87 ± 7.3 | 6.22 ± 5.53 |
| (1) | (1) | (1) | (3) | (1) | (1) | (1) | (3) | (3) | (3) | ||
| Final Scores of WPI Water Quality Criteria | 13 | 13 | 15 | 17 | 13 | 16 | 16 | 21 | 23 | 25 | |
| Poor | Poor | Poor | Poor | Poor | Poor | Poor | Fair | Fair | Good | ||
Table 4.
Annual results of qualitative habitat evaluation index (QHEI) and habit status evaluation in Gap Stream during 2007–2016.
Table 4.
Annual results of qualitative habitat evaluation index (QHEI) and habit status evaluation in Gap Stream during 2007–2016.
| Model Metrics (M) | Mean and Stand. Deviation | |||||||||
|---|---|---|---|---|---|---|---|---|---|---|
| 2007 | 2008 | 2009 | 2010 | 2011 | 2012 | 2013 | 2014 | 2015 | 2016 | |
| M1: Epifaunal substrate, available cover | 13.3 ± 4 | 13.4 ± 4.1 | 13.4 ± 4.5 | 13.4 ± 4.5 | 13.1 ± 4.3 | 13.4 ± 4.5 | 13.4 ± 4.5 | 13.6 ± 4.6 | 13.6 ± 4.6 | 13.6 ± 4.6 |
| M2: Embeddedness/pool substrate characterization | 15.1 ± 3.7 | 15.0 ± 3.9 | 16.2 ± 3.2 | 15.2 ± 4.1 | 15.2 ± 3.7 | 15.8 ± 3.5 | 15.8 ± 3.5 | 15.8 ± 3.5 | 15.6 ± 3.3 | 15.8 ± 3.5 |
| M3: Velocity, depth combination/pool variability | 16.1 ± 2.5 | 16.4 ± 2.4 | 16.8 ± 2.5 | 16.8 ± 2.5 | 16.8 ± 2.5 | 16.8 ± 2.5 | 16.8 ± 2.5 | 16.8 ± 2.5 | 16.8 ± 2.5 | 16.8 ± 2.5 |
| M4: Sediment deposition | 18.2 ± 2.6 | 18.4 ± 2.8 | 17.1 ± 2.7 | 17.6 ± 2.8 | 16.7 ± 3.1 | 18.4 ± 2.8 | 18.4 ± 2.8 | 18.2 ± 2.9 | 17.1 ± 3.1 | 18.2 ± 2.9 |
| M5: Channel flow status | 16.4 ± 2.9 | 17.4 ± 2.7 | 16.7 ± 2.4 | 17.3 ± 2.7 | 17.2 ± 2.9 | 17.4 ± 2.5 | 17.6 ± 2.6 | 17.6 ± 2.6 | 16.7 ± 3.3 | 17.4 ± 2.7 |
| M6: Channel alteration | 10.5 ± 6.2 | 10.8 ± 6.1 | 10.8 ± 6.1 | 10.8 ± 6.1 | 10.3 ± 6.0 | 10.8 ± 6.1 | 10.8 ± 6.1 | 10.8 ± 6.1 | 10.8 ± 6.1 | 10.8 ± 6.1 |
| M7: Frequency of riffles or bends/channel sinuosity | 9.1 ± 5.5 | 9.2 ± 5.6 | 9.2 ± 5.6 | 9.2 ± 5.6 | 9.2 ± 5.6 | 9.2 ± 5.6 | 9.2 ± 5.6 | 9.2 ± 5.6 | 9.2 ± 5.6 | 9.2 ± 5.6 |
| M8: Bank stability | 10.4 ± 5.9 | 10.4 ± 5.9 | 10.4 ± 5.9 | 10.4 ± 5.9 | 10.2 ± 5.7 | 10.0 ± 5.5 | 10.2 ± 5.7 | 10.4 ± 5.9 | 10.6 ± 6.1 | 10.8 ± 6.3 |
| M9: Bank vegetative protection | 10.1 ± 7.4 | 10.0 ± 7.5 | 10.2 ± 7.3 | 10.0 ± 7.5 | 10.6 ± 6.6 | 10.8 ± 6.8 | 10.8 ± 6.8 | 11.0 ± 6.6 | 11.0 ± 6.6 | 10.8 ± 6.8 |
| M10: Riparian vegetative zone width | 11.8 ± 5.7 | 11.8 ± 5.7 | 11.8 ± 5.7 | 11.8 ± 5.7 | 11.8 ± 5.7 | 11.8 ± 5.7 | 11.8 ± 5.7 | 11.8 ± 5.7 | 11.8 ± 5.7 | 11.8 ± 5.7 |
| M11: Small scale weir construction | 11.0 ± 5.6 | 11.0 ± 5.6 | 11.3 ± 5.4 | 12.0 ± 4.4 | 11.2 ± 4.0 | 12.0 ± 4.4 | 12.0 ± 4.4 | 12.4 ± 4.6 | 12.4 ± 4.6 | 12.4 ± 4.6 |
| QHEI Score | 142 ± 42.5 | 143.8 ± 43.7 | 143.9 ± 42.4 | 144.5 ± 41.8 | 142.3 ± 38.5 | 146.4 ± 41.4 | 146.8 ± 41.5 | 147.6 ± 41.8 | 145.6 ± 39.8 | 147.6 ± 42.3 |
| QHEI Criteria | Good | Good | Good | Good | Good | Good | Good | Good | Good | Good |
Table 5.
Spatial distribution of fish species sampled from Gap Stream and their difference before and after restoration.
Table 5.
Spatial distribution of fish species sampled from Gap Stream and their difference before and after restoration.
| Fish Species | Fish Guilds | Before Restoration (BR) | After Restoration (AR) | TNI | RA (%) | ||||||||||||||
|---|---|---|---|---|---|---|---|---|---|---|---|---|---|---|---|---|---|---|---|
| TO | TR | HA | B1 | B2 | B3 | B4 | B5 | TNI | RA (%) | B1 | B2 | B3 | B4 | B5 | TNI | RA (%) | |||
| Zacco platypus | 221 | 69 | 93 | 116 | 184 | 683 | 37.6 | 55 | 26 | 78 | 69 | 53 | 281 | 27.7 | 482 | 33.7 | |||
| Pseudogobio esocinus | IS | I | - | 4 | 30 | 49 | 12 | 25 | 120 | 6.6 | 4 | 7 | 11 | 18 | 38 | 78 | 7.7 | 99 | 6.9 |
| Carassius auratus | TS | O | - | 4 | 38 | 6 | 34 | 50 | 132 | 7.3 | 6 | 8 | 1 | 23 | 19 | 57 | 5.6 | 94.5 | 6.6 |
| Acheilognathus lanceolatus | IS | O | - | 20 | 16 | 29 | 28 | 19 | 112 | 6.2 | 8 | 5 | 15 | 17 | 23 | 68 | 6.7 | 90 | 6.3 |
| Hemibarbus labeo | TS | I | - | 13 | 14 | 17 | 73 | 117 | 6.4 | 9 | 3 | 22 | 26 | 60 | 5.9 | 88.5 | 6.2 | ||
| Opsarichthys uncirostris amurensis | TS | C | - | 1 | 40 | 12 | 17 | 42 | 112 | 6.2 | 4 | 9 | 5 | 6 | 1 | 25 | 2.5 | 68.5 | 4.8 |
| Rhinogobius brunneus | IS | I | RB | 9 | 6 | 10 | 3 | 3 | 31 | 1.7 | 7 | 2 | 39 | 13 | 6 | 67 | 6.6 | 49 | 3.4 |
| Zacco koreanus | SS | I | - | 48 | 1 | 49 | 2.7 | 40 | 40 | 3.9 | 44.5 | 3.1 | |||||||
| Pungtungia herzi | IS | I | - | 10 | 1 | 7 | 4 | 3 | 25 | 1.4 | 12 | 3 | 10 | 17 | 3 | 45 | 4.4 | 35 | 2.4 |
| Microphysogobio yaluensis | IS | O | RB | 7 | 13 | 1 | 2 | 23 | 1.3 | 3 | 22 | 4 | 7 | 36 | 3.6 | 29.5 | 2.1 | ||
| Hemibarbus lon girostris | IS | I | - | 6 | 6 | 11 | 10 | 6 | 39 | 2.1 | 2 | 1 | 3 | 9 | 4 | 19 | 1.9 | 29 | 2.0 |
| Coreoleuciscus splendidus | SS | I | RB | 6 | 7 | 13 | 0.7 | 2 | 37 | 1 | 40 | 3.9 | 26.5 | 1.9 | |||||
| Micropterus salmoides | TS | C | - | 4 | 26 | 5 | 1 | 1 | 37 | 2.0 | 1 | 6 | 2 | 3 | 2 | 14 | 1.4 | 25.5 | 1.8 |
| Pseudorasbora parva | TS | O | - | 3 | 11 | 14 | 28 | 1.5 | 1 | 1 | 1 | 17 | 20 | 2.0 | 24 | 1.7 | |||
| Acanthorhodeus macropterus | IS | O | - | 1 | 1 | 2 | 23 | 27 | 1.5 | 1 | 1 | 1 | 10 | 3 | 16 | 1.6 | 21.5 | 1.5 | |
| Acanthorhodeus gracilis | IS | O | - | 1 | 20 | 4 | 3 | 28 | 1.5 | 1 | 1 | 8 | 1 | 11 | 1.1 | 19.5 | 1.4 | ||
| Odontobutis interrupta | IS | C | - | 6 | 10 | 4 | 1 | 4 | 25 | 1.4 | 3 | 5 | 1 | 1 | 2 | 12 | 1.2 | 18.5 | 1.3 |
| Misgurnus anguillicaudatus | TS | O | - | 2 | 19 | 1 | 1 | 1 | 24 | 1.3 | 1 | 5 | 6 | 0.6 | 15 | 1.0 | |||
| Gnathopogon strigatus | IS | I | - | 5 | 2 | 3 | 2 | 5 | 17 | 0.9 | 2 | 11 | 13 | 1.3 | 15 | 1.0 | |||
| Acheilognathus rhombeus | IS | O | - | 1 | 6 | 1 | 1 | 9 | 0.5 | 2 | 10 | 3 | 5 | 20 | 2.0 | 14.5 | 1.0 | ||
| Squalidus gracilis majimae | IS | I | - | 23 | 23 | 1.3 | 3 | 3 | 0.3 | 13 | 0.9 | ||||||||
| Iksookimia koreensis | IS | I | RB | 9 | 1 | 10 | 20 | 1.1 | 3 | 1 | 4 | 0.4 | 12 | 0.8 | |||||
| Lepomis macrochirus | TS | I | - | 20 | 1 | 1 | 22 | 2.2 | 22 | 1.5 | |||||||||
| Pseudobagrus koreanus | IS | I | RB | 2 | 6 | 1 | 9 | 0.5 | 4 | 3 | 1 | 1 | 9 | 0.9 | 9 | 0.6 | |||
| Misgurnus mizolepis | TS | O | - | 2 | 15 | 17 | 0.9 | 1 | 1 | 0.1 | 9 | 0.6 | |||||||
| Cyprinus carpio | TS | O | - | 1 | 9 | 3 | 13 | 0.7 | 1 | 1 | 1 | 1 | 4 | 0.4 | 8.5 | 0.6 | |||
| Squaliobarbus curriculus | IS | O | - | 13 | 13 | 0.7 | 2 | 2 | 0.2 | 7.5 | 0.5 | ||||||||
| Odontobutis platycephala | SS | C | - | 8 | 8 | 0.4 | 1 | 1 | 1 | 3 | 0.3 | 5.5 | 0.4 | ||||||
| Cobitis lutheri | IS | I | - | 5 | 2 | 1 | 8 | 0.4 | 1 | 2 | 3 | 0.3 | 5.5 | 0.4 | |||||
| Zacco temminckii | SS | I | - | 6 | 6 | 0.3 | 2 | 2 | 0.2 | 4 | 0.3 | ||||||||
| Tridentiger brevispinis | IS | I | RB | 1 | 1 | 5 | 7 | 0.4 | 1 | 1 | 0.1 | 4 | 0.3 | ||||||
| Rhodeus uyekii | IS | O | - | 6 | 6 | 0.3 | 1 | 1 | 0.1 | 3.5 | 0.2 | ||||||||
| Pseudobagrus fulvidraco | TS | I | - | 1 | 2 | 1 | 1 | 5 | 0.3 | 1 | 1 | 2 | 0.2 | 3.5 | 0.2 | ||||
| Squalidus japonicus coreanus | TS | O | - | 1 | 1 | 0.1 | 2 | 4 | 6 | 0.6 | 3.5 | 0.2 | |||||||
| Siniperca scherzeri | IS | C | - | 2 | 1 | 3 | 0.2 | 1 | 2 | 1 | 4 | 0.4 | 3.5 | 0.2 | |||||
| Sarcocheilichthys nigripinnis morii | IS | I | - | 1 | 1 | 1 | 3 | 0.2 | 1 | 1 | 1 | 3 | 0.3 | 3 | 0.2 | ||||
| Squalidus chankaensis tsuchigae | IS | O | - | 4 | 4 | 0.2 | 2 | 2 | 0.2 | 3 | 0.2 | ||||||||
| Silurus asotus | TS | C | - | 1 | 1 | 1 | 3 | 0.2 | 1 | 1 | 2 | 0.2 | 2.5 | 0.2 | |||||
| Channa argus | TS | C | - | 1 | 1 | 2 | 0.1 | 1 | 1 | 2 | 0.2 | 2 | 0.1 | ||||||
| Carassius cuvieri | TS | O | - | 1 | 3 | 4 | 0.2 | 4 | 0.3 | ||||||||||
| Erythroculter erythropterus | TS | C | - | 1 | 1 | 0.1 | 1 | 1 | 2 | 0.2 | 1.5 | 0.1 | |||||||
| Iksookimia choii | SS | I | - | 3 | 3 | 0.2 | 3 | 0.2 | |||||||||||
| Acheilognathus koreensis | IS | O | - | 1 | 1 | 0.1 | 1 | 1 | 2 | 0.2 | 1.5 | 0.1 | |||||||
| Rhodeus notatus | IS | O | - | 2 | 2 | 0.1 | 2 | 0.1 | |||||||||||
| Sarcocheilichthys variegatus wakiyae | IS | I | 1 | 1 | 0.1 | 1 | 1 | 0.1 | 1 | 0.1 | |||||||||
| Rhinogobius giurinus | TS | O | - | 1 | 1 | 0.1 | 1 | 0.1 | |||||||||||
| Pseudopungtungia nigra | SS | I | - | 1 | 1 | 0.1 | 1 | 0.1 | |||||||||||
| Oryzias sinensis | TS | O | - | 1 | 1 | 0.1 | 1 | 0.1 | |||||||||||
| Monopterus albus | TS | C | - | 1 | 1 | 0.1 | 1 | 0.1 | |||||||||||
| Macropodus ocellatus | TS | I | - | 1 | 1 | 0.1 | 1 | 0.1 | |||||||||||
| Total Number of Species | 31 | 24 | 26 | 24 | 27 | 45 | 23 | 23 | 26 | 26 | 33 | 46 | 50 | ||||||
| Total Number of individuals | 422 | 306 | 315 | 283 | 489 | 1815 | 165 | 117 | 252 | 237 | 242 | 1013 | 1432 | ||||||
TO = Tolerance guild, TR = Tolerance guild, HA = Habitat preference, TS = Tolerant species, IS = Intermediate species, SS = Sensitive species, I = Insectivores, O = Omnivores, C = Carnivores, RB = Riffle benthic, TNI = Total number of individuals, RA = Relative abundance.
Table 6.
Annual results of index of biotic integrity (IBI) and biological health evaluation in Gap Stream during 2007–2016.
Table 6.
Annual results of index of biotic integrity (IBI) and biological health evaluation in Gap Stream during 2007–2016.
| Category | Metric | Mean and Stand. Deviation (Obtained Metric Score) | |||||||||
|---|---|---|---|---|---|---|---|---|---|---|---|
| 2007 | 2008 | 2009 | 2010 | 2011 | 2012 | 2013 | 2014 | 2015 | 2016 | ||
| Species composition | M1: Total number of native fish species | 13.9 ± 2.1 | 13.1 ± 2.3 | 14.8 ± 3.0 | 12.4 ± 4.8 | 14.4 ± 5.3 | 12.9 ± 2.9 | 9.8 ± 2.9 | 11.6 ± 3.0 | 13.5 ± 3.3 | 9.3 ± 2.4 |
| (5) | (5) | (5) | (5) | (5) | (5) | (3) | (5) | (5) | (3) | ||
| M2: Number of riffle benthic species | 2.2 ± 1.5 | 2.0 ± 1.3 | 2.3 ± 1.8 | 2.2 ± 2.1 | 1.8 ± 1.5 | 2.2 ± 1.8 | 2.2 ± 1.8 | 1.8 ± 1.4 | 2.6 ± 1.8 | 1.5 ± 1.4 | |
| (1) | (1) | (1) | (1) | (1) | (1) | (1) | (1) | (3) | (1) | ||
| M3: Number of sensitive species | 0.9 ± 1.1 | 0.8 ± 1.2 | 0.7 ± 0.9 | 1.0 ± 1.3 | 0.4 ± 0.7 | 0.9 ± 1.0 | 0.5 ± 0.5 | 0.6 ± 0.8 | 1.0 ± 1.4 | 0.6 ± 0.7 | |
| (1) | (1) | (1) | (1) | (1) | (1) | (1) | (1) | (1) | (1) | ||
| M4: Percent individuals as tolerant species (%) | 60.7 ± 25.9 | 61.7 ± 25.8 | 58.9 ± 16.1 | 61.4 ± 14.7 | 50.7 ± 19.4 | 59.2 ± 22.2 | 46.0 ± 20.8 | 49.6 ± 16.0 | 49.0 ± 21.8 | 66.5 ± 19.6 | |
| (1) | (1) | (1) | (1) | (1) | (1) | (1) | (1) | (1) | (1) | ||
| Trophic composition | M5: Proportion of individuals as native omnivores (%) | 56.7 ± 17.8 | 58.7 ± 17.2 | 55.5 ± 14.5 | 53.0 ± 24.3 | 53.4 ± 20.0 | 62.3 ± 15.2 | 49.0 ± 23.1 | 51.8 ± 15.7 | 50.3 ± 16.4 | 56.3 ± 15.3 |
| (1) | (1) | (1) | (1) | (1) | (1) | (1) | (1) | (1) | (1) | ||
| M6: Proportion of individuals as native insectivores (%) | 32.1 ± 15.5 | 31.0 ± 15.9 | 32.2 ± 12.7 | 34.8 ± 23.2 | 36.9 ± 19.2 | 31.6 ± 18.0 | 42.3 ± 20.6 | 40.8 ± 17.2 | 38.2 ± 17.6 | 30.2 ± 15.8 | |
| (3) | (3) | (3) | (3) | (3) | (3) | (3) | (3) | (3) | (3) | ||
| Fish abundance and condition | M7: Total number of individuals | 192.2 ± 79.1 | 189.2 ± 79.8 | 165.3 ± 88.2 | 185 ± 139.4 | 138.0 ± 62.7 | 154.5 ± 50.7 | 69.3 ± 44.1 | 94.7 ± 47.8 | 143.9 ± 72.4 | 85.6 ± 41.9 |
| (3) | (3) | (3) | (3) | (3) | (3) | (1) | (1) | (3) | (1) | ||
| M8: Portion of individuals with abnormalities (%) | 0.3 ± 0.4 | 0.4 ± 0.5 | 0.4 ± 0.9 | 0.3 ± 0.9 | 0.0 ± 0.1 | 0.4 ± 0.6 | 1.1 ± 3.6 | 1.1 ± 1.6 | 0 | 0 | |
| (3) | (3) | (3) | (3) | (3) | (3) | (1) | (1) | (5) | (5) | ||
| Sum of IBI Scores | 18 | 18 | 18 | 18 | 18 | 18 | 12 | 14 | 22 | 16 | |
| Health status | Poor | Poor | Poor | Poor | Poor | Poor | V. poor | V. poor | Poor | Poor | |
Table 7.
Correlation analysis on selected water quality parameters and indices used in Gap Stream during 2007–2016.
Table 7.
Correlation analysis on selected water quality parameters and indices used in Gap Stream during 2007–2016.
| Parameters | pH | EC | TN | TP | BOD | COD | TSS | CHL-a | WPI | QHEI | IBI |
|---|---|---|---|---|---|---|---|---|---|---|---|
| pH | 1 | ||||||||||
| EC | −0.194 | 1 | |||||||||
| TN | −0.115 | 0.878 ** | 1 | ||||||||
| TP | 0.086 | 0.634 ** | 0.689 ** | 1 | |||||||
| BOD | 0.094 | 0.781 ** | 0.826 ** | 0.789 ** | 1 | ||||||
| COD | 0.120 | 0.858 ** | 0.840 ** | 0.736 ** | 0.925 ** | 1 | |||||
| TSS | 0.390 ** | 0.161 | 0.264 * | 0.406 ** | 0.481 ** | 0.428 ** | 1 | ||||
| CHL-a | 0.391 ** | 0.358 ** | 0.290 ** | 0.517 ** | 0.580 ** | 0.638 ** | 0.444 ** | 1 | |||
| WPI | −0.263 * | −0.623 ** | −0.617 ** | −0.666 ** | −0.787 ** | −0.783 ** | −0.647 ** | −0.633 ** | 1 | ||
| QHEI | −0.230 * | −0.105 | −0.084 | −0.065 | −0.178 | −0.190 | −0.122 | −0.081 | 0.109 | 1 | |
| IBI | −0.089 | −0.139 | −0.231 * | −0.145 | −0.256 * | −0.229 * | −0.233 * | −0.120 | 0.167 | 0.569 ** | 1 |
EC = Electrical conductivity, TN = Total nitrogen, TP = Total phosphorus, BOD = Biological oxygen demand, COD = Chemical oxygen demand, TSS = Total suspended solids, CHL-a = Chlorophyll-a, WPI = Water pollution index, QHEI = Qualitative habitat evaluation index, IBI = Index of biotic integrity. *: p < 0.05, **: p < 0.01.
Table 8.
Loading values, eigenvalues and variances of factors obtained from PCA in Gap Stream.
| Parameters | PC 1 | PC 2 | PC 3 | PC 4 | PC 5 |
|---|---|---|---|---|---|
| pH | 0.001 | −0.001 | −0.463 | −0.001 | −0.002 |
| DO | 0.001 | 0.013 | −0.005 | 0.018 | −0.004 |
| BOD | 0.004 | 0.518 | −0.001 | −0.006 | −0.002 |
| COD | 0.575 | 0.006 | 0.002 | −0.011 | −0.005 |
| TSS | 0.006 | −0.012 | 0.011 | −0.029 | 0.002 |
| TN | 0.003 | 0.010 | −0.008 | 0.011 | 0.001 |
| TP | 0.690 | −0.078 | −0.294 | −0.069 | −0.032 |
| TN:TP | −0.102 | 0.224 | −0.228 | 0.910 | 0.061 |
| WT | −0.001 | −0.074 | 0.029 | −0.123 | −0.002 |
| EC | 0.072 | 0.935 | −0.138 | −0.235 | −0.196 |
| TDN | 0.002 | 0.010 | −0.008 | 0.008 | −0.001 |
| NH4-N | 0.002 | 0.005 | −0.005 | −0.465 | 0.002 |
| NO3-N | 0.000 | 0.003 | −0.002 | 0.646 | −0.005 |
| TDP | 0.612 | −0.080 | −0.220 | 0.135 | 0.076 |
| PO4-P | 0.356 | 0.119 | 0.870 | 0.237 | −0.204 |
| CHL-a | 0.032 | 0.010 | 0.033 | −0.118 | 0.655 |
| WPI | 0.008 | 0.008 | 0.023 | −0.004 | 0.872 |
| QHEI | 0.074 | 0.208 | 0.183 | −0.076 | 0.950 |
| IBI | 0.004 | 0.014 | 0.947 | −0.012 | 0.058 |
| Eigenvalue | 33,483.1 | 2985.62 | 1890.21 | 1112.01 | 1019.19 |
| % variance | 81.99 | 7.311 | 4.63 | 2.72 | 2.49 |
| % CV | 81.99 | 89.30 | 93.93 | 96.65 | 99.15 |
(WT = Water temperature, EC = Electrical conductivity, DO = Dissolved oxygen, TDN = Total dissolved nitrogen, NH4-N = Ammonia nitrogen, NO3-N = Nitrate nitrogen, TN = Total nitrogen, TP = Total phosphorus, TDP = Total dissolved phosphorus, PO4-P =Phosphate phosphorus, BOD = Biological oxygen demand, COD = Chemical oxygen demand, SS = Suspended solids, CHL-a = Chlorophyll-a, WPI = Water pollution index, IBI = Index of biotic integrity, QHEI = Qualitative habitat evaluation index).
© 2019 by the authors. Licensee MDPI, Basel, Switzerland. This article is an open access article distributed under the terms and conditions of the Creative Commons Attribution (CC BY) license (http://creativecommons.org/licenses/by/4.0/).
Share and Cite
MDPI and ACS Style
Kim, J.-J.; Atique, U.; An, K.-G. Long-Term Ecological Health Assessment of a Restored Urban Stream Based on Chemical Water Quality, Physical Habitat Conditions and Biological Integrity. Water 2019, 11, 114. https://doi.org/10.3390/w11010114
AMA Style
Kim J-J, Atique U, An K-G. Long-Term Ecological Health Assessment of a Restored Urban Stream Based on Chemical Water Quality, Physical Habitat Conditions and Biological Integrity. Water. 2019; 11(1):114. https://doi.org/10.3390/w11010114
Chicago/Turabian StyleKim, Jung-Jae, Usman Atique, and Kwang-Guk An. 2019. "Long-Term Ecological Health Assessment of a Restored Urban Stream Based on Chemical Water Quality, Physical Habitat Conditions and Biological Integrity" Water 11, no. 1: 114. https://doi.org/10.3390/w11010114
Note that from the first issue of 2016, this journal uses article numbers instead of page numbers. See further details here.