Article

The Impact of River Discharge and Water Temperature on Manganese Release from the Riverbed during Riverbank Filtration: A Case Study from Dresden, Germany

1
Dresden University of Applied Sciences, Friedrich-List-Platz 1, 01069 Dresden, Germany
2
DREWAG Netz GmbH Dresden, Kohlenstraße 23, 01189 Dresden, Germany
*
Author to whom correspondence should be addressed.
Water 2018, 10(10), 1476; https://doi.org/10.3390/w10101476
Submission received: 19 July 2018 / Revised: 10 October 2018 / Accepted: 15 October 2018 / Published: 19 October 2018
(This article belongs to the Special Issue Efficiency of Bank Filtration and Post-Treatment)

Abstract

:
The climate-related variables, river discharge, and water temperature, are the main factors controlling the quality of the bank filtrate by affecting infiltration rates, travel times, and redox conditions. The impact of temperature and discharge on manganese release from a riverbed were assessed by water quality data from a monitoring transect at a riverbank filtration site in Dresden-Tolkewitz. Column experiments with riverbed material were used to assess the Mn release for four temperature and three discharge conditions, represented by varying infiltration rates. The observed Mn release was modeled as kinetic reactions via Monod-type rate formulations in PHREEQC. The temperature had a bigger impact than the infiltration rates on the Mn release. Infiltration rates of <0.3 m3/(m2·d) required temperatures >20 °C to trigger the Mn release. With increasing temperatures, the infiltration rates became less important. The modeled consumption rates of dissolved oxygen are in agreement with results from other bank filtration sites and are potentially suited for the further application of the given conditions. The determined Mn reduction rate constants were appropriate to simulate Mn release from the riverbed sediments but seemed not to be suited for simulations in which Mn reduction is likely to occur within the aquifer. Sequential extractions revealed a decrease of easily reducible Mn up to 25%, which was found to reflect the natural stratification within the riverbed, rather than a depletion of the Mn reservoir.

1. Introduction

Riverbank filtration (RBF) has been successfully used as a natural and cost-efficient water treatment method in many countries in Europe [1,2], the USA [3,4], Africa [5,6], and Asia [7,8]. RBF can naturally occur or can be induced by pumping, whereby wells are placed adjacent to the river that creates a hydraulic potential gradient from the river towards the wells. RBF triggers a variety of natural attenuation processes that can largely improve the water quality of the bank filtrate (BF) and lower the post-treatment effort [9,10]. For example, some organic micropollutants are effectively removed within the first meter of infiltration under oxic conditions [11]. A series of redox processes along the flow path of the infiltrate can adversely affect the BF quality. Depletion of dissolved oxygen (DO), followed by denitrification and the reduction of manganese (Mn) minerals in the riverbed and the aquifer can cause elevated Mn concentrations, which require subsequent treatment [12,13,14].
However, the resulting Mn concentration depends on various factors, including residence time and water temperature [15]. Assuming a steady well operation, the residence time can change due to river water level fluctuations, which are usually connected to river discharge variations (floods/droughts). For example, decreasing water levels usually lower the hydraulic gradient and prolong the distance between the river and the RBF wells. The lowered hydraulic gradient also affects the infiltration rate. Additionally, the infiltration rate is impacted by a usually smaller infiltration area at lower water levels. Water temperature variations affect the viscosity of the water and, therefore, also affect the residence times and infiltration rates. Additionally, according to the rule of Van ’t Hoff [16], increasing temperatures lead to increased biological degradation rates, whereby Mn release is considered to be largely biologically mediated.
Current climate forecasts are thought-provoking at many RBF sites [17,18,19]. Droughts potentially lower the river discharge, extend travel times, and promote anaerobic conditions along the flow path, while floods can shorten travel times or cause, for example, breakthroughs of pathogens and organic micropollutants. The current increase of climate extremes in Europe is expected to continue, with a higher frequency of heat waves, long-lasting droughts in some regions, heavy precipitation events and river floods [20]. For the German state of Saxony, the air temperature is projected to increase by 3–3.5 °C and the mean summer rainfall is to decrease by 20–25% by the year 2100 [21].
The Waterworks (WW) Dresden-Tolkewitz (Saxony, Germany) was built in 1898 and is one of the oldest RBF schemes in Europe. This study investigated the impact of the climate-related variables, temperature and discharge, on the BF quality. Water quality data of a 10-year time span from a monitoring transect were examined to identify discharge- and temperature-related patterns. To assess the potential Mn release from the riverbed in Dresden-Tolkewitz, three columns filled with riverbed sediment from the Elbe river emulated three infiltration rates and four temperature conditions. In order to use the results from the column experiment for a planned modeling of the transect, the observed Mn release was reproduced by hydrogeochemical modeling with PHREEQC. Additionally, a sequential extraction procedure was applied to the riverbed sediment from the columns after the experiment. Based on that data, the implications of the results to the redox-related BF quality in a potentially changing climate are discussed with a focus on Mn.

2. Materials and Methods

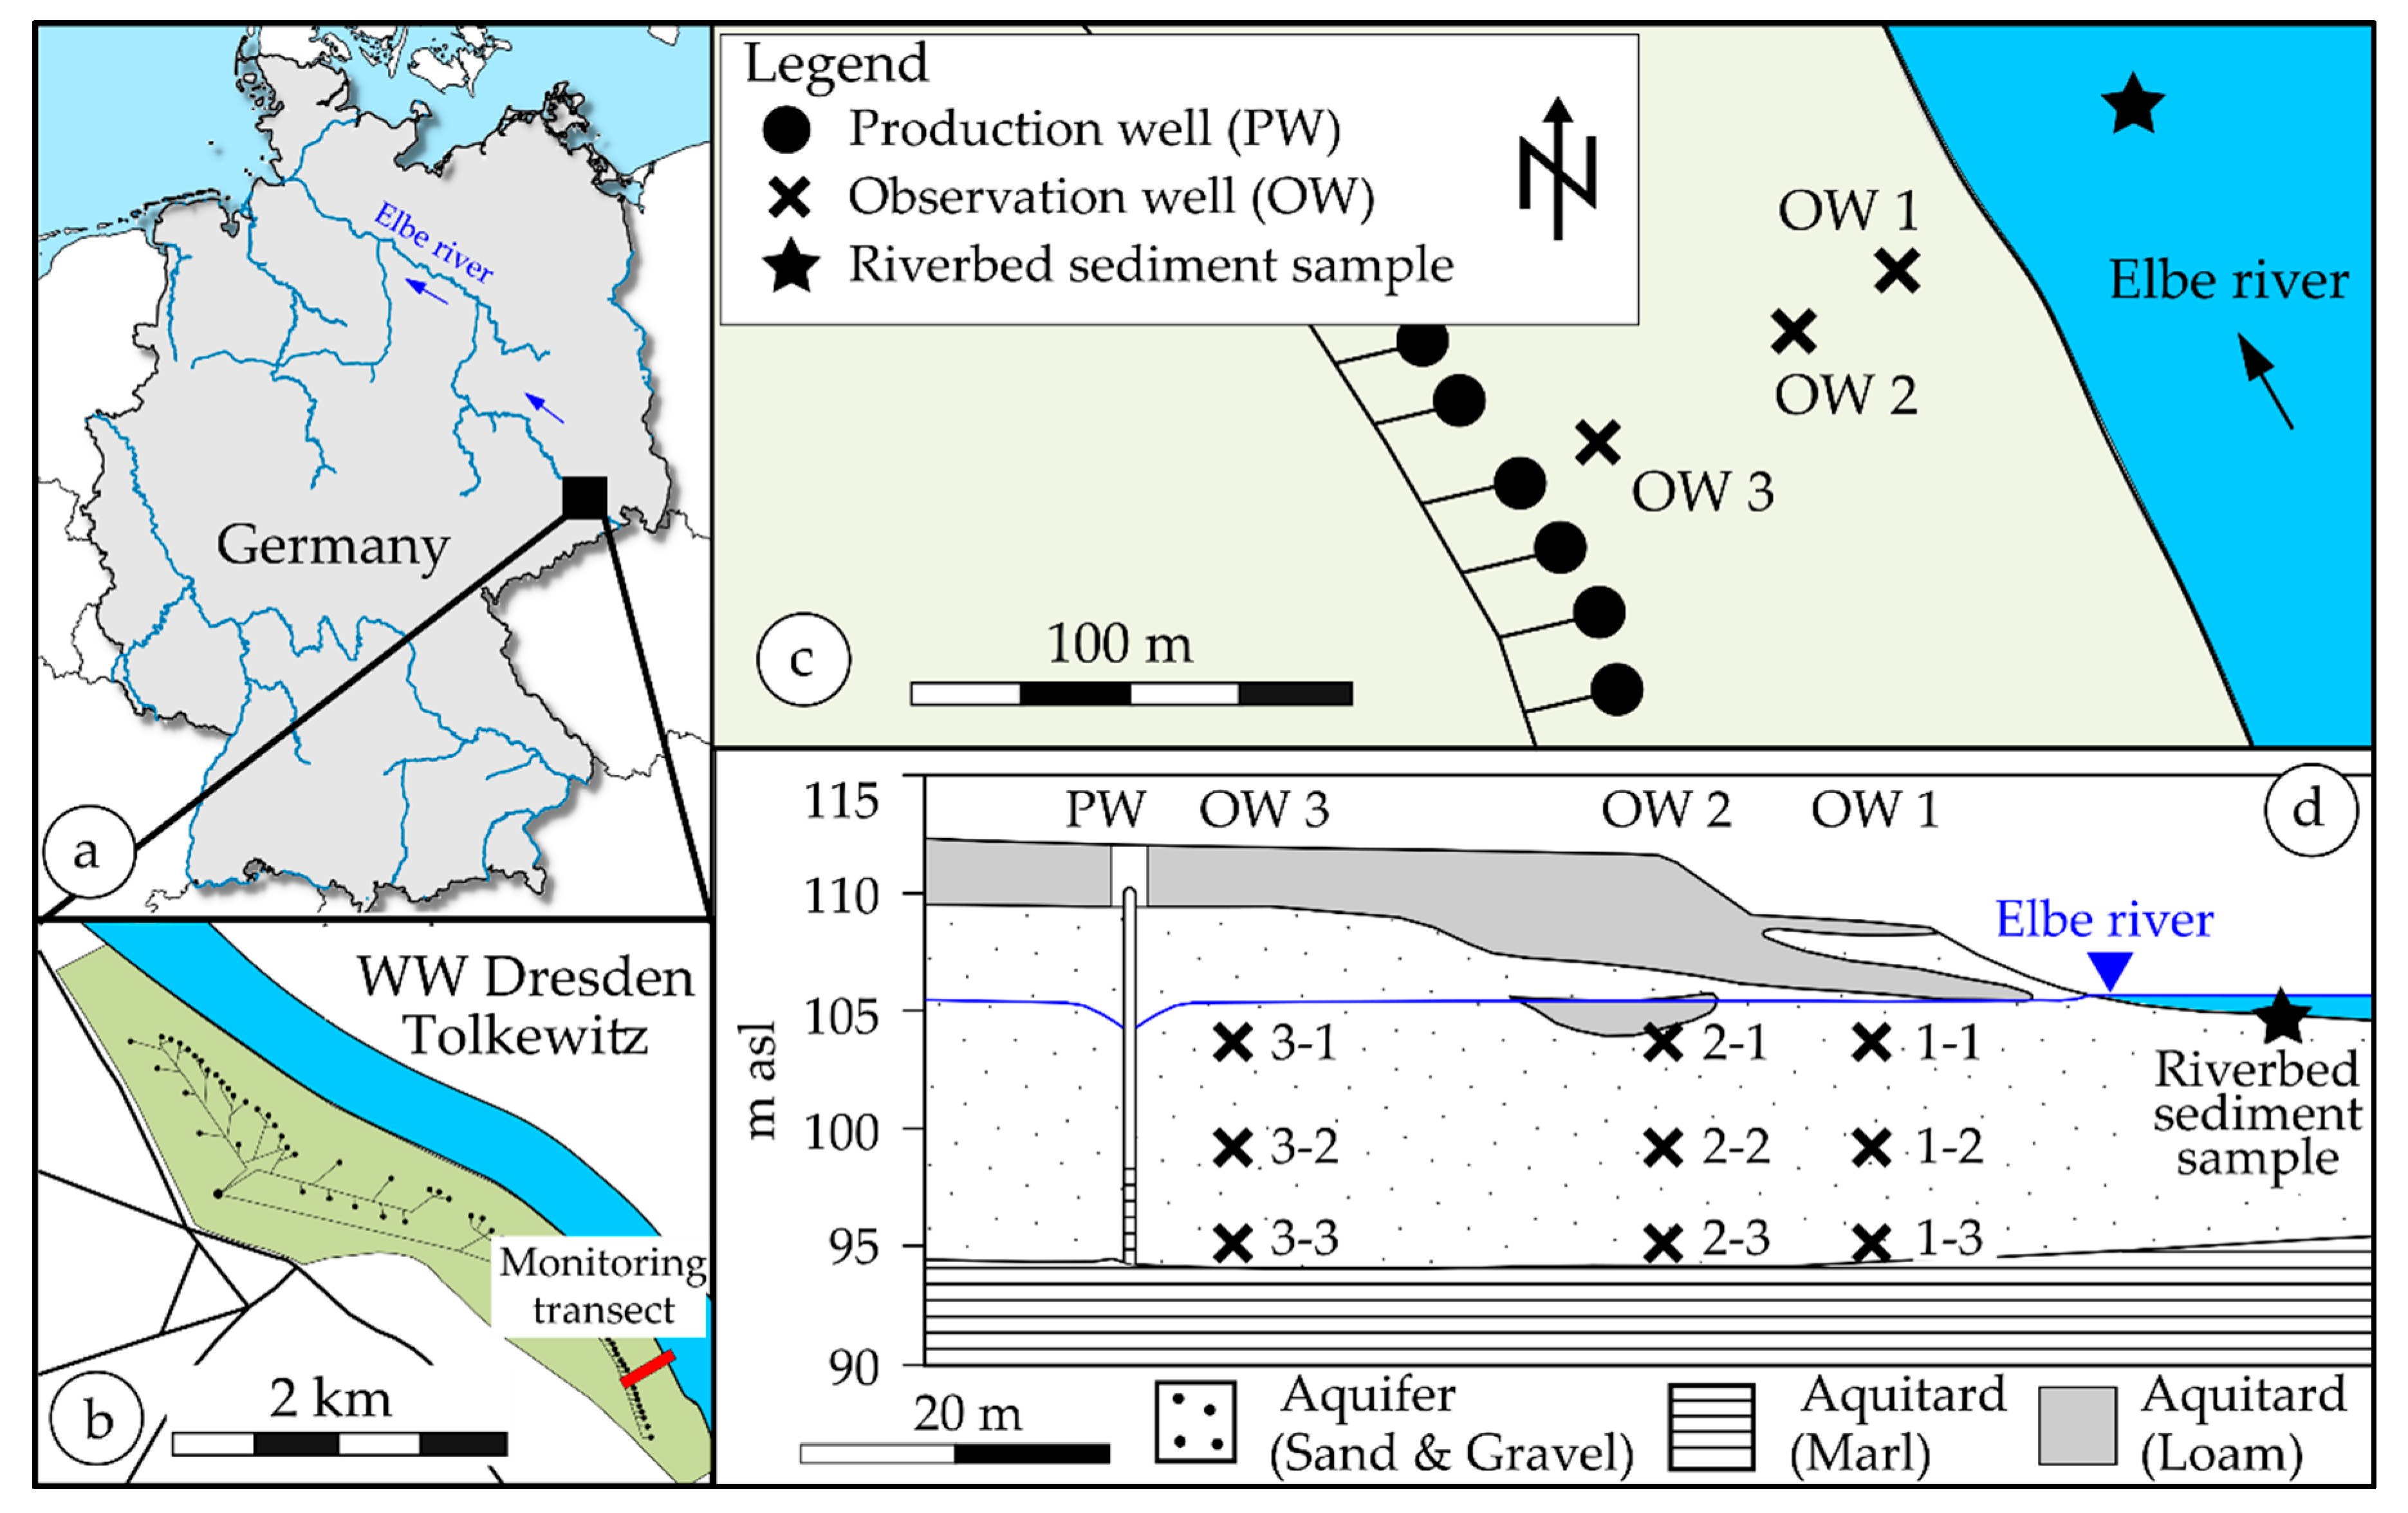
2.1. Description of the RBF Waterworks Dresden-Tolkewitz

The WW Dresden-Tolkewitz is located at the upper Elbe river in Germany (Figure 1). Three siphon well galleries with 72 vertical wells abstract up to 1500 m3/h (36,000 m3/d). The portion of riverbank filtrate is around 83% during mean flow and 70–75% during low flow conditions [22]. The focus of this study was a 95 m wide transect between the Elbe river and a production well (PW), which already was the focus of previous riverbed clogging studies [22]. The PW fully penetrates the aquifer and the 4 m long filter screen is located directly above the aquitard. The transect has three observation wells (OW 1, 2 and 3). Each OW has sampling points at three depths (upper, middle, lower = OW i-1, i-2, i-3). During the mean flow, the nearest OW (OW 1) is around 21–30 m apart from the riverbank. OW 2 and OW 3 are around 40 and 80 m apart from the bank during mean flow. The average travel time along the transect is between 24 and 30 days [23].
The mean discharge of the Elbe river in Dresden is 332 m3/s (at 1.84 m river stage). The discharge varies during the mean low and high flow periods between 110 m3/s (0.75 m) and 1700 m3/s at a water level of 5.47 m [22]. The climate in Dresden is humid continental with warm summers. The alluvial aquifer is unconfined, composed of gravel and coarse sand with a saturated thickness of 11–14 m and has a hydraulic conductivity of 1–2 × 10⁻³ m/s [22].

2.2. Regular Monitoring in Dresden-Tolkewitz

In this study, the evaluation period of the water quality data from the WW Dresden-Tolkewitz was a 10-year time span from 1 January 2006 to 31 December 2016. Regular samples were taken twice a year from all sampling points of each OW by the waterworks staff. Additional event-based samples were taken during low flow periods and, if possible, during high flow periods. Sampling was carried out according to DVGW [24] and corresponding to earlier guidelines. Water quality data for the Elbe river were taken from the database of the Saxon state ministry [25]. The relevant sampling point is located at river km 43.5, around 3 km upstream of the WW. Water levels in this study refer to the federal water level “Dresden Augustusbruecke” at river km 55.63 [26].

2.3. Set-Up of the Column Experiments

To understand the behavior of Mn at the RBF site in Dresden-Tolkewitz, three columns with riverbed sediments were set up in the laboratory of the University of Applied Sciences Dresden (Figure S1). Each column was 1 m long, had an inner diameter of 0.08 m, and was made up of galvanized steel. The filling material was riverbed sediment from the Elbe River. The riverbed material was collected in front of the investigated monitoring cross-section of the RBF Waterworks Dresden-Tolkewitz (Figure 1). The riverbed sediment was recovered around 20 m apart from the riverbank during a low discharge period. Due to the very low gradient of the riverbed towards the riverbank, the area around the sampling point was already flooded at slightly higher water levels, which still would occur during mean low flow conditions. Hence, the area around the sampling point can be considered as a potential infiltration area. Because of the relatively coarse riverbed, undisturbed sampling was not possible. Thus, the upper 5 cm of the riverbed where scratched first to represent the clogging layer. Subsequently, the deeper riverbed material was dug out layer-wise and sieved in place to a grain size <4 mm. Immediately after transporting it to the lab, the wet riverbed material was filled into columns in ≈0.1 m thick, separately compacted layers with the clogging layer on top.
During the filling of the columns, the sediment mass was measured using a balance to calculate the bulk density and assess the compaction of the material in the columns. The mean travel time (ta) and effective porosity (ne) for both columns were determined from electrical conductivity (NaCl) breakthrough curves from tracer experiments performed before start-up.
To adjust the temperature regiment, all three columns with riverbed material were stored in a thermostatic cabinet. A second thermostatic cabinet contained three storage containers with Elbe river water, collected in Dresden once per week. The outflow of the columns flowed into three additional containers within the second cabinet. The investigated temperatures were 10, 20, 30, and 35 °C (Table 1).
Temperature (T), dissolved oxygen (DO), the pH-value, and electrical conductivity (EC) were determined using WTW Multi 3430 and appropriate electrodes (WTW, Weilheim, Germany) before the columns in the storage containers and after the columns in a flow-through cell. A series of valves allowed sending the outflow of each column separately through the cell.
At most RBF sites, the infiltration rates depend for example on abstraction rates of the wells, clogging of the riverbed, distance between the river and the wells and the infiltrating area, and are therefore very site specific. To represent the low, mean, and high infiltration rates of 0.3, 0.6 and 1.1 m3/(m²·d), the flow through the columns was adjusted to 1, 2, and 4 mL/min. The flow rate was adjusted individually for each column using ProMinent Beta diaphragm pumps (ProMinent, Heidelberg, Germany). Each of the 12 possible flow and temperature conditions run until 15 to 20 pore volumes (PV) of every column were exchanged. Sampling started after around 5 PV and continued until at least 10 and 15 PV. Up to three intermediate samples were taken if possible (e.g., weekends were skipped). At one sampling event, the water samples from all three columns were taken at separate sampling taps after the columns before the outflow container. Thus, the presented results for each temperature and flow rate represent the mean value of three similarly prepared, and independently operated columns. Samples from the storage containers (=inflow) were taken once per week. Alkalinity was determined at every sampling event by alkalimetric titrations with 0.1 M hydrochloric acid (HCl).

2.4. Water Analysis

Water samples of the regular monitoring at the OW’s in Dresden-Tolkewwitz were analyzed for >100 parameters in the lab of DREWAG Netz GmbH (DIN EN ISO/IEC 17025 certified). Water samples from the column experiment were filtered immediately after sampling through 0.45 μm membrane filters (VWR International GmbH, Darmstadt, Germany). The samples for cation analysis were preserved with 0.1 M nitric acid (HNO3). Major cations K+, Na+, Ca2+, Mg2+ and dissolved metals As, Fe, Mn, Si, and Sr were measured with ICP-OES (Optima 4300 DV, PerkinElmer, Waltham, MA, USA). Br, Cl, F, NO2, NO3, PO43−, and SO42− were determined with ion-chromatography (autosampler AS50, eluent generator EG50, gradient pump GP50, electrochemical detector ED50, separation column AS19, all from Dionex) at the Institute for Water Chemistry, TU Dresden, Germany.

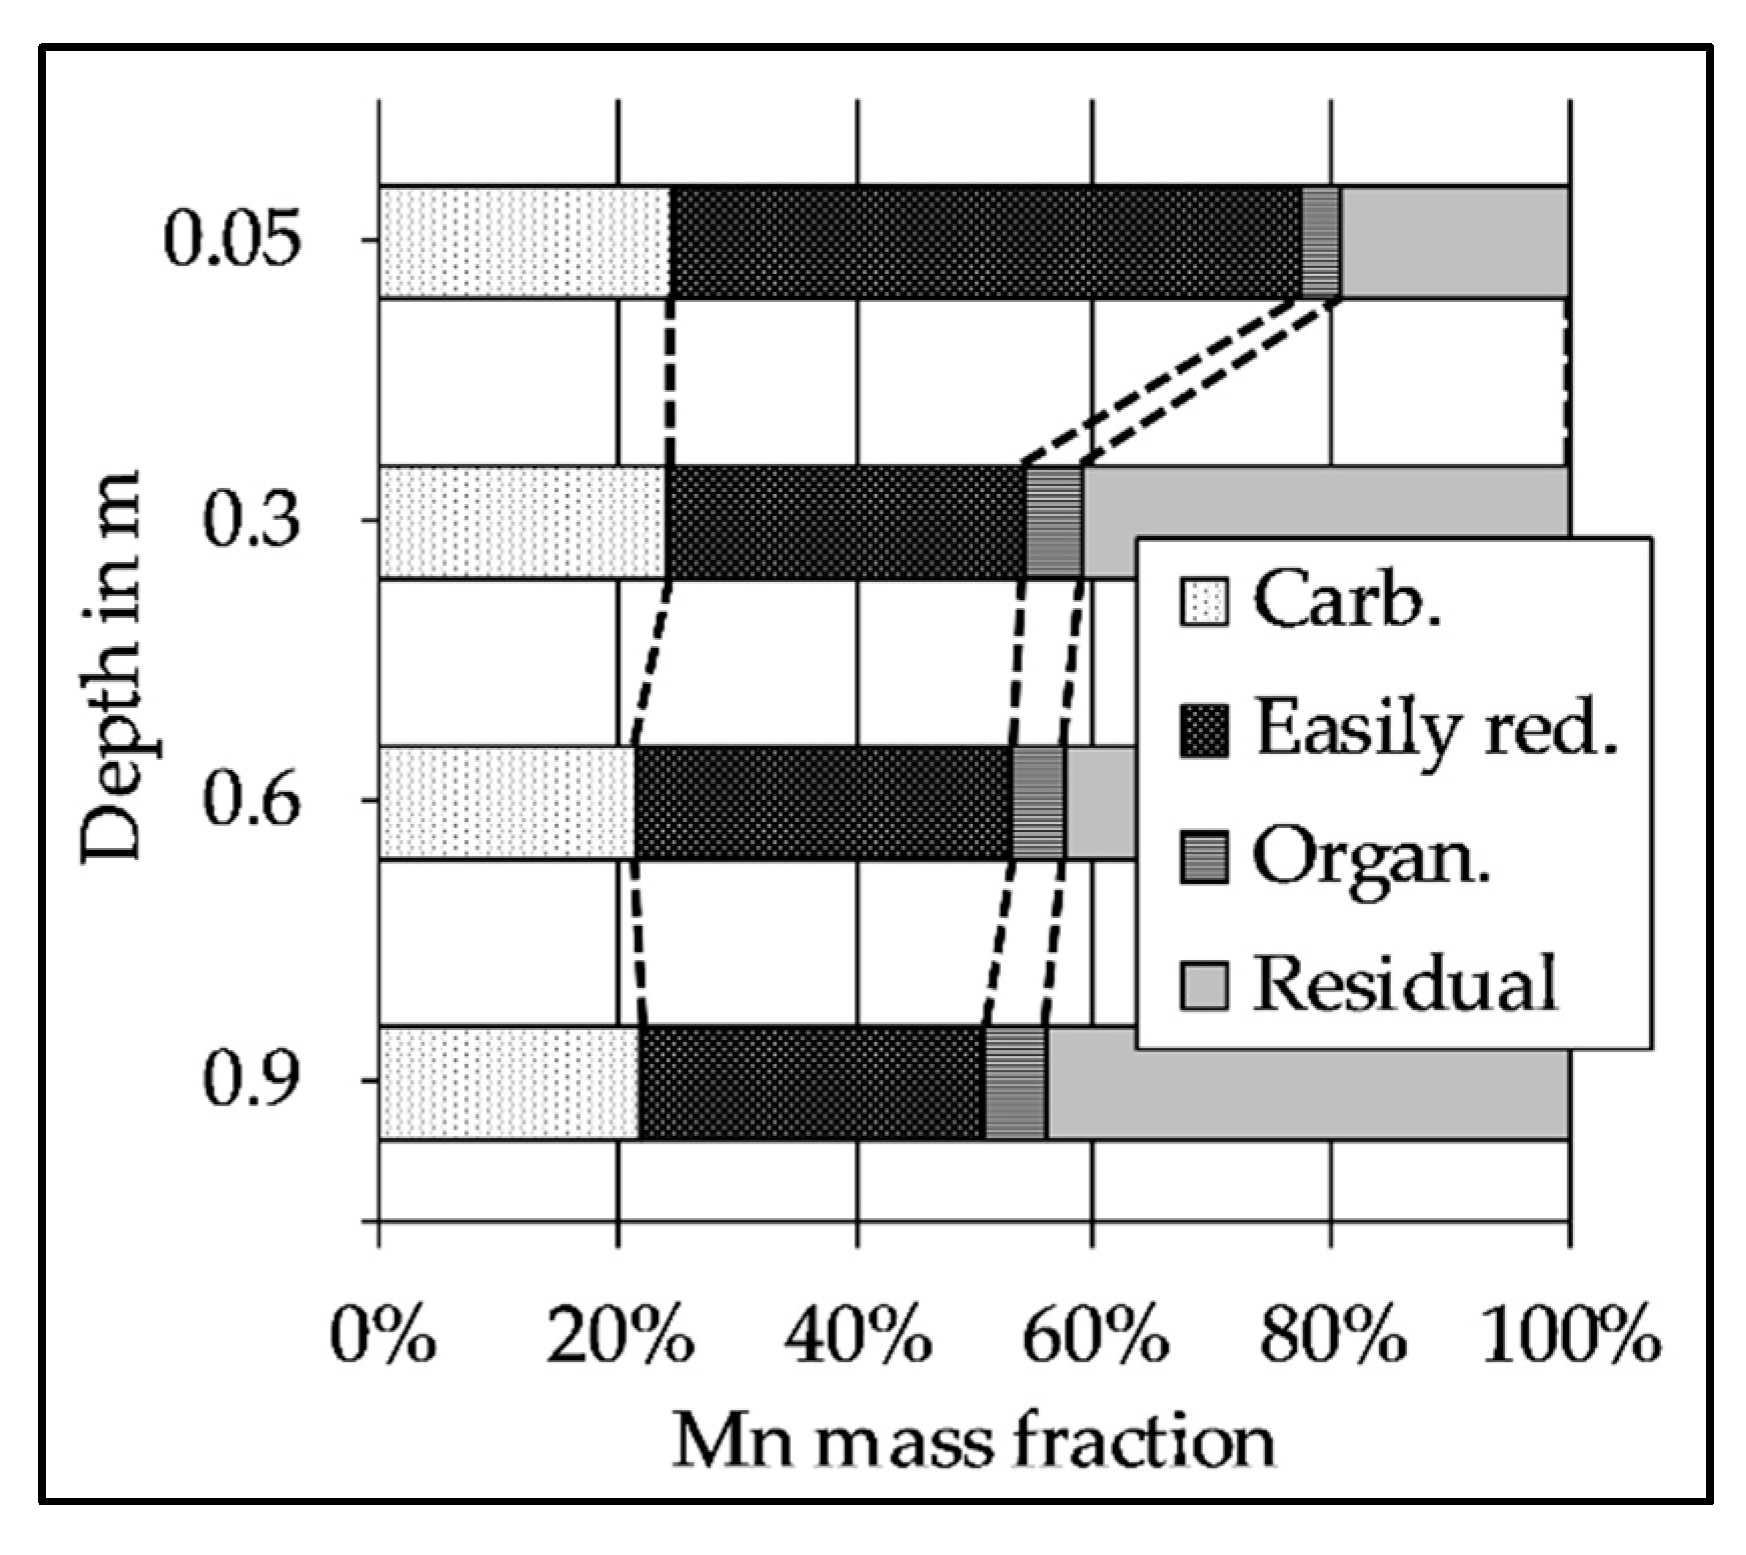
2.5. Sequential Extraction of the Riverbed Sediment

To estimate the mobilization behavior of Mn and to assess the mineralogical composition, a 4-step sequential extraction procedure was applied to the filling material of the columns after the experiment (Table S1). Rauret et al. [27] and Sutherland and Tack [28] described the applied procedure in detail. The total extractable Mn was determined by microwave acid digestion with HNO3 for separate samples from the same sampling points. Samples were taken after 0.05 m (below the clogging layer), and at 0.3, 0.6, and 0.9 m along the columns, before being immediately filled into airtight sample containers and stored at 4 °C before analysis.

2.6. Estimation of Reduction Constants for the Elbe Riverbed with PHREEQC

Elevated Mn concentrations at many bank filtration sites are linked to the microbiological reduction of Mn minerals within the riverbed and the aquifer [1,29]. The degradation (oxidation) of organic matter (OM, simplified CH2O) is the driving force for the associated redox reactions (Equations (1)–(3)).
Aerobic   respiration :   CH 2 O   +   O 2   CO 2   +   H 2 O  
Denitrification :   5 CH 2 O   +   4 NO 3   +   4 H +     5 CO 2   +   2 N 2   +   7 H 2 O  
Mn ( IV )   reduction :   CH 2 O   +   2 MnO 2 ( s )   +   4 H +   2 Mn 2 + +   3 H 2 O   +   CO 2  
The results from the column experiments are considered to represent the potential Mn release from the riverbed. In order to use the results for a planned modeling of the transect, the observed Mn release was reproduced by chemical modeling with PHREEQC [30]. By applying the approach of Henzler et al. [14], the relevant redox reactions were modeled as kinetic reactions using Monod-type rate formulations (Equations (4)–(7)). Because neither increasing Fe concentrations nor decreasing sulfate concentrations were observed along the transect, additional redox reactions accounting for iron and sulfate reduction were excluded.
  r o x = f r e a c × Y o x 1 × k o x × ( C o x C o x + K o x ) × f T  
  r n i t = f r e a c × Y n i t 1 × k n i t × ( C n i t C n i t + K n i t ) × ( K i n h b n i t o x C o x + K i n h b n i t o x ) × f T  
  r m n = f r e a c × Y m n 1 × k m n × ( K i n h b m n o x C o x + K i n h b m n o x ) × ( K i n h b m n n i t C o x + K i n h b m n n i t ) × f T  
  r O M = Y o x × r o x + Y n i t × r n i t Y m n × r m n  
The parameters rox, rnit and rmn denote the production and consumption rates (positive and negative) of dissolved O2, NO3, and Mn2+. Rate constants for OM degradation under oxic, nitrate and manganese reducing condition are represented by kox, knit and kmn. Cox and Cnit are the dissolved oxygen and nitrate concentrations. Kox and Knit denote Monod-half saturation constants. The inhibition of nitrate and manganese reduction under oxic conditions was implemented by the inhibition constants K i n h b n i t o x and K i n h b m n n i t . Accordingly, K i n h b m n n i t represents the inhibition constant for manganese reduction under nitrate-reducing conditions. The overall turnover rate of OM rOM (Equation (7)) is the sum of the reaction rates rox, rnit, and rmn that are multiplied with the stoichiometric coefficients Yox, Ynit, and Ymn corresponding to the redox reactions (Equations (1)–(3)). Following a similar modeling approach of Greskowiak et al. [31], the parameter freac was included to simulate a zone of increased reactivity at the first section of the infiltration path [14]. The application of Equations (4)–(7) implied two assumptions. First, MnO2 was present in excess. Hence, MnO2 was not rate limiting and the implementation of a Monod-half saturation constant for Mn was not necessary in Equation 6. Second, the OM content was assumed to be infinitely available (or redelivered by the river) and would not be exhausted during the simulation period.
Similar to Diem et al. [32], Greskowiak et al. [31], and Sharma et al. [33], an additional temperature factor fT was implemented that accounted for the impact of temperature changes on the degradation rates (Equation (8)).
  f T = e x p [ α + β × T × ( 1 0.5 × T T o p t ) ]  
Topt denotes the optimal temperature for a maximal degradation rate and α as well as β are fitting parameters. Applying the results from Diem et al. [32], Henzler et al. [14], Greskowiak et al. [33] and Sharma et al. [33], none of the three parameters were to be changed from the initial data set.
In PHREEQC, a 1 m long column was represented by 50 cells with a length of each of them being 0.02 m (Table S2). Porosity and pore velocity were known from the tracer test. The dispersion and diffusion coefficients for the model were calibrated for the NaCl breakthrough curves from the tracer tests and non-reactive transport. Subsequently, the data from Henzler et al. [14] for the rate constants kox, knit, and kmn, as well as for the inhibition constants K i n h b n i t o x , K i n h b m n o x , and K i n h b m n n i t , were used as the initial parameter set for reactive modeling. Calibration was initially carried out with PEST [34]. Since the inhibition constants K i n h b n i t o x , K i n h b m n o x and K i n h b m n n i t did not change during the initial calibration runs, and in order to speed up the calibration, the inhibition constants were held fixed at the initial values during further calibration. The following calibration of the rate constants kox, knit and kmn was first carried out by adjusting the parameters for best fit by hand (trial-and-error). Afterward, the trial-and-error results were checked with PEST.
The calibration targets were the determined median values of pH, DO, NO3 and Mn2+ in the outflow water of the columns for each of the three flow and four temperature conditions. Hence, the calibration each resulted in 12 values for kox, knit, and kmn.

3. Results

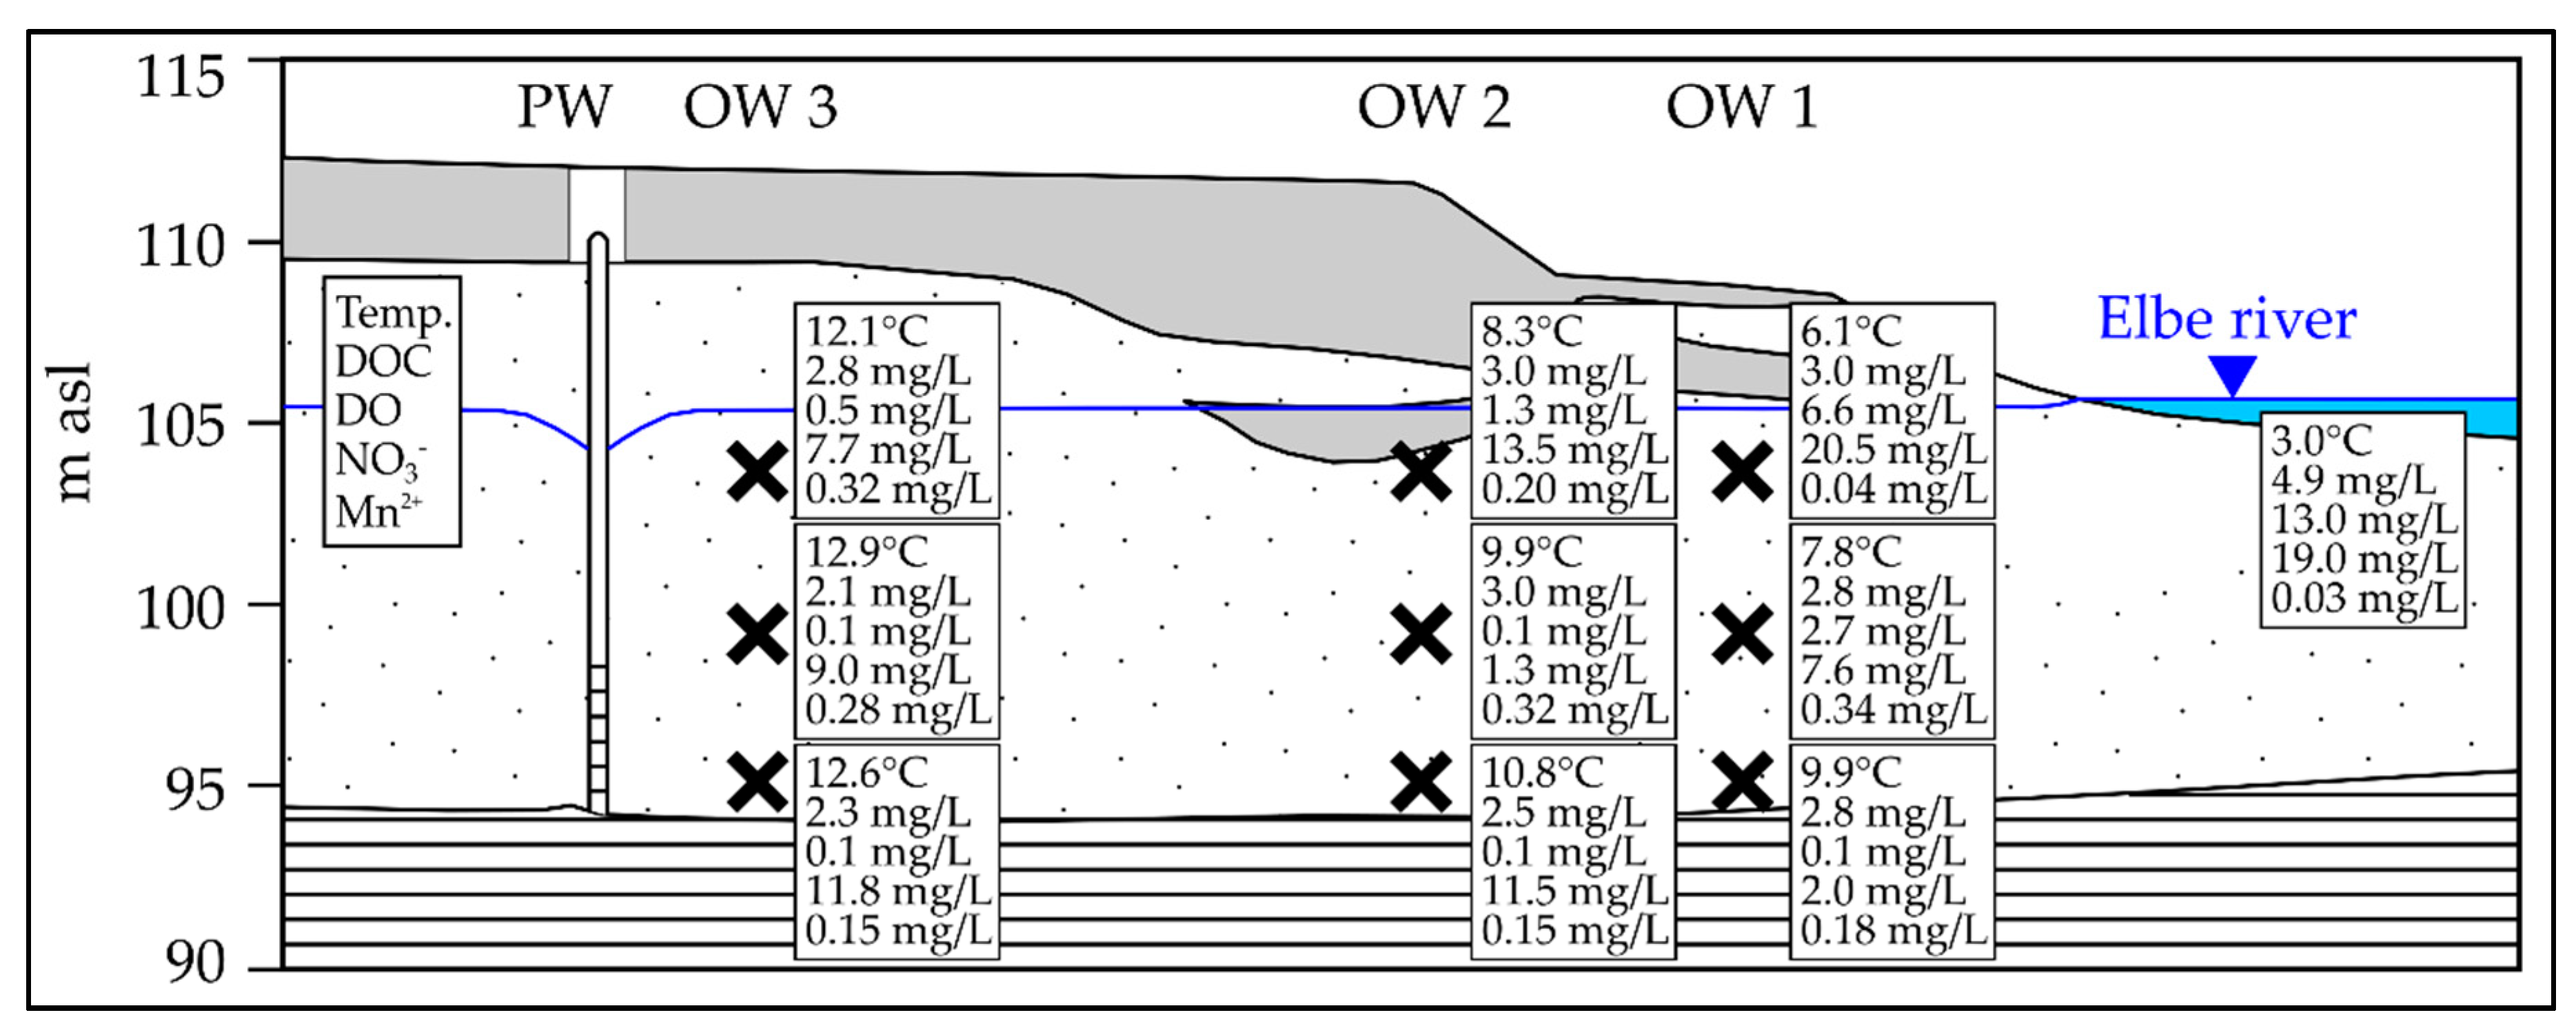
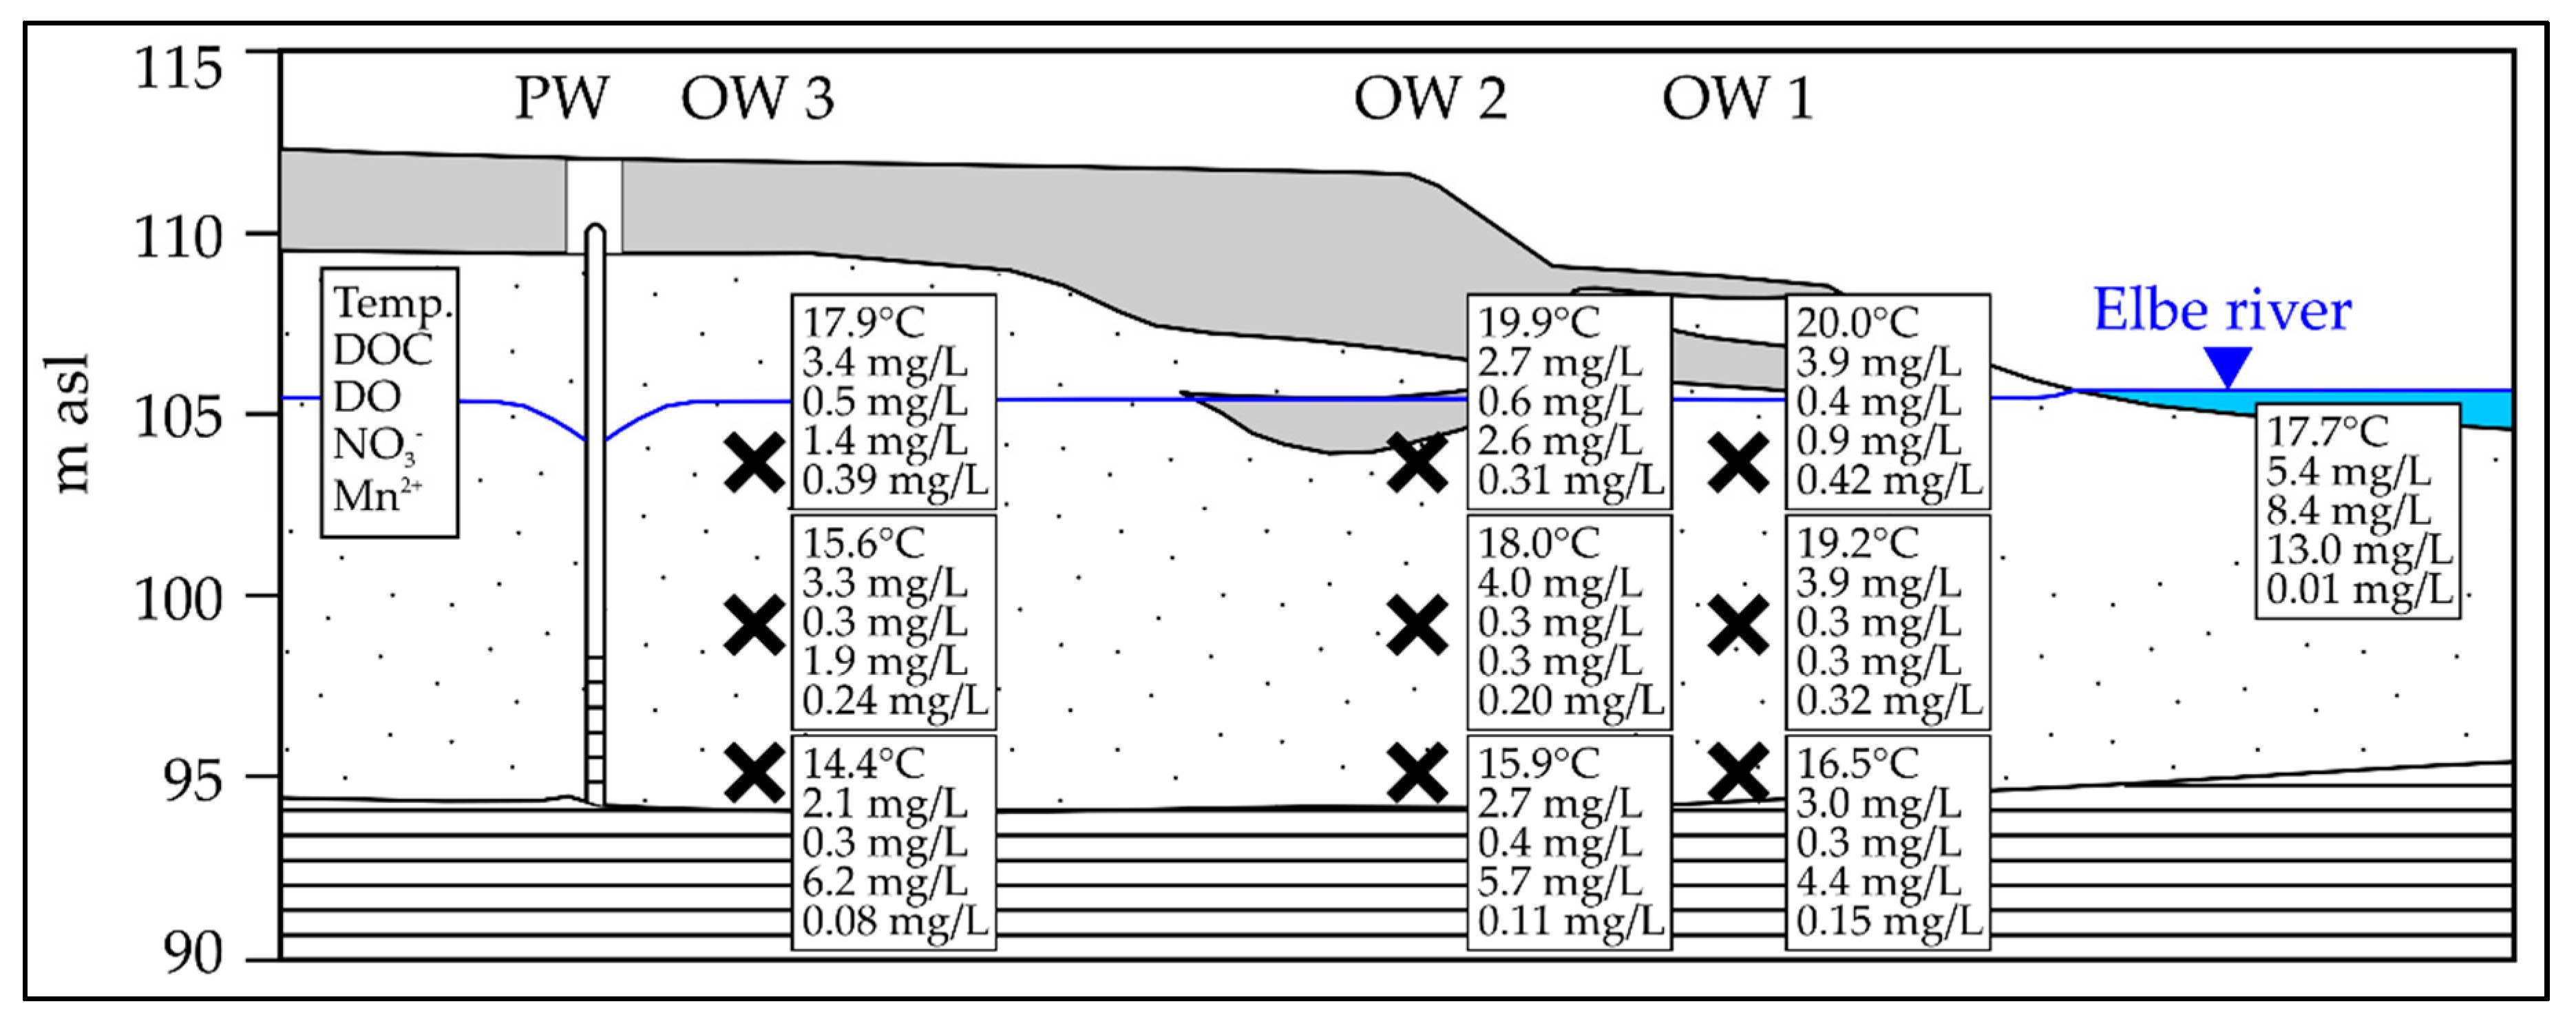
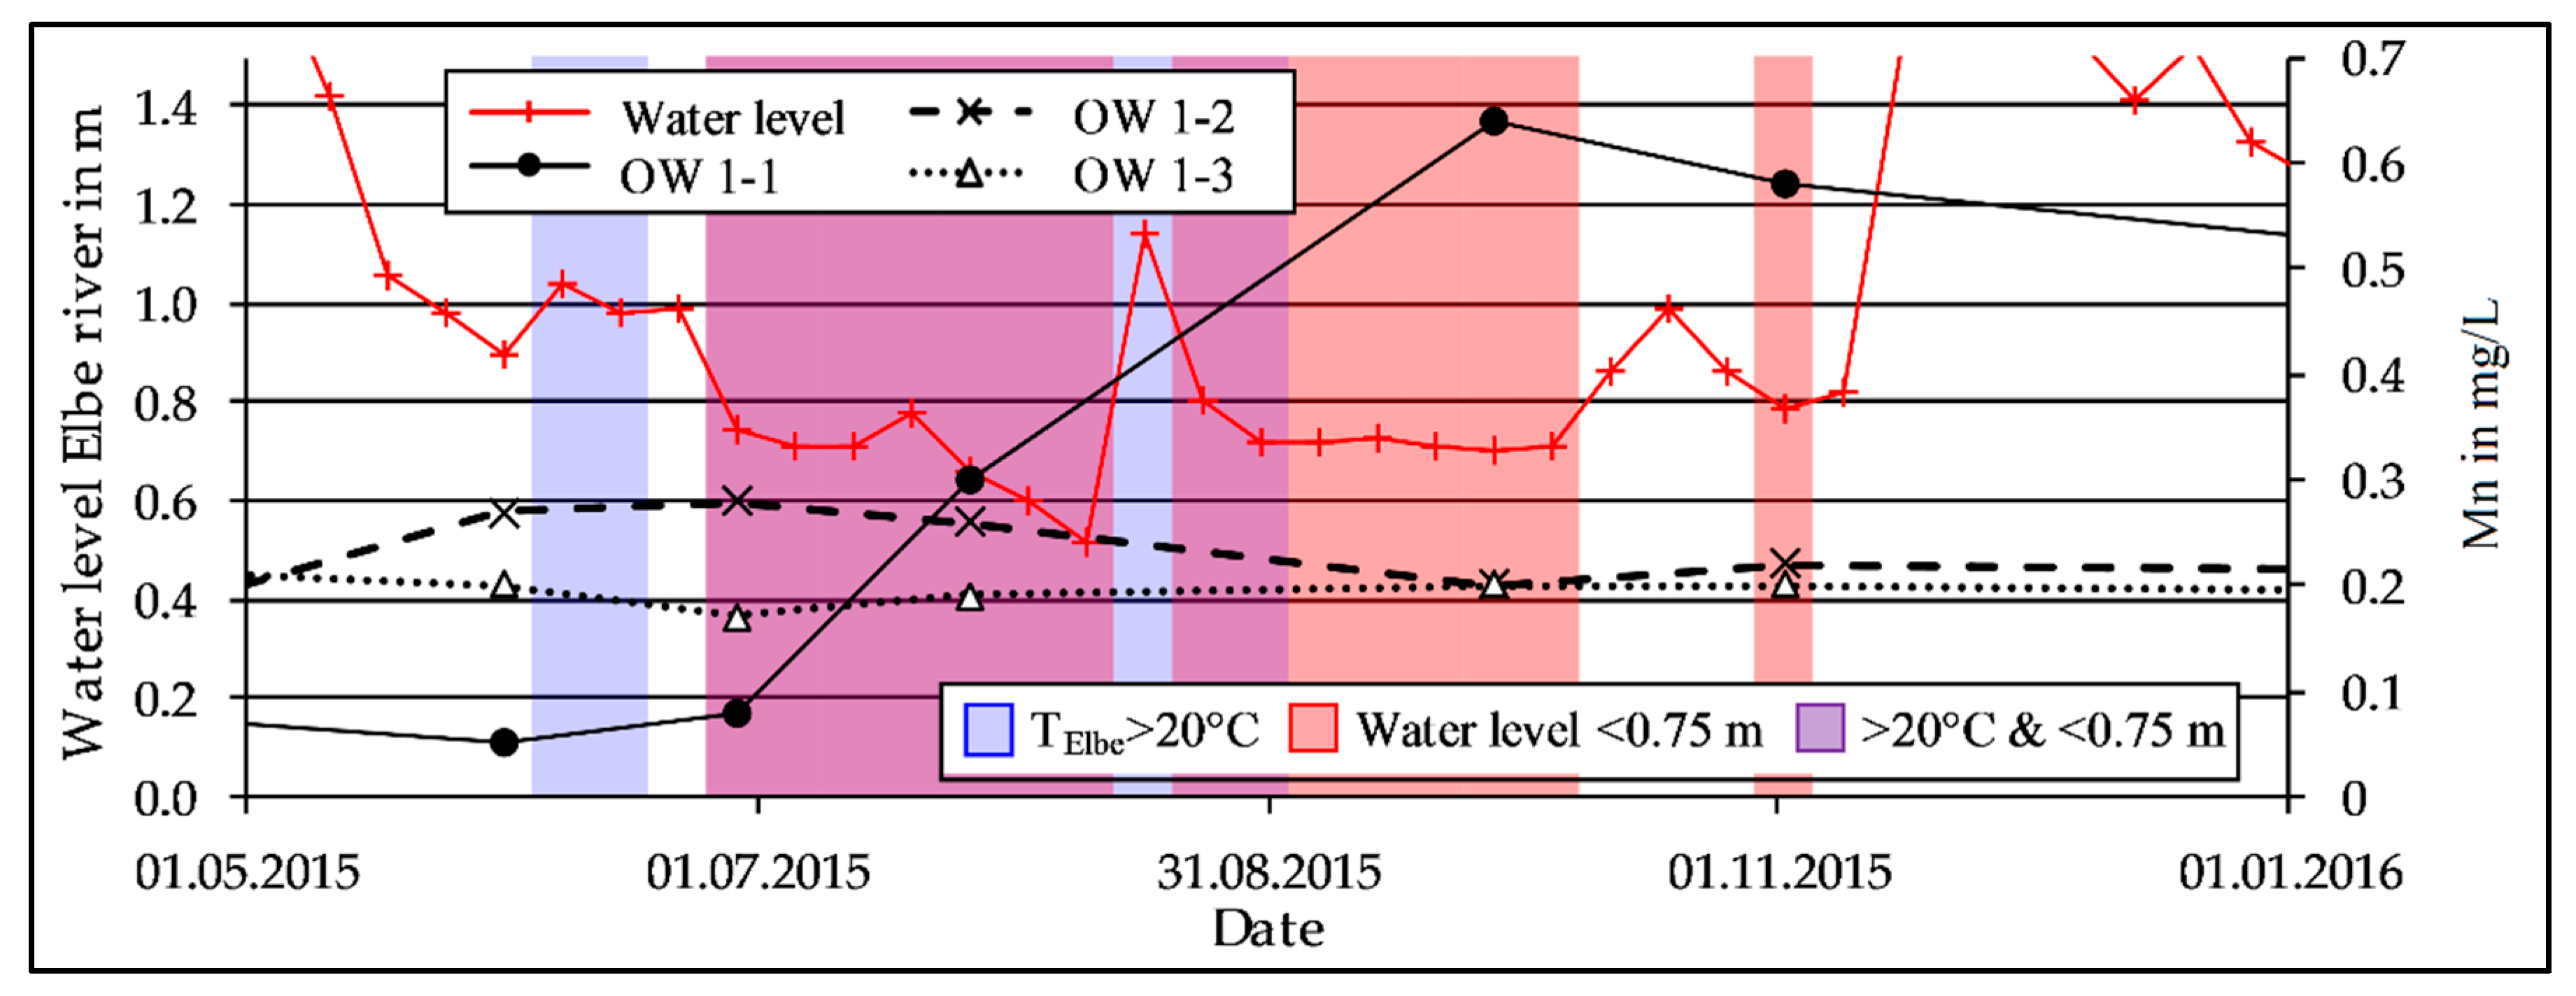
3.1. Seasonal Fluctuation of Redox-Sensitive Parameters Close to the Riverbank

Most relevant redox parameters of the Elbe river undergo strong seasonal fluctuations (Table S3). The median value for water temperature was 10.9 °C (3.0–21.3 °C, 10–90%ile, n = 267) during the entire 10-year observation period. Median values for DO, NO3, DOC, TOC, and Mn were 10.8 mg/L (8.4–13.8 mg/L, n = 269), 15.0 mg/L (12.0–20.0 mg/L, n = 279), 5.2 mg/L (4.6–6.0 mg/L, n = 325), 6.3 mg/L (5.2–8.2 mg/L, n = 292), and 0.01 mg/L (0.01–0.03 mg/L, n = 278). During the cold winter season (December–March), the water temperature decreased down to 3 °C and the TOC concentration to <6 mg/L, whereas DO and NO3 increased to around 13 and 19 mg/L. During hot summer months (June–September), the water temperature increased to >21 °C and the TOC concentration to >7 mg/L, whereas DO and NO3 usually decreased to ≈8.5 mg/L and ≈13 mg/L. Mn in the Elbe river showed no noticeable seasonal fluctuations.
Along the transect from the Elbe river towards the PW seasonal fluctuations were also noticeable (Table S4). As expected, OW 1-1 and 2-1 in the upper aquifer showed the strongest variations. The temperatures at both observation points varied from winter to summer from 6.1 to 20.0 °C and 8.3 to 19.9 °C (Figure 2 and Figure 3). Temperature fluctuations at the deeper observation points OW 1-2 and 2-2 were in the same order of magnitude. At the lowest observation points OW 1-3 and 2-3, as well as further along the flow path at OW 3, the temperature variations were ±3 °C compared to the median values.
DO showed similar patterns during the year. The higher DO concentration in the Elbe river in winter resulted in >6.5 mg/L at OW 1-1, >2.5 mg/L at OW 1-2 and >1.0 mg/L at OW 2-1. Further, along the flow path, DO was mostly found <0.5 mg/L. During summer, the DO was almost depleted at OW 1-1. Nitrate showed a similar behavior. During winter, NO3 concentrations were >20 mg/L at OW 1-1, >7 mg/L at OW 1-2 and >13 mg/L at OW 2-1, whereas in summer, the nitrate was with <1.0, <0.5 and <3.0 mg/L almost neglectable.
Mn concentration varied primary at OW 1-1 during the year. In winter, the Mn concentration was very low at OW 1-1, but increased up to 0.42 mg/L during summer time. At all other observation points, variations were found but without distinct patterns. Along the entire flow path after OW 1-1, the Mn concentration was always >0.1 mg/L and mostly below 0.35 mg/L (Table S4).

3.2. Mn Release During Low Discharge Periods of the Elbe River

The water level of the Elbe river shows strong annual fluctuations. Long-lasting mean low discharge conditions are represented by a water level of ≤0.75 m and are rare. From 1998 to 2006, the Elbe water level was between 0.7 and 0.8 m only in 2003 (for almost 3 months). During the observation period from 2006 onwards, the Elbe river decreased to mean low discharge conditions in 2008, 2009, and 2016, which lasted for two weeks at maximum. In 2015, the latest low discharge period was observed that lasted for more than 3 months and the water level dropped to as low as 0.5 m [26].
During this 153 day long low discharge period in 2015, the median water level was 0.74 m (0.62–1.05 m, 10–90%ile, n = 153) and the mean water temperature 20.1 °C (11.0–24.6 °C, n = 153, Table S5). The Mn concentration at OW 1-1 increased up to 0.69 mg/L (median 0.19 mg/L, n = 6, Table S5) after the water temperature already fell below 20 °C (Figure 4). At the two deeper OW 1-2 and OW 1-3, the Mn concentration did not change noticeably. Further, along the flow path at OW 2-1, Mn increased up to 0.42 mg/L (median 0.23 mg/L, n = 6, Figure S2) and at OW 3-1 up to 0.39 mg/L (median 0.26 mg/L, n = 6, Figure S3). At OW 2-2, 2-3, 3-2, and 3-3, the Mn concentration remained almost constant.

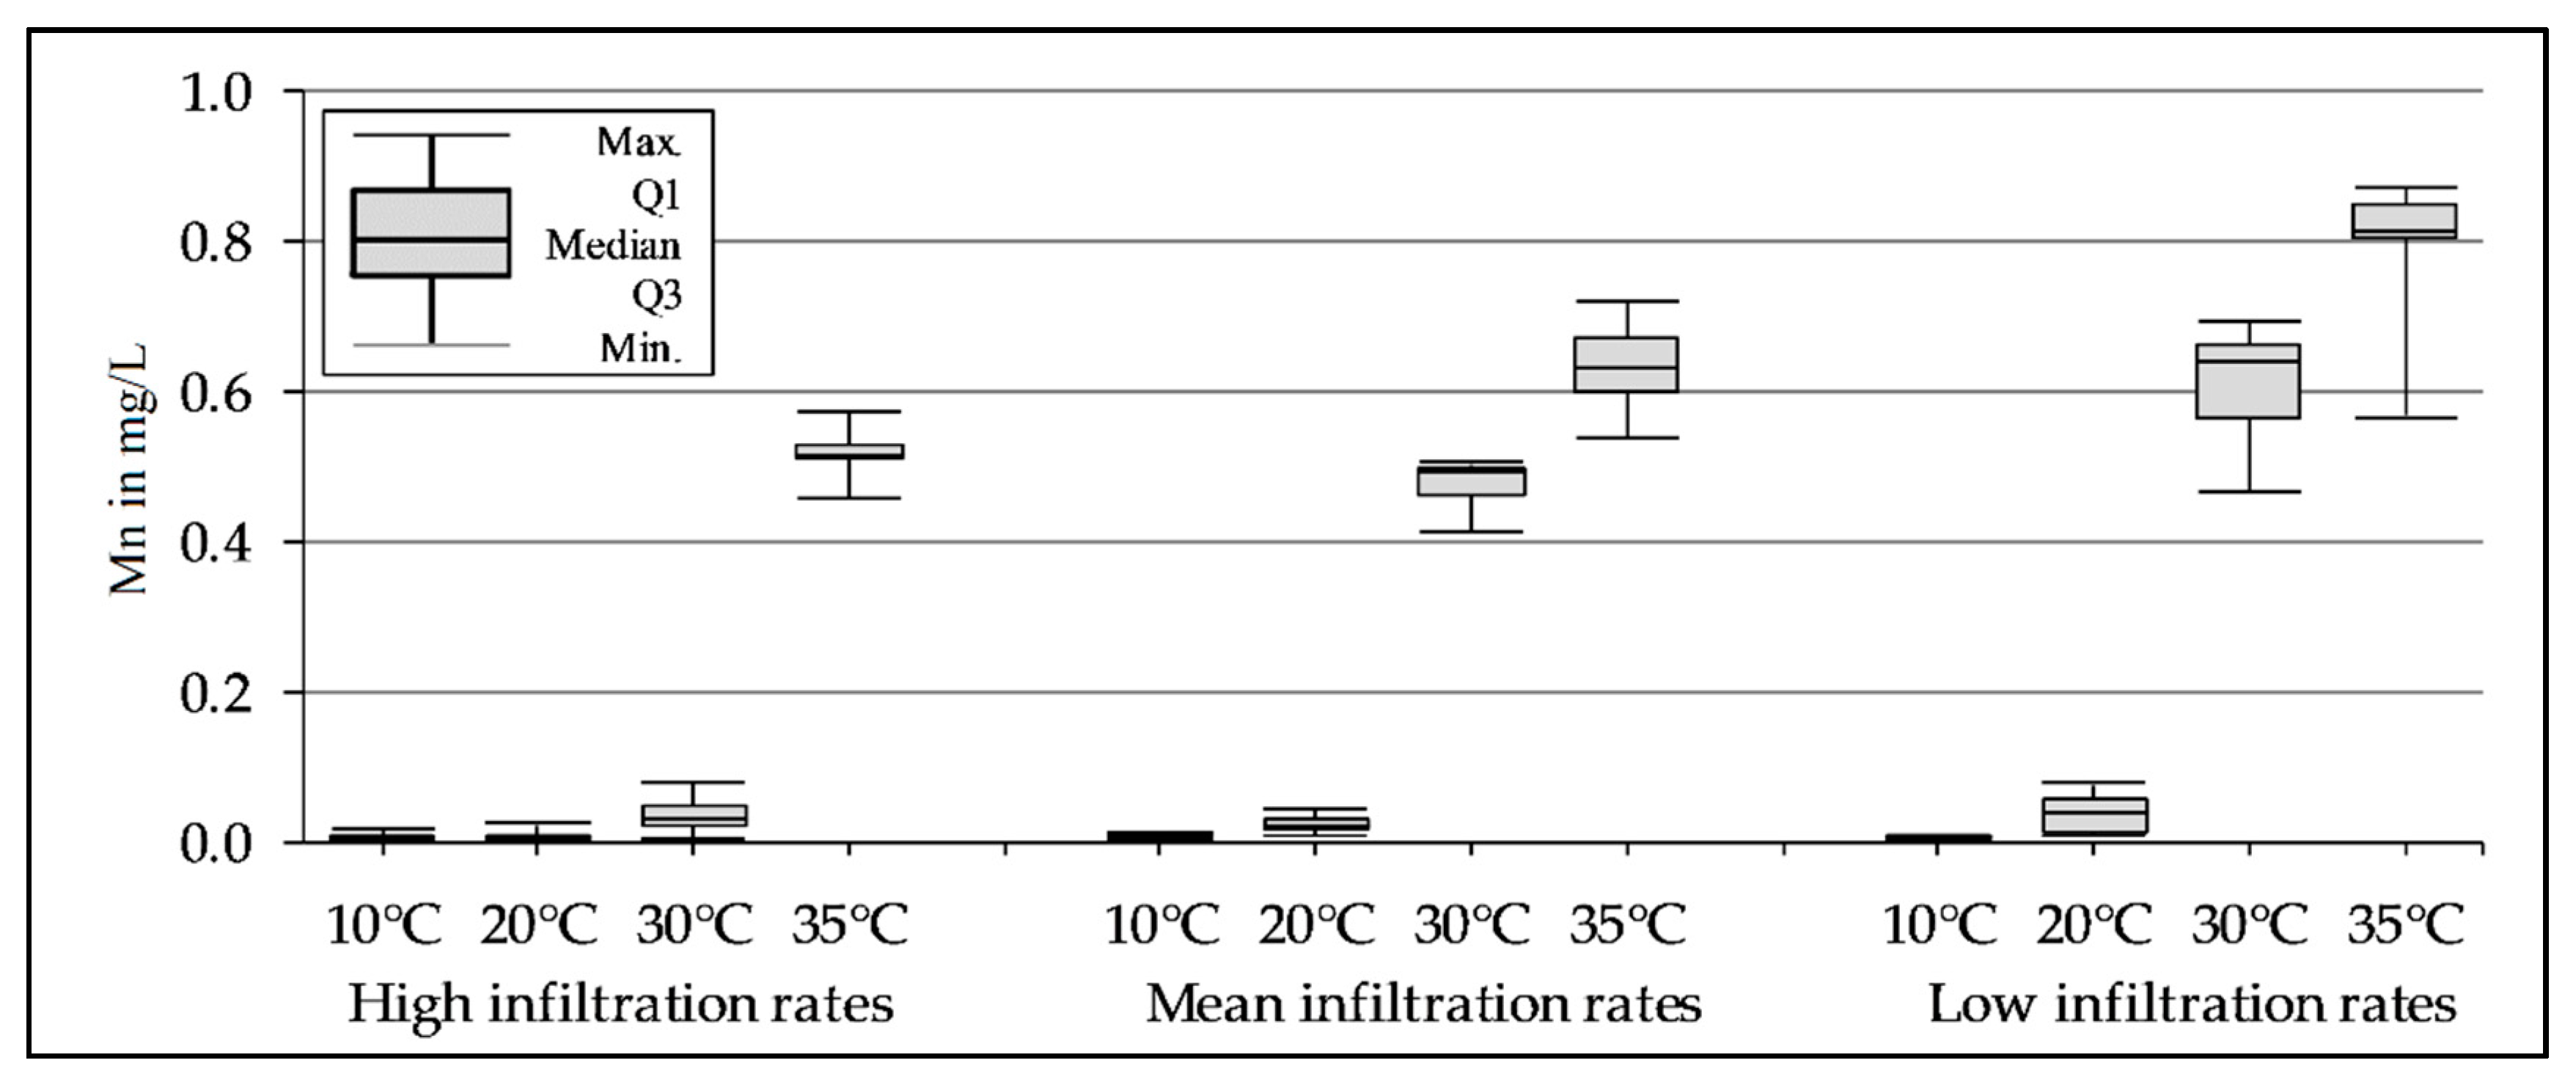
3.3. Mn Release Depending on the Temperature and Infiltration Rate During the Column Experiments

To investigate the effect of varying temperature to the Mn release from the riverbed, three columns filled with riverbed sediments run at 10, 20, 30, and 35 °C. Varying flow rates of 1, 2, and 4 mL/min represented low, mean and high infiltration rates for all four temperature regimes.
After changing temperature and/or flow, the Mn concentration changed within 5 pore volumes (PV) and was stable after 8–10 PV (e.g., Figure S4). At high infiltration rates (4 mL/min, pore velocity va = 3.44·10−5 m/s, residence time tR = 8.1 h) and water temperatures of 10 and 20 °C, the median Mn release was <<0.01 mg/L (n = 9 and 12) and almost neglectable (Figure 5, Table S6). At 30 °C, the Mn concentration increased in the outflow slightly to around 0.03 mg/L (median, n = 21). Only at 35 °C was Mn released (median of 0.51 mg/L).
At mean infiltration rates (2 mL/min, va = 1.72·10−5 m/s, tR = 16.2 h), a minor Mn release was observed at 10 and 20 °C with median values of 0.01 and 0.02 mg/L, respectively. With increasing temperature, the Mn release increased to 0.49 mg/L at 30 °C (median, n = 9) and 0.63 mg/L at 35 °C (median, n = 15).
For low infiltration rates (1 mL/min, va = 8.60·10−6 m/s, tR = 32.4 h) at 10 °C, no Mn release was observed. The Mn concentration in the outflow increased already at 20 °C and stabilized around 0.04 mg/L (median, n = 21). After the temperature rose to 30 °C, Mn increased sharply to ≈0.64 mg/L (median, n = 18, Figure S4). The subsequent temperature increase to 35 °C led to around 0.81 mg/L Mn (median, n = 15).
The Mn concentration in the feed water maximally was 0.02 mg/L (median <LOD, limit of detection 0.005 mg/L Mn, n = 23).

3.4. Reduction Constants of O2, NO3 and Mn(IV) as Electron Acceptors

The observed Mn release was reproduced by chemical modeling with PHREEQC using Monod-type rate formulations and the reduction rate constants kox, knit, and kmn as calibration parameters. The reduction rate constant kox showed the highest value at high infiltration rates and at a temperature of 10 °C (1.8 × 10⁻⁹ mol/(L·s)). With increasing temperature, kox decreased down to 4.3 × 10⁻¹⁰ mol/(L·s) (Table 2, Figure S5). For mean and low infiltration rates, a similar behavior was found. The lowest kox of 9.7 × 10⁻¹¹ mol/(L·s) was determined at low infiltration rates and a temperature of 35 °C.
For the reduction rate constant knit, no distinct pattern was found. At high infiltration rates, knit remained constant at 5.0 × 10⁻¹² mol/(L·s). For mean and low infiltration rates at 10 °C, knit was in the same order of magnitude (7.0 and 2.0 × 10⁻¹² mol/(L·s)). With increasing temperatures of 20 °C and 30 °C, knit increased up to 2.8 × 10⁻¹⁰ mol/(L·s). At 35 °C, knit decreased again at the mean and low infiltration rates.
The reduction rate constant kmn at 10 °C and 20 °C for high, mean and low infiltration rates were in the order of magnitude of 1.0 to 2.5 × 10⁻¹⁰ mol/(L·s). At 30 °C and high infiltration rates, kmn remained in this range. For mean and low infiltration rates at 30 °C and 35 °C, kmn increased to 1.4–2.0 × 10⁻⁹ mol/(L·s).
With a percental error of −2.4% compared to the measured values (median, −6.7–0.2%, 10–90%ile, n = 12), the simulated DO concentrations showed the largest errors of relevant redox parameters (Table S7). The error for NO3 with a median of 0.4% and a span of −0.6 to 1.1% (10 to 90%ile, n = 12) was lower. With an error of 0.2%, the simulated Mn2+ concentrations showed the smallest median deviation but a comparable large span of −15.7 to 8.5% (n = 12). The median error for the simulated pH was −1.0% with a span of −8.7 to 1.7% (n = 12).

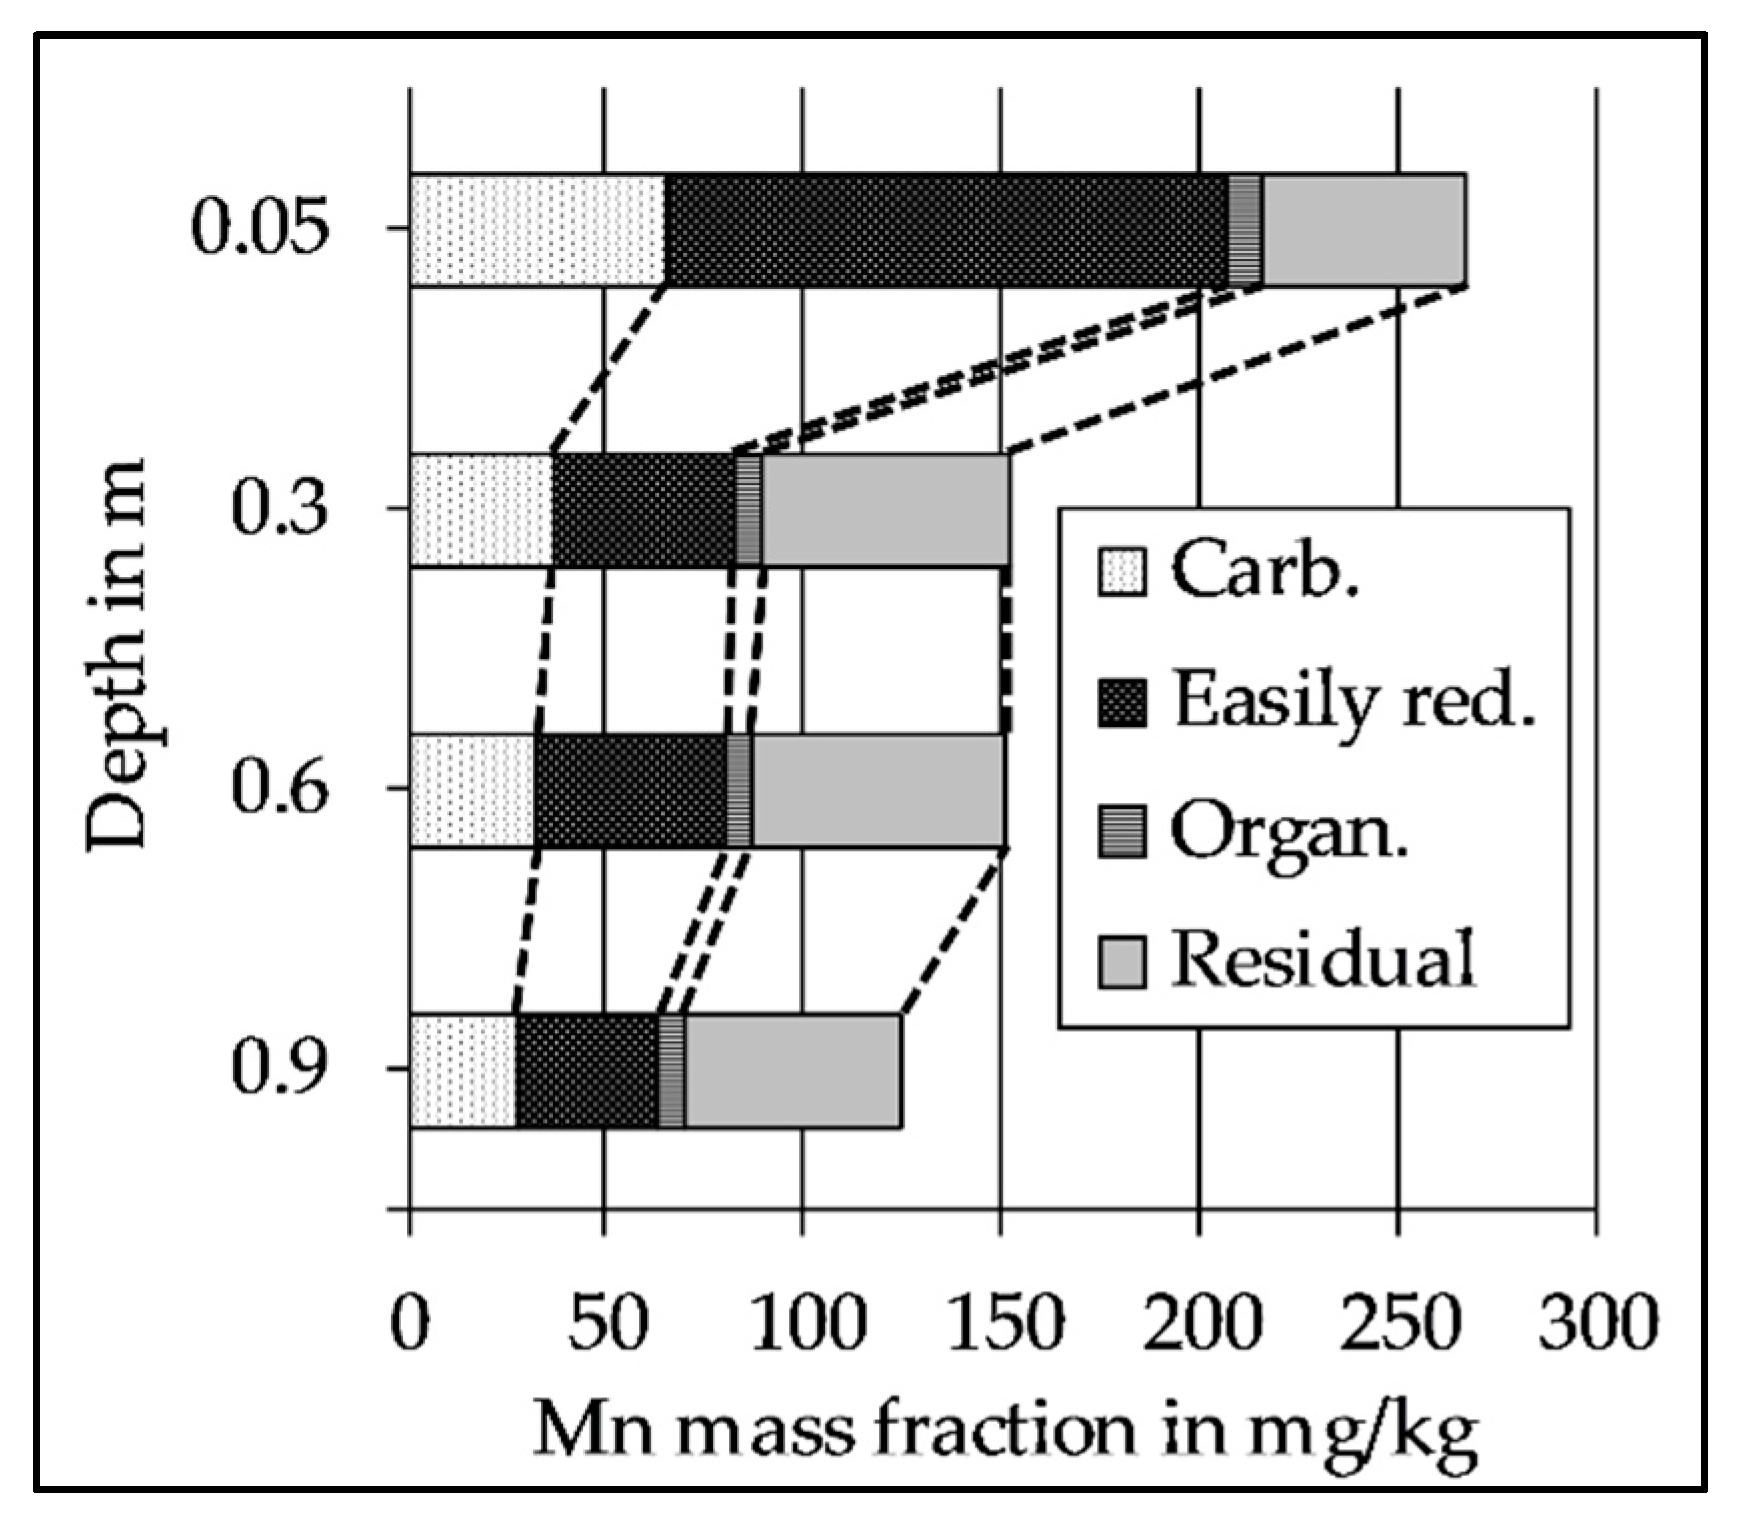
3.5. The Decrease of Easily Reducible Mn Along the Flow Path

To estimate the mobilization behavior of Mn, a 4-step sequential extraction procedure was applied to the filling material of the three columns after the experiment. All three columns showed qualitatively similar results and all the following values represent median values with n = 3 (Table S8). The total Mn mass (Mntot, as the sum of all 4 extracted fractions) was around 270 mg/kg at the inlet after 0.05 m (Figure 6). Further along the flow path, the total Mn mass decreased to ≈150 mg/kg down to a minimum of ≈125 mg/kg the minimum at the outlet after 0.9 m. The total extractable Mn (microwave acid digestion) was around 112 mg/kg at the inlet and increased to 133, 250, and 473 mg/kg at the outlet (Table S8).
The mass fraction of soluble and carbonate bound Mn (“Carb.”) decreased from around 65 mg/kg to 30 mg/kg along the flow path. On a percentage base, the soluble and carbonate bound Mn always remained between 21–24% (Figure 7). Easily reducible Mn dropped from around 140 mg/kg (53% of the total mass) at the inlet to 36 mg/kg (<30%) after 0.9 m. Organically bound Mn (“Organ.”) remained stable between 6–9 mg/kg (3–5%). The residual Mn fraction was found almost constant at 51–64 mg/kg, but the percentage increased from around 20 to >40%.

4. Discussion

4.1. The Significance of the Calibrated Degradation Rate Constants

In order to use the results from the column experiment for a planned modeling of the transect, the observed Mn release was simulated using PHREEQC, focusing on relevant redox reactions. During an initial automated calibration with PEST, the inhibition constants Koxinhb_nit, Koxinhb_mn, and Knitinhb_mn did not change and were held fixed at the initial values during further calibration. Hence, only the reduction rate constants kox, knit and kmn were used for calibration.
The calibrated kox had an overall median value of 4.4 × 10⁻¹⁰ mol/(L·s) (n = 12, Table 2). These results are in fair agreement with results of Henzler et al. [14], who determined a kox of 2.0 × 10⁻¹⁰ mol/(L·s) for a bank filtration site at Lake Tegel in Berlin, Germany. Greskowiak et al. [31] used a kox of 1.52 × 10⁻¹⁰ mol/(L s) to simulate the consumption of DO at an infiltration pond in Berlin. Sharma et al. [33] used a more than ten times higher degradation rate with kox = 1.30 × 10⁻⁹ mol/(L·s) to simulate a transect at the RBF Waterworks Flehe in Düsseldorf, Germany. The average water temperature in their study was 13.5 °C and the BF traversed the ≈60 m wide stretch from the riverbank to the well within 60 days [33]. This corresponds to a pore velocity (va) of ≈1.2 × 10⁻⁵ m/s. Comparing this with the results of this study of kox = 8.65 × 10⁻¹⁰ mol/(L·s) at 10 °C and va ≈ 1.72 × 10⁻⁵ m/s, shows a good agreement, too.
The overall median value for the calibrated knit was 2.1 × 10⁻¹¹ mol/(L·s) (n = 12, Table 2). This is about five times lower than a reported knit of 1.0 × 10⁻¹⁰ mol/(L·s) by Henzler et al. [14] and 40-times lower than what Sharma et al. [33] reported with a knit = 8.0 × 10⁻¹⁰ mol/(L·s). Prommer and Stuyfzand [37] and Greskowiak et al. [31] reported a knit of 1.0 and 3.8 × 10⁻¹¹ mol/(L·s), which correspond to the values of this study.
For kmn, the overall median value was 2.3 × 10⁻¹⁰ mol/(L·s) (n = 12, Table 2). This is ≈100- to 1000-times higher than the reported data of kmn = 1.7 × 10⁻¹² mol/(L·s) [14], 8.9 × 10⁻¹³ mol/(L·s) [31] or 3.0 × 10⁻¹³ mol/(L·s) [35]. Matsunga et al. [35] modeled a column experiment and included the precipitation of Rhodochrosite (MnCO3) as a sink for Mn2+. The precipitation of MnCO3 as a sink for Mn2+ has also been shown at other bank filtration sites [38]. Taking the average water quality of the outflow from the columns at 20 °C (pH 8, 50 mg/L Ca2+, 120 mg/L HCO3) and mean infiltration rates for equilibrium in PHREEQC, the water would be supersaturated with respect to MnCO3 with around 0.1 mg/L Mn2+ in equilibrium (saturation index 0.77). Thus, the precipitation ofMnCO3 would probably control the Mn concentration for longer residence times but did not along the columns due to slow reaction kinetics [39]. As a consequence, the given kmn seem to be representative in simulating an Mn release from a (highly reactive) riverbed, but are not suited for simulations of longer transects, in which an Mn reduction is likely to occur within the aquifer and can be controlled by MnCO3 precipitation, for example.

4.2. Impact of the Discharge on the Observed Redox Patterns

River discharge indirectly affects the quality of the BF in multiple ways. Low river discharge and related low water levels are often associated with less dilution of wastewater effluent, higher loads of dissolved organic matter (DOM), prolonged travel times, and they are expected to promote DO consumption [19]. Low discharge periods further result in reduced shear stress at the riverbed and more intense clogging at the bottom of the water body, which can also promote anoxic conditions [40,41]. High discharge conditions/floods can cause a partial removal of the clogging layer, resulting in a better hydraulic conductivity of the riverbed and higher water levels lead to higher infiltration rates [18]. Increased flow velocities combined with shorter flow paths cause shorter travel times. Furthermore, high flow conditions and shorter travel times were linked to an increased input of TOC (total organic carbon) [42,43].
To the authors’ knowledge, very few researchers have addressed the impact of river discharge to Mn release from the riverbed or the Mn concentration in the BF. Previous work has focused on the impact of discharge on the degradation of natural organic matter (NOM) and DO consumption. In a column experiment, von Rohr et al. [44] evaluated the role of discharge on NOM degradation during RBF. The experiment was set up at 20 °C and with four flow rates, resulting in residence times (tR) of 40, 20, 12, and 4 h. At residence times of 4 h, oxic conditions persisted through the entire column. With a residence time of 20 h, anoxic conditions were observed within 20 cm along the flow path. Results from the column experiment in this study confirm the flow/infiltration rate dependency of oxygen depletion. At 20 °C and at high infiltration rates (tR = 8.1 h), the columns remained oxic, but became anoxic at residence times of 16–32 h (Table S9). Diem et al. [32] found river discharge to be correlated with an enhanced POM input and higher DO consumption during flood events. Due to a generally higher DO consumption at temperatures >15 °C, the correlation was only found to be true for temperatures below 15 °C [17]. Diem et al. [32] successfully modeled these observations using higher DO consumption for higher discharges. In this study, rates for DO consumption (kox) in PHREEQC were highest at high infiltration rates and decreased at mean and low infiltration rates, which is in agreement with the findings of Diem et al. [32].
Groffman and Crossey [45] found slightly increasing Mn concentrations within the upper aquifer section during periods with lower discharge at Rio Calaveras (New Mexico, USA). The observations from the transect in Dresden-Tolkewitz did not reveal a clear discharge/water level dependency. Figure 4 indicates an increasing Mn concentration at OW 1-1 during a long-lasting low discharge period of the Elbe River in 2015. In addition, Mn at OW 2-1 and 3-1 increased during this period (Figures S2 and S3). Contrary to this, at OW 1-1 Mn, already decreased when the water level was still low, whereas Mn further increased at OW 2-1 and 3-1. Hence, the field observations did not indicate a mere discharge-dependency of Mn along the transect.
Manganese release during the column experiment with riverbed material was low at 10 °C and 20 °C for the high, mean, and low infiltration rates (Figure 5). At 30 and 35 °C, Mn increased from high to mean and again to low infiltration rates. Correlation coefficients of −0.99 for 30 °C and −0.87 for 35 °C were very high and significant (p < 0.05, data not shown).
The relation between river discharge and the release of Mn from the riverbed is ambiguous. On the one hand, the literature data [44] and the results from the column experiments in this study suggest that periods of low discharge lead to elevated Mn concentrations due to lower infiltration rates and longer residence times. Contrary to that, e.g., Diem et al. [17] found higher river discharge to be correlated with higher DO consumption, which was also reinforced by modeling [32]. Since higher DO consumption is often related to increasing Mn concentrations during RBF [1], periods of higher discharge may cause Mn release. Shorter travel times during periods of high river discharge would interfere with this. In addition, the results of the column experiment in this study showed that the temperature effect distorts this discharge dependency (see the following paragraph).

4.3. Manganese Release Controlled by Temperature

A temperature-dependent fluctuation of the Mn concentration has been shown at many bank filtration sites [1,15,38,46,47,48,49,50].
Manganese along the transect in Dresden-Tolkewitz varied the most at OW 1-1, 2-1, and 2-2 (Figure 4 and Figure S2), which are closest to the Elbe river (≈20 m). Furthermore, those observation points showed the largest temperature fluctuations (Figure 2 and Figure 3). Especially the Mn concentration at OW 1-1, which is closest to the riverbank, responded to higher water temperatures during low and mean flow conditions (Figures S6–S8). However, at the more distant observation points (OW 1-3, 2-3 and OW 3), Mn was comparably stable during the year. This can partially be attributed to extended travel times (compared to the average travel times), especially towards the deeper observation points. Similar observations were made at RBF sites at the Lot river in France [51] and at the Glatt river in Switzerland [50]. Both found a seasonal trend for Mn, with elevated concentrations during the warm summer months and lower concentrations during the winter season. For the RBF site in Dresden-Tolkewitz, no seasonal trend for Mn was observed at any OW, which is probably due to the long sampling interval. Temperature seems to be a very important factor controlling initial Mn release from the riverbed in Dresden-Tolkewitz, but more research is needed in order to assess this parameter quantitatively. Since the assessment is only possible during temporary constant, low water levels [23], future research must focus on the rare long-lasting low discharge periods.
Results from the column experiments indicate a high-temperature dependency of Mn release. At constant infiltration rates (high, mean, or low), the Mn concentration increased with increasing temperature (Figure 5). At high infiltration rates (residence time tR = 8.1 h), the Mn concentration increased in the outflow sharply from 0.03 to 0.51 mg/L at higher temperatures of 30 and 35 °C. For mean and low infiltration rates (tR = 16.2 and 32.4 h), a similar Mn increase happened after water temperature increased from 20 to 30 °C. The calibrated kmn in this study reflects the sharp increases, showing a 20-fold increase from 30 to 35 °C at high infiltration rates as well as a 15- and 17-times higher kmn after temperature raised from 20 to 30 °C at mean and low infiltration rates (Table 2).
Bourg and Bertin [51] reported a threshold water temperature of 10 °C to trigger a microbiologically mediated Mn reduction. Hoehn et al. [52] observed extensive denitrification, stronger reducing conditions, and elevated Mn concentrations at water temperatures above 14 °C. The findings of the column experiment support these observations. At water temperatures of 10 °C, the Mn release was neglectable for all infiltration rates. In addition, the results from the column experiment and the determined reduction constants can expand these statements for Mn containing riverbeds. For high infiltration rates of 1.1 m3/(m2·d) and above, Mn release from the riverbed is unlikely for surface water temperatures that are typical in temperate climate zones (≤30 °C). If the BF infiltrates at infiltration rates in the order of magnitude of 0.6 m3/(m2·d) and below, water temperatures >20 °C are sufficient to trigger extensive Mn release from the riverbed.

4.4. Depletion of the Mn Reservoir Within the Riverbank

After the column experiments were finished, a sequential extraction procedure was applied to the riverbed sediment (Figure 6 and Figure 7).
Manganese contents in the riverbed sediments are very site-specific and cannot be limited to regional or climatic differences [53]. Moreover, the Mn content depends highly on the grain size. Jain and Ram [54] and Jain and Sharma [55] found 230–650 mg/kg Mn in the grain size fraction with the highest mass fraction (36%, d = 0.21–0.25 mm), whereas the grain size fraction with the lowest mass fraction of only 2% (d < 0.075 mm) contained up to 2800 mg/kg Mn.
However, the order of magnitude of ≈150–300 mg/kg Mn was low compared to many other riverbed sediments, e.g., 960 mg/kg Mn in the Rhine sediment [56] or 1700 mg/kg Mn in the Garonne [53]. Nonetheless, the values are in agreement with the former analysis of the riverbed sediment from the Elbe river. Grischek et al. [57] determined ≈50 mg/kg Mntot (n = 3) in riverbed sediment at Torgau around 100 km downstream of Dresden. In Dresden-Tolkewitz at the same transect, Paufler [58] determined around 250 mg/kg Mntot (n = 3) for the upper 5 cm of the riverbed and only ≈80 mg/kg Mntot (n = 6) for the depths 5–30 cm.
At the Glatt river in Switzerland, von Gunten et al. [13] hypothesized that the repetitive exhaustion of Mn deposits in the river sediments towards the fall season could be one reason for seasonal Mn variations.
Integrating the released Mn from one column over the entire experimental time in this study (all four infiltration rates and three temperature regimes), this results in an overall mass output of approx. 140 mg Mn (data not shown). After the experiment, the total Mn mass was around 1600 mg within a column (Figure 7, ≈10 kg of sediment, calculated dry weight). Considering the large deviations from the total extractable Mn (Table S8), and the potential error of sequential extraction procedures [59], conclusions about a possible exhaustion of Mn during the column experiment would not be reasonable. Taking the observations of Paufler [58] into account, the observed steps along the columns in this study may reflect the natural stratification within the riverbed, rather than a depletion of the Mn reservoir.
With around 5 mg/L of filterable substances and a Mn content of 3500 mg/kg of the suspended matter (both median, n > 100 [25]), the Elbe river water contains approximately 0.04 mg/L Mn, which is bound to suspended solids. Considering the mean abstraction of 22,000 m3/d in Dresden-Tolkewitz and a bank filtrate portion of 70%, about 15,500 m3 BF are abstracted per day. Assuming an even distribution of suspended solids in the infiltrating river water, the Elbe river delivers around 6 × 10⁵ mg Mn per day into the riverbed, which is probably not entirely reducible. With the same BF portion and the observed Mn release of 0.1 to 0.8 mg/L, the Mn output from the riverbed into the BF would be 1.5 × 10⁶ to 1.2 × 10⁷ mg/d. Thus, a depletion of the Mn reservoir seems to be possible but more research is needed to evaluate this conclusively.

4.5. Implications for (River-)Bank Filtration Sites

Current climate forecasts show an increase in river discharge seasonality, with increasing high discharges and decreasing low discharges. Furthermore, global mean river water temperatures are projected to increase by 0.8–1.6 °C by 2100 with Europe, the United States, parts of southern Africa, Australia and eastern China facing the largest changes [60].
The results of this study showed stronger Mn release for low infiltration rates compared to high infiltration rates when the temperature was equal. RBF sites in regions with a colder climate probably will not notice different Mn concentrations in the future, since Mn release was neglectable at water temperatures of 10 °C for all infiltration rates. In regions with a temperate climate, Mn release from the riverbed is unlikely during high discharge events with infiltration rates ≥1.1 m3/(m2·d). At infiltration rates of around 0.6 m3/(m2·d) and below, water temperatures >20 °C are sufficient to trigger extensive Mn release from the riverbed. Thus, RBF sites in temperate climate zones at rivers with large seasonal discharge fluctuations may have to deal with increasing Mn concentrations in the future. Additionally, the effect of seasonal rivers showing the highest water temperatures during low discharge periods [60] may intensify this effect. Surface water temperatures of >30 °C are rare in the temperate climate zone.
Typically, rivers in dry/arid or tropical climates like the Nile river [61] or the Mekong river [62] show temperatures in this order of magnitude. Thus, the results of this study suggest that RBF sites in arid or tropical climate zones should be aware of an intensified Mn release from the riverbed in the future, which can distort the quality of the BF even at high infiltration velocities. In such cases, biological post-treatment could be a viable option to remove Mn from the BF [63].
Nonetheless, elevated temperatures are not necessarily causing elevated Mn concentrations during RBF. During the summer in 2003, maximum river water temperatures of 25 °C were observed at the RBF site at the Rhine river in Germany. No elevated Mn concentrations were detected, although anaerobic conditions developed within the aquifer [64].
The field observations in Dresden-Tolkewitz and at other RBF sites prove that an actual high Mn release from the riverbed must not necessarily lead to elevated Mn concentrations in the pumped raw water [1,47]. Sorption, (re-)oxidation, and precipitation along the flow path are potential sinks for Mn released from a riverbed. Especially if the aquifer material contains Mn(hydr)oxides, Mn concentrations of the BF can change largely along the flow path due to the high affinity of Mn2+ for Mn(hydr)oxides [63]. Thus, a long distance between the riverbank and the pumping wells could be of advantage to buffer elevated Mn concentrations and temperature. However, such an advantage may have to be checked against a lower portion of abstracted bank filtrate and a higher portion of potentially Fe- and Mn-rich landside groundwater [65].
For the RBF site in Dresden-Tolkewitz, the temperature was found to be the driving force for Mn release from the riverbed and high discharge and infiltration rates limit the release at lower temperatures. In Dresden-Tolkewitz, the mean infiltration rate is around 0.2 m3/(m2·d), which corresponds to the infiltration rate that was found to be sustainable for RBF sites along the River Rhine, Elbe, and other European Rivers [66]. After Soares [67], an infiltration rate of 0.32 m3/(m2·d) would be still sustainable for this RBF site. Ahrns [23] observed infiltration rates up to 0.95 m3/(m2·d) in Dresden-Tolkewitz. Thus, the investigated low infiltration rate of 0.3 m3/(m2·d) in this study represents the mean infiltration rate in Dresden-Tolkewitz. Such low infiltration rates must go in hand with temperatures above 20 °C to trigger a Mn release. With increasing temperatures, the infiltration rate becomes less important and at water temperatures around 30 °C, an extensive Mn release from the riverbed can be expected even at mean infiltration rates.

5. Conclusions

Current climate forecasts project increasing river discharge seasonality and water temperatures and thus, are thought-provoking at many (river)bank filtration sites. Water quality data of a 10-year time span from a monitoring transect at the RBF site Dresden-Tolkewitz and accompanying column experiments were used to assess the potential Mn release from the riverbed with respect to the climate-related variables, temperature and discharge. Temperature was found to be more important than discharge. Low infiltration rates 0.3 m3/(m2·d) required temperatures above 20 °C to trigger Mn release. With an increasing temperature, the discharge becomes less important and at 30 °C, the infiltration rates of ≈0.6 m3/(m2·d) can already cause an extensive Mn release from the riverbed. The subsequent modeling of the column experiment with PHREEQC resulted in degradation rates for DO that are applicable at other RBF sites for several water temperatures and flow velocities. The determined Mn reduction rate constants are appropriate to simulate an Mn release from riverbed sediments but are not suited for simulations in which Mn reduction is likely to occur within the aquifer and the Mn concentrations can be limited by precipitation, for example.

Supplementary Materials

The following are available online at https://www.mdpi.com/2073-4441/10/10/1476/s1,
  • Figure S1: The flow scheme of the column experiments inside the thermostatic cabinets;
  • Figure S2: The Mn concentration at OW 2 during a low discharge period in 2015;
  • Figure S3: The Mn concentration at OW 3 during a low discharge period in 2015;
  • Figure S4: The increase of the Mn concentration within the first 5 PV at 30 °C and 1 mL/min after lowering from 2 mL/min, Median, 10- and 90-%ile (each n = 3);
  • Figure S5: The calibrated reduction rate constants for the column experiment;
  • Figure S6: The Mn concentration at OW 1 during a low discharge period in 2007;
  • Figure S7: The Mn concentration at OW 2 during a low discharge period in 2007;
  • Figure S8: The Mn concentration at OW 3 during a low discharge period in 2007;
  • Table S1: The chemical reagents and analytical conditions for the optimized BCR sequential extraction procedure [27,28];
  • Table S2: The input data of the column in PHREEQC;
  • Table S3: The statistical data of the Elbe river at Dresden for the entire observation period 2006–2016 [25];
  • Table S4: The monthly and 10-year median values of selected parameters along all three OW’s of the transect in the WW Dresden-Tolkewitz for the entire observation period 2006–2016;
  • Table S5: The statistical data for the low flow period in 2015;
  • Table S6: The statistical data for Mn release during the column experiment with riverbed sediment from the Elbe river in Dresden-Tolkewitz, Q1 and Q3 correspond to the 1st and 3rd quartile;
  • Table S7: The comparison of the measured parameter values during the column experiment and the modeled parameters from PHREEQC;
  • Table S8: The results and statistical data of the sequential extraction of the riverbed sediment after the column experiment (n = 3 for each statistical data);
  • Table S9: The median concentration of DO in the outflow during the column experiment.

Author Contributions

Data curation, M.B., N.S. and T.F.; Investigation, S.P. and T.G.; Methodology, S.P. and T.G.; Project administration, T.G.; Modeling, S.P.; Supervision, S.P. and T.G.; Writing—original draft, S.P.; Writing—review & editing, S.P., T.G., M.B., N.S. and T.F.

Funding

This research received no external funding.

Acknowledgments

This work was performed as cooperation between DREWAG Netz GmbH and the Division of Water Sciences at the University of Applied Sciences Dresden. The authors are grateful to the ESF for the financial support to S. Paufler (grant no. 200031585). The paper was completed by further analysis supported by the AquaNES project, which has received funding from the European Union’s Horizon 2020 research and innovation programme under grant agreement No. 689450.

Conflicts of Interest

The authors declare no conflict of interest. The founding sponsors had no role in the design of the study; in the collection, analyses, or interpretation of data; in the writing of the manuscript, and in the decision to publish the results.

References

  1. Bourg, A.C.M.; Bertin, C. Biogeochemical processes during the infiltration of river water into an alluvial aquifer. Environ. Sci. Technol. 1993, 27, 661–666. [Google Scholar] [CrossRef]
  2. Grischek, T.; Schoenheinz, D.; Worch, E.; Hiscock, K. Bank filtration in Europe – An overview of aquifer conditions and hydraulic controls. In Management of Aquifer Recharge for Sustainability; Dillon, P., Ed.; Balkema Publ.: Lisse, The Netherlands, 2002; pp. 485–488. [Google Scholar]
  3. Ray, C.; Melin, G.; Linsky, R.B. Riverbank Filtration—Improving Source Water Quality; Kluwer: Dordrecht, The Netherlands, 2003; 364p. [Google Scholar]
  4. Regnery, J.; Barringer, J.; Wing, A.D.; Hoppe-Jones, C.; Teerlink, J.; Drewes, J.E. Start-up performance of a full-scale riverbank filtration site regarding removal of DOC, nutrients, and trace organic chemicals. Chemosphere 2015, 127, 136–142. [Google Scholar] [CrossRef] [PubMed]
  5. Blanford, W.; Boving, T.; Al-Ghazawi, Z.; Shawaqfah, M.; Al-Rashdan, J.; Saadoun, I.; Schijven, J.; Ababneh, Q. River bank filtration for protection of Jordanian surface and groundwater. In Proceedings of the World Environmental and Water Resources Congress 2010: Challenges of Change; ASCE: Providence, RI, USA, 2010; pp. 776–781. [Google Scholar]
  6. Ghodeif, K.; Paufler, S.; Grischek, T.; Wahaab, R.; Souaya, E.; Bakr, M.; Abogabal, A. Riverbank filtration in Cairo, Egypt—Part I: Installation of a new riverbank filtration site and first monitoring results. Environ. Earth. Sci. 2018, 77, 270. [Google Scholar] [CrossRef]
  7. Hu, B.; Teng, Y.; Zhai, Y.; Zuo, R.; Li, J.; Chen, H. Riverbank filtration in China: A review and perspective. J. Hydrol. 2016, 541, 914–927. [Google Scholar] [CrossRef]
  8. Sandhu, C.; Grischek, T.; Kumar, P.; Ray, C. Potential for riverbank filtration in India. Clean Technol. Environ. Policy 2011, 13, 295–316. [Google Scholar] [CrossRef]
  9. Hiscock, K.M.; Grischek, T. Attenuation of groundwater pollution by bank filtration. J. Hydrol. 2002, 266, 139–144. [Google Scholar] [CrossRef] [Green Version]
  10. Kuehn, W.; Mueller, U. Riverbank filtration—An overview. J. Am. Water Works Assoc. 2000, 92, 60–69. [Google Scholar] [CrossRef]
  11. Bertelkamp, C.; Reungoat, J.; Cornelissen, E.R.; Singhal, N.; Reynisson, J.; Cabo, A.J.; van der Hoek, J.P.; Verliefde, A.R.D. Sorption and biodegradation of organic micropollutants during river bank filtration: A laboratory column study. Water Res. 2014, 52, 231–241. [Google Scholar] [CrossRef] [PubMed]
  12. Bourg, A.C.M.; Richard-Raymond, F. Spatial and temporal variability in the water redox chemistry of the M27 experimental site in the Drac river calcareous alluvial aquifer (Grenoble, France). J. Contam. Hydrol. 1994, 15, 93–105. [Google Scholar] [CrossRef]
  13. Von Gunten, H.R.; Karametaxas, G.; Krähenbühl, U.; Kuslys, M.; Giovanoli, R.; Hoehn, E.; Keil, R. Seasonal biogeochemical cycles in riverborne groundwater. Geochim. Cosmochim. Acta 1991, 55, 3597–3609. [Google Scholar] [CrossRef]
  14. Henzler, A.F.; Greskowiak, J.; Massmann, G. Seasonality of temperatures and redox zonations during bank filtration—A modeling approach. J. Hydrol. 2016, 535, 282–292. [Google Scholar] [CrossRef]
  15. Gross-Wittke, A.; Gunkel, G.; Hoffmann, A. Temperature effects on bank filtration: Redox conditions and physical–chemical parameters of pore water at Lake Tegel, Berlin, Germany. J. Water Clim. Chang. 2010, 1, 55–66. [Google Scholar] [CrossRef]
  16. Van’t Hoff, J.H.; Cohen, E. Studies on Chemical Dynamics; Studien zur chemischen Dynamik, Etudes de dynamique chemique; Frederik Muller & Co.: Amsterdam, The Netherlands, 1896; p. 128. [Google Scholar]
  17. Diem, S.; von Rohr, M.R.; Hering, J.G.; Kohler, H.-P.E.; Schirmer, M.; von Gunten, U. NOM degradation during river infiltration: Effects of the climate variables temperature and discharge. Water Res. 2013, 47, 6585–6595. [Google Scholar] [CrossRef] [PubMed]
  18. Schoenheinz, D.; Grischek, T. Behavior of dissolved organic carbon during bank filtration under extreme climate conditions. In Riverbank Filtration for Water Security in Desert Countries; Shamrukh, M., Ed.; NATO Science for Peace and Security Series C: Environmental Security; Springer: Dordrecht, The Netherlands, 2011; pp. 151–168. ISBN 978-94-007-0025-3. [Google Scholar]
  19. Sprenger, C.; Lorenzen, G.; Hulshoff, I.; Gruetzmacher, G.; Ronghang, M.; Pekdeger, A. Vulnerability of bank filtration systems to climate change. Sci. Total Environ. 2011, 409, 655–663. [Google Scholar] [CrossRef] [PubMed]
  20. EEA European Environment Agency. Climate Change, Impacts and Vulnerability in Europe 2016; An Indicator-Based Report; Publications Office of the European Union: Luxembourg, 2017; ISBN 978-92-9213-835-6. [Google Scholar]
  21. Kreienkamp, F.; Spekat, A.; Enke, W. WEREX V: Provision of an Ensemble of Regional Climate Projections for Saxony, 1st ed.; Saxon State Office for the Environment, Agriculture and Geology: Dresden, Germany, 2011; 71p. (In German) [Google Scholar]
  22. Grischek, T.; Bartak, R. Riverbed clogging and sustainability of riverbank filtration. Water 2016, 8, 604. [Google Scholar] [CrossRef]
  23. Ahrns, J. Modeling the Exchange between Surface Water and Groundwater Using Temperature as Tracer. Diploma Thesis, Dresden University of Applied Sciences, Dresden, Germany, 2008. (In German). [Google Scholar]
  24. DVGW German Technical and Scientific Association for Gas and Water. Guideline DVGW W 112 (A), Principles of Groundwater Sampling from Groundwater Monitoring Wells; WVGW: Bonn, Germany, 2011; ISSN 0176-3504. (In German) [Google Scholar]
  25. SMUL Saxon State Ministry for Environment and Agriculture. Water Quality Data for the Elbe River. 2018. Available online: www.umwelt.sachsen.de/umwelt/wasser/ (accessed on 15 June 2018).
  26. WSV Federal Waterways and Shipping Administration. Hydrological Information System. 2018. Available online: www.wsv.de (accessed on 14 June 2018).
  27. Rauret, G.; López-Sánchez, J.F.; Sahuquillo, A.; Rubio, R.; Davidson, C.; Ure, A.; Quevauviller, P. Improvement of the BCR three step sequential extraction procedure prior to the certification of new sediment and soil reference materials. J. Environ. Monit. 1999, 1, 57–61. [Google Scholar] [CrossRef] [PubMed]
  28. Sutherland, R.A.; Tack, F.M.G. Determination of Al, Cu, Fe, Mn, Pb and Zn in certified reference materials using the optimized BCR sequential extraction procedure. Anal. Chim. Acta 2002, 454, 249–257. [Google Scholar] [CrossRef]
  29. Farnsworth, C.E.; Hering, J.G. Inorganic geochemistry and redox dynamics in bank filtration settings. Environ. Sci. Technol. 2011, 45, 5079–5087. [Google Scholar] [CrossRef] [PubMed]
  30. Parkhurst, D.L.; Appelo, C.A.J. Description of Input and Examples for Phreeqc Version 3: A Computer Program for Speciation, Batch-Reaction, One-Dimensional Transport, and Inverse Geochemical Calculations. U.S. Geological Survey Techniques and Methods, book 6, chap. A43; 2013. Available online: http://pubs.usgs.gov/tm/06/a43 (accessed on 14 June 2018).
  31. Greskowiak, J.; Prommer, H.; Massmann, G.; Nutzmann, G. Modeling seasonal redox dynamics and the corresponding fate of the pharmaceutical residue phenazone during artificial recharge of groundwater. Environ. Sci. Technol. 2006, 40, 6615–6621. [Google Scholar] [CrossRef] [PubMed]
  32. Diem, S.; Cirpka, O.A.; Schirmer, M. Modeling the dynamics of oxygen consumption upon riverbank filtration by a stochastic–convective approach. J. Hydrol. 2013, 505, 352–363. [Google Scholar] [CrossRef]
  33. Sharma, L.; Greskowiak, J.; Ray, C.; Eckert, P.; Prommer, H. Elucidating the effects on seasonal variations of biogeochemical turnover rates during riverbank filtration. J. Contam. Hydrol. 2012, 428–429, 104–115. [Google Scholar] [CrossRef]
  34. Doherty, J. PEST. Model-Independent Parameter Estimation, 7th ed.; Watermark Numerical Computing: Brisbane, Australia, 2018. [Google Scholar]
  35. Matsunaga, T.; Karametaxas, G.; von Gunten, H.R.; Lichtner, P.C. Redox chemistry of iron and manganese minerals in river-recharged aquifers: A model interpretation of a column experiment. Geochim. Cosmochim. Acta 1993, 57, 1691–1704. [Google Scholar] [CrossRef]
  36. Mayer, K.U.; Benner, S.G.; Frind, E.O.; Thornton, S.F.; Lerner, D.N. Reactive transport modeling of processes controlling the distribution and natural attenuation of phenolic compounds in a deep sandstone aquifer. J. Contam. Hydrol. 2001, 53, 341–368. [Google Scholar] [CrossRef]
  37. Prommer, H.; Stuyfzand, P.J. Identification of temperature-dependent water quality changes during a deep well injection experiment in a pyritic aquifer. Environ. Sci. Technol. 2005, 39, 2200–2209. [Google Scholar] [CrossRef] [PubMed]
  38. Massmann, G.; Pekdeger, A.; Merz, C. Redox processes in the Oderbruch polder groundwater flow system in Germany. Appl. Geochem. 2004, 19, 863–886. [Google Scholar] [CrossRef]
  39. Jensen, D.L.; Boddum, J.K.; Tjell, J.C.; Christensen, T.H. The solubility of rhodochrosite (MnCO3) and siderite (FeCO3) in anaerobic aquatic environments. Appl. Geochem. 2002, 17, 503–511. [Google Scholar] [CrossRef]
  40. Heeger, D. Investigation of Clogging in Rivers. Ph.D. Thesis, Dresden University of Technology, Dresden, Germany, 1987. (In German). [Google Scholar]
  41. Grischek, T. Management of bank filtration sites along the Elbe River. Ph.D. Thesis, Faculty of Forestry, Geo and Hydro Sciences, Dresden University of Technology, Dresden, Germany, 2003. (In German). [Google Scholar]
  42. Eckert, P.; Rohns, H.P.; Irmscher, R. Dynamic processes during bank filtration and their impact on raw water quality. In Proceedings of the Aquifer Recharge, Recharge Systems for Protecting and Enhancing Groundwater Resources, Berlin, Germany, 11–16 June 2005; pp. 17–22. [Google Scholar]
  43. Eckert, P.; Irmscher, R. Over 130 years of experience with riverbank filtration in Düsseldorf, Germany. Aqua 2006, 55, 283–291. [Google Scholar] [CrossRef]
  44. Von Rohr, R.M.; Hering, J.G.; Kohler, H.P.; von Gunten, U. Column studies to assess the effects of climate variables on redox processes during riverbank filtration. Water Res. 2014, 61, 263–275. [Google Scholar] [CrossRef] [PubMed]
  45. Groffman, A.R.; Crossey, L.J. Transient redox regimes in a shallow alluvial aquifer. Chem. Geol. 1999, 161, 415–442. [Google Scholar] [CrossRef]
  46. Bourg, A.C.M.; Darmendrail, D.; Ricour, J. Geochemical filtration of riverbank and migration of heavy metals between the Deûle River and the Ansereuilles alluvion-chalk aquifer (Nord, France). Geoderma 1989, 44, 229–244. [Google Scholar] [CrossRef]
  47. Jacobs, L.A.; von Gunten, H.R.; Keil, R.; Kuslys, M. Geochemical changes along a river-groundwater infiltration flow path: Glattfelden, Switzerland. Geochim. Cosmochim. Acta 1988, 52, 2693–2706. [Google Scholar] [CrossRef]
  48. Kedziorek, M.; Geoffriau, S.; Bourg, A.C.M. Organic matter and modeling redox reactions during river bank filtration in an alluvial aquifer of the Lot River, France. Environ. Sci. Technol. 2008, 42, 2793–2798. [Google Scholar] [CrossRef] [PubMed]
  49. Maeng, S.K.; Ameda, E.; Sharma, S.K.; Grützmacher, G.; Amy, G.L. Organic micro-pollutant removal from wastewater effluent-impacted drinking water sources during bank filtration and artificial recharge. Water Res. 2010, 44, 4003–4014. [Google Scholar] [CrossRef] [PubMed]
  50. Von Gunten, H.R.; Karametaxas, G.; Keil, R. Chemical processes in infiltrated riverbed sediments. Environ. Sci. Technol. 1994, 28, 2087–2093. [Google Scholar] [CrossRef] [PubMed]
  51. Bourg, A.C.M.; Bertin, C. Seasonal and spatial trends in manganese solubility in an alluvial aquifer. Environ. Sci. Technol. 1994, 28, 868–876. [Google Scholar] [CrossRef] [PubMed]
  52. Hoehn, E.; Zobrist, J.; Schwarzenbach, R.P. Infiltration of river water into groundwater—Hydrogeological and hydrochemical investigations in the Glattal. Gas Wasser Abwasser 1983, 63, 401–410. (In German) [Google Scholar]
  53. Martin, J.M.; Meybeck, M. Elemental mass-balance of material carried by major world rivers. Mar. Chem. 1979, 7, 173–206. [Google Scholar] [CrossRef]
  54. Jain, C.K.; Ram, D. Adsorption of lead and zinc on bed sediments of the river Kali. Water Res. 1997, 31, 154–162. [Google Scholar] [CrossRef]
  55. Jain, C.K.; Sharma, M.K. Adsorption of Cadmium on bed sediments of River Hindon: Adsorption models and kinetics. Water Air Soil Poll. 2001, 137, 1–19. [Google Scholar] [CrossRef]
  56. Förstner, U.; Salomons, W. Trace metal analysis on polluted sediments, II. Evaluation of environmental impact. Environ. Technol. Lett. 1980, 1, 506–517. [Google Scholar] [CrossRef]
  57. Grischek, T.; Dehnert, J.; Nestler, W.; Treutler, H.C.; Freyer, K. Description of system conditions during bank filtration through accompanying drilling core investigations. In Proceedings of the 2nd Dresdner Grundwasserforschungstage, Dresden, Germany, 25 March 1993; pp. 207–220. (In German). [Google Scholar]
  58. Paufler, S. Management of Riverbank Filtration Sites to Reduce Manganese Concentrations in Raw Water. Diploma Thesis, Dresden University of Applied Sciences, Dresden, Germany, 2015. (In German). [Google Scholar]
  59. Nirel, P.M.V.; Morel, F.M.M. Pitfalls of sequential extractions. Water Res. 1990, 24, 1055–1056. [Google Scholar] [CrossRef]
  60. Van Vliet, M.T.H.; Franssen, W.H.P.; Yearsley, J.R.; Ludwig, F.; Haddeland, I.; Lettenmaier, D.P.; Kabat, P. Global river discharge and water temperature under climate change. Glob. Environ. Chang. 2013, 23, 450–464. [Google Scholar] [CrossRef]
  61. Abdalla, F.A.; Shamrukh, M. Quantification of river Nile/Quaternary aquifer exchanges via riverbank filtration by hydrochemical and biological indicators, Assiut, Egypt. J. Earth Syst. Sci. 2016, 125, 1697–1711. [Google Scholar] [CrossRef]
  62. Buschmann, J.; Berg, M.; Stengel, C.; Sampson, M.L. Arsenic and manganese contamination of drinking water resources in Cambodia: Coincidence of risk areas with low relief topography. Environ. Sci. Technol. 2007, 41, 2146–2152. [Google Scholar] [CrossRef] [PubMed]
  63. Brandhuber, P.; Clark, S.; Knocke, W.; Tobiason, J. (Eds.) Guidance for the Treatment of Manganese; Water Research Foundation: Denver, Colorado, 2013; 148p, ISBN 978-1-60573-187-2. [Google Scholar]
  64. Rohns, H.P.; Forner, C.; Eckert, P.; Irmscher, R. Efficiency of riverbank filtration considering the removal of pathogenic microorganisms of the River Rhine. In Recent Progress in Slow Sand and Alternative Biofiltration Processes; Gimbel, R., Graham, N.J.D., Collins, M.R., Eds.; IWA Publishing: London, UK, 2006; pp. 539–546. ISBN 9781843391203. [Google Scholar]
  65. Grischek, T.; Paufler, S. Prediction of iron release during riverbank filtration. Water 2017, 9, 317. [Google Scholar] [CrossRef]
  66. Grischek, T.; Schoenheinz, D.; Eckert, P.; Ray, C. Sustainability of river bank filtration: Examples from Germany. In Groundwater Quality Sustainability; Maloszewski, P., Witczak, S., Malina, G., Eds.; Taylor & Francis Group: London, UK, 2012; pp. 213–227. [Google Scholar]
  67. Soares, M. The influence of high infiltration rates, suspended sediment concentration and sediment grain size on river and lake bed clogging. Ph.D. Thesis, Technical University of Berlin, Berlin, Germany, 2015. [Google Scholar]
Figure 1. (a) The location of the RBF Waterworks Dresden-Tolkewitz, (b) Observed transect between the Elbe river and the pumping well (PW), (c) Location of the observation wells within the transect and sampling point of the riverbed sediment for the column experiment, (d) cross-section of the transect and locations of the observation points for each observation well (OW).
Water 10 01476 g001
Figure 2. The mean values (n = 2) of the relevant redox parameters along the transect in February (Table S4).
Water 10 01476 g002
Figure 3. The mean values (n = 2) of the relevant redox parameters along the transect in September (Table S4).
Water 10 01476 g003
Figure 4. The Mn concentration at OW 1 during a low discharge period in 2015.
Water 10 01476 g004
Figure 5. The mean Mn concentration in the outflow of the columns with riverbed sediment for high, mean, and low infiltration rates (4, 2 and 1 mL/min) at different temperatures (see Table S6 for no. of samples), Q1 and Q3 correspond to the 1st and 3rd quartile.
Water 10 01476 g005
Figure 6. The median values (n = 3) of the absolute Mn mass fractions along the column.
Water 10 01476 g006
Figure 7. The median values (n = 3) of percentage Mn mass fractions along the columns.
Water 10 01476 g007
Table 1. The experimental design of the column experiment.
Column1, 2, and 3
Temperature in °C10203035
Flow in mL/min124124124124
n Samples/event333333333333
Table 2. The calibrated reduction constants of this study compared to the literature data.
This Study
TemperaturevakoxknitkmnNotes
m/smol/(L·s)mol/(L·s)mol/(L·s)
10 °C8.60 × 10−65.18 × 10−102.00 × 10−122.50 × 10⁻¹⁰Low infiltration rate (1 mL/min)
1.72 × 10−58.65 × 10−107.00 × 10−122.00 × 10⁻¹⁰Mean infiltration rate (2 mL/min)
3.44 × 10−51.80 × 10−95.00 × 10−121.00 × 10⁻¹⁰High infiltration rate (4 mL/min)
20 °C8.60 × 10−62.17 × 10−101.53 × 10−101.10 × 10⁻¹⁰Low infiltration rate (1 mL/min)
1.72 × 10−54.50 × 10−105.50 × 10−111.50 × 10⁻¹⁰Mean infiltration rate (2 mL/min)
3.44 × 10−58.90 × 10−105.00 × 10−121.00 × 10⁻¹⁰High infiltration rate (4 mL/min)
30 °C8.60 × 10−61.02 × 10−101.88 × 10−101.90 × 10⁻⁹Low infiltration rate (1 mL/min)
1.72 × 10−52.14 × 10−102.80 × 10−102.20 × 10⁻⁹Mean infiltration rate (2 mL/min)
3.44 × 10−54.70 × 10−105.00 × 10−121.00 × 10⁻¹⁰High infiltration rate (4 mL/min)
35 °C8.60 × 10−69.70 × 10−111.35 × 10−101.62 × 10⁻⁹Low infiltration rate (1 mL/min)
1.72 × 10−52.14 × 10−103.50 × 10−111.40 × 10⁻⁹Mean infiltration rate (2 mL/min)
3.44 × 10−54.28 × 10−105.00 × 10−121.95 × 10⁻⁹High infiltration rate (4 mL/min)
10%ile1.13 × 10−105.00 × 10−121.00 × 10⁻¹⁰
Median4.39 × 10−102.10 × 10−112.25 × 10⁻¹⁰
90%ile8.88 × 10−101.85 × 10−101.95 × 10⁻⁹
n121212
Literature Data
TemperaturevakoxknitkmnSource
m/smol/(L·s)mol/(L·s)mol/(L·s)
VariableVariable1.52 × 10−103.81 × 10−118.91 × 10⁻¹³[31]
VariableVariable2.00 × 10−101.00 × 10−101.70 × 10⁻¹²[14]
22 °C7.60 × 10−63.50 × 10−83.40 × 10−83.00 × 10⁻¹³[35]
n.a.n.a.3.98 × 10−103.98 × 10−116.31 × 10⁻¹⁴[36]
VariableVariable1.57 × 10−91.00 × 10⁻¹¹n.a.[37]
VariableVariable1.30 × 10−98.00 × 10⁻¹⁰n.a.[33] for DOC
VariableVariable1.90 × 10−111.20 × 10⁻¹¹n.a.[33] for SOM
n.a.—not available, va—pore velocity.

