Removal of Natural Organic Matter and Organic Micropollutants during Riverbank Filtration in Krajkowo, Poland
by

Krzysztof Dragon
1,*, 
Józef Górski
1,
Roksana Kruć
1,
Dariusz Drożdżyński
2 and
Thomas Grischek
3 1
Department of Hydrogeology and Water Protection, Institute of Geology, Adam Mickiewicz University in Poznań, ul. Bogumiła Krygowskiego 12, 61-680 Poznań, Poland
2
Department of Pesticide Residue Research, Plant Protection Institute–National Research Institute, ul. Władysława Węgorka 20, 60-318 Poznań, Poland
3
Division of Water Sciences, University of Applied Sciences Dresden, Friedrich-List-Platz 1, 01069 Dresden, Germany
*
Author to whom correspondence should be addressed.
Water 2018, 10(10), 1457; https://doi.org/10.3390/w10101457
Submission received: 19 September 2018
/
Revised: 4 October 2018
/
Accepted: 11 October 2018
/
Published: 16 October 2018
(This article belongs to the Special Issue Efficiency of Bank Filtration and Post-Treatment)
Abstract
:The aim of this article is to evaluate the removal of natural organic matter and micropollutants at a riverbank filtration site in Krajkowo, Poland, and its dependence on the distance between the wells and the river and related travel times. A high reduction in dissolved organic carbon (40–42%), chemical oxygen demand (65–70%), and colour (42–47%) was found in the riverbank filtration wells at a distance of 60–80 m from the river. A lower reduction in dissolved organic carbon (26%), chemical oxygen demand (42%), and colour (33%) was observed in a horizontal well. At greater distances of the wells from the river, the removal of pharmaceutical residues and pesticides was in the range of 52–66% and 55–66%, respectively. The highest removal of pharmaceutical residues and pesticides was found in a well located 250 m from the river and no micropollutants were detected in a well located 680 m from the river. The results provide evidence of the high efficacy of riverbank filtration for contaminant removal.
1. Introduction
Alluvial aquifers supply a significant amount of drinking water in many countries because they offer easy access to groundwater and usually have feasible hydraulic properties. One method used for increasing quantities of groundwater in alluvial aquifers is riverbank filtration (RBF). RBF is a good alternative to the direct supply of surface water because the passage of water through the aquifer improves water quality. First in the riverbed and then in the aquifer, the water undergoes combined physical, biological, and chemical processes such as dissolution, sorption, redox processes, and biodegradation [1]. Additionally, mixing with ambient groundwater usually occurs to some degree [2,3].
Among the multiple benefits of RBF, the removal of natural organic matter (NOM), which is usually present in surface waters at relatively high concentrations, is significant. During RBF, an effective removal of dissolved organic carbon (DOC) of more than 50% can be achieved [4,5]. The significant reduction in chemical oxygen demand (COD) is also important [6]. It has been documented that the effective reduction of high molecular weight organic fractions is achieved during RBF, but with a lower removal of low molecular weight fractions [7,8]. This finding is important for further water treatment due to the formation of by-products during water chlorination [9].
The nature of the RBF system results in the quality of extracted water being dependent on surface water quality. Pollution of rivers is observed in many European countries due to agricultural activities in the catchment area [10,11], and wastewater effluents [12]. Water pollution by nitrates is common around the world [13,14], but in recent years, the pollution of surface water by pesticides has become increasingly problematic [15,16,17]. Other emerging contaminants in surface water are pharmaceutical residues [18,19]. Due to the high vulnerability of RBF systems to contamination by source surface water, it is crucial to determine organic micropollutant removal rates to properly manage RBF systems.
The main goals of the present article are: (1) the determination of the changes in water chemistry during passage through the aquifer in relation to the seasonal surface water chemistry fluctuations; (2) the investigation of the occurrence and behaviour of selected pesticides and pharmaceuticals; and (3) the investigation of removal efficacy of RBF depending on the distance of the wells from the river. For the present investigation, the Krajkowo site was selected, where an RBF system of vertical wells exists as well as a horizontal well (HW), with drains located below the river bottom.
2. Materials and Methods
2.1. Site Description
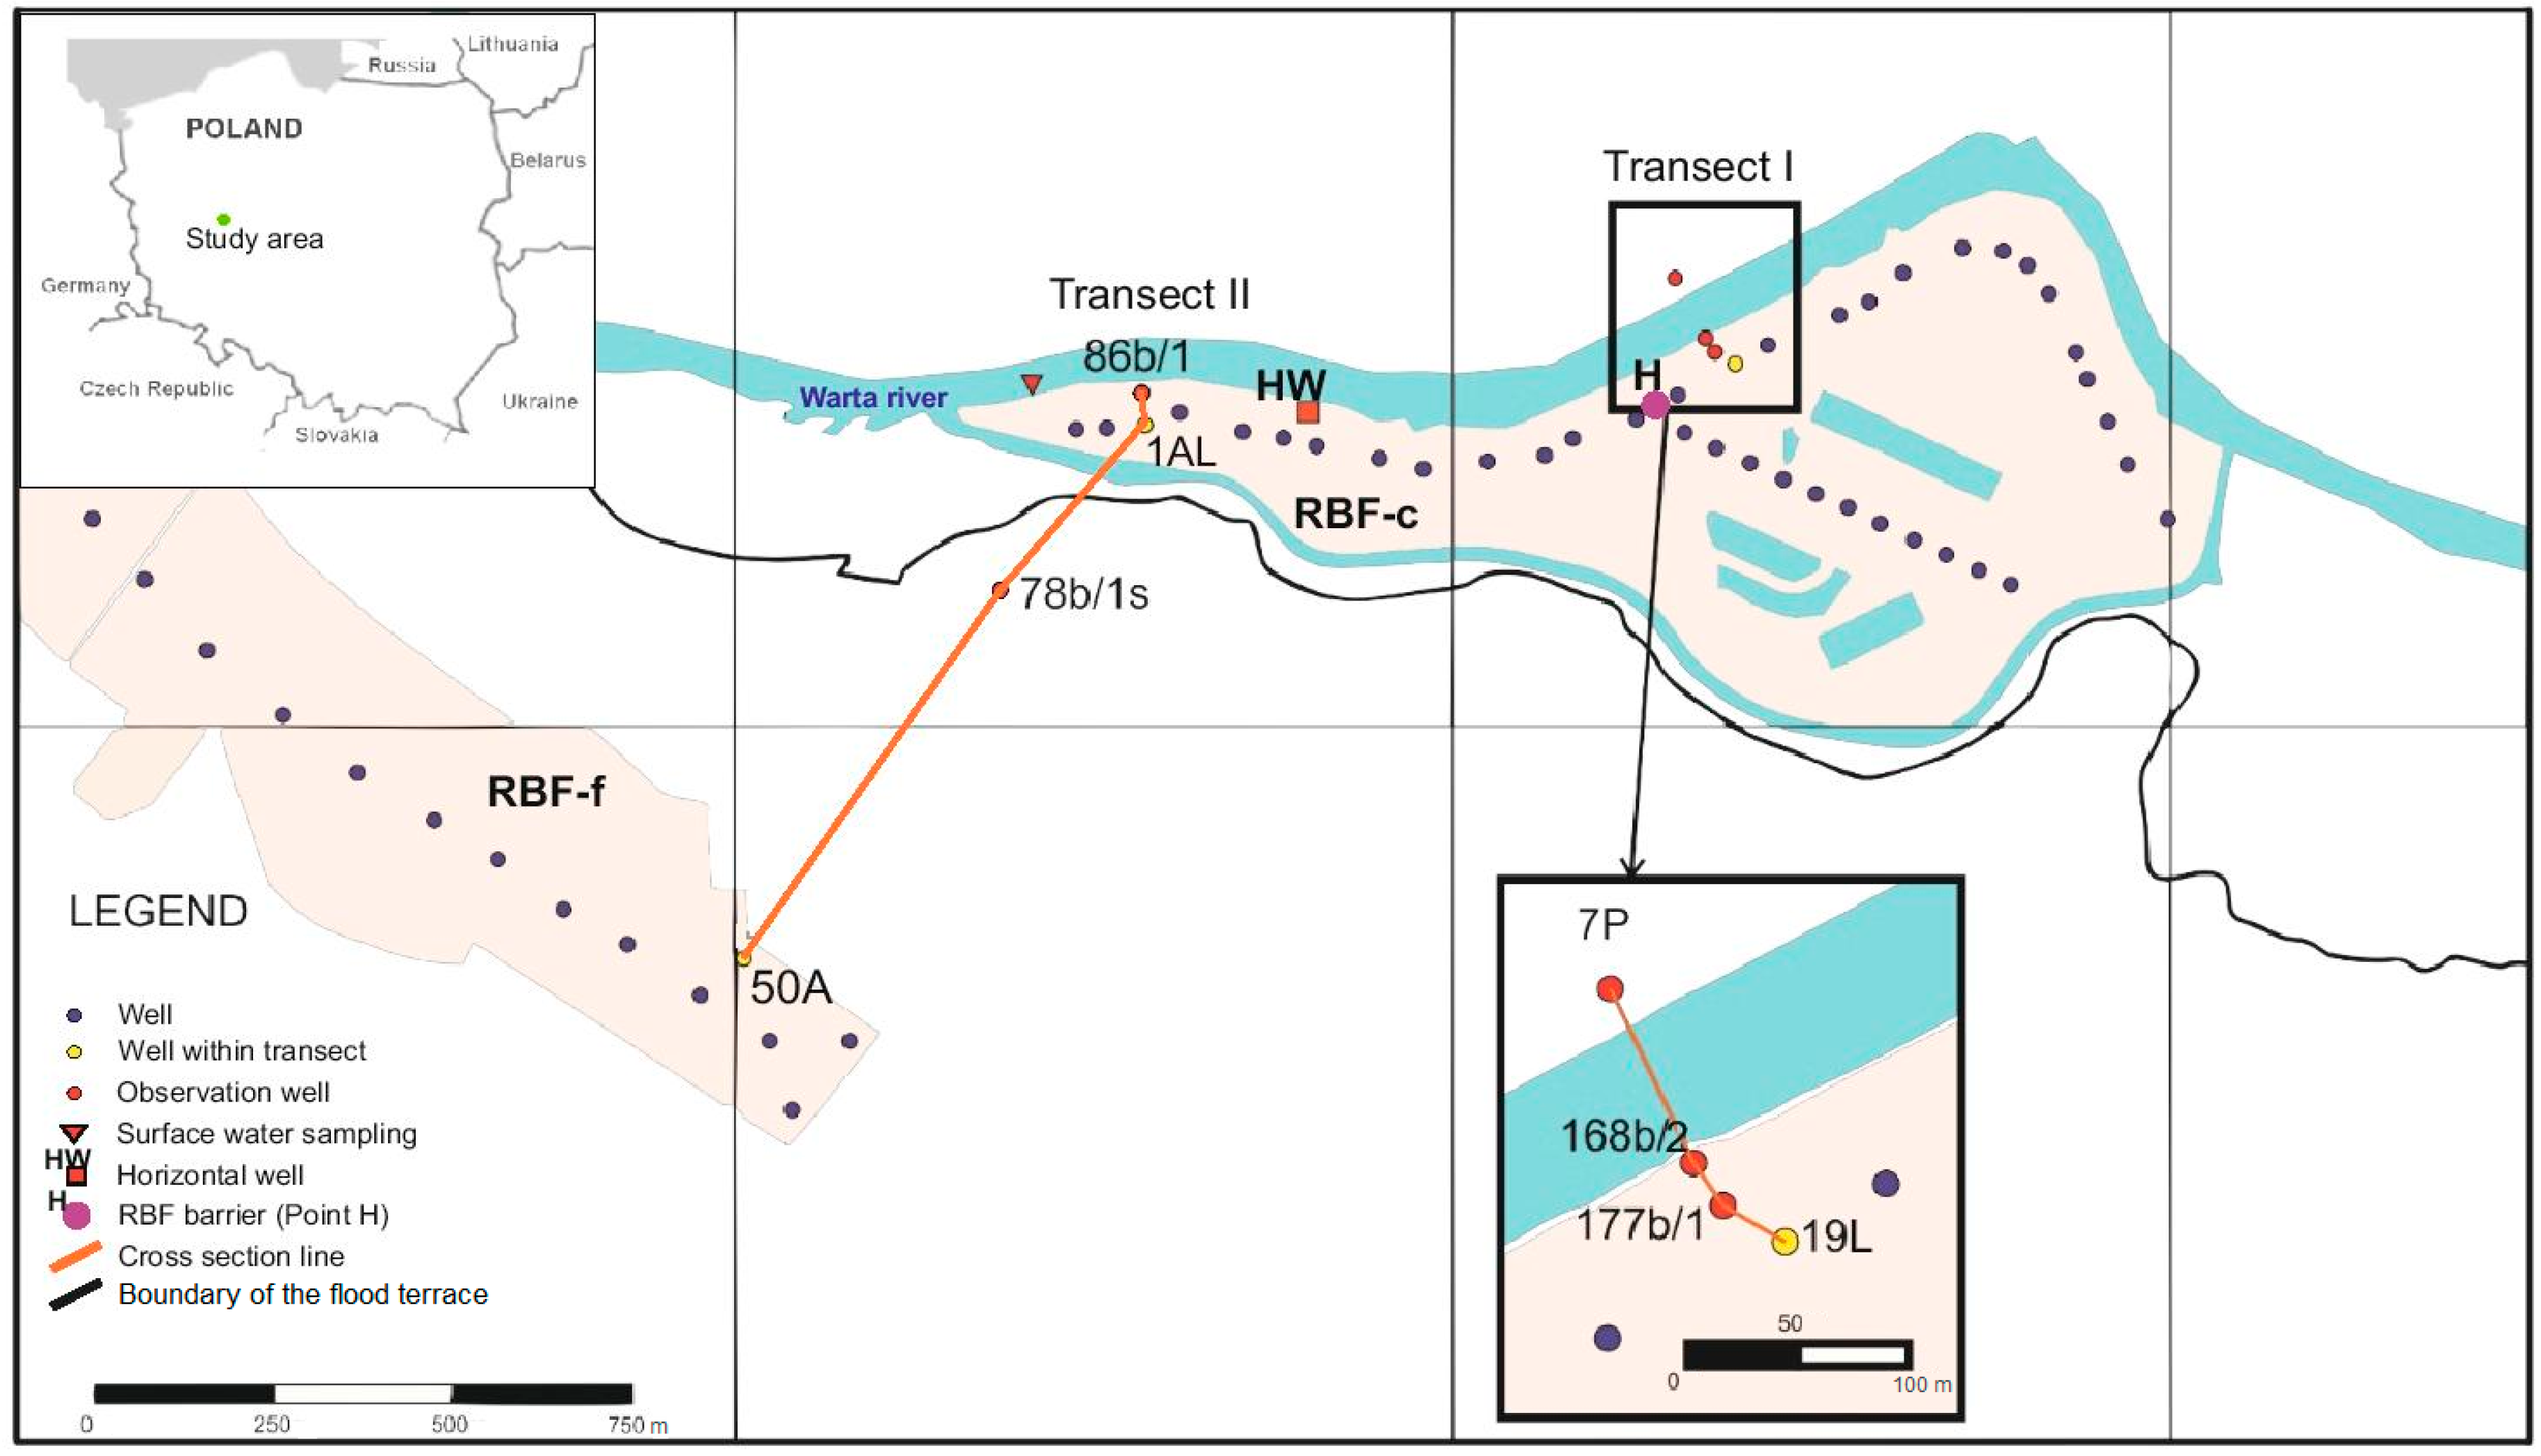
The Krajkowo well field supplies water to Poznań City and is located 30 km south of the city on Krajkowo Island (52°12’47”N 16°56’49”E) in the Warta River valley (Figure 1). The wells are located in the region where two main groundwater bodies overlap—The Wielkopolska Burried Valley (WBV) aquifer and the Warszawa-Berlin Ice Marginal Valley (WBIMV) aquifer. The well field is located in the region where the sediments forming these aquifers overlap, thereby providing good conditions for water exploitation (water-bearing sediments with a thickness of 30–40 m).
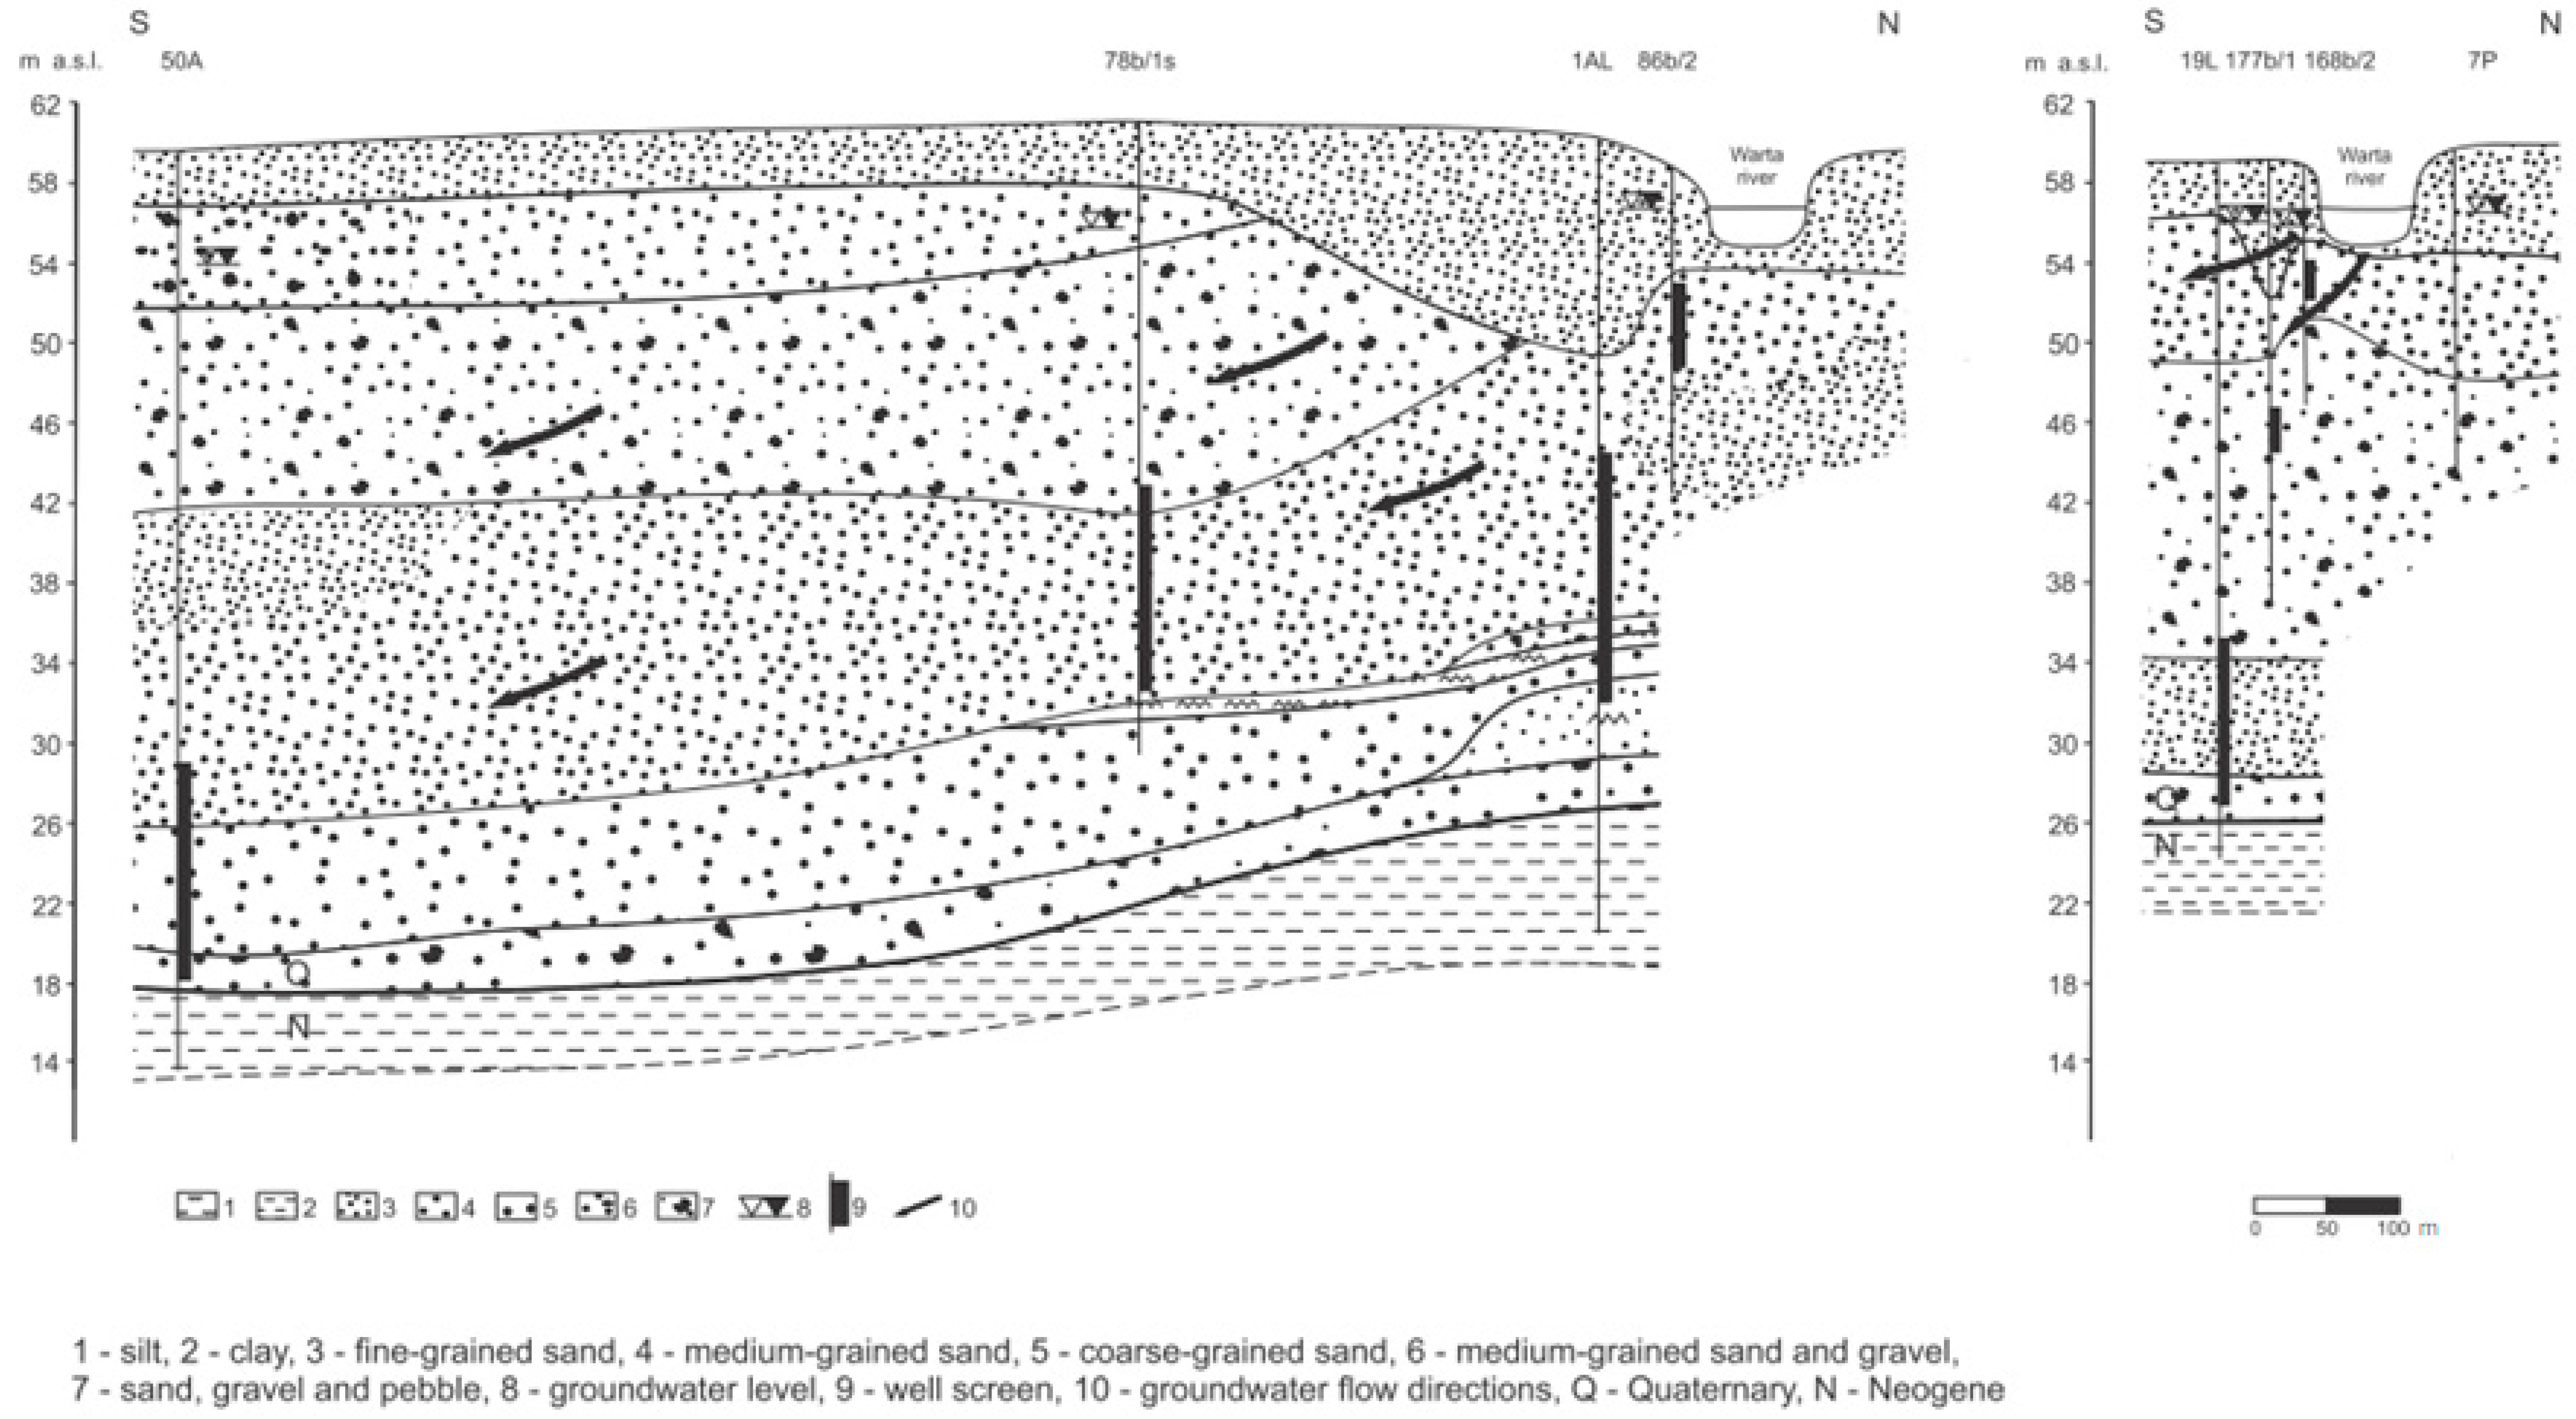
The lithology of the upper aquifer (WBIMV) is dominated by fine and medium sands of fluvial origin (to a depth of 10 m) and by coarse sands and gravels of fluvio-glacial origin in the deeper portions (to a depth of 20 m) (Figure 2). The deepest aquifer (WBV) is also composed of fine and medium fluvial sands in the upper part (to a depth of 25–30 m) and by coarse fluvio-glacial sands and gravels in the deepest part of the aquifer. Unconfined aquifer conditions dominate the study area, whereas in small regions aquitard composed of glacial tills are present between the WBV and WBIMV aquifers. The static water level is approximately 3–5 m below the ground surface.
Two different well types are used for water extraction (Figure 1):
- a gallery of 29 vertical wells (RBF-c) on the left side of the Warta River located at a distance of 60–80 m from the river channel (Figure 3),
- a horizontal well (HW) with drains placed 5 m below the river bottom (Figure 3). The drains were installed by excavation (dredging) of the riverbed sediments.
At longer distances from the river (between 400 and 1000 m), the second well group is located on a higher terrace. This group includes 56 vertical wells. This part of the well field is not continuously exploited. For this study, only the portion of the well group shown in Figure 1 (RBF-f) was continuously pumped for a period of two years.
2.2. Methods
To investigate groundwater chemistry changes in the RBF system, wells along two transects were selected for sampling. Transect I (shorter) was located between the river and the RBF-c production well and transect II (longer) was located between the river and the RBF-f well (Figure 1). The sampling points along transects were located along the flow paths, permitting the investigation of hydrochemical transformations associated with bank filtration at different distances from the source (river) water.
The monitoring programme included a one-year sampling campaign in two selected wells located on the transects (1AL and 19L) and an 18-month sampling campaign at sampling point H, which received mixed water from 15 wells located on the eastern side of the well gallery (Figure 1). Sampling was performed monthly between October 2016 and May 2018. Warta River water was also sampled during the investigation period. For pesticides and pharmaceuticals, 6 sampling series were planned at all sampling points located on the transects. In this article, the preliminary results from the first three series are presented along with the results of the first pilot sampling series for pharmaceutical residues. Additionally, Aquanet (waterworks operator) operational monitoring data were used, including the analyses of HW from January 2015 to May 2018.
The production wells were continuously pumped during sampling, while the observation wells were pumped using a portable pump (MP-1, Grundfos, Bjerringbro, Denmark). The water was stored in polyethylene bottles that were flushed three times before sampling. On the same day, watersamples were transported to the laboratory in a refrigerated container. Chemical analyses (Table 1) were performed at the Aquanet Laboratory (Poznań, Poland) with use of a Dionex ionic chromatograph (Thermo Fisher Scientific, Waltham, MA, USA) (NO3− and NO2−), a Varian Cary 50 spectrometer (Varian, Inc, Palo Alto, CA, USA) (NH4+), and a Shimadzu TOC-L-CSN IR spectrometer (Shimadzu Corporation, Kyoto, Japan), and filtered through a 0.45-μm membrane filter (DOC). Coliform bacteria were analysed with use of Quantitray Model 2X (IDEXX Laboratories, Westbrook, ME, USA). Pharmaceutical residues were measured in the laboratory of the Institute for Water Chemistry, TU Dresden (Germany), with an HPLC system (Agilent 1100, Agilent Technologies, Waldbronn, Germany) coupled with MS/MS detection (Sciex Q3200, AB Sciex Pte. Ltd, Woodlands, Singapore) after enrichment via solid-phase extraction. Pesticide measurements were performed at the laboratory of Plant Protection Institute, National Research Institute in Poznań (Department of Pesticide Residue Research) with use of liquid chromatograph (ACQUITY® UPLC, Waters, Milford, MA, USA).
3. Results
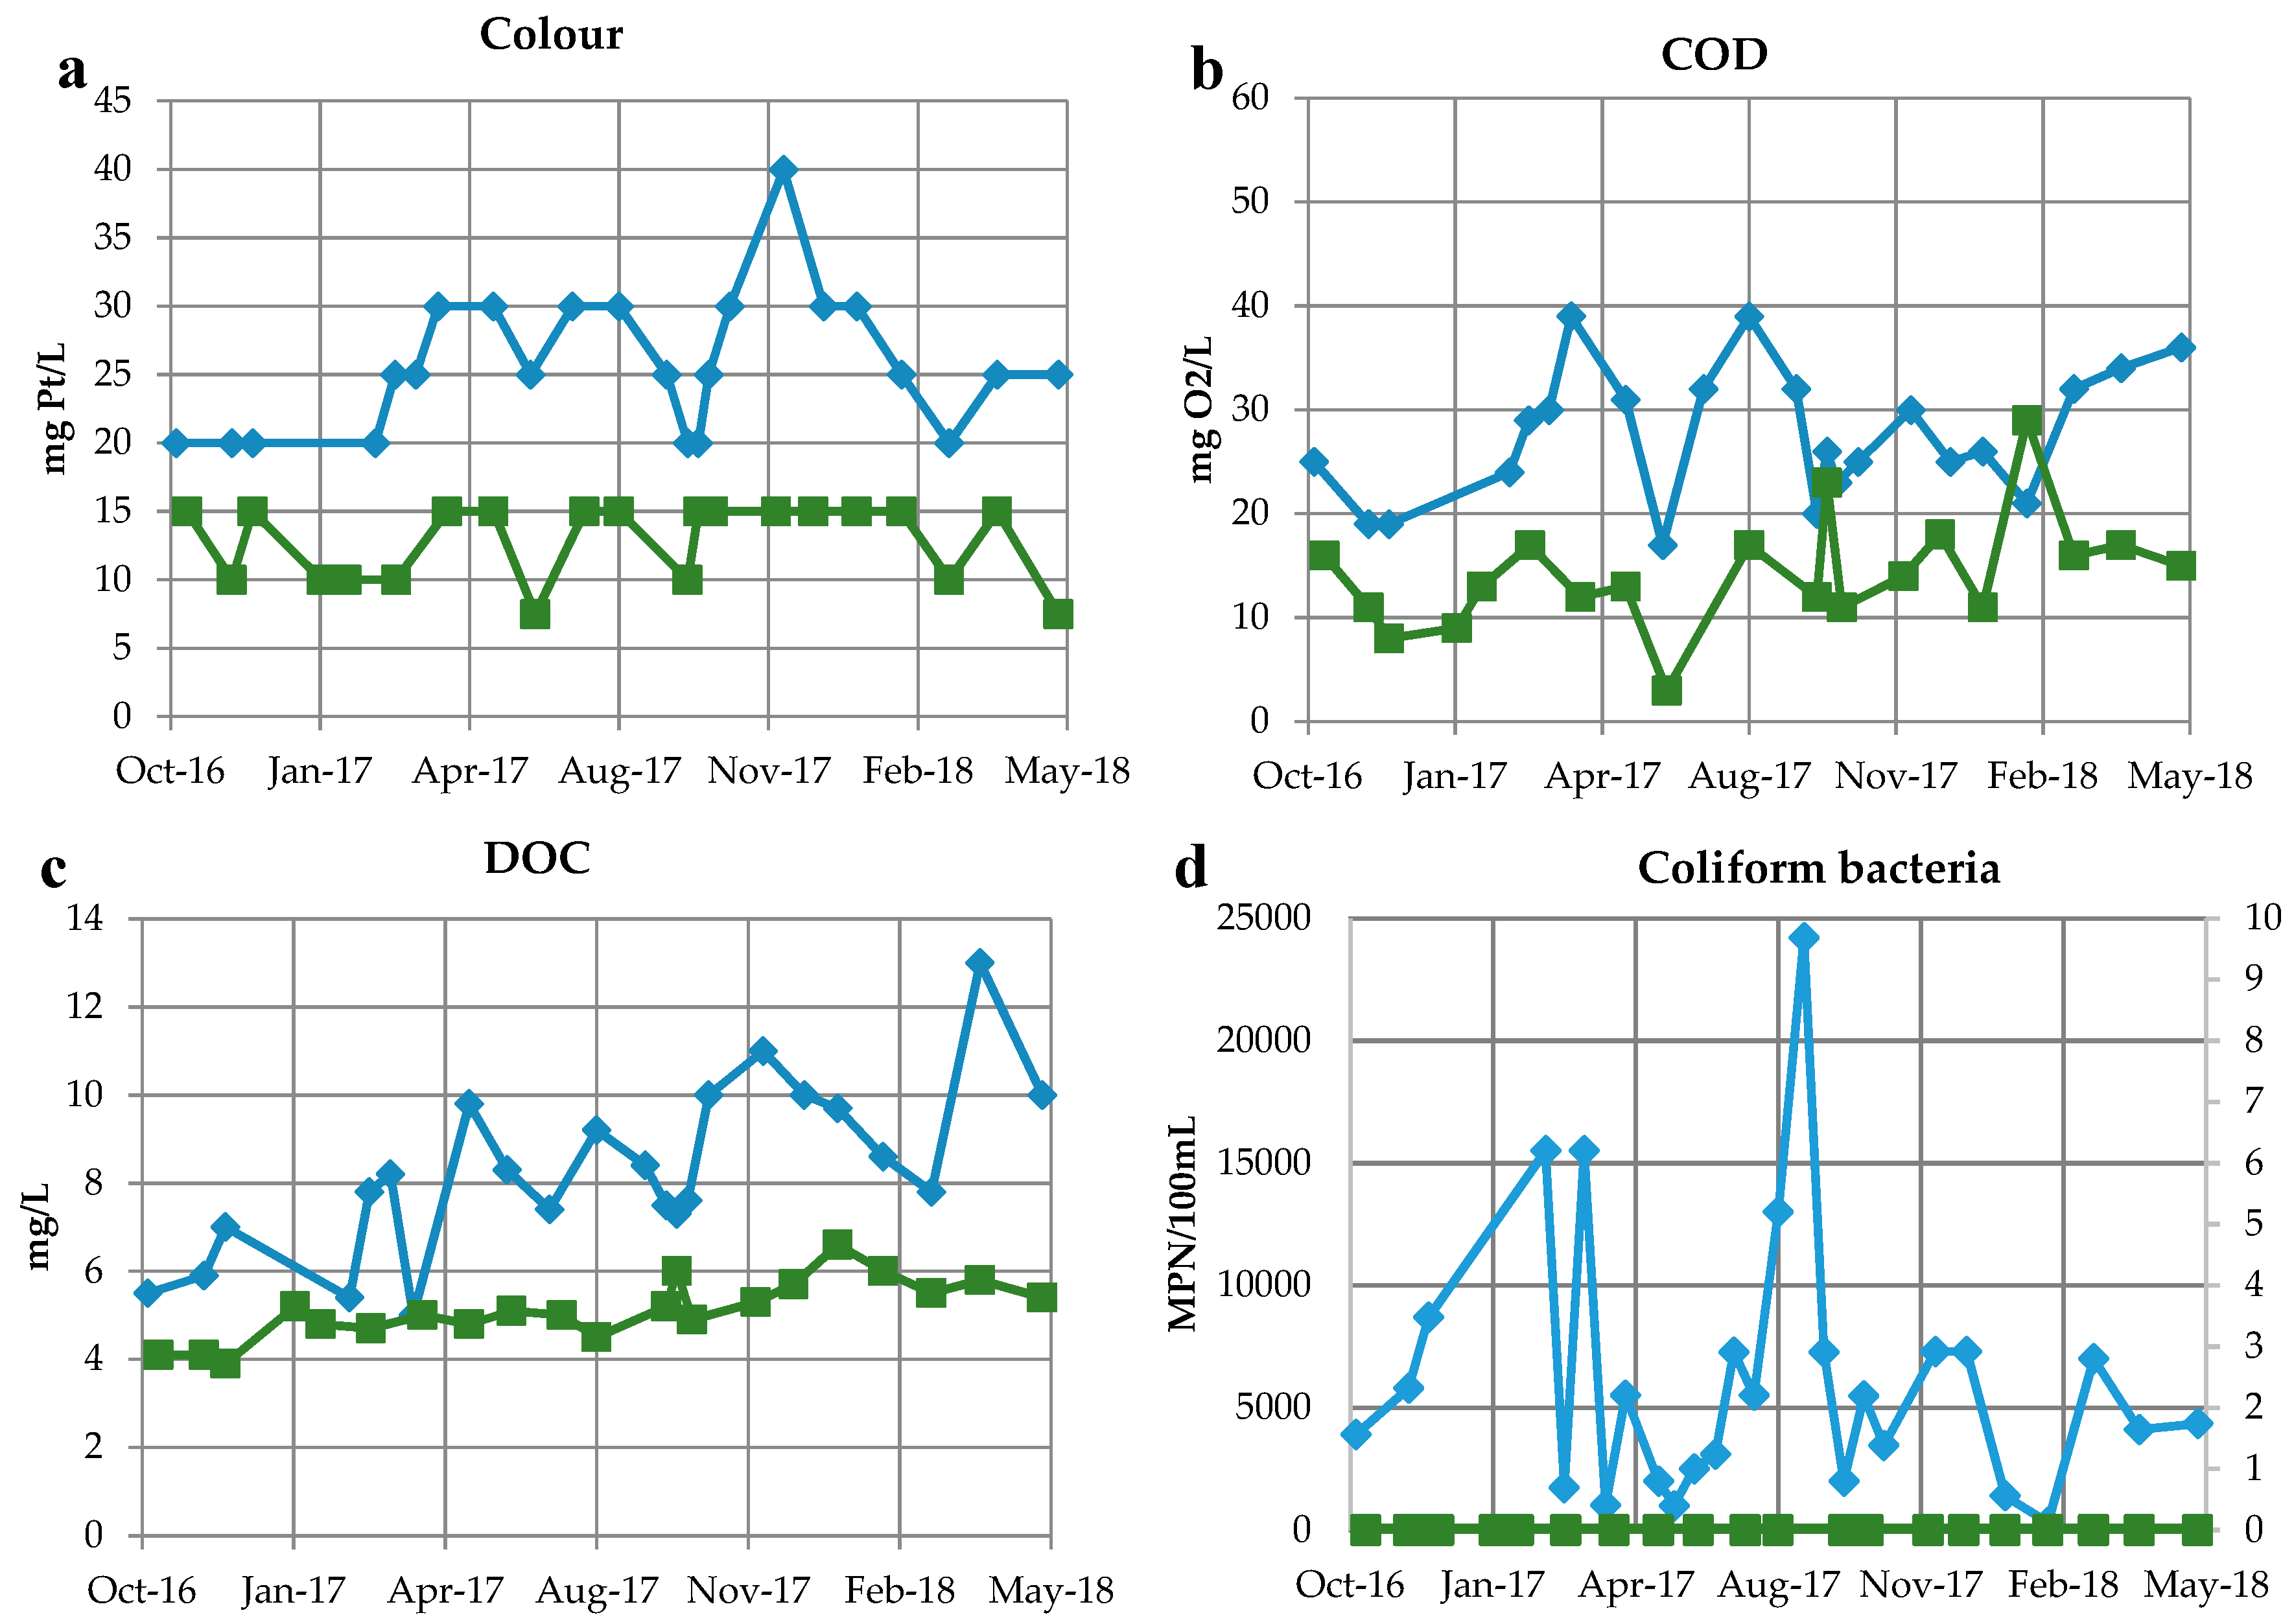
The statistical characteristics of the water samples are presented in Table 1. Figure 4 presents fluctuations in some parameter concentrations of RBF water relative to the source water in the Warta River. The most apparent difference is seen in the case of coliform bacteria. Despite the high concentration of bacteria in river water, almost no bacteria were found in bank filtrate. This is a common effect observed at RBF sites and a result of filtration and adsorption and inactivation or die-off with time. A high removal efficiency was also observed for parameters reflecting the occurrence of NOM in water. The chemical oxygen demand (COD) reflected good removal of NOM from source water. In the Warta River, the maximum concentration occasionally reached levels higher than 50 mg O2/L (median 24.5 mg O2/L) whereas in the bank filtrate the level of COD was much lower (maximum 27.0 mg O2/L, median 13.0 mg O2/L). The median DOC concentration was 8.2 mg/L and was quite high compared to other rivers. The DOC concentration showed large fluctuation in source water from 5.0 to 10 mg/L, while the concentration of DOC in bank filtrate was relatively stable and much lower (maximum concentration of 6.0 mg/L, median 5.0 mg/L). The relatively stable level of DOC achieved by RBF is important for post-treatment. In contrast to COD, the DOC concentration did not follow seasonal fluctuations in source water. The reduction of NOM caused a significant decrease in water colour. A 30–40 mg Pt/L decrease in colour to less than 15 mg Pt/L was observed in RBF wells.
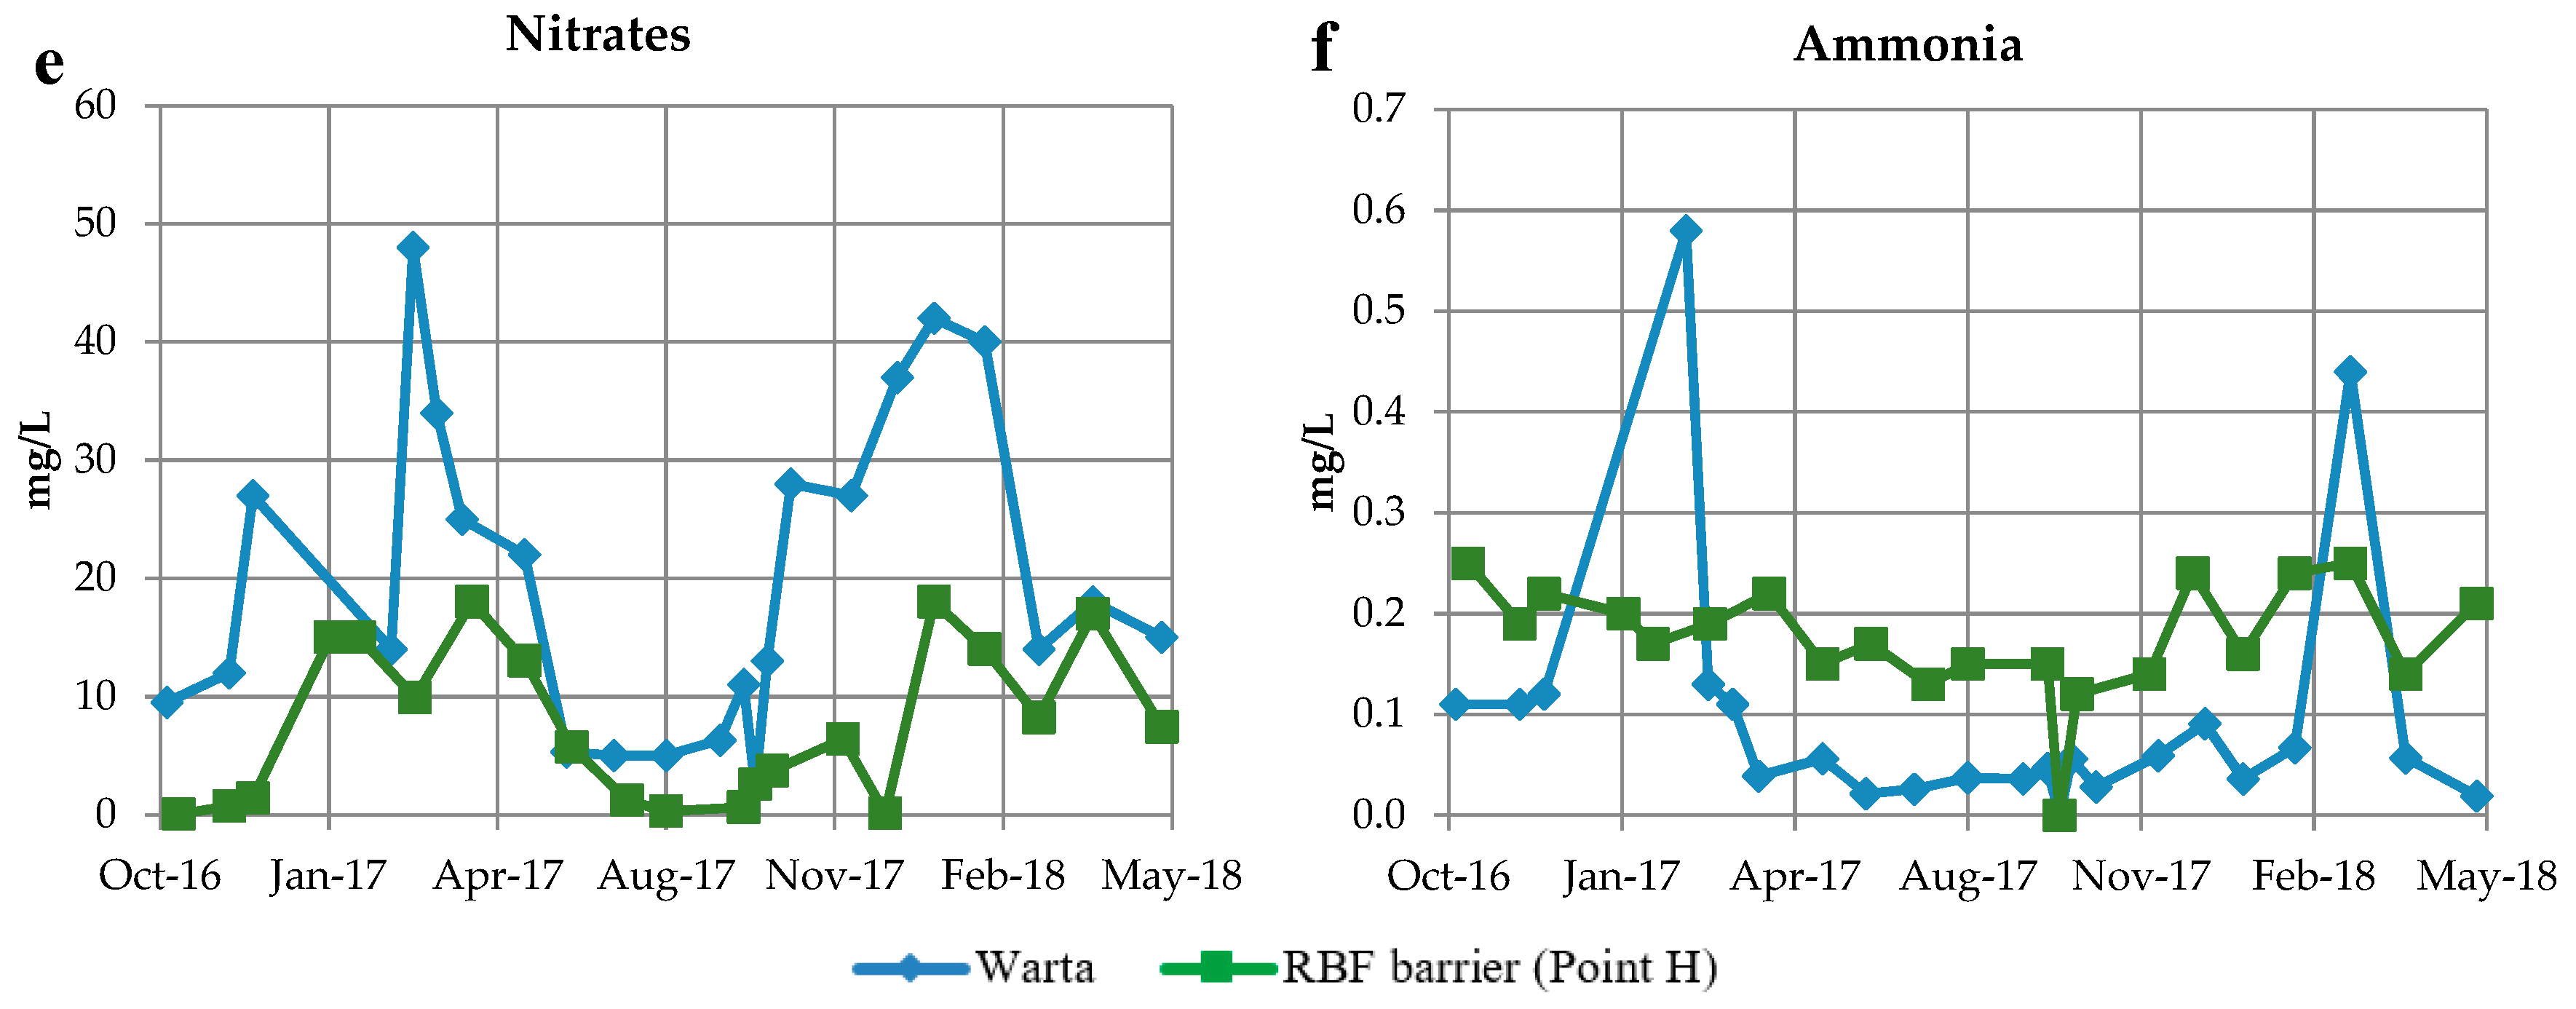
A high level of nitrogen reduction was observed during bank filtration. There were very high fluctuations of nitrate, nitrite, and ammonia in river water (Figure 4e,f). The seasonal variations in nitrogen concentrations are related to the growth periods of flora and fauna in the river, which result from seasonal temperature changes and are a major factor in regulating the biological processes that determine N-cycling [21]. During seasonal fluctuations, the changes related to extreme weather conditions overlap (mainly long-term drought and the influence of the wet season after droughts). It was observed [11] that high concentrations of nitrate up to 80 mg/L occurred after long-term drought as a result of flushing the accumulated contaminants in the environment. Bank filtrate displayed significantly lower nitrogen concentrations. The variability is related to nitrate, which was reduced from the maximum level of 50 mg/L (median 17.5 mg/L) in source water to a maximum level of 18.0 mg/L (median 6.4 mg/L) in bank filtrate during winter. In summer months, denitrification causes a strong decrease in nitrate concentration in bank filtrate. The concentration peaks of ammonia observed in river water (maximum concentration 0.58 mg/L) were buffered by RBF (maximum concentration 0.25 mg/L). However, the average ammonia level was higher in bank filtrate than in river water (median in bank filtrate 0.18 mg/L compared to 0.09 mg/L in source water), indicating a portion of ammonia coming from mixing with ambient groundwater.
Figure 5 presents the fluctuations of some parameter concentrations from the HW in relation to the source water in the Warta River. In the case of coliform bacteria, water treatment is usually effective, but during some periods, coliform bacteria were present in HW water. A distinct decrease in COD was observed in HW water. In the Warta River, periodic peaks were observed, mainly in summer because of biological activity in the river (maximum 60 mg O2/L). The COD in the HW showed low fluctuation, usually significantly less than 20 mg O2/L, with an increase to 30 mg O2/L in spring 2018. The DOC behaviour in the HW followed the concentration peaks observed in the river, but the concentration level was significantly lower (maxima significantly lower than 6 mg/L with an increase in spring 2018 to a value of 9 mg/L). The decrease in water colour was evident in the HW, but in some periods, the high colour peak followed the colour of water in the river.
Low ammonia concentrations were found in the HW. In general, the high concentration peaks followed the behaviour of ammonia in the source river water, but the concentration of ammonia in the HW was significantly lower (maximum of 0.5–0.6 mg/L in the river compared to less than 0.2 mg/L in the HW). There was no removal of nitrate between the river and the HW. The behaviour of nitrate in HW strictly follows fluctuations observed in surface water. The minima and maxima observed in river water and the HW were almost identical with respect to time and range of concentration.
Preliminary results show the presence of some pharmaceutical compounds and other micropollutants in both source water and bank filtrate (Table 2). In total, 30 micropollutants were analysed. The following pharmaceutical residues were detected in the Warta river, but not in bank filtrate: diclofenac (15 ng/L), iohexol (20 ng/L), iomeprol (20 ng/L), iopamidol (20 ng/L), metoprolol (10 ng/L), and theophylline (40 ng/L). The pharmaceutical residues that were not found in river water nor in bank filtrate were as follows: 4-DMA-antipyrin, 4-IP-antipyrine, atenolol, bezafibrate, diazepam, loratidin, naproxen, paracetamol, phenazone, primidone, sulfadiazine, theophylline, aspartam, chloramphenicol, gemfibrozil, and phenobarbital.
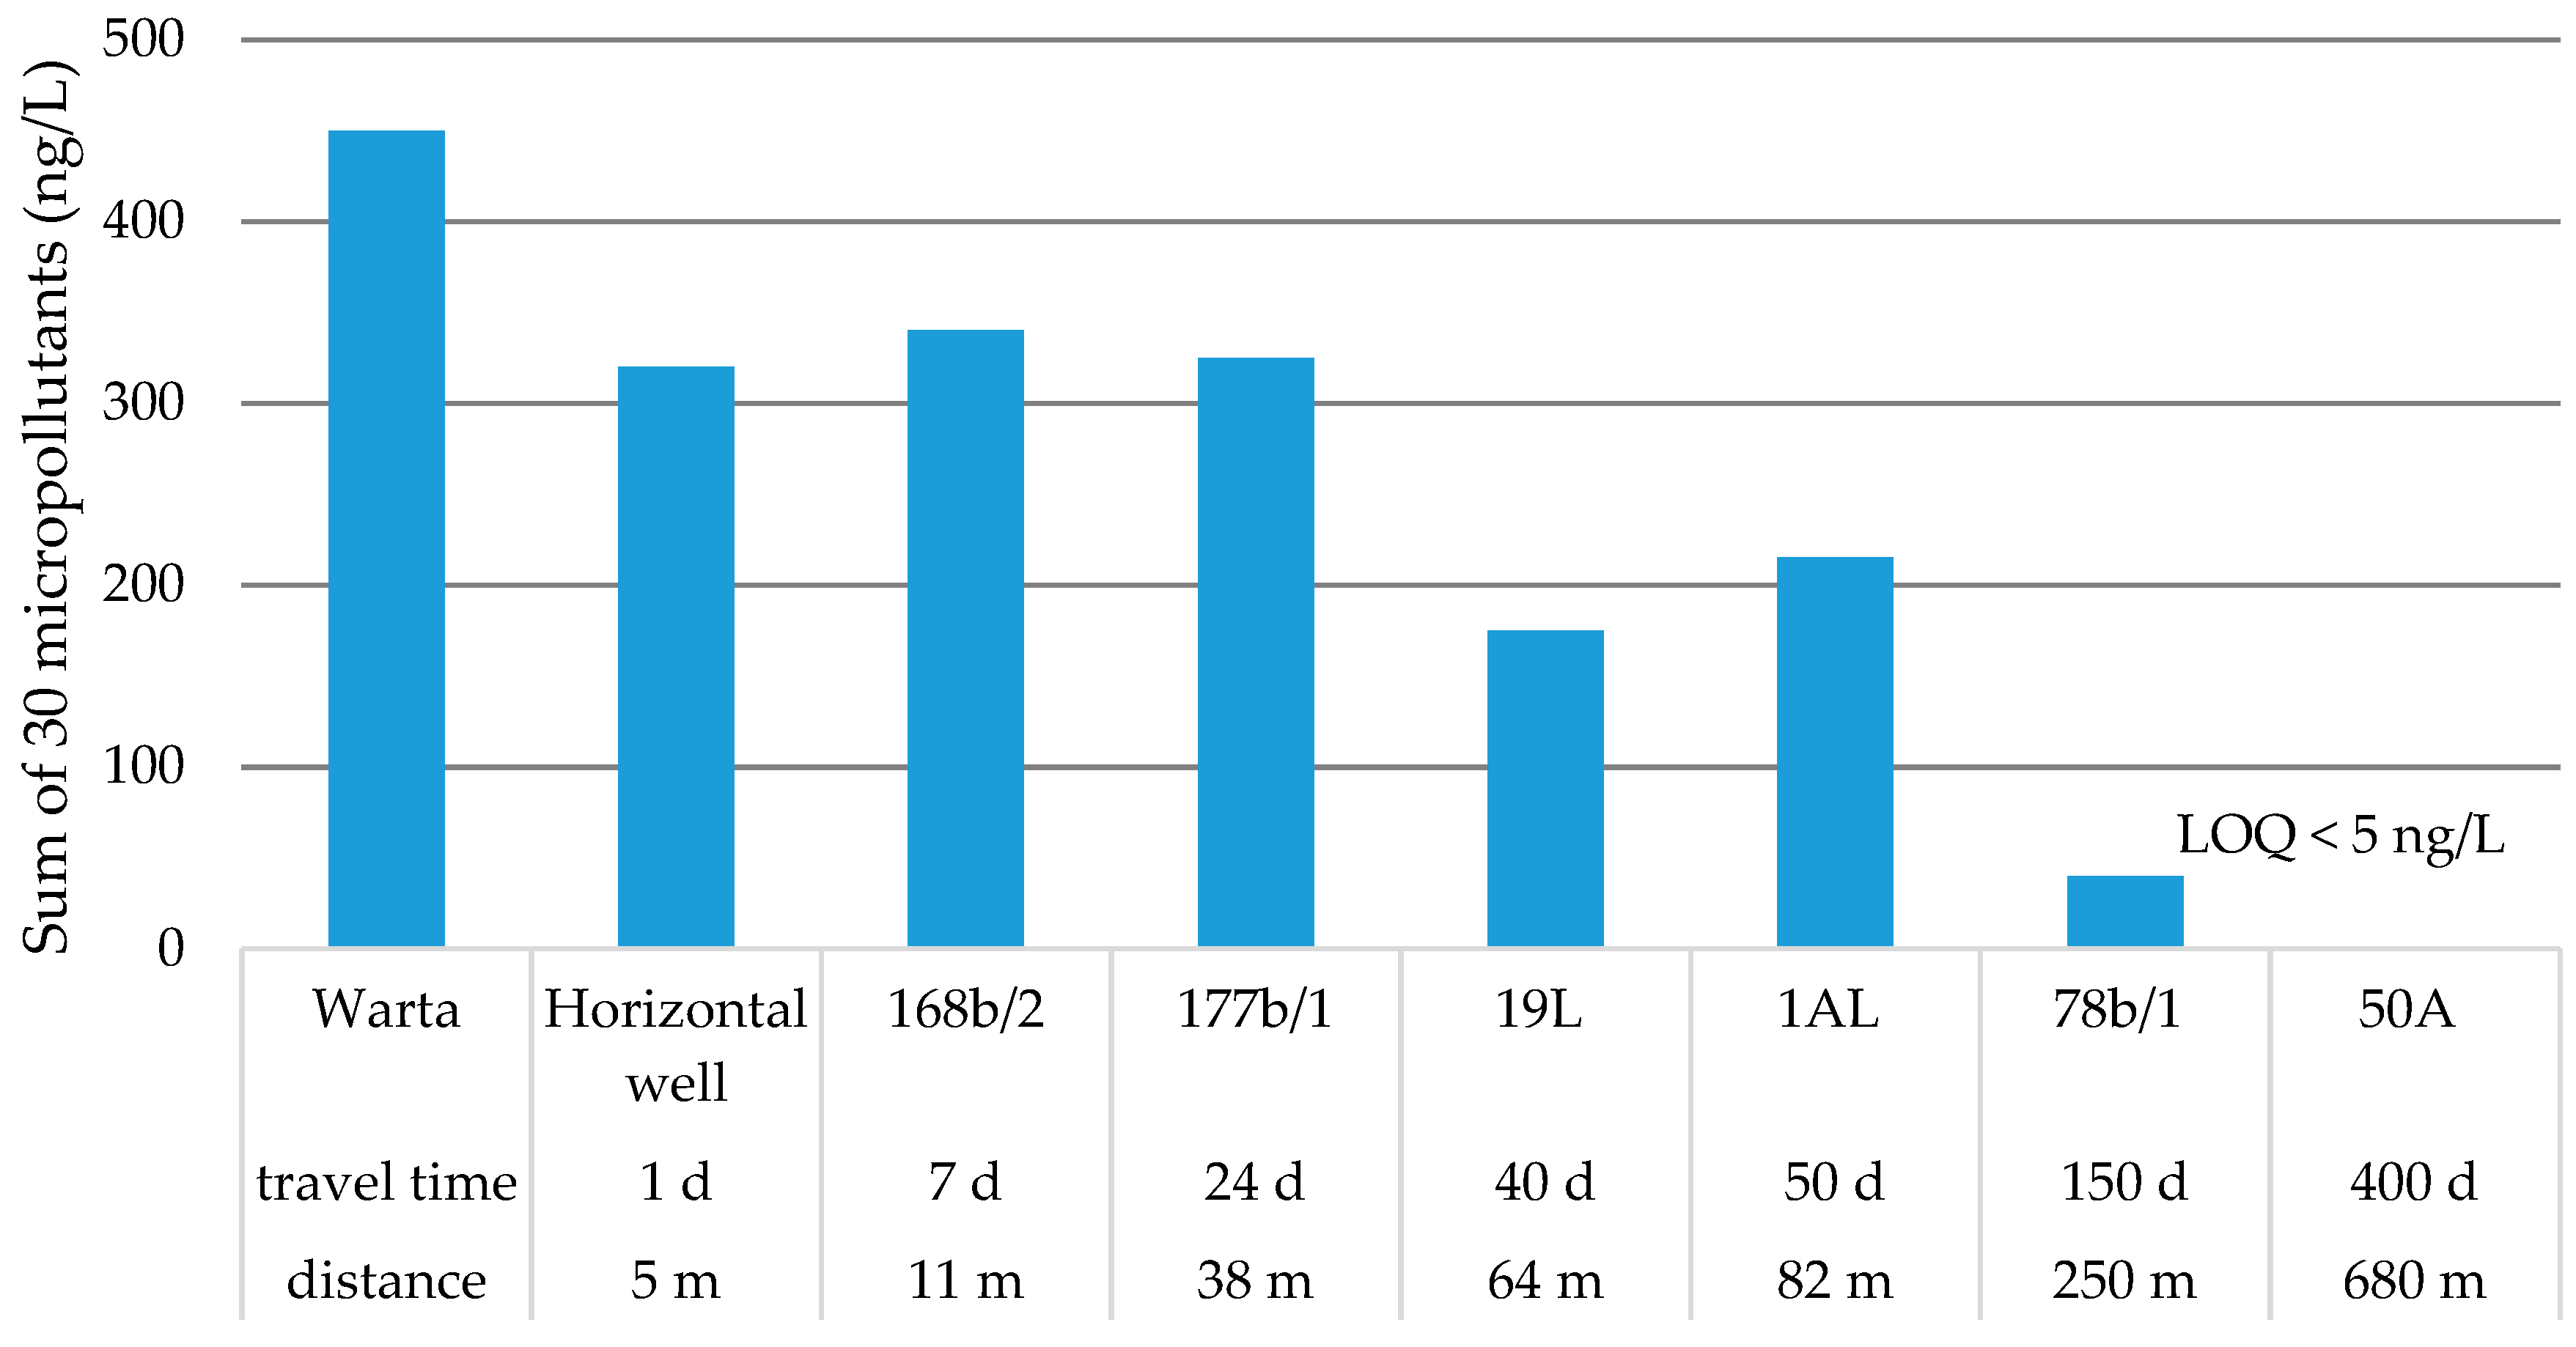
Figure 6 shows the total concentration of all 30 micropollutants analysed. In the Warta River, higher concentrations of pharmaceuticals and other micropollutants were detected. To get a rough estimate of the removal efficacy along flow paths, all results have been summed up, knowing that a single-compound assessment is more reliable but here not feasible due to an insufficient number of samples. Furthermore, it is of note that the concentration in the river water could have been lower or higher when the river water infiltrated which was abstracted as bank filtrate at the HW and other sampling points. The resulting total concentration from all 30 micropollutants in river water was 450 ng/L. Lower concentrations were documented in the HW and observation wells located close to the river and wells 168b/1 and 177b/1 (320, 340, and 325 ng/L, respectively). Much lower concentrations were documented in RBF-c wells 19L and 1AL (175 and 215 ng/L, respectively). Furthermore, from the river to well 78b/1s, the concentration decreased to 40 ng/L, while in the RBF-f well (50A), micropollutants were not detected.
The most common micropollutants found were the corrosion inhibitor benzotriazole and the pharmaceutical carbamazepine (Figure 7). Their concentrations in bank filtrate were higher than in river water. This finding may reflect the travel time influence on micropollutant behaviour and a higher concentration of these micropollutants in river water prior to the sampling period.
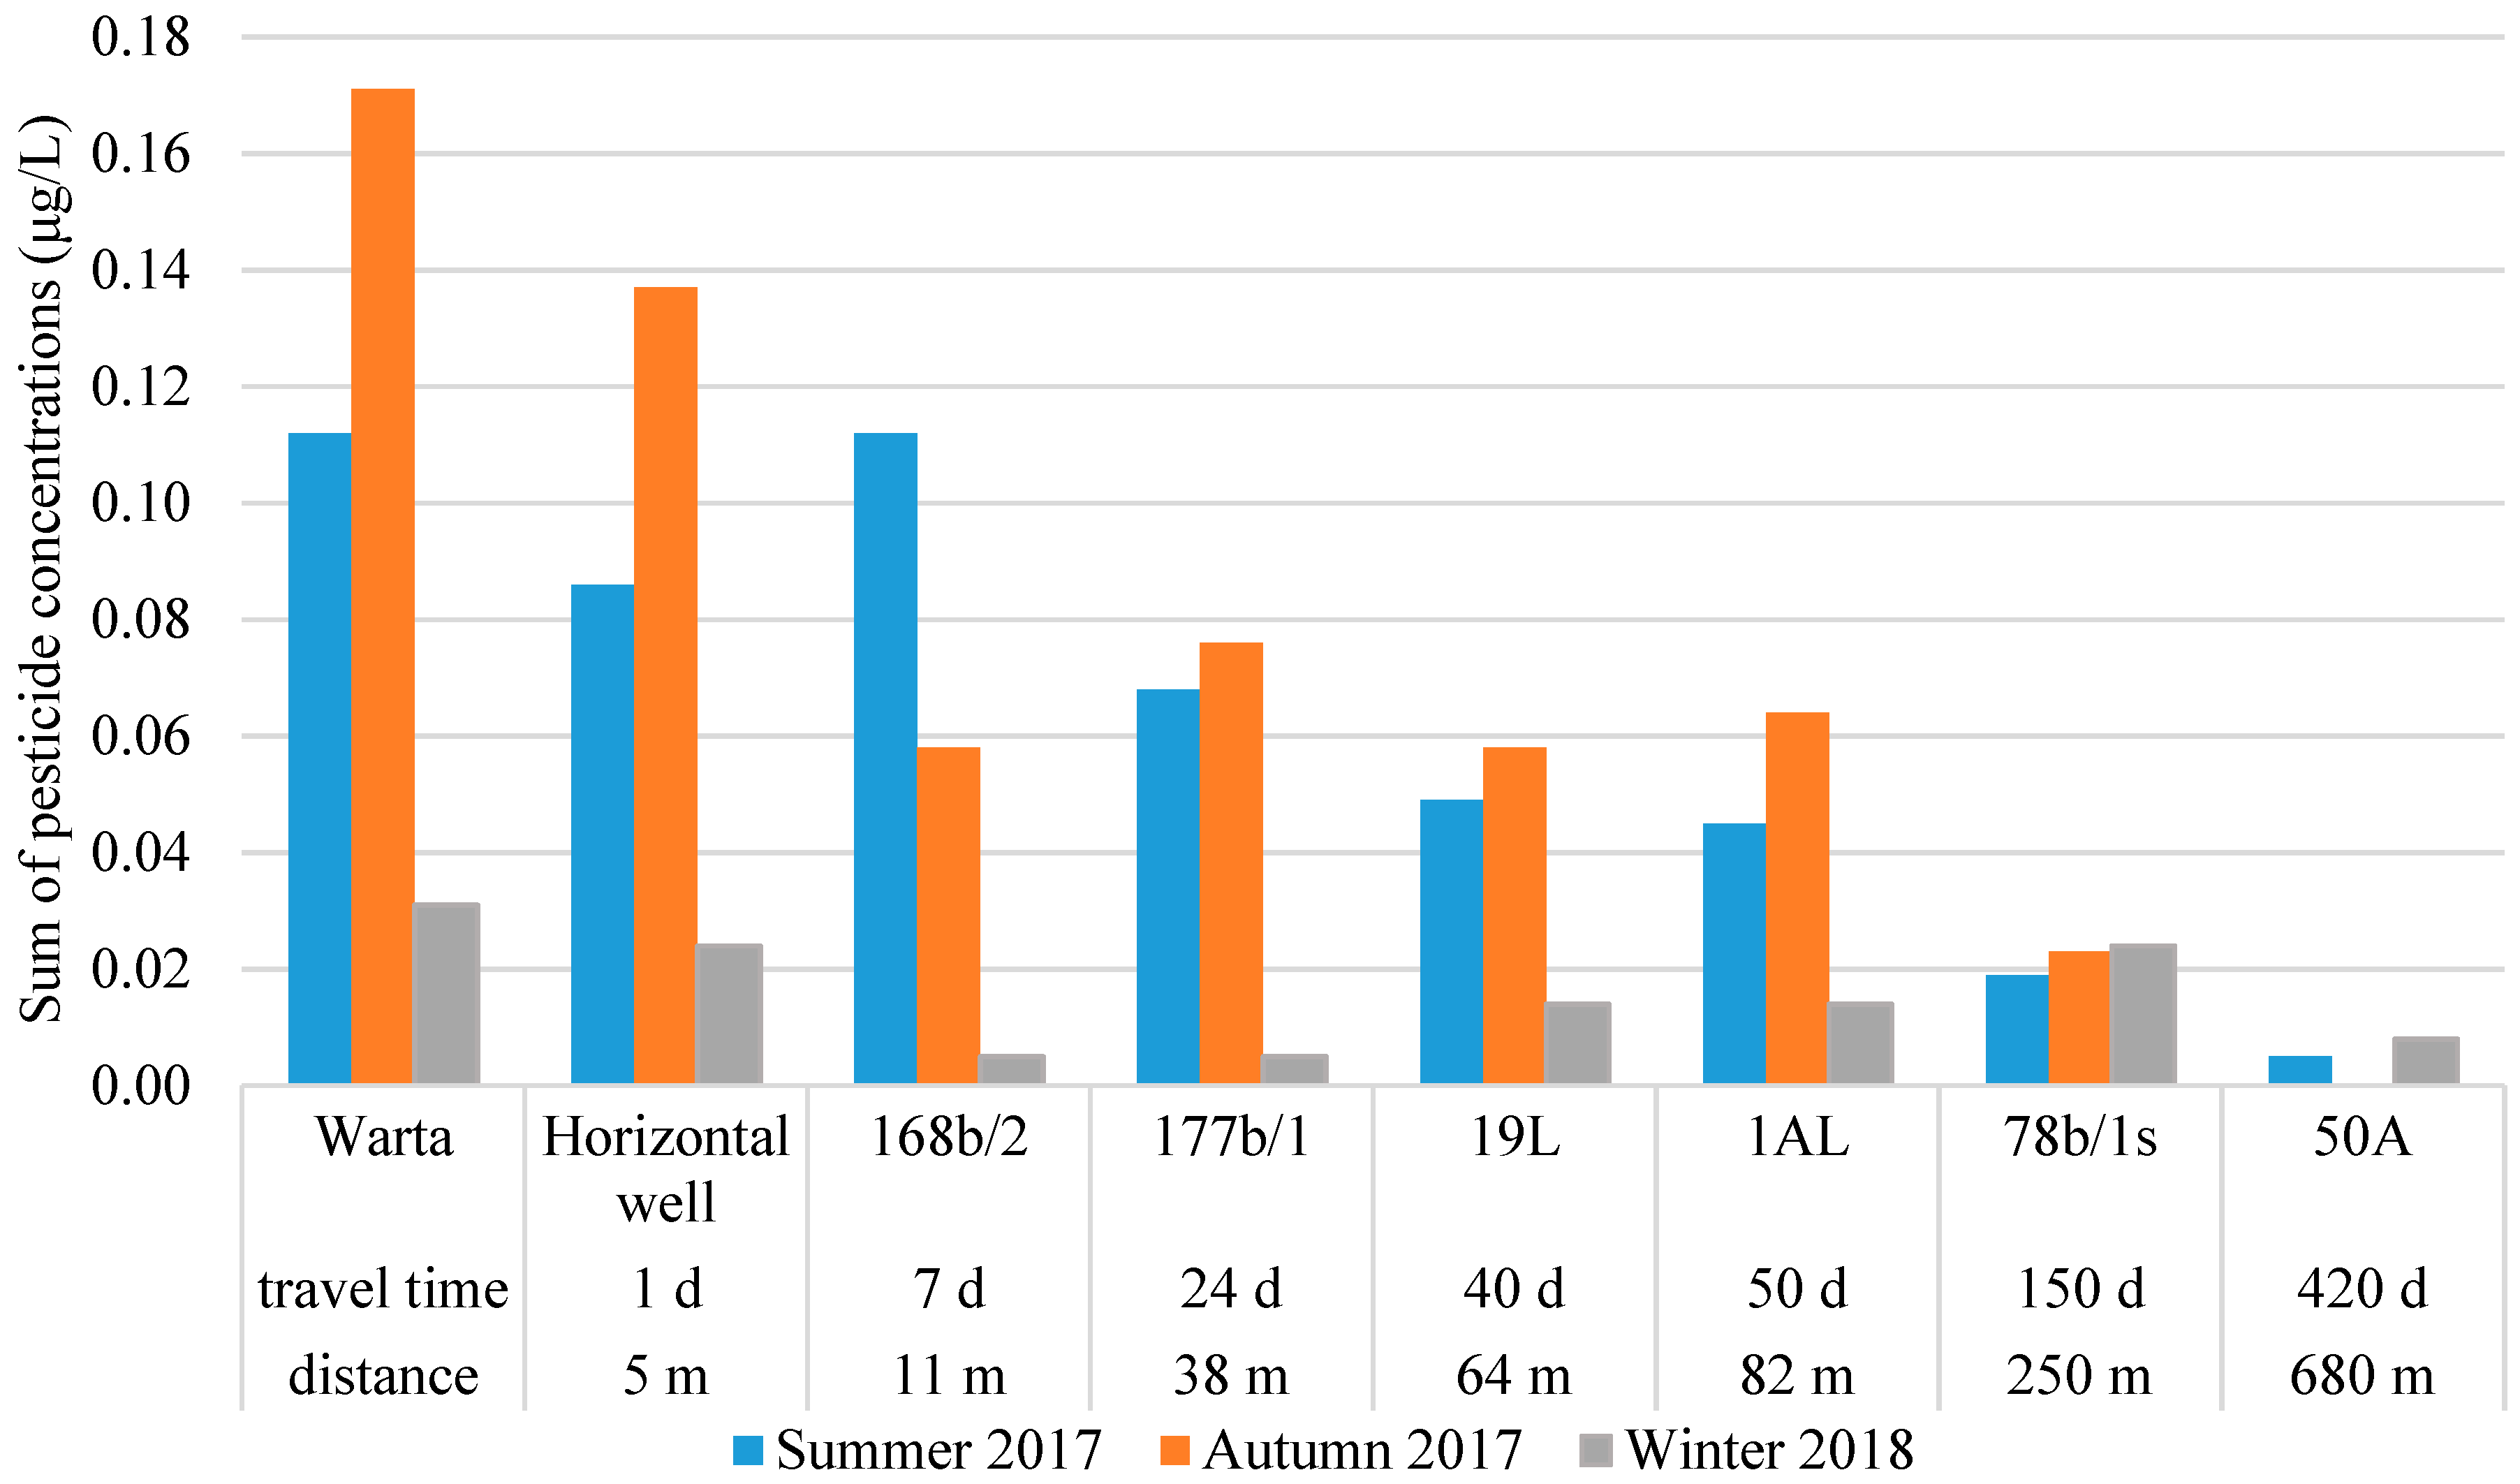
The spatial distribution of pesticides was very similar to that of the other micropollutants in the region. The highest concentrations were found in Warta River water and in the HW (Figure 8).
Based on literature search on relevant pesticides found elsewhere at RBF sites and on indications for application in the study area, selected pesticides were analysed (Table 3). The concentrations of pesticides decreased with increasing distance from the river, and in the RBF-f well no pesticides were detected. During the sampling campaigns performed in 2017, pesticides were detected at a total concentration of 0.112 µg/L in summer, and a total concentration of 0.171 µg/L was detected in autumn (Table 3). In the winter sampling campaign, lower concentrations of pesticides were observed (0.031 µg/L). In the HW similar pesticide concentrations as in river water were found (0.086, 0.137, and 0.024 µg/L, respectively). Much lower concentrations were detected in the vertical wells. In the sampling campaign of summer 2017, three pesticides were detected, with total concentrations of 0.045 and 0.049 µg/L in wells 1AL and 19L, respectively. In the autumn campaign, the total pesticide levels were 0.064 and 0.058 µg/L in wells 1AL and 19L, respectively. Seven pesticide constituents were detected in well 1AL, and five were observed in well 19L. The concentrations of pesticides in piezometers located between the river and RBF-c wells were intermediate concentrations that reflected the successive concentration reduction with distance during RBF. Pesticides were not detected in the RBF-f well, and only isoproturon was detected in well 78b/ls at concentrations of 0.019, 0.023, and 0.024 µg/L during the three sampling campaigns.
4. Discussion
The results presented here show a high efficacy of RBF for the removal of organic compounds, micropollutants, and coliform bacteria when (vertical) wells are located at least 60–80 m from the river bank. For all vertical wells a complete removal of coliform bacteria was observed. The reduction of DOC was about 40–42% (Table 1), and the reduction of COD more than 50% at point H and almost 70% at wells 1AL and 19L. These results are in accordance with others previously documented in the literature for other RBF sites in Europe [4]. The reduction of nitrates occurs at a high level during summer months with higher water temperature. Nitrates in RBF wells are reduced by 58%, in some wells up to 97% (1AL and 19L). The decrease in nitrate concentration is caused by denitrification and mixing with ambient groundwater. Denitrification was previously documented at RBF sites [22]. The mixing rate at the Krajkowo site shows a value of 65–86% of bank filtrate relative to the total water balance, but it should be emphasized that the amount of river water in the total water balance is a changeable factor and depends strongly on well exploitation. Lower well yield can lead to a decrease in river water portion in the total water balance in wells. This factor affects the nitrate concentration too. The seasonal peaks of high ammonia concentrations are strongly buffered and decreased (mainly by sorption in riverbed sediments and aquifer sediments), but the average concentration of ammonia is higher in bank filtrate.
In the HW, removal of NOM is also visible, but the removal rate is much lower than in RBF wells located at further distance from the river. The decrease in coliform bacteria is evident, but bacteria appear in the HW periodically. The reduction of COD was found to be 42% and that of DOC 26%, but seasonal changes of these parameters follow the fluctuations observed in river water (Figure 5). This makes the HW very vulnerable to extreme weather conditions, especially floods. During and after floods, the NOM content increases in river water and causes breakthroughs to the HW [6]. The distinct removal of ammonia is visible (especially in the peaks of high concentrations, which are damped), while the nitrates in the HW follow fluctuations observed in river water. This also proves limited attenuation of pollutants if the flow paths between the river bed and the screen of a well are short.
A high removal rate of organic micropollutants was determined at the Krajkowo site. Concentrations of pharmaceuticals in Warta River water were found similar to levels detected in other European rivers [19,23]. Among the 30 analysed micropollutants, 14 were detected in the Warta River. Non-steroidal anti-inflammatory drugs (diclofenac and ibuprofen) previously measured in the Warta River showed lower concentrations in current research than in 2007 [24], and the naproxen detected in 2007 was not detected in this study. This can be related to the high discharge rate of the Warta River during the wet period in September 2017. Out of the 14 substances detected in Warta River, 8 substances were detected in the bank filtrate (Table 2). The high attenuation potential is visible during water passage through the aquifer and depending on flow path length. The pharmaceutical concentrations in the HW and observation wells located close to the river are at levels observed in the source water, while after further aquifer passage, the concentrations decrease considerably. In wells located 60–80 m from the river (travel time 40–50 days), the concentrations are significantly lower (Figure 6 and Figure 7), while at a distance of 250 m from the river (point 78b/1s), only three substances were detected. Further away from the river, no pharmaceutical residues were detected. Along the flow path, a low increase in carbamazepine and sucralose was visible (Figure 7), indicating that these compounds were present in the Warta River at higher concentrations before the sampling period. This finding shows the importance of regular sampling of source water and RBF water to assess the removal efficacy.
Pesticide levels were also reduced significantly during RBF (Figure 8). The similar constituents and concentrations detected in the Warta River and the HW indicate that the well is vulnerable to pollution from the river. Water passage through 5-m-thick sediments is not sufficient to remove micropollutants from the drained water. In vertical wells located 60–80 m from the river (RBF-c wells) pesticide concentrations were much lower than those in the river and HW, but some pesticides were still present (Figure 8).
A factor that influences concentrations in RBF wells is the mixing of bank filtrate with ambient groundwater. In RBF-c wells, 65–85% of water is derived from bank filtration, and in RBF-f wells, this percentage is ~40%. This mixing leads to the dilution of pollutants in bank filtrate, but it should be emphasized that the portion of river water in total water balance is changeable throughout the year. It is also changeable according to the wells’ exploitation rate, which causes the mixing rate to change.
The European Union (EC 1998; EC 2006) and Polish regulations (Rozporządzenie 2017) have established a maximum acceptable concentration of 0.1 µg/L for individual pesticides and their degradation products and of 0.5 µg/L for the total pesticide concentration [25,26,27]. Pharmaceutical residue concentrations are currently not regulated in the European Union or Polish guidelines but are proposed to be lower than 0.1 µg/L. In the study area the maximum admissible limit of pesticides was not exceeded. Only benzotriazole was found to be present at levels higher than 0.1 µg/L in some wells (bank filtrate) and needs to be removed during post-treatment.
5. Conclusions
Investigations at the Krajkowo site show effective removal of NOM in the vertical RBF wells located at distances of 60–80 m from the river. The removal of DOC, COD, and colour was found in the ranges of 40–42%, 51–70%, and 42–50%, respectively. A much lower reduction of DOC (26%), COD (42%), and colour (33%) in horizontal well was observed. Furthermore, the horizontal well is more sensitive than vertical wells to changes in the NOM content, which is expressed by similar seasonal fluctuations in NOM content compared to river water.
Results of micropollutant investigations (mainly of pharmaceutical residues) demonstrate a gradual lowering of concentrations along the flow path. In the RBF wells the reduction rate of the sum of micropollutant concentrations is greater than 50%. Lower reduction rates (approximately 30%) were found for the HW and observation wells located 11 m and 38 m from the river. At a distance of 250 m from the river (travel time ~ 150 days) only carbamazepine and sucralose were detected. At a distance of 680 m (travel time ~ 420 days) pharmaceutical residues were not detected. The most persistent pharmaceutical is carbamazepine. The decrease of its concentration was observed at a distance of 250 m.
Results of pesticides investigation show also gradual decrease of concentrations along the flow path. High reduction rates are visible in RBF wells (about 80% for the sum of pesticide concentrations). In the RBF-f well pesticides were practically not detected, but in the 78b/s well (250 m from the river) isoproturon was detected at low concentrations.
The presented results prove a high efficacy of contaminant removal by the riverbank filtration system. Significantly lower contaminant removal was documented in the horizontal well, which received river water after a very short travel time. For RBF sites with similar conditions, the distance from the river should be at least 60 m. However, higher removal rates can be achieved for wells located at a distance of 250 m from the river.
The preliminary results of the organic micropollutant investigation show the need for further monitoring of emerging compounds in both source (river) water and extracted bank filtrate. In the case of increased concentrations in river water, operation of vertical wells at a longer distance from the wells should be favoured against operation of the HW. Regular monitoring of relevant micropollutants is important for water management purposes as well as for adjusting post-treatment technologies.
Author Contributions
J.G. and K.D. were responsible for the overall coordination of the research team; T.G. and D.D. took part in conceptualisation of water monitoring; R.K. took part in field work and performed graphical and statistical interpretations; K.D., J.G., and R.K. interpreted the data and were involved in discussing the study; K.D. prepared the manuscript; and all authors read and approved the manuscript.
Funding
This research was completed with support from the AquaNES project. This project has received funding from the European Union’s Horizon 2020 Research and Innovation Program under grant agreement no. 689450.
Acknowledgments
The authors would like to thank Aquanet SA (Poznań Waterworks operator) for their contribution, Rico Bartak and Sebastian Paufler for water sampling for micropollutants, and Hilmar Börnick and Oliver Faber for analysis of pharmaceuticals.
Conflicts of Interest
The authors declare no conflicts of interest.
References
- Hiscock, K.M.; Grischek, T. Attenuation of groundwater pollution by bank filtration. J. Hydrol. 2002, 266, 139–144. [Google Scholar] [CrossRef] [Green Version]
- Foriczs, T.; Berecz, Z.; Molnar, Z.; Suveges, M. Origin of shallow groundwater of Csepel Island (south of Budapest. Hungary. River Danube): Isotopic and chemical approach. Hydrol. Process. 2005, 19, 3299–3312. [Google Scholar] [CrossRef]
- Lasagna, M.; De Luca, D.A.; Franchino, E. Nitrates contamination of groundwater in the western Po Plain (Italy): The effects of groundwater and surface water interactions. Environ. Earth Sci. 2016, 75, 240. [Google Scholar] [CrossRef]
- Grunheid, S.; Amy, G.; Jekel, M. Removal of bulk dissolved organic carbon (DOC) and trace organic compounds by bank filtration and artificial recharge. Water Res. 2005, 39, 3219–3228. [Google Scholar] [CrossRef] [PubMed]
- Hoppe-Jones, C.; Oldham, G.; Drewes, J.E. Attenuation of total organic carbon and unregulated trace organic chemicals in U.S. riverbank filtration systems. Water Res. 2010, 44, 4643–4659. [Google Scholar] [CrossRef] [PubMed]
- Górski, J.; Dragon, K.; Kruć, R. A comparison of river water treatment efficiency in different types of wells. Geologos 2018, in press. [Google Scholar] [CrossRef]
- Miettinen, I.T.; Martikainen, P.J.; Vartiainen, T. Humus transformation at the bank filtration water plant. Water Sci. Techol. 1994, 30, 179–187. [Google Scholar] [CrossRef]
- Ray, C.; Soong, T.W.; Lian, Y.Q.; Roadcap, G.S. Effect of flood-induced chemical load on filtrate quality at bank filtration sites. J. Hydrol. 2002, 266, 235–258. [Google Scholar] [CrossRef]
- Sandhu, C.; Grischek, T.; Kumar, P.; Ray, C. Potential for riverbank filtration in India. Clean Technol. Environ. Policy 2011, 13, 295–316. [Google Scholar] [CrossRef]
- Hu, L.; Xu, Z.; Huang, W. Development of a river-groundwater interaction model and its application to a catchment in Northwestern China. J. Hydrol. 2016, 543, 483–500. [Google Scholar] [CrossRef]
- Górski, J.; Dragon, K.; Kaczmarek, P. Nitrate pollution in the Warta River (Poland) between 1958 and 2016: Trend and causes. Environ. Sci. Pollut. Res. 2017. [Google Scholar] [CrossRef] [PubMed]
- Sui, Q.; Cao, X.; Lu, S.; Zhao, W.; Qiu, Z.; Yu, G. Occurrence, sources and fate of pharmaceuticals and personal care products in the groundwater: A review. Emerg. Contam. 2015, 1, 14–24. [Google Scholar] [CrossRef]
- Bohlke, J.K. Groundwater recharge and agricultural contamination. Hydrogeol. J. 2002, 10, 153–179. [Google Scholar] [CrossRef]
- Dragon, K. Groundwater nitrates pollution in the recharge zone of a regional Quaternary flow system (Wielkopolska region, Poland). Environ. Earth Sci. 2013, 68, 2099–2109. [Google Scholar] [CrossRef]
- Guzzella, L.; Pozzoni, F.; Giuliano, G. Herbicide contamination of surficial groundwater in Northern Italy. Environ. Pollut. 2006, 142, 344–353. [Google Scholar] [CrossRef] [PubMed]
- Loos, R.; Locoro, G.; Comero, S.; Contini, S.; Schwesig, D.; Werres, F.; Balsaa, P.; Gans, O.; Weiss, S.; Blaha, L.; et al. Pan-European survey on the occurrence of selected polar organic persistent pollutants in ground water. Water Research 2010, 44, 4115–4126. [Google Scholar] [CrossRef] [PubMed]
- Köck-Schulmeyer, M.; Ginebreda, A.; Postigo, C.; Garrido, T.; Fraile, J.; López de Alda, M.; Barceló, D. Four-year advanced monitoring program of polar pesticides in groundwater of Catalonia (NE-Spain). Sci. Total Environ. 2014, 470–471, 1087–1098. [Google Scholar] [CrossRef] [PubMed]
- Li, W.C. Occurrence, sources, and fate of pharmaceuticals in aquatic environment and soil. Environ. Pollut. 2014, 187, 193–201. [Google Scholar] [CrossRef] [PubMed]
- Kovačević, S.; Radišić, M.; Laušević, M.; Dimkić, M. Occurrence and behavior of selected pharmaceuticals during riverbank filtration in The Republic of Serbia. Environ. Sci. Pollut. Res. 2017, 24, 2075–2088. [Google Scholar] [CrossRef] [PubMed]
- Przybyłek, J.; Dragon, K.; Kaczmarek, P. Hydrogeological investigations of river bed clogging at a river bank filtration site along the River Warta, Poland. Geologos 2017, 23, 201–214. [Google Scholar] [CrossRef] [Green Version]
- Howden, N.J.K.; Burt, T.P. Temporal and spatial analysis of nitrates concentrations from the Frome and Piddle catchments in Dorset (UK) for water years 1978 to 2007: Evidence for nitrates break through? Sci. Total Environ. 2008, 407, 507–526. [Google Scholar] [CrossRef] [PubMed]
- Grischek, T.; Hiscock, K.M.; Metschies, T.; Dennis, P.F.; Nestler, W. Factors affecting denitrification during infiltration of river water into a sand and gravel aquifer in Saxony, Germany. Water Research 1998, 32, 450–460. [Google Scholar] [CrossRef]
- Szymonik, A.; Lach, J.; Malińska, K. Fate and removal of pharmaceuticals and illegal drugs present in drinking water and wastewater. Ecol. Chem. Eng. S 2017, 24, 65–85. [Google Scholar] [CrossRef]
- Kasprzyk-Hordern, B.; Dąbrowska, A.; Vieno, N.; Kronberg, L.; Nawrocki, J. Occurrence of Acidic Pharmaceuticals in the Warta River in Poland. Chem. Anal. 2008, 52, 289–303. [Google Scholar]
- European Commission (EC). Council Directive 98/83/EC of 3 November 1998 on the Quality of Water Intended for Human Consumption (L327/1. 22/12/2000); Official Journal of the European Union: Aberdeen, UK, 1998. [Google Scholar]
- European Commission (EC). Directive 2006/118/EC of the European Parliament and the Council of 12th December 2006 on the Protection of Ground Water Against Pollution and Degradation (L372/19. 27/12/2006); Official Journal of the European Union: Aberdeen, UK, 2006. [Google Scholar]
- Internet System of Legal Acts (ISAP). Regulation of the Ministry of Health on the Quality of Water Intended for Human Consumption (Dz.U. 2017 nr 2294); ISAP: Warsaw, Poland, 2017. [Google Scholar]
Figure 1.
Map of the study area. RBF: riverbank filtration; RBF-c: wells on the flood terrace; RBF-f: wells on the higher terrace; HW: horizontal well.
Figure 1.
Map of the study area. RBF: riverbank filtration; RBF-c: wells on the flood terrace; RBF-f: wells on the higher terrace; HW: horizontal well.

Figure 2.
Hydrogeological cross-sections (lines of cross-sections are marked in Figure 1).
Figure 2.
Hydrogeological cross-sections (lines of cross-sections are marked in Figure 1).

Figure 3.
A scheme presenting the location of the horizontal drains of the collector well and positions of the RBF-c wells [20]. Legend: 1—the embankment; 2—sands; 3—gravels; 4—silts; 5—clays; 6—the static and dynamic water level; 7—groundwater flow directions; 8—the position of the RBF well screen; 9—the position of the HW drains; 10—other observation wells; 11—Quaternary; 12—Neogene.
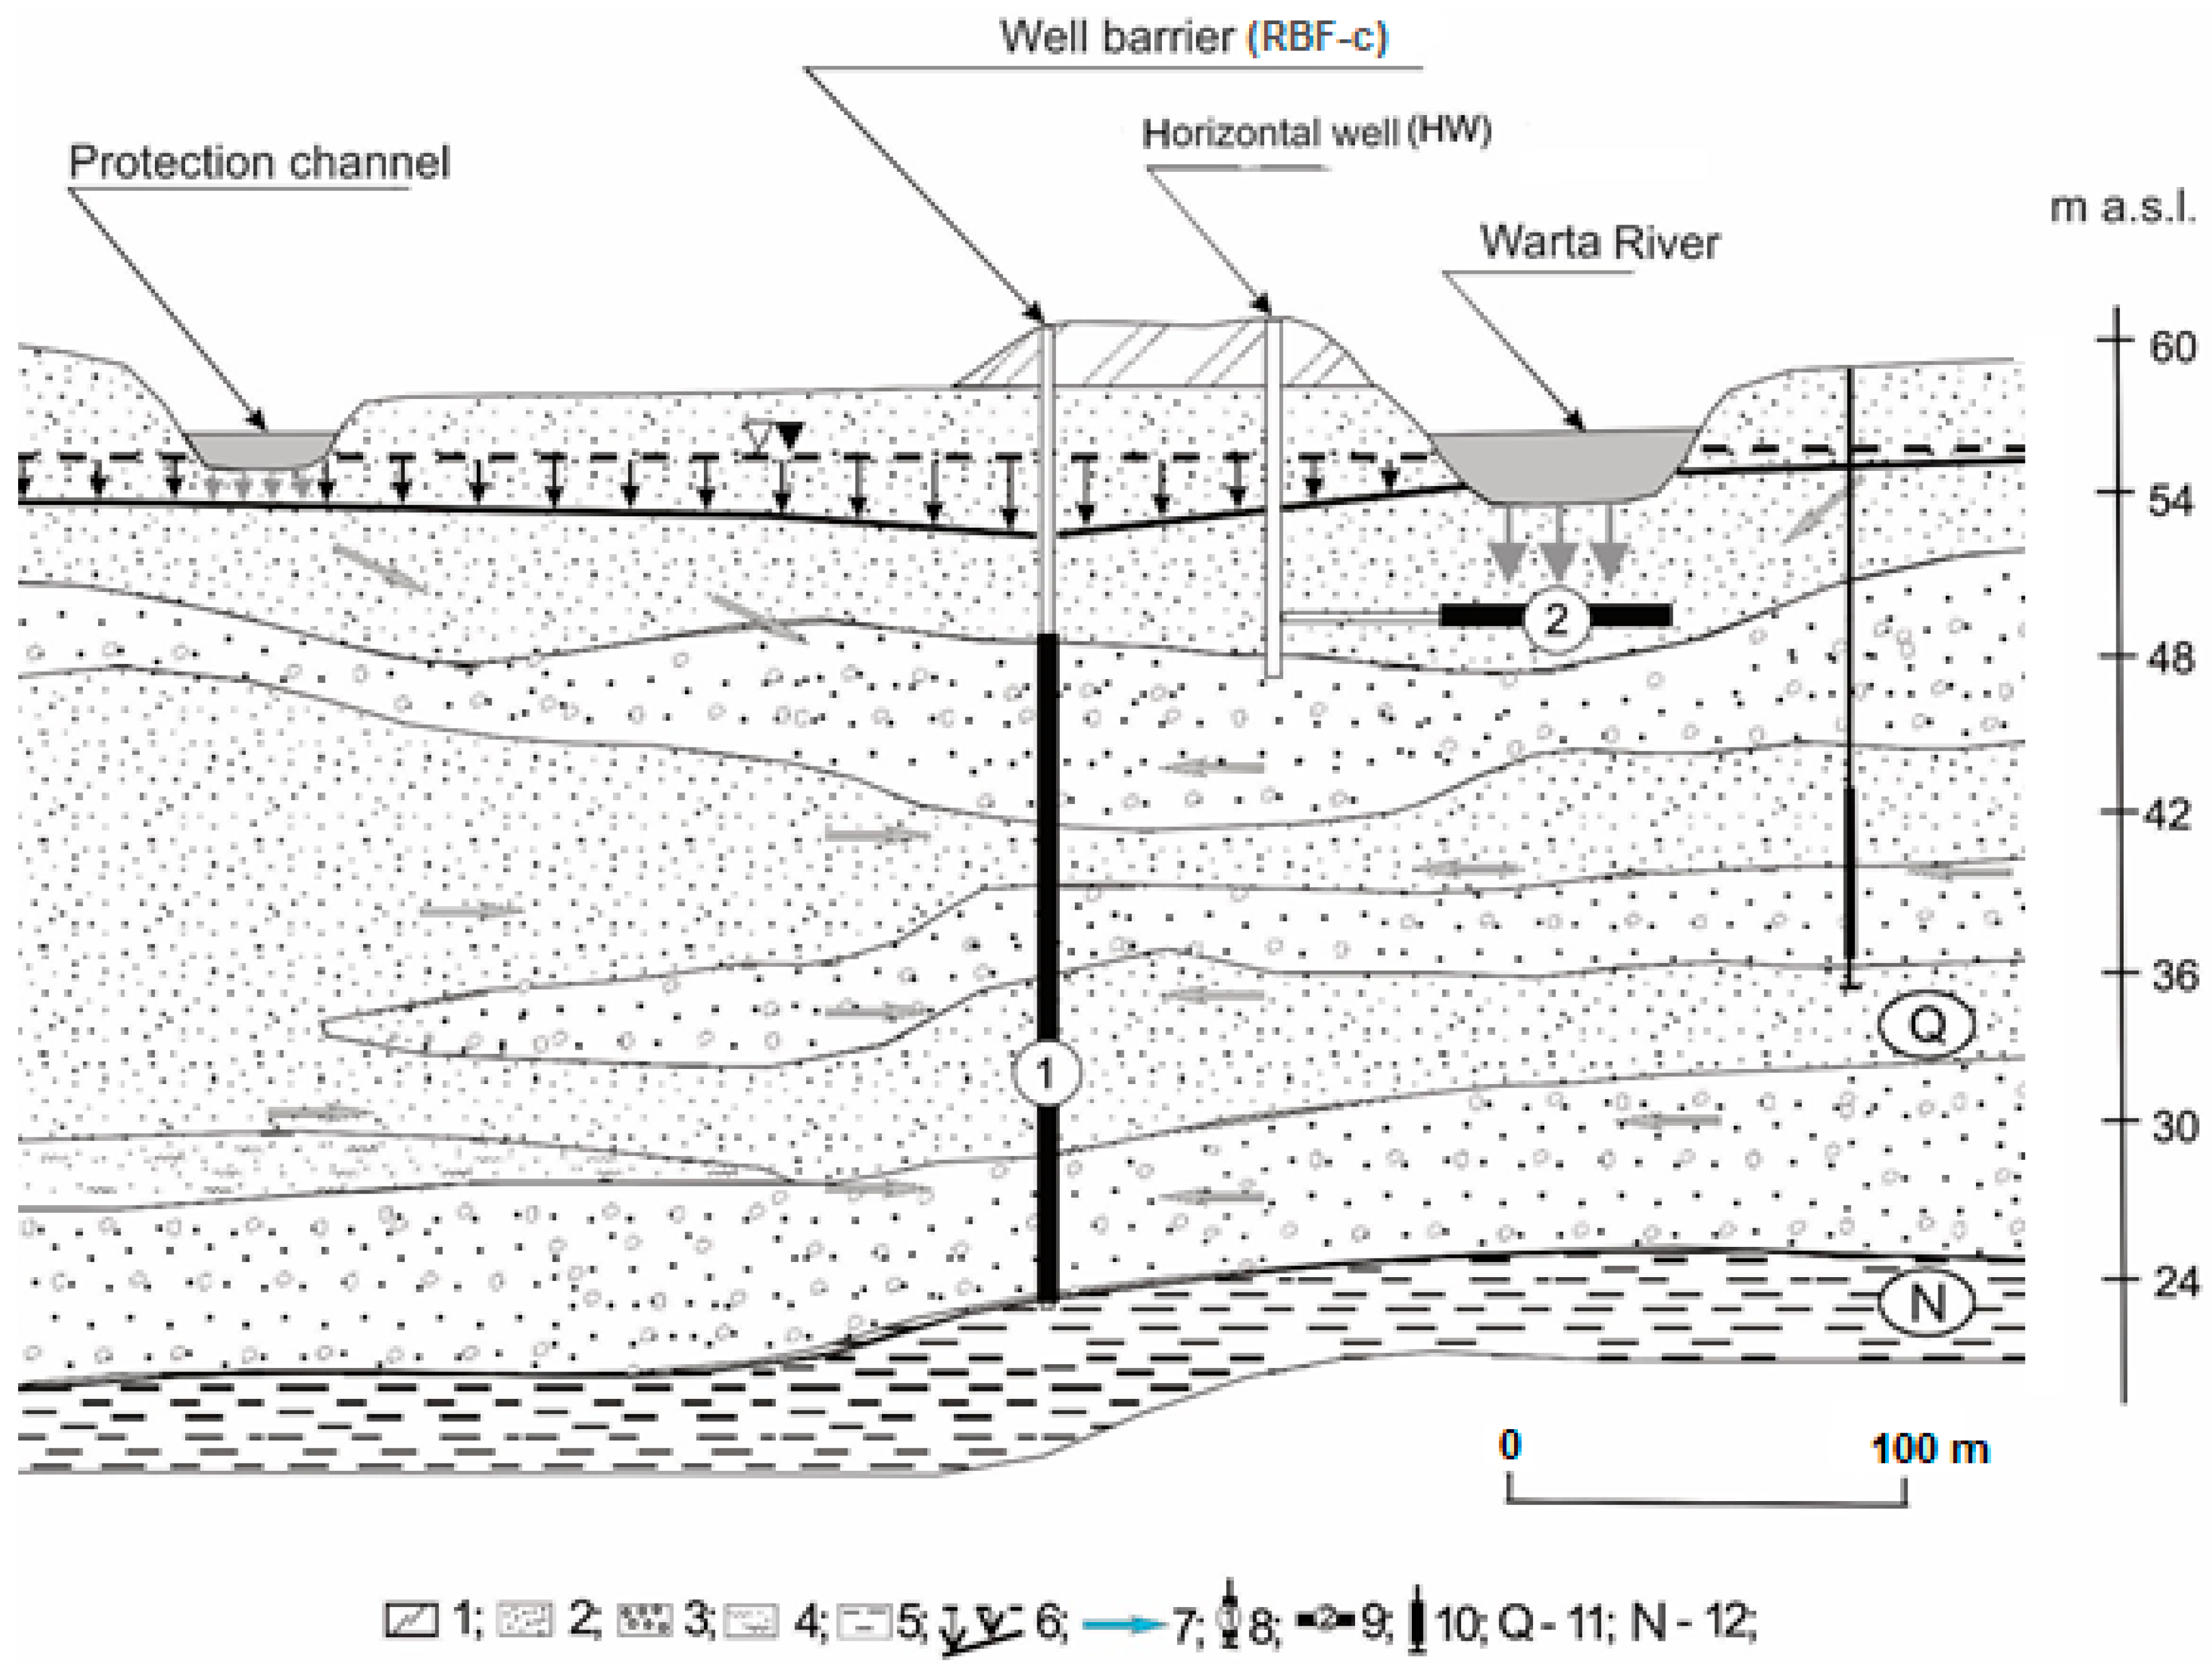
Figure 4.
Temporal changes of selected parameters in bank filtrate and Warta River water. (a) Colour, (b) COD, (c) DOC, (d) coliform bacteria, (e) nitrates, (f) ammonia.
Figure 4.
Temporal changes of selected parameters in bank filtrate and Warta River water. (a) Colour, (b) COD, (c) DOC, (d) coliform bacteria, (e) nitrates, (f) ammonia.


Figure 5.
Temporal changes of selected parameters in the horizontal well (HW) and the Warta River. (a) Colour, (b) COD, (c) DOC, (d) coliform bacteria, (e) nitrates, (f) ammonia.
Figure 5.
Temporal changes of selected parameters in the horizontal well (HW) and the Warta River. (a) Colour, (b) COD, (c) DOC, (d) coliform bacteria, (e) nitrates, (f) ammonia.
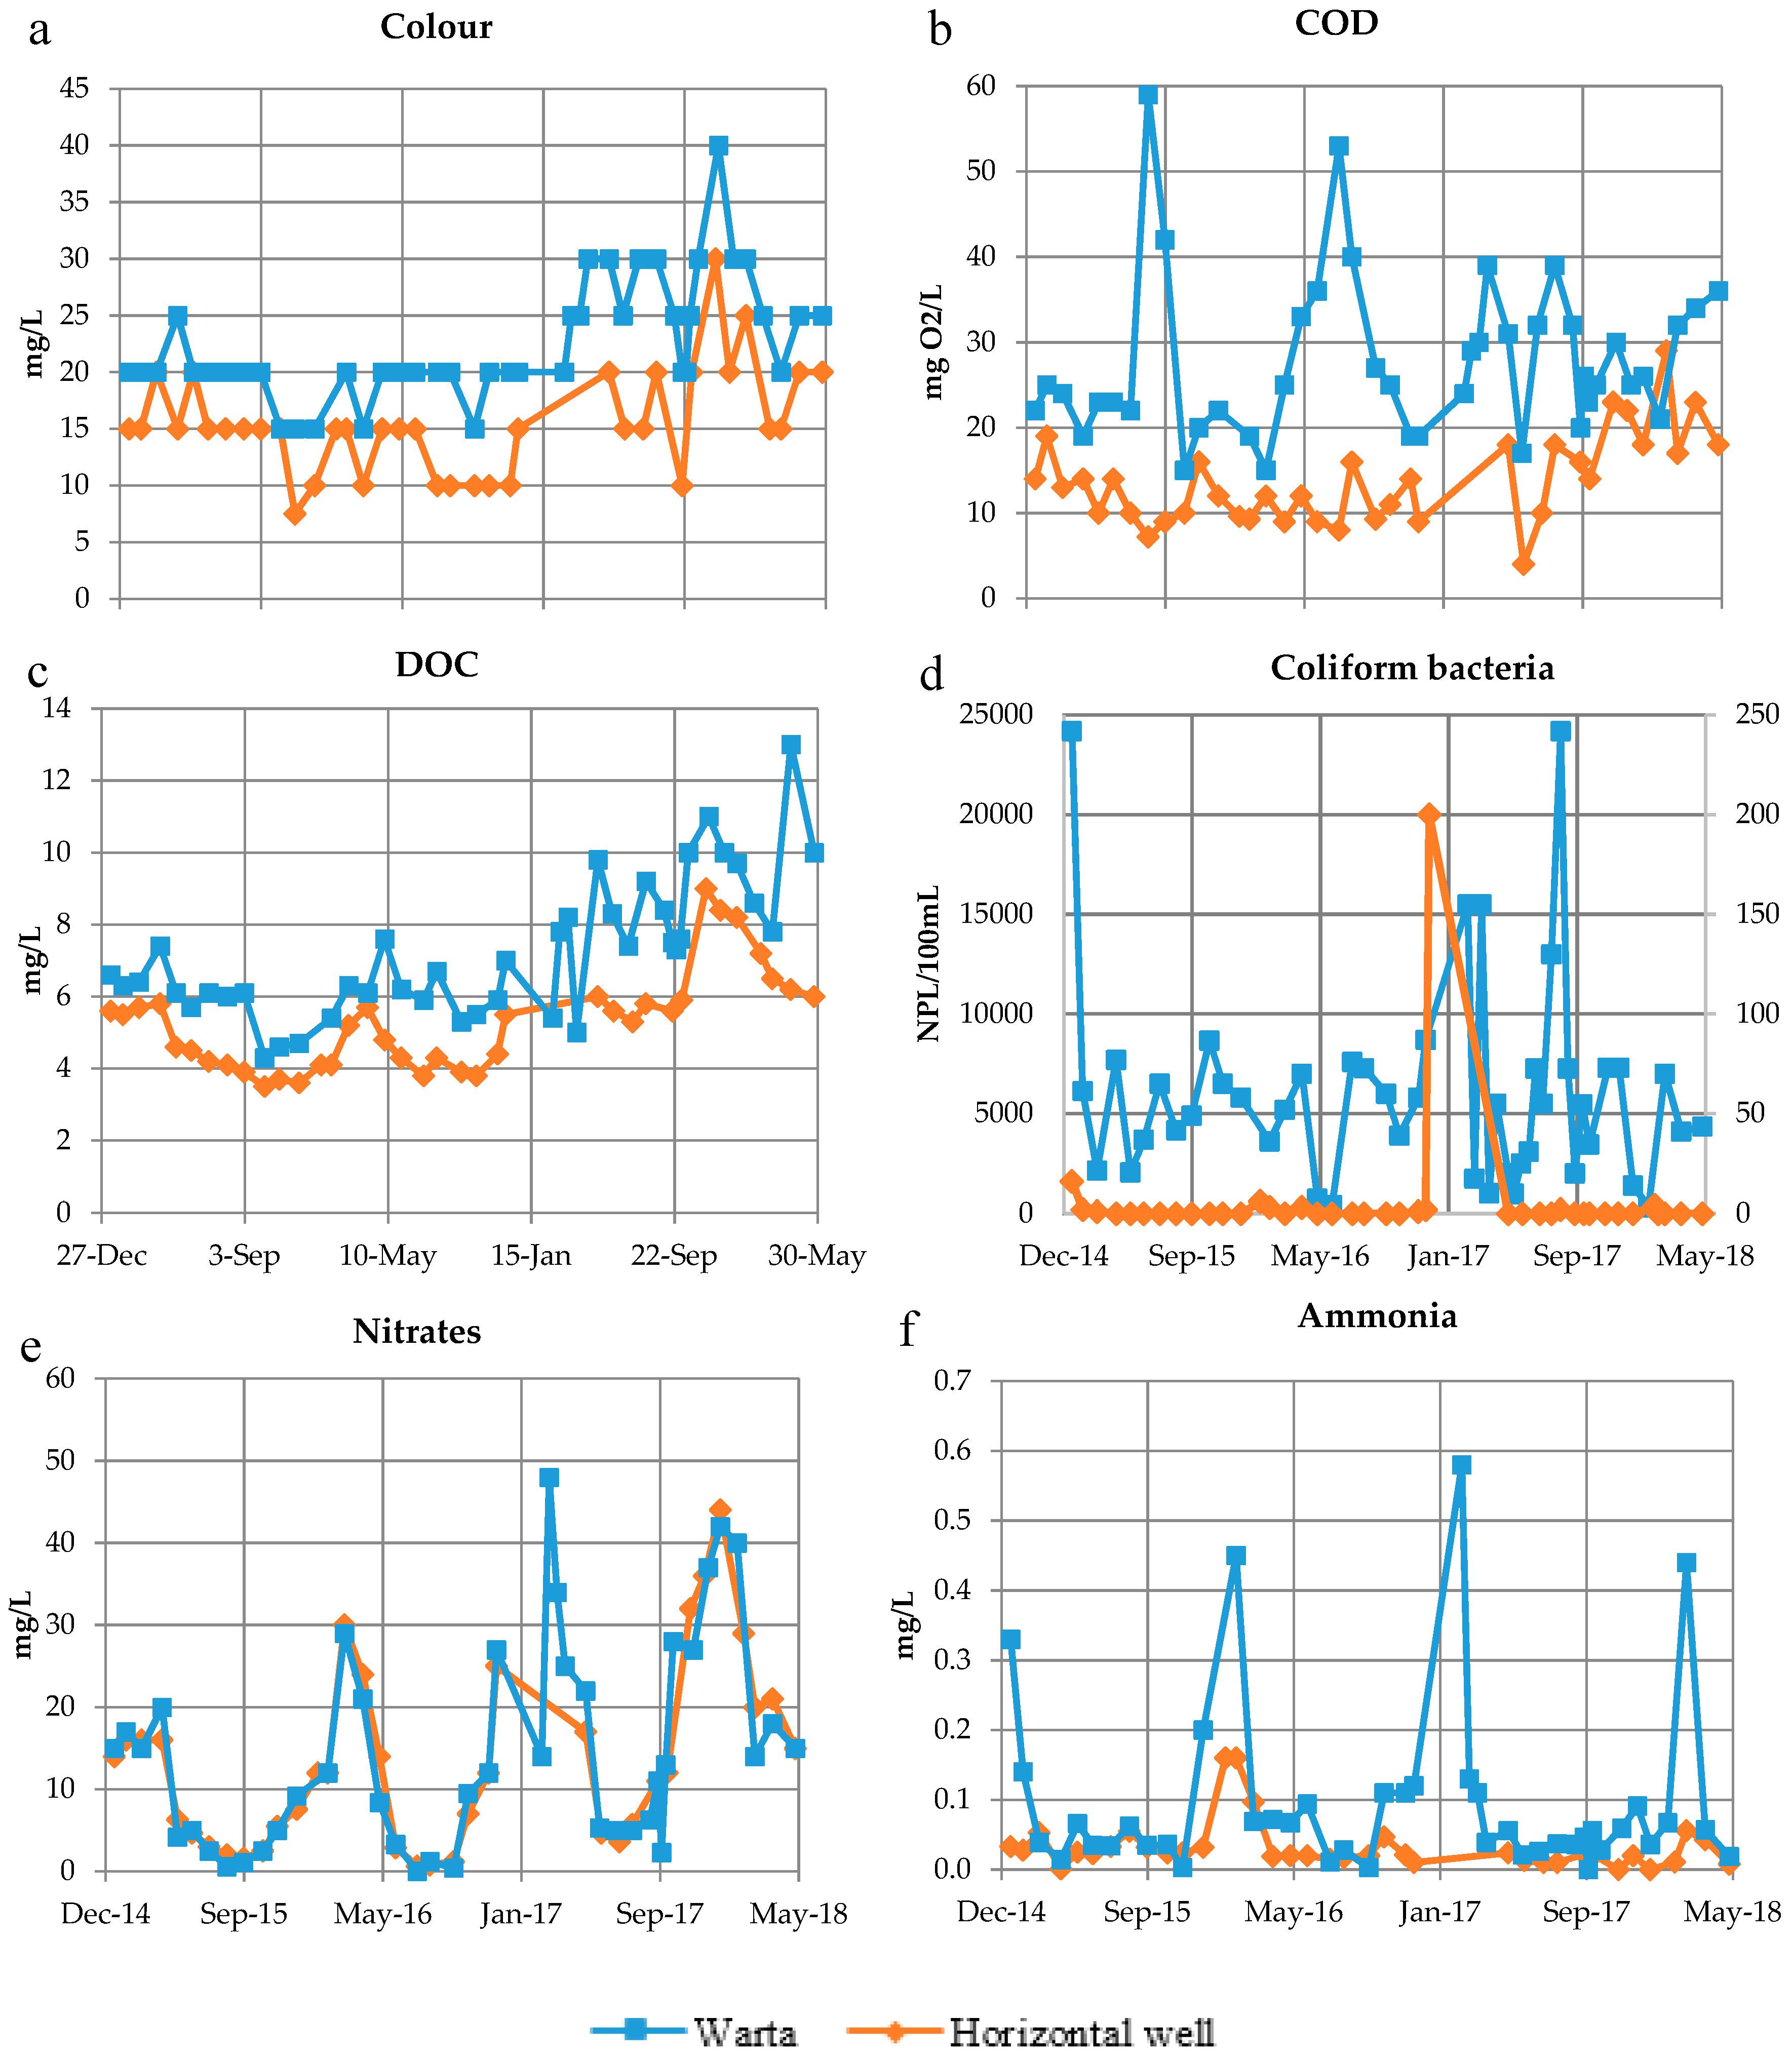
Figure 6.
Changes in total micropollutant concentrations along the flow path. Limit of Quantification (LOQ).
Figure 6.
Changes in total micropollutant concentrations along the flow path. Limit of Quantification (LOQ).

Figure 7.
Changes in the detected micropollutant concentrations along the flow path.
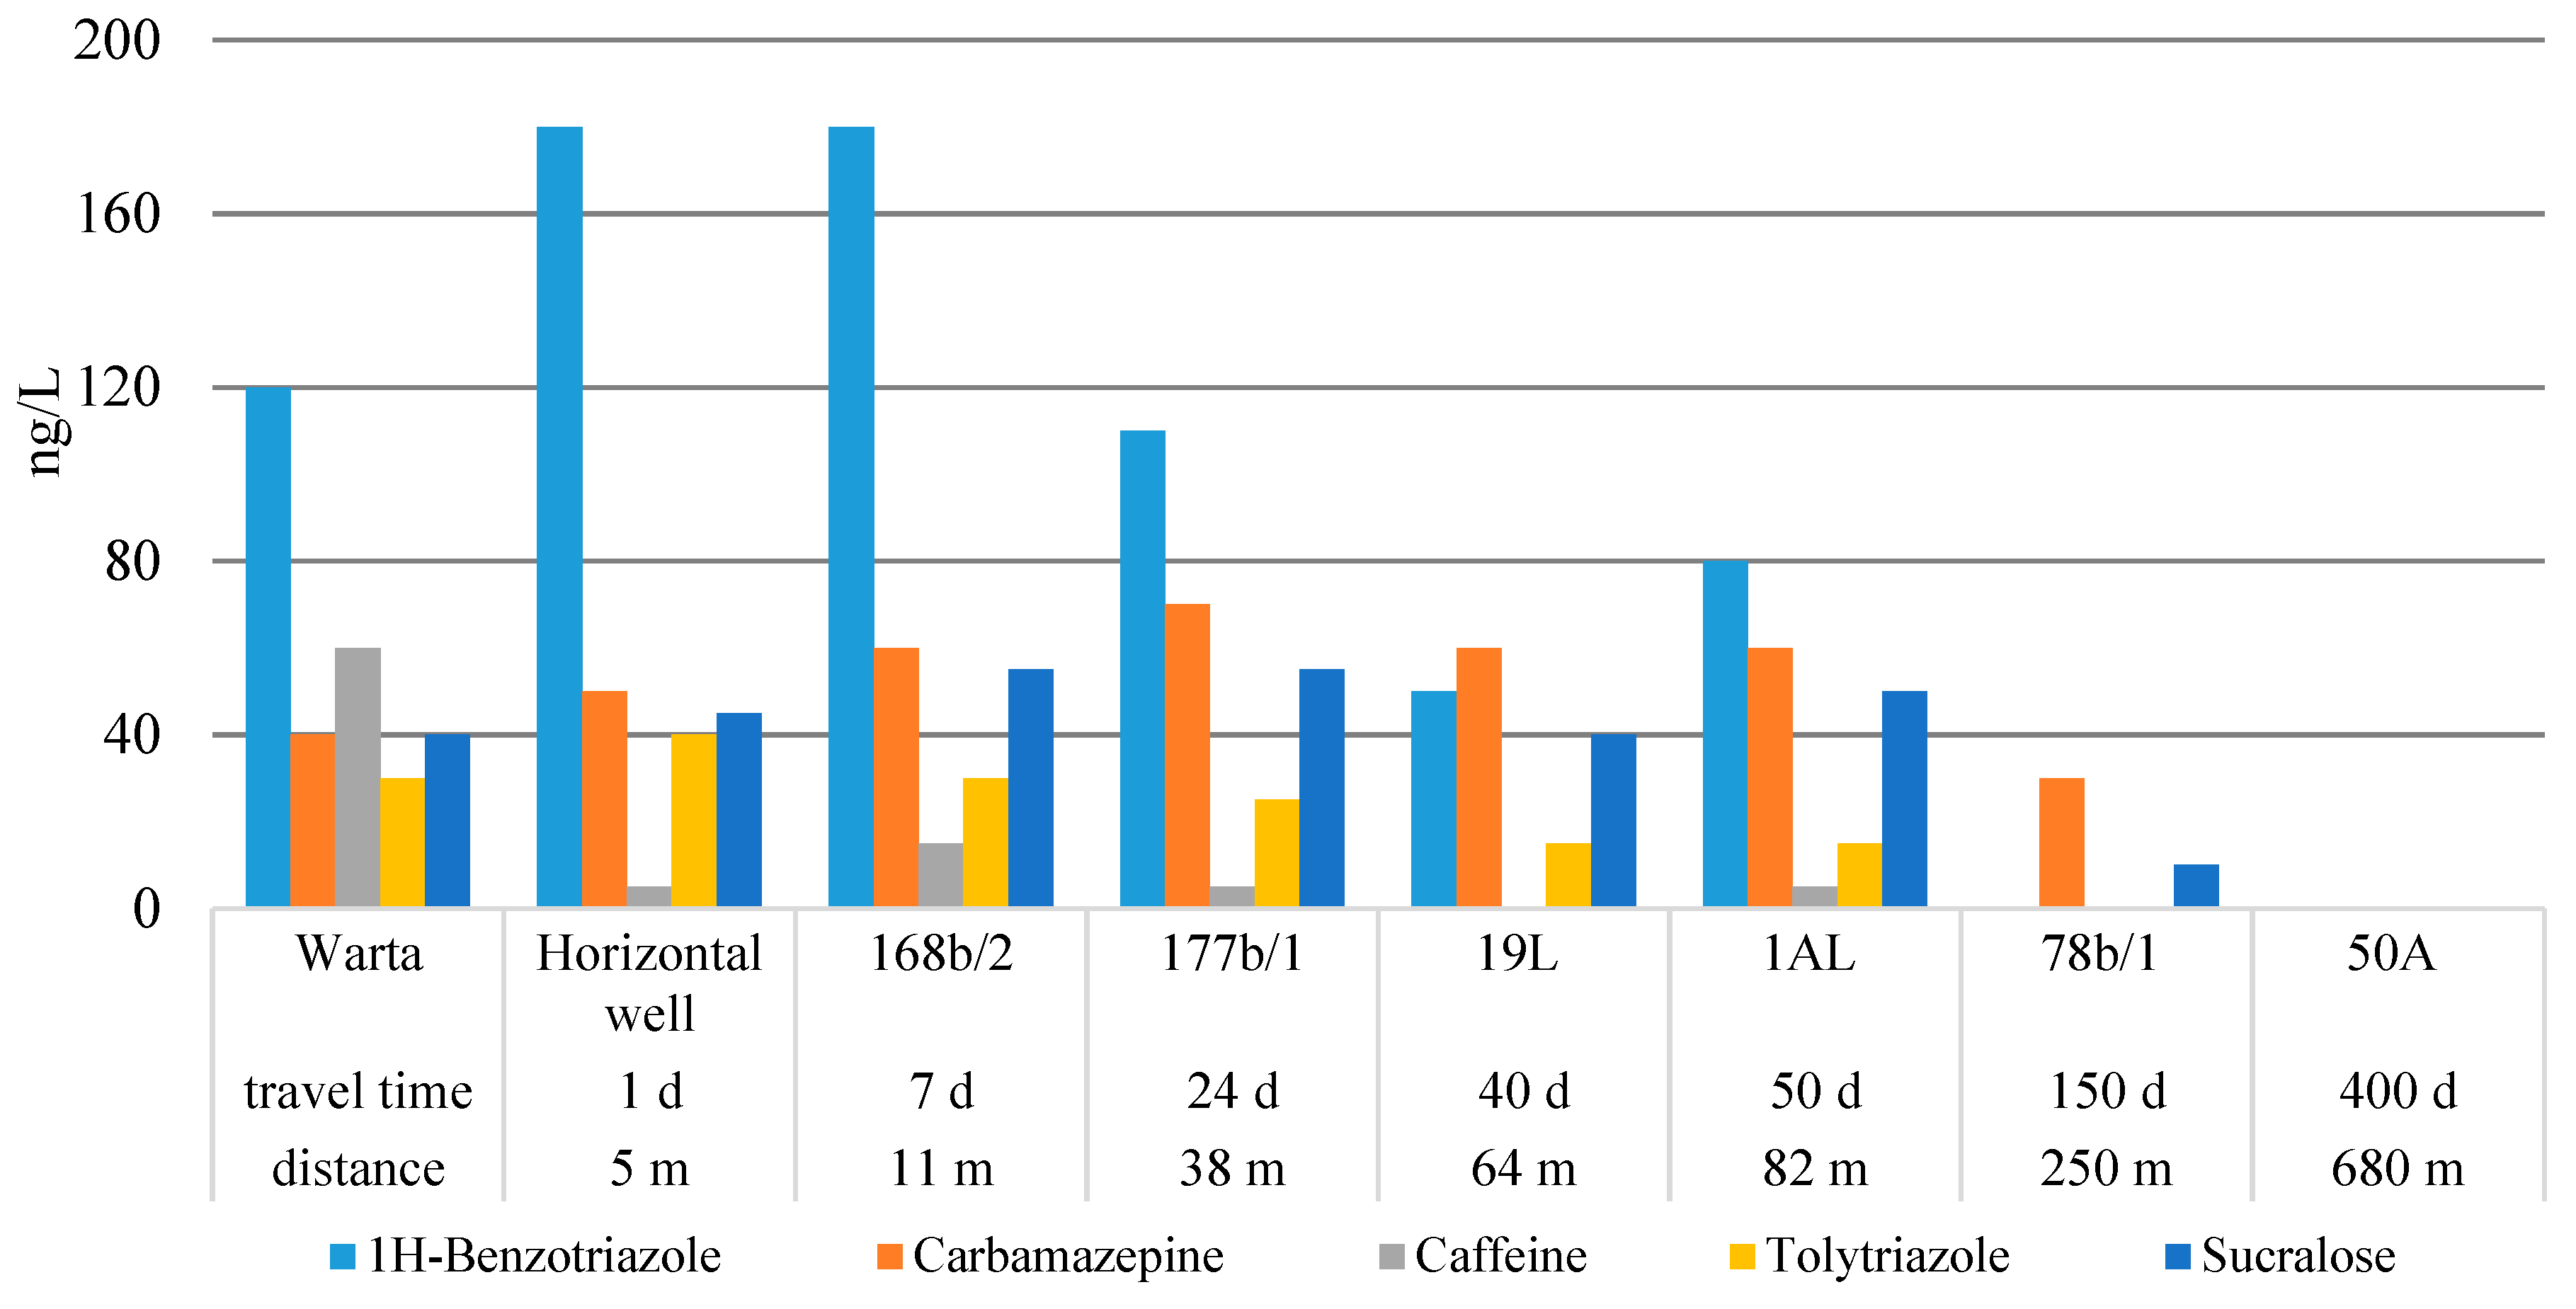
Figure 8.
The sum of pesticide concentrations along the flow path.

Table 1.
Statistical characteristics of the data set.
| Parameters | Colour (mg Pt/L) | EC (μS/cm) | NO3 (mg/L) | NO2 (mg/L) | NH4 (mg/L) | COD (mg O2/L) | DOC (mg/L) | Coliform Bacteria MPN/100 mL |
|---|---|---|---|---|---|---|---|---|
| Warta river (n = 37) | ||||||||
| Average | 25 | 624 | 18.6 | 0.09 | 0.10 | 28.2 | 8.4 | 6154 |
| Median | 25 | 619 | 14.0 | 0.09 | 0.06 | 28.0 | 8.0 | 5475 |
| Minimum | 20 | 542 | 0.5 | 0.03 | 0.02 | 17.0 | 5.0 | 308 |
| Maximum | 40 | 703 | 48.0 | 0.18 | 0.58 | 44.0 | 13.0 | 24,200 |
| Standard deviation | 4 | 49 | 13.0 | 0.04 | 0.13 | 6.6 | 1.8 | 5432 |
| Horizontal well (HW) (n = 32) | ||||||||
| Average | 17 | 626 | 18.4 | 0.02 | 0.02 | 16.5 | 6.2 | 1 |
| Median | 17 | 614 | 16.0 | 0.01 | 0.02 | 17.5 | 5.9 | 1 |
| Minimum | 10 | 539 | 3.6 | 0.00 | 0.00 | 4.0 | 3.8 | 0 |
| Maximum | 30 | 695 | 44.0 | 0.11 | 0.06 | 29.0 | 9.0 | 2 |
| Standard deviation | 5 | 56 | 12.0 | 0.03 | 0.02 | 6.2 | 1.5 | 1 |
| Reduction/Increase (average) | 32.5% | −0.4% | 0.9% | 74.8% | 80.5% | 41.5% | 26.01% | 99.98% |
| RBF barrier (Point H) (n = 21) | ||||||||
| Average | 13 | 650 | 7.8 | 0.09 | 0.19 | 13.8 | 5.0 | 0 |
| Median | 15 | 662 | 6.4 | 0.11 | 0.18 | 13.0 | 5.0 | 0 |
| Minimum | 7.5 | 581 | 0.0 | 0.02 | 0.12 | 3.0 | 3.9 | 0 |
| Maximum | 15 | 695 | 18.0 | 0.16 | 0.25 | 29.0 | 6.6 | 0 |
| Standard deviation | 2 | 33 | 6.8 | 0.04 | 0.04 | 5.2 | 0.7 | 0 |
| Reduction/Increase (average) | 49.8% | −4.3% | 58.1% | −6.9% | −91.5% | 51.1% | 40.3% | 100% |
| Well 19L (n = 10) | ||||||||
| Average | 15 | 614 | 0.58 | 0.03 | 0.19 | 9.8 | 5.0 | 0 |
| Median | 15 | 622 | 0.23 | 0.02 | 0.21 | 9.0 | 5.1 | 0 |
| Minimum | 10 | 580 | 0.00 | 0.01 | 0.10 | 3.0 | 4.3 | 0 |
| Maximum | 20 | 652 | 1.91 | 0.09 | 0.27 | 20.0 | 5.8 | 0 |
| Standard deviation | 4 | 29 | 0.68 | 0.03 | 0.07 | 6.83 | 0.6 | 0 |
| Reduction/Increase (average) | 42.1% | 1.5% | 96.9% | 64.2% | −99.9% | 65.3% | 40.4% | 100% |
| Well 1AL (n = 12) | ||||||||
| Average | 13.75 | 598 | 1.55 | 0.04 | 0.61 | 8.6 | 4.9 | 0 |
| Median | 10 | 612 | 1.23 | 0.03 | 0.42 | 8.5 | 4.9 | 0 |
| Minimum | 10 | 563 | 0.91 | 0.01 | 0.14 | 3.7 | 4.1 | 0 |
| Maximum | 25 | 618 | 2.83 | 0.12 | 1.18 | 15.0 | 5.4 | 0 |
| Standard deviation | 5 | 24 | 0.80 | 0.04 | 0.45 | 4.7 | 0.6 | 0 |
| Reduction/Increase (average) | 46.9% | 4.1% | 91.7% | 54.0% | -529% | 69.6% | 42.4% | 100% |
TDS—total dissolved solids; EC—electrical conductivity; COD—chemical oxygen demand; DOC—dissolved organic carbon; n—number of analyses; (-)—increase.
Table 2.
Concentration of relevant pharmaceuticals and other micropollutants in ng/L (Limit of Quantification (LOQ) < 5).
Table 2.
Concentration of relevant pharmaceuticals and other micropollutants in ng/L (Limit of Quantification (LOQ) < 5).
| Sampling Point | 1H-Benzotriazole | Carbamazepine | Caffeine | Sulfamethoxazole | Tolytriazole | Chlorothiazide | Ibuprofen | Sucralose | Sum |
|---|---|---|---|---|---|---|---|---|---|
| Warta River | 120 | 40 | 60 | 15 | 30 | <LOQ | 20 | 40 | 450 |
| Horizontal well | 180 | 50 | 5 | <LOQ | 40 | <LOQ | <LOQ | 45 | 320 |
| 168b/2 | 180 | 60 | 15 | <LOQ | 30 | <LOQ | <LOQ | 55 | 340 |
| 177b/1 | 110 | 70 | 5 | 15 | 25 | 5 | 40 | 55 | 325 |
| 19L | 50 | 60 | <LOQ | <LOQ | 15 | 10 | <LOQ | 40 | 175 |
| 1AL | 80 | 60 | 5 | <LOQ | 15 | 5 | <LOQ | 50 | 215 |
| 78b/1s | <LOQ | 30 | <LOQ | <LOQ | <LOQ | <LOQ | <LOQ | 10 | 40 |
| 50A | <LOQ | <LOQ | <LOQ | <LOQ | <LOQ | <LOQ | <LOQ | <LOQ | <LOQ |
Table 3.
Concentration of pesticides in μg/L (LOQ < 0.005).
| Sampling Period | Sampling Point | Imidacloprid | Isoproturon | M-Metalaxyl | Metazachlor | Nicosulfuron | Terbuthylazine | Chlortoluron | S-Metolachlor | Prometryn | Terbutryn | Sum |
|---|---|---|---|---|---|---|---|---|---|---|---|---|
| August 2017 | Warta | 0.007 | 0.008 | 0.005 | 0.036 | 0.012 | 0.008 | <LOQ | <LOQ | <LOQ | <LOQ | 0.112 |
| Horizontal well | 0.005 | <LOQ | 0.007 | 0.015 | 0.021 | 0.008 | <LOQ | <LOQ | <LOQ | <LOQ | 0.086 | |
| 168b/2 | 0.009 | 0.006 | 0.015 | <LOQ | 0.03 | 0.012 | 0.012 | 0.006 | 0.006 | <LOQ | 0.112 | |
| 177b/1 | 0.011 | <LOQ | 0.006 | <LOQ | 0.012 | 0.008 | 0.017 | 0.006 | 0.008 | <LOQ | 0.068 | |
| 19L | 0.007 | <LOQ | <LOQ | <LOQ | 0.017 | <LOQ | 0.018 | <LOQ | 0.007 | <LOQ | 0.049 | |
| 1AL | 0.005 | <LOQ | <LOQ | <LOQ | 0.016 | <LOQ | 0.016 | <LOQ | 0.008 | <LOQ | 0.045 | |
| 78b/1s | <LOQ | 0.012 | <LOQ | <LOQ | <LOQ | <LOQ | 0.007 | <LOQ | <LOQ | <LOQ | 0.019 | |
| 50A | <LOQ | <LOQ | <LOQ | <LOQ | <LOQ | <LOQ | <LOQ | <LOQ | <LOQ | <LOQ | ||
| November 2017 | Warta | <LOQ | 0.009 | 0.005 | 0.03 | 0.023 | 0.006 | 0.047 | 0.009 | <LOQ | 0.007 | 0.171 |
| Horizontal well | 0.007 | 0.007 | 0.005 | 0.021 | 0.019 | 0.007 | 0.032 | 0.008 | <LOQ | 0.007 | 0.137 | |
| 168b/2 | 0.008 | <LOQ | <LOQ | 0.007 | 0.018 | <LOQ | 0.005 | 0.005 | <LOQ | 0.006 | 0.058 | |
| 177b/1 | 0.007 | <LOQ | <LOQ | 0.007 | 0.017 | 0.007 | 0.008 | 0.006 | 0.006 | 0.008 | 0.076 | |
| 19L | 0.007 | <LOQ | <LOQ | <LOQ | 0.024 | <LOQ | 0.01 | 0.005 | 0.006 | 0.006 | 0.058 | |
| 1AL | 0.007 | 0.006 | <LOQ | <LOQ | 0.02 | <LOQ | 0.012 | 0.006 | 0.007 | 0.006 | 0.064 | |
| 78b/1s | <LOQ | 0.014 | <LOQ | <LOQ | <LOQ | <LOQ | 0.009 | <LOQ | <LOQ | <LOQ | 0.023 | |
| 50A | <LOQ | <LOQ | <LOQ | <LOQ | <LOQ | <LOQ | <LOQ | <LOQ | <LOQ | <LOQ | ||
| February 2018 | Warta | 0.005 | 0.008 | <LOQ | <LOQ | <LOQ | <LOQ | 0.012 | <LOQ | 0.006 | <LOQ | 0.031 |
| Horizontal well | <LOQ | 0.006 | <LOQ | <LOQ | <LOQ | <LOQ | 0.013 | <LOQ | 0.005 | <LOQ | 0.024 | |
| 168b/2 | <LOQ | <LOQ | <LOQ | <LOQ | <LOQ | <LOQ | 0.005 | <LOQ | <LOQ | <LOQ | 0.005 | |
| 177b/1 | <LOQ | <LOQ | <LOQ | <LOQ | <LOQ | <LOQ | <LOQ | <LOQ | <LOQ | <LOQ | ||
| 19L | <LOQ | 0.005 | <LOQ | <LOQ | <LOQ | <LOQ | 0.009 | <LOQ | <LOQ | <LOQ | 0.014 | |
| 1AL | <LOQ | 0.005 | <LOQ | <LOQ | <LOQ | <LOQ | 0.009 | <LOQ | <LOQ | <LOQ | 0.014 | |
| 78b/1s | <LOQ | 0.015 | <LOQ | <LOQ | <LOQ | <LOQ | 0.009 | <LOQ | <LOQ | <LOQ | 0.024 | |
| 50A | <LOQ | 0.008 | <LOQ | <LOQ | <LOQ | <LOQ | <LOQ | <LOQ | <LOQ | <LOQ | 0.008 |
© 2018 by the authors. Licensee MDPI, Basel, Switzerland. This article is an open access article distributed under the terms and conditions of the Creative Commons Attribution (CC BY) license (http://creativecommons.org/licenses/by/4.0/).
Share and Cite
MDPI and ACS Style
Dragon, K.; Górski, J.; Kruć, R.; Drożdżyński, D.; Grischek, T. Removal of Natural Organic Matter and Organic Micropollutants during Riverbank Filtration in Krajkowo, Poland. Water 2018, 10, 1457. https://doi.org/10.3390/w10101457
AMA Style
Dragon K, Górski J, Kruć R, Drożdżyński D, Grischek T. Removal of Natural Organic Matter and Organic Micropollutants during Riverbank Filtration in Krajkowo, Poland. Water. 2018; 10(10):1457. https://doi.org/10.3390/w10101457
Chicago/Turabian StyleDragon, Krzysztof, Józef Górski, Roksana Kruć, Dariusz Drożdżyński, and Thomas Grischek. 2018. "Removal of Natural Organic Matter and Organic Micropollutants during Riverbank Filtration in Krajkowo, Poland" Water 10, no. 10: 1457. https://doi.org/10.3390/w10101457
Note that from the first issue of 2016, this journal uses article numbers instead of page numbers. See further details here.