Article

Assessing the Impact of LAI Data Assimilation on Simulations of the Soil Water Balance and Maize Development Using MOHID-Land

1
Centro de Ciência e Tecnologia do Ambiente e do Mar (MARETEC), Instituto Superior Técnico, Universidade de Lisboa, Av. Rovisco Pais, 1, 1049-001 Lisboa, Portugal
2
Centro de Investigação em Agronomia, Alimentos, Ambiente e Paisagem (LEAF), Instituto Superior de Agronomia, Universidade de Lisboa, Tapada da Ajuda, 1349-017 Lisboa, Portugal
*
Author to whom correspondence should be addressed.
Water 2018, 10(10), 1367; https://doi.org/10.3390/w10101367
Submission received: 8 August 2018 / Revised: 13 September 2018 / Accepted: 27 September 2018 / Published: 30 September 2018
(This article belongs to the Special Issue Innovation Issues in Water, Agriculture and Food)

Abstract

:
Hydrological modeling at the catchment scale requires the upscaling of many input parameters for better characterizing landscape heterogeneity, including soil, land use and climate variability. In this sense, remote sensing is often considered as a practical solution. This study aimed to access the impact of assimilation of leaf area index (LAI) data derived from Landsat 8 imagery on MOHID-Land’s simulations of the soil water balance and maize state variables (LAI, canopy height, aboveground dry biomass and yield). Data assimilation impacts on final model results were first assessed by comparing distinct modeling approaches to measured data. Then, the uncertainty related to assimilated LAI values was quantified on final model results using a Monte Carlo method. While LAI assimilation improved MOHID-Land’s estimates of the soil water balance and simulations of crop state variables during early stages, it was never sufficient to overcome the absence of a local calibrated crop dataset. Final model estimates further showed great uncertainty for LAI assimilated values during earlier crop stages, decreasing then with season reaching its end. Thus, while model simulations can be improved using LAI data assimilation, additional data sources should be considered for complementing crop parameterization.

1. Introduction

In recent decades, modeling has become an essential part of the decision-making process for improving irrigation water use [1,2,3,4], optimizing fertilization practices [5,6], predicting crop yields [7,8] and coping with climate change [9,10] at the field and regional scales. However, modeling tools require first a considerable time investment in calibration to provide feasible results to their users. This is often accomplished at the plot scale, where most variables influencing crop development (soil properties, plant physiology, groundwater levels and weather conditions) can be more easily monitored. The problem often arises when upscaling to the field or regional scales due to the difficulties in portraying landscape heterogeneity, including soil, land use and climate variability.
Remote sensing technology offers today a potential solution for accurately and reliably describing the spatial distribution of soil properties and canopy state variables (leaf area index, canopy height, biomass) at the field and regional scales [11]. A vast number of new satellite sensors (Landsat 8, Sentinel-2, Spot-6, RapidEye, Huanjing-1) together with versatile, light-weighted and low-cost sensors mounted in farm tractors or unmanned aerial vehicles are now available for providing information with high spatial and temporal resolution to farmers and technicians. This information can potentially be also assimilated into field or regional scale models, overcoming many constraints in terms of input parameterization.
The purpose of assimilation is to optimize model input parameters by integrating, both in space and time, soil or canopy state variables derived from remote sensing methods [12]. Accurate and up-to-date information has been increasingly available at low cost, which has led to numerous research studies focusing on assimilation of remote sensing measurements [13,14,15,16,17,18,19]. Some of these have estimated leaf area index (LAI) using different remote sensing data sources, then assimilating those values by directly replacing the simulated LAI to improve model estimates of the aboveground dry biomass, yield and crop transpiration [14,17]. Other studies have used more advanced assimilation techniques, usually based on the Extended Kalman Filter [20] and Ensemble Kalman Filter [21] assimilation methods, for integrating remote sensing LAI into model simulations [15,16,19]. Overall, regardless of the technique used, most of those studies concluded that remote sensing provides useful measurements which can then be used for improving model simulations.
While a wide variety of models exist capable of simulating crop growth processes at the regional scale, thus portraying landscape heterogeneity at some extent [22,23,24], fully distributed process-based models such as MIKE SHE [25], SHETRAN [26] and MOHID-Land [27] are often considered ideal for further studying distributed state variables (the spatiotemporal variability of soil moisture) and flow paths (sediment and nutrient transport) [28]. These fully distributed process-based models consider interactions between multiple components of the soil-water-atmosphere continuum, with fundamental process being formulated at fine spatial (plot) and temporal scales, contributing to the overall dynamics at a higher organizational level, such as the watershed [28]. For the case of MOHID-Land, the model has been used for improving irrigation practices at the plot and field scales [3,29,30], understanding the contribution of flood events to the eutrophication of water reservoirs [31,32] and forecasting fresh water quantity and quality in coastal rivers [33]. Extensive calibration has been normally required for characterizing soil, groundwater, crop and river flow properties. Thus, data assimilation may have here a decisive contribution for more accurately describing the spatial and temporal variability of many of the required input parameters. However, the impact of data assimilation on final model outputs needs to be first assessed.
The main objective of this study was thus to understand the impact of LAI assimilation on MOHID-Land’s estimates of the soil water balance and crop state variables (LAI, canopy height, aboveground dry biomass and yield). The hypothesis addressed were that (i) the MOHID-Land model could accurately estimate the soil water balance and aboveground biomass growth in a one-dimensional domain; (ii) LAI assimilation could improve simulations of crop development and (iii) the related uncertainties could be assessed. Results from this study will help to improve hydrological modeling at the field and regional scales by quantifying the uncertainty related to data assimilation using the MOHID-Land model.

2. Materials and Methods

2.1. Field Site Description and Data

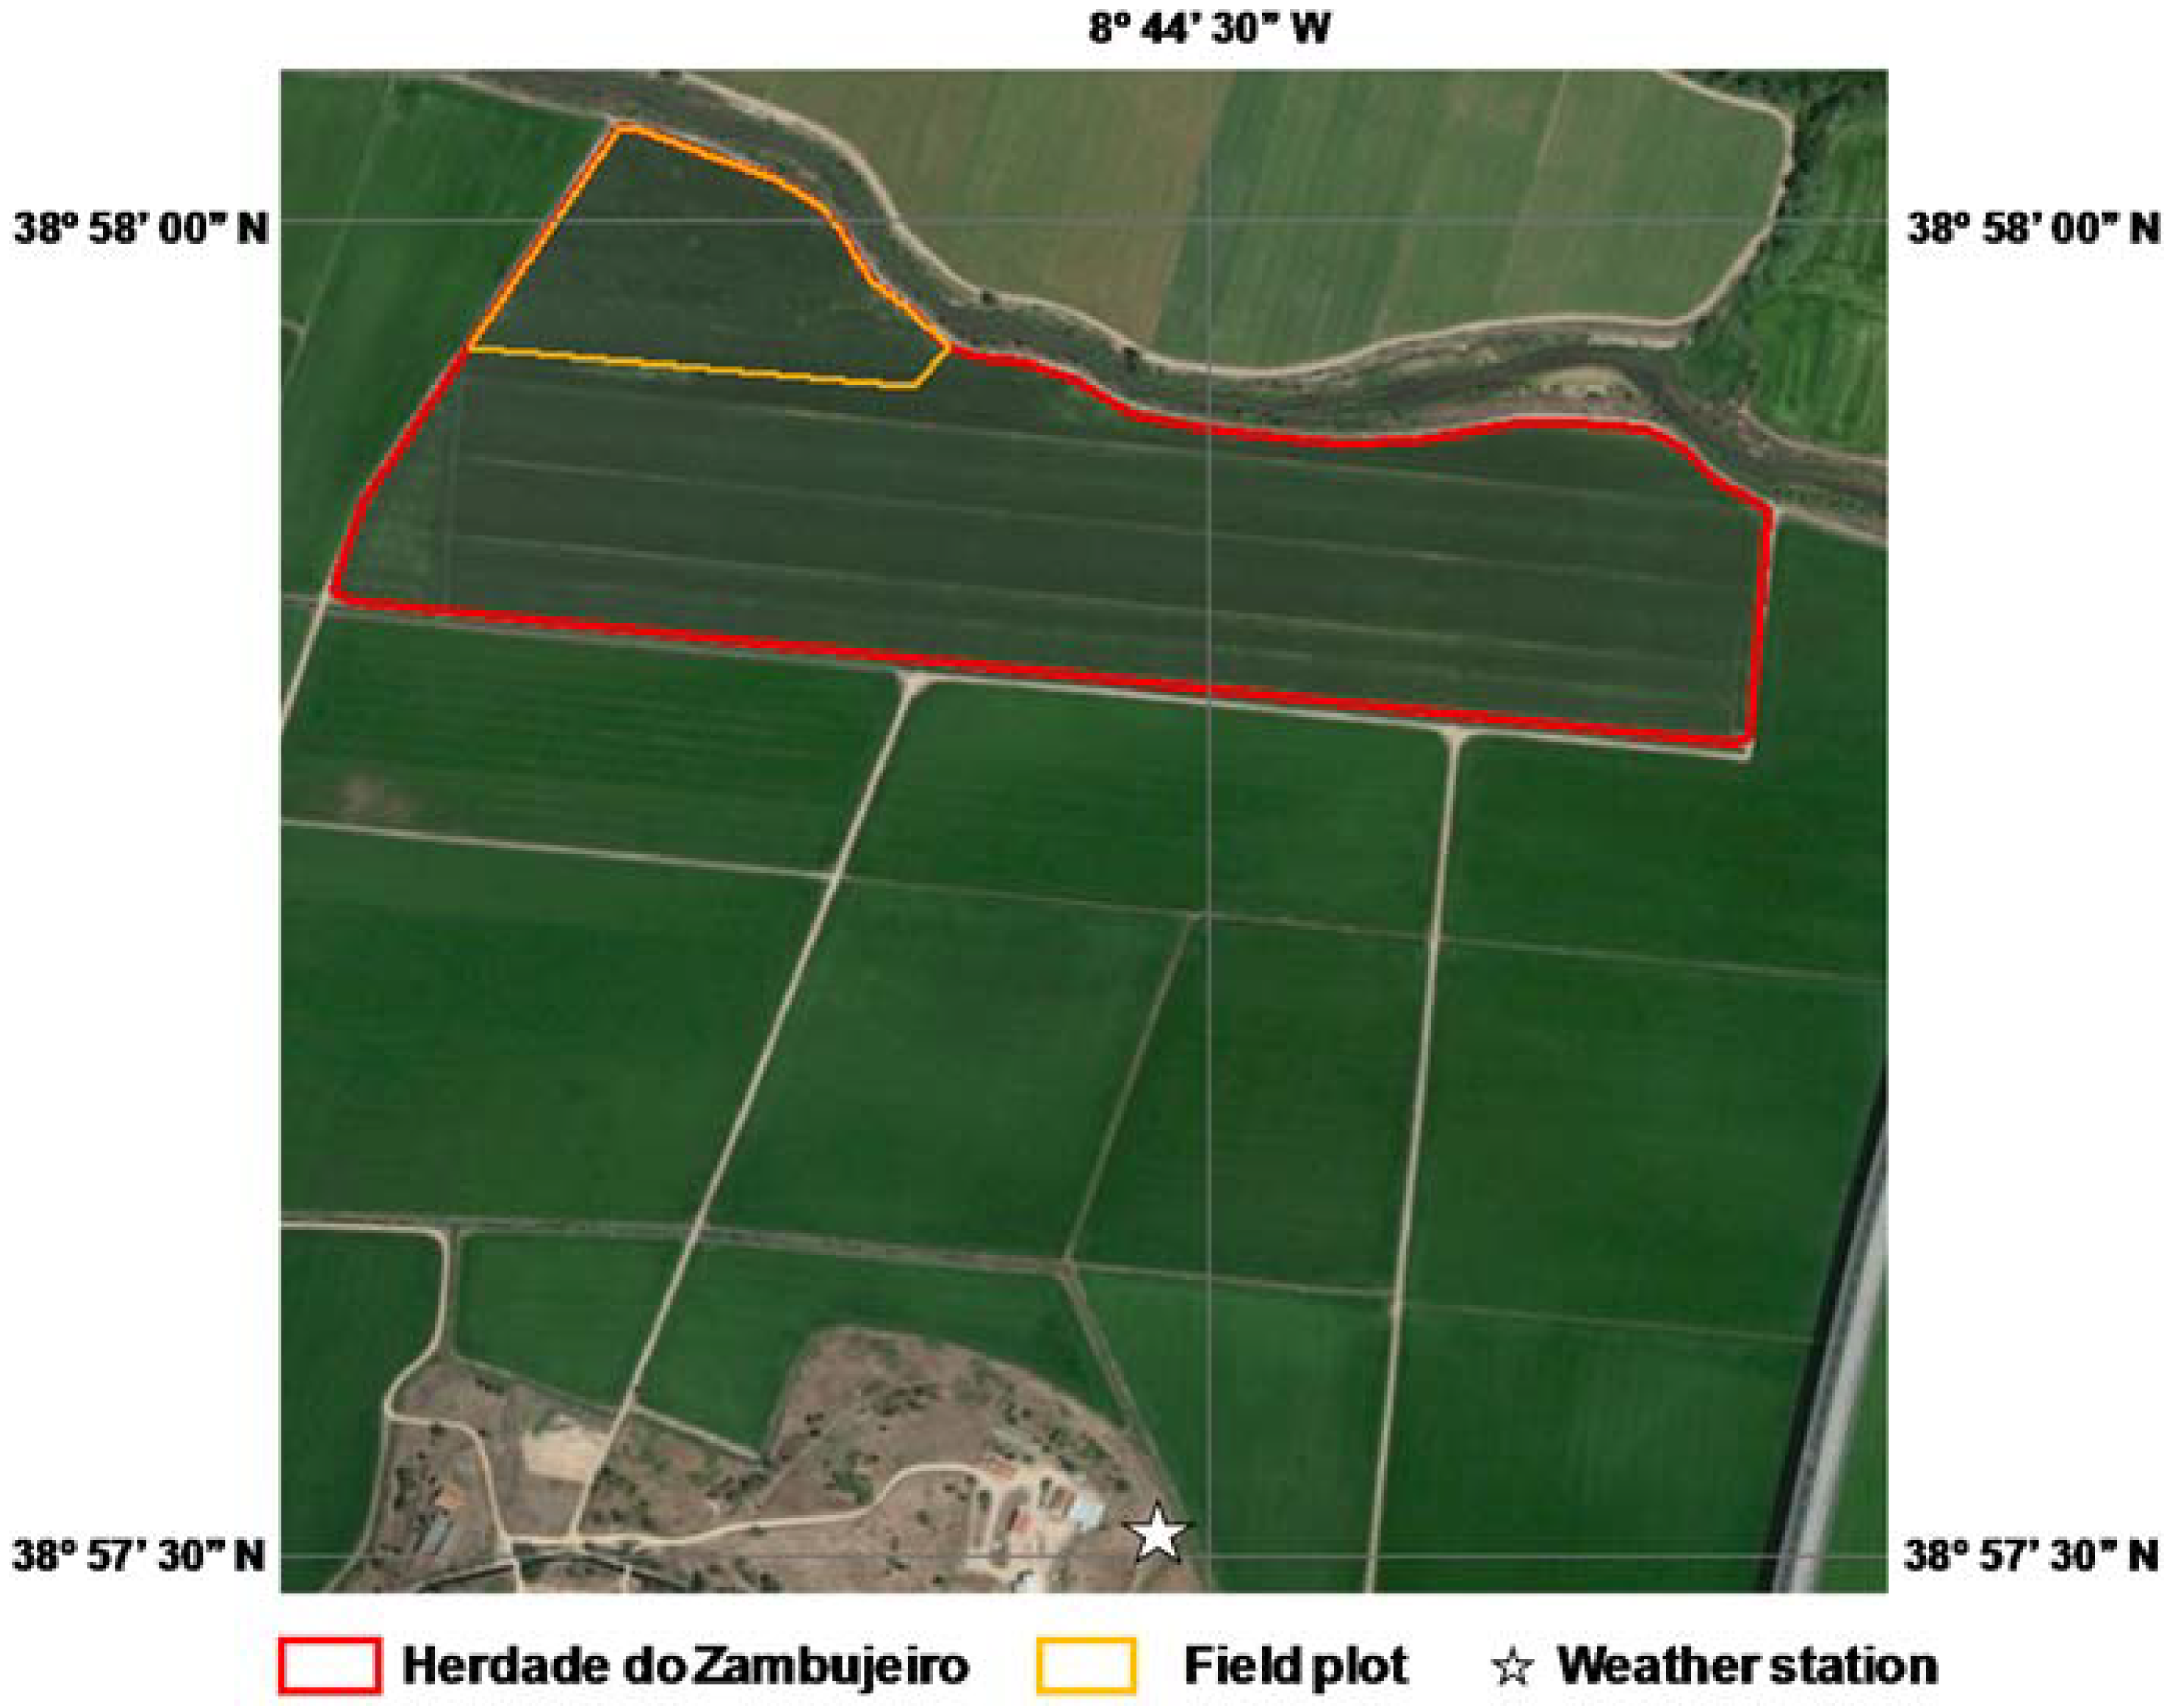
Field data used in this study was collected at Herdade do Zambujeiro (22 ha), Benavente, southern Portugal (38°58′0.97′′ N, 8°44′46.63′′ W, 6 m a.s.l.) (Figure 1). The climate in the region is semi-arid to dry sub-humid, with hot dry summers and mild winters with irregular rainfall. The mean annual temperature is 16.8 °C, with the mean daily temperatures at the coolest (January) and warmest (August) months reaching 11.4 and 22.7 °C, respectively. The mean annual precipitation is 668 mm, mostly occurring between October and May. The soil was a Haplic Fluvisol [34], with the main soil physical and chemical properties presented in Table 1. The bottom layers exhibited higher dry bulk density and lower measured saturated hydraulic conductivity values than the topsoil layers [3], evidencing some soil compaction due to tillage operations carried out throughout the years and the relatively high soil moisture that was constant along the seasons because of the shallow groundwater levels.
The MOHID-Land model was previously implemented in the area by Ramos et al. [3]. These authors evaluated the model’s capacity in predicting soil water contents and fluxes and the evolution of different crop growth parameters, including the leaf area index (LAI), canopy height, aboveground dry biomass and yields during the 2014 and 2015 maize growing seasons. Details on the calibration/validation approach can be found in the cited reference. For that, the field was cropped with maize hybrid P1574 (FAO 600) with a density of approximately 89,000 plants ha
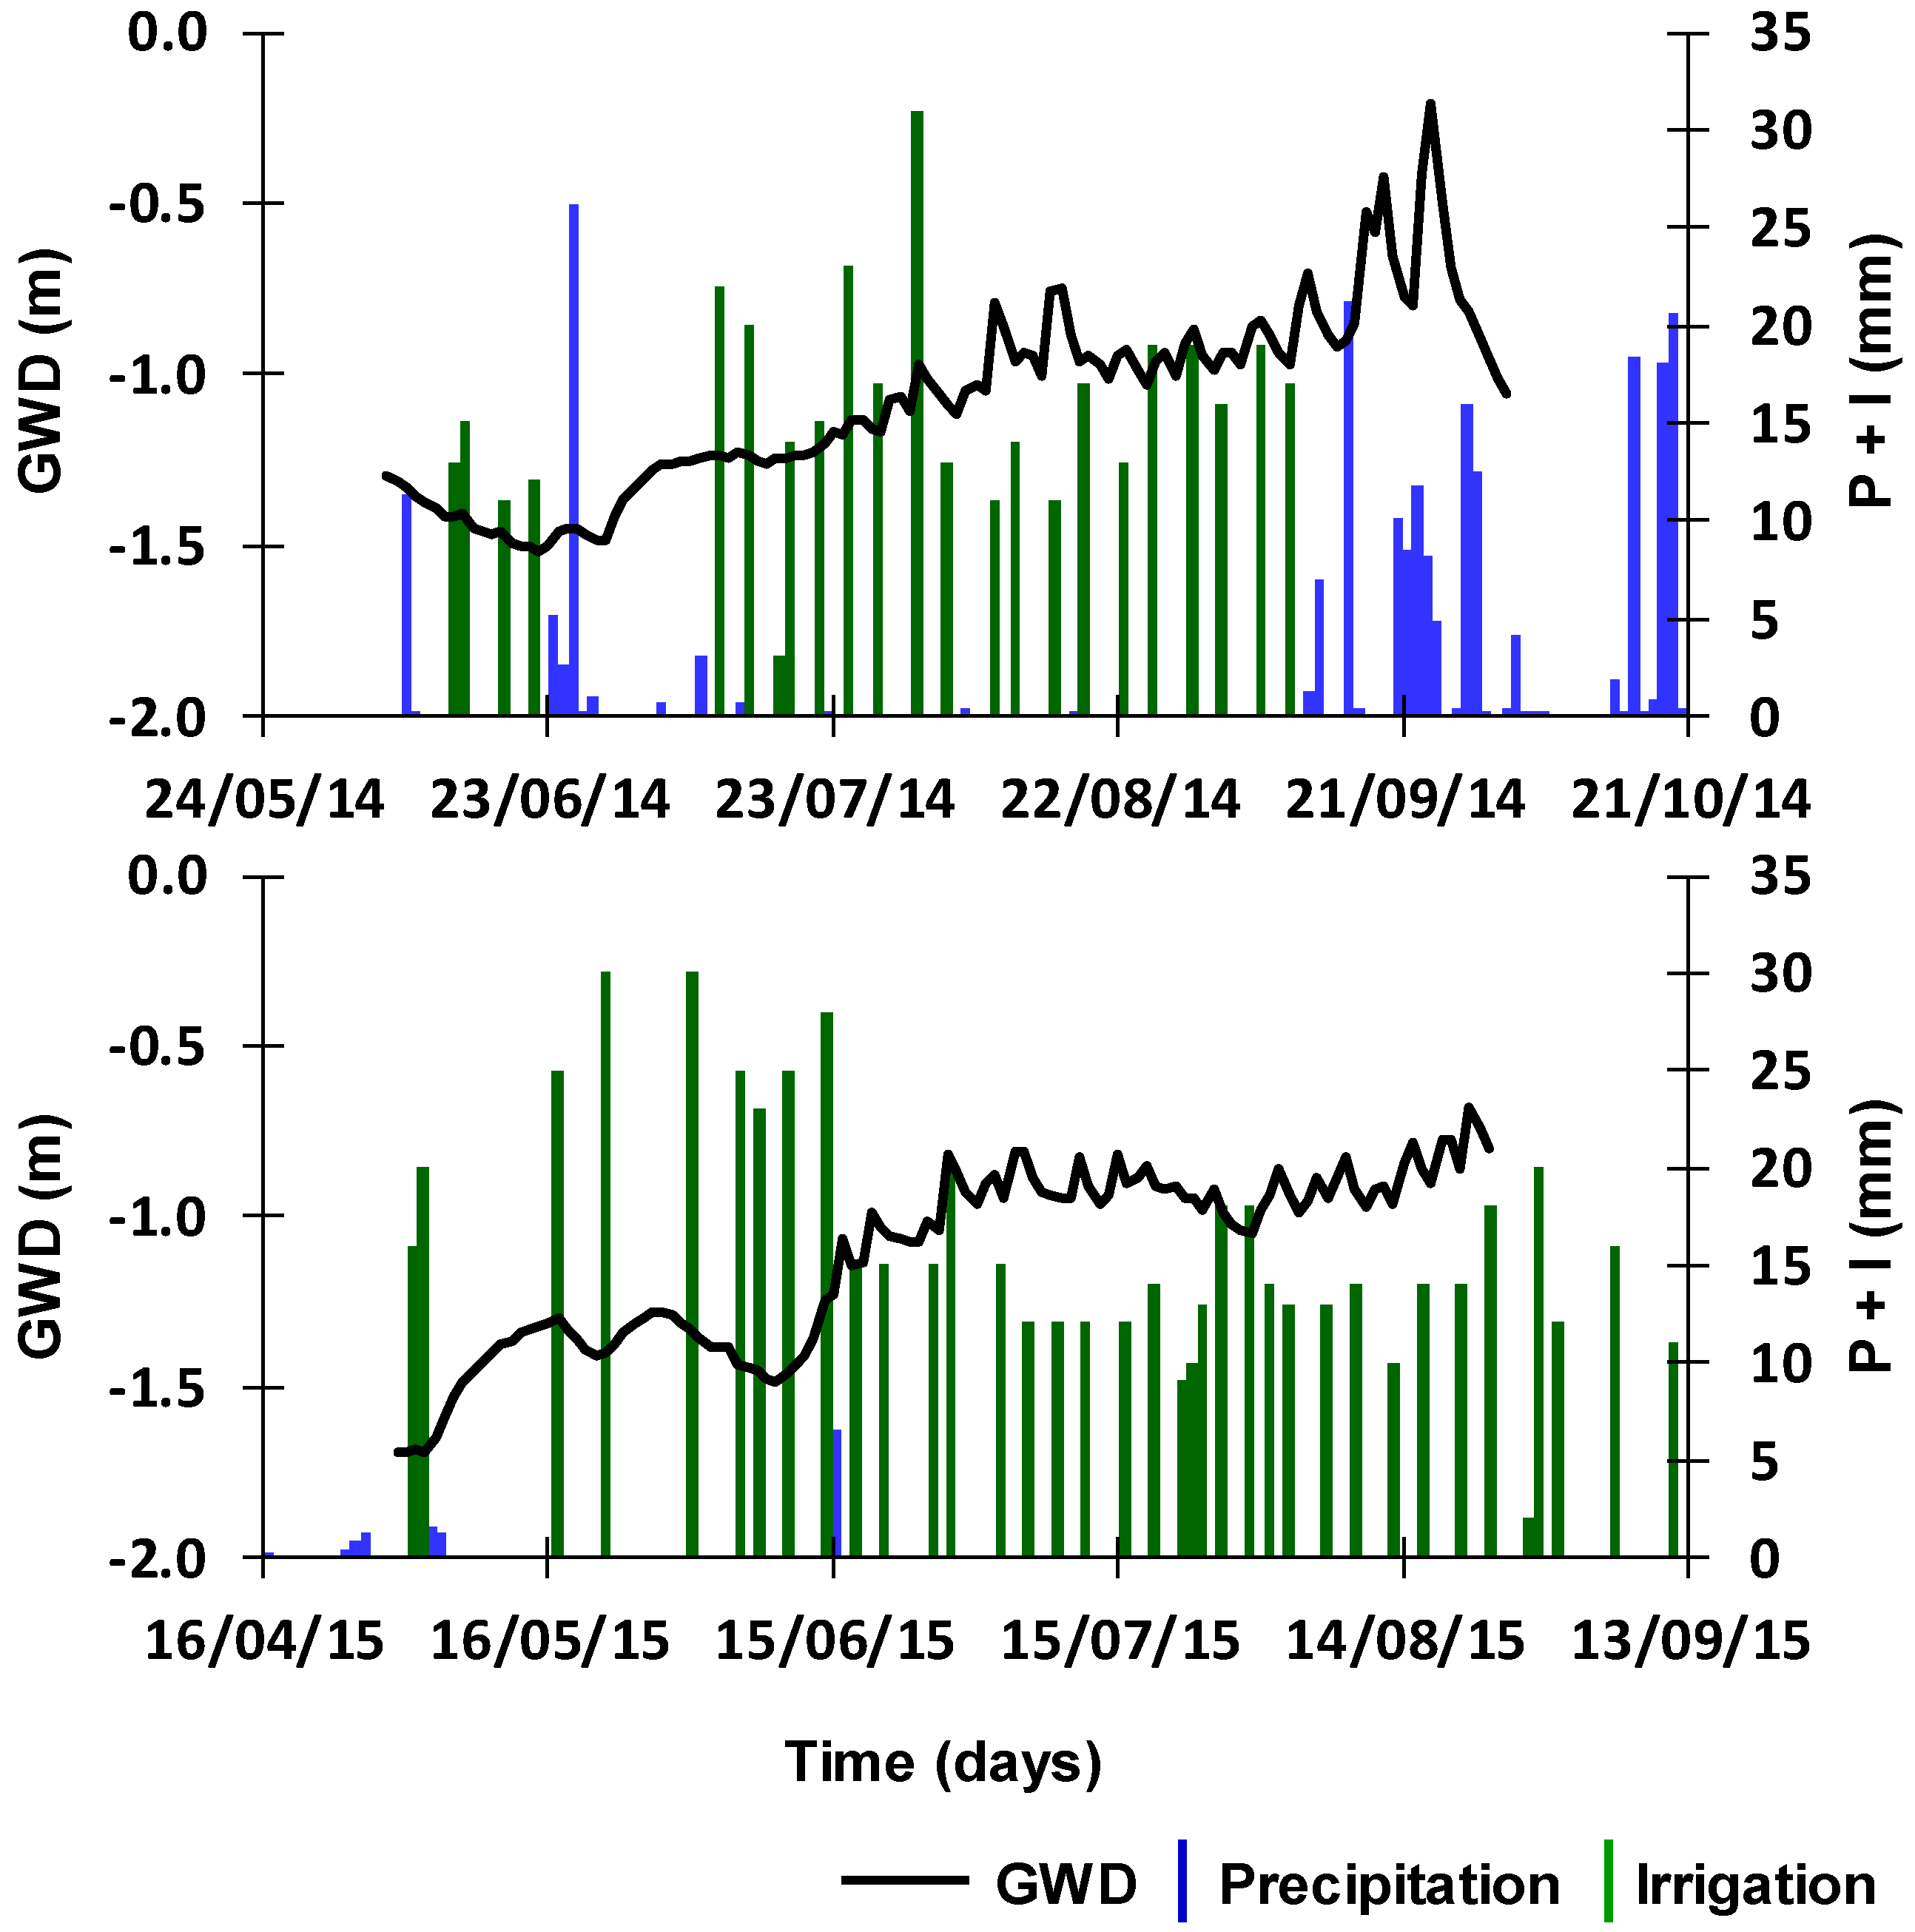
−1. Management practices, including fertilization and irrigation, were performed according to the standard practices in the region and were decided by the farmer. During 2014, maize was sown on May 24 and harvested on October 8; the net rainfall reached 163 mm, while the net irrigation amounted 365 mm (Figure 2). During 2015, maize was sown on April 16 and harvested on September 20; the net rainfall reached only 12 mm, while the net irrigation summed 620 mm (Figure 2). Irrigation was applied with the farmer’s stationary sprinkler system. Groundwater depth (GWD) varied between approximately 1.5 m depth at the beginning of the growing season to 1.0 m depth during irrigation, further reaching 0.3 m depth during September 2014 after successive rain events (Figure 2). Crop stages were set as in Table 2 based on field observations.
One SM1 capacitance probe (Adcon Telemetry, Klosterneuburg, Austria) and one ECH2O-5 capacitance probe (Decagon Devices, Pullman, WA, USA) were installed at depths of 10, 30 and 50 cm to continuously measure soil water contents. One LEV1 level sensor (Adcon Telemetry, Klosterneuburg, Austria) was used to continuously monitor the groundwater level (Figure 2). One RG1 (Adcon Telemetry, Klosterneuburg, Austria) and two QMR101 (Vaisala, Helsinki, Finland) rain gauges were used to measure the amount of water applied per irrigation event.
LAI, canopy height and the aboveground dry biomass were further monitored by harvesting 3 random plants in four locations distributed randomly throughout the field plot, every 15 days, between May and September, during the 2014 and 2015 maize growing seasons (Table 3). The same crop parameters were measured at the end of each crop season, but by harvesting all plants in random areas of 1.5 m2 (corresponding to approximately 12 plants). The length and width of crop leafs were measured in every harvested plant and then converted to LAI values as documented in Ramos et al. [4]. The aboveground dry biomass was determined by oven drying maize stems, leaves and grain at 70 °C to a constant weight. Maize yield was obtained from the grain’s dry biomass measured at the end of each crop season.

2.2. Model Description

MOHID-Land is a distributed model capable of computing different physical and chemical processes in a three-dimensional domain using a finite-volume approach [27]. Variably-saturated water flow is described using the Richards equation, while the van Genuchten–Mualem functional relationships [35] are used for defining the unsaturated soil hydraulic properties, as follows:
S e ( h ) = θ ( h ) θ r θ s θ r = 1 ( 1 + | α   h | η ) m
K ( h ) = K s S e [ 1 ( 1 S e 1 / m ) m ] 2
where Se is the effective saturation (L3 L−3), θr and θs denote the residual and saturated water contents (L3 L−3), respectively, Ks is the saturated hydraulic conductivity (L T−1), α (L−1) and η (-) are empirical shape parameters, m = 1 − 1/η and is a pore connectivity/tortuosity parameter (-).
Crop evapotranspiration (ETc) is determined from reference evapotranspiration (ET0) values computed with the FAO Penman-Monteith method using the single crop coefficient (Kc) approach [36]. ETc is then partitioned into potential soil evaporation (Ep) and potential crop transpiration (Tp) as a function of LAI [37]:
T p = ET c   ( 1 e ( λ   LAI ) )
E p = ET c T p
where λ is the extinction coefficient of radiation attenuation within the canopy (-).
Root water uptake is computed using the macroscopic approach introduced by Feddes et al. [38], meaning that Tp is distributed over the root zone and may be diminished by the presence of depth-varying root zone stressors, namely water stress. Root water uptake reductions (i.e., actual transpiration, Ta) are then described using the piecewise linear model proposed by Feddes et al. [38]. In this model, root water uptake is at the potential rate when the pressure head (h) is between h2 and h3, drops off linearly when h > h2 or h < h3 and becomes zero when h < h4 or h > h1 (subscripts 1 to 4 denote for different threshold pressure heads). Ep values are limited by a pressure head threshold value to obtain the actual soil evaporation rate (Ea) [39].
MOHID-Land further includes a modified version of the EPIC model [40,41] for simulating crop growth. This model is based on the heat unit theory, which considers that all heat above the base temperature will accelerate crop growth and development:
PHU = i = 1 m HU = i = 1 m ( T av T base ) when   T av > T base
where PHU is the total heat units required for plant maturity (°C), HU is the number of heat units accumulated on day i (°C), i = 1 corresponds to the sowing date (-), m is the number of days required for plant maturity (-), Tav is the mean daily temperature (°C) and Tbase is the minimum temperature for plant growth (°C).
Crop growth is modelled by simulating light interception, conversion of intercepted light into biomass and LAI development. Total biomass is calculated from the solar radiation intercepted by the crop leaf area using the Beer’s law [42]:
i = 1 m Δ Bio act , i = i = 1 m Δ Bio i   γ i = i = 1 m RUE   ( 0.5   PAR i   ( 1 e λ   LAI ) )   γ i
where ΔBioact,i and ΔBioi are the actual and potential increase in total plant biomass on day i (kg ha−1), RUE is the radiation-use efficiency of the plant ((kg ha−1) (MJ m−2)−1), PARi is the daily incident photosynthetically active radiation (MJ m−2), λ is again the light extinction coefficient (-) and γi is the daily plant growth factor (0–1) which accounts for water and temperature stresses [41].
Leaf area index is computed as a function of heat units, crop stress and the development stage [41]. During early stages (initial and plant development stages), LAI increment on a given day is a function of the fraction of the plant’s maximum LAI (LAImax) that needs to be reached during those stages (frLAImax) and crop stress.
Δ LAI act , i = Δ LAI i   γ i = ( fr LAImax , i fr LAImax , i 1 )   LAI max   ( 1 e ( 5 × ( LAI i 1 LAI max ) ) )   γ i
where ΔLAIact,i and ΔLAIi are the actual and potential LAI increment added on day i (m2 m−2), respectively and frLAImax,i and frLAImax,i−1 are the fraction of the plant’s maximum LAI (LAImax, m2 m−2) on day i and i − 1 (-), respectively. During the mid-season stage, LAI is assumed to be constant. During the late-season stage, LAI declines as a function of LAImax, heat units and crop stress.
Root depth is also computed as a function of heat units [41], while root biomass is assumed to decrease from 0.4 of the total biomass at emergence to 0.2 at maturity [43]. Finally, yield is obtained from the product of the aboveground dry biomass and the actual harvest index [41]. A more detailed description of the MOHID-Land model governing equations can be found in Trancoso et al. [27] and Ramos et al. [3].

2.3. Model Setup and Data Assimilation

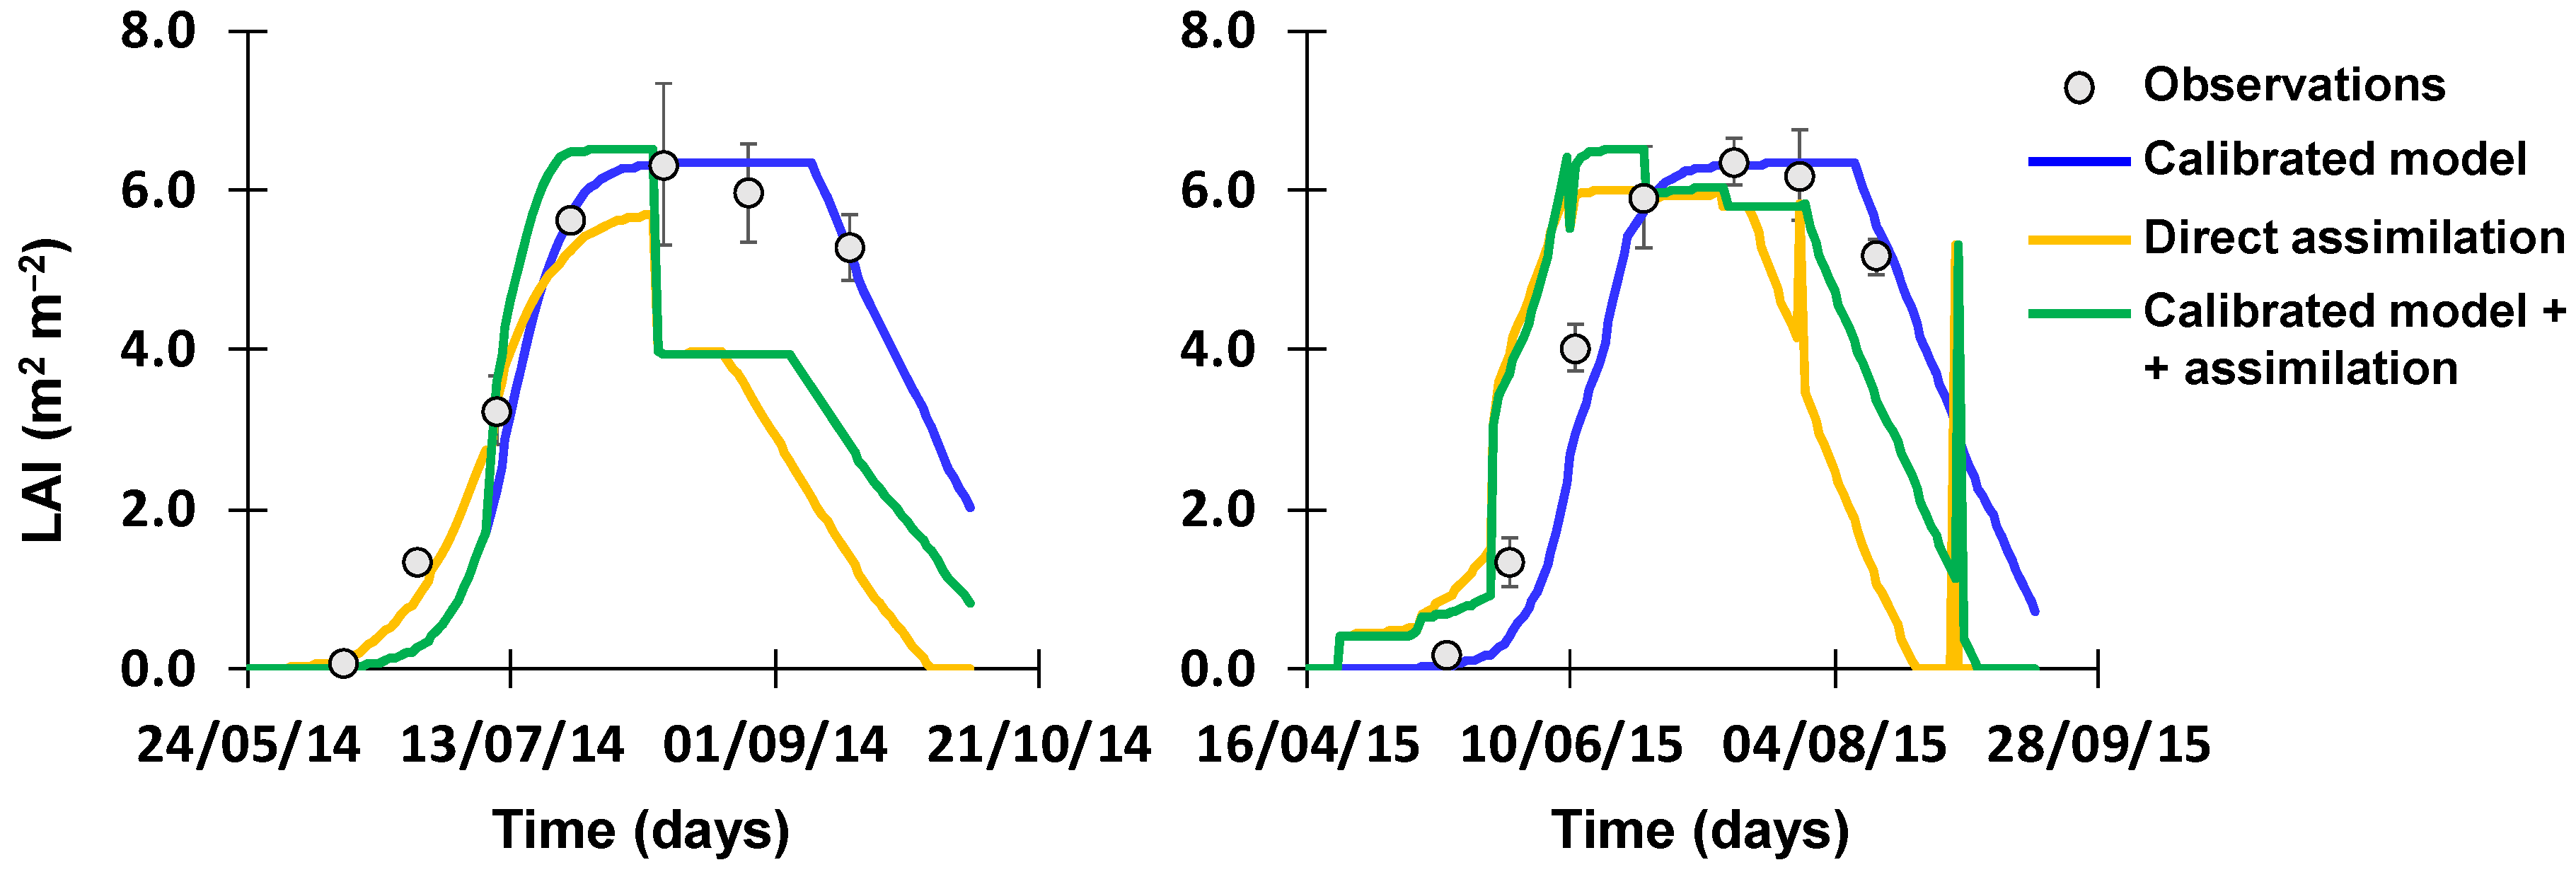
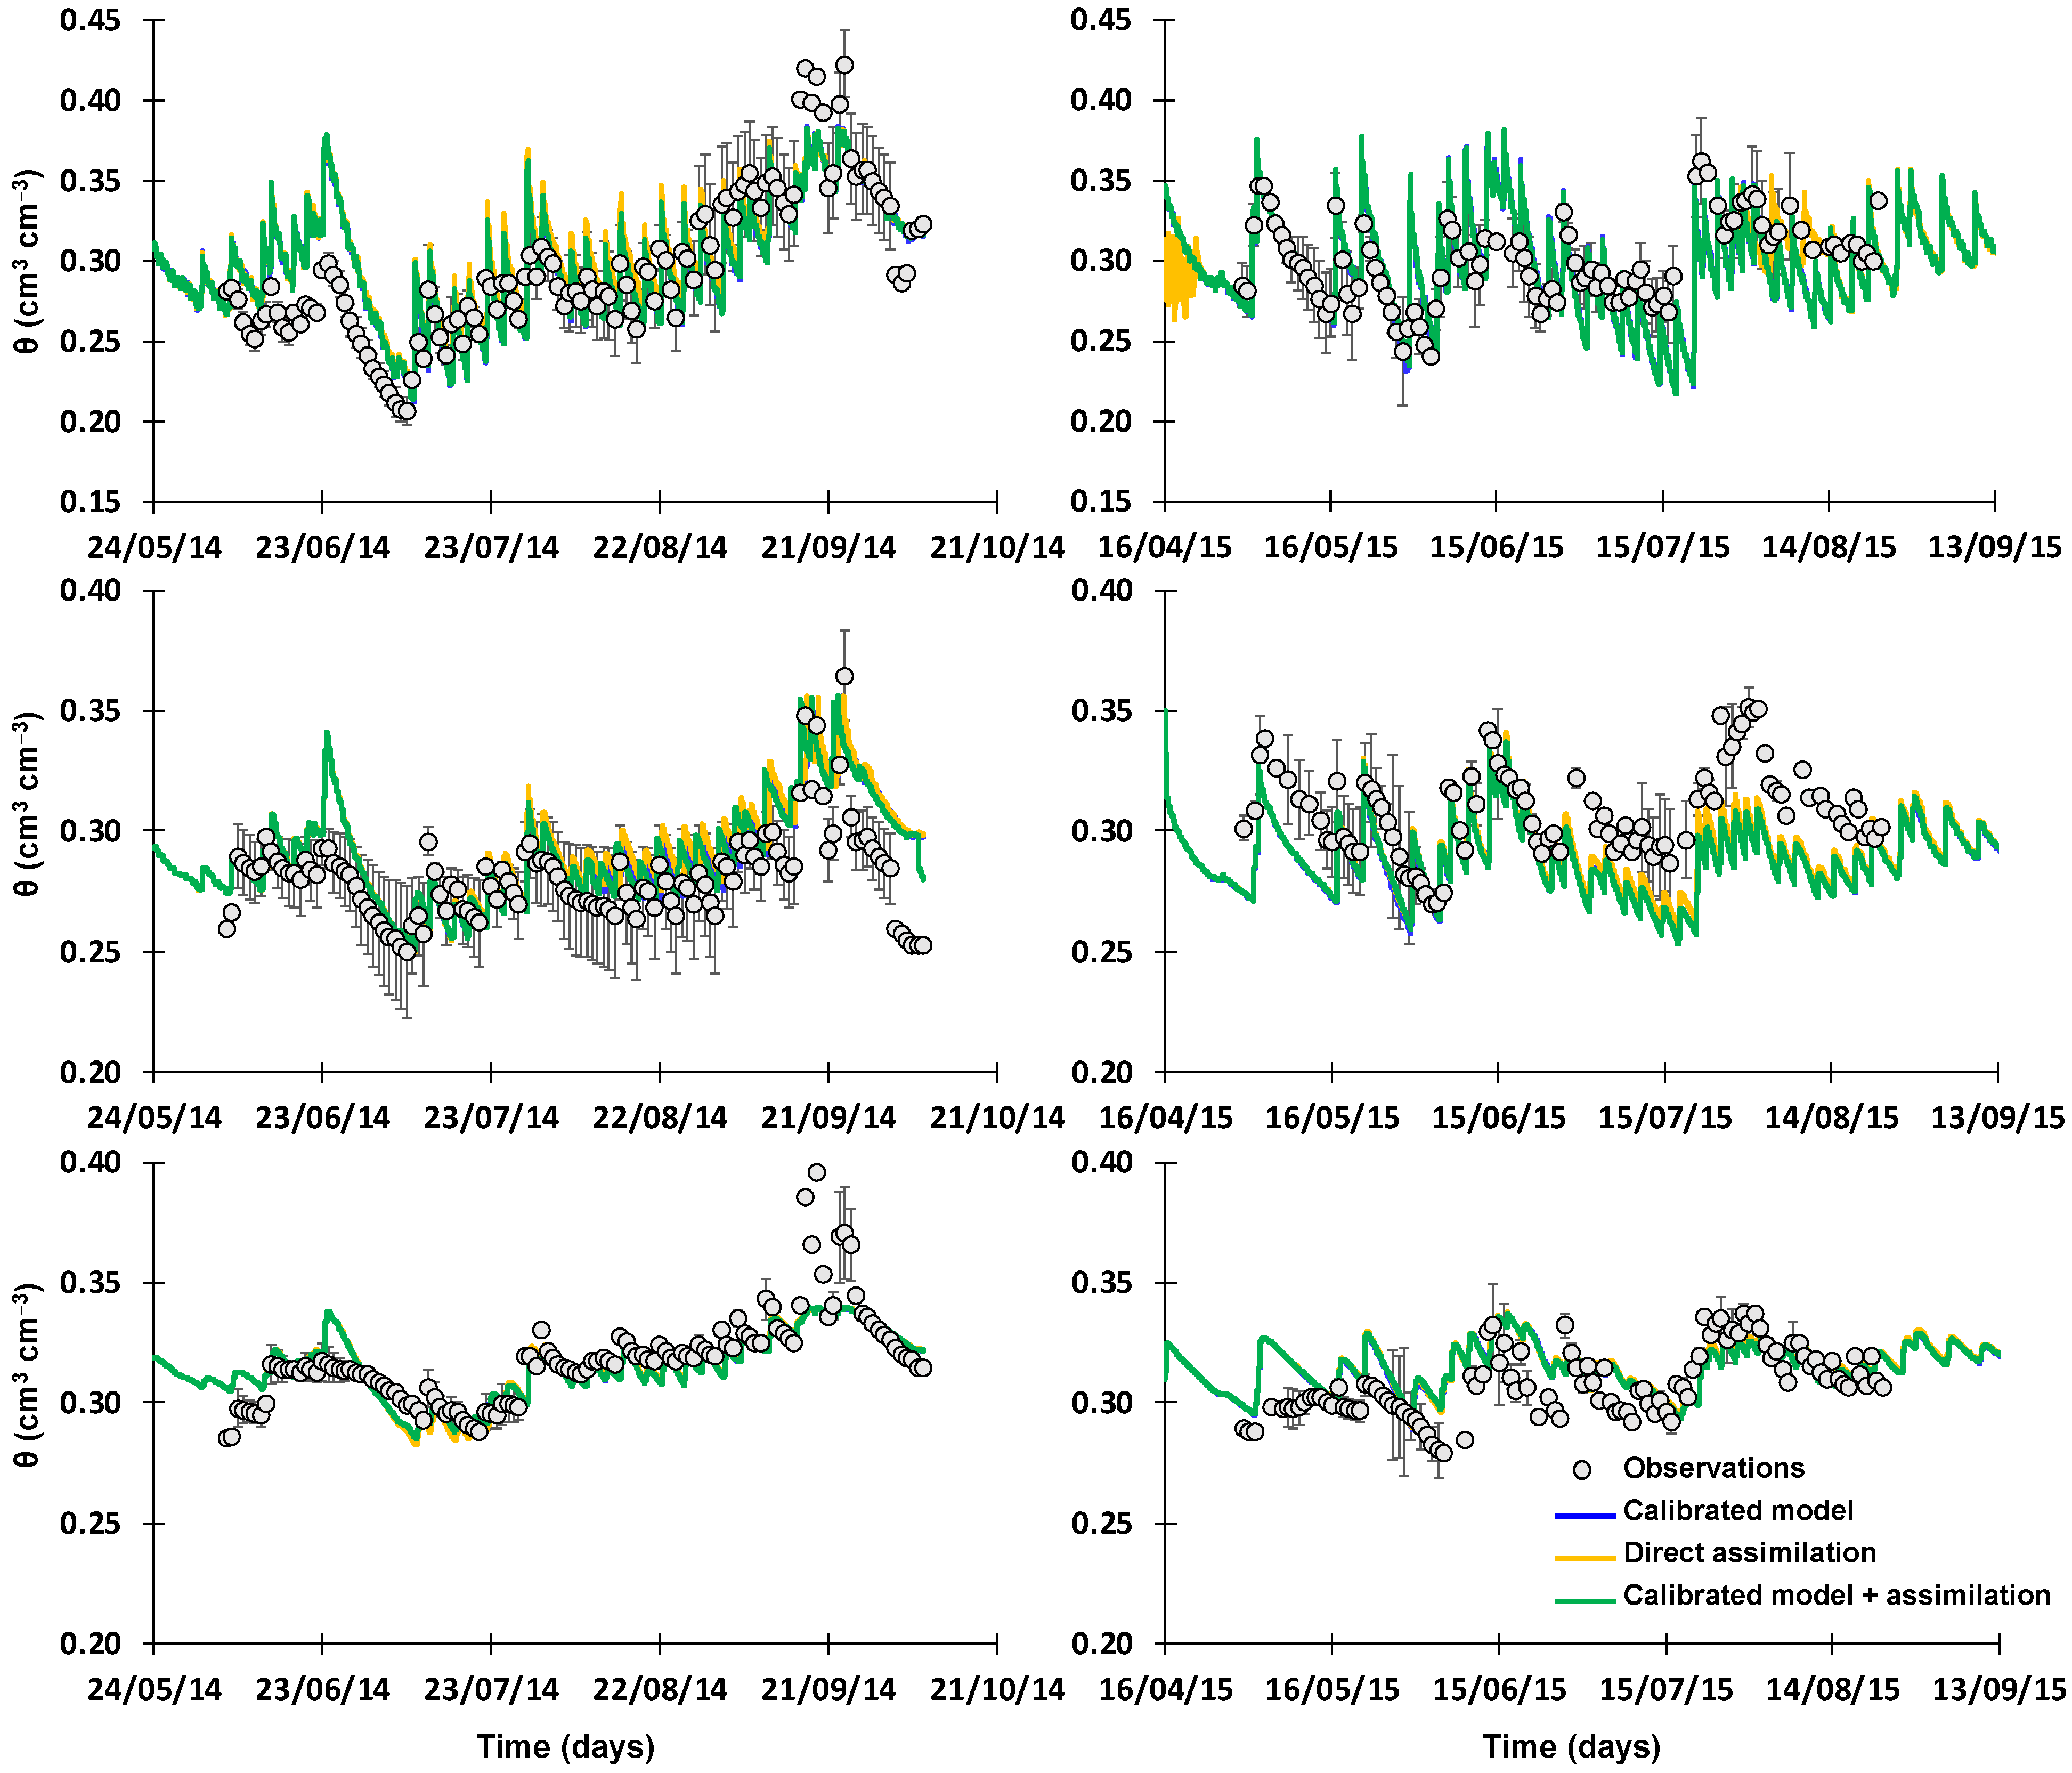
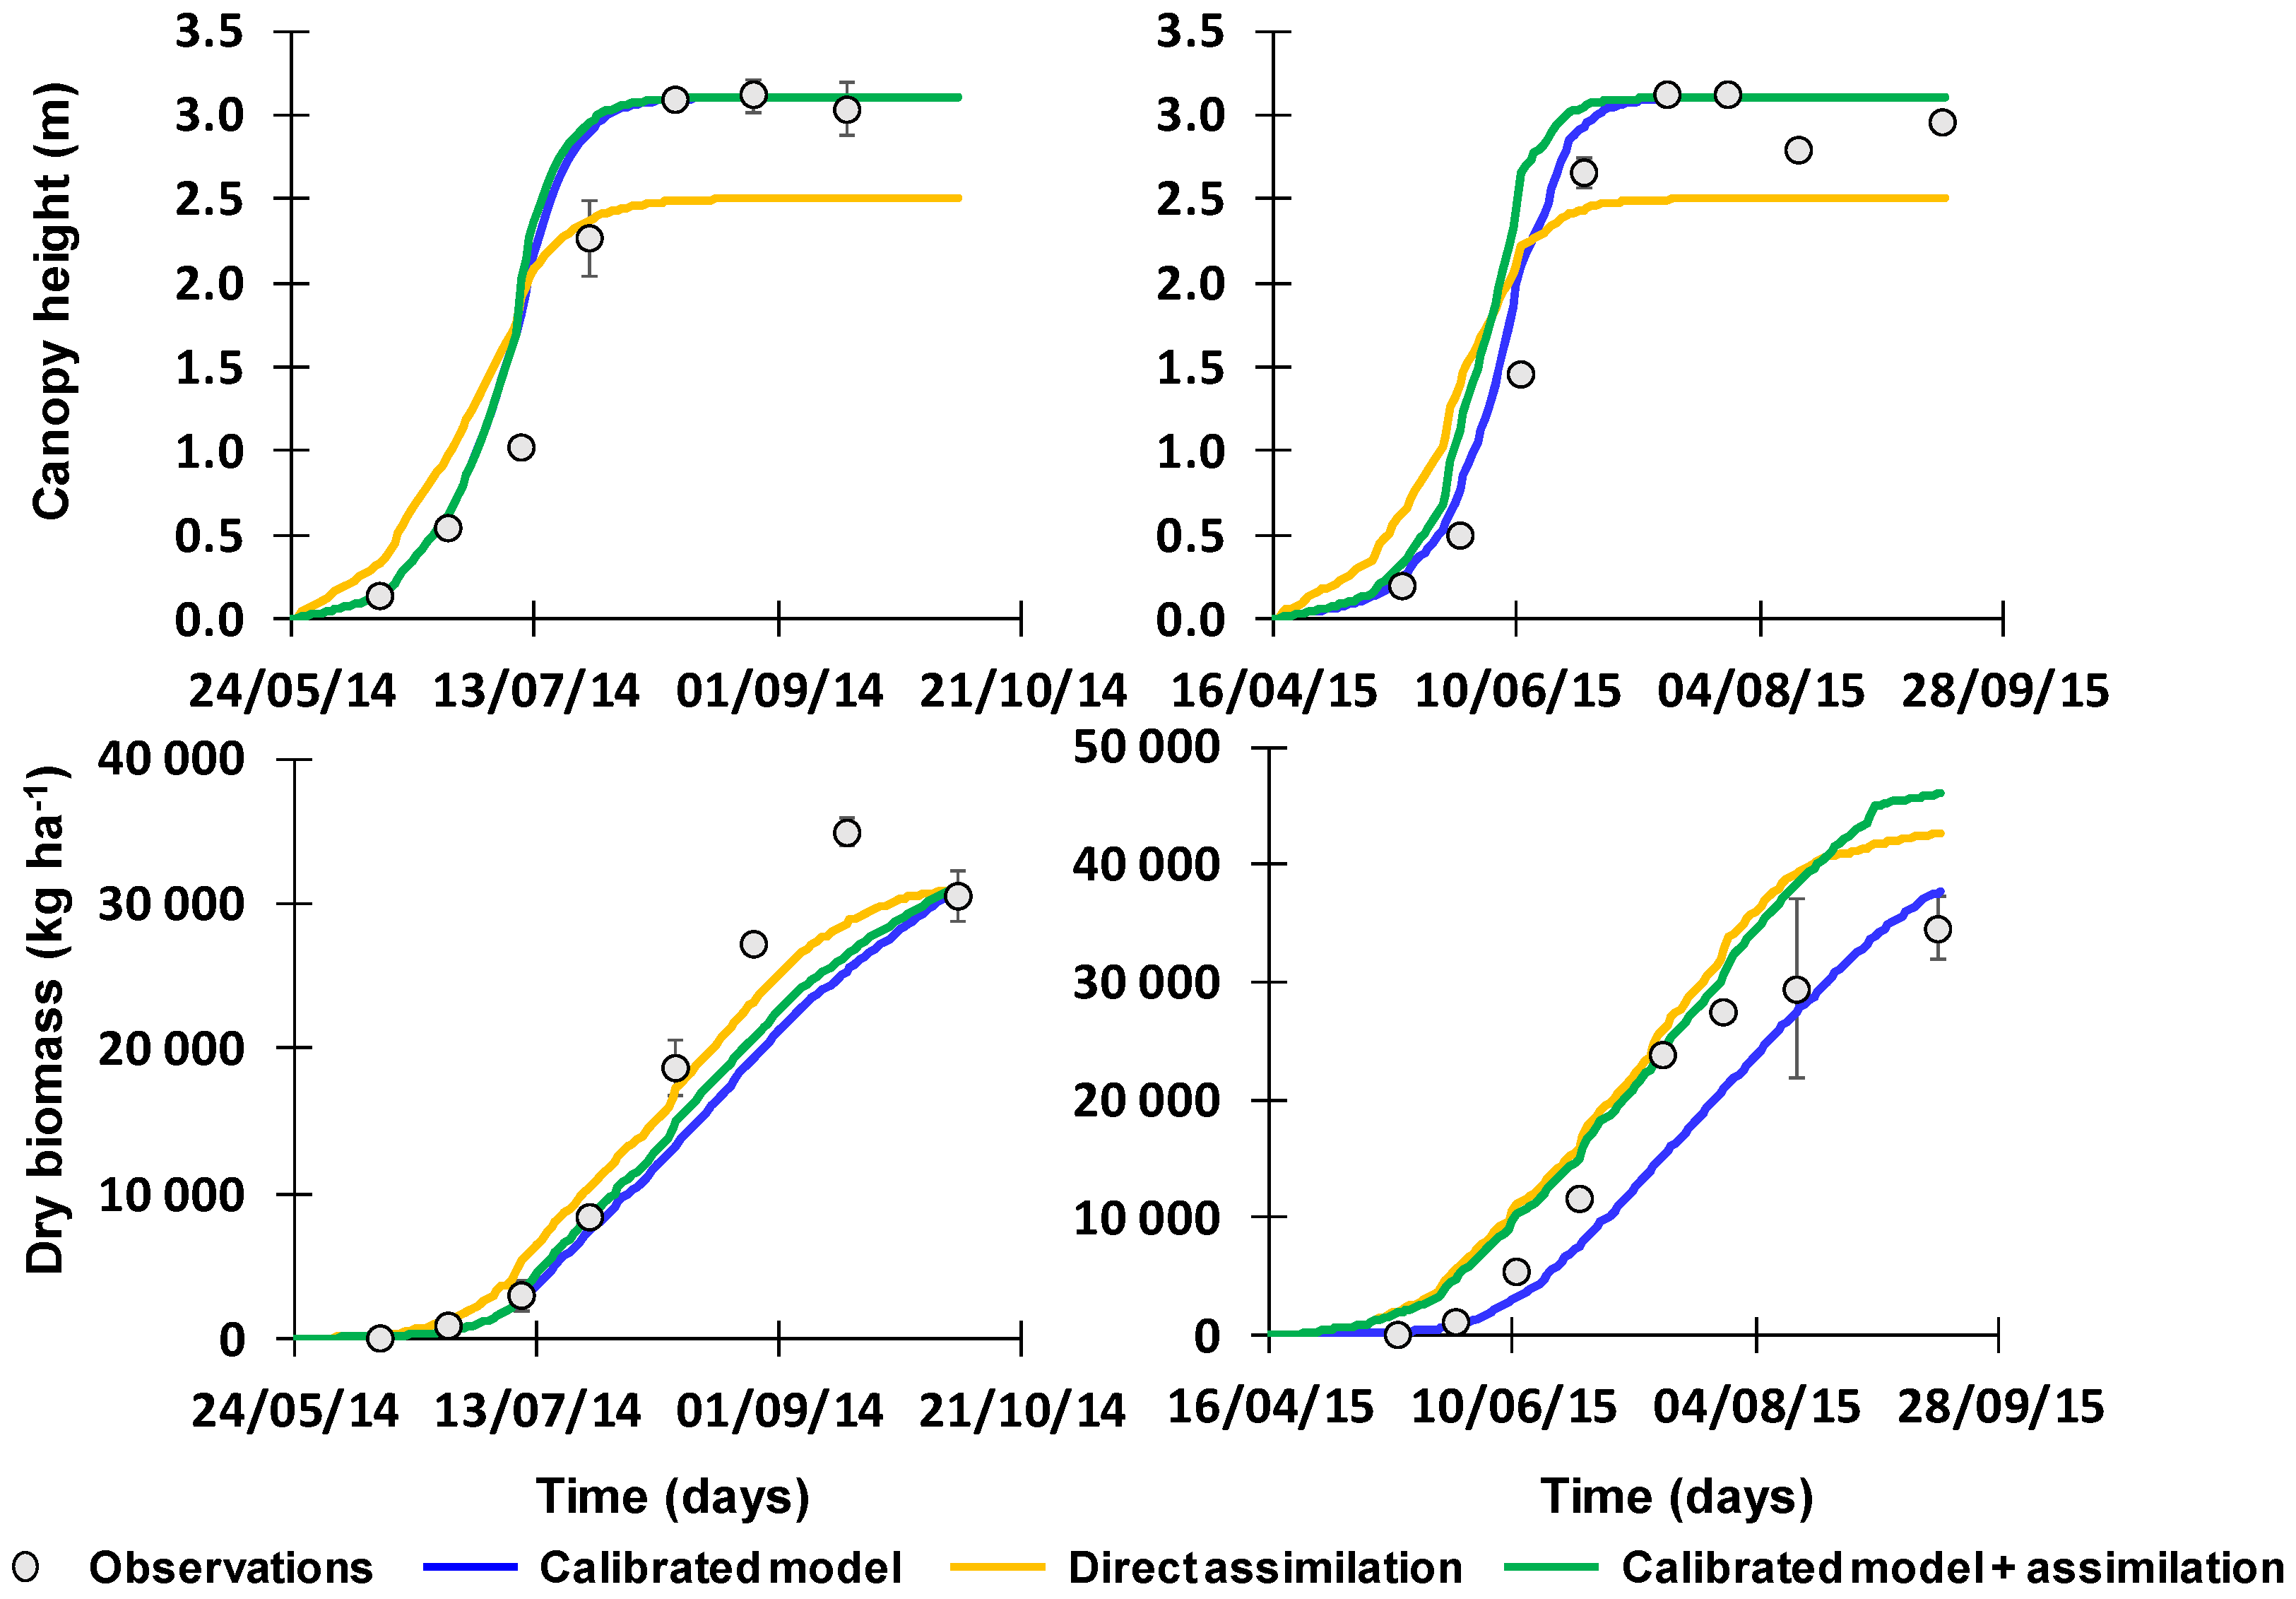
The assimilation of LAI data into MOHID-Land simulations has a direct influence on the water balance through the partition of ETc values into Tp (Equation (3)) and Ep (Equation (4)) and on the computation of the aboveground dry biomass (Equation (6)) Three distinct approaches were thus considered for better understanding the impact of LAI assimilation on model simulations:
A—The model was run as in Ramos et al. [3], which simulations of soil water contents, LAI, hc, aboveground dry biomass and yields served as baseline for this study (Calibrated model). These authors followed a traditional calibration/validation approach, where a trial-and-error procedure was carried out to adjust soil hydraulic (Table 1) and crop parameters (Table 4) until deviations between the measured 2014 dataset and simulated values were minimized. The calibrated parameters were then validated using the 2015 dataset, with model simulations being compared to measured data.
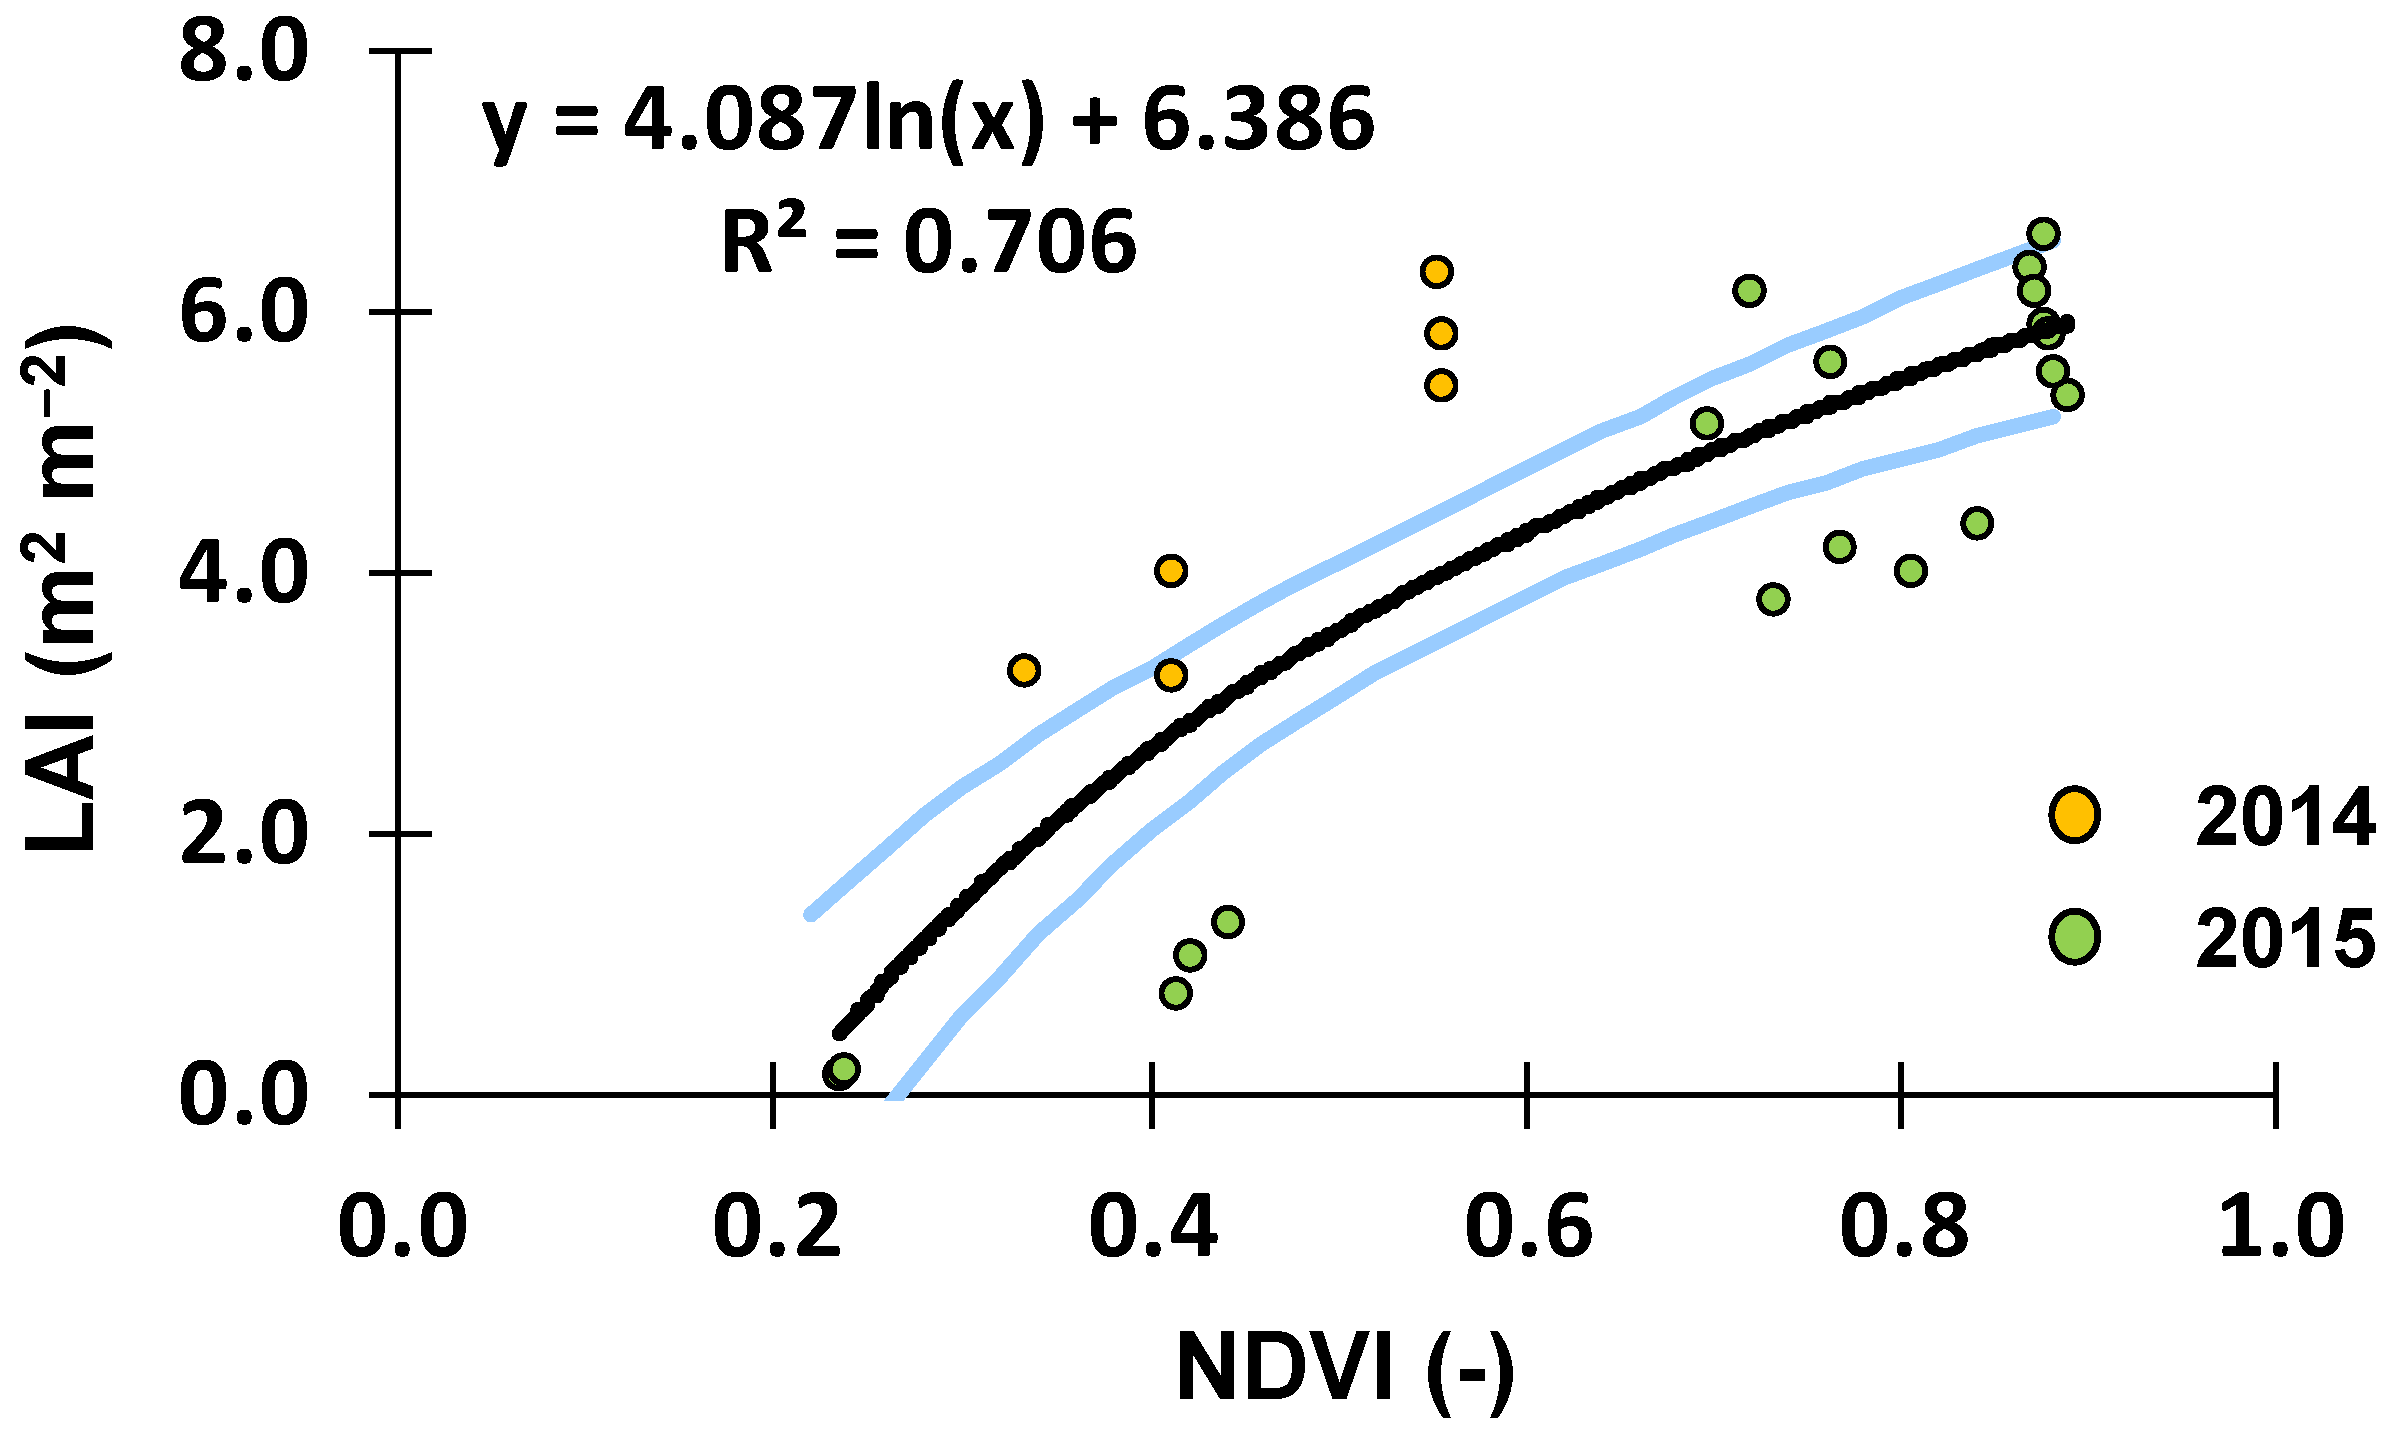
B—The model was run using LAI values extracted from satellite data as inputs (LAI assimilation). LAI values were derived from the normalized difference vegetation index (NDVI) using the relationship shown in Figure 3. This relationship was found by comparing NDVI values computed from Landsat 8 satellite images (band 4 and 5) with LAI values measured in the study site, at multiple locations and over the 2014 and 2015 growing seasons. The calibrated soil hydraulic parameters were here also adopted (Table 1). However, the default crop parameters from the MOHID-Land’s database (Table 4) were considered instead so that model performance in the absence of a calibrated dataset could be assessed.
C—The model was again run using LAI values extracted from satellite data as inputs. However, Ramos et al. [3] calibrated crop parameters (Table 4) were here considered (Calibration + LAI assimilation), as well as the calibrated soil hydraulic parameters (Table 1).
Landsat 8 images were first corrected to convert the TOA (Top of Atmosphere) planetary reflectance using reflectance rescaling coefficients provided in the Landsat 8 OLI metadata file and to correct the reflectance value with the sun angle. Two images were available from sowing to harvest during the 2014 growing season, while eight images were used during the 2015 growing season (Table 5). These images were used to extract the NDVI values corresponding to the multiple locations where LAI field observations were carried out, in a total of 26 measurements (Figure 3). LAI and NDVI values ranged from 0.41–5.85 and 0.23–0.88, respectively, in line with Pôças et al. [44].
Data assimilation in MOHID-Land was carried out using the forcing method [12]. The approach is relatively straightforward, with the model simply replacing the predicted value by a new input when an image becomes available, updating then frLAImax to account for what still needs to be reached during a specific crop stage and more interestingly, the water balance and the aboveground dry biomass estimates. From that date on and until another image becomes available model simulations follow the parameterization given in Table 4. Table 5 lists the assimilated LAI values and dates.
In all simulations (Approach A–C), the soil profile was specified with 2 m depth, divided into four soil layers according to observations (Table 1). The soil domain was represented using an Arakawa C-grid type [45], defined by one vertical column (one-dimensional domain) discretized into 100 grid cells with 1 m wide, 1 m long and 0.02 m thickness each (i.e., 1 × 1 × 0.02 m3). The simulation periods covered from sowing to harvest. The upper boundary condition was determined by the actual evaporation and transpiration rates and the irrigation and precipitation fluxes (Figure 2). Weather data used in this study was taken from a meteorological station located 950 m from the study site (38°57′30.25′′ N, 8°44′31.70′′ W, 7 m a.s.l.; Figure 1) and included the average temperature (°C), wind speed (m s−1), relative humidity (%), global solar radiation (W m−2) and precipitation (mm). ETc values were computed from hourly ET0 values and Kc values of 0.30, 1.20 and0.35 for the initial, mid-season and late season crop stages, respectively [31]. The Kc value for the initial crop stage was then adjusted for the frequency of the wetting events (precipitation and irrigation) and average infiltration depths, while the Kc values for mid-season and late season crop stages were adjusted for local climate conditions taking into consideration canopy height, wind speed and minimum relative humidity averages for the periods under consideration [36]. The following parameters of the Feddes et al. [38] model were used to compute Tp reductions due to water stress: h1 = −15, h2 = −30, h3 = −325 to −600, h4 = −8000 cm [46]. The bottom boundary condition was specified using the observed GWD (Figure 2). The initial soil water content conditions were set to field capacity.

2.4. Statistical and Uncertainty Analysis

Model calibration and validation was performed by comparing field measured values of soil water contents, LAI, hc and aboveground dry biomass with the MOHID-Land simulations (Approaches A–C) using various quantitative measures of the uncertainty, such as, the coefficient of determination (R2), the root mean square error (RMSE), the ratio of the RMSE to the standard deviation of observed data (NRMSE), the percent bias (PBIAS) and the model efficiency (EF). R2 values close to 1 indicate that the model explains well the variance of observations. RMSE, NRMSE and PBIAS values close to zero indicate small errors of estimate and good model predictions [47,48,49]. Positive or negative PBIAS values refer to the occurrence of under- or over-estimation bias, respectively. Nash and Sutcliff [50] modelling efficiency EF values close to 1 indicate that the residuals variance is much smaller than the observed data variance, hence the model predictions are good; contrarily, when EF is very close to 0 or negative there is no gain in using the model.
Data assimilation is much dependent on the empirical relationship (Figure 3) established to derive LAI values from the NDVI measurements [14,18]. As such, the uncertainty related to that conversion was quantified on final model estimates of Ta, Ea and aboveground dry biomass using a Monte Carlo method. This evaluation was performed on modeling Approach C (Calibration + LAI assimilation) as the objective here was to assess if remote sensing data assimilation could further correct for simulation errors that result from model parameter uncertainty. The 2015 dataset was also considered as more satellite images were available during this season. A randomly population of 10,000 LAI values was first created for each available image date following a normal distribution with mean equal to the estimated parameter given by the LAI-NDVI regression equation and range defined by the 95% confidence intervals (Figure 3, Table 5). The model was then run following Approach C settings until reaching the dates of each of the eight available images (8 × 1 simulation). Afterwards, the 10,000 LAI randomly generated values were assimilated by the model, which then proceeded with simulations until the end season following Approach C settings again (8 × 10,000 simulations). In the end, the uncertainty of final model estimates of Ta, E
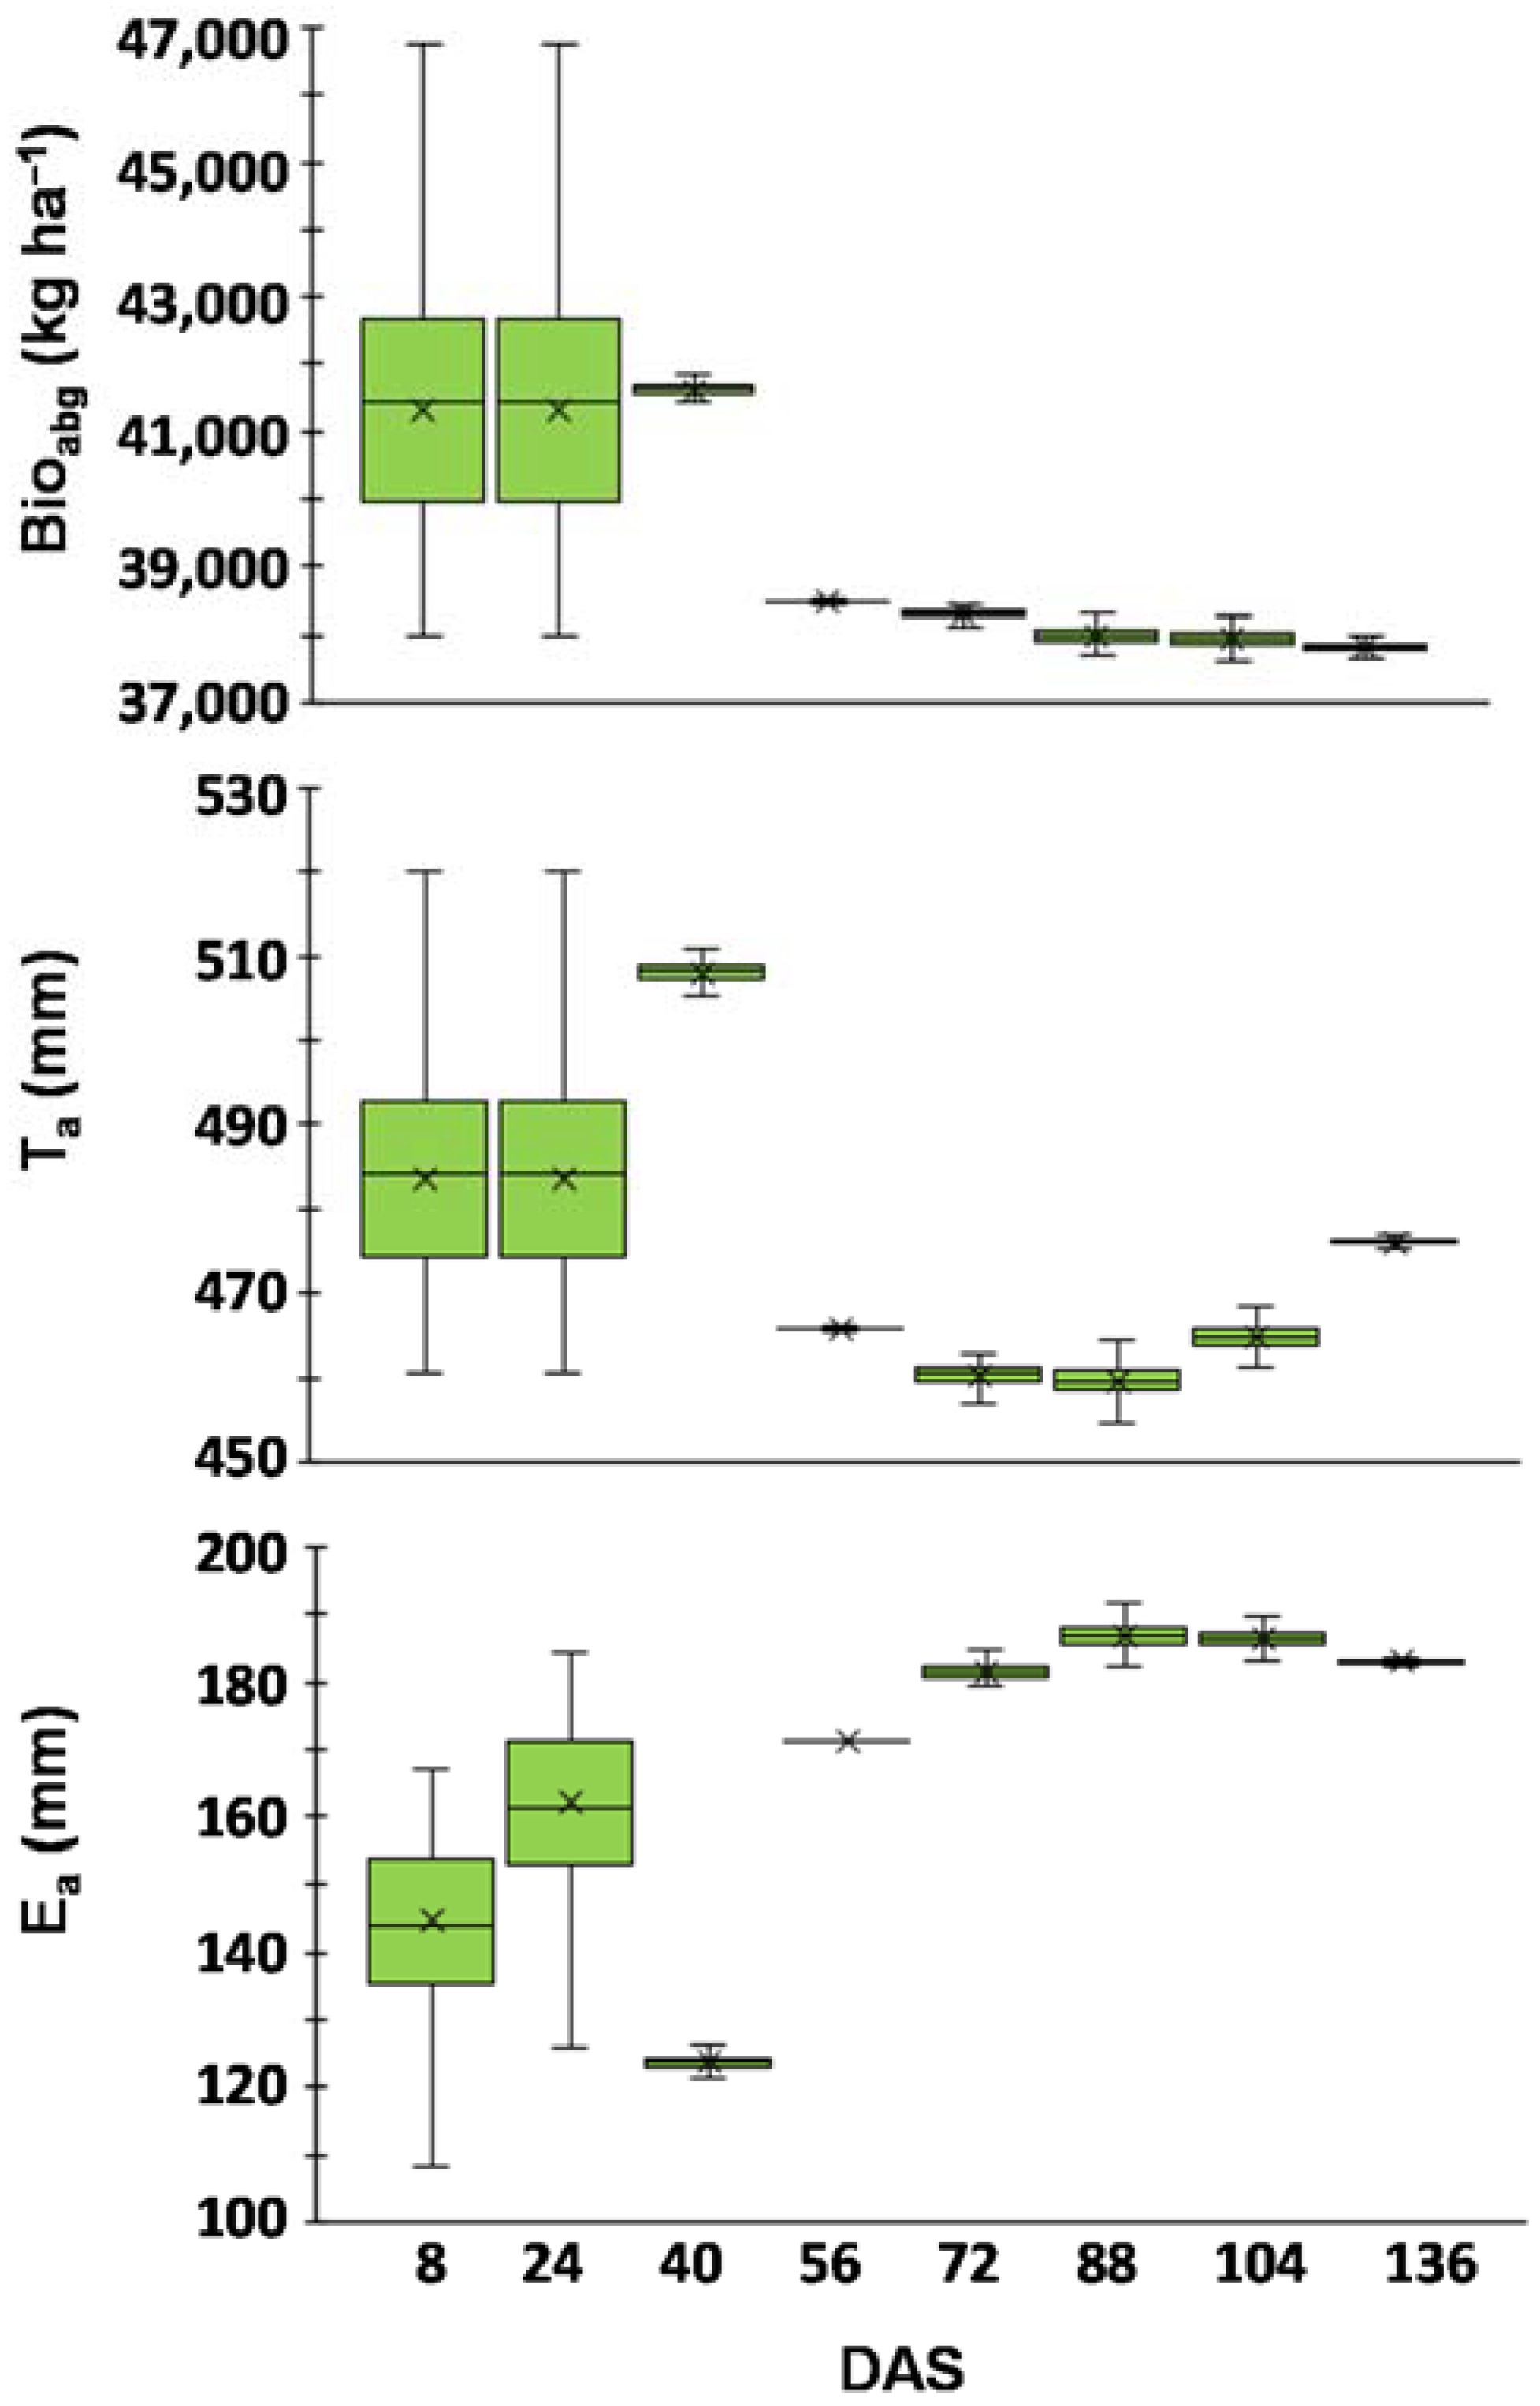
a and aboveground dry biomass were assessed for each assimilation date (8 dates) from 10,000 simulations (80,000 simulations in total). The Monte Carlo simulations were performed with a Python script.

3. Results and Discussion

3.1. LAI Evolution

Figure 4 shows the evolution of LAI estimated values using the calibrated model in Ramos et al. [3] (Approach A), direct LAI assimilation (Approach B) and the combination of the calibrated model and LAI assimilation (Approach C). Table 6 presents the statistical indicators used to evaluate the agreement between model simulations and measured values. Ramos et al. [3] showed that the MOHID-Land model could reasonably well simulate LAI evolution during the 2014 and 2015 growing seasons. In their study, the values of R2 were very high (0.97), showing that the model could explain well the variability of the observed data. The errors of the estimates were quite small, resulting in RMSE values lower than 0.63 m2 m−2 and NRMSE values lower than 0.16. The PBIAS values were lower than 6.40%, indicating some underestimation of the measured data. The modelling efficiency EF were also high (≥0.93), meaning that the residual variance was much smaller than the measured data variance.
The direct assimilation of LAI values into model simulations (Approach B) produced worse statistical indicators than when using the calibrated model (Approach A), with the R2 values decreasing down to 0.35 and the RMSE and NRMSE values increasing up to 2.16 m2 m−2 and 0.53, respectively. The PBIAS showed contrasting results, while the EF values also decreased down to 0.24, indicating nonetheless that the model was still able to describe field measurements with relative success. The direct assimilation approach made that MOHID-Land’s LAI simulated results were directly replaced by the remote sensing LAI values in the dates when satellite images were available. From that date on and until another image was available model simulations followed the default parameterization of the MOHID-Land crop database given in Table 4. As a result, assimilation of remote sensing LAI values using the forcing method available in the MOHID-Land model resulted in several unrealistic discontinuities in simulated LAI (Figure 4), a common feature when using this assimilation approach [14]. Also, LAI increased at a much faster pace during the initial and development crop stages, with maize also reaching senescence earlier. The difference of 200 °C in the total heat units required for plant maturity (PHU) considered between the default and calibrated crop parameters (Table 4) showed here to be critical for model performance. LAI assimilation was able to correct model simulations during the earlier crop stages but failed to counteract the end of the crop cycle as observed in the 2015 simulations (Figure 4). Here, despite assimilating higher LAI values, the model was obviously never able to extend the crop lifecycle longer than the allowed by the default PHU parameter.
The previous results show the importance of considering Approach C, where data assimilation forced simulations of the local calibrated model. Contrarily to the expected, LAI assimilation did not further improve Approach A results. The R2 values still decreased down to 0.63, while the RMSE and NRMSE values increased up to 1.73 m2 m−2 and 0.43, respectively. The EF values also decreased down to 0.51. However, these statistics were better than those obtained using only direct LAI assimilation (Approach B), showing the importance of local model calibration. Model simulations fully covered maize’s lifecycle this time since no constraints in the PHU existed. However, results were still dependent on the quality of the assimilated data, with LAI evolution at the end of the 2015 season suggesting that some filtering would be needed during the assimilation process (Figure 4).
Despite the lower statistical indicators found when compared to those using only the calibrated model (Approach A), LAI evolution was also considered to be well represented when LAI data assimilation was included in the MOHID-Land model simulations (Approaches B and C), particularly during the earlier crop stages. Results further suggested that a higher time resolution of assimilated data would improve the agreement between model simulations and measured data. Nonetheless, more important than accurately predicting LAI evolution was to understand how data assimilation impacted the soil water balance, aboveground dry biomass and yield estimates during the 2014 and 2015 growing seasons, as shown below.

3.2. Soil Water Balance

Figure 5 presents the measured soil water contents at depths of 10, 30 and 50 cm during the 2014 and 2015 growing seasons and compares these values with model simulations following the approaches referred above. Contrarily to LAI results, forcing remote sensing LAI data into model simulations reduced deviations between measured and simulated soil water content values. During the 2014 growing season, the RMSE values decreased from 0.018 to 0.012 cm3 cm-3, while the NRMSE values reduced from 0.061 to 0.039 when considering LAI assimilation (Approaches B and C). Inversely, the EF values increased from 0.70 to 0.88 (Table 6). During the 2015 growing season, the positive impact of LAI data assimilation on soil water content simulation was more modest with only the EF values showing a relative improvement from 0.11 to 0.28. No noticeable differences were found between Approach B and Approach C statistical indicators. All simulations shared the same soil hydraulic parameters (Table 1) to better assess the actual impact of LAI assimilation on soil water content simulations, explaining thus the similarity of model results.
As LAI evolution was used in the partition of ETc values into Tp (Equation (3)) and Ep (Equation (4)) [37], these two soil water balance components showed the greatest variation when considering LAI data assimilation (Table 7). The calibrated model (Approach A) produced estimates of Ta, Ea, capillary rise (CR) and deep percolation (DP), in line with other studies carried out in the region [51,52,53], some of which highlighting the importance of CR to the soil water balance in the Sorraia Valley region. Direct LAI assimilation produced always the lowest Tp and Ta values (Ta/Tp = 1), and, naturally, the highest Ep and Ea values during both seasons. The LAI data forcing on the calibrated model (Approach C) produced contrasting results when compared to Approach A, with Tp values decreasing in 2014 when LAI evolution was underestimated (PBIAS = 24.39%) and increasing in 2015 when the opposite occurred (PBIAS = −10.34%). Accurate LAI predictions were thus essential for simulating crop transpiration and soil evaporation, even though other important soil water balance components such as deep percolation and capillary rise were not significantly affected by less accurate LAI predictions. As a result, LAI assimilation in MOHID-Land may thus have a direct influence on biomass development, while estimates of groundwater recharge or solute leaching from the root zone may be impacted less significantly.

3.3. Crop Height

The direct assimilation of LAI (Approach B) showed the maize canopy growing faster than that measured in the field or simulated by Ramos et al. [3] (Approach A), similarly to LAI predictions (Figure 6). Canopy height then assumed a default maximum value (hc,max) of 2.5 m when the mid-season crop stage was reached (default value in Table 4), underestimating field values from that date onward and producing worse statistical indicators than those computed using the calibrated model (Table 6). The main problem here was thus the lack of a local calibrated dataset with the impact of LAI assimilation on canopy height simulations being only marginal as shown by the good indicators again obtained in Approach C.

3.4. Dry Biomass and Yields

Simulations of the aboveground dry biomass were concordant with the estimated LAI values during the 2014 and 2015 growing seasons. In 2014, the underestimation of LAI values led also to lower aboveground dry biomass estimates following the direct LAI assimilation approach (Approach B), with these being further closer to field measurements than the earlier results from the calibrated model (Approach A). As a result, the RMSE values decreased from 5128.3 to 2183.7 kg ha–1, the NRMSE values reduced from 0.39 to 0.24 and the EF values increased from 0.87 to 0.95 when direct LAI assimilation was considered. Contrarily, the overestimation of LAI values produced larger errors in 2015 when compared to field measurements, with the RMSE values increasing from 4616.8 to 6211.4 kg ha−1, the NRMSE values increasing from 0.33 to 0.44 and the EF values decreasing from 0.89 to 0.79. The local calibrated crop dataset (Approach C) did not improve aboveground dry biomass estimates.
Measured crop yields reached 16,093 and 17,300 kg ha−1 during the 2014 and 2015 seasons, respectively (Table 8). Yield predictions were in line with the same under- and overestimation tendencies observed in simulations of the aboveground dry biomass. Yield estimated from the three modeling approaches were relatively close (14,670–15,518 kg ha−1) during the 2014 season, with Approach C producing the best estimates. On the other hand, during the 2015 season, yield estimates from that same approach produced the worse results (23,016 kg ha−1), with all models diverging substantially from the measured value.
While many studies throughout the literature reported that precise knowledge of light interception and hence LAI, was critical for predicting biomass and yield accurately [12,17,54], results presented here were more in line with Linker and Ioslovich [19], who found that assimilation of easy-to-obtain canopy cover measurements did not always improve the predictions of biomass. They explained that by model choice, which in their case was a purely water-driven model in which solar radiation and light interception were not considered explicitly, likely resulting in underestimating the overall impact of canopy cover on crop development. A similar reasoning can be considered here. Ines et al. [16] also found that LAI assimilation could not always improve simulated aboveground dry biomass and yield predictions, particularly during dry conditions as the root zone soil moisture could not meet the increased water demand that resulted from improved canopy growth. Likewise, Nearing et al. [15] referred to the failure of LAI and soil moisture data assimilation in improving yield estimates, especially in water-limited environments, pointing out similar reasons as Ines et al. [16]. From a different perspective, Trombetta et al. [55] made use of remote sensed LAI data derived from the MODIS satellite images for calibrating/validating a hydrological model at the plot scale. Remote sensing LAI data, after being converted into canopy cover, was used as an alternative to field measurements during the calibration/validation process, with results suggesting this approach as a viable alternative for characterizing landscape heterogeneity (crop variability) at larger scales.

3.5. Uncertainty of Model Estimates

The previous sections showed that the impacts of LAI assimilation on MOHID-Land final estimates of Ta, Ea and aboveground biomass were substantial and that some filtering would be eventually needed for improving the quality of assimilated data. The uncertainty analysis carried out using a Monte Carlo method confirmed these early findings, with Figure 7 showing a relatively large uncertainty of final model estimates when LAI assimilation was performed during the first two dates (23/04/2015, 09/05/2015) of 2015 crop growing season. In these dates, Ta values ranged from 460 to 527 mm, while Ea values varied between 102 and 184 mm. Likewise, the aboveground dry biomass showed also considerable variation, ranging from 37,978 to 47,347 kg ha−1. From those dates onwards, the uncertainty of final model estimates decreased, being relatively small when LAI assimilation was carried out at the end of the crop cycle. Filtering of the assimilation data would thus be important during the earlier crop stages, becoming irrelevant as the crop reaches the end of its life cycle.
The large uncertainty observed on model final estimates was already expected when LAI assimilation was performed during the earlier dates since the crop was still at the initial and development stages and thus is growth cycle was not yet well defined. Yet, the Monte Carlos simulation results showed that the assimilation of too low LAI values could lead the model to greatly underestimate crop transpiration and aboveground dry biomass, while soil evapotranspiration would be greatly overestimated. Hence, this can be quite problematic in the absence of additional information to update model simulations throughout the crop season if new satellite images are no longer available (e.g., due to cloud cover). In this case, the model will never be able to further update simulations of Ta, Ea and aboveground dry biomass, producing quite substantial errors.

4. Conclusions

Remote sensing technology can provide valuable information for hydrological modeling at the field and regional scales by better characterizing the spatial and temporal variability of soils, land uses and climate, which otherwise are difficult to portray. This study showed that LAI assimilation from NDVI derived satellite data improved MOHID-Land estimates of the soil water balance and simulations of crop height and aboveground dry biomass during the early stages of the crop growing period. However, data assimilation was never sufficient to improve model simulations in the absence of a crop calibrated dataset, failing to simulate the entire growing season when calibrated potential head units (PHU) were missing or even crop maximum height when crop parameterization was misadjusted.
LAI data assimilation led also to great uncertainty on final estimates of crop transpiration, soil evaporation and the aboveground dry biomass when solely performed during the initial stages of the crop growing period. Although model uncertainty then decreased as LAI assimilation was being carried out closer to the end of the crop cycle, results showed that this approach may lead to complete erroneous estimates of the soil water balance and crop yields even when local calibrated soil and crop datasets are used. Therefore, while LAI remote sensing data can help defining MOHID-Land’s input parameters, additional data sources should be accessed for complementing such characterization. The implementation of the MOHID-Land model at the regional scale cannot depend solely on inputs from the LAI data assimilation as estimates may diverge substantially from reality.

Author Contributions

Tiago Ramos conceived the experiment and wrote the paper; Lucian Simionesei set up the model and run simulations; Ana Oliveira performed the Monte Carlo analysis; Hanaa Darouich and Ramiro Neves made revisions and improvements to the draft version.

Funding

This study was funded by the Water JPI Project WATER4EVER (Optimizing water use efficiency in agriculture to preserve soil and water resources, Project WaterJPI/0010/2016, http://water4ever.eu). MARETEC acknowledges the national funds from the Foundation for Science and Technology (FCT) (Project UID/EEA/50009/2013). T. B. Ramos was supported by the FCT grant SFRH/BPD/110655/2015.

Conflicts of Interest

The authors declare no conflict of interest.

References

  1. Paço, T.A.; Pôças, I.; Cunha, M.; Silvestre, J.C.; Santos, F.L.; Paredes, P.; Pereira, L.S. Evapotranspiration and crop coefficients for a super intensive olive orchard. An application of SIMDualKc and METRIC models using ground and satellite observations. J. Hydrol. 2014, 519, 2067–2080. [Google Scholar] [CrossRef] [Green Version]
  2. González, M.G.; Ramos, T.B.; Carlesso, R.; Paredes, P.; Petry, M.T.; Martins, J.D.; Aires, N.P.; Pereira, L.S. Modelling soil water dynamics of full and deficit drip irrigated maize cultivated under a rain shelter. Biosyst. Eng. 2015, 132, 1–18. [Google Scholar] [CrossRef]
  3. Ramos, T.B.; Simionesei, L.; Jauch, E.; Almeida, C.; Neves, R. Modelling soil water and maize growth dynamics influenced by shallow groundwater conditions in the Sorraia Valley region, Portugal. Agric. Water Manag. 2017, 185, 27–42. [Google Scholar] [CrossRef]
  4. Paredes, P.; Rodrigues, G.J.; Petry, M.T.; Severo, P.O.; Carlesso, R.; Pereira, L.S. Evapotranspiration partition and crop coefficients of Tifton 85 Bermudagrass as affected by the frequency of cuttings. Application of the FAO56 dual Kc model. Water 2018, 10, 558. [Google Scholar] [CrossRef]
  5. Cameira, M.R.; Fernando, R.M.; Ahuja, L.; Pereira, L.S. Simulating the fate of water in field soil–crop environment. J. Hydrol. 2005, 315, 1–24. [Google Scholar] [CrossRef]
  6. Ramos, T.B.; Šimůnek, J.; Gonçalves, M.C.; Martins, J.C.; Prazeres, A.; Pereira, L.S. Two-dimensional modeling of water and nitrogen fate from sweet sorghum irrigated with fresh and blended saline waters. Agric. Water Manag. 2012, 111, 87–104. [Google Scholar] [CrossRef]
  7. Jiang, Y.; Xu, X.; Huang, Q.; Huo, Z.; Huang, G. Assessment of irrigation performance and water productivity in irrigated areas of the middle Heihe River using a distributed agro-hydrological model. Agric. Water Manag. 2015, 147, 67–81. [Google Scholar] [CrossRef]
  8. Vaghefi, S.A.; Abbaspour, K.C.; Faramarzi, M.; Srinivasan, R.; Arnold, J.G. Modeling crop water productivity using a coupled SWAT-MODSIM model. Water 2017, 9, 157. [Google Scholar] [CrossRef]
  9. Valverde, P.; Serralheiro, R.; Carvalho, M.; Maia, R.; Oliveira, B.; Ramos, V. Climate change impacts on irrigated agriculture in the Guadiana river basin (Portugal). Agric. Water Manag. 2015, 152, 17–30. [Google Scholar] [CrossRef] [Green Version]
  10. Fraga, H.; Atauri, I.G.C.; Santos, J.A. Viticultural irrigation demands under climate change scenarios in Portugal. Agric. Water Manag. 2018, 196, 66–74. [Google Scholar] [CrossRef]
  11. Mulla, D.J. Twenty five years of remote sensing in precision agriculture: Key advances and remaining knowledge gaps. Biosyst. Eng. 2013, 114, 358–371. [Google Scholar] [CrossRef]
  12. Jin, X.; Kumar, L.; Li, Z.; Feng, H.; Xu, X.; Yang, G.; Wang, J. A review of data assimilation of remote sensing and crop models. Eur. J. Agron. 2018, 92, 141–152. [Google Scholar] [CrossRef]
  13. Vazifedoust, M.; van Dam, J.C.; Bastiaansen, W.F.M.; Feddes, R.A. Assimilation of satellite data into agrohydrological models to improve crop yield forecasts. Int. J. Remote Sens. 2009, 30, 2523–2545. [Google Scholar] [CrossRef]
  14. Thorp, K.R.; Hunsaker, D.J.; French, A.N. Assimilating leaf area index estimates from remote sensing into the simulations of a cropping systems model. Trans. Am. Soc. Agric. Biol. Eng. 2010, 53, 251–262. [Google Scholar]
  15. Nearing, G.S.; Crow, W.T.; Moran, M.S.; Reichle, R.H.; Gupta, H.V. Assimilating remote sensing observations of leaf area index and soil moisture for wheat yield estimates: An observing system simulation experiment. Water Resour. Res. 2012, 48. [Google Scholar] [CrossRef] [Green Version]
  16. Ines, A.V.; Das, N.N.; Hansen, J.W.; Njoku, E.G. Assimilation of remotely sensed soil moisture and vegetation with a crop simulation model for maize yield prediction. Remote Sens. Environ. 2013, 138, 149–164. [Google Scholar] [CrossRef]
  17. Tripathy, R.; Chaudhari, K.N.; Mukherjee, J.; Ray, S.S.; Patel, N.; Panigrahy, S.; Parihar, J.S. Forecasting wheat yield in Punjab state of India by combining crop simulation model WOFOST and remotely sensed inputs. Remote Sens. Lett. 2013, 4, 19–28. [Google Scholar] [CrossRef]
  18. Li, Y.; Zhou, G.Q.; Zhou, J.; Zhang, G.F.; Chen, C.; Wang, J. Assimilating remote sensing information into a coupled hydrology-crop growth model to estimate regional maize yield in arid regions. Ecol. Model. 2014, 291, 15–27. [Google Scholar] [CrossRef]
  19. Linker, R.; Ioslovich, I. Assimilation of canopy cover and biomass measurements in the crop model AquaCrop. Biosyst. Eng. 2017, 162, 57–66. [Google Scholar] [CrossRef]
  20. Evensen, G. Sequential data assimilation with a nonlinear quasi-geostrophic model using Monte Carlo methods to forecast error statistics. J. Geophys. Res. Oceans 1994, 99, 10143–10162. [Google Scholar] [CrossRef]
  21. Evensen, G. The Ensemble Kalman Filter: Theoretical formulation and practical implementation. Ocean Dyn. 2003, 53, 343–367. [Google Scholar] [CrossRef]
  22. Basso, B.; Liu, L.; Ritchie, J.T. A comprehensive review of the CERES-wheat, -maize and -rice models’ performances. Adv. Agron. 2016, 136, 27–132. [Google Scholar]
  23. Guzmán, S.M.; Paz, J.O.; Tagert, M.L.M.; Mercer, A.E.; Pote, J.W. An integrated SVR and crop model to estimate the impacts of irrigation on daily groundwater levels. Agric. Syst. 2018, 159, 248–259. [Google Scholar] [CrossRef]
  24. Zhang, B.; Feng, G.; Ahuja, L.R.; Kong, X.; Ouyang, Y.; Adeli, A.; Jenkins, J.N. Soybean crop-water production functions in a humid region across years and soils determined with APEX model. Agric. Water Manag. 2018, 204, 180–191. [Google Scholar] [CrossRef]
  25. Buts, M.; Drews, M.; Larsen, M.A.D.; Lerer, S.; Rasmussen, S.H.; Grooss, J.; Overgaard, J.; Refsgaard, J.C.; Christensen, O.B.; Christensen, J.H. Embedding complex hydrology in the regional climate system—Dynamic coupling across different modelling domains. Adv. Water Resour. 2014, 74, 166–184. [Google Scholar] [CrossRef]
  26. Ewen, J.; Parkin, G.; O’Connell, P.E. SHETRAN: Distributed River Basin Flow and Transport Modelling System. ASCE J. Hydrol. Eng. 2000, 5, 250–258. [Google Scholar] [CrossRef]
  27. Trancoso, A.R.; Braunschweig, F.; Chambel Leitão, P.; Obermann, M.; Neves, R. An advanced modelling tool for simulating complex river systems. Sci. Total Environ. 2009, 407, 3004–3016. [Google Scholar] [CrossRef] [PubMed]
  28. Fatichi, S.; Vivoni, E.R.; Ogden, F.L.; Ivanov, V.Y.; Mirus, B.; Gochis, D.; Downer, C.W.; Camporese, M.; Davidson, J.H.; Ebel, B.; et al. An overview of current applications, challenges and future trends in distributed process-based models in hydrology. J. Hydrol. 2016, 537, 45–60. [Google Scholar] [CrossRef]
  29. Simionesei, L.; Ramos, T.B.; Brito, D.; Jauch, E.; Leitão, P.C.; Almeida, C.; Neves, R. Numerical simulation of soil water dynamics under stationary sprinkler irrigation with MOHID-Land. Irrig. Drain. 2016, 65, 98–111. [Google Scholar] [CrossRef]
  30. Simionesei, L.; Ramos, T.B.; Oliveira, A.R.; Jongen, M.; Darouich, H.; Weber, K.; Proença, V.; Domingos, T.; Neves, R. Modeling soil water dynamics and pasture growth in the montado ecosystem using MOHID-Land. Water 2018, 10, 489. [Google Scholar] [CrossRef]
  31. Brito, D.; Neves, R.; Branco, M.C.; Gonçalves, M.C.; Ramos, T.B. Modeling flood dynamics in a temporary river draining to an eutrophic reservoir in southeast Portugal. Environ. Earth Sci. 2017, 76, 377. [Google Scholar] [CrossRef]
  32. Brito, D.; Ramos, T.B.; Gonçalves, M.C.; Morais, M.; Neves, R. Integrated modelling for water quality management in a eutrophic reservoir in south-eastern Portugal. Environ. Earth Sci. 2018, 77, 40. [Google Scholar] [CrossRef]
  33. Brito, D.; Campuzano, F.J.; Sobrinho, J.; Fernandes, R.; Neves, R. Integrating operational watershed and coastal models for the Iberian Coast: Watershed model implementation—A first approach. Estuar. Coast. Shelf Sci. 2015, 167, 138–146. [Google Scholar] [CrossRef]
  34. IUSS Working Group. World Reference Base for Soil Resources 2014: International Soil Classification System for Naming Soils and Creating Legends for Soil Maps; World Soil Resources Reports No. 106; Food and Agriculture Organization of the United Nations (FAO): Rome, Italy, 2014. [Google Scholar]
  35. Van Genuchten, M.T. A closed-form equation for predicting the hydraulic conductivity of unsaturated soils. Soil Sci. Soc. Am. J. 1980, 44, 892–898. [Google Scholar] [CrossRef]
  36. Allen, R.G.; Pereira, L.S.; Raes, D.; Smith, M.; FAO. Crop Evapotranspiration—Guidelines for Computing Crop Water Requirements; Irrigation & Drainage Paper 56; Food and Agriculture Organization of the United Nations (FAO): Rome, Italy, 1998. [Google Scholar]
  37. Ritchie, J.T. Model for predicting evaporation from a row crop with incomplete cover. Water Resour. Res. 1972, 8, 1204–1213. [Google Scholar] [CrossRef]
  38. Feddes, R.A.; Kowalik, P.J.; Zaradny, H. Simulation of Field Water Use and Crop Yield; Wiley: Hoboken, NJ, USA, 1978. [Google Scholar]
  39. American Society of Civil Engineers (ASCE). Hydrology Handbook Task Committee on Hydrology Handbook; II Series, GB 661.2. H93; ASCE: Reston, VA, USA, 1996; pp. 96–104. [Google Scholar]
  40. Williams, J.R.; Jones, C.A.; Kiniry, J.R.; Spanel, D.A. The EPIC crop growth model. Trans. Am. Soc. Agric. Biol. Eng. 1989, 32, 497–511. [Google Scholar] [CrossRef]
  41. Neitsch, S.L.; Arnold, J.G.; Kiniry, J.R.; Williams, J.R. Soil and Water Assessment Tool: Theoretical Documentation, 2009th ed.; Texas Water Resources Institute; Technical Report No. 406; Texas A&M University System: College Station, TX, USA, 2011. [Google Scholar]
  42. Monsi, M.; Saeki, T. Uber den Lictfaktor in den Pflanzengesellschaften und sein Bedeutung fur die Stoffproduktion. Jpn. J. Bot. 1953, 14, 22–52. (In German) [Google Scholar]
  43. Jones, C.A. C4 Grasses and Cereals: Growth, Development and Stress Response; John Wiley & Sons: New York, NY, USA, 1985; p. 419. [Google Scholar]
  44. Pôças, I.; Paço, T.A.; Paredes, P.; Cunha, M.; Pereira, L.S. Estimation of actual crop coefficients using remotely sensed vegetation indices and soil water balance modelled data. Remote Sens. 2015, 7, 2373–2400. [Google Scholar] [CrossRef]
  45. Purser, R.J.; Leslie, L.M. A semi-implicit, semi-lagrangian finite-difference scheme using high-order spatial differencing on a nonstaggered grid. Mon. Weather Rev. 1988, 116, 2069–2080. [Google Scholar] [CrossRef]
  46. Wesseling, J.G.; Elbers, J.A.; Kabat, P.; van den Broek, B.J. SWATRE: Instructions for Input Report; Win and Staring Centre: Wageningen, The Netherlands, 1991. [Google Scholar]
  47. Legates, D.R.; McCabe, G.J. Evaluating the use of “goodness-of-fit” measures in hydrologic and hydroclimatic model validation. Water Resour. Res. 1999, 35, 233–241. [Google Scholar] [CrossRef]
  48. Moriasi, D.N.; Arnold, J.G.; van Liew, M.W.; Bingner, R.L.; Harmel, R.D.; Veith, T.L. Model Evaluation Guidelines for Systematic Quantification of Accuracy in Watershed Simulations. Trans. Am. Soc. Agric. Biol. Eng. 2007, 50, 885–900. [Google Scholar]
  49. Wang, X.; Williams, J.R.; Gassman, P.W.; Baffaut, C.; Izaurralde, R.C.; Jeong, J.; Kiniry, J.R. EPIC and APEX: Model Use, Calibration and Validation. Trans. Am. Soc. Agric. Biol. Eng. 2012, 55, 1447–1462. [Google Scholar] [CrossRef]
  50. Nash, J.E.; Sutcliffe, J.V. River flow forecasting through conceptual models part I—A discussion of principles. J. Hydrol. 1970, 10, 282–290. [Google Scholar] [CrossRef]
  51. Cameira, M.R.; Fernando, R.M.; Pereira, L.S. Monitoring water and NO3-N in irrigated maize fields in the Sorraia Watershed, Portugal. Agric. Water Manag. 2003, 60, 199–216. [Google Scholar] [CrossRef]
  52. Paredes, P.; Rodrigues, G.C.; Alves, I.; Pereira, L.S. Partitioning evapotranspiration, yield prediction and economic returns of maize under various irrigation management strategies. Agric. Water Manag. 2014, 135, 27–39. [Google Scholar] [CrossRef]
  53. Paredes, P.; Melo-Abreu, J.P.; Alves, I.; Pereira, L.S. Assessing the performance of the AquaCrop model to estimate maize yields and water use under full and deficit irrigation with focus on model parameterization. Agric. Water Manag. 2014, 144, 81–97. [Google Scholar] [CrossRef]
  54. Yuping, M.; Shili, W.; Li, Z.; Yingyu, H.; Liwei, Z.; Yanbo, H.; Futang, W. Monitoring winter wheat growth in North China by combining a crop model and remote sensing data. Int. J. Appl. Earth Obs. Geoinf. 2008, 10, 426–437. [Google Scholar] [CrossRef]
  55. Trombetta, A.; Iacobellis, V.; Tarantino, E.; Gentile, F. Calibration of the AquaCrop model for winter wheat using MODIS LAI images. Agric. Water Manag. 2016, 164, 304–316. [Google Scholar] [CrossRef]
Figure 1. Location of the study site.
Water 10 01367 g001
Figure 2. Daily values of precipitation, irrigation and groundwater depth (GWD) during the 2014 (top) and 2015 (bottom) crop seasons.
Water 10 01367 g002
Figure 3. Relationship between measured Leaf Area Index (LAI) and the Normalized Difference Vegetation Index (NDVI). The blue lines correspond to the 95% confidence interval.
Water 10 01367 g003
Figure 4. Measured and simulated leaf area index during 2014 (left) and 2015 (right) crop seasons. Vertical bars correspond to the standard deviation of measured data.
Water 10 01367 g004
Figure 5. Measured and simulated soil water contents (θ) at depths of 10 (top), 30 (middle) and 50 cm (bottom) during 2014 (left) and 2015 (right) crop seasons. Vertical bars correspond to the standard deviation of measured data.
Water 10 01367 g005
Figure 6. Measured and simulated canopy height (top) and aboveground dry biomass (bottom) during 2014 (left) and 2015 (right) crop seasons. Vertical bars correspond to the standard deviation of measured data.
Water 10 01367 g006
Figure 7. Uncertainty of data assimilation on aboveground dry biomass (top), actual transpiration Ta (middle) and actual soil evaporation Ea (bottom) final model estimates for the 2015 crop season on different dates (DAS, days after sowing). Box-plots indicate maximum and minimum values, median (–), first and third quartiles and average (×) of 10,000 Monte Carlo simulations.
Water 10 01367 g007
Table 1. Main physical and chemical soil characteristics.
Depth (m)Soil Layers
0–0.20.2–0.40.4–0.60.6–0.8
Coarse Sand, 2000–200 μm (%)3.46.811.514.7
Fine Sand, 200–20 μm (%)44.647.853.648.4
Silt, 20–2 μm (%)33.328.120.623.2
Clay, <2 μm (%)18.817.314.313.7
TextureSilty LoamLoamLoamLoam
Bulk Density (g cm−3)1.571.521.661.66
Organic Matter (%)1.730.960.570.59
θFC (cm3 cm−3)0.3210.2930.3110.311
θWP (cm3 cm−3)0.2090.2350.2230.223
Van Genuchten-Mualem Parameters:
θr (cm3 cm−3)0.0780.0670.0650.065
θs (cm3 cm−3)0.3930.3560.3400.340
α (cm−1)0.0090.0160.0050.005
η (-)1.751.311.801.80
(-)−1.0−1.0−1.0−1.0
Ks (cm d−1)500.322.60.70.7
θFC, soil water content at field capacity; θWP, soil water content at the wilting point, θr, residual water content; θs, saturated water content; α and η, empirical shape parameters; , pore connectivity/tortuosity parameter; Ks, saturated hydraulic conductivity.
Table 2. Dates of crop growth stages.
Stage20142015
DaysDateDaysDate
Initial3124 May3716 April
Canopy Development3024 June3223 May
Mid-Season5224 July5324 June
Late Season2714 September2616 August
Harvest-8 October-20 September
Table 3. Measured values of Leaf Area Index (LAI), canopy height (hc) and aboveground dry biomass during the 2014 and 2015 crop seasons.
DateLAI (m2 m−2)hc (m)Biomass (kg ha−1)
MeanStandard DeviationMeanStandard DeviationMeanStandard Deviation
11/06/20140.10.00.140.0248.315.3
25/06/20141.30.10.540.04826.756.6
10/07/20143.20.41.020.102906.71083.2
24/07/20145.60.12.270.238279.4339.2
11/08/20146.31.03.080.0318,593.81881.7
27/08/20146.00.63.110.1027,228.2594.8
15/09/20145.30.43.030.1534,945.6982.8
08/10/2014- --30,423.21735.6
15/05/20150.20.00.190.0380.016.8
28/05/20151.30.30.490.011090.161.8
11/06/20154.00.31.450.065309.5280.6
25/06/20155.90.62.650.0911,550.0958.9
14/07/20156.40.33.120.0223,711.2812.9
28/07/20156.20.63.120.0127,373.9229.2
13/08/20155.20.22.780.0629,434.47624.1
14/09/2015----34,540.32670.5
Table 4. Parameters of the crop growth model.
Crop ParameterDefaultCalibrated
Optimal Temperature for Plant Growth, Topt (°C)25.025.0
Minimum Temperature for Plant Growth, Tbase (°C)8.08.0
Plant Radiation-Use Efficiency, RUE [(kg ha−1) (MJ m−2)−1]45.039.0
Total Heat Units Required for Plant Maturity, PHU (°C)17001900
Fraction of PHU to Reach the End of Stage 1 (Initial Crop Stage), frPHU,init (-)0.150.20
Fraction of PHU to Reach the End of Stage 2 (Canopy Development Stage), frPHU,dev (-)0.500.43
Fraction of PHU after which LAI Starts to Decline, frPHU,sen (-)0.700.73
Maximum Leaf Area Index, LAImax (m2 m−2)6.06.5
Fraction of LAImax at the End of Stage 1 (Initial Crop Stage), frLAImax,ini (-)0.050.05
Fraction of LAImax at the end of Stage 2 (Canopy Development Stage), frLAImax,dev (-)0.950.95
Maximum Canopy Height, hc,max (m)2.53.1
Maximum Root Depth, Zroot,max (m)2.00.6
Potential Harvest Index for the Crop at Maturity, HIopt (-)0.500.49
Minimum Harvest Index Allowed, HImin (-)0.300.30
Table 5. Leaf Area Index (LAI) assimilation data.
DateAssimilated LAI (m2 m−2)NDVI (-)LAI 95% Confidence Interval
LowerUpper
09/07/20142.750.41--
10/08/20143.970.55--
23/04/20150.410.230.001.53
09/05/20150.480.240.001.58
25/05/20153.040.442.473.61
10/06/20155.500.814.896.11
26/06/20155.850.885.176.53
12/07/20155.790.865.126.46
28/07/20155.820.875.156.49
29/08/20155.310.774.735.89
Table 6. Results of the statistical analysis between measured and simulated soil water contents, leaf area index (LAI), canopy height and aboveground dry biomass.
StatisticR2RMSENRMSEPBIASEF
2014
Water Content (cm3 cm−3)
Calibrated Model0.730.0180.061−1.530.70
Direct Assimilation0.850.0120.041−1.160.87
Calibrated Model + Assimilation0.890.0120.039−0.950.88
LAI (m2 m−2)
Calibrated Model0.970.630.166.400.94
Direct Assimilation0.602.130.5433.820.26
Calibrated model + Assimilation0.701.730.4324.390.51
Canopy Height (m)
Calibrated Model0.930.420.22−11.830.90
Direct Assimilation0.860.580.310.960.80
Calibrated Model + Assimilation0.900.500.26−13.870.85
Dry Biomass (kg ha−1)
Calibrated Model0.945128.30.3919.200.87
Direct Assimilation0.942183.70.244.600.95
Calibrated Model + Assimilation0.962518.90.3214.200.91
2015
Water Content (cm3 cm−3)
Calibrated Model0.370.0190.0631.910.11
Direct Assimilation0.400.0170.0570.900.28
Calibrated Model + Assimilation0.390.0180.0601.580.18
LAI (m2 m−2)
Calibrated Model0.970.610.156.310.94
Direct Assimilation0.352.160.52−1.180.24
Calibrated Model + Assimilation0.631.580.38−10.340.59
Canopy Height (m)
Calibrated model0.960.330.17−11.000.93
Direct Assimilation0.850.650.33−2.570.73
Calibrated Model + Assimilation0.880.600.30−19.130.77
Dry Biomass (kg ha−1)
Calibrated Model0.934616.80.3315.270.89
Direct Assimilation0.986211.40.44−31.490.80
Calibrated Model + Assimilation0.966237.80.44−28.520.79
R2, coeficient of determination; RMSE, root mean square error; NRMSE, normalized RMSE; PBIAS, percent bias; EF, modeling efficiency.
Table 7. Components of the soil water balance.
ApproachInputsOutputs
P (mm)I (mm)CR (mm)ΔSS (mm)Ea (mm)Ta (mm)Ta/Tp (-)DP (mm)
2014
Calibrated model16336578161643740.9974
Direct assimilation1633657021913451.0090
Calibrated model + Assimilation1633657821833551.0084
2015
Calibrated model1262094111814811.0075
Direct assimilation126208431994611.0082
Calibrated model + Assimilation126209531505121.0075
P, precipitation; I, irrigation; CR, capillary rise; Ea, actual soil evaporation; Ta, actual crop transpiration; Tp, potential crop transpiration; DP, deep percolation.
Table 8. Yield (kg ha−1) estimates.
SeasonMeasuredApproach AApproach BApproach C
201416,09314,67015,19615,518
201517,30017,93020,91623,016

