Article

Characteristic Analysis of the Downburst in Greely, Colorado on 30 July 2017 Using WPEA Method and X-Band Radar Observations

1
College of Atmospheric Sounding, Chengdu University of Information Technology, Chengdu 610225, China
2
College of Engineering, Colorado State University, Fort Collins, CO 80521, USA
3
Key Open Laboratory of Atmospheric Sounding, Chengdu University of Information and Technology, Chengdu 610225, China
*
Author to whom correspondence should be addressed.
Atmosphere 2018, 9(9), 348; https://doi.org/10.3390/atmos9090348
Submission received: 10 June 2018 / Revised: 4 September 2018 / Accepted: 4 September 2018 / Published: 6 September 2018
(This article belongs to the Section Meteorology)

Abstract

:
As a manifestation of low-altitude wind shear, a downburst is a localized, strong downdraft that can lead to disastrous wind on the ground surface. For effective pre-warning and forecasting of downbursts, it is particularly critical to understand relevant weather features that occur before and during a downburst process. It is important to identify the macroscopic features associated with the downburst weather process before considering fine-scale observations because this would greatly increase the accuracy and timeliness of forecasts. Therefore, we applied the wind-vector potential-temperature energy analysis (WPEA) method and CSU-CHILL X-band dual-polarization radar to explore the features of the downburst process. Here it was found that prior to the occurrence of the downburst of interest, the specific areas that should be monitored in future events could be determined by studying the atmospherically unstable areas using the WPEA method. Combining the WPEA method with dual-polarization radar observations, we can better distinguish the phase distribution of the hydrometeor in the process and greatly enhance the judgment of the possibility of the downburst. From exploration of the microphysical features of the downburst, we further found that ‘Zdr (differential reflectivity) column’ can be regarded as an important early warning indicator of the location of the downburst. Finally, a schematic of the formation process of the downburst according to the analyses was produced.

1. Introduction

A downburst refers to a downward-moving middle-air current that on reaching the surface can generate disastrous divergent or linear ground-level horizontal wind speeds >17.9 m/s [1]. After convective storms develop into a mature stage, cold downdrafts within the thunderstorm clouds can become sufficiently strong to form outflows and squall lines on reaching the ground. It can have considerable impact on the take-off and landing activities of planes. The destructive gale resulting from a downburst can cause plane crashes, human injuries and fatalities, and substantial damage to trees and crops [2,3,4]. Fujita [1] classified downbursts into two categories based on their spatial scales: macrobursts and microbursts. The area of influence of a macroburst is >4 km in diameter and the burst can persist for up to half an hour. The area of influence of a microburst is ≤4 km in diameter and its duration is usually less than five minutes. In addition, downbursts can also be classified as “dry downbursts” or “wet downbursts” according to amount of surface precipitation during the downburst process (with 0.25 mm of precipitation used as the differentiation criterion) and radar echo intensity (with 35 dBz of echo intensity used as the differentiation criterion) [4,5].
Studies on downbursts began in the 1970s when Fujita analyzed the damage caused by an outbreak of super tornadoes that occurred in the USA on 3–4 April 1974, and investigated a plane crash that happened at JFK Airport in New York (USA) on 24 June 1976. It was reported that the main reason for both these incidents was strong downdrafts hitting the ground surface at very high speed and quickly spreading in all directions, thereby causing strong wind shear near the ground surface [6]. In 1978, under the support of the Northern Illinois Meteorological Research on Downbursts Project, Fujita et al. were able to verify the existence of downbursts by conducting the first field observational experiments using three evenly distributed Doppler radars. After analyzing the Doppler velocity field and intensity field information during multiple downburst events, they discovered the existence of a bow echo structure evident on the radar echo map during the downburst process [7,8]. This discovery constitutes a very important reference indicator for the prediction of downbursts. Although about 50 microburst events were observed during the experimental campaign, details of the low-altitude dynamics of the downbursts were not obtained because the strength of the divergent wind field was weak and because the radars were widely separated (i.e., about 60 km apart). Later, Fujita [6] obtained the three-dimensional evolutionary features of the kinematic field of a downburst via the Joint Airport Wind Shear observation experiment, which further promoted elucidation of the forcing mechanism of downbursts.
Considerable research has been undertaken on downbursts based on experimental observations with radars. This research effort has not only explored the echo features presented by downbursts [6,9,10], but it has also examined the features of downburst-prediction signals, especially the three most important features of descending reflectivity cores, mid-level radial convergence, and descending horizontal troughs of Zdr [11,12,13]. With the development of computer technology, the effective combination of experimental observations and numerical models has provided a new research perspective for further study both of the formation mechanisms of downbursts and of the sensitivity of downburst formation to external environmental conditions. Srivastava [14] found that with a declining (increasing) lapse rate of environmental temperature, the occurrence of a downburst required a greater (lesser) amount of water vapor; thus, parent thunderstorm clouds with high moisture content will lead to stronger downdrafts. Based on simulations of downdrafts, Proctor [15,16] found the evaporation of precipitation, melting of hail, and sublimation of snow are all major driving forces behind the formation of downbursts. Knupp [17] used a three-dimensional cloud model to simulate two downburst events generated by thunderstorm clouds. It was found that both the temperature of the boundary layer and the environmental wind shear played important roles in the evolution of the microphysical features of the downbursts. Wakimoto et al. [18] conducted observational experiments and found that snowflake-like hydrometeor particles would be very likely to produce downbursts, which verified an earlier finding by Proctor [16] that was based on numerical simulation. Subsequent research related to numerical models has focused primarily on comparisons of the effects on downbursts of different boundary conditions and microphysical parameterization schemes [19,20,21]. The combination of observations and simulations has established a theoretical model for the formation mechanism of downbursts. However, because of the limitations of observational and simulation methods, many research conclusions remain theoretical and they have yet to be verified observationally. Therefore, such conclusions cannot be considered accurate and reasonable explanations for the evolutionary features of the physical structure of downdraft phenomena.
Following the upgrading of the Weather Surveillance Radar-1988 Doppler system, the application of dual-polarization weather radars has been proven effective for revealing the microphysical features and dynamic mechanisms of downbursts. Dual-polarization weather radars provide information about the intensity change (horizontal reflectivity: Zh) and the phase (average radial velocity: V, spectral width: W) of object-backscattered electromagnetic wave signals at two different polarization states. However, they also provide information about the differences in object-backscattered echoes between the two different polarization states (differential reflectivity, Zdr; two-way propagation phase difference, Фdp; differential propagation phase shift, Kdp; correlation coefficient, CC; linear polarizability, Ldr). These dual-polarization variables are sensitive to hydrometeor properties such as shape, size, orientation, and phase. The integrated use of these variables can help identify hydrometeor type, which is beneficial in understanding the formation mechanism and microphysical changes of downbursts [22]. Bringi et al. [23,24] employed dual-polarization radars and, for the first time, discerned the existence of hail beneath the melting layer, thereby effectively identifying the specific location of a downburst. In 1986, using polarization information provided by dual-polarization weather radars, Fujita and co-workers [25] studied the types of precipitation particles and they analyzed the microphysical change characteristics of thunderstorm clouds before the occurrence of a downburst. Wakimoto and Bringi [26] showed that the downdraft of a microburst was related to the long and narrow axis of the hail, and they found that a ‘Zdr Hole’ appearing in the main core area of precipitation would lead to a strong downdraft. Using dual-polarization radar variables, Doviak and Zrnic [22] conducted detailed analysis and calculation both to determine the capability of the radars to identify various hydrometeors and to establish the value ranges of the various variables. Based on those results, Straka and Zrnic [27] further proposed the use of fuzzy logic algorithms to identify the phases of precipitation particles. Because fuzzy logic algorithms can describe a system using simple rules instead of formulas, they have obvious advantages when used to identify the phases of hydrometeor. Liu and Chandrasekar [28] established a fuzzy logic algorithm for the classification of hydrometeor based on the variables of the Colorado State University CHILL (CSU–CHILL) weather radar (an S-band, dual-polarization radar), and they verified the classification results obtained with the algorithm. Based on the Hydrometeor Classification Algorithm function, Mahale et al. [29] used the KOUN dual-polarization radar in Oklahoma (USA) to study a downburst event, analyzing the detail of the microphysical evolution characteristics of the process and obtaining a corresponding conceptual model.
To date, only a small number of theoretical studies on downbursts have been conducted using dual-polarization radar observations, and few have explored the relationships between the meteorological environmental fields and microphysical structures, both of which affect downburst formation. Analysis of the meteorological environmental fields and microphysical structures is of pivotal importance regarding the prediction of downbursts. Therefore, this study had three primary objectives: (1) to perform qualitative analysis of the downburst process based on conventional observational data; (2) to investigate the microphysical processes of downbursts from the perspective of detection, focusing on linking the external environmental conditions to the microphysical change characteristics during the evolution of a downburst to elucidate the underlying cause of downburst development; and (3) to refine the theoretical model of the occurrence and development of downbursts.
The remainder of this paper is organized as follows. Section 2 introduces the data and methods used in this study. Section 3 presents a detailed analysis of the case study. The conclusions are presented in Section 4.

2. Data and Methods

2.1. Data Sources

The radar data were obtained by the CSU–CHILL. This radar, located in Greeley (CO, USA), is an advanced, transportable dual-polarized dual-wavelength (S- and X-band) weather radar system. The facility is operated under the joint sponsorship of Colorado State University and the National Science Foundation [30]. This radar is one of the most advanced dual-polarization radar systems currently available, and it is the first radar that measures differential reflectivity factors using a slow switch. Following several upgrades, the radar can be operated in three observation modes: (1) the conventional mode of alternating horizontal and vertical polarization; (2) the mode of simultaneous transmission and alternating reception; and (3) the mode of simultaneous transmission and simultaneous reception. This study used the CSU–CHILL dual-polarization X-band radar observation data to monitor and analyze the downburst process (see Table 1 for the main parameters). X-band data were used for the analysis because they allow variables to be investigated in more detail, and because the X-band is more sensitive than the S-band to microphysical phase changes when analyzing the differential phase (Kdp) of radar pulses. Before use, quality control and attenuation correction were performed on the data [30,31].
In addition to using the CSU–CHILL radar data, our research also used the North American Regional Reanalysis (NARR) dataset to construct and analyze the meteorological environmental fields. The spatial resolution of the NARR dataset is 32.463 × 32.463 km and the temporal resolution is 3 h [32]. The dataset is derived primarily from all the observational data in the National Centers for Environmental Prediction/National Center for Atmospheric Research Global Reanalysis project, as well as relevant precipitation data, TOVS 1B radiance data, profiler data, and land surface and moisture data. All the data are processed using the Eta 32 km/45-layer model to produce the final dataset. This dataset is generally considered reliable and thus it was adopted in this study to conduct a comprehensive analysis of the atmospheric environmental fields.

2.2. Method

When analyzing the atmospheric environmental fields, the NARR data were used to represent the horizontal or vertical distributions of variables such as wind direction, wind speed, temperature, humidity, and air pressure at various altitudes. The data were mainly used for the qualitative analysis of the atmospheric environmental fields, but they were also used to provide temperature and humidity and other information that the CSU-CHILL radar failed to measure. When studying the vertical atmospheric structure based on single-station observational data, the “3θ” energy analysis method can be used to analyze and study the thermal features of the atmospheric environmental fields [33,34]. Here, 3θ refers to three types of temperature: the potential temperature θ, pseudo-equivalent potential temperature θsed (calculated using the dew point temperature), and saturation temperature θ*, which assumes a saturated state of air at the current temperature. Details about the definitions and calculation methods of the three temperatures can be found in Wang et al. [33]. The main reason for adopting this method in this study was that it allows the evolution of the atmospheric environmental fields under strong-convection weather to be presented in a qualitative manner.
A schematic of the 3θ is shown in Figure 1. In general, potential temperature increases with altitude (showing a 45° inclination in the P–T diagram). A decrease (or no change or only a slight change) of the three θ curves in the leftward direction of the abscissa axis with increasing altitude indicates the vertical structure of the troposphere is extremely unstable and that accumulating energy will need to be released [35].

3. Case Study

The case study incident was a strong-convection weather process involving a downburst accompanied by localized hail and precipitation. The downburst incident occurred from 20:20 to 20:36 Universal Time (hereafter, UT) on 30 July 2017 in the northwestern part of Greely (CO, USA). During this incident, the area of impact of the downburst exceeded 4 km in diameter and the maximum ground wind speed exceeded 20.0 m/s. Prior to this incident, the National Weather Service had issued a warning of slow-moving thunderstorms in the region, which produced up to 1.25 inches of rain in 30 min in some areas. Forecasters warned of the potential for stream and street flooding due to the heavy rain; however, the forecast did not mention the potential for downbursts.

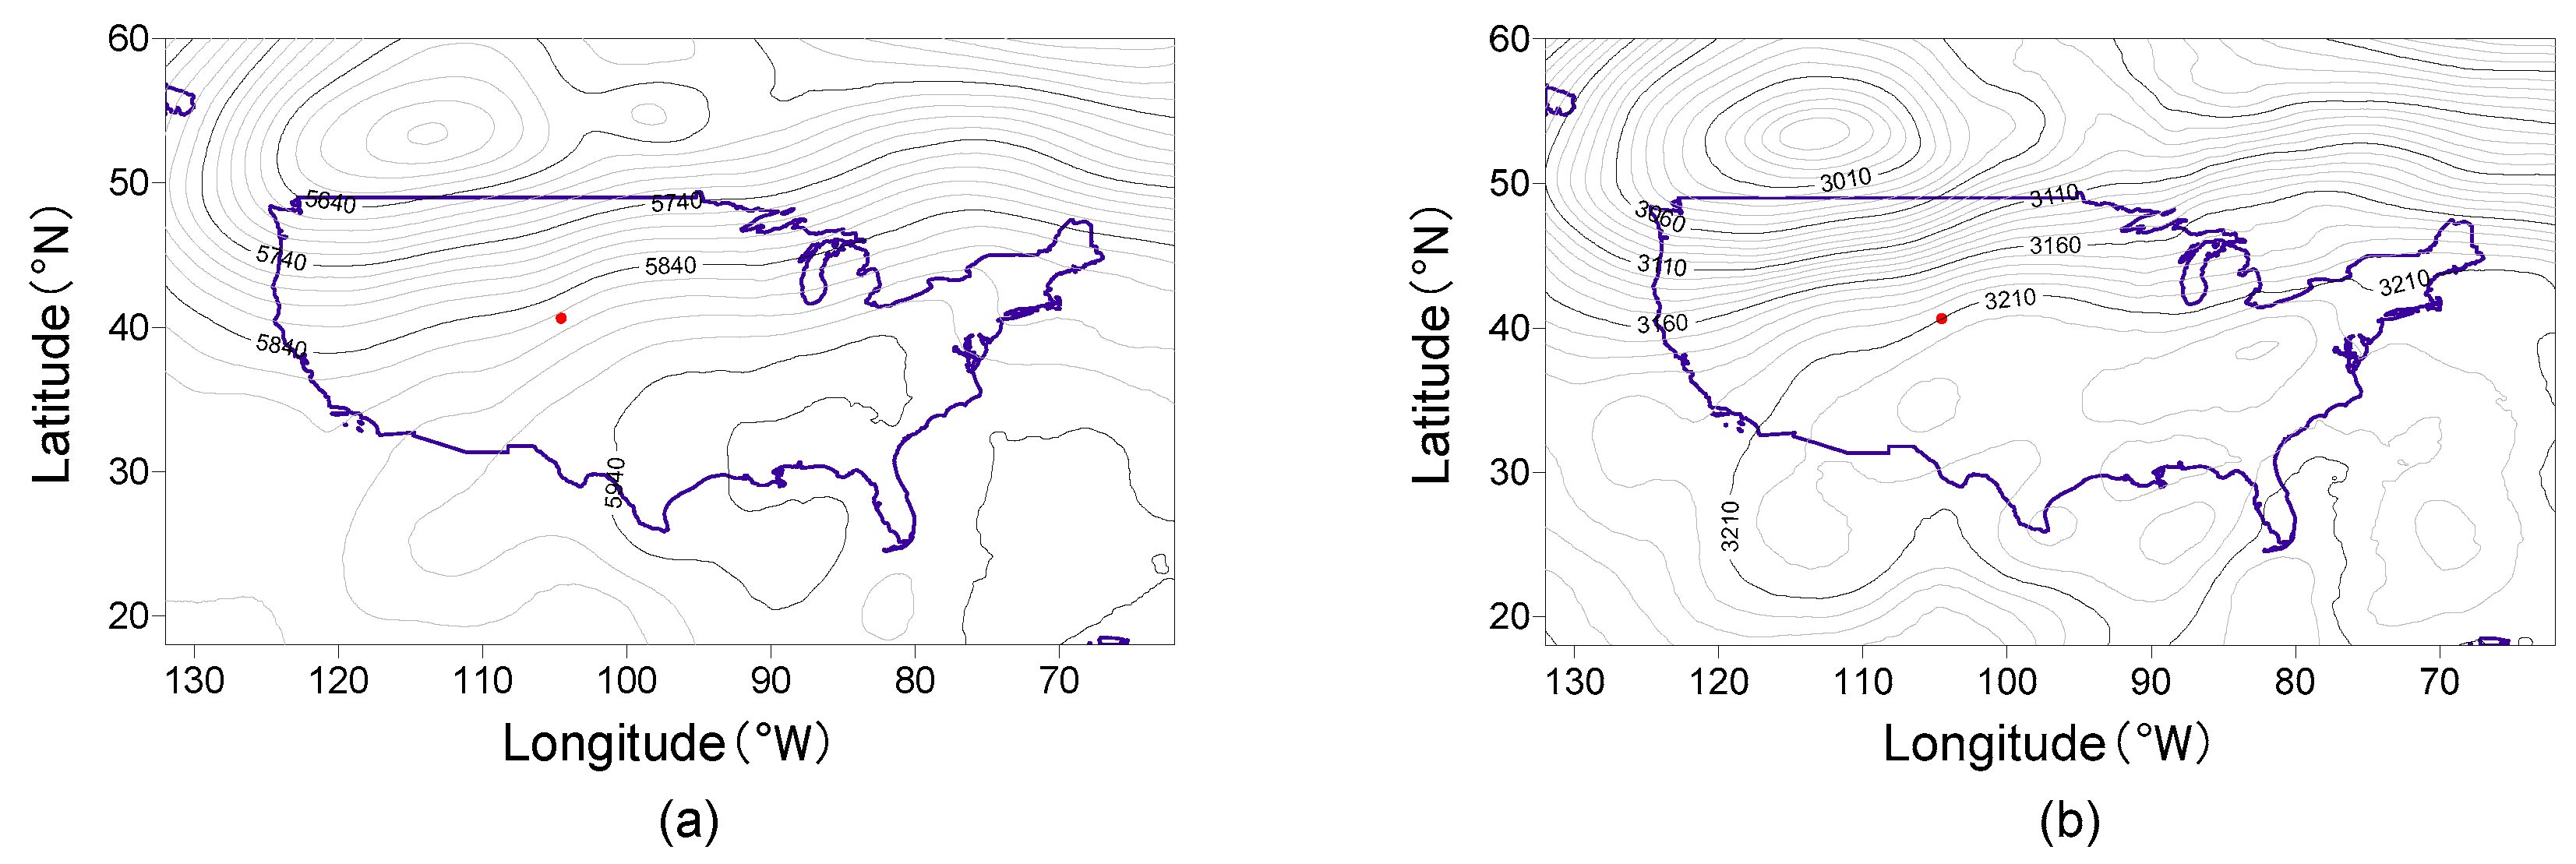
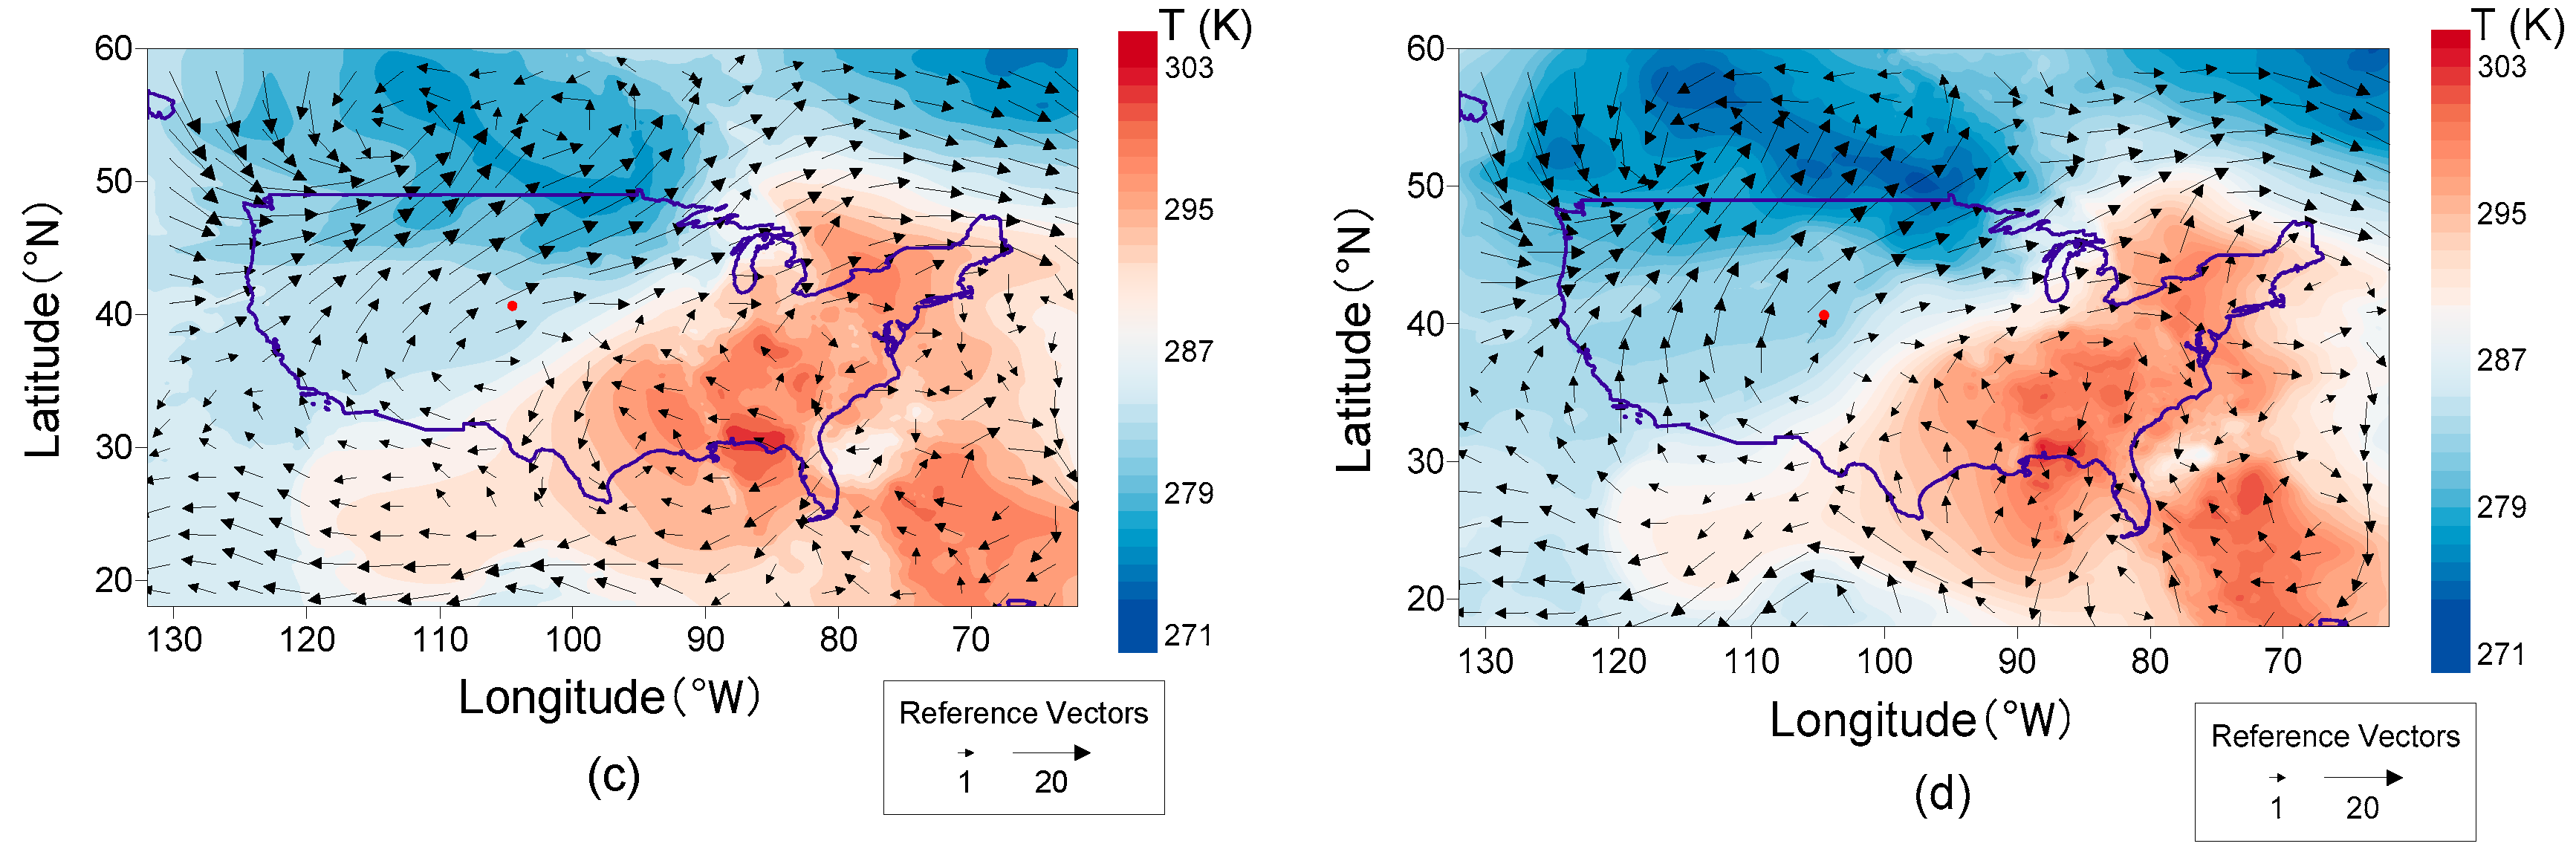
3.1. Atmospheric Circulation Situation

Analysis of the atmospheric circulation situation associated with this incident revealed that a subsynoptic-scale horizontal trough in front of a baroclinic northwest cold vortex was the main influential system in this process. As shown by the high- and low-altitude configurations of the atmospheric circulation fields, the 500-hPa upper trough at 18:00 UT on 30 July was slightly ahead of the 700-hPa upper trough (Figure 2a,b). Although the 700- and 850-hPa upper troughs largely overlapped each other in terms of their positions, both lagged behind the 500-hPa upper trough. Strong-convection weather usually occurs in such forward-tilting trough structures, because it is easy for unstable convective structures to form where the dry and cold advection behind the upper trough is located above the warm and wet advection in the front part of low-altitude trough. Another important influential system was the warm anticyclone below 600 hPa that was centered over southeastern Colorado. The location of the downburst was situated between the cold trough and the warm anticyclone. With the downward swing of the troughs (from Figure 2c,d), the anticyclone moved slowly southward and it expanded toward the east, which increased the temperature gradient between the cold trough and the anticyclone, leading to an increase of baroclinicity and consequently, to an increase of wind speed.

3.2. Atmospheric Environmental Conditions

The root cause of strong-convection weather such as downbursts is the non-uniform change and distribution of atmospheric heat [35,36]. The occurrence of strong-convection weather is not only related to relevant dynamic factors but also closely related to unstable energy distribution (thermal conditions) and water vapor saturation (water vapor conditions) [37]. Therefore, this study used the 3θ analysis method to analyze the atmospheric energy structure during the case study incident to reveal the evolution of the atmospheric environmental fields. In this method, θ represents the vertical distribution of atmospheric heat, θsed is the potential temperature calculated using the dew point temperature instead of the traditional condensation level temperature, and θ* is the potential temperature assuming a saturated state of the air at the current temperature, which is intended to compare the distribution of atmospheric water vapor.
As shown by the atmospheric structures at the three time points of 12:00, 15:00, and 18:00 UT on 30 July 2017 (Figure 3a–c, respectively), the lines of θsed and θ* are leftward tilting and especially for the altitude below 780-hPa (about 2.3 km) which form obtuse angles with the temperature axis (T-axis). These configurations are attributed primarily to convective instability of the low-altitude air due to ground heating, indicating that overall convection was established below the 780-hPa altitude. Moreover, convection started to strengthen after 12:00 UT, as reflected in the increase of the obtuse angles and the increase of the unstable-layer altitude [33]. In addition, with regard to the entire layer of the atmosphere, the average distance between the θsed and θ* lines is substantial, indicating the atmospheric water vapor content was not high, which is representative of the essential difference between general showery precipitation and continuous heavy precipitation in weather processes [35]. As shown by the vertical distribution of specific humidity in Figure 4, there was accumulation of water vapor before the onset of the downburst, and although adequate high-altitude water vapor might have provided conditions necessary for the occurrence of hail, there was no obvious change in the water vapor content at lower altitudes. As the release of unstable energy can occur in the form of rainfall (hail), strong winds, or thunder and lighting, it is foreseeable based on the temperature–humidity distribution characteristics (calculations showed that cumulative precipitation on the ground was less than 10 mm during 18:00–21:00 UT). Because of the low height of the water vapor transport and the inadequate low-level water vapor, we can infer that this process was not dominated by precipitation but that it had already released unstable energy in another form. Therefore, we should heed more the occurrence of hail and strong winds, as well as thunder and lightning.

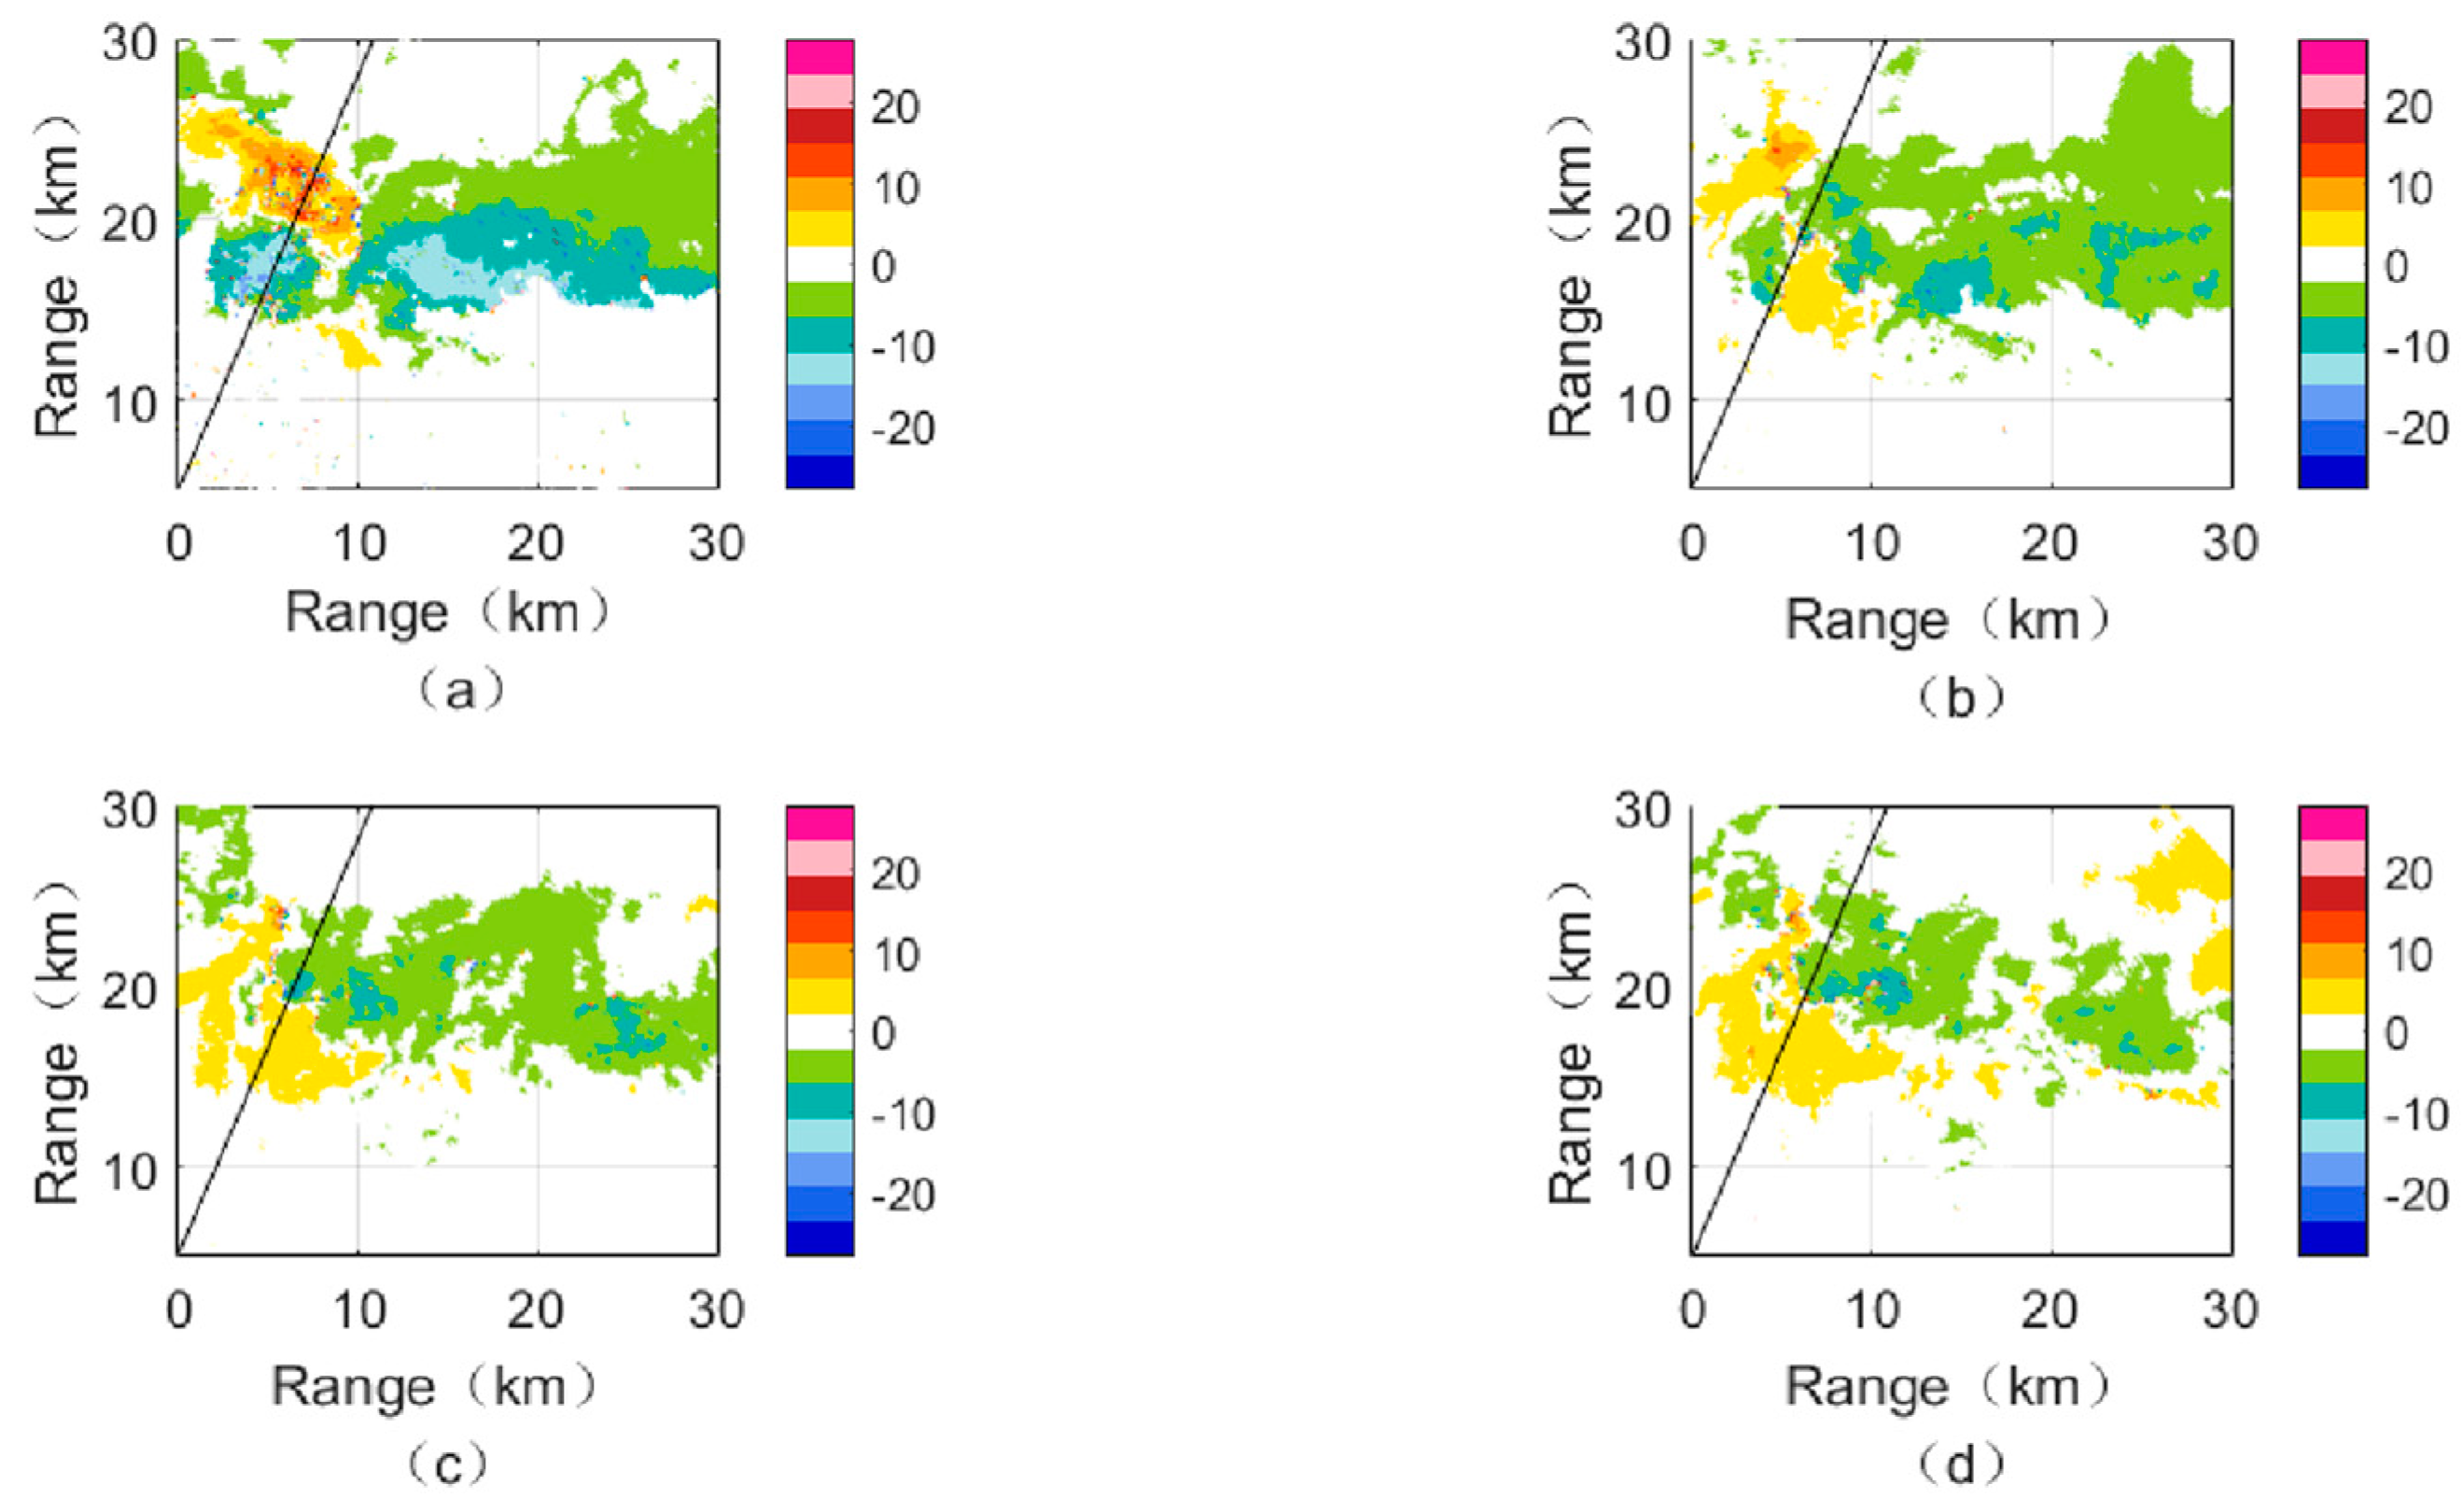
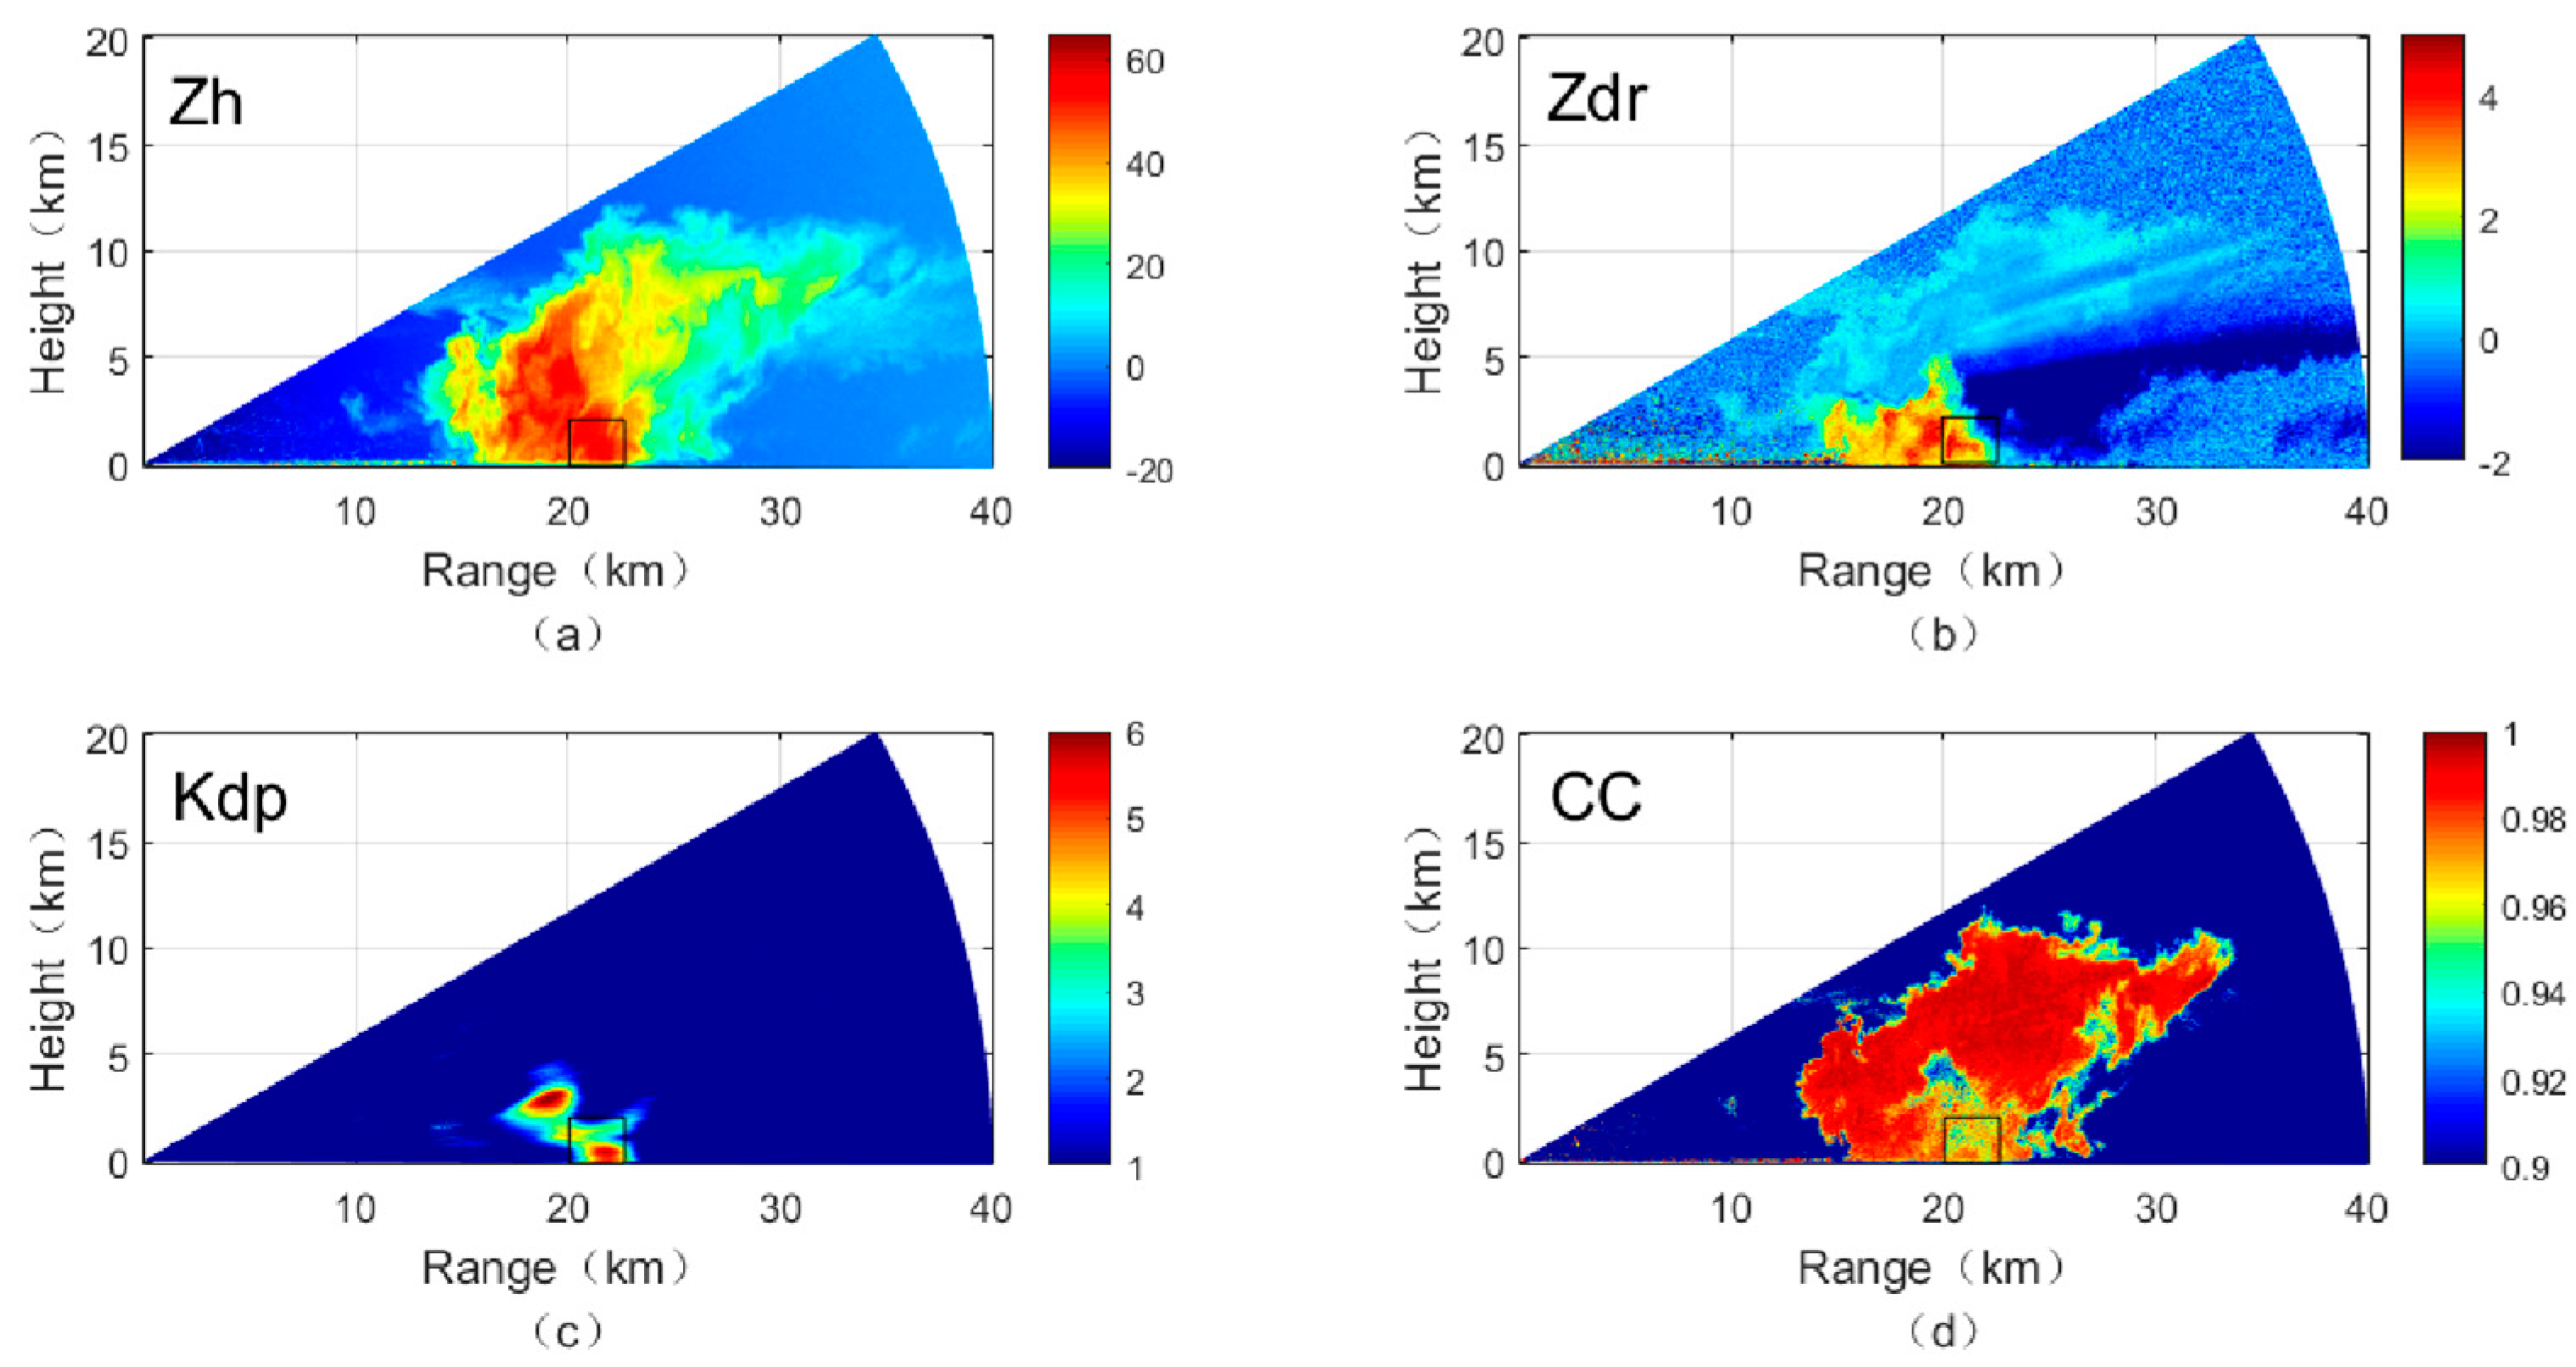
3.3. Dual-Polarization Radar Observations

The configurations of the atmospheric environmental fields, which created the external conditions favorable for the occurrence of the case study downburst, could qualitatively have provided a certain degree of predictability regarding the occurrence of the incident. To study the downburst process in detail, we analyzed the process evolution features based on the dual-polarization radar observations, focusing on the microphysical features of the downburst present in the special atmospheric environment when the downburst occurred.
The hail precipitation began at 20:16 UT, which is when the strong surface wind began to increase in intensity. As shown in the 20:23 UT Plan Position Indicator (PPI) radial velocity map at 0.5° elevation, a pair of very strong positive and negative velocities was present about 21 km from the CSU–CHILL radar station. This indicated strong divergent movement with maximum divergent wind speed of >18.0 m/s was occurring near the ground, that is, approximately 0.2 km above the ground (Figure 5a). The maximum instantaneous wind speed at the ground surface exceeded 20 m/s. Multiple PPI radial velocity maps at 20:23–20:25 UT (Figure 5) illustrate the wind field structure of the downburst. There was strongly divergent movement at low altitudes (0.5° elevation, at around 0.2 km) (Figure 5a), a distinctly convergent structure at high altitudes (6.5° elevation, at around 2.4 km) (Figure 5d), and cyclonic circulation between the two (Figure 5b,c). This circulation strengthened these two movements and allowed them to develop vigorously. In addition, as the height that the downburst system reached (i.e., around 2.4 km) coincided very much with that of the unstable layer of the atmospheric environmental fields, we concluded that the atmospherically unstable area obtained from the wind-vector potential-temperature energy analysis indicated the evolving position of this downburst. Thus, this could be used to constrain the key region for downburst monitoring.
In-depth analysis of the internal structure of a downburst is fundamental to understanding the process. The CSU–CHILL radar performed eight complete Range–Height Indicator (RHI) scans from 20:28:30 to 20:31:46 UT. As shown in the RHI scans at the azimuth of 31°, the strong echo region (Zh > 45 dBz) extended in the vertical direction to a height of 8.6 km (Figure 6a). Two kernels with strong reflectivity factors (>60 dBz) were evident at heights of 5 and 1 km at horizontal distances of 19.5 and 21 km, respectively, from the radar. In general, the maximum reflectivity factors of storm cells that produce downbursts have large heights and rapidly descending reflectivity factor cores. The higher the maximum reflectivity factors, the faster the factors descend, and the longer the precipitation particles dive downward [38]. This means the air currents would plummet at higher speeds, and when the vertically descending air currents approach the ground surface, they would generate a destructive wind, that is, a downburst. In the case study incident, the center of high divergence caused prolonged sinking that further strengthened the intensity of the downburst. The above features suggest that the strong reflectivity factors at the distance of 21 km from the radar, close to the ground surface, reflected the presence of hail or strong precipitation, and that strong divergent currents had appeared on the ground surface, meaning that this incident had manifested the basic features of a downburst.
The changes of dual-polarization variables allow further analysis of the microphysical features of the downburst process and the determination of features for the prediction of the downburst occurrence. Calculation based on observational data suggested the freezing level of the storm cloud in the case study incident was located at about the 650-hPa height, equivalent to about 3.8 km above the ground. Moreover, it was observed that the ‘Zdr column’ extended to a height of about 4.7 km (Figure 6b). This exceeded the height of the zero-degree layer by about 0.9 km, indicating that the strong upward movement had flushed liquid droplets to above the freezing level [39]. This likely led to the formation of supercooled water droplets and small ice particles, which—once in contact with one another—would have resulted in the freezing of the liquid droplets onto the surfaces of the ice crystals and formation of larger graupel particles, a process called accretion. Supercooled water droplets and graupel particles are important sources for the formation of hail embryos [40]. At the top of the ‘Zdr column’, above the zero-degree level, contact between ice crystals and supercooled water droplets would have led to the freezing of the liquid droplets and the formation of small ice particles, which could account for the rapid decrease of Zdr values. In addition, the height of the top of the ‘Zdr column’ can be regarded as the maximum height reachable during ascent within a storm [29]. Thus, this maximum height could represent a reference value for the evaluation of the strength of the incident process. From the perspective of dynamics, the kinetic energy of an updraft is stored as potential energy at this height. With the beginning of precipitation (hail precipitation), the upper parts of clouds begin to collapse and become downdrafts, and the potential energy is released and converted back into kinetic energy. At the top of the ‘Zdr column’ shown in Figure 6d, there is a zone where the CC values decreased rapidly to <0.9. Other studies have referred to such a zone as a ‘CC Hole’ [41]. The appearance of a ‘CC Hole’ indicates that graupel particles and hailstones were forming and growing within the zone [42,43]. Therefore, based on the location of the ‘Zdr column’, the appearance of the ‘CC Hole’, and the low Kdp values within the zone, it can be deduced that hailstones were continually forming and developing despite the occurrence of the downburst [44]. The black box in Figure 6 denotes the core zone of the microburst. Based on the features of Zh (>50 dBz), Zdr (3–6 dB), Kdp (2–4°/km), and CC (0.90–0.95), it can be ascertained that the microburst process involved mixed precipitation dominated by hail, confirming the conclusion of other researchers that a wet downburst is usually accompanied by the formation of hail [16,45]. Although the Zh values showed the presence of two kernels with strong reflectivity factors, the distribution of Zdr suggested the phases of the hydrometeor of the two kernels were different. The high-altitude kernel was associated with smaller values of Zdr, indicating the formation and growth of hailstones, while the low-altitude kernel was associated with larger values of Zdr, indicating a mixed precipitation process in which hailstones were melting and large raindrops were forming.
When the radar scanned at the azimuth of 37° at 20:32 UT (Figure 7), it was found that of the two kernels with strong reflectivity factors, which had existed at earlier time points, the distribution of Zh indicated only one remained at this time point. The kernel close to the ground surface had disappeared at this time. Comparison of the distribution of strong echoes (>45 dBz) between this time point and earlier time points suggests that although the echoes were still large, they had loose internal structures with blurred edges, and that their sizes and intensities were weak than azimuth at 31°. The top height was still large but the intensity gradient had dropped significantly, with strong echoes occurring in the middle and lower parts as the height kept decreasing. At this time point, the height of the ‘Zdr column’ was less than 3.8 km above the ground, indicating that there were no strong upward movements within the storm cloud and no liquid water droplets below the freezing level being flushed to above the freezing level. As shown by the distribution features of the correlation coefficients, the ‘CC hole’ was in the middle and lower layers and the CC values distributed around it were mostly <0.95. Moreover, most importantly, based on the RHI radial velocity maps (Figure 8), there was obviously no divergent movement of velocity near the ground. This indicates that the downburst formation was closely associated with the occurrence of and the extended height of the ‘Zdr column’. Although Zh was relatively high, the lack of dynamic uplift made it difficult for liquid droplets to develop into supercooled water droplets and ice particles. Thus, energy released during precipitation was insufficient, bringing relatively weak downward airflow. To further verify the validity of the conclusion, we compared the Zdr and radial velocity maps obtained at azimuths of 33° and 35° and we discovered divergent movements with high velocities near the ground when the ‘Zdr column’ appeared and extended over the freezing level.

4. Conclusions

This study conducted in-depth analysis of the weather process of a typical downburst phenomenon that occurred on 30 July 2017 in Greely, Colorado (USA). Based on the WPEA method and dual-polarization radar observations, we obtained the critical meteorological and microphysical features of this downburst process and we produced a schematic of its formation (Figure 9). The primary conclusions derived are as follows.
(1)
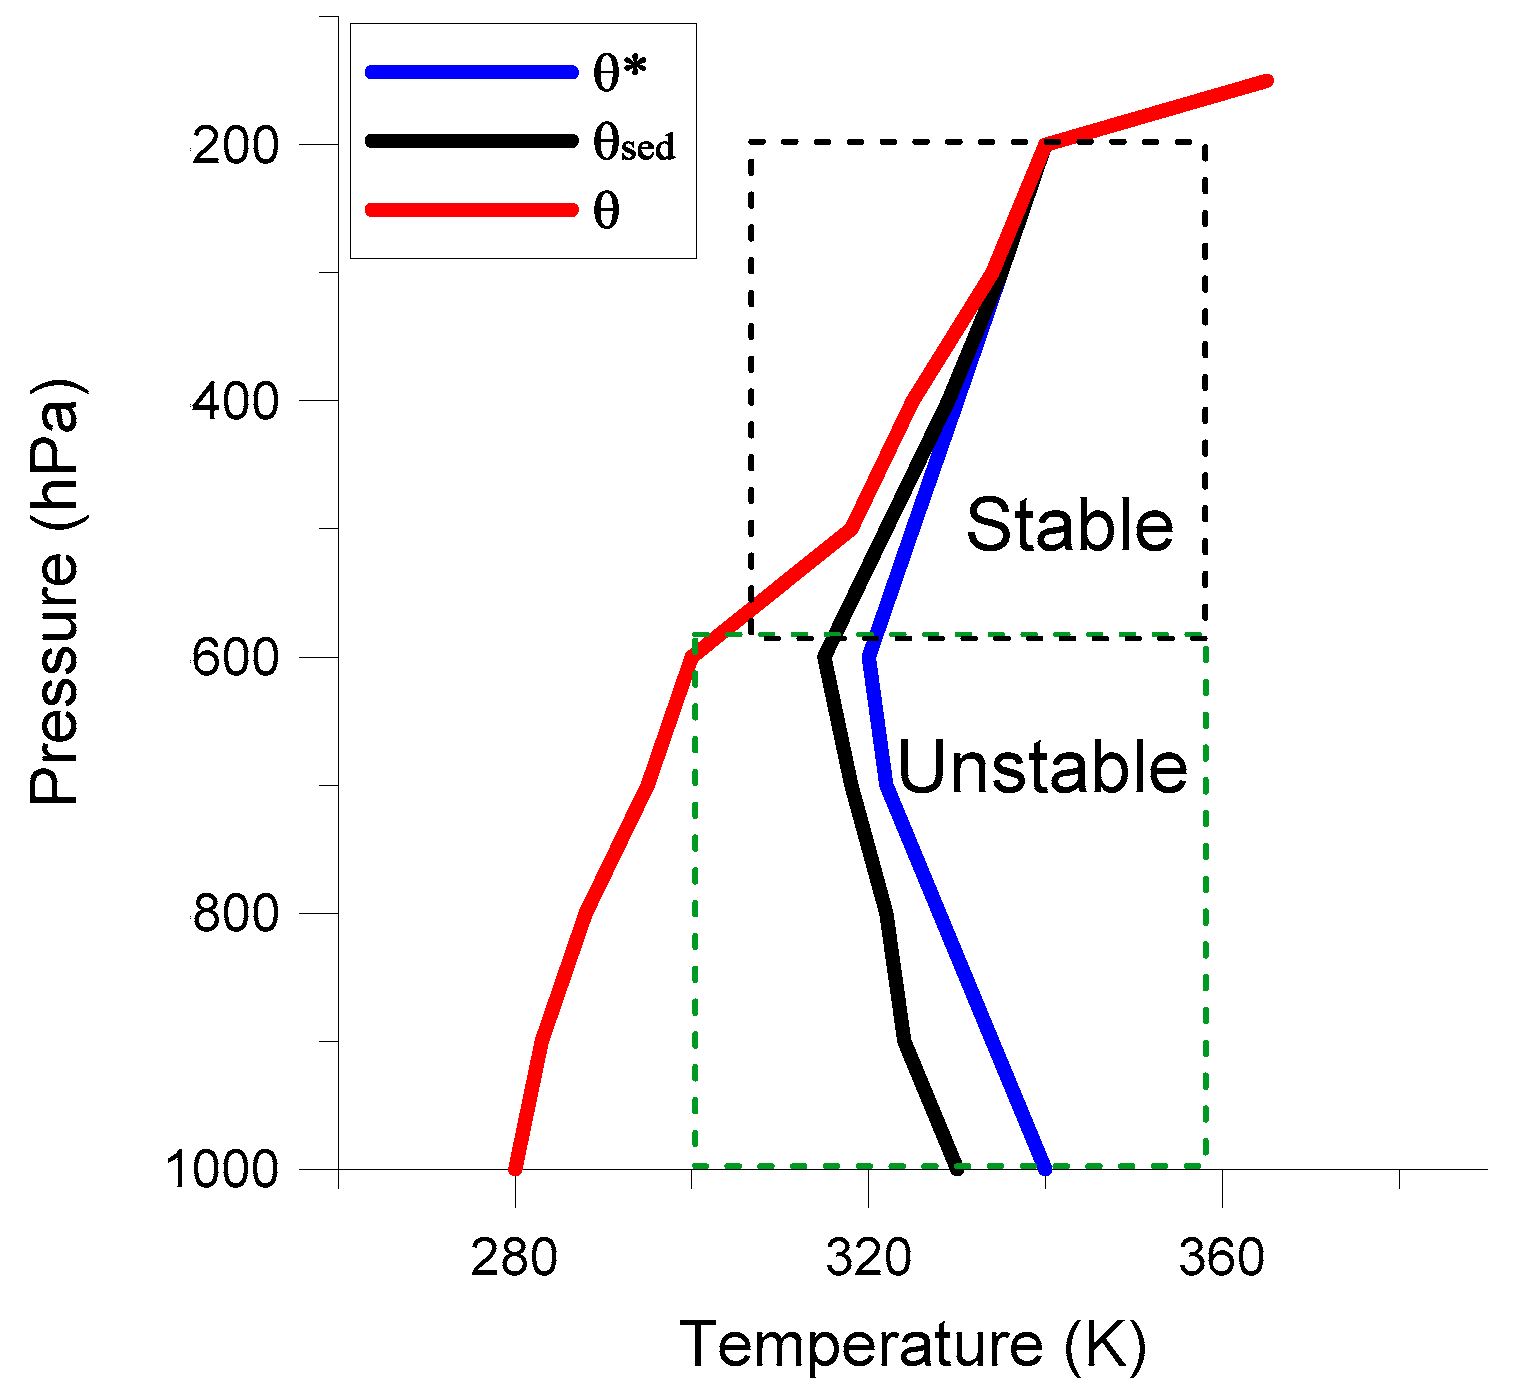
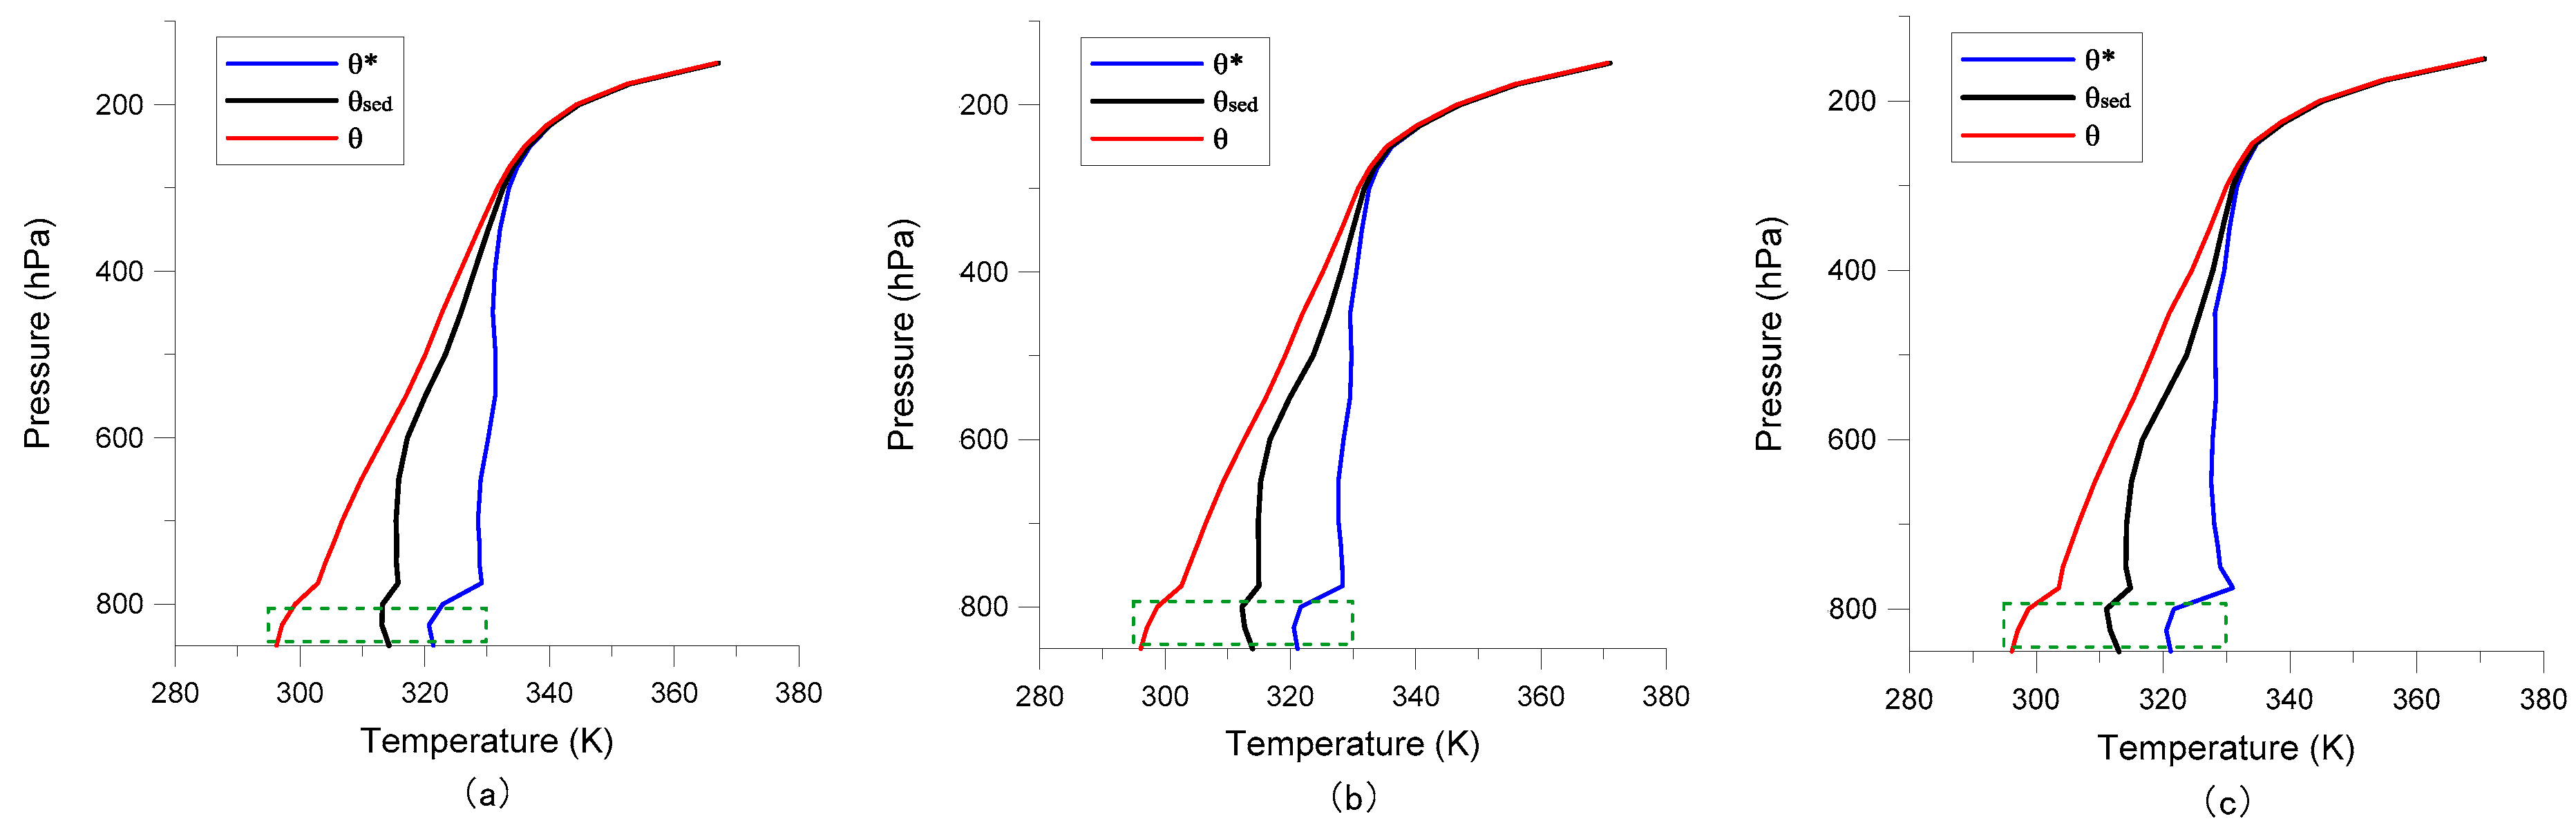
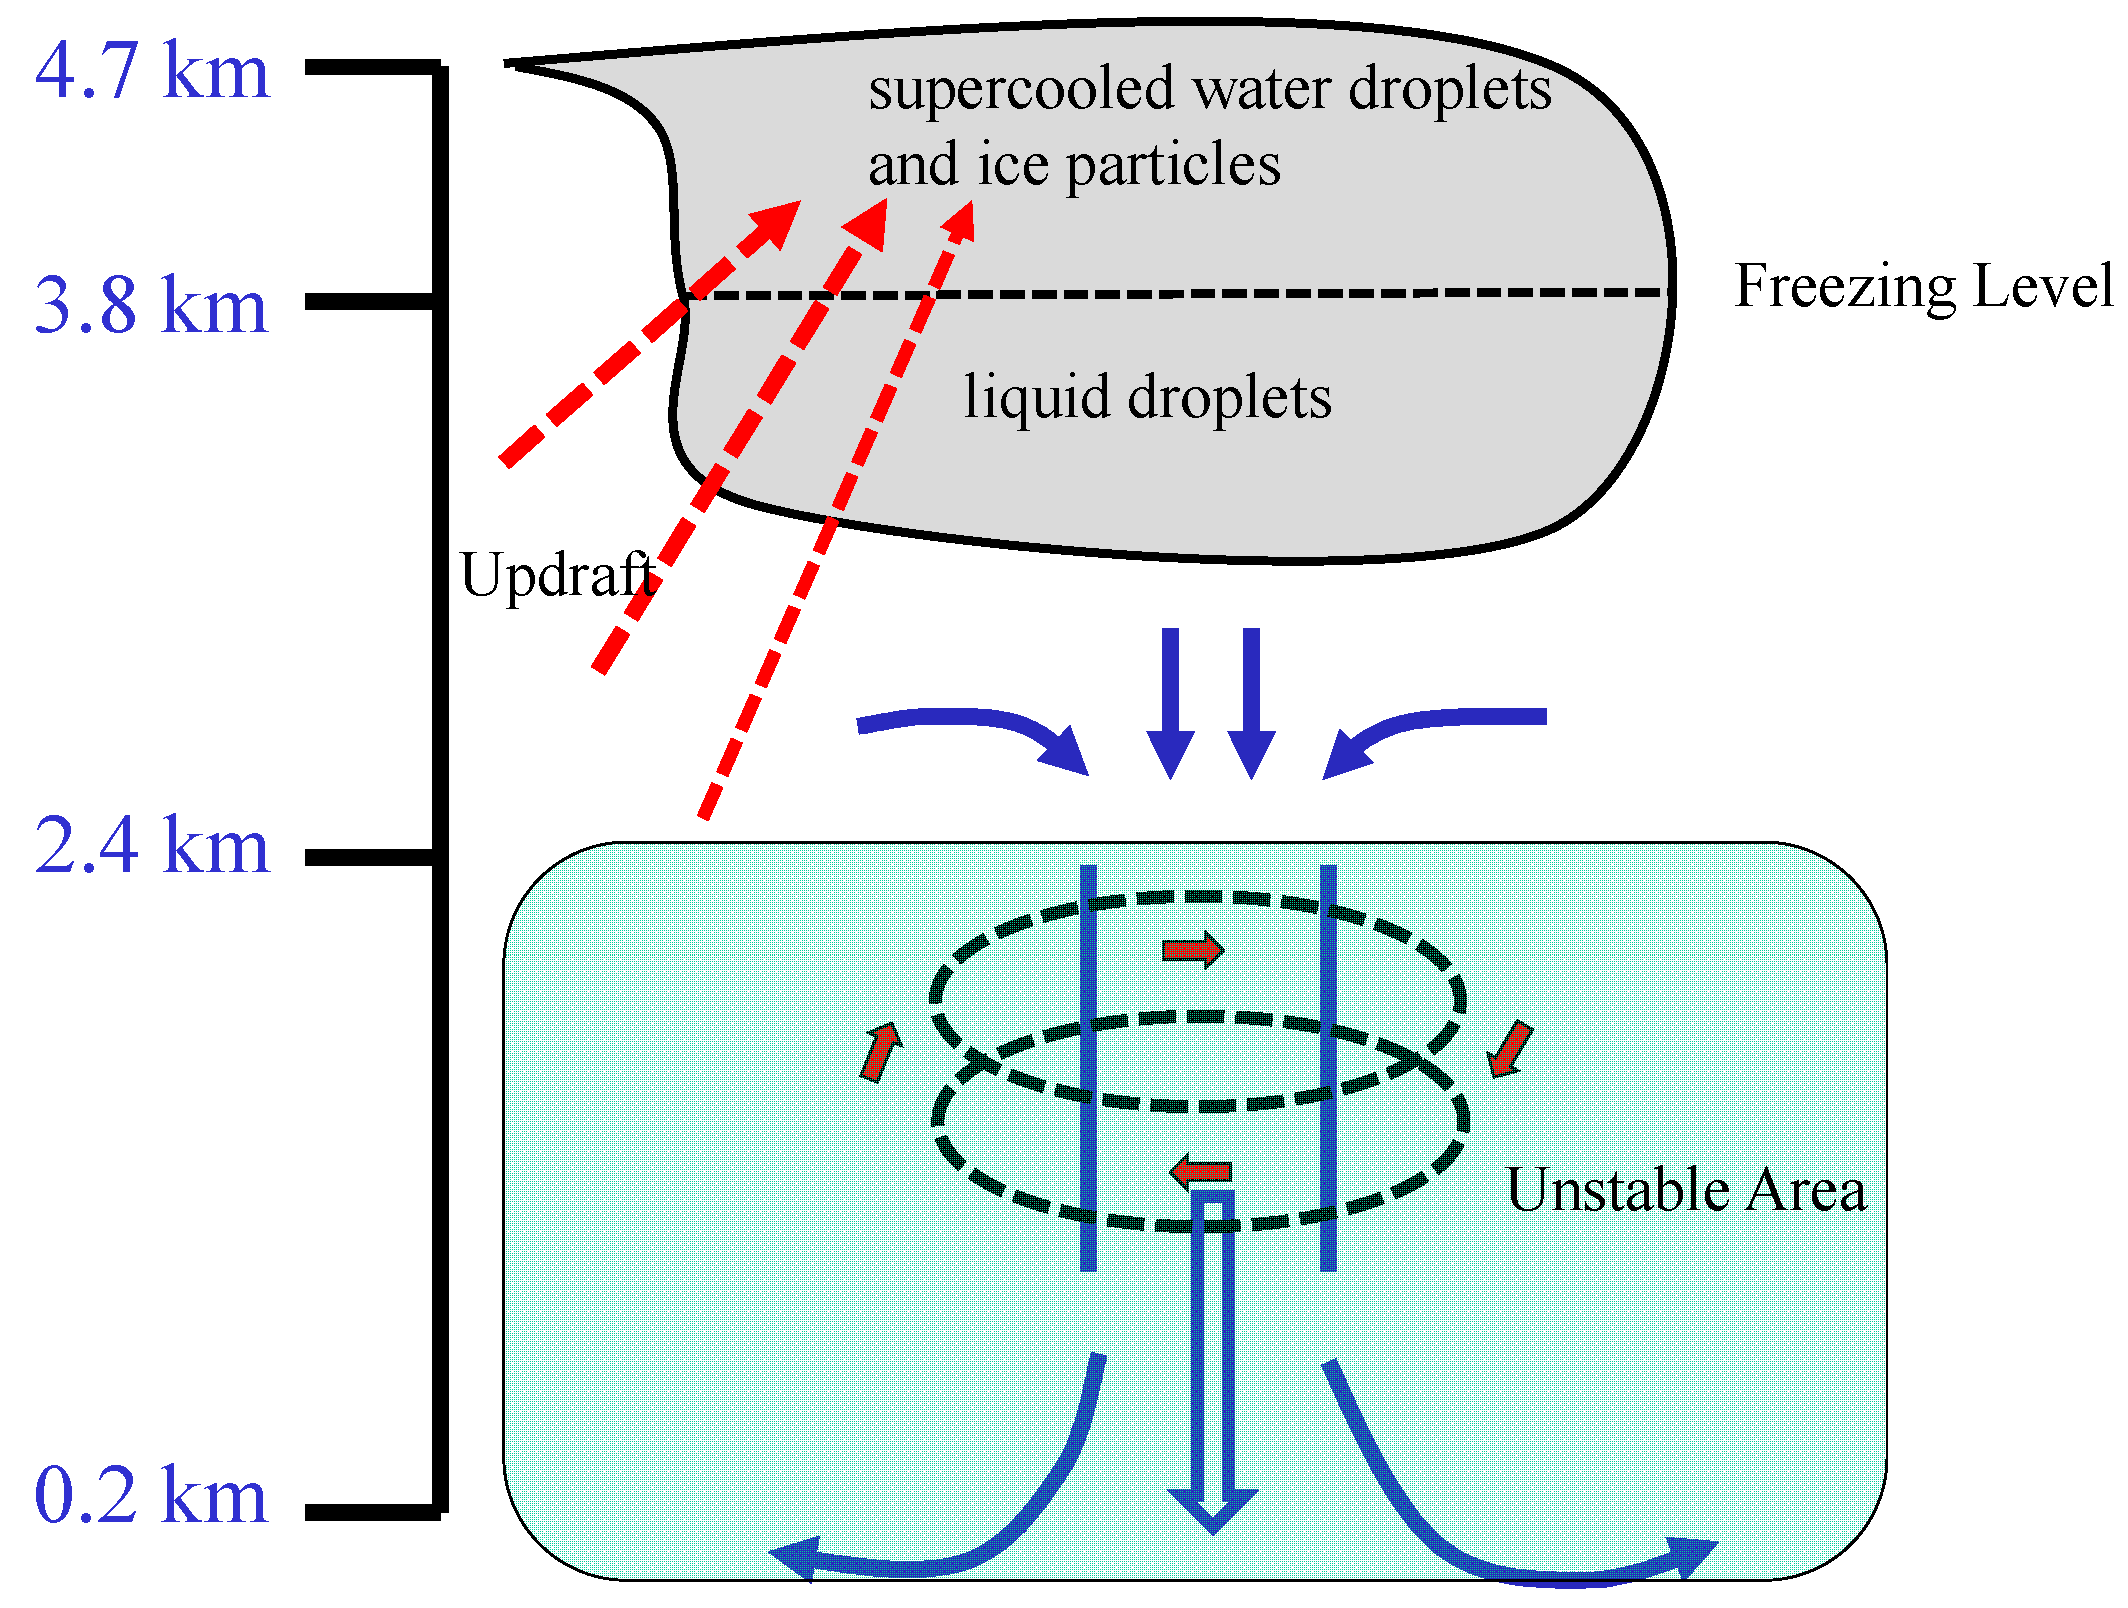
Features of the atmospheric environmental field: The most important feature of downburst occurrence was the uneven distribution of heat in the external atmosphere. The distribution structure determines the degree of instability of the atmosphere. Before the onset of the downburst, the 3θ diagram showed the angles of tilt of the θsed and θ* lines becoming larger relative to the T-axis, and the unstable layer before the onset of the downburst was at an altitude below the 780-hPa level (about 2.3 km). Furthermore, analysis of the wind field of the downburst system showed that the height of the downburst, at around 2.4 km, was highly consistent with that of the unstable layer of the atmospheric environmental fields. Therefore, a new finding in this paper is that the important locations to monitor for downbursts can be determined by studying the atmospherically unstable areas using the WPEA method.
(2)
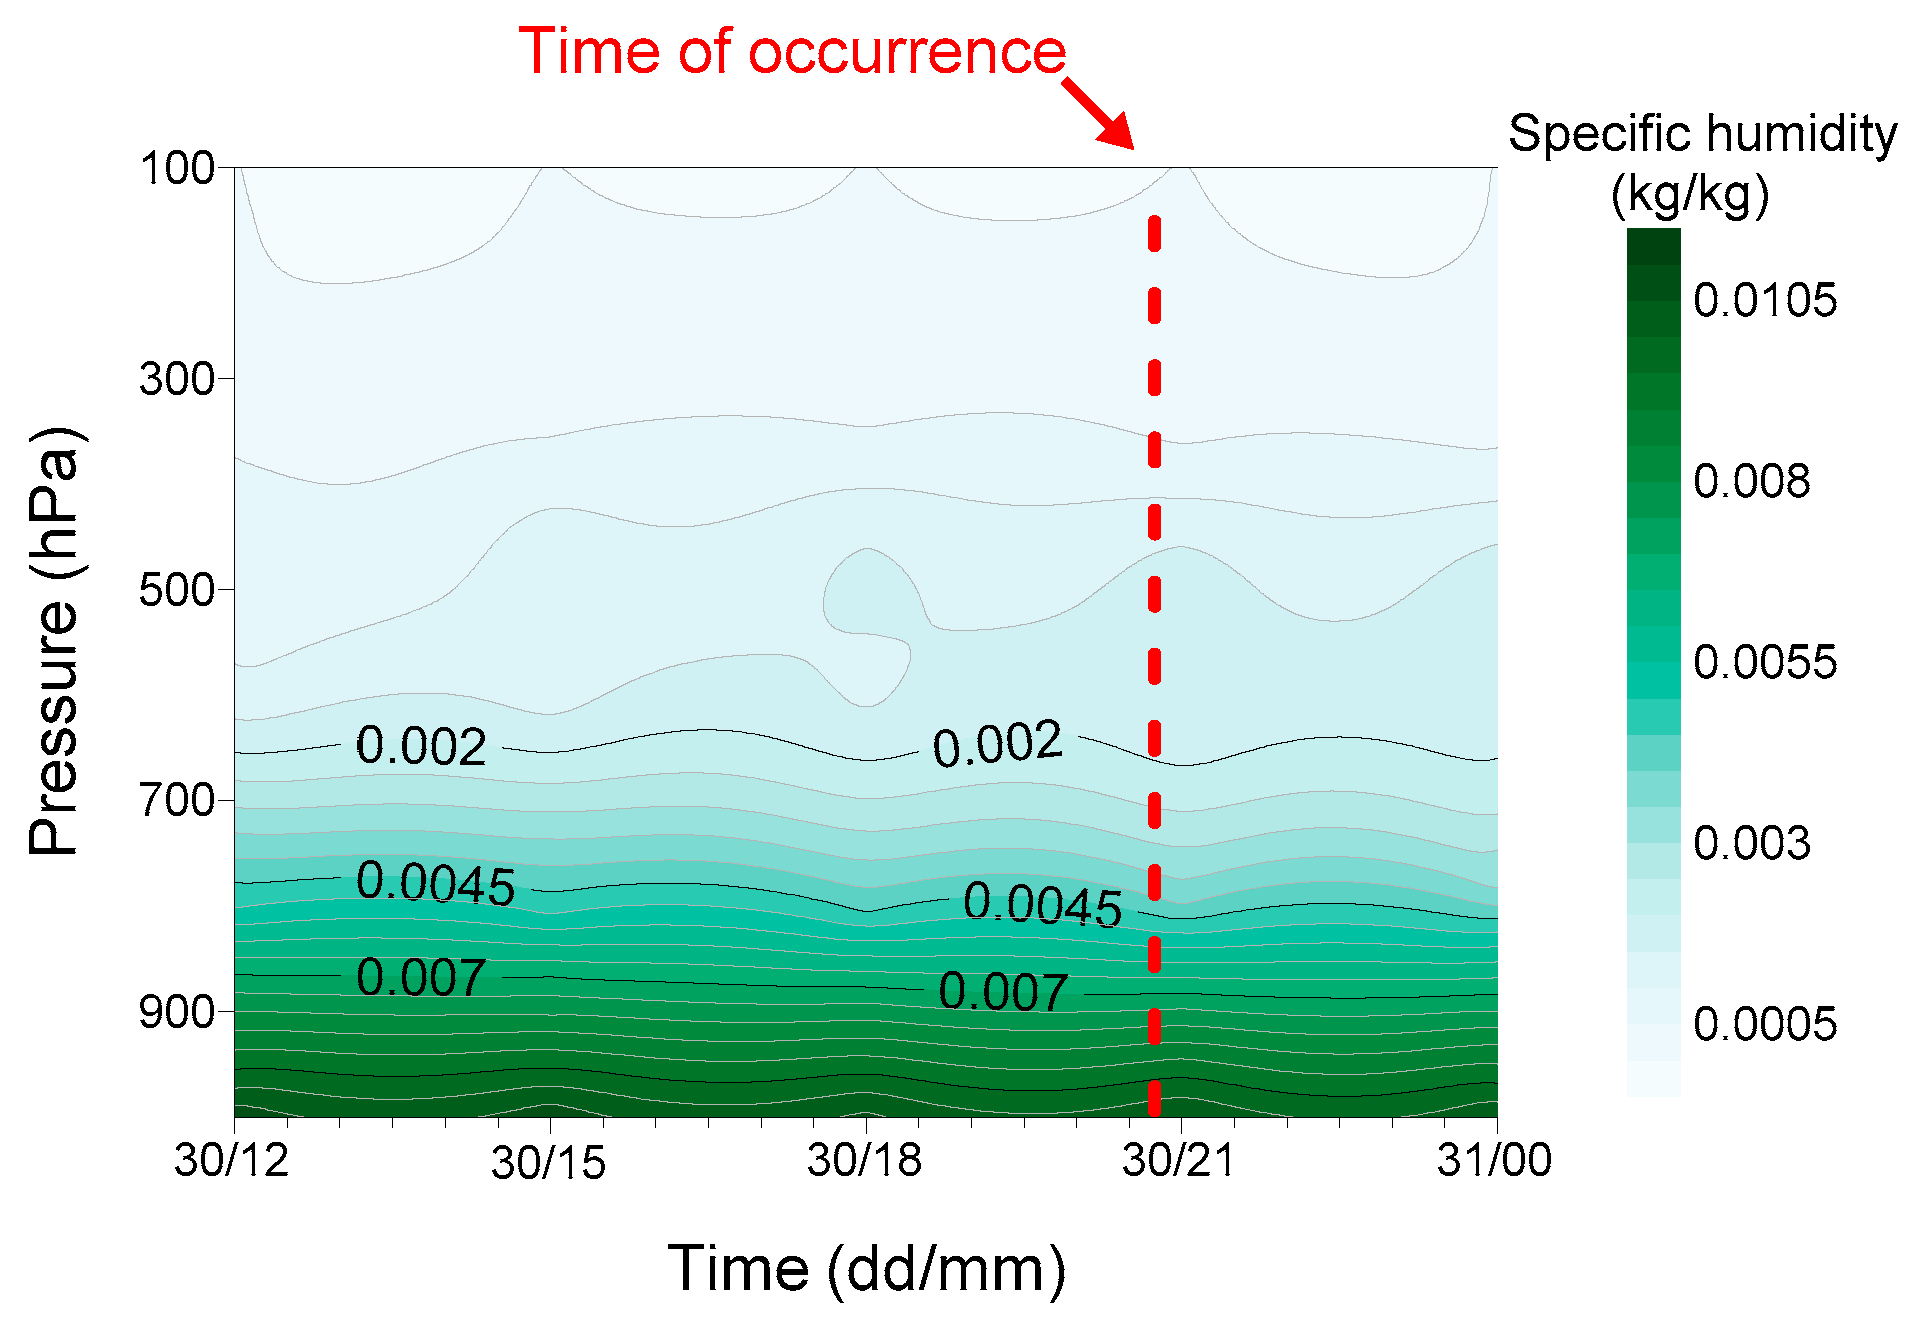
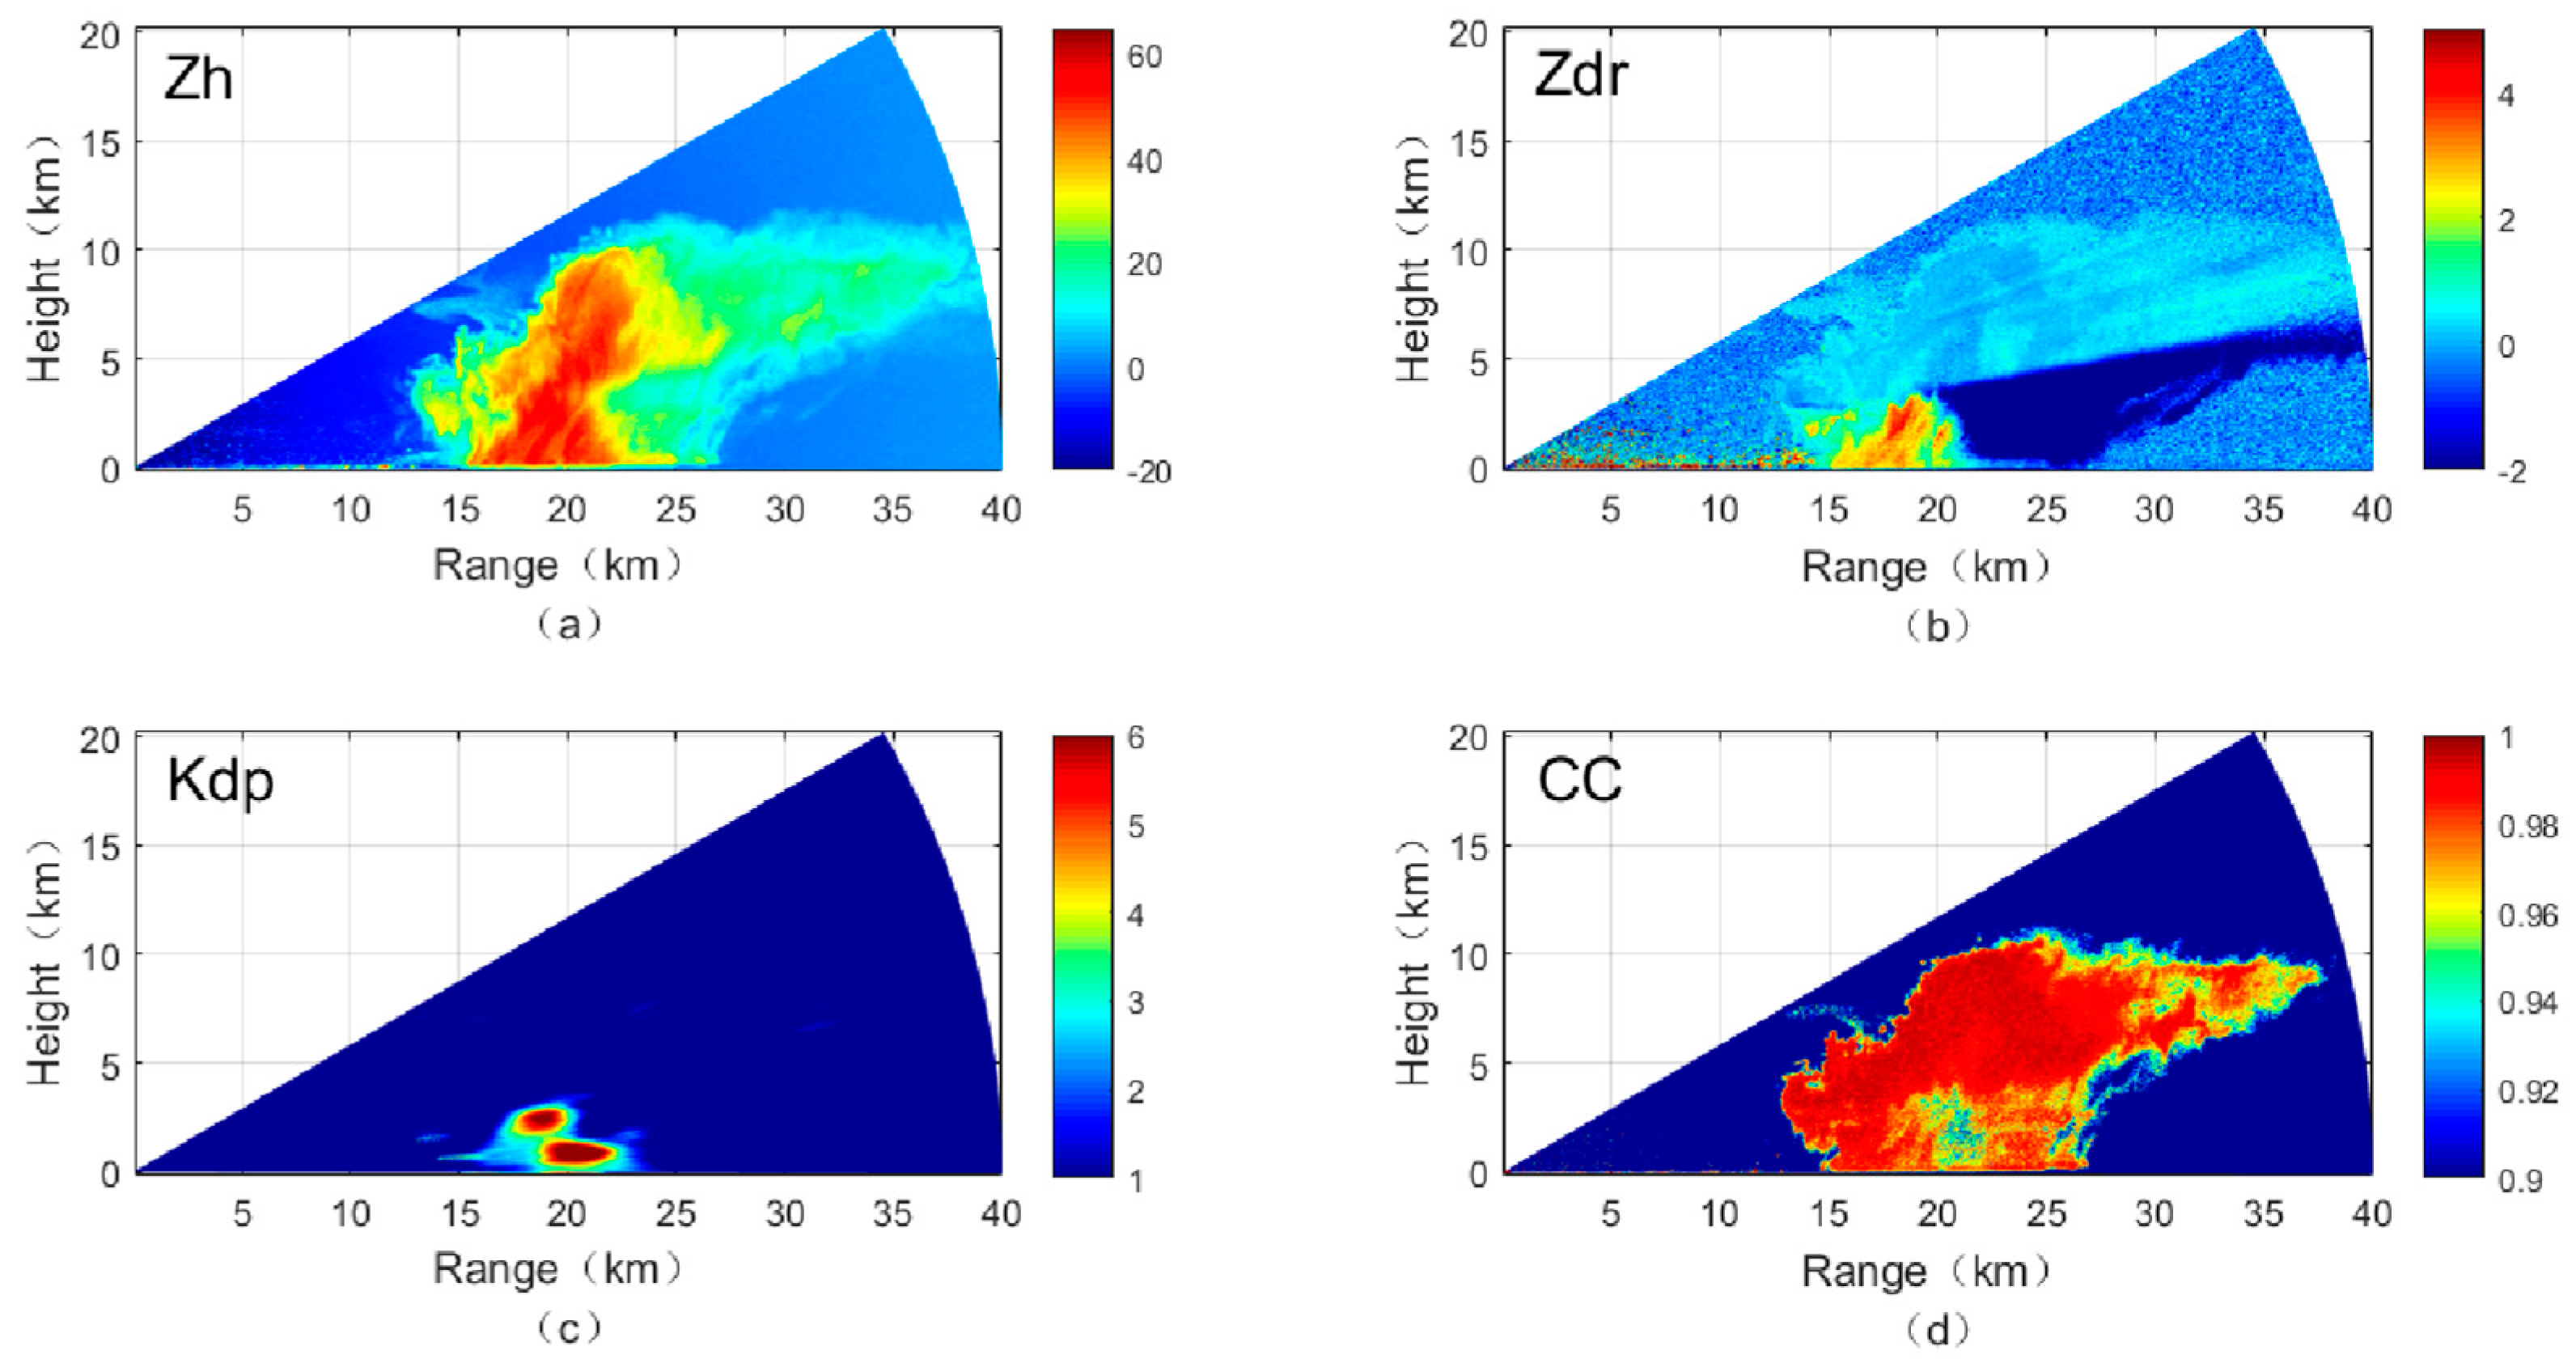
The release of unstable energy was found to have strong correlation with the impending weather process. The distribution and content of water vapor are very important in the occurrence of a downburst. In the case study, water vapor continuously accumulated in the mid- and high-altitude layers before the onset of the downburst, while there was no obvious change of water vapor in the lower atmosphere. Thus, it can be asserted qualitatively that the downburst was a weather process that involved low precipitation accompanied by localized hail precipitation. Based on the information from the WPEA method, and combined with the dual-polarization characteristic variables (Zh (>50 dBz), Zdr (3–6 dB), Kdp (2–4°/km)) and CC (0.9–0.95), we can better distinguish the phase distribution of the hydrometeor in the process and greatly enhance the judgment of the possibility of the downburst.
(3)
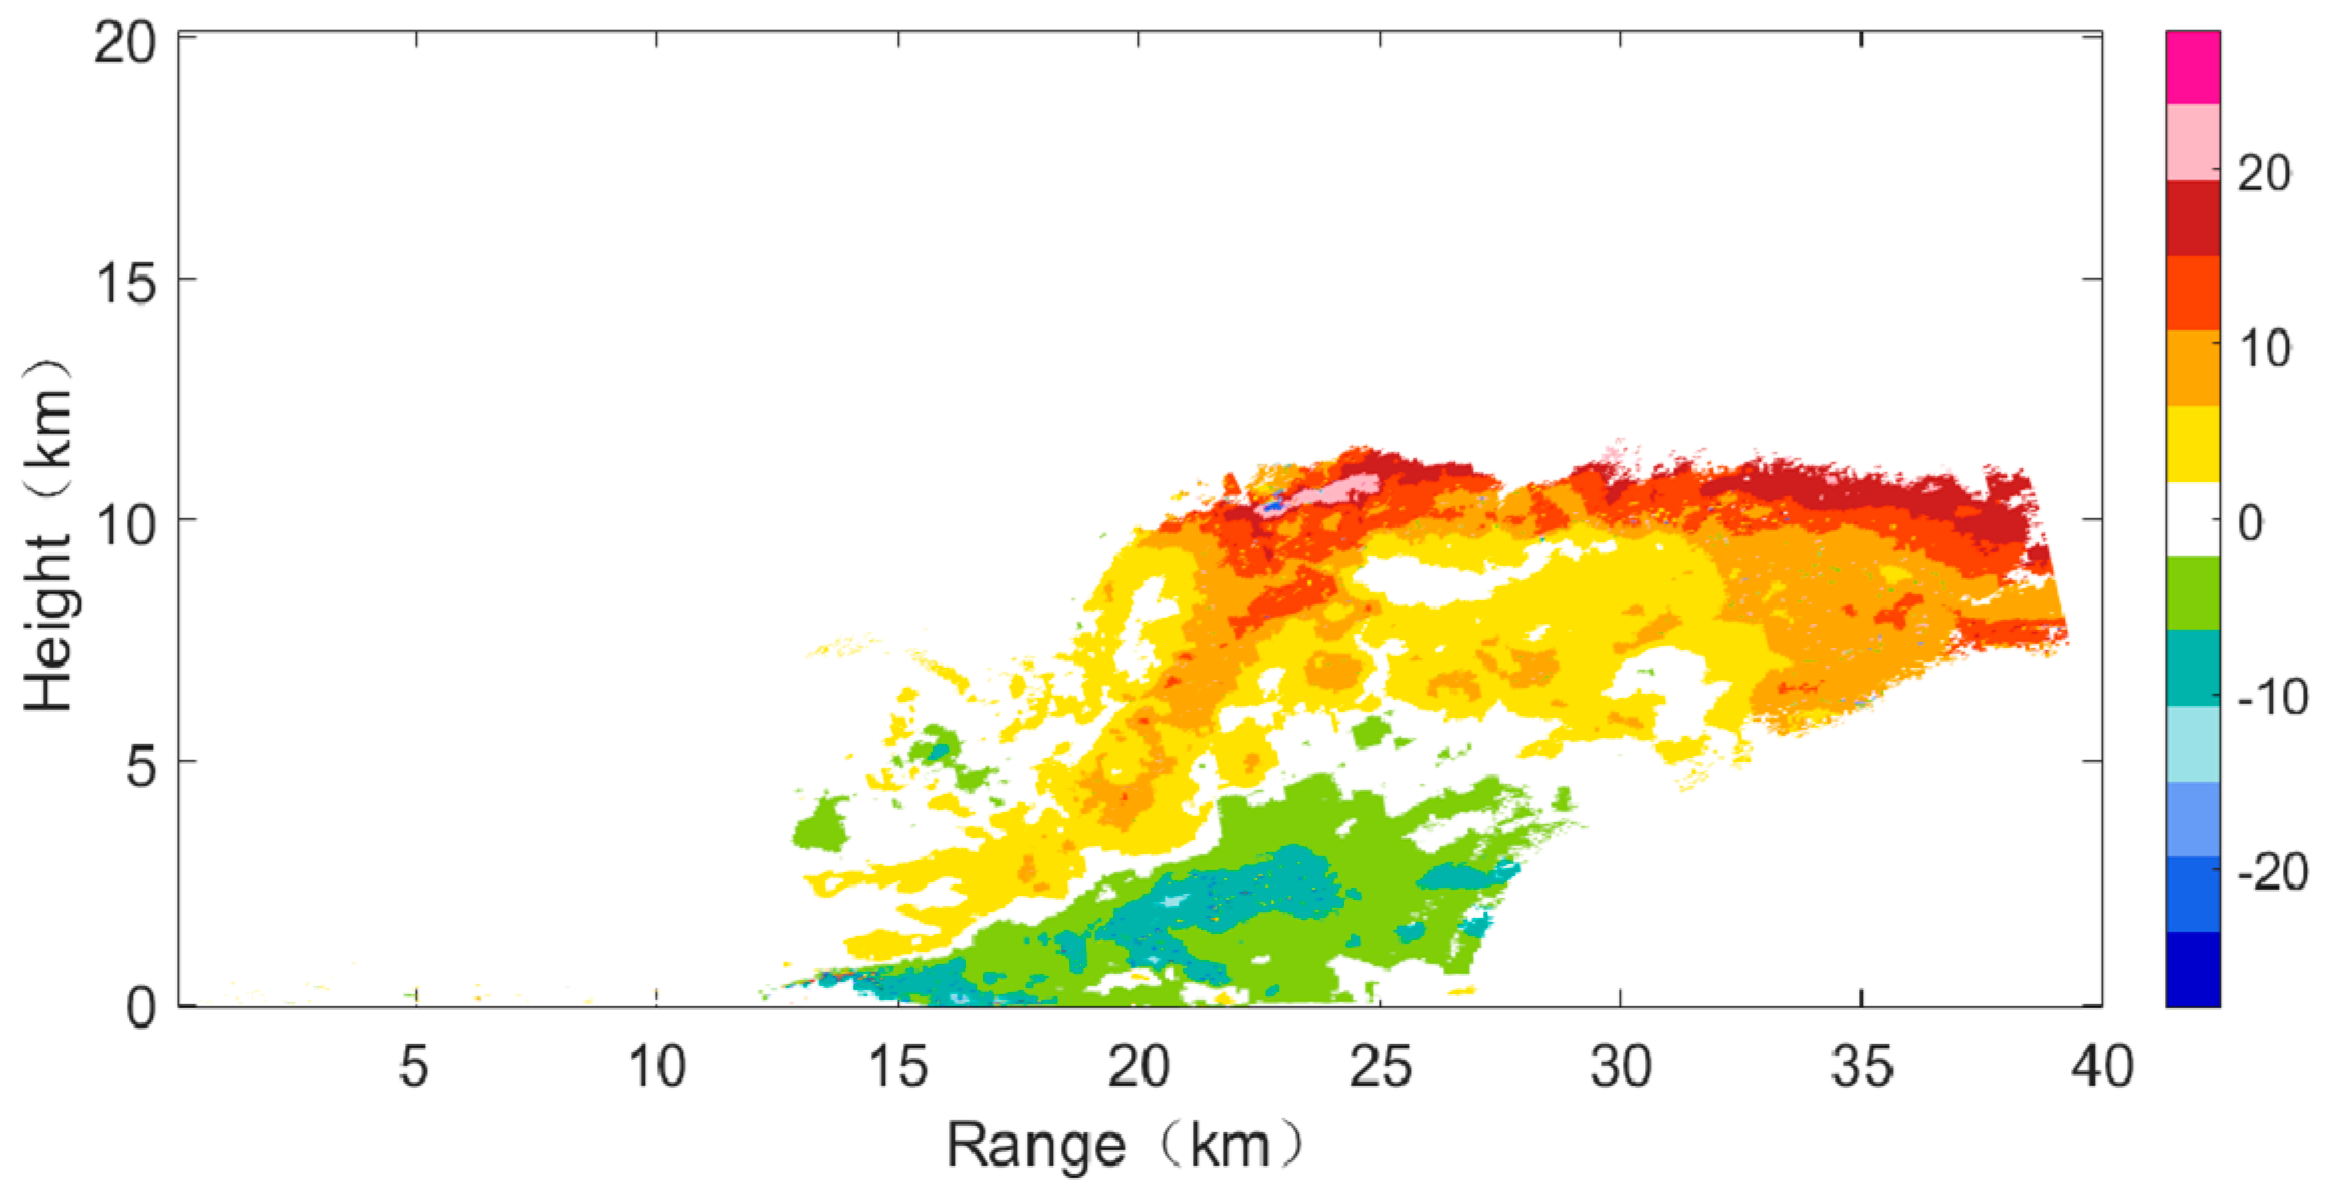
It was clearly observed in the initial stage of the downburst that the ‘Zdr column’ thrust upward beyond the zero-degree layer. Furthermore, the strong upward movement was indicative of the continuous formation and growth of supercooled water droplets and small ice particles. These were similar to the conclusions from previous studies. But in this paper we further discovered that the formation of the downburst was found closely associated with the occurrence of and the extended height of the ‘Zdr column’. However, no downburst process was found in the position where there is no obvious ‘Zdr column’ in the upper atmosphere. Therefore, we can regard the ‘Zdr column’ as an important early warning indicator of the location of the downburst in this case. However, the validity of this conclusion needs more case studies to verify in the future.
Given its intensity and small spatial scale, localized strong convection can often cause disasters. However, existing observation systems have low resolution and radar monitoring can discern convection only hours or minutes in advance. Through comprehensive study of the change process of each feature variable during the evolution process of strong-convection weather, it is possible to determine precursory information prior to the onset of such phenomena. Moreover, the application of dual-polarization weather radars can both provide fine-scale observations of the internal structure of downbursts and reveal their microphysical mechanisms, establishing features relevant for the prediction of future downburst incidents. Our future work will focus on qualitative research and fine-scale quantification, including the investigation of other downburst cases, to explore the links among relevant parameters and to eventually establish a pre-warning and forecast indicator system.

Author Contributions

H.W. conceived this research and designed the study. The paper was written by H.W. V.C. and J.H. presented some research ideas. Z.S. analyzed the data and presented some conclusions. L.W. undertook some programming work.

Funding

This work was supported by the National Natural Science Foundation of China (No. 41375043, No. 41405036, No. 41505031), China Scholarship Council (No. 201608515106), and the 2015 Middle-aged Academic Leaders Research Fund of Chengdu University of Information Technology (CUIT) (J201502).

Acknowledgments

The authors would like to express their sincere thanks to NCAR/UCAR and CSU for supplying the data used in this paper, and also to thank the reviewers for their constructive comments and editorial suggestions that helped improve the quality of the paper considerably.

Conflicts of Interest

The authors declare no conflict of interest.

References

  1. Fujita, T.T. The Downburst: Microburst and Microburst; SMRP Research Paper 210; University of Chicago: Chicago, IL, USA, 1985; p. 122, [NTIS PB85-148880]. [Google Scholar]
  2. Fujita, T.T.; Caracena, F. An analysis of three weather-related aircraft accidents. Bull. Am. Meteorol. Soc. 1977, 58, 1164–1181. [Google Scholar] [CrossRef]
  3. Fujita, T.T.; Byers, H.R. Spearhead echo and downbursts in the crash of an airliner. Mon. Weather Rev. 1977, 105, 129–146. [Google Scholar] [CrossRef]
  4. Wakimoto, R.M. Forecasting dry microburst activity over the High Plains. Mon. Weather Rev. 1985, 113, 1131–1143. [Google Scholar] [CrossRef]
  5. Atkins, N.T.; Wakimoto, R.M. Wet microburst activity over the southeastern United States: Implications for forecasting. Weather Forecast. 1991, 6, 470–482. [Google Scholar] [CrossRef]
  6. Wilson, J.W.; Wakimoto, R.M. The discovery of the downburst: T.T. Fujita’s contribution. Bull. Am. Meteorol. Soc. 2001, 82, 49–62. [Google Scholar] [CrossRef]
  7. Fujita, T.T. Manual of Downburst Identification for Project NIMROD; SMRP Research Paper 156; University of Chicago: Chicago, IL, USA, 1978; p. 104, [NTIS PB-286048]. [Google Scholar]
  8. Weisman, M.L. Bow echoes: A tribute to T. T. Fujita. Bull. Am. Meteorol. Soc. 2001, 82, 97–116. [Google Scholar] [CrossRef]
  9. Dotzek, N.; Lang, P.; Hagen, M.; Fehr, T.; Hellmiss, W. Doppler radar observation, CG lightning activity and aerial survey of a multiple downburst in southern Germany on 23 March 2001. Atmos. Res. 2007, 83, 519–533. [Google Scholar] [CrossRef] [Green Version]
  10. Vasiloff, S.V.; Howard, K.W. Investigation of a severe downburst storm near Phoenix, Arizona, as seen by a mobile Doppler radar and the KIWA WSR-88D. Weather Forecast. 2008, 24, 856–867. [Google Scholar] [CrossRef]
  11. Isaminger, M.A. A preliminary study of precursors to Huntsville microbursts. Linc. Lab. Proj. Rep. 1988, 153, 22. [Google Scholar]
  12. Roberts, R.D.; Wilson, J.W. A proposed microburst nowcasting procedure using single-Doppler radar. J. Appl. Meteorol. 1989, 28, 285–303. [Google Scholar] [CrossRef]
  13. Kuster, C.M.; Heinselman, P.L.; Schuur, T.J. Rapid-update radar observations of downbursts occurring within an intense multicell thunderstorm on 14 June 2011. Weather Forecast. 2016, 31, 827–851. [Google Scholar] [CrossRef]
  14. Srivastava, R.C. A simple model of evaporatively driven downdrafts: Application to microburst downdraft. J. Atmos. Sci. 1985, 42, 1004–1023. [Google Scholar] [CrossRef]
  15. Proctor, F.H. Numerical simulations of an isolated microburst. Part I: Dynamics and structure. J. Atmos. Sci. 1988, 45, 3137–3160. [Google Scholar] [CrossRef]
  16. Proctor, F.H. Numerical simulations of an isolated microburst. Part II: Sensitivity experiments. J. Atmos. Sci. 1989, 46, 2143–2165. [Google Scholar] [CrossRef]
  17. Knupp, K.R. Numerical simulation of low-level downdraft initiation within precipitating cumulonimbi: Some preliminary results. Mon. Weather Rev. 1989, 117, 1517–1529. [Google Scholar] [CrossRef]
  18. Wakimoto, R.M.; Kessinger, C.J.; Kingsmill, D.E. Kinematic, thermodynamic, and visual structure of low-reflectivity microbursts. Mon. Weather Rev. 1994, 122, 72–92. [Google Scholar] [CrossRef]
  19. Vermire, B.C.; Orf, L.G.; Savory, E. A parametric study of downburst line near-surface outflows. J. Wind Eng. Ind. Aerodyn. 2011, 99, 226–238. [Google Scholar] [CrossRef]
  20. Orf, L.G.; Kantor, E.; Savory, E. Simulation of a downburst-producing thunderstorm using a very high-resolution three-dimensional cloud model. J. Wind Eng. Ind. Aerodyn. 2012, 104–106, 547–557. [Google Scholar] [CrossRef]
  21. Haines, M.; Taylor, I. Numerical investigation of the flow field around low rise buildings due to a downburst event using large eddy simulation. J. Wind Eng. Ind. Aerodyn. 2018, 172, 12–30. [Google Scholar] [CrossRef]
  22. Doviak, R.J.; Zrnic, D.S. Doppler Radar and Weather Observation; Academic Press: New York, NY, USA, 1993; p. 554. [Google Scholar]
  23. Bringi, V.N.; Seliga, T.A.; Aydin, K. Hail detection with a differential reflectivity radar. Science 1984, 225, 1145–1147. [Google Scholar] [CrossRef] [PubMed]
  24. Bringi, V.N.; Vivekanandan, J.; Tuttle, J.D. Multiparameter radar measurements in Colorado convective storms. Part II: Hail detection studies. J. Atmos. Sci. 1986, 43, 2564–2577. [Google Scholar] [CrossRef]
  25. Fujita, T.T. The Mystery of Severe Storms; WRL Research Paper 239; University of Chicago: Hong Kong, China, 1992; p. 298. [Google Scholar]
  26. Wakimoto, R.M.; Bringi, V.N. Dual-Polarization observations of Microbursts Associated with Intense Convection: The 20 July Storm during the MIST Project. Mon. Weather Rev. 1988, 116, 1521–1539. [Google Scholar] [CrossRef] [Green Version]
  27. Straka, M.J.; Zrnic, D.S. An algorithm to deduce hydrometeor types and contents from multi-parameter radar data. Conf. Radar Meteorol. 1993, 17, 513–515. [Google Scholar]
  28. Liu, H.P.; Chandrasekar, V. Classification of hydrometeors based on polarimetric radar measurements: Development of fuzzy logic and neuro-fuzzy systems, and in situ verification. J. Atmos. Ocean. Technol. 2000, 17, 140–164. [Google Scholar] [CrossRef]
  29. Mahale, N.N.; Zhang, G.; Xue, M. Characterization of the 14 June 2011 Norman, Oklahoma, downburst through dual-polarization radar observations and hydrometeor classification. J. Appl. Meteorol. Climatol. 2016, 55, 2635–2655. [Google Scholar] [CrossRef]
  30. Junyent, F.; Chandrasekar, V. An examination of precipitation using CSU–CHILL dual-wavelength, dual-polarization radar observations. J. Atmos. Ocean. Technol. 2016, 33, 313–329. [Google Scholar] [CrossRef]
  31. Shi, Z.; Chen, H.; Chandrasekar, V.; He, J. Deployment and performance of an X-band dual-polarization radar during the Southern China Monsoon Rainfall Experiment. Atmosphere 2018, 9, 4. [Google Scholar] [CrossRef]
  32. Mesinger, F.; DiMego, G.; Kalnay, E.; Mitchell, K.; Shafran, P.C.; Ebisuzaki, W.; Jović, D.; Woollen, J.; Rogers, E.; Berbery, E.H.; et al. North American Regional Reanalysis. Bull. Am. Meteorol. Soc. 2006, 87, 343–360. [Google Scholar] [CrossRef] [Green Version]
  33. Wang, H.; Chen, G.; Lei, H.; Wang, Y.; Tang, S. Improving the predictability of severe convective weather processes by using wind vectors and potential temperature changes: A case study of a severe thunderstorm. Adv. Meteorol. 2016, 2016, 1–11. [Google Scholar] [CrossRef]
  34. Wang, H.; Wang, Y.; Wang, Y. A Comprehensive Analysis of a Heavy Precipitation Event in Chengdu Plain (China) Based on Ground-Based GPS. Earth Sci. 2016, 5, 48–55. [Google Scholar]
  35. Ouyang, S.; Chen, G.; Lin, Y. Information Digitalization and Forecasting; China Meteorological Press: Beijing, China, 2009. [Google Scholar]
  36. Wang, H.; He, J.; Wei, M.; Zhang, Z. Synthesis analysis of one severe convection precipitation event in Jiangsu using ground-based GPS technology. Atmosphere 2015, 6, 908–927. [Google Scholar] [CrossRef]
  37. Wang, H.; Wei, M.; Li, G.; Zhou, S.; Zeng, Q. Analysis of precipitable water vapor from GPS measurements in Chengdu region: Distribution and evolution characteristics in autumn. Adv. Space Res. 2013, 52, 656–667. [Google Scholar] [CrossRef]
  38. Zhou, H.; Diao, X.; Zhao, Q.; Li, Y.; Xia, W. Cause analysis of a continuous downburst weather. J. Acid Meteorol. 2017, 35, 641–648. [Google Scholar]
  39. Kumjian, M.R.; Khain, A.P.; Benmoshe, N.; Ilotoviz, E.; Ryzhkov, A.V.; Phillips, V.T.J. The anatomy and physics of ZDR columns: Investigating a polarimetric radar signature with a spectral bin microphysical model. J. Appl. Meteorol. Climatol. 2014, 53, 1820–1843. [Google Scholar] [CrossRef]
  40. Nelson, S.P. The influence of storm flow structure on hail growth. J. Atmos. Sci. 1983, 40, 1965–1983. [Google Scholar] [CrossRef]
  41. Kumjian, M.R.; Ryzhkov, A.V. Polarimetric signatures in supercell thunderstorms. J. Appl. Meteorol. Climatol. 2008, 47, 1940–1961. [Google Scholar] [CrossRef]
  42. Kennedy, P.C.; Rutledge, S.A.; Petersen, W.A.; Bringi, V.N. Polarimetric radar observations of hail formation. J. Appl. Meteorol. 2001, 40, 1347–1366. [Google Scholar] [CrossRef]
  43. Kumjian, M.R.; Ganson, S.M.; Ryzhkov, A.V. Freezing of raindrops in deep convective updrafts: A microphysical and polarimetric model. J. Atmos. Sci. 2012, 69, 3471–3490. [Google Scholar] [CrossRef]
  44. Oue, M.; Kumjian, M.R.; Lu, Y.; Jiang, Z.; Clothiaux, E.; Verlinde, J.; Aydin, K. X-band polarimetric and Ka-band Doppler spectral radar observations of a graupel-producing Arctic mixed-phase cloud. J. Appl. Meteorol. Climatol. 2015, 54, 1335–1351. [Google Scholar] [CrossRef]
  45. Fu, D.; Guo, X. Numerical study on a severe downburst-producing thunderstorm on 23 August 2001 in Beijing. Adv. Atmos. Sci. 2007, 24, 227–238. [Google Scholar] [CrossRef]
Figure 1. Schematic of the “3θ” energy analysis method.
Atmosphere 09 00348 g001
Figure 2. (a) 500-hPa and (b) 700-hPa geopotential height over North America at 18:00 UT on 30 July 2017, respectively; (c) composite of 700-hPa wind field and 850-hPa temperature field at 9:00 UT on 30 July 2017; and (d) similar to (c) but for 18:00 UT on 30 July 2017. The red dots in the four panels represent the location of the downburst. All the data are from the North American Regional Reanalyis (NARR) dataset.
Atmosphere 09 00348 g002aAtmosphere 09 00348 g002b
Figure 3. The 3θ distribution conditions at the center location: (a) 12:00; (b) 15:00; and (c) 18:00 UT on 30 July 2017. Red, green, and blue lines are the θ, θsed, and θ* curves, respectively. Area indicated by the dotted green box is the unstable area.
Atmosphere 09 00348 g003
Figure 4. Specific humidity (kg/kg) between 12:00 UT on 30 July 2017 and 00:00 UT on 31 July 2017 for the center location of the case study downburst.
Atmosphere 09 00348 g004
Figure 5. Plan Position Indicator (PPI) scans of radial wind speed (m/s) at (a) 0.5°; (b) 2.9°; (c) 5.3°; (d) 6.5° elevations at 20:23–20:25 UT on 30 July 2017. Black lines represent the radar radial line.
Atmosphere 09 00348 g005
Figure 6. Range–Height Indicator (RHI) scans of dual-polarization variables: (a) Zh; (b) Zdr; (c) Kdp; and (d) correlation coefficient (CC) at azimuth of 31° at 20:28 UT on 30 July 2017. Black box indicates the critical area in which the downburst was generated.
Atmosphere 09 00348 g006
Figure 7. RHI scans of dual-polarization variables of (a) Zh; (b) Zdr; (c) Kdp; and (d) CC at the azimuth of 37° at 20:32 UT on 30 July 2017.
Atmosphere 09 00348 g007
Figure 8. RHI scan of radial wind speed (m/s) at the azimuth of 37° at 20:33 UT on 30 July 2017.
Atmosphere 09 00348 g008
Figure 9. Schematic of the formation of the studied downburst.
Atmosphere 09 00348 g009
Table 1. Main specifications of the CSU–CHILL X-band radar system.
Gain53 dBi
Beamwidth0.3°
Sidelobe level<36 dB
Frequency9.41 GHz ± 30 MHz
PRF max2.00 kHz
Sensitivity (dual-wavelength mode)−15 dBz, 10 km
Range sampling1.5–192.0 m
Dynamic range90 dB
Scan typePPI (360°, sector), RHI, fixed pointing, vertically pointing

