Article

Nitrogen Deposition on Danish Nature

Department of Environmental Science, Aarhus University, P.O. Box 358, Frederiksborgvej 399, 4000 Roskilde, Denmark
*
Author to whom correspondence should be addressed.
Atmosphere 2018, 9(11), 447; https://doi.org/10.3390/atmos9110447
Submission received: 15 August 2018 / Revised: 25 October 2018 / Accepted: 9 November 2018 / Published: 14 November 2018

Abstract

:
Eutrophication events are frequent in Inner Danish waters and critical loads are exceeded for much of the Danish sensitive terrestrial ecosystems. The Danish air quality monitoring program combines measurements and model calculations to benefit from the complementarities in data from these two sources. Measurements describe actual status, seasonal variation, and temporal trends. Model calculations extrapolate the results to the entire country and determine depositions to specific ecosystems. Measurements in 2016 show annual depositions between 7.5 and 11 kg N/ha to terrestrial ecosystems, and a load to marine waters of 5.3 kg N/ha. The deposition on Danish marine waters in 2016 was calculated to be 73,000 tons N with an average deposition of 6.9 kg N/ha. For terrestrial areas, the deposition was calculated to be 57,000 tons N with an average deposition of 13 kg N/ha. This is above critical loads for sensitive ecosystems. Long-term trends show a 35% decrease since 1990 in measured annual nitrogen deposition. At two out of four stations in nature areas, measured ammonia levels exceeded critical levels for lichens and mosses. Conclusions: Nitrogen loads and levels to Danish nature is decreasing, but critical loads and levels are still exceeded for sensitive ecosystems. Combining measurements and model calculations is a strong tool in monitoring.

1. Introduction

Critical load was defined in the late 1980s as “a quantitative estimate of an exposure to one or more pollutants below which significant harmful effects on specified sensitive elements of the environment do not occur according to present knowledge” [1]. Reactive nitrogen inputs above critical loads affect the competitive relationship between constituent organisms within an ecosystem, and this can lead to invasion of plants that require high inputs of nitrogen but grow very fast and over time may dominate the ecosystem [2]. The result of exceeded critical load can be loss of biodiversity, which has even been demonstrated experimentally [3,4]. The European Nitrogen Assessment (ENA) project concluded in 2011 that too much nitrogen harms the environment, and at the same time, it has economic consequences for the society [5]. These findings led the ENA researchers to conclude that “Curbing nitrogen emissions is a central environmental challenge for the twenty-first century” [6].
In the 1980s there was significant public and political focus on nitrogen loadings of Danish inner waters. The reason was substantial algal blooming in late summers and autumns that frequently led to turn-overs and in worst cases these were followed by death of fish and benthic fauna. This led the Danish parliament to launch a series of Aquatic Action Plans (I to IV) aiming at reducing nitrogen input to nature by reducing nitrogen in industrial and domestic wastewater, as well as reducing releases to surrounding environment of nitrogen related to livestock production in agriculture [7]. The action plans led to substantial reductions in wastewater nitrogen inputs, and both runoff and atmospheric ammonia emissions from Danish agriculture were likewise significantly reduced. However, the nitrogen loadings of both marine and terrestrial nature are still substantial and provide challenges. The European Environment Agency (EEA) reports that nutrient input to Danish nature still constitutes a significant challenge [8], and this is confirmed in a recent review [9]. The overall conclusion from the EEA is that biodiversity continues to decline in many spheres in Denmark, although there are areas where this decline has slowed down. The positive part of the story is that land-based discharge of nitrogen to Inner Danish waters has been reduced to 50% since 1990 (partly due to the aforementioned aquatic actions plans). The fact that Danish nature is still under pressure underlines the importance of closely monitoring the atmospheric nitrogen inputs to Danish nature to follow the development, and the need for assessing various scenarios to predict the future development and evaluate potential impact of additional regulation as well as other management initiatives.
It is a goal for Denmark as well as for the EU, that nature should not receive air pollution including atmospheric nitrogen that exceeds critical loads and levels. The European Water Framework Directive and the European Habitat Directive commit the EU member states, including Denmark, to protect nature from harmful effects related to nitrogen deposition. Denmark does not have any national goals for the magnitude of the atmospheric nitrogen deposition, nor for deposition reductions that are to be obtained. However, Denmark is committed to reduce national emissions of nitrogen oxides and ammonia by 71%, and 45%, respectively. These reductions are relative to 1990 and are to be met by 2030. Much of the reductions have already been accomplished, and further reductions in the coming years are likely to be more moderate. The reductions are obligations that Denmark has signed up to under the Gothenburg Protocol (http://www.unece.org/environmental-policy/conventions/envlrtapwelcome/guidance-documents-and-other-methodological-materials/gothenburg-protocol.html), and negotiations related to the EU National Emissions Ceiling (NEC) Directive (https://eur-lex.europa.eu/legal-content/EN/TXT/?uri=uriserv:OJ.L_.2016.344.01.0001.01.ENG). For EU member states, the similar committed reductions are 40% and 6% for nitrogen oxides and ammonia, relative to 2005 emissions. Similar reduction targets have been decided in the revised NEC directive (see above link).
The aim of the current paper is to describe the setup, and present recent results from the Danish air quality monitoring program regarding atmospheric nitrogen concentrations in and depositions on Danish terrestrial and marine nature. The air quality program uses integrated monitoring, defined as the combined use of measurements and model calculations [10]. This paper aims to demonstrate how the use of integrated monitoring is leading to synergies adding substantial value to the monitoring program. Focus is on the results for 2016, on the design of the program as it looked in 2016, and on the trends from the beginning of the program in 1989 and up to 2016.

2. Materials and Methods
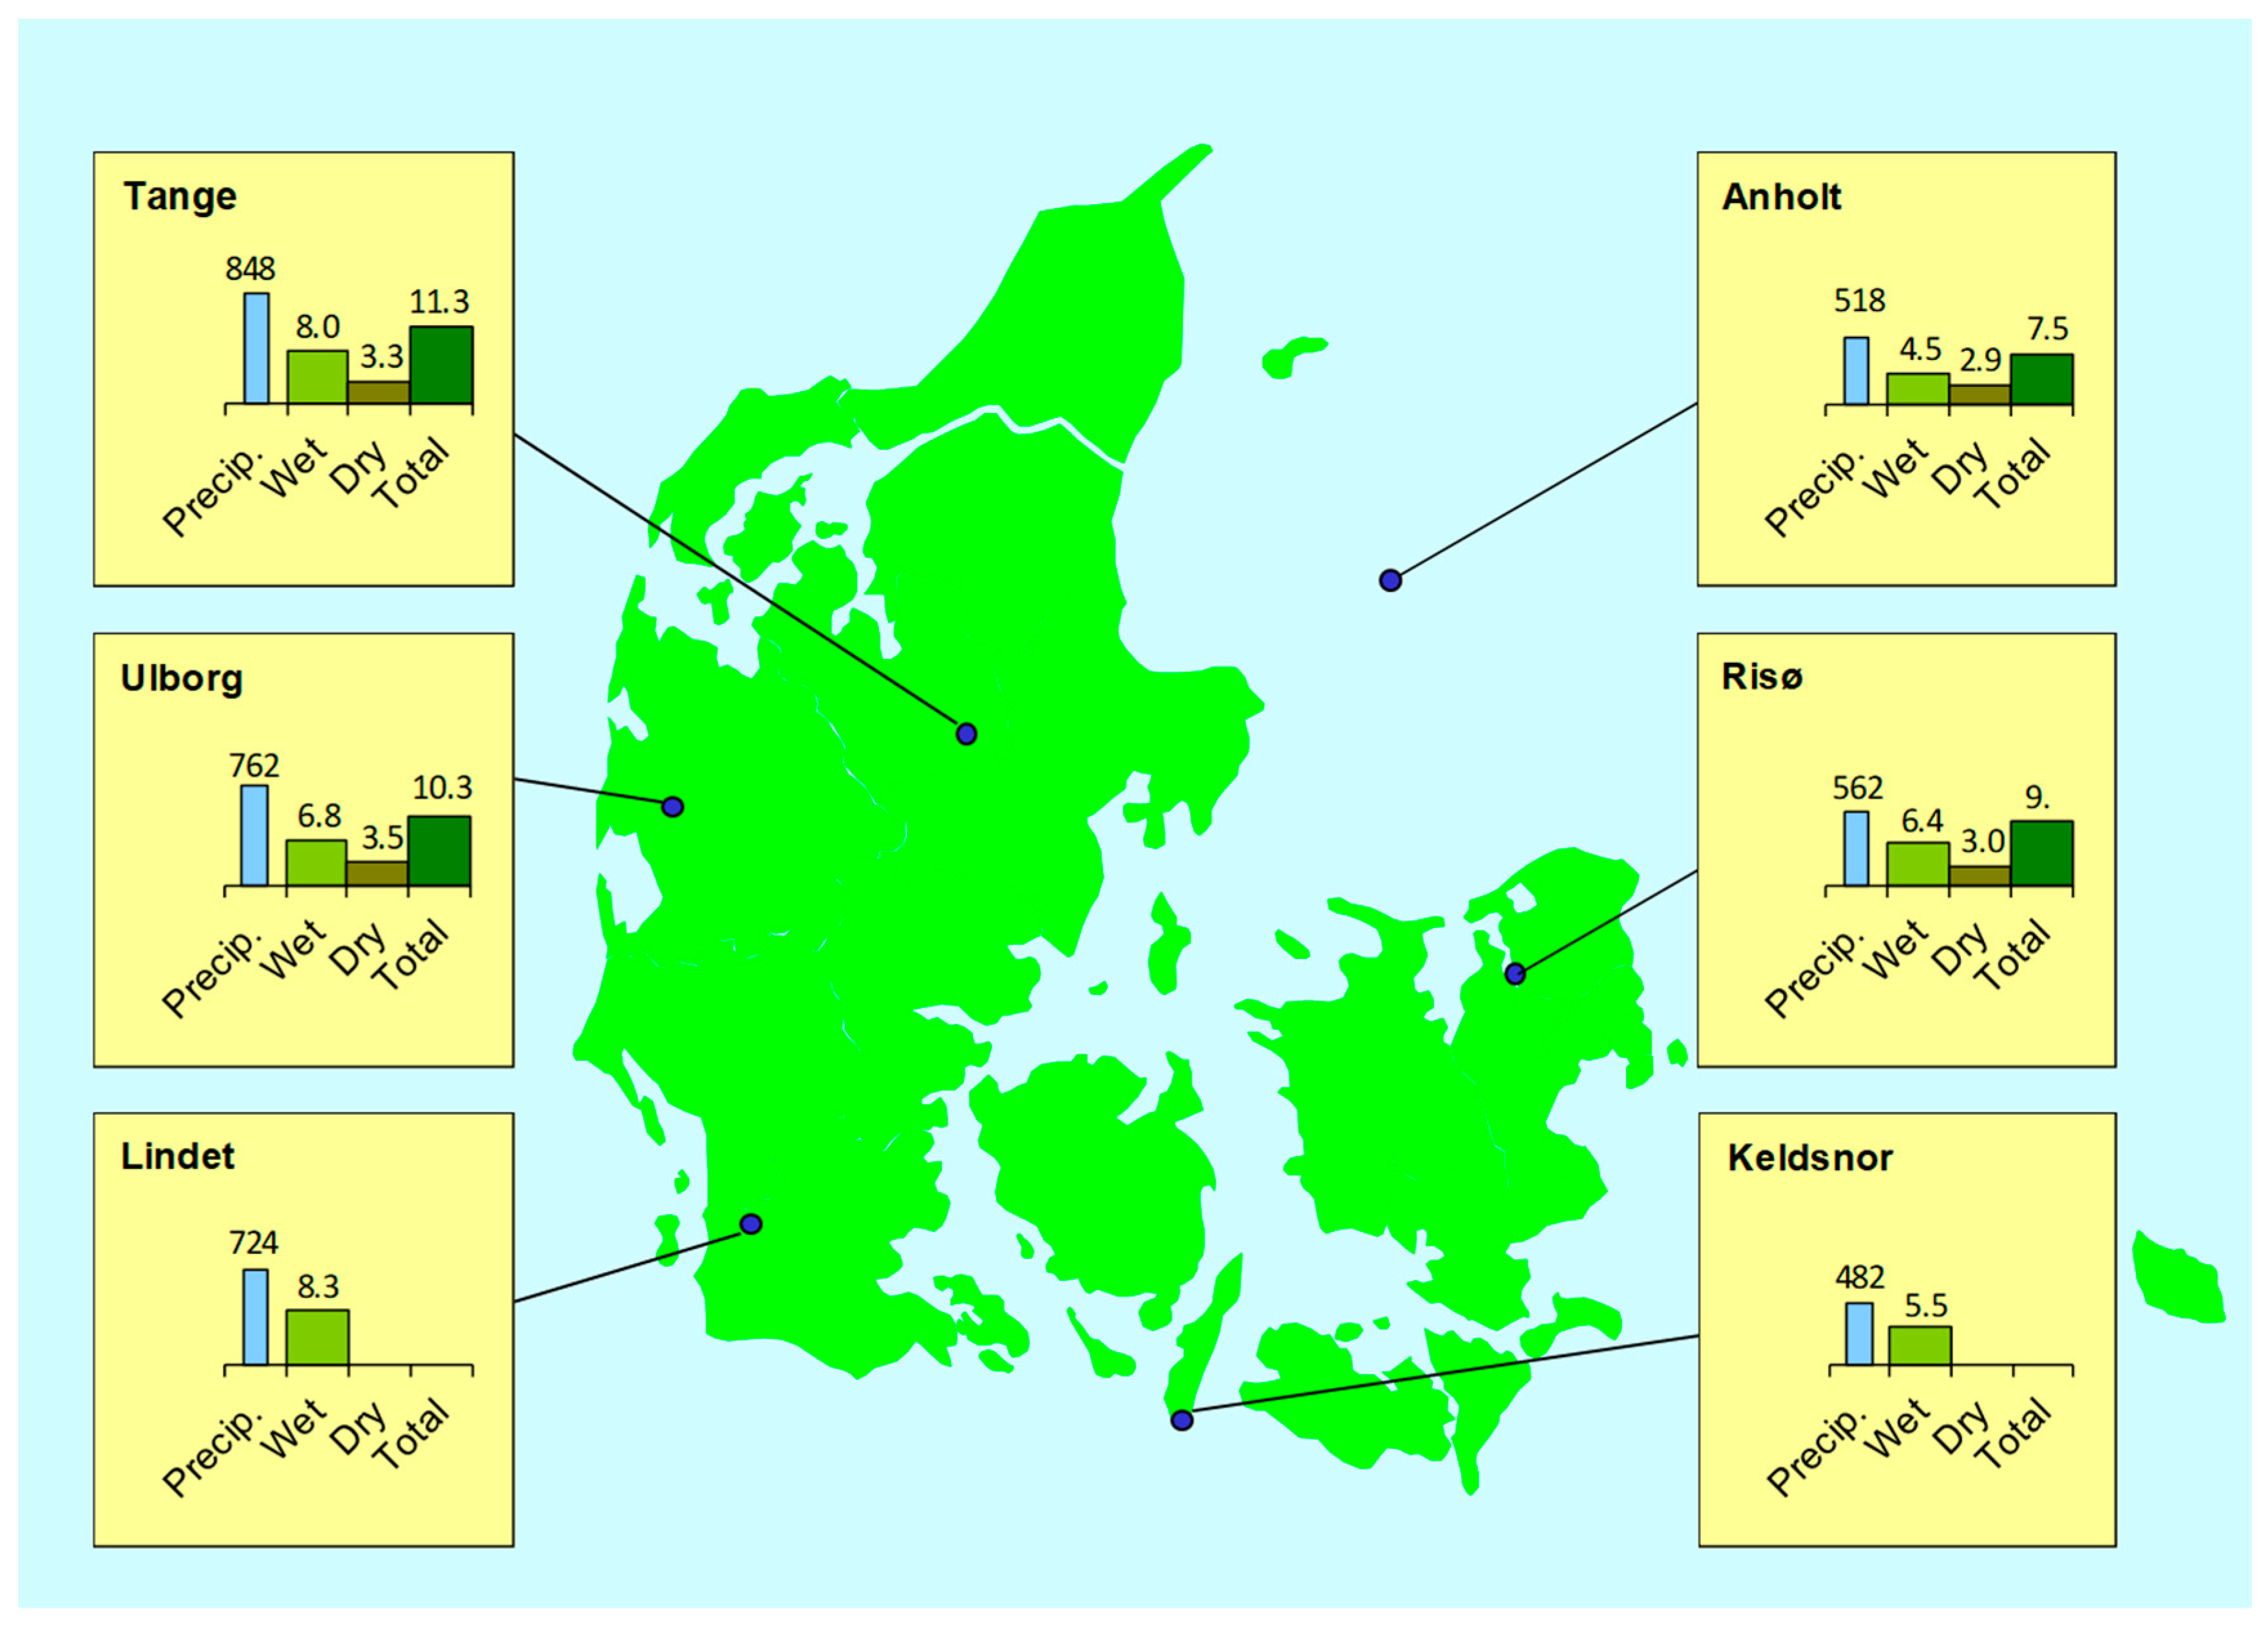
The Danish Nationwide Air Quality Monitoring Program is designed to map and follow trends in air pollution levels over Danish land and marine areas, as well as to determine the atmospheric loadings of eutrophication, acidification, and presence of environmentally hazardous compounds to Danish ecosystems. The results from the monitoring program are used to describe spatial and temporal variations in pollutants, and to evaluate causes to observed changes. Measurements for the main part of samples and analyses are accredited according to ISO 17025, and they follow the EU directive 2008/50/EC for those analyses where it applies. As already stated, the air quality program uses integrated monitoring, defined as the combined application of measurements and model calculations. Measurements are used for describing the actual status of air quality and atmospheric deposition, seasonal variations, as well as temporal trends in pollutant concentrations and depositions. Model calculations from Chemistry-Transport Models (CTMs) are on the other hand used for spatially extrapolating the results from the monitoring sites to the entire country, e.g., for determining depositions to individual terrestrial and marine ecosystems. In addition, the model calculations are used as a basis for understanding the variations, for source apportionments, and for determining the Danish contribution to atmospheric deposition. In addition, receptor models are applied for deducing source apportionment data from measurement data in statistical analyses [11] and for comparing these findings to results from the CTMs.

2.1. Measurements

In relation to atmospheric depositions to Danish nature, focus will here be on the rural part of the nationwide monitoring program. Currently, this part of the monitoring network includes eight larger fixed-location monitoring sites. In addition to nitrogen compounds, the monitoring program also include sulfur compounds, ozone, and heavy metals, but since atmospheric nitrogen deposition is the focus of this paper, the description has been limited to the measurements of nitrogen compounds. Table 1 lists the applied measurement methods. At these monitoring sites, the following parameters are measured:
  • Wet deposition of ammonium and nitrate.
  • Concentrations of nitrogen compounds in gas and particle phase (ammonia, nitrogen dioxide, particulate ammonium, and the sum of gas phase nitric acid and particulate nitrate).
In addition to the eight larger fixed-site monitoring stations, the program includes several smaller monitoring stations for measuring ammonia concentrations. The aim of these measurements is to use these to determine atmospheric nitrogen concentrations in and depositions to selected sensitive ecosystems. In 2016, monitoring stations for ammonia measurements were established at 17 sensitive terrestrial ecosystems distributed over the entire country. More details are given in the following sections.
Wet deposition is monitored by precipitation sampling by two types of samplers—“bulk” and “wet only” samplers, respectively. Sampling of wet deposition by “bulk” sampler is carried out using home-build samplers that resemble those from NILU (Norwegian Institute of Air Research) and has a sampling area of 314 cm2. Sampling is performed for half-monthly periods, and analyses of the samples are performed in the laboratory. The “bulk” samplers receive material both during wet and dry period, since gases and particles will dry deposit in the sampler. This led to some overestimation, but the locations of the “bulk” samplers are selected to avoid as much as possible influence from very local sources. Furthermore, at four stations, home-build “wet only” samplers (sampling area 314 cm2) are operated in parallel with the “bulk” samplers to quantify the error of the “bulk” samplers. The “wet only” samplers contain humidity sensors that ensure that the lid is open only during precipitation. Comparisons have shown that the discrepancy between “bulk” samplers and “wet only” samplers is in the range of 10 to 20%.
Dry deposition may be determined from more or less direct methods such as eddy correlation and relaxed eddy accumulation methods [12], but these methods are resource demanding and expensive to deploy. Within the Danish monitoring program, dry depositions are therefore estimated from ambient air concentrations using calculated dry deposition velocities. The latter are calculated based on meteorological parameters (obtained from the meteorological model MM5, see Section 2.2) using the dry deposition module from the CTM model Danish Eulerian Hemispheric Model (DEHM) (see Section 2.2) and accounting for surface characteristic (again using the same land-use data as applied the DEHM). In the following, the “measured dry deposition” refers to dry deposition calculated from measured ambient air concentrations that have multiplied to calculated dry deposition velocities.

2.2. Model Calculations

The Danish Ammonia MOdelling System (DAMOS) [13,14] is applied for mapping atmospheric nitrogen deposition to Danish nature within the Danish Air Quality Monitoring Program. The DAMOS system consists of a combination of the DEHM [15,16,17] for describing the contribution from long-range to regional scale transport of atmospheric nitrogen, and the OML-DEP [18,19] for describing the local scale contribution from nearby agricultural activities. The latter includes contributions related to local ammonia emissions from barns and storages as well as from manure application to the fields. The DAMOS makes use of a state-of-the-art ammonia emission inventory with high spatial (at single farm level for Denmark) and high temporal (hourly) resolution [20,21,22,23]. The long-range transport component concerns especially the wet deposition of ammonium and nitrate in fine fraction particles.
An overall coarse resolution mapping of depositions to Danish land and sea surfaces is performed with the DEHM at a resolution of 5.6 km × 5.6 km (in the following we will for simplicity refer to this as 6 km × 6 km) for the entire Danish land and sea areas. The exception is for the Western part of the Danish North Sea area for which the resolution is 16.67 km × 16.67 km (for simplicity, we will in the following refer to this resolution as 17 km × 17 km). DEHM describes the lowest 15 km of the atmosphere (up to 100 hPa) with a coarse resolution at the top of the domain and a high resolution near the surface. The lowest level is 12 m thick to provide a good description of the boundary layer meteorology and the dry deposition process. In combination with DEHM, the OML-DEP is applied for mapping depositions to selected Danish nature areas with a resolution of 400 m × 400 m within a domain of 16 km × 16 km surrounding the selected nature system. To avoid double-counting of local emissions, the OML-DEP is initialized using upwind concentrations from the DEHM. Wet deposition includes in-cloud and below-cloud scavenging and is calculated as the product of scavenging coefficients and the concentration. In the DEHM, dry deposition velocities for gases and aerosols are calculated based on the commonly applied resistance method, including the aerodynamic resistance, the laminar boundary layer resistance and the surface (or canopy) resistance. The applied procedure for calculating dry deposition velocities is similar to the one applied in the European Monitoring and Evaluation Program (EMEP) model [24]. The applied land-use information for Denmark is obtained from the AIS (Area Information System) database and for the rest of the Northern Hemisphere; it is based on the Olson World Ecosystem Classes v1.4D. The same dry deposition module is used to calculate dry deposition velocities for determining the “measured” dry deposition (see Section 2.1).
The calculations for 2016 have been performed with meteorological data obtained from the MM5 [25]. The MM5 is operated within the AU Air Pollution Forecasting and Scenario Management System THOR (http://thor.dmu.dk) [26,27]. Emission inventories on 17 km × 17 km grid resolution are applied for the entire European area including marine waters [28]. These inventories are compiled based on the EMEP inventories on 50 km × 50 km, and a detailed inventory on 17 km × 17 km for land areas in the EU. For Denmark, a detailed Danish inventory on 1 km × 1 km is applied, but this inventory is aggregated to 6 km × 6 km to fit the inner nest in DEHM. The detailed Danish inventory includes emissions from around 100 larger Danish point sources. Calculations have been made using the most recent available emission inventories, where the 2016 calculations are based on inventories compiled for 2015. The Danish Centre for Environment and Energy (DCE), Aarhus University has derived the inventories for Denmark [29], and inventories for land-based as well as marine sources for the rest of Europe are obtained from the EMEP program (http://www.ceip.at/ms/ceip_home1/ceip_home/webdab_emepdatabase). A very detailed inventory for emissions from ship traffic on Danish marine waters has been compiled with a 1 km × 1 km grid resolution [30].
The model system is regularly evaluated by comparison to observations from the Danish and international monitoring networks (mainly EMEP monitoring data) as well as against observations from field studies [17,31,32].

3. Results

For the year 2016, the atmospheric nitrogen deposition has been determined from measurements at four main fixed-site land-based monitoring stations within the Danish air quality monitoring program. These stations were: Tange, Ulborg, Anholt and Risø (Figure 1). Measurements show a total annual atmospheric nitrogen deposition in the range between 7.5 and 11 kg N/ha (See Figure 2). The total atmospheric nitrogen deposition to the marine waters at Anholt in 2016 was measured to 5.3 kg N/ha. The lowest nitrogen depositions to land areas have been determined for Anholt, Risø and Keldsnor (for Keldsnor only wet deposition data is available). These stations have the lowest influence from local agricultural sources, and the results show that they received only relatively little wet deposition in 2016.
The highest nitrogen depositions in 2016 were determined at Lindet (only wet deposition data is available for this station), Ulborg and Tange. These stations are in areas with ammonia emissions from local agricultural activities. At the same time, these stations are in Jutland in the Western part of the country that receives the highest precipitation amounts. The latter leads to a generally higher deposition in Jutland, especially when compared with Zealand. The difference in loadings between the monitoring stations is, however, not more than 40%.
The uncertainty on the measured annual nitrogen deposition is estimated to be 12 to 25% for marine waters and 27 to 43% for Danish land areas [13,14]. The explanation for the relatively high uncertainty is that the nitrogen deposition is determined as a sum of depositions of many compounds. However, also the indirect method for “measuring” dry deposition plays a role.
Figure 3 shows a comparison of measured and modelled annual nitrogen deposition to marine and terrestrial sites in the air quality monitoring program. This comparison is based on the DEHM calculations and shows that the model overestimates the deposition by about 10%. For the terrestrial sites, part of this overestimation is due to the even distribution of emission over the grid cell of 6 km × 6 km. The measurement sites are placed so that they are affected by very local agriculture. In the most intense agricultural areas, the even distribution of emissions of a grid cell will therefore lead to an overestimation at the measurement site. For these locations, the application of the local scale model will lead to lower deposition at the measurement site and thereby better agreement with the observed depositions [32].

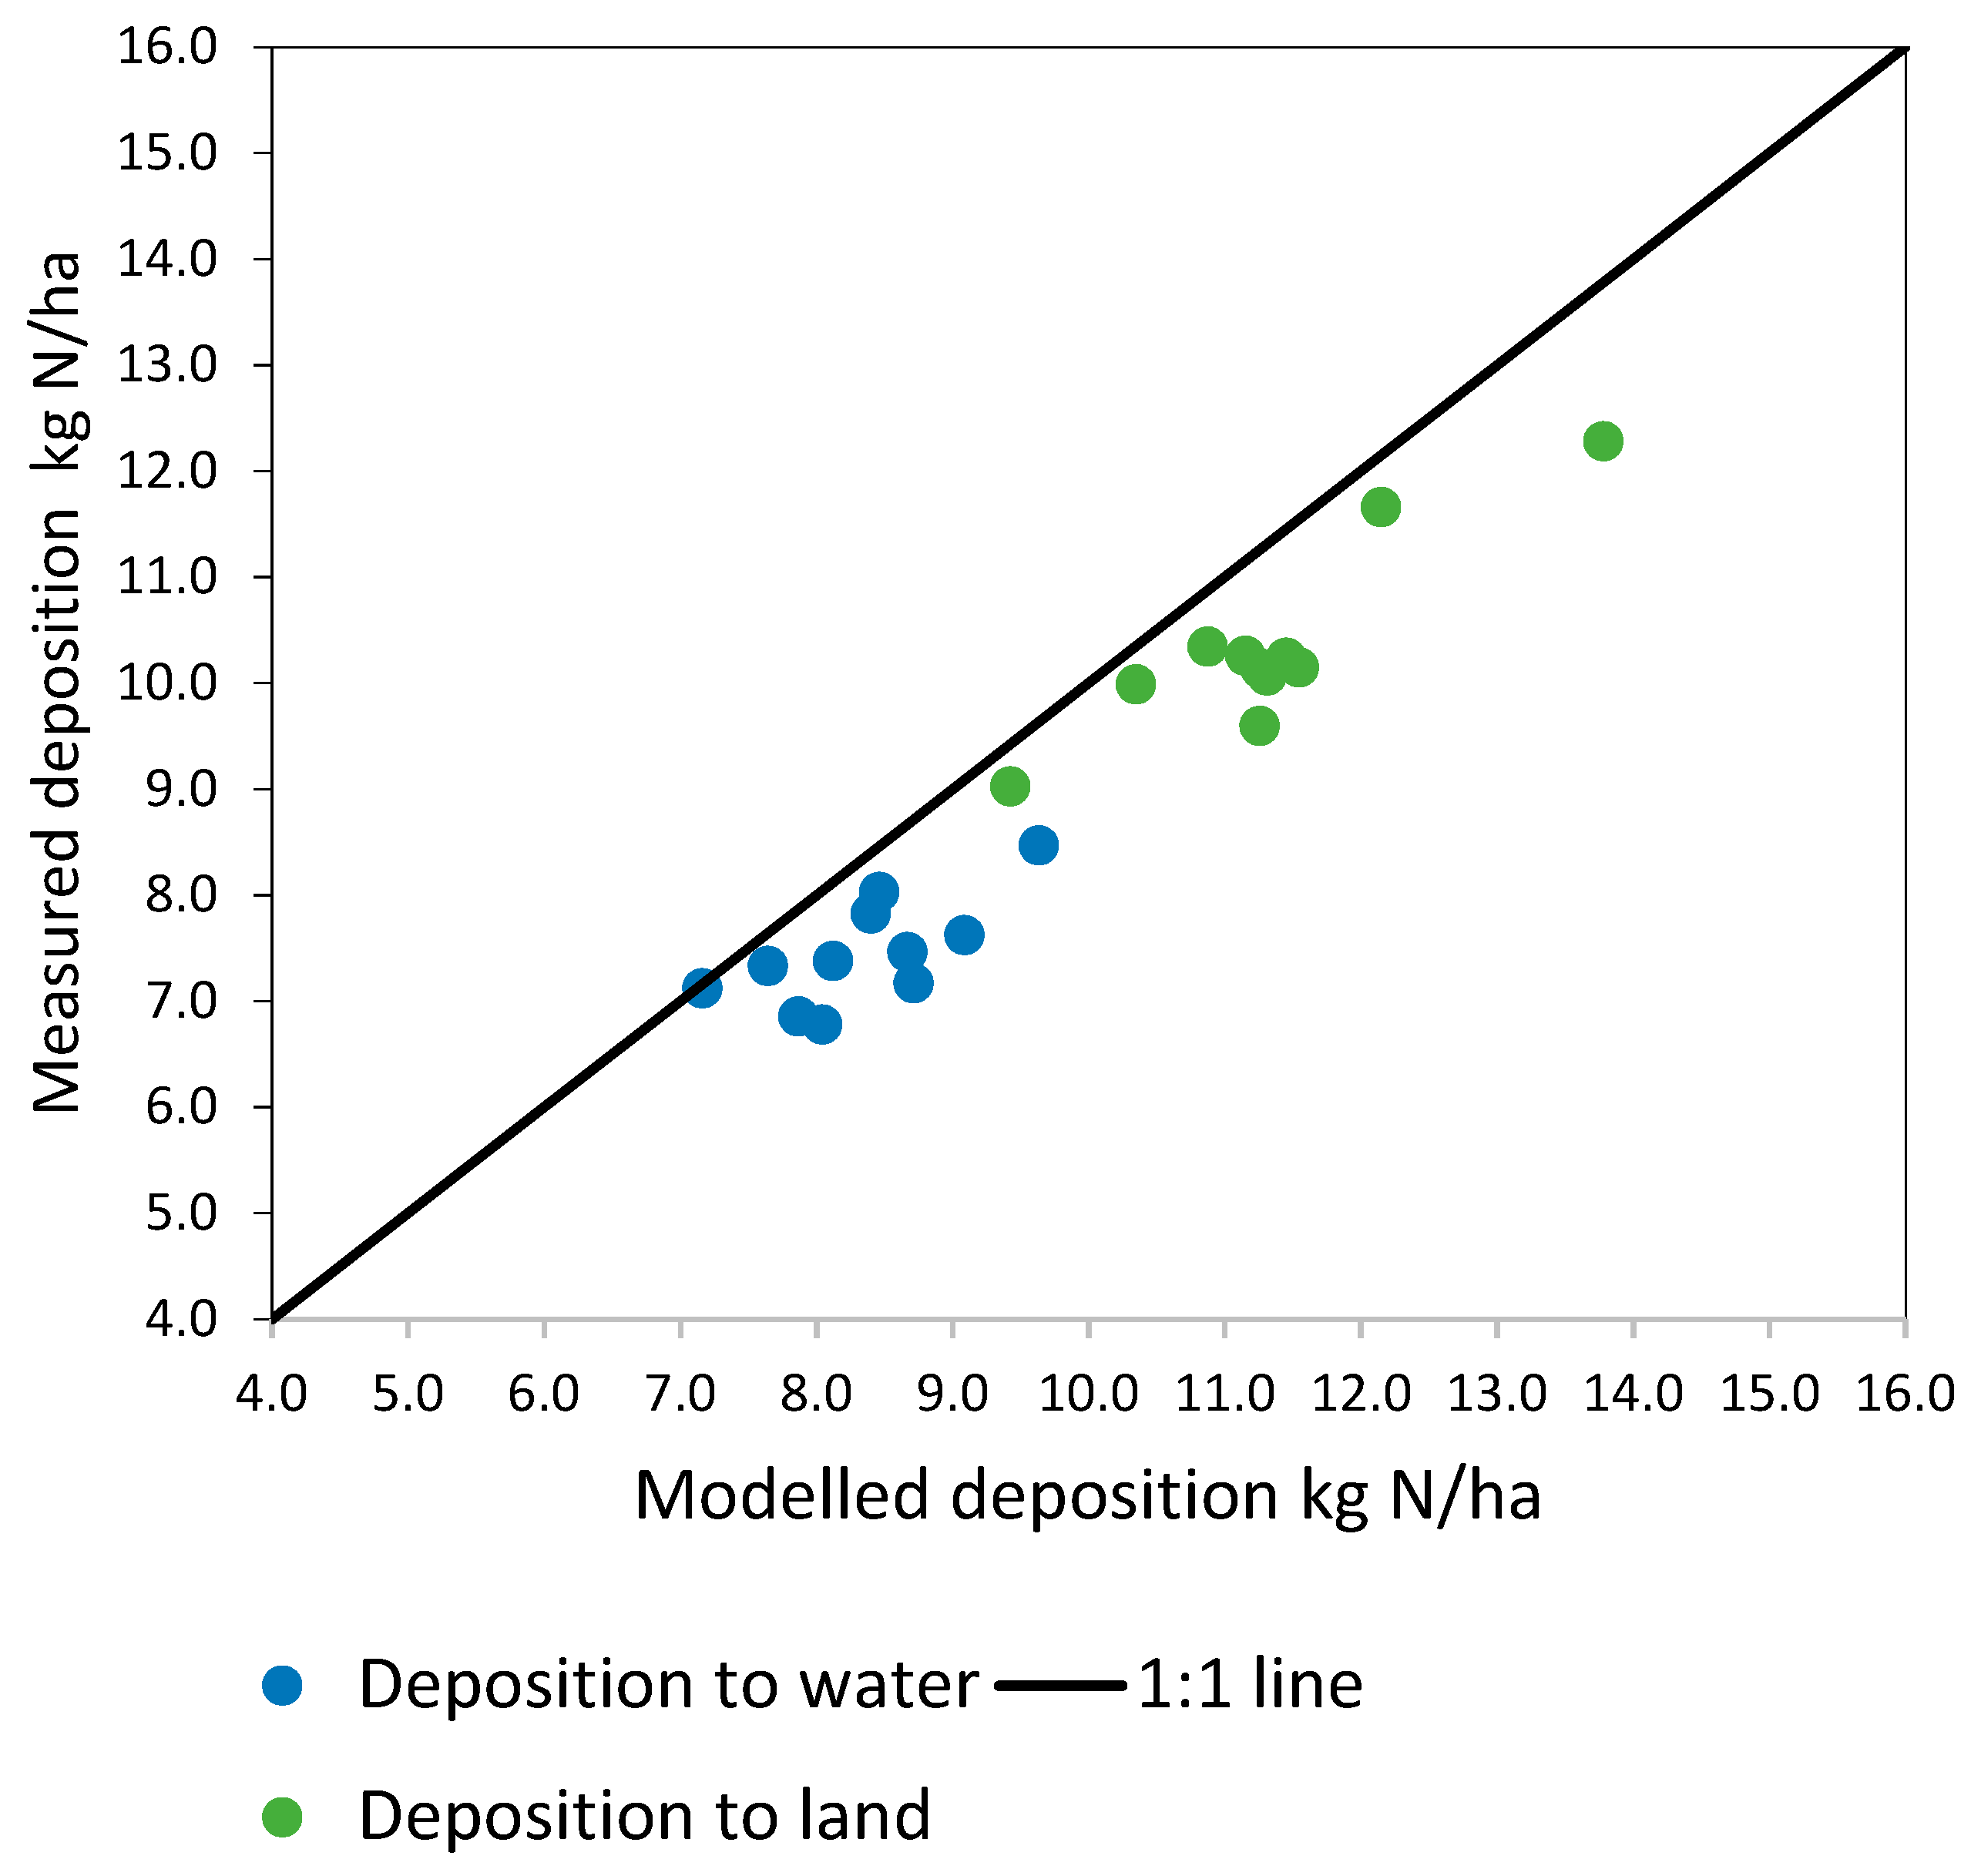
3.1. Atmospheric Loadings of Marine Waters

For 2016, the total atmospheric nitrogen deposition to Danish marine waters is calculated to be 73,000 tons N (Table 2). Since the Danish marine waters have a total surface area of 105,000 km2, this gives an average deposition of 6.9 kg N/ha (see Figure 4 and Table 2).
The atmospheric nitrogen deposition varies by a factor of two over the Danish marine waters. Largest deposition is seen for the coastal waters and fjords that lie a short distance from agricultural sources. The highest deposition is about 15 kg N/ha and calculated for the coastal area around Als (an island in the region of Southern Jutland), while the lowest deposition is about 6 kg N/ha for parts of the Baltic, North Sea and Skagerrak. A gradient from South towards North is evident, and this gradient is due to contributions to atmospheric nitrogen deposition from nitrogen sources in the countries south of Denmark.
The uncertainty on the model calculations are estimated to be ±30% for the open waters, while the uncertainty can be up to ±50% for the coastal waters, fjords, bays, and coves. The uncertainties have been estimated on basis of comparisons with measurements from the monitoring program and applies to the calculations for grid cells. The uncertainties for the total depositions to the various Danish waters listed in Table 2 may be somewhat smaller, since over- and underestimations within a domain may level out somewhat.

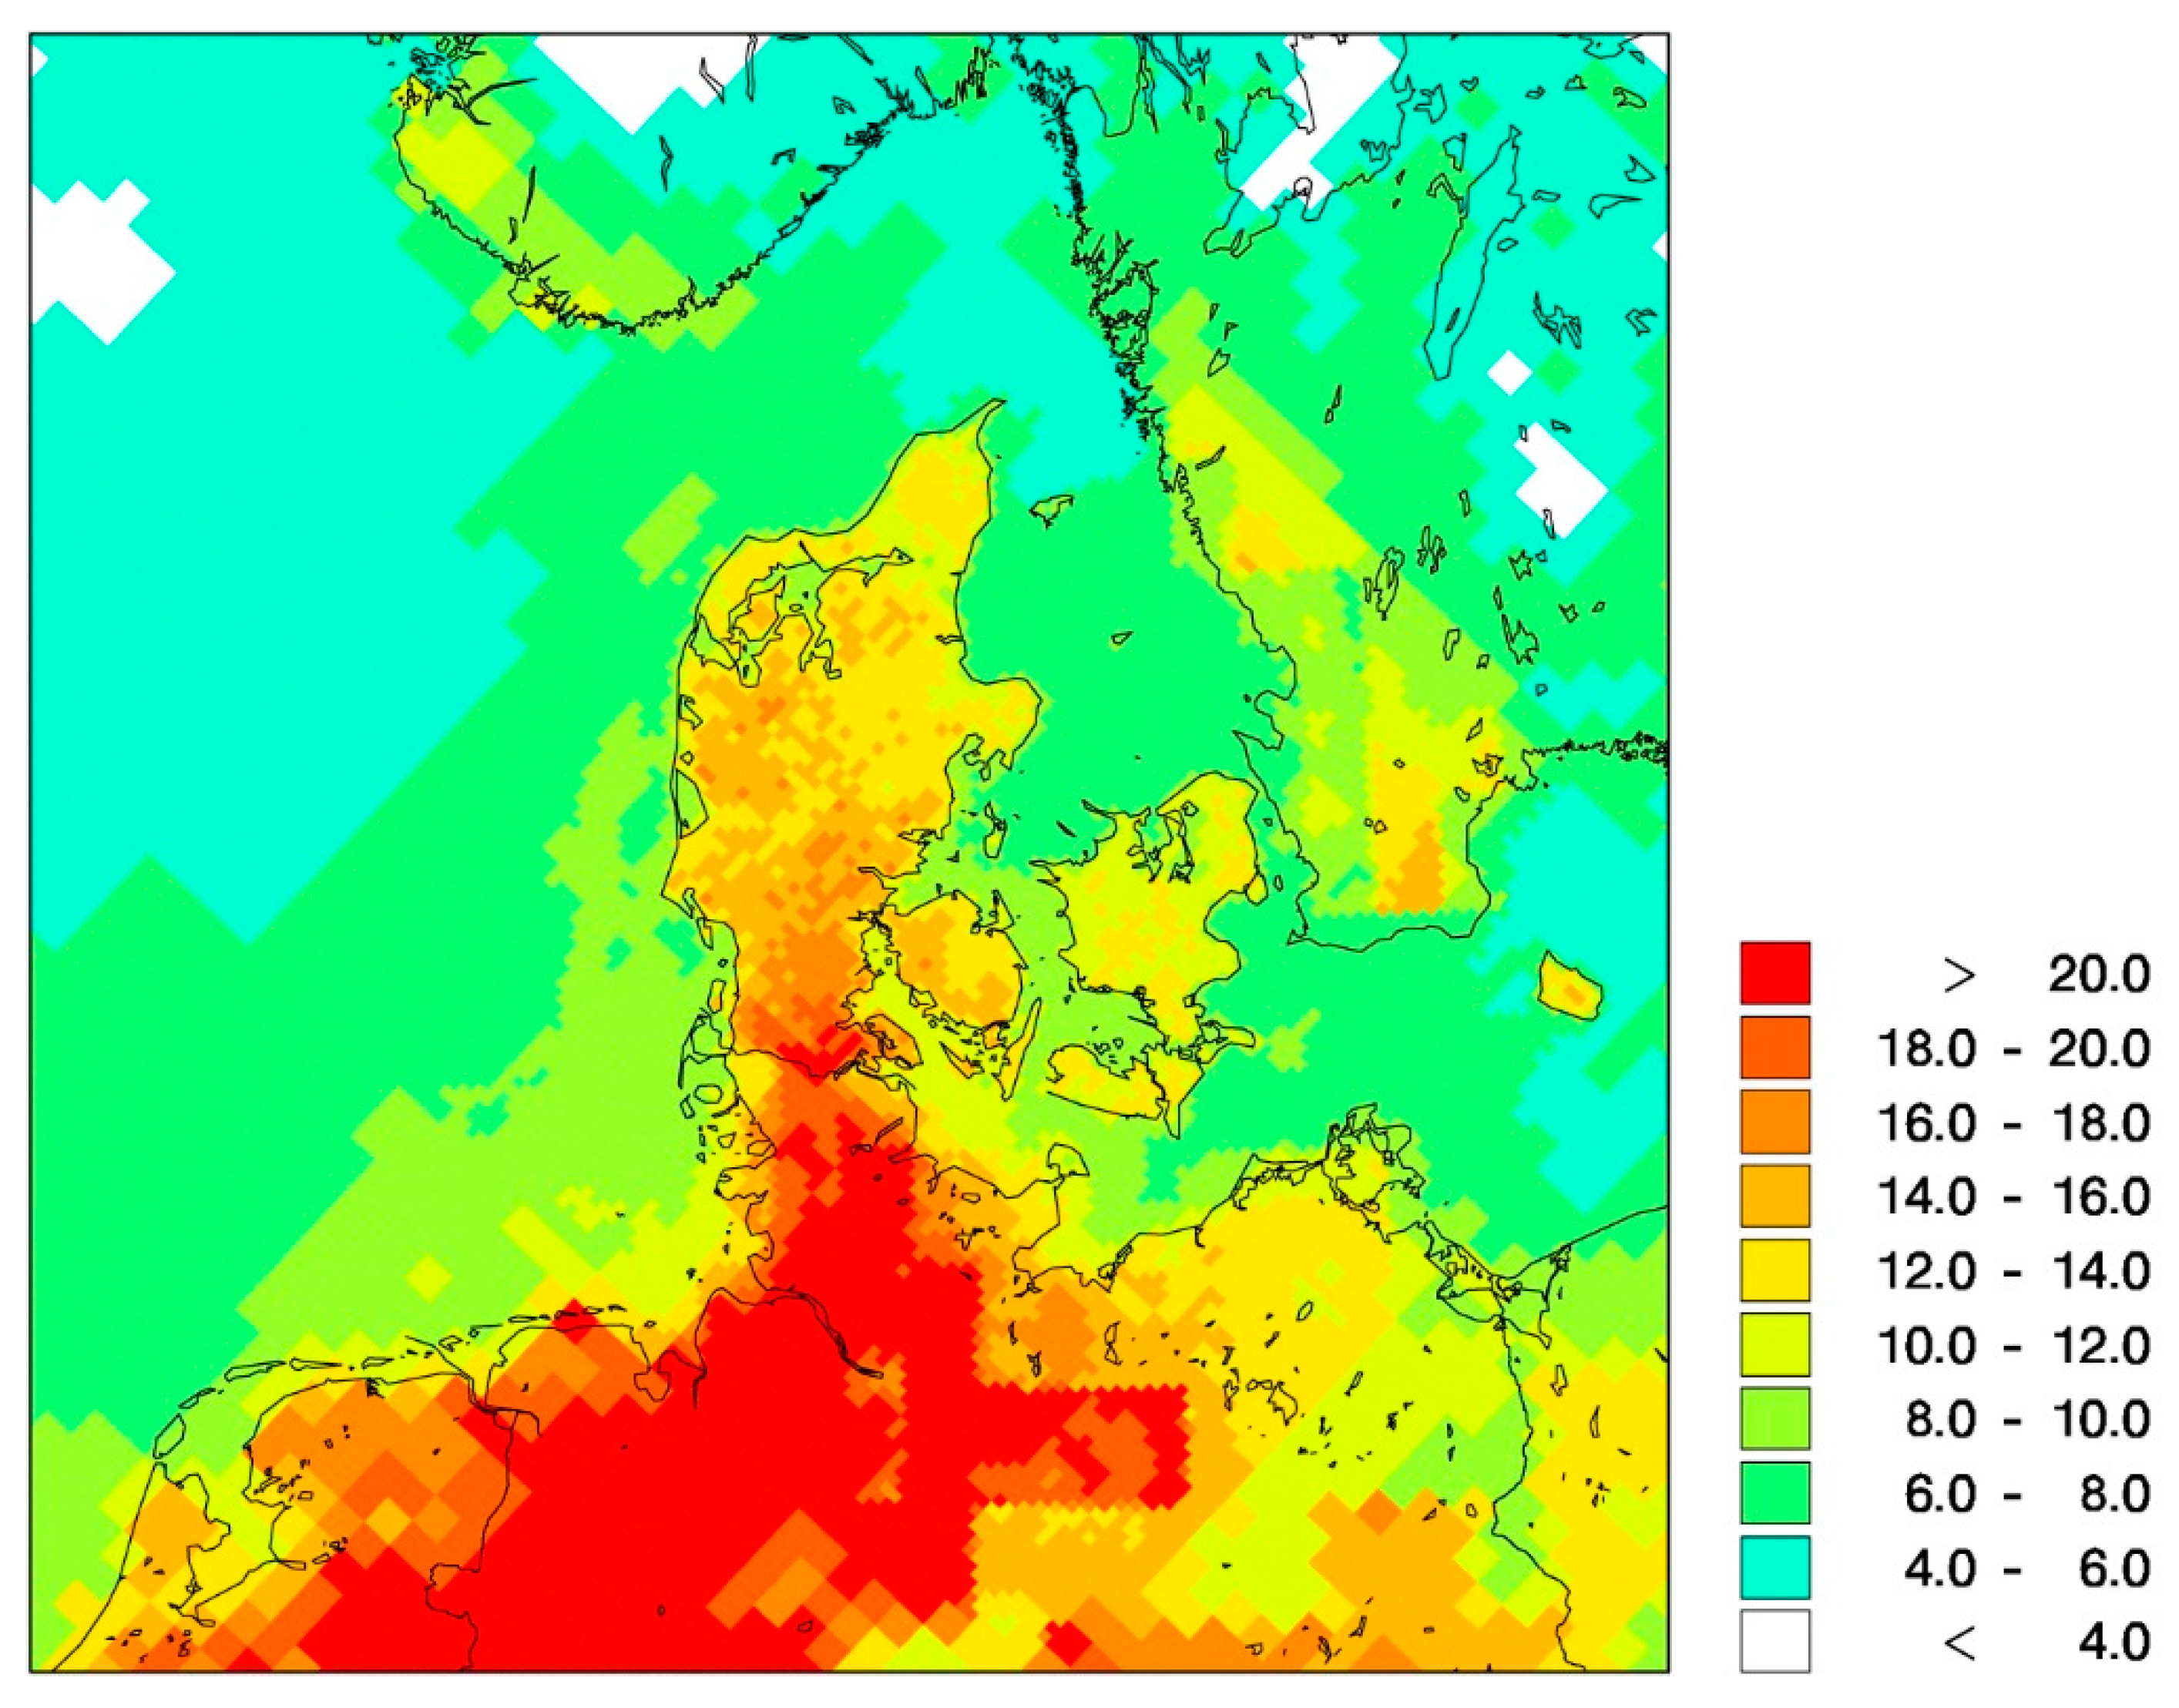
3.2. Atmospheric Loadings of Land Surfaces

For 2016, the total atmospheric nitrogen deposition to Danish land areas has been calculated to 57.000 tons N using DEHM (Table 3). The average annual atmospheric nitrogen deposition is 13 kg N/ha, which is above or in line with critical loads for many of the sensitive Danish ecosystems such as High Bog 5 to 10 kg N/ha, Lobelia Lakes 5 to 10 kg N/ha, Dunes 10 to 25 kg N/ha, and Heath 10 to 25 kg N/ha [33]. The annual atmospheric nitrogen deposition varies geographically over the country from about 5 kg N/ha and up to 20 kg N/ha, when computed as average deposition for the DEHM models grid cells of 6 km × 6 km for Denmark (see Figure 4). The magnitude of the deposition is a result of the land cover (type of surface), distance to local agricultural activities, and precipitation amounts. The highest depositions are computed for the Southern part of Jutland where the animal household is intense, leading to high ammonia emissions. The lowest depositions are found for Zealand and some of the smaller island that are far from agricultural sources and for which the precipitation amounts are limited. For calculations with higher resolution, the spatial differences are considerably higher (See Section 3.4). Danish nitrogen oxide emissions contribute only to a minor extend to the atmospheric nitrogen loadings of Danish nature. Nitrogen dioxide can be dry deposited to vegetation by uptake via the plants’ stomata, which is a relatively slow process, or it can be removed by the conversion to nitric acid which is likewise a slow process. These two removal processes lead to a typical lifetime of nitrogen oxides of about 24 h [34]. The slow dry deposition process and the likewise slow conversion to nitric acid (that may be quickly deposited by dry or wet deposition) means that only about 5% of the Danish nitrogen oxide emissions are deposited within Denmark.
The uncertainties of the model calculations are estimated to be on the order of ±40% for the averages of grid cells. The uncertainties are estimated from comparisons between model calculations and measurements for the monitoring stations.
The total nitrogen deposition to Danish terrestrial areas of 57,000 tons N in 2016 are in good compliance with the similar results from the EMEP (European Monitoring and Evaluation Programme) of 52,000 tons [34]. The DEHM calculations are based on a high resolution emission inventory for Denmark and a reception net of 5km × 5km, whereas the EMEP model has a coarser spatial resolution of 50km × 50km [35]. The south-north gradient in air concentrations is also reflected in the nitrogen deposition. When comparing depositions over Danish land areas with depositions to our land areas in neighboring countries, it is evident that long-range transport of especially particulate nitrate and ammonium from source areas in the northern part of the European continent is responsible for a significant part of the observed gradient. Atmospheric nitrogen depositions to land surfaces in northern Germany are thus higher than in Denmark, whereas depositions to land surfaces in southern Sweden are lower. Over Denmark, this south-north gradient is clear, and so is the west-east gradient resulting from differences in agricultural activity over the country.

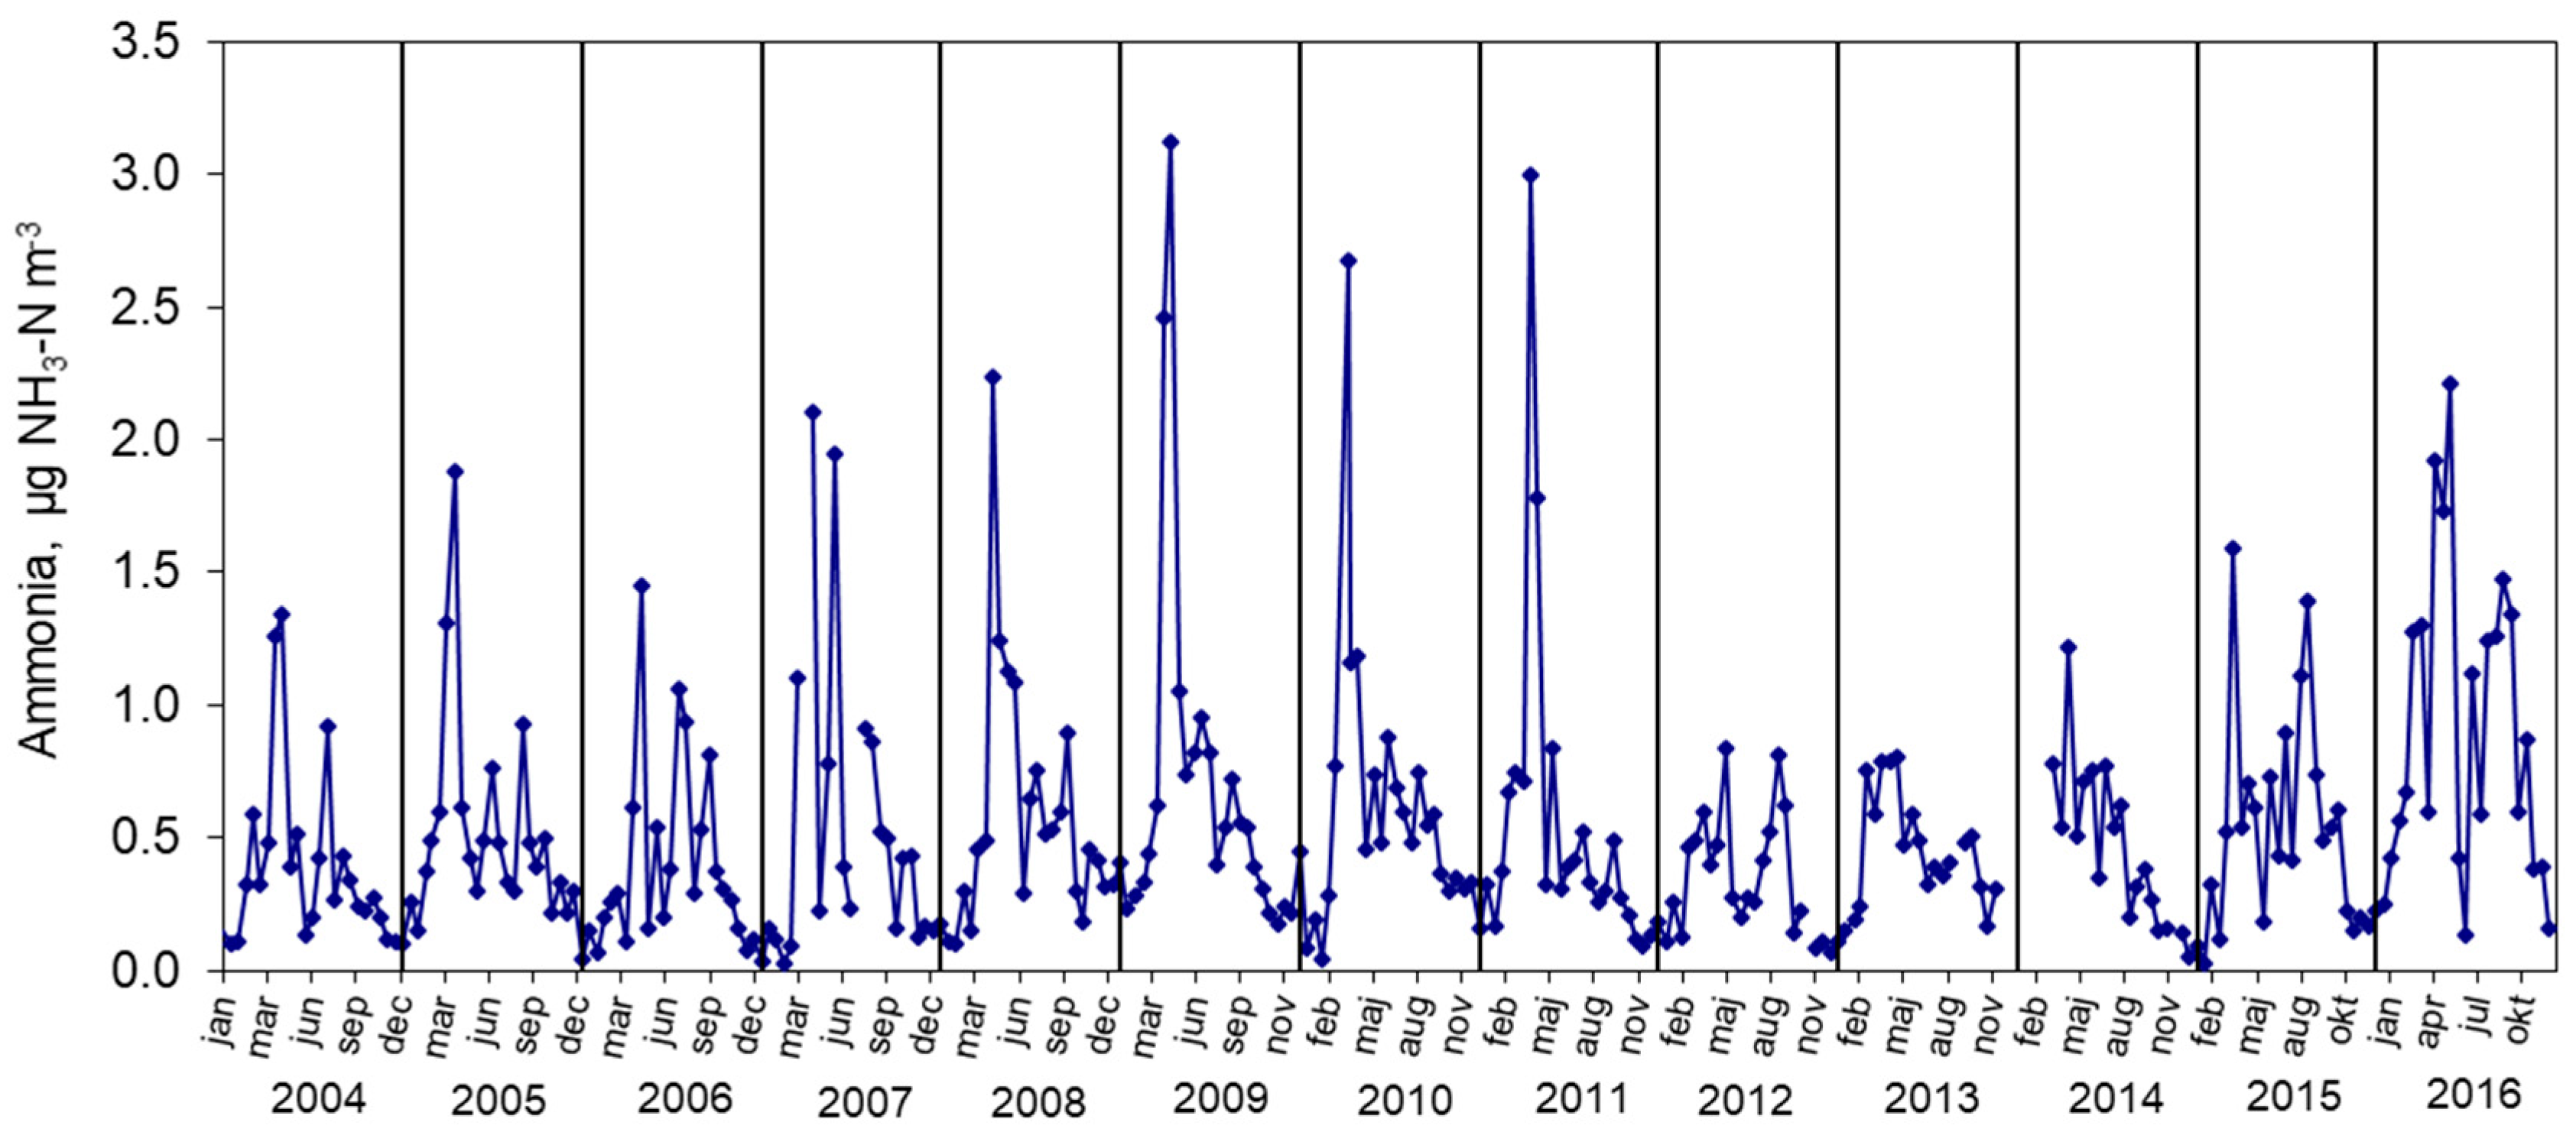
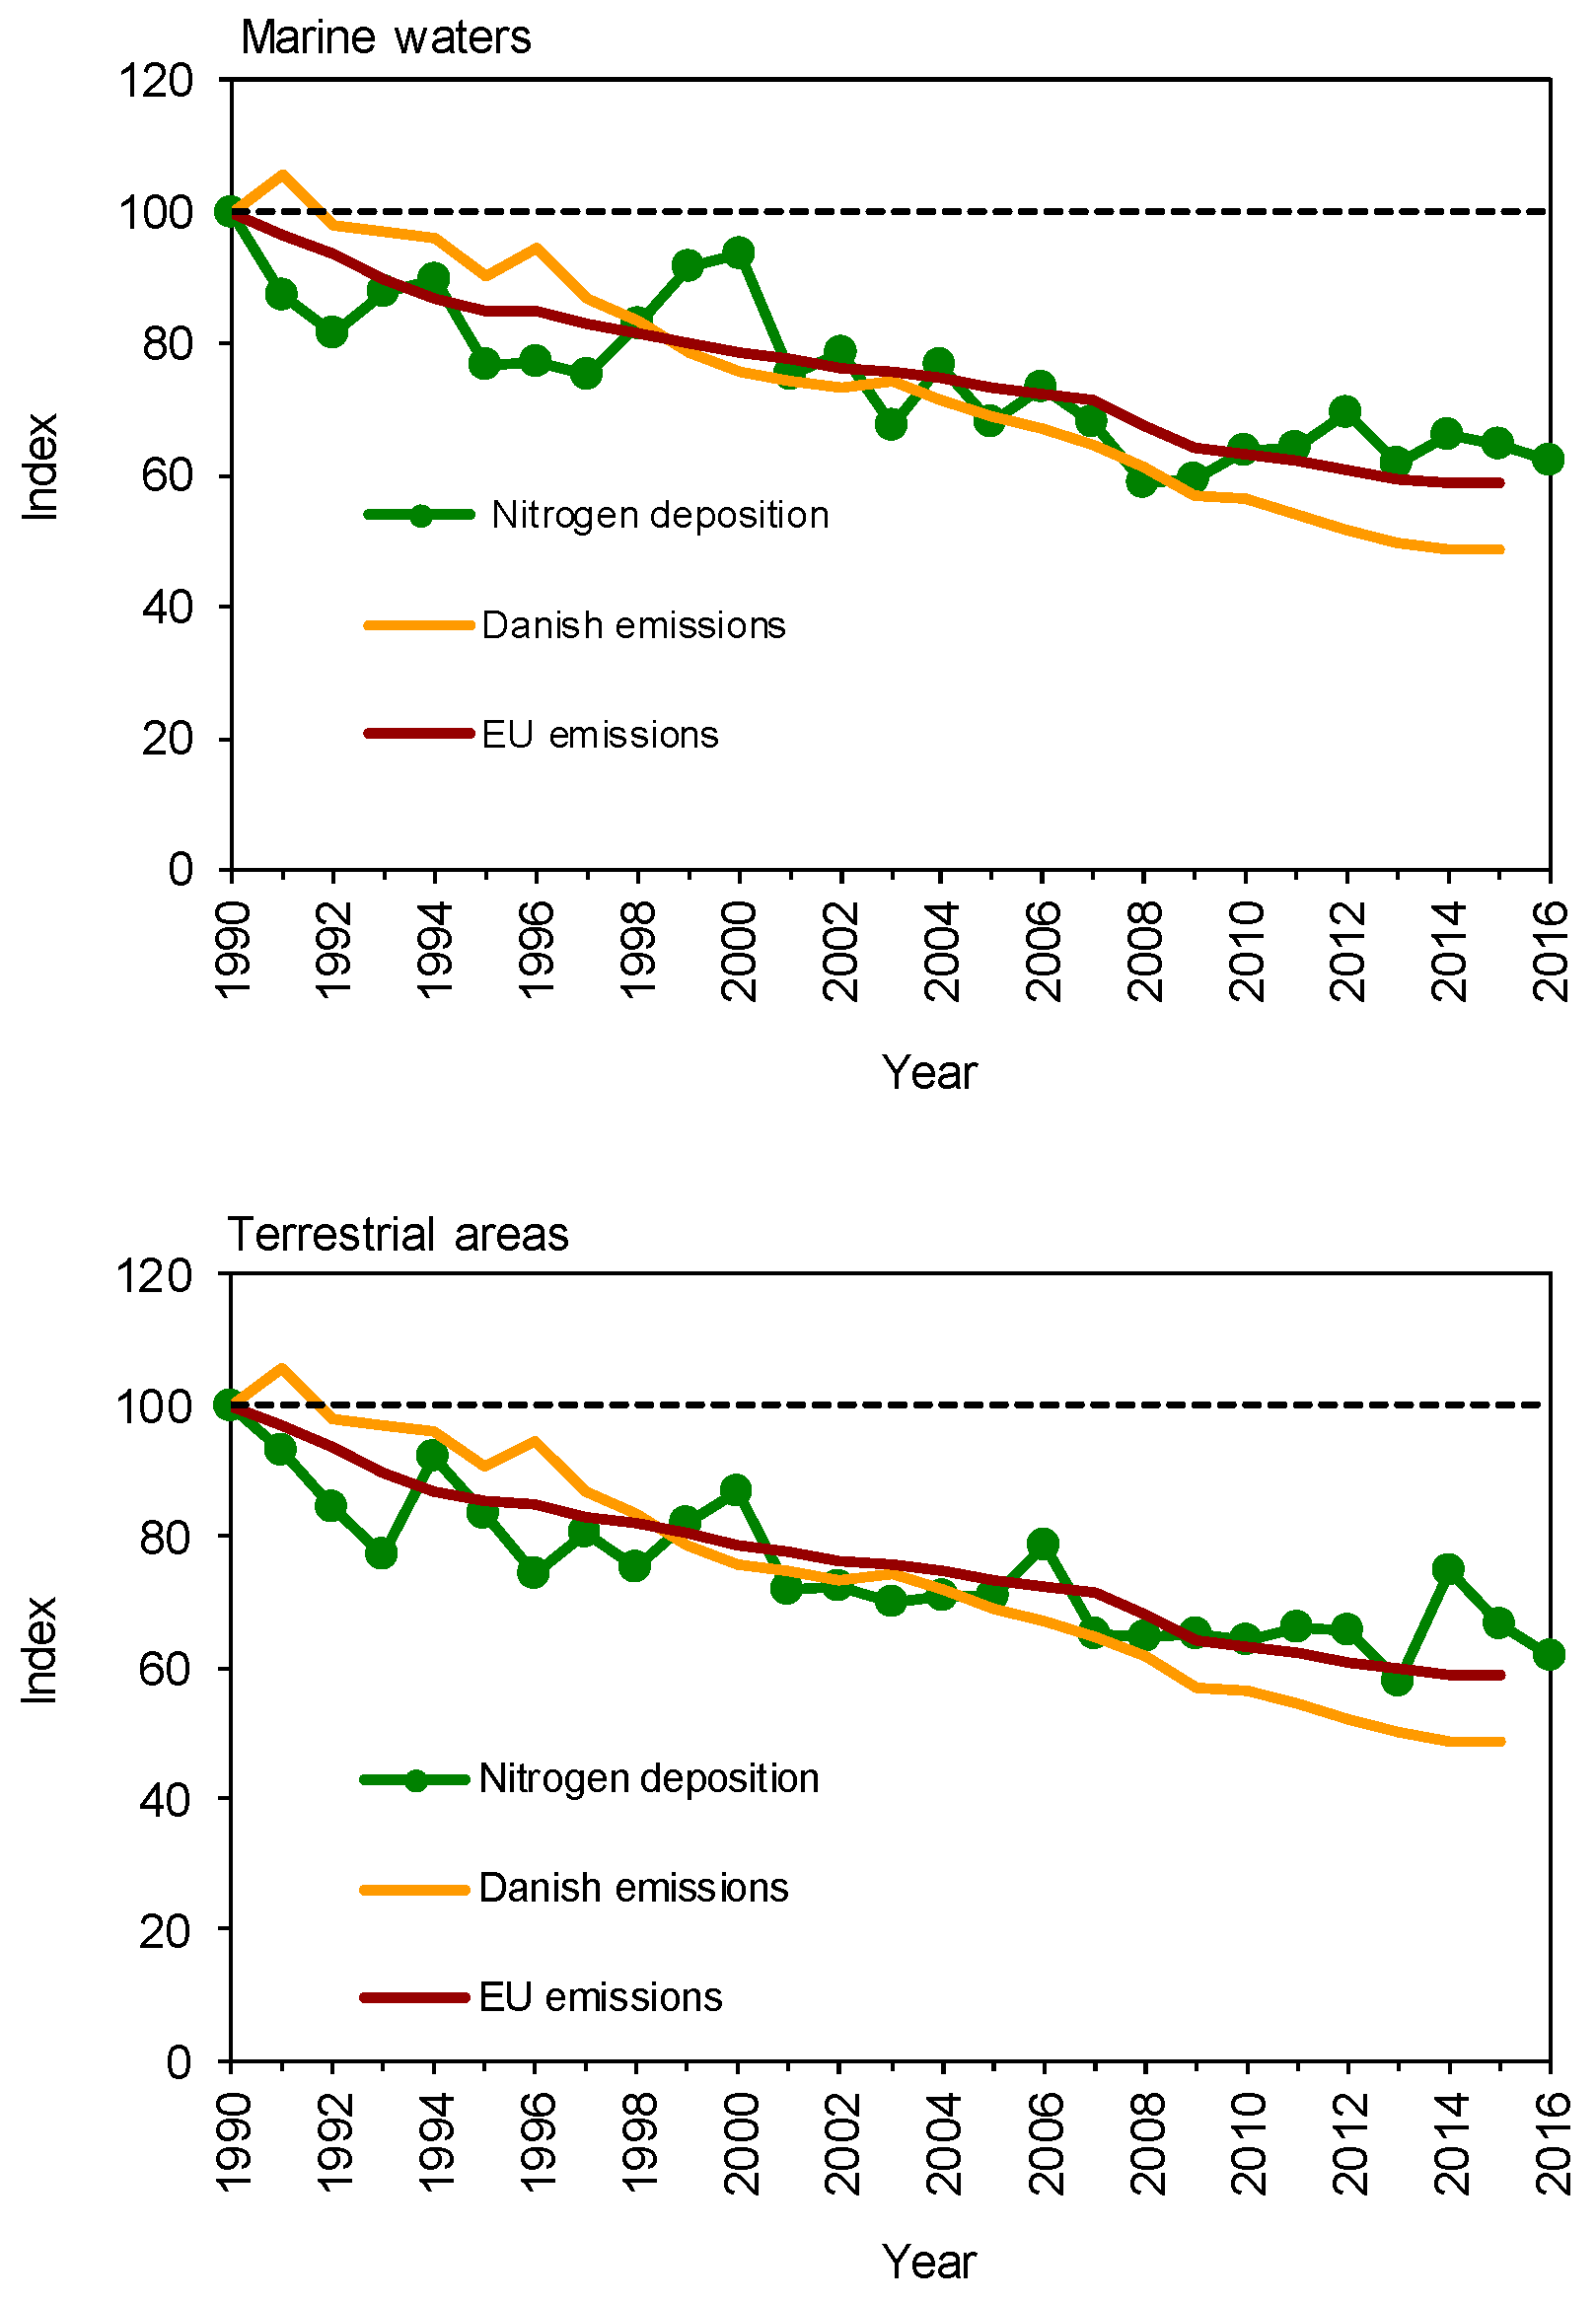
3.3. Long-Term Trends in Atmospheric Nitrogen Deposition

Concerning the long-term trends in atmospheric nitrogen deposition, the measurements from the stationary routine monitoring stations show a decrease since 1990 of 35% for terrestrial as well as marine monitoring sites (See Figure 5). Most of the decrease is observed for the beginning of the period. It is believed that this tendency is representative for Denmark as such, but locally there may be significant deviations from this pattern. The trend in atmospheric nitrogen deposition is in line with the general development in atmospheric nitrogen emissions in Denmark and the other EU countries during this period. Most of the decreasing trend is believed to be associated with the decrease in emissions from European sources south of Denmark, but also reductions in Danish agricultural ammonia emissions play an important role. The latter is especially evident for parts of Jutland where 45% of the deposition is related to local Danish emissions. The trends depicted in Figure 4 are split in deposition to Danish terrestrial and marine areas, due to the differences in dry deposition velocities, amount of precipitation and vicinity to local agricultural ammonia sources.
Variations in meteorological conditions play a significant role for the atmospheric nitrogen deposition. This affects especially depositions to marine waters, where wet deposition constitutes 70 to 90% of the total atmospheric nitrogen deposition. Year-to-year variations in precipitation amounts may be substantial (also visible in Figure 4). Seen over the entire period that the monitoring program has been operated, there has been a slight increase in annual precipitation. However, this increase took place mainly in the 1990s, whereas precipitation amounts have been more or less unchanged since 2000 (see http://www.dmi.dk/klima/fremtidens-klima/danmark/nedboer/). In years with high precipitation amounts, depositions will be high compared with surrounding years. This is evident for the years 1999 and 2000, when high precipitation amounts where observed. For 2016, the precipitation amounts were low; the annual mean precipitation over Denmark was 701 mm, which is 2% below the average for the time period since 1961, and 6% lower than the average for the period since 1989 when the monitoring program started [36].
It has been argued that changes in sulfur and nitrogen emissions have not resulted in proportional decrease in depositions over the past decades [37]. The results shown in Figure 4 indicate that for Danish conditions, trends in annual mean nitrogen depositions seem to be fairly proportional to the trends in nitrogen emissions.

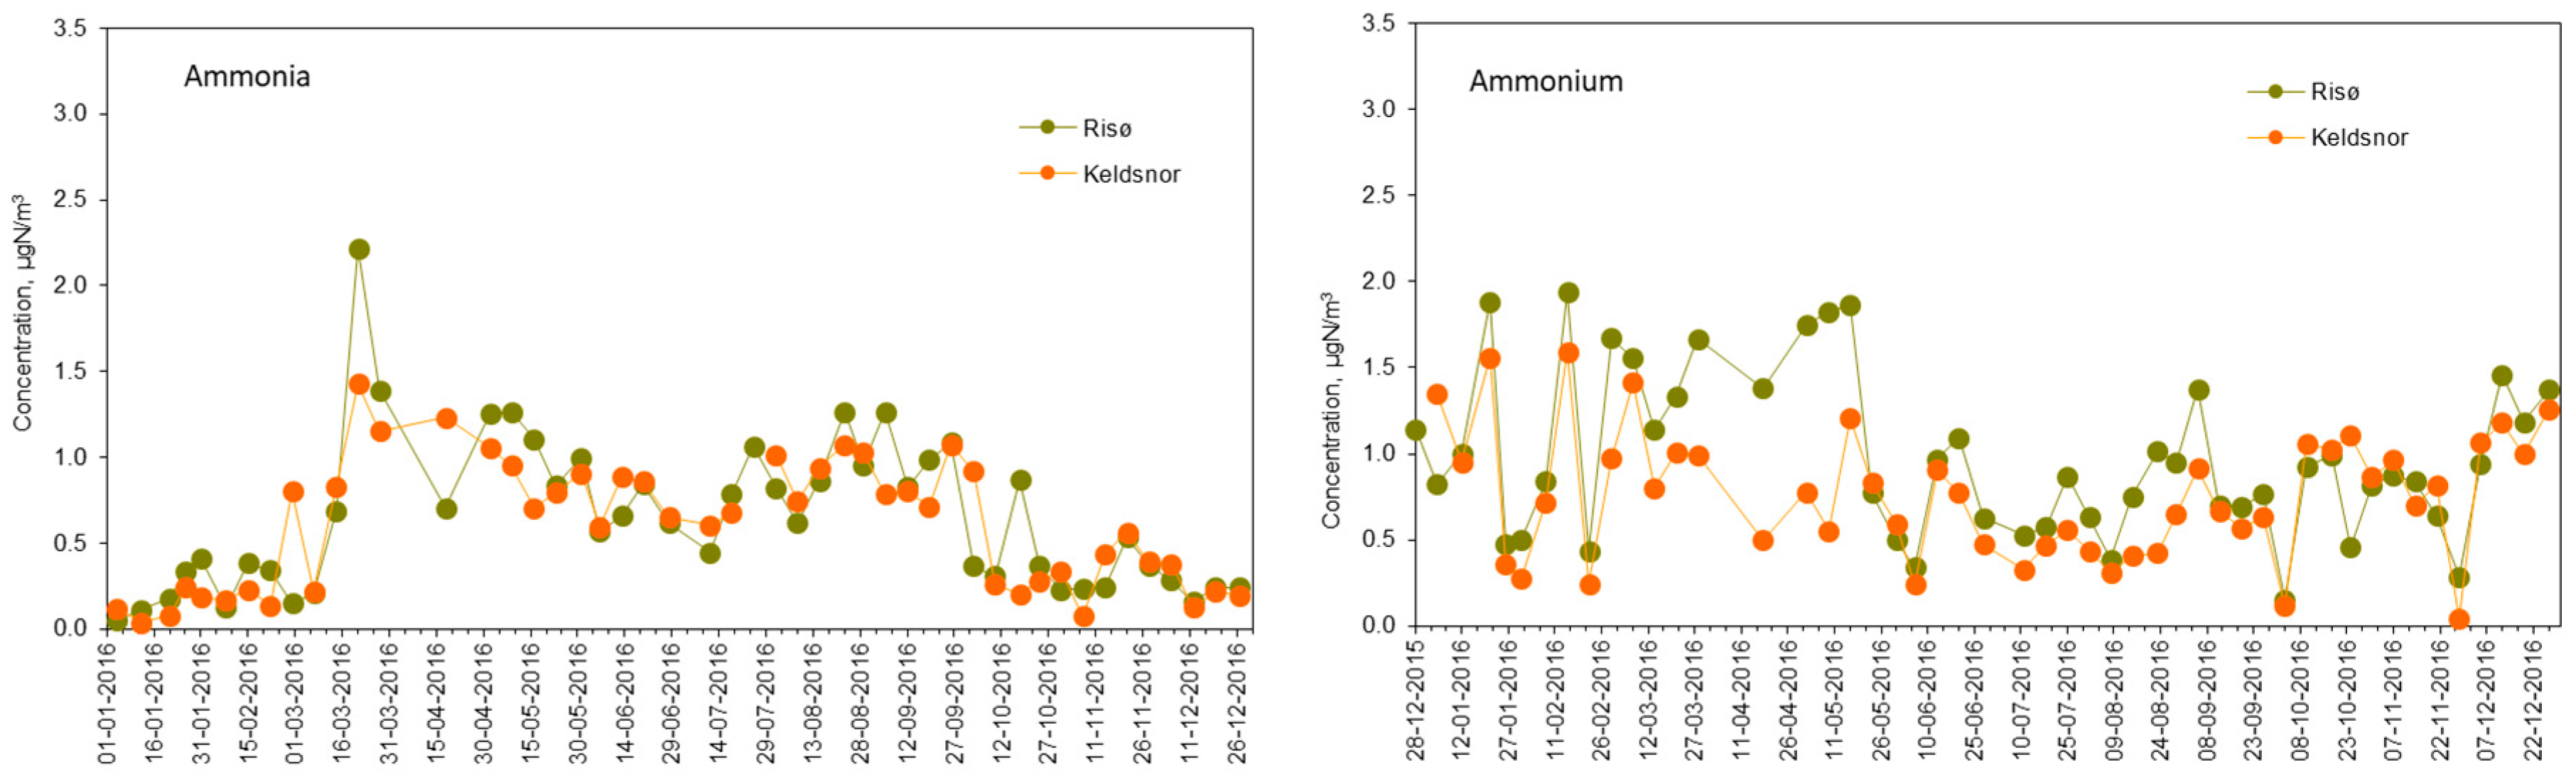
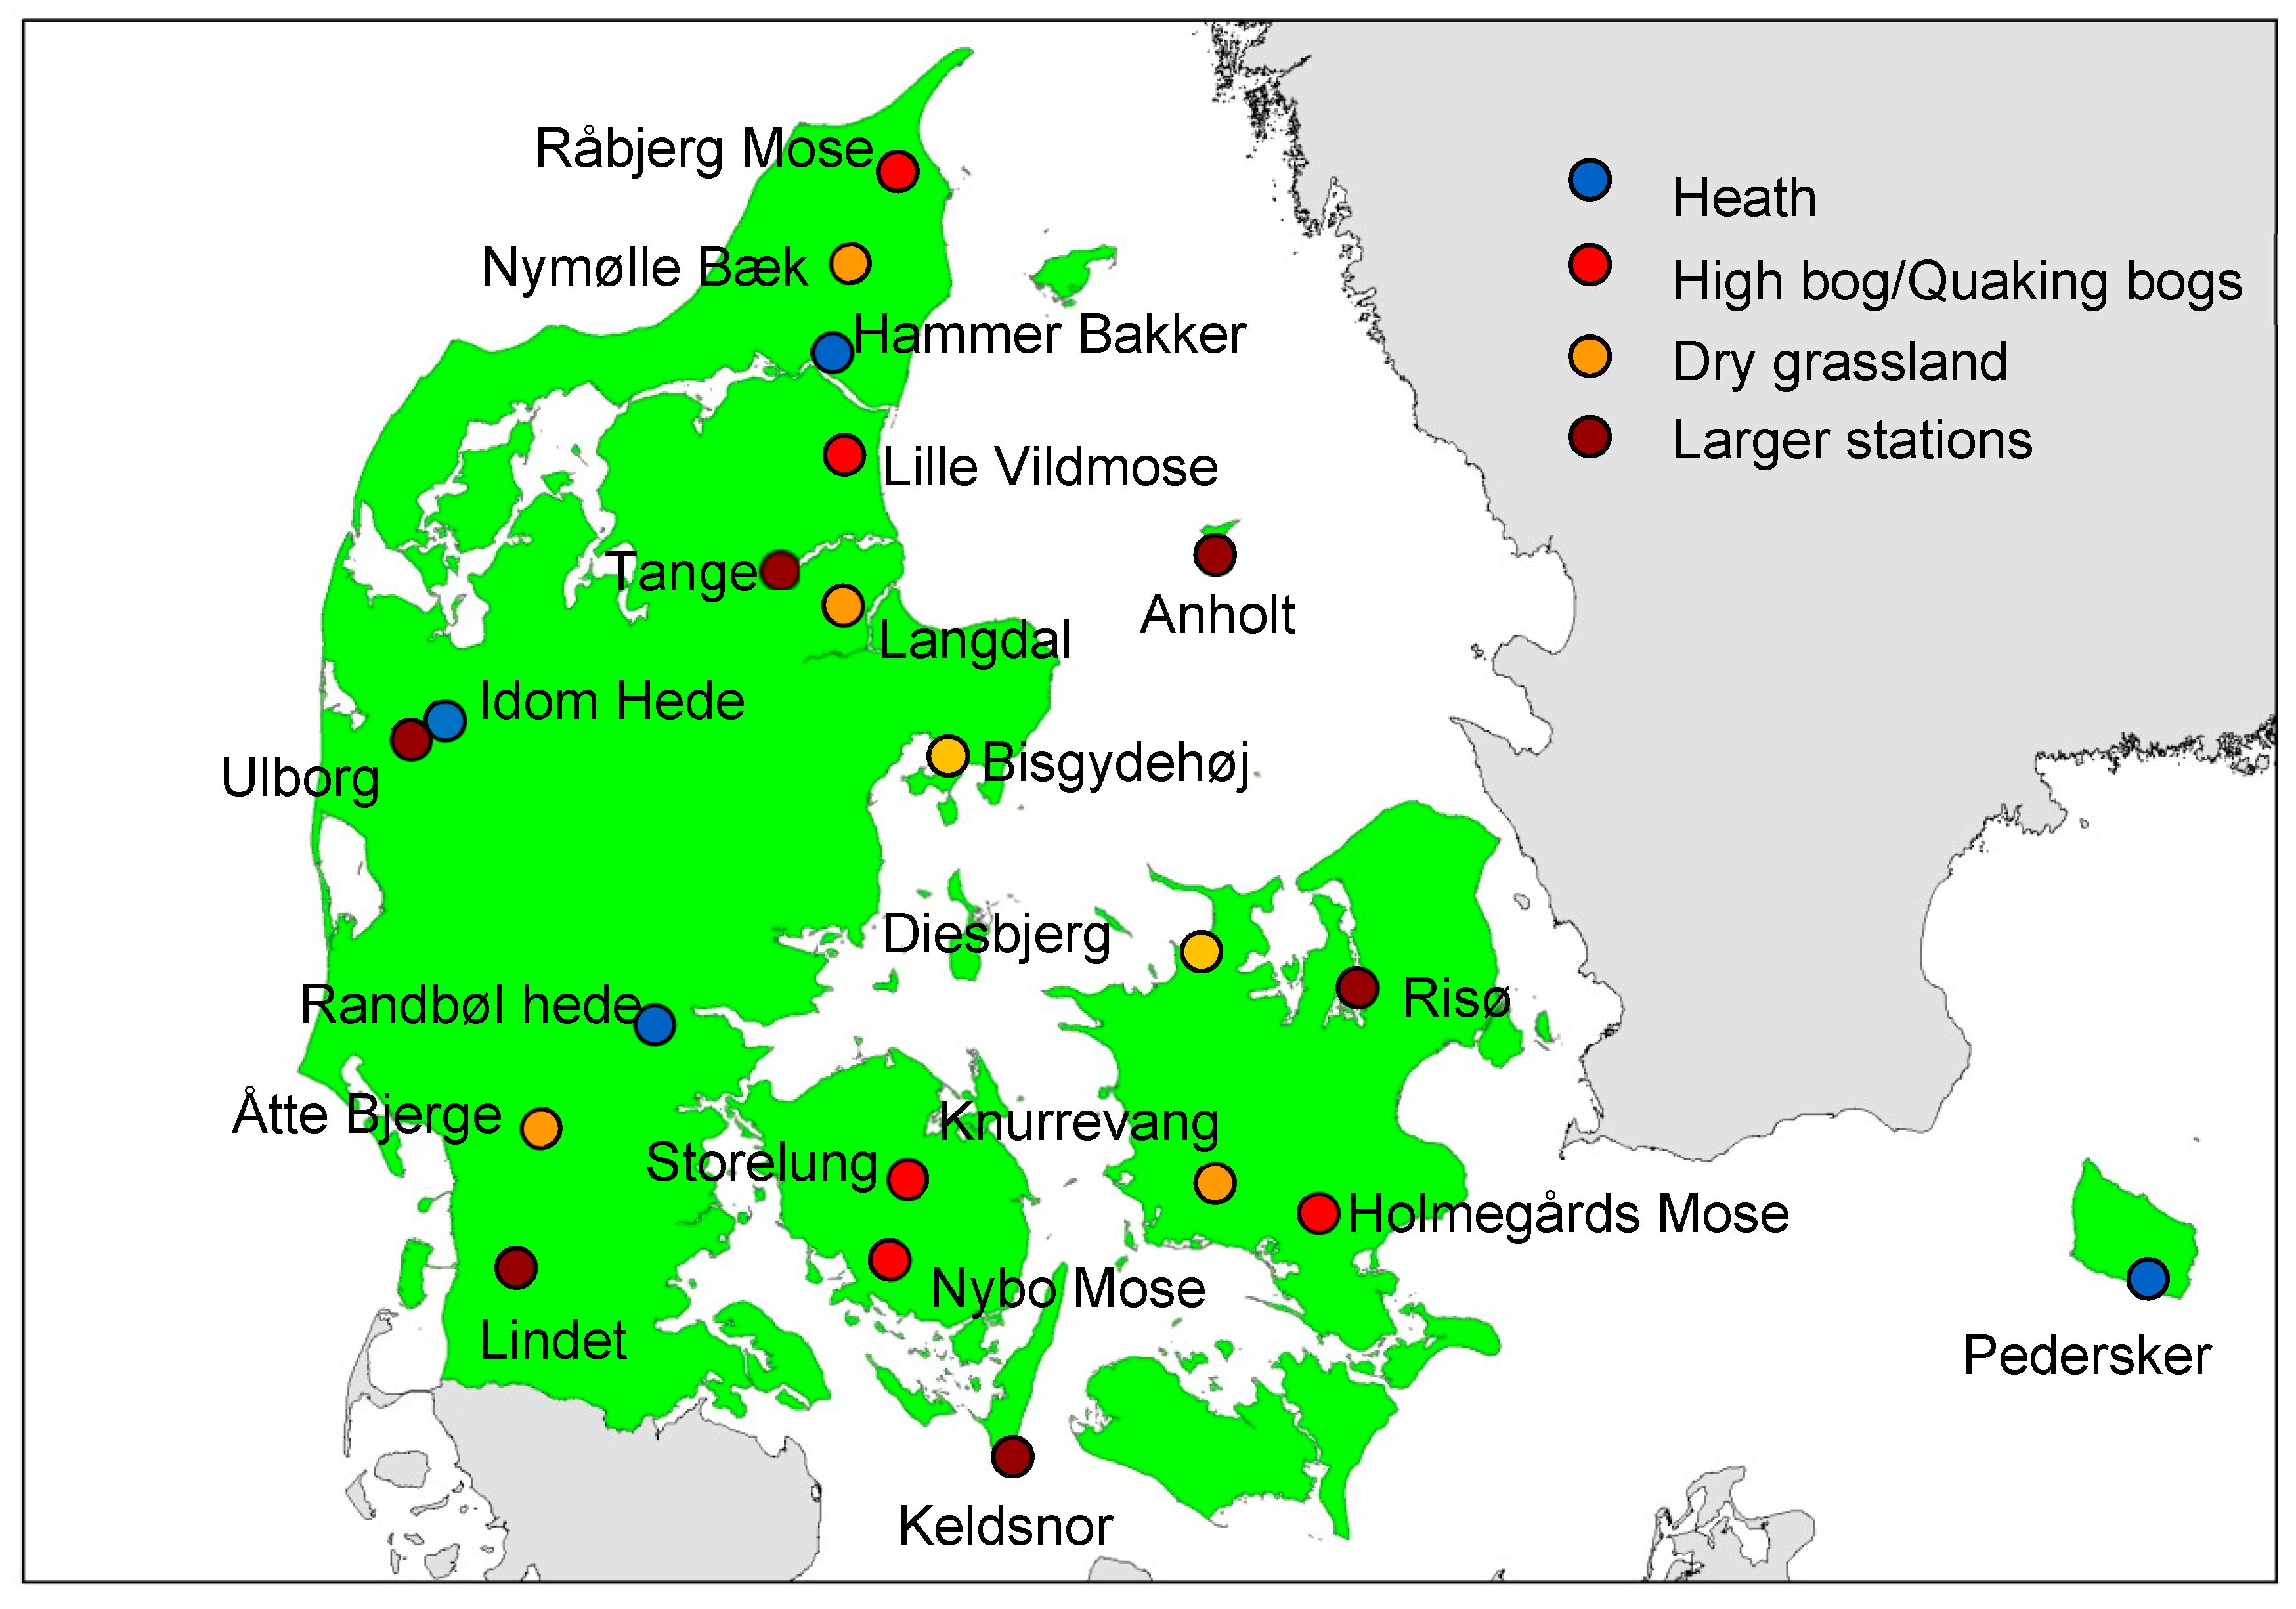
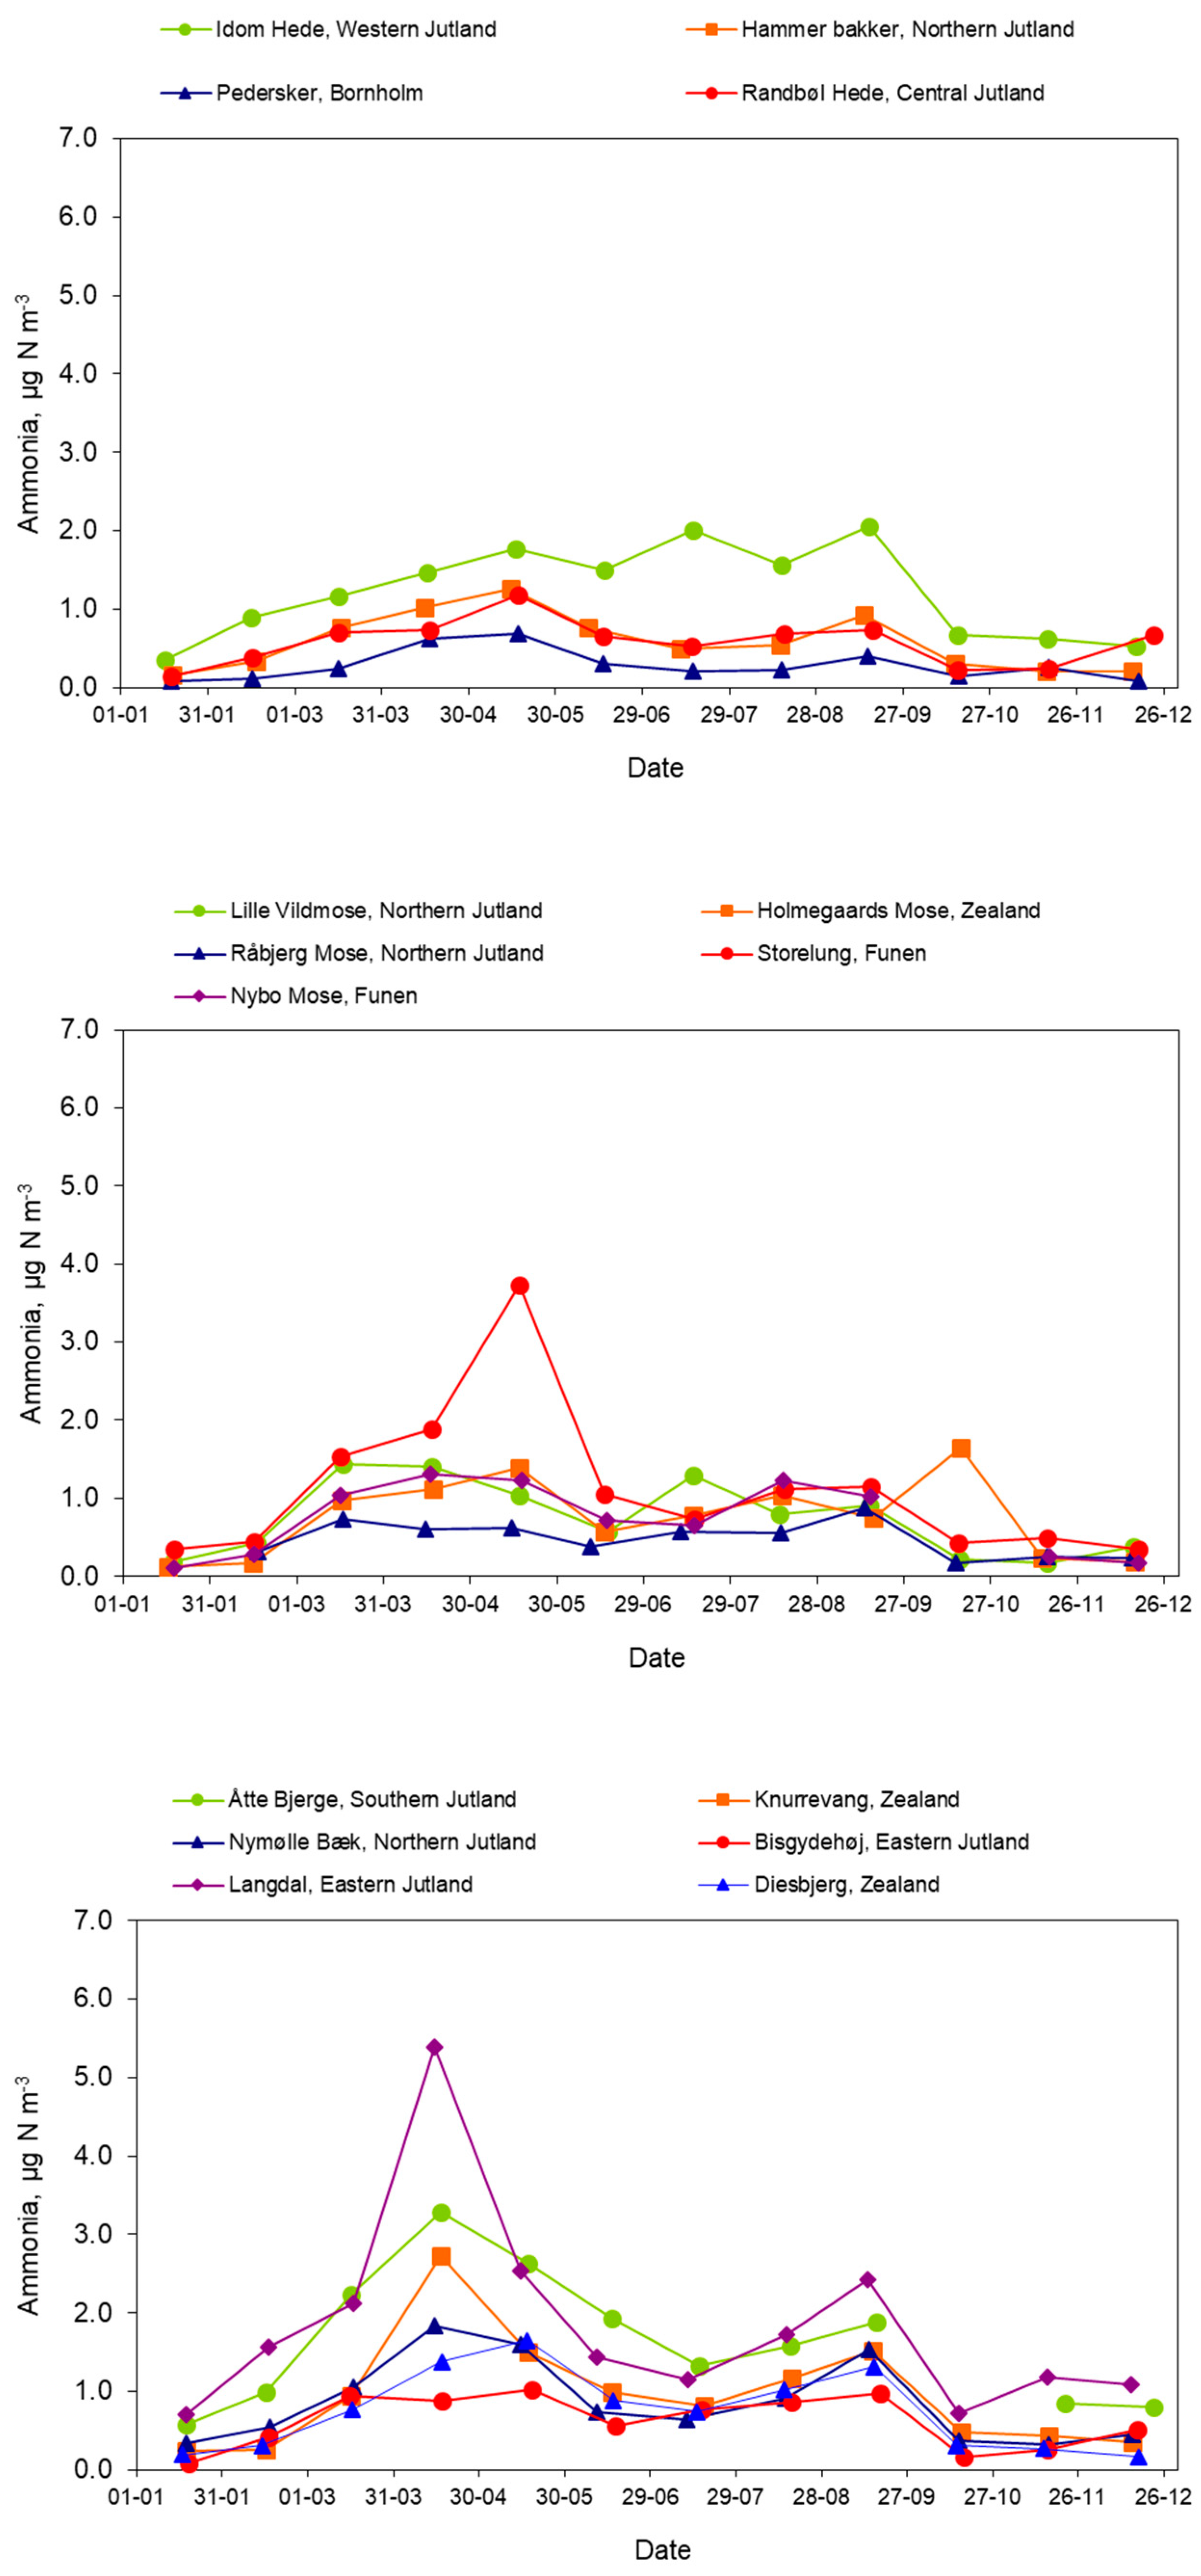
3.4. Ammonia and the Nature Stations

In 2004, the Danish monitoring program was extended to include measurements of nitrogen compounds at terrestrial nature areas. These include long-term measurements of half-monthly to monthly ammonia concentrations over the most nitrogen sensitive Danish ecosystems (See Figure 1). The measurements are used for obtaining information about the concentration levels and deposition loading as well as for local scale model validation over the years. Since these measurements were established, some of the nature monitoring stations have been closed or moved to other localities. In 2016, ammonia measurements were performed over 15 nature areas. These nature areas included the nature types: High Bog, Heath, Dry Heath, Dry Grassland, and Quaking Bogs.
As part of the general mapping of nitrogen loadings over Denmark, long-term measurements of ammonia, nitric acid, nitrate, and ammonium are performed at some of the routine monitoring stations. The long-term measurements are performed as a supplement to the filter pack measurements (see Section 2.1). In 2010, concentration measurements of ammonia and ammonium using the denuder method was closed at two stations (Anholt and Lindet), whereas a station was established at Risø nearby Roskilde. At the Lindet station, the denuder measurements have been substituted by passive sampling of ammonia using the same method as for the nature monitoring stations.
Figure 6 shows the weekly mean measurements of ammonia and ammonium in 2016 measured at Keldsnor and Risø. In general, the levels of both compounds are rather similar at the two stations. Lowest concentrations are observed for the winter seasons, and for both stations a maximum in spring (although not very pronounced) is observed. This seasonal variation is similar to what was observed in 2014 and 2015. For these years, the spring maximum came early due to mild winters, resulting in early application of manure on the fields. During the summer period, the concentrations are somewhat lower until a small increase takes place in August when manure is applied again. This seasonal variation is due to Danish legislation which demands that application of manure takes place only when there is growth of crops on the fields, and hence bans application of manure between November 15th and February 1st [22]. Unlike ammonia, ammonium concentrations do not decrease in autumn due to long-range transport from the European continent south of Denmark.
Figure 7 shows the half-monthly concentrations of ammonia observed at Ulborg during the period 2004 to 2016. In general, there is a significant variation from year to year due to variations in meteorological conditions but also due to variations in agricultural activities between the years. For the period 2004 to 2011, the ammonia concentrations show a tendency to have three peak concentrations over the year. The most pronounced peak is related to the spring application of manure, whereas the two secondary peaks are observed in summer and early autumn. The spring application of manure is a result of the aforementioned Danish legislation [20,22]. In winter, the concentrations are significantly lower. The time of the spring maximum varies from first half of April to first half of May in these years.
The period 2012 to 2015 is significantly different from the period 2004 to 2011, in the sense that during this three-years period, the spring maximum is either missing or much less pronounced compared with the other years. This may to some extent be due to meteorological conditions during these three year. However, since this change is observed for several years, this may also indicate that some changes in agricultural praxis or agricultural activities have taken place. An explanation could thus be addition of acid during the manure application which may have been used to lower emissions. The seasonal variation in 2016 follows the same pattern as observed for the years 2004 to 2011. Again, meteorological conditions and agricultural praxis and activity may be the cause of both change in seasonal variation and the increased concentration level.
Since 2006, 12 measurement stations with passive ammonia sampling have been operated over nature areas with nitrogen sensitive ecosystems (See Figure 1). Figure 8 shows the ammonia concentrations measured in the year 2016. The upper plot shows measurements over Heath on the stations Idom Hede, Hammer Bakker, Randbøl Hede, and Pedersker. The plot in the middle shows measurements from High Bog at Storelung, Nybo Mose, Lille Vildmose, and Holmegårds Mose as well as the Quaking Bogs site in Råbjerg Mose. The lower plot shows measurements from Dry Grassland in Bisgydehøj, Diesbjerg, Nymølle Bæk, Langdal, Knurrevang and Åtte Bjerge.
The nature stations show a relatively uniform seasonal pattern. However, in 2016 a somewhat larger difference is observed compared with previous years. The stations with the highest concentrations (Langdal, Åtte Bjerge and Knurrevang) show a pronounced spring peak, which is believed to be the result of manure application in March and April. Spring peak at Storelung appear in May, and this is later than usual for this site. Concentrations decrease over the summer period, and a smaller peak related to autumn manure application can be observed in August-September. The nature monitoring stations with the lowest concentrations (Mols Bjerge, Råbjerg Mose, and Pedersker) are all in the same concentration range during the manure application periods in spring and autumn. For all stations in the nature monitoring program, the lowest concentrations are found in winter season. This is again a result of the Danish legislation that bans manure application outside growth season, and the low evaporation from barns and storages at low ambient air temperatures. Differences in interseasonal pattern between stations reflect to a high degree to what extent the stations are affected by local agricultural sources.
Table 4 shows the annual mean ammonia concentrations for the different sites in 2016. The annual mean ammonia concentrations in 2016 exceed the critical levels for the mosses and lichens (1 µg m−3) at the High Bog site Storelung and the Idom Hede (Heath) site. For the Dry Grassland sites, the Åtte Bjerge and Langdal sites are at the level of or slightly below critical level for mosses and lichens. For Åtte Bjerge and Langdal the levels are slightly below the lower bound for the critical levels for higher plants (2–4 µg m−3). For all other sites, the concentrations are in compliance with the critical levels.
The nature stations provide crucial information about ammonia loads and levels at selected nature spots. These measurements are then supplemented by high resolution model calculations on 400 m × 400 m resolution of ammonia dry deposition (see example in Figure 9). Ammonia is the largest contributor to local variation of the total nitrogen deposition. For these calculations, the emission inventory consists of area sources in a grid of 400 m × 400 m and point sources for the individual animal houses and stores. High spatial resolution is necessary, since previous studies have shown that about 20% of the emitted ammonia deposits within about 2 km from the source [19,38]. The hotspots in Figure 9 occur when point sources are positioned close to the receptors in the grid. In the report of the monitoring program for 2016, DAMOS/OML-DEP calculations were performed for a sub-set of selected nature areas. In the future, this method will be applied for a total mapping of all Danish nature areas. The calculations will be performed for about 1200 overlapping domains using individual DEHM background input and only data for the central parts of the domains will be employed.

4. Conclusions

The Danish Air Quality Monitoring Program integrates measurements and model calculations to map and follow trends in atmospheric nitrogen loads and levels. Measurements are performed at eight larger fixed-site stations with detailed measurements, and at 12 nature stations with ammonia measurements. The measurements are used to study actual levels and depositions, trends, and seasonal variation, for validation of the models, as well as for source apportionments using receptor models. Model calculations are used for source apportionments and to extrapolate data from the measurement sites to the entire country. The models are carefully validated by comparisons to observations from European and Danish monitoring sites.
Trends in observed nitrogen deposition to Danish terrestrial and marine areas are in line with Danish and European nitrogen emission inventories. Reductions in emissions mean that atmospheric nitrogen depositions have decreased by 35% from 1990 to 2016. The decrease was most pronounced in the beginning of this period. Measured ammonia concentrations at Danish nature stations have shown no significant change for the past decade. The differences in seasonal variation in ammonia concentrations at the various stations reflects distances to local agricultural sources. Due to the Danish regulation, manure application is restricted to growth season, which is reflected in ammonia concentrations. Both measurements and model calculations show a variation in nitrogen deposition of a factor of two over the country. The highest ammonia concentrations and nitrogen depositions are found in the South-Western parts of the country where the most intense agricultural activities are found. Furthermore, the Western part of the country receives more precipitation compared with the Eastern part of the country, which leads to higher wet deposition of nitrogen.
The atmospheric nitrogen deposition to Danish marine waters (105,000 km2) is calculated to 73,000 tons N (average deposition 6.9 kg N/ha) and for the terrestrial areas (43,000 km2) to 57,000 tons N (average deposition 13 kg N/ha) in 2016. Wet deposition is generally the highest contributor; especially to Danish marine waters where it may constitute 70 to 90%. Very close to agricultural sources, dry deposition may strongly dominate the deposition. Local scale model calculations show that about 20% of the emitted ammonia deposits within about 2 km from the source. The local agriculture thus mainly affect nature located within close vicinity of farms. Sensitive Danish terrestrial nature includes High Bog and Lobelia Lakes with critical loads of 5 to 10 kg N/ha/year, as well as Dunes and Heath with critical loads of 10 to 25 kg N/ha/year. The average nitrogen deposition onto Danish land areas is about 13 kg N/ha/year, and therefore the sensitive parts of Danish nature is under pressure. Over the areas in South-Western Denmark, calculations show that the contribution from Danish sources may be even up to 45% of the deposition.

Author Contributions

T.E.: The overall responsible for the Danish air quality monitoring program. T.E. has been in charge also of the interpretation of the results from the program. J.N.: Responsible for parts of the laboratory analyses and the parts of the QA/QS in the monitoring program. J.N. contributed to the interpretation of results and commenting the manuscript. J.H.C.: Responsible for the regional to long-range transport model calculations in the monitoring program. J.H.C. contributed to the interpretation of results and commenting the manuscript. P.L.: Responsible for the local range transport model calculations in the monitoring program. P.L. contributed to the interpretation of results and commenting the manuscript. C.G.: Contributed to the local to long-range transport model calculations in the monitoring program. C.G. contributed to the interpretation of results and commenting the manuscript. I.E.N.: Contributed to the laboratory analyses. I.E.N. contributed to the interpretation of results and commenting the manuscript. M.B.P.: Contributed to the laboratory analyses. M.B.P. contributed to the interpretation of results and commenting the manuscript. C.M.: Responsible for parts of the laboratory analyses and the parts of the QA/QS in the monitoring program. C.M. contributed to the interpretation of results and commenting the manuscript. S.G.: Responsible for the agricultural nitrogen emission inventories. S.G. contributed to the interpretation of results and commenting the manuscript. J.B.: Overall responsible for the chemistry-transport modelling within the monitoring program. J.B. contributed to the interpretation of results and commenting the manuscript. O.H. wrote the paper and contribute to daily quality control and management.

Acknowledgments

This paper presents measurements and model calculations produced within the Danish Air Quality Monitoring Program under the Danish Monitoring Program for Water and Nature (NOVANA). This monitoring program is funded by the Danish Environment and Food Ministry.

Conflicts of Interest

The authors declare no conflict of interest.

References

  1. Nilsson, J.; Grennfelt, P. Critical Loads for Sulphur and Nitrogen; Nordic Council of Ministers: Skokloster, Sweden, 1988; 488p. [Google Scholar]
  2. Bobbink, R.; Hicks, K.; Galloway, J.; Spranger, T.; Alkemade, R.; Ashmore, M.; Bustamante, M.; Cinderby, S.; Davidson, E.; Dentener, F.; et al. Global assessment of nitrogen deposition effects on terrestrial plant diversity: A synthesis. Ecol. Appl. 2010, 20, 30–59. [Google Scholar] [CrossRef] [PubMed] [Green Version]
  3. Stevens, C.J.; Dupre, C.; Dorland, E.; Gaudnik, C.; Gowing, D.J.G.; Bleeker, A.; Diekmann, M.; Alard, D.; Bobbink, R.; Fowler, D.; et al. Nitrogen deposition threatens species richness of grasslands across Europe. Environ. Pollut. 2010, 158, 2940–2945. [Google Scholar] [CrossRef] [PubMed] [Green Version]
  4. Maskell, L.C.; Smart, S.M.; Bullock, J.M.; Thompson, K.; Stevens, C.J. Nitrogen deposition causes widespread loss of species richness in British habitats. Glob. Chang. Boil. 2010, 16, 671–679. [Google Scholar] [CrossRef]
  5. Sutton, M.A.; Howard, C.M.; Erisman, J.W.; Billen, G.; Bleeker, A.; Greenfelt, P.; Grinsven, H.V.; Grizzetti, B. The European Nitrogen Assessment—Sources, Effects and Policy Perspectives; Cambridge CB2 8RU; Cambridge University Press: Edinburgh, UK, 2011; p. 612. [Google Scholar]
  6. Sutton, M.A.; Oenema, O.; Erisman, J.W.; Leip, A.; van Grinsven, H.; Winiwarter, W. Too much of a good thing. Nature 2011, 472, 159–161. [Google Scholar] [CrossRef] [PubMed]
  7. Danish Government. The Danish Aquatic Action Plan III. 2004. Available online: http://www.vmp3.dk/Files/Filer/English%20version/engelsk_oversaettelse.pdf (accessed on 14 November 2018).
  8. EEA. The European Environment—State and Outlook 2015: Synthesis Report; Publications Office of the European Union, The European Environment Agency: Luxembourg, 2015; p. 212. [Google Scholar]
  9. Dalgaard, T.; Hansen, B.; Hasler, B.; Hertel, O.; Hutchings, N.J.; Jacobsen, B.H.; Jensen, L.S.; Kronvang, B.; Olesen, J.E.; Schjorring, J.K.; et al. Policies for agricultural nitrogen management-trends, challenges and prospects for improved efficiency in Denmark. Environ. Res. Lett. 2014, 9, 115002. [Google Scholar] [CrossRef]
  10. Hertel, O.; Ellermann, T.; Palmgren, F.; Berkowicz, R.; Løfstrøm, P.; Frohn, L.M.; Geels, C.; Skjøth, C.A.; Brandt, J.; Christensen, J.; et al. Integrated air-quality monitoring—Combined use of measurements and models in monitoring programmes. Environ. Chem. 2007, 4, 65–74. [Google Scholar] [CrossRef]
  11. Nielsen, I.E.; Eriksson, A.C.; Lindgren, R.; Martinsson, J.; Nystrom, R.; Nordin, E.Z.; Sadiktsis, I.; Boman, C.; Nojgaard, J.K.; Pagels, J. Time-resolved analysis of particle emissions from residential biomass combustion Emissions of refractory black carbon, PAHs and organic tracers. Atmos. Environ. 2017, 165, 179–190. [Google Scholar] [CrossRef]
  12. Erisman, J.W.; Mennen, M.G.; Fowler, D.; Flechard, C.R.; Spindler, G.; Gruner, A.; Duyzer, J.H.; Ruigrok, W.; Wyers, G.P. Deposition monitoring in Europe. Environ. Monit. Assess. 1998, 53, 279–295. [Google Scholar] [CrossRef]
  13. Geels, C.; Andersen, H.V.; Skjoth, C.A.; Christensen, J.H.; Ellermann, T.; Lofstrom, P.; Gyldenkaerne, S.; Brandt, J.; Hansen, K.M.; Frohn, L.M.; et al. Improved modelling of atmospheric ammonia over Denmark using the coupled modelling system DAMOS. Biogeosciences 2012, 9, 2625–2647. [Google Scholar] [CrossRef] [Green Version]
  14. Hertel, O.; Geels, C.; Frohn, L.M.; Ellermann, T.; Skjoth, C.A.; Lostrom, P.; Christensen, J.H.; Andersen, H.V.; Peel, R.G. Assessing atmospheric nitrogen deposition to natural and semi-natural ecosystems—Experience from Danish studies using the DAMOS. Atmos. Environ. 2013, 66, 151–160. [Google Scholar] [CrossRef]
  15. Christensen, J.H. The Danish Eulerian hemispheric model—A three-dimensional air pollution model used for the Arctic. Atmos. Environ. 1997, 31, 4169–4191. [Google Scholar] [CrossRef]
  16. Frohn, L.M.; Christensen, J.H.; Brandt, J. Development and testing of numerical methods for two-way nested air pollution modelling. Phys. Chem. Earth 2002, 27, 1487–1494. [Google Scholar] [CrossRef]
  17. Brandt, J.; Silver, J.D.; Frohn, L.M.; Geels, C.; Gross, A.; Hansen, A.B.; Hansen, K.M.; Hedegaard, G.B.; Skjoth, C.A.; Villadsen, H.; et al. An integrated model study for Europe and North America using the Danish Eulerian Hemispheric Model with focus on intercontinental transport of air pollution. Atmos. Environ. 2012, 53, 156–176. [Google Scholar] [CrossRef]
  18. Olesen, H.R.; Berkowicz, R.; Løfstrøm, P. OML: Review of Model Formulation; NERI: Roskilde, Denmark, 2007; p. 130. [Google Scholar]
  19. Hertel, O.; Skjøth, C.A.; Løfstrøm, P.; Geels, C.; Frohn, L.M.; Ellermann, T.; Madsen, P.V. Modelling Nitrogen Deposition on a Local Scale—A Review of the Current State of the Art. Environ. Chem. 2006, 3, 317–337. [Google Scholar] [CrossRef]
  20. Skjøth, C.A.; Geels, C.; Berge, H.; Gyldenkærne, S.; Fagerli, H.; Ellermann, T.; Frohn, L.M.; Christensen, J.; Hansen, K.M.; Hansen, K.; et al. Spatial and temporal variations in ammonia emissions—A freely accessible model code for Europe. Atmos. Chem. Phys. 2011, 11, 5221–5236. [Google Scholar] [CrossRef] [Green Version]
  21. Gyldenkærne, S.; Skjøth, C.A.; Hertel, O.; Ellermann, T. A dynamical ammonia emission parameterization for use in air pollution models. J. Geophys. Res.-Atmos. 2005, 110, D7. [Google Scholar] [CrossRef]
  22. Skjøth, C.A.; Hertel, O.; Gyldenkærne, S.; Ellermann, T. Implementing a dynamical ammonia emission parameterization in the large-scale air pollution model ACDEP. J. Geophys. Res.-Atmos. 2004, 109, D6. [Google Scholar] [CrossRef]
  23. Fagerli, H.; Hertel, O.; Skjøth, C.A.; Gyldenkærne, S.; Hutchings, N. Implementation of a dynamical ammonia emission parameterization in the regional unified EMEP chemical transport model. In Proceedings of the Fourth Nitrogen Conference (N-2007), Costa do Sauípe, Brazil, 1–5 October 2007. [Google Scholar]
  24. Simpson, D.; Fagerli, H.; Jonson, J.E.; Tsyro, S.; Wind, P. Transboundary Acidification, Eutrophication and Ground Level Ozone in Europe, PART I, Unified EMEP Model Description; Norwegian Meteorological Institute: Oslo, Norway, 2003; pp. 1–104. [Google Scholar]
  25. Grell, G.A.; Dudhia, J.; Stauffer, D.R. A Description of the Fifth-Generation Penn State/NCAR Mesoscale Model (MM5); NCAR: Boulder, CO, USA, 1995. [Google Scholar]
  26. Brandt, J.; Christensen, J.H.; Frohn, L.M.; Berkowicz, R. Operational air pollution forecasts from regional scale to urban street scale. Part 1: System description. Phys. Chem. Earth Part B-Hydrol. Oceans Atmos. 2001, 26, 781–786. [Google Scholar] [CrossRef]
  27. Brandt, J.; Christensen, J.; Frohn, L.; Berkowicz, R.; Palmgren, F. The DMU-ATMI THOR Air Pollution Forecast System; Technical Report No 321; System Description: Roskilde, Denmark, 2000. [Google Scholar]
  28. Hertel, O.; Skjoth, C.A.; Frohn, L.M.; Vignati, E.; Frydendall, J.; de Leeuw, G.; Schwarz, U.; Reis, S. Assessment of the atmospheric nitrogen and sulphur inputs into the North Sea using a Lagrangian model. Phys. Chem. Earth 2002, 27, 1507–1515. [Google Scholar] [CrossRef]
  29. Nielsen, O.K.; Plejdrup, M.S.; Winther, M.; Mikkelsen, M.H.; Nielsen, M.; Gyldenkærne, S.; Fauser, P.; Albrektsen, R.; Hjelgaard, K.; Bruun, H.G.; et al. Annual Danish Informative Inventory Report to UNECE. Emission Inventories from the Year of the Protocols to Year 2015; Aarhus University: Aarhus, Denmark, 2017; 475p. [Google Scholar]
  30. Olesen, H.R.; Winther, M.; Ellermann, T.; Christensen, J.H.; Plejdrup, M.S. Ship Emissions and Air Pollution in Denmark: Present Situation and Future Scenarios; Danish Environmental Protection Agency: København, Denmark, 2009; 137p. [Google Scholar]
  31. Sommer, S.G.; Østergård, H.S.; Løfstrøm, P.; Andersen, H.V.; Jensen, L.S. Validation of model calculation of ammonia deposition in the neighbourhood of a poultry farm using measured NH3 concentrations and N deposition. Atmos. Environ. 2009, 43, 915–920. [Google Scholar] [CrossRef]
  32. Geels, C.; Ellermann, T.; Frohn, L.; Løfstrøm, P.; Christensen, J.H.; Hertel, O.; Gyldenkærne, S.; Skjøth, C.A.; Brandt, J.; Andersen, H.V.; et al. A coupled model system (DAMOS) improves the accuracy of simulated atmospheric ammonia levels over Denmark. Biogeosciences 2012, 9, 2625–2647. [Google Scholar] [CrossRef] [Green Version]
  33. UNECE. Empirical Critical Loads for Nitrogen—Expert Workshop, Berne, 11–13 November 2002; Environmental Documentation No. 164; UNECE: Geneva, Switzerland, 2003; p. 327. [Google Scholar]
  34. Klein, H.; Gauss, M.; Nyiri, A.; Benedictow, A. Transboundary Air Pollution by Main Pollutants (S, N, O3) and PM—Denmark; Norwegian Meteorological Institute: Oslo, Norway, 2018. [Google Scholar]
  35. Fagerli, H.; Tsyro, S.; Jonson, J.E.; Nyiri, A.; Gauss, M.; Simpson, D.; Wind, P.; Benedictow, A.; Valdebenito, A.; Klein, H.; et al. Transboundary Particulate Matter, Photo-Oxidants, Acidifying and Euthrophying Components; Norwegian Meteorological Institute: Oslo, Norway, 2018; p. 204. [Google Scholar]
  36. Cappelen, J.; Jørgensen, B.V. Danish Weather Since 1974—Month by Month with Temperature, Precipitation and Sun Hjours as Well as A Descrkiption of the Weather (In Danish: “Dansk vejr siden 1874—måned for måned med temperatur, nedbør og soltimer samt beskrivelser af vejret”); Danish Meteorological Institute: Copenhagen, Denmark, 2008; p. 10. [Google Scholar]
  37. Fowler, D.; Muller, J.; Smith, R.I.; Cape, J.N.; Erisman, J.W. Nonlinearities in source receptor relationships for sulfur and nitrogen compounds. Ambio 2005, 34, 41–46. [Google Scholar] [CrossRef] [PubMed]
  38. Schou, J.S.; Tybirk, K.; Løfstrøm, P.; Hertel, O. Economic and environmental analysis of buffer zones as an instrument to reduce ammonia loads to nature areas. Land Use Policy 2006, 23, 533–541. [Google Scholar] [CrossRef]
Figure 1. Location of the measurement stations in Denmark under the monitoring program in 2016. The map shows the location of both the larger monitoring stations and location and nature type for the specific nature stations.
Atmosphere 09 00447 g001
Figure 2. Atmospheric nitrogen deposition (kg N/ha/year) and precipitation amounts at the monitoring stations for the year 2016. The data in the plot represents deposition to the average surface around the monitoring station. Results from Tange are based on a combination of measurements from Tange and Sepstrup Sande (32.1 km away). Dry deposition estimates are not available for Lindet and Keldsnor, since ambient air concentrations are no longer measured at these sites.
Atmosphere 09 00447 g002
Figure 3. Comparison of annual nitrogen deposition to marine and terrestrial monitoring sites over the years 1989 to 2016. Model calculations are from the DEHM. Trends in deposition to land surfaces are calculated as average values for Anholt, Tange and Ulborg during the period up until 2010. After 2010, Risø has been included in the trend. The deposition to marine waters is based on data from the two coastal stations Anholt and Keldsnor.
Atmosphere 09 00447 g003
Figure 4. The total atmospheric nitrogen deposition computed using DEHM for 2016. Depositions represent an average for the grid cell. For grid cells with both land and sea surfaces, the data reflect an average surface of the two. Depositions are given in kg N/ha/year. Grid cells are of 6 km × 6 km except for the outer domain where the grid cells are of 17 km × 17 km.
Atmosphere 09 00447 g004
Figure 5. Trends in the measured total atmospheric nitrogen deposition to Danish marine waters (top) and Danish terrestrial areas (bottom). Together with the trends in depositions, also trends in Danish (yellow) and European (red) nitrogen emissions are shown in the two plots. All values are indexed to 100 in 1990. Trends in deposition to land surfaces are calculated as average values for Anholt, Tange and Ulborg during the period up to 2010. After 2010, Risø has been included in the trend. Deposition to marine waters is based on data from the two coastal stations Anholt and Keldsnor. Since 2010, the dry deposition for Keldsnor is estimated based on weekly denuder measurements. Missing values are estimated based on comparisons with other stations. The emission inventory for Denmark has been produced by DCE (Nielsen et al., 2017) and for the EU countries the inventories from EMEP have been applied in the comparison of trends (http://www.ceip.at/ms/ceip_home1/ceip_home/webdab_emepdatabase).
Atmosphere 09 00447 g005
Figure 6. Weekly mean measurements of ammonia and ammonium in 2016.
Atmosphere 09 00447 g006
Figure 7. Half-monthly concentrations of ammonia at Ulborg during the period 2004 to 2016.
Atmosphere 09 00447 g007
Figure 8. Ammonia concentrations in the year 2016 at a series of nature sites in Denmark. Measurements are monthly mean values marked for the middle of the measurement period. Upper plot: Heath (Idom Hede: monthly mean values are derived from aggregating half-monthly values). Middle plot: High Bog and Quaking Bogs, Lower plot: Dry Grassland.
Atmosphere 09 00447 g008
Figure 9. Example of calculated atmospheric ammonia dry deposition (kg NH3-N/ha) in 2016 using the OML-DEP under the DAMOS system. Calculations of ammonia dry depositions are performed on 400 m × 400 m resolution for a 16 km × 16 km domain using upwind DEHM results as initial concentration. The figure shows a map for Lønborg Hede (located in the center of the map) near the west coast of Jutland (in Universal Transverse Mercator (UTM) coordinates, zone 32). On this map iso-deposition curves are drawn on basis of the modelled deposition data. Iso-lines are not drawn close to the domain border due to less accuracy.
Atmosphere 09 00447 g009
Table 1. Applied measurement methods for the fixed-site rural monitoring stations in the Danish Air Quality Monitoring Program.
Monitoring StationWet Deposition ***Gas and Particles *
AnholtNitrate and ammoniumFilterpack, NOX monitor, Denuder
KeldsnorNitrate and ammoniumNOX monitor, Denuder
Lille Valby/Risø **Nitrate and ammoniumFilterpack, NOX monitor, Denuder, Passive sampler
LindetNitrate and ammoniumPassive sampler
PederskerNitrate and ammonium
Sepstrup Sande ****Nitrate and ammonium
Tange Filterpack
UlborgNitrate and ammoniumFilterpack, NOX monitor, Denuder, Passive sampler
* Filterpack (diurnal): NH3, and particulate NH4+ and NO3. Denuder (weekly, bi-weekly, or monthly): NH3, HNO3 and particulate NH4+ and NO3. Passive sampler (monthly): NH3; ** In July 2010, the monitoring station at Lille Valby was moved 2 km West to Risø campus. Additional measurements were added in connection with the move; *** Wet deposition is made by bulk sampler as bi-weekly samples; **** Sepstrup Sande is located on 32.1 km from Tange and these two are considered as one station.
Table 2. The total atmospheric nitrogen deposition to Danish marine waters calculated using DEHM for 2016. The table includes the Swedish parts of the Kattegat Strait and the Baltic.
Main WaterDry Deposition (ktons N)Wet Deposition (ktons N)Total Deposition (ktons N)Total Deposition/Area (kg N/ha)Area
(km2)
North Sea DK6.526336.748,754
Skagerrak DK1.15.66.86.510,329
Kattegat SE0.83.74.46.66743
Kattegat DK2.79.2127.116,830
Northern Belt0.72.33.07.73909
Little Belt0.71.72.4112171
Great Belt1.03.04.08.94519
Øresund DK0.20.81.07.31336
Øresund SE0.10.60.77.3950
Southern Belt0.61.72.39.12547
Baltic2.27.09.26.214,926
Total Marine1657736.9105,321
Table 3. The total atmospheric nitrogen deposition to Danish land regions calculated for 2016.
RegionDry Deposition (ktons N)Wet Deposition (ktons N)Total Deposition (ktons N)Total Deposition/Area (kg N/ha)Area
(km2)
Northern Jutland4.45.29.7127907
Central Jutland7.89.8181313,093
Southern DK8.410181512,130
Zealand3.64.78.3117268
Capital area1.31.52.8112567
Entire country2631571342,927
Table 4. Annual mean ammonia concentrations in 2016 for several sites and the nature type for the site. The figures given at the nature type are the Natura 2000 classification numbers.
SiteNature TypeAnnual Mean Ammonia Concentration (µg m−3)
Langdal (Eastern Jutland)Dry Grassland (6230)1.8
Åtte Bjerge (Southern Jutland)Dry Grassland (6230)1.6
Idom Hede (Western Jutland)Dry Heath (4030)1.2
Storelung (Funen)High Bog (7110)1.1
Lille Vilmose (Himmerland)High Bog (7110)0.7
Holmegårds Mose (Southern Zealand)High Bog (7110)0.7
Nymølle Bæk (Northern Jutland)Dry Grassland (6230)0.9
Knurrevang (Southern Zealand)Dry Grassland (6230)1.0
Nybo Mose (Funen)High Bog (7110)0.7
Diesbjerg (Sejerøbugten)Dry Grassland (6230)0.7
Bisgydehøj (Mols Bjerge)Dry Grassland (6230)0.6
Randbøl Hede (Central Jutland)Dry Heath (4030)0.6
Råbjerg Mose (Northern Jutland)Quaking Bogs (7240)0.5
Hammer Bakker (Northern Jutland)Dry Heath (4030)0.6
Pedersker (Bornholm)Dry Heath (4030)0.3

