
Assessment of Chemical Fiber Air Filter for General Ventilation

School of Energy and Safety Engineering, Tianjin Chengjian University, Tianjin 300384, China
*
Author to whom correspondence should be addressed.
†
These authors contributed equally.
Atmosphere 2021, 12(12), 1636; https://doi.org/10.3390/atmos12121636
Submission received: 4 November 2021
/
Revised: 2 December 2021
/
Accepted: 4 December 2021
/
Published: 7 December 2021
(This article belongs to the Special Issue Advances in Integrated Air Quality Management: Emissions, Monitoring, Modelling)
Abstract
:Air filters for general ventilation have mainly been used to control the concentration of indoor particulate matter. In this study, the pressure differential, test dust capacity, quality factor and operating life of class F8 pleat–plate and multi-bag type chemical fiber filters were evaluated using an air filter performance test system. The results showed that the resistance increase rate of multi-bag filter (0.49 Pa/g·(cm/s)) was lower than that of pleat–plate filter (1.94 Pa/g·(cm/s)), the quality factor of the multi-bag filter was lower than that of pleat–plate filter, and the dust capacity of the multi-bag filter was much higher than that of the pleat–plate filter. The operating life of the multi-bag filter was 8 times as that of the pleat–plate filter with the measured PM2.5 of outdoor. The energy consumption of the pleat–plate filter was 2.2 times that of the multi-bag filter. Analyzing the electron microscope photos after dust loading, the dust depth of pleat–plate filter into filter material was thinner than that of multi-bag filter. The research results could provide data support for the design optimization and selection of ventilation filters and the treatment of the particulate matter in indoor environments.
1. Introduction
Recently, fine particles have become one of the main pollutants affecting the quality of the indoor and outdoor environment. Field results have shown that about 55–75% of indoor particulate matter comes from outdoor sources [1,2]. Inhaling air contaminated with particulate matter is very harmful to human health. Air filters for general ventilation are the main method to control particulate matter and improve indoor air quality.
The key factor affecting the application of air filters is the performance of the filters. A few studies have researched the influence of fiber structure, particle characteristics and structural parameters on the performance of air filters. [3,4,5,6,7]. Additionally, a study has reported that the filtration efficiency of class F7 multi-bag filters was different during the test process due to the electrostatic effect [8]. Compared with electrostatic filters, the efficiency of new filters has gradually increased, offering greater filtration areas, until finally reaching a maximum value following which there have been no changes [9]. In addition, some studies have concluded that the larger pleat density of the filter materials could lead to a decrease in pleat spacing and an uneven distribution of air flow, while increased filter resistance has also led to a sharp decrease in dust capacity [10,11]. A preliminary simulation provided a theoretical basis for the modified fiber filters, and acts as a reference for improving the performance of air filters [11]. In addition, an optimal fold number was determined for a filter of a certain size in order to minimize filtration resistance [12]. Additionally, the filter efficiency and pressure drop performance were affected by the diameter, orientation, and distribution of the fibers in an experimental study [13]. With respect to the operating life of filters, a study was carried out on high-efficiency air filters, and a life prediction model was developed [14]. Some researchers have discussed the benefits of using a consistent testing method to characterize the aerodynamic and energy performance of FFU, and a method has been proposed for evaluating the lab-measured performance of relatively new fan filter units (FFUs) [15].
To date, many studies have focused on the performance evaluation of high-efficiency filters [14,16], which entail high cost, higher energy consumption, and difficult maintenance. With outdoor pollution such as haze and indoor air quality requirements, it is necessary to evaluate the performance of air filters for ventilation. Class F medium-efficiency filters are the most commonly used filters in combined air conditioning units to remove indoor particles and ensure indoor air quality [8]. In the literature, the influence of fiber structure, particle characteristics, and structural parameters on pressure drop and efficiency of air filters for ventilation have been studied individually. However, a comprehensive assessment of ventilation filters is still lacking. The aims of this study were: (1) assessment of the performance (the resistance, dust capacity, quality factor, energy consumption) of class F8 multi-bag and pleat–plate chemical fiber air filters; and (2) development of a calculation method to predict the operating life of air filters for general ventilation in the actual environment.
2. Materials and Methods
2.1. Selection of the Tested Air Filter
Two class F8 chemical fiber filters (a multi-bag and a pleat–plate one) were selected as the tested filters, and their basic information is shown in Table 1. The different structures (8 bags and 130 pleats) of the selected filters yielded in filtration areas from 6.6 to 7.1 m2. The initial resistances (Pa) of the filters (pressure difference across the filter) were 110 Pa (multi-bag type) and 190 Pa (pleat–plate type), respectively. The air flow rate of the tested filters was 3400 m3/h (13.3 cm/s, converted into the filtration speed of the filter medium).
2.2. Performance Testing System
The filtration parameters (including air volume, resistance, number efficiency, gravimetric efficiency, and dust capacity) of the air filter under investigation were tested by the experimental system, based on field studies [14,17]. The main components of the test system are shown in Figure 1. This filter test system mainly consisted of a fan box, nozzle box, aerosol generation port, artificial dust generation, particle sampling, and resistance test components. The air volume of this test system was measured by a pressure sensor connected to the nozzle.
In the dust holding stage, ground A2 dust (the particle size of the A2 dust was in the range 1–120 μm) [18] was used as the load duster at a uniform speed, and was blown along with the system air duct (30 g dust test) [17]. A laser particle counter (TSI 9306, USA) with an isokinetic sampling probe was selected as the particle measurement instrument.
The testing process was as follows: firstly, the air flow resistance of the filter was tested at test air volumes of 50%, 75%, 100% and 125% of the rated air volume, respectively [17]. Then, the concentrations of the upstream and downstream particles recorded by the data recording system were tested automatically. Finally, the efficiency was calculated based on the gravimetric efficiency [17]. The gravimetric efficiency (Aj) in the dust holding stage of “j” was calculated by Equation (1).
mj is the mass of dust passing through the filter during the dust holding stage “j” (mj is the sum of mass increment of final filter and dust accumulation in air duct behind tested filter); Mj represents the dust mass (dust increment) of the dust holding stage “j”.
2.3. Experiments of Test Dust Capacity
At first, the dust placed in the dust feeding tray with an accuracy of ±1 g in each dust increment was sent to the filter at a concentration of 70 mg/m3 until the filter resistance reached the final resistance value of the predetermined stage. Then the feeder tube was oscillated or taped for 30 s. Then, the end filter was weighed (accuracy to 0.5 g) and the weight of the collected artificial dust was determined. Finally, all the dust in the duct between the tested filter and the final stage filter was collected with a fine brush, and summed into the weight of the final stage filter using Equation (1).
2.4. Performance Evaluation
The quality factor of the filter () [19] was calculated using Equation (2),
where is the efficiency of the filter under the rated air volume is the air flow resistance under the rated air volume (Pa).
Energy consumption was the key index for measuring the performance of the filter, and affects the cost during the filter’s usage period. For general ventilation filters, energy consumption (W) was defined using Equation (3) [20]:
where W is the total energy consumption for the operating life of the filter, is the rated air volume of the filter, is the fan efficiency, and 50% is taken as the average efficiency of the fan in the HVAC system. The variable t represents the total service time of the filter, and is the calculated resistance during the operation of the filter.
The operating life of the filter is closely related to service conditions, such as efficiency, outdoor particle concentration, dust capacity, and resistance. The operating life of the filter was calculated using Equation (4).
where is the operating life of the tested filter, is the rated air volume of the filter, represents the gravimetric efficiency of the filter, n is the average concentration of outdoor PM2.5, and Mx is related to the experimental results of the filter and obtained by fitting the relationship curve between dust capacity and resistance of the filter [20]. Using the fourth-order formula for fitting, Mx was calculated using Equation (5), where represents the final resistance, which was considered to be two times the initial resistance, and the other parameters were obtained by experiments.
Energy consumption of general ventilation air filters was determined using Equation (3). The average resistance of the filter was determined using Equation (6) [20], which represents the average resistance of the filter during operation.
where a, b, c, and d are the coefficients of the fourth-order fitting curve of the experimental results of the dust capacity of the unused filter, is the initial resistance of the filter, and Mx represents the total dust capacity of the filter’s operating life. There is a fixed dust holding capacity value for filters with different efficiency levels. Corresponding to two filters in this study, Mx was defined as 100 g [20].
The fourth-order relationship between the dust capacity and the resistance of the filter was established [14] using Equation (7), and the relationship between the operation time and the dust capacity of the filter was established using Equation (8) [21]. Then, combining Equations (7) and (8), the relationship between the operating time of the filter and the change rate of the resistance could be obtained.
where and represent the current resistance and the initial resistance of the filter, respectively. The coefficients B1, B2, B3 and B4 represent the equation coefficients of the fourth-order fitting curve, and lnt represents the intercept of the fitting curve (i.e., the initial resistance of the filter). For the filter at run time ΔT, n is the annual average concentration of outdoor PM2.5 (the annual average concentration of outdoor PM2.5 in Tianjin: 47 μg/m3).
3. Results and Discussion
3.1. Performance of the Selected Air Filters
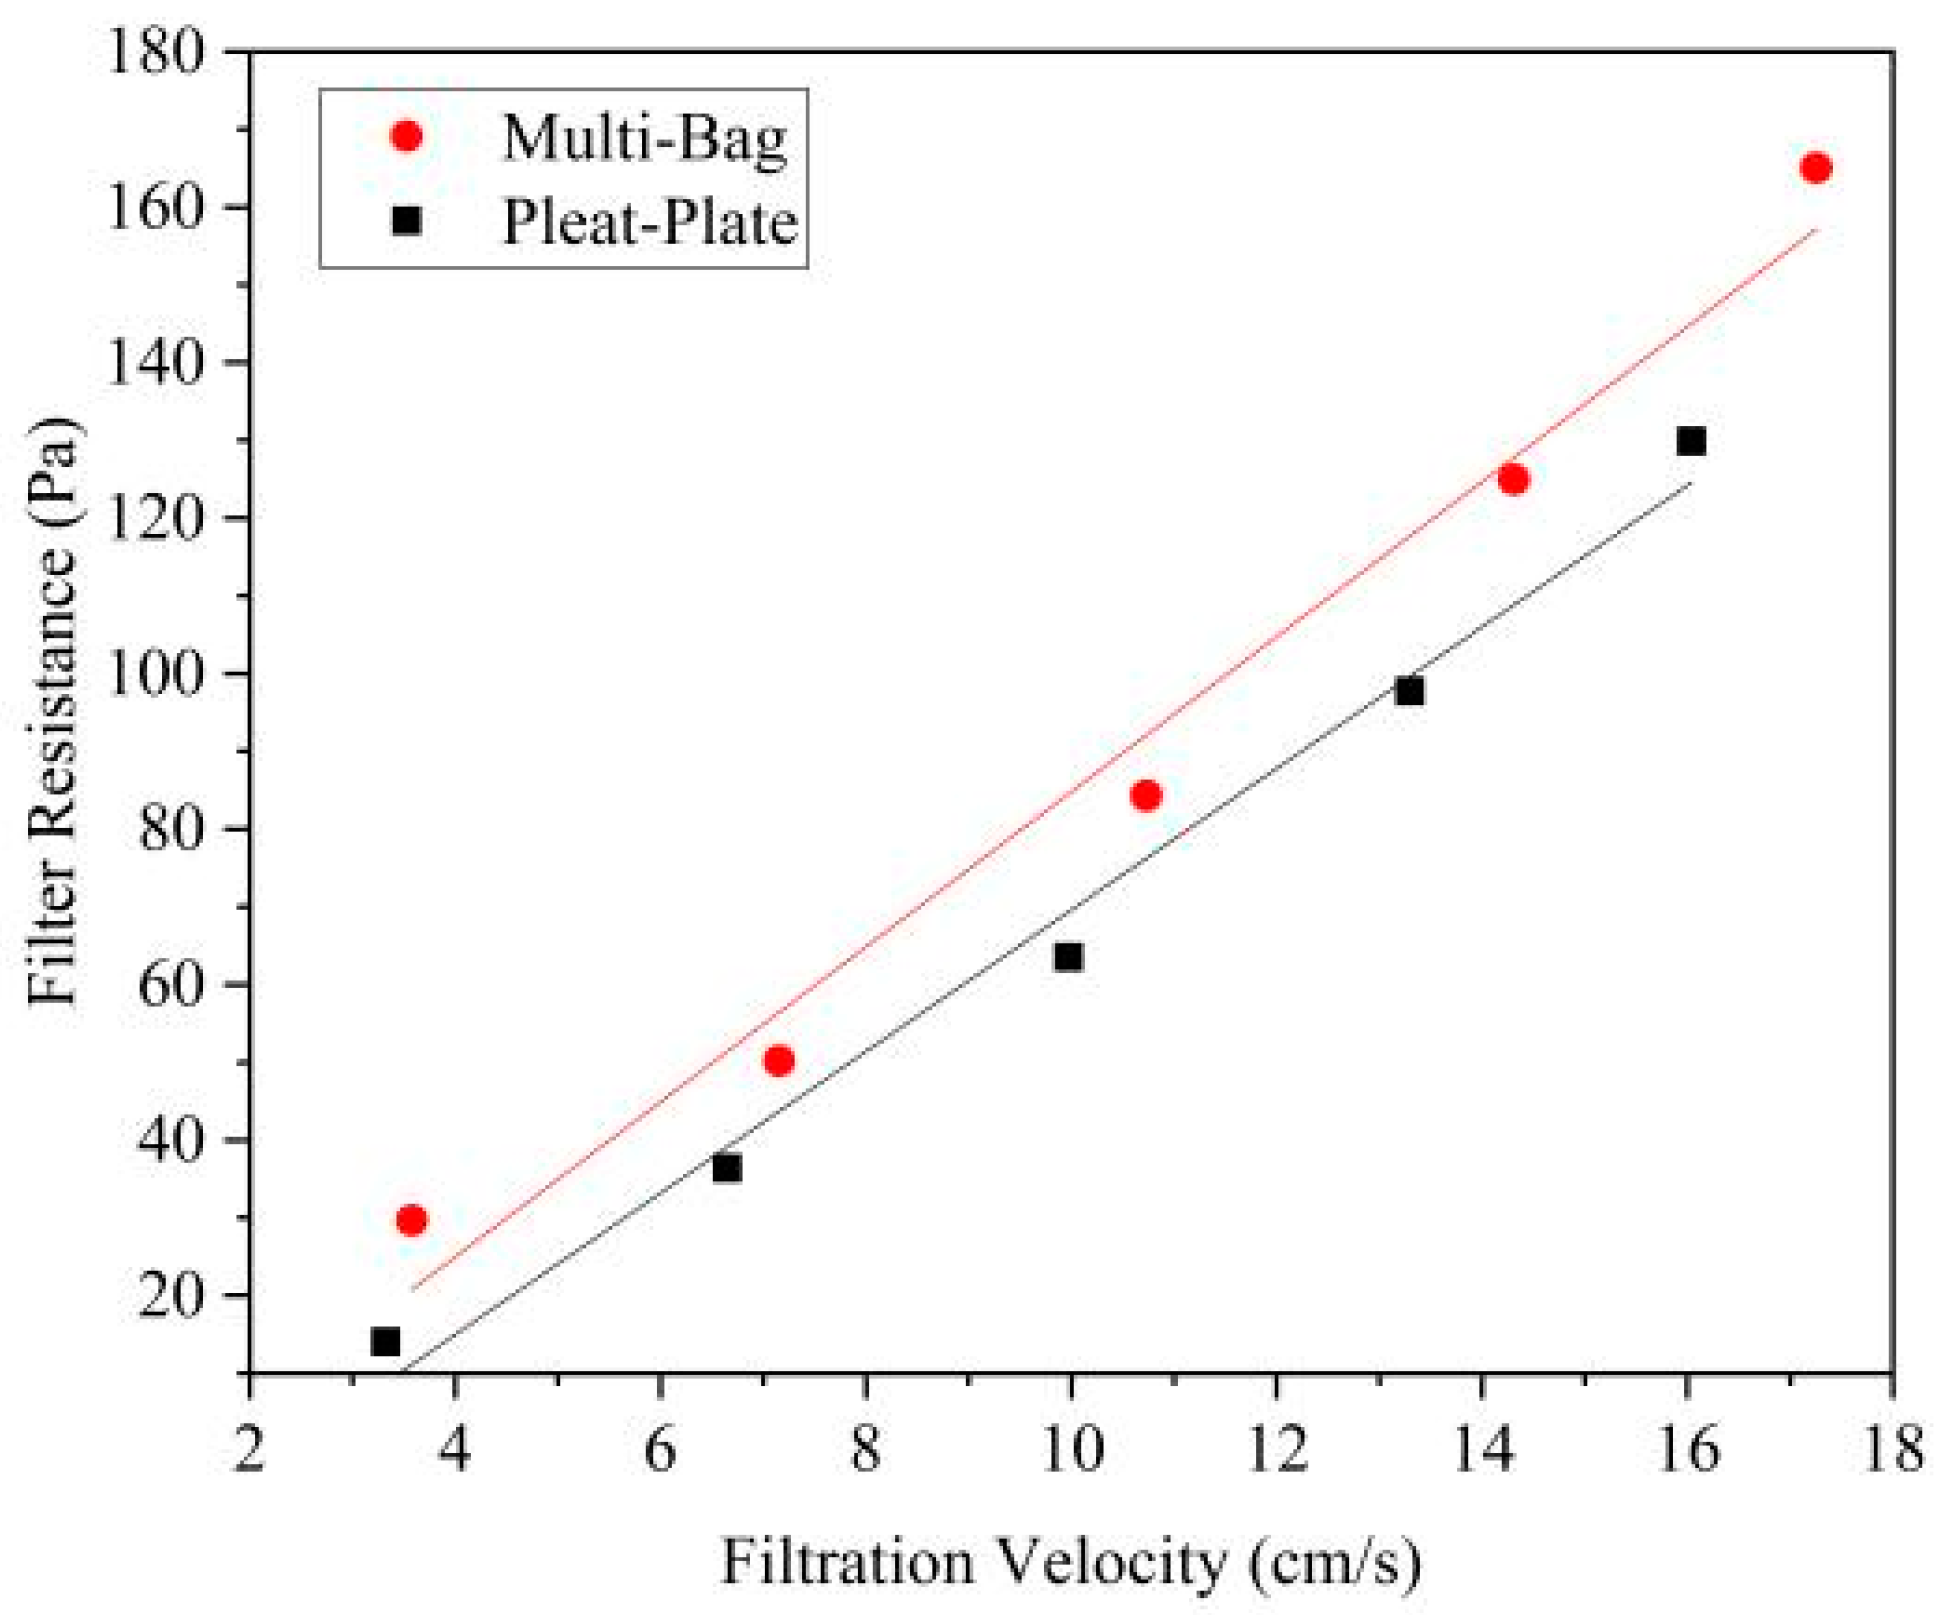
Figure 2 shows the filter resistance under different filtration velocities. The higher the filtration velocity, the greater the resistance in the tested filter, and this is consistent with other studies [22,23]. The resistances of the pleat–plate filter and the multi-bag filter reached 130 Pa and 146 Pa, respectively (Figure 2). The difference in structure between the multi-bag filter and the pleat–plate filter resulted in different initial resistances at different filtration velocities [24,25].
Another study [14] reported that it was not sufficient to consider only the pressure drop and filtration efficiency of the filter when evaluating a filter’s performance. For this reason, quality factor was considered to be adequate as an index of filter performance [26]. Figure 3 shows the Qr of the two tested filters under different air flow rates (850 m3/h, 1700 m3/h, 2550 m3/h, 3400 m3/h, 4100 m3/h). The filtration rate and pressure loss of the bag filter are larger than those of the plate filter, which results in higher Qr values compared to the pleat–plate filter and the multi-bag filter (Figure 3). In addition, the increase in air flow rate resulted in decreased Qr gap for the two tested filters, and similar results were obtained when studying the filtration performance of high-efficiency filters using experiments and mathematical models [27].
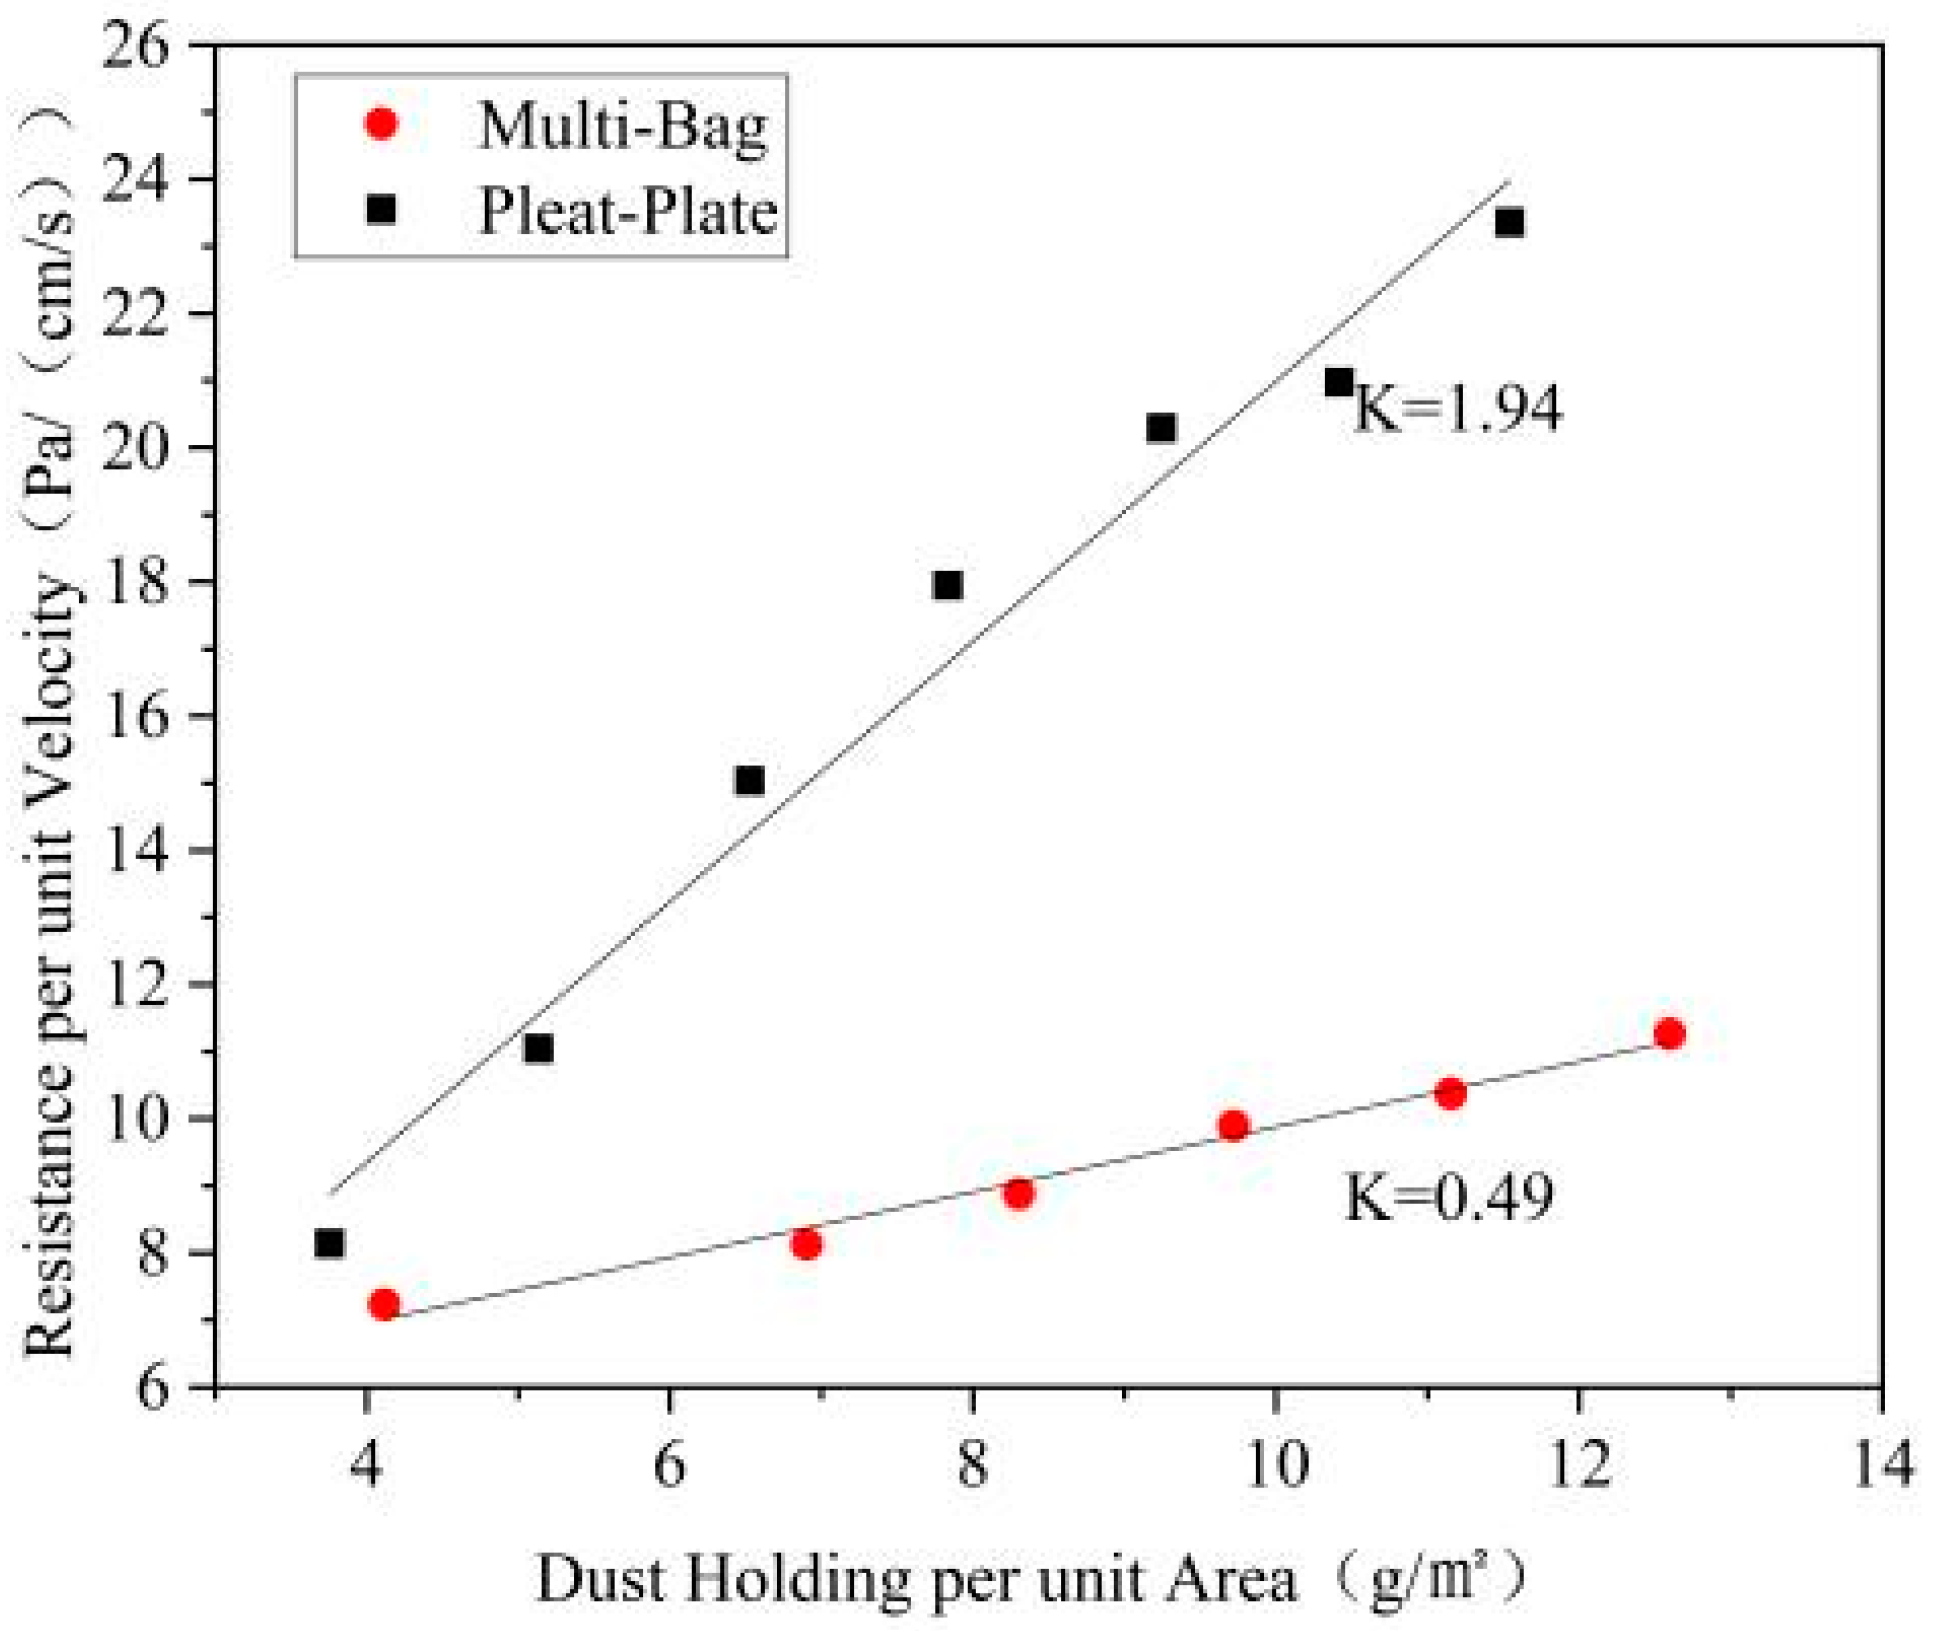
For the tested air filters, the dust capacity is considered to be a key performance indicator for determining the operating life of the filter. Figure 4 shows the relationship between the filter resistance and the dust holding capacity. The flow resistance and dust capacity were normalized according to the filter area and air flow velocity, and polynomial fitting [20] was implemented for the dust capacity per unit area and resistance per unit velocity. In addition, the resistance change of the filters during operation was analyzed. The slope of the fitting curve represents the various rates of filter resistance under the same dust capacity. The rate of resistance increase of the multi-bag filter (0.49 Pa/g·(cm/s)) was significantly lower than that of the pleat–plate filter (1.94 Pa/g·(cm/s)) (Figure 4). This finding implies that the working time of the multi-bag filter is longer before reaching its final resistance for the same given dust capacity. In other words, multi-bag filters have a longer operating life than pleat–plate filters [28].
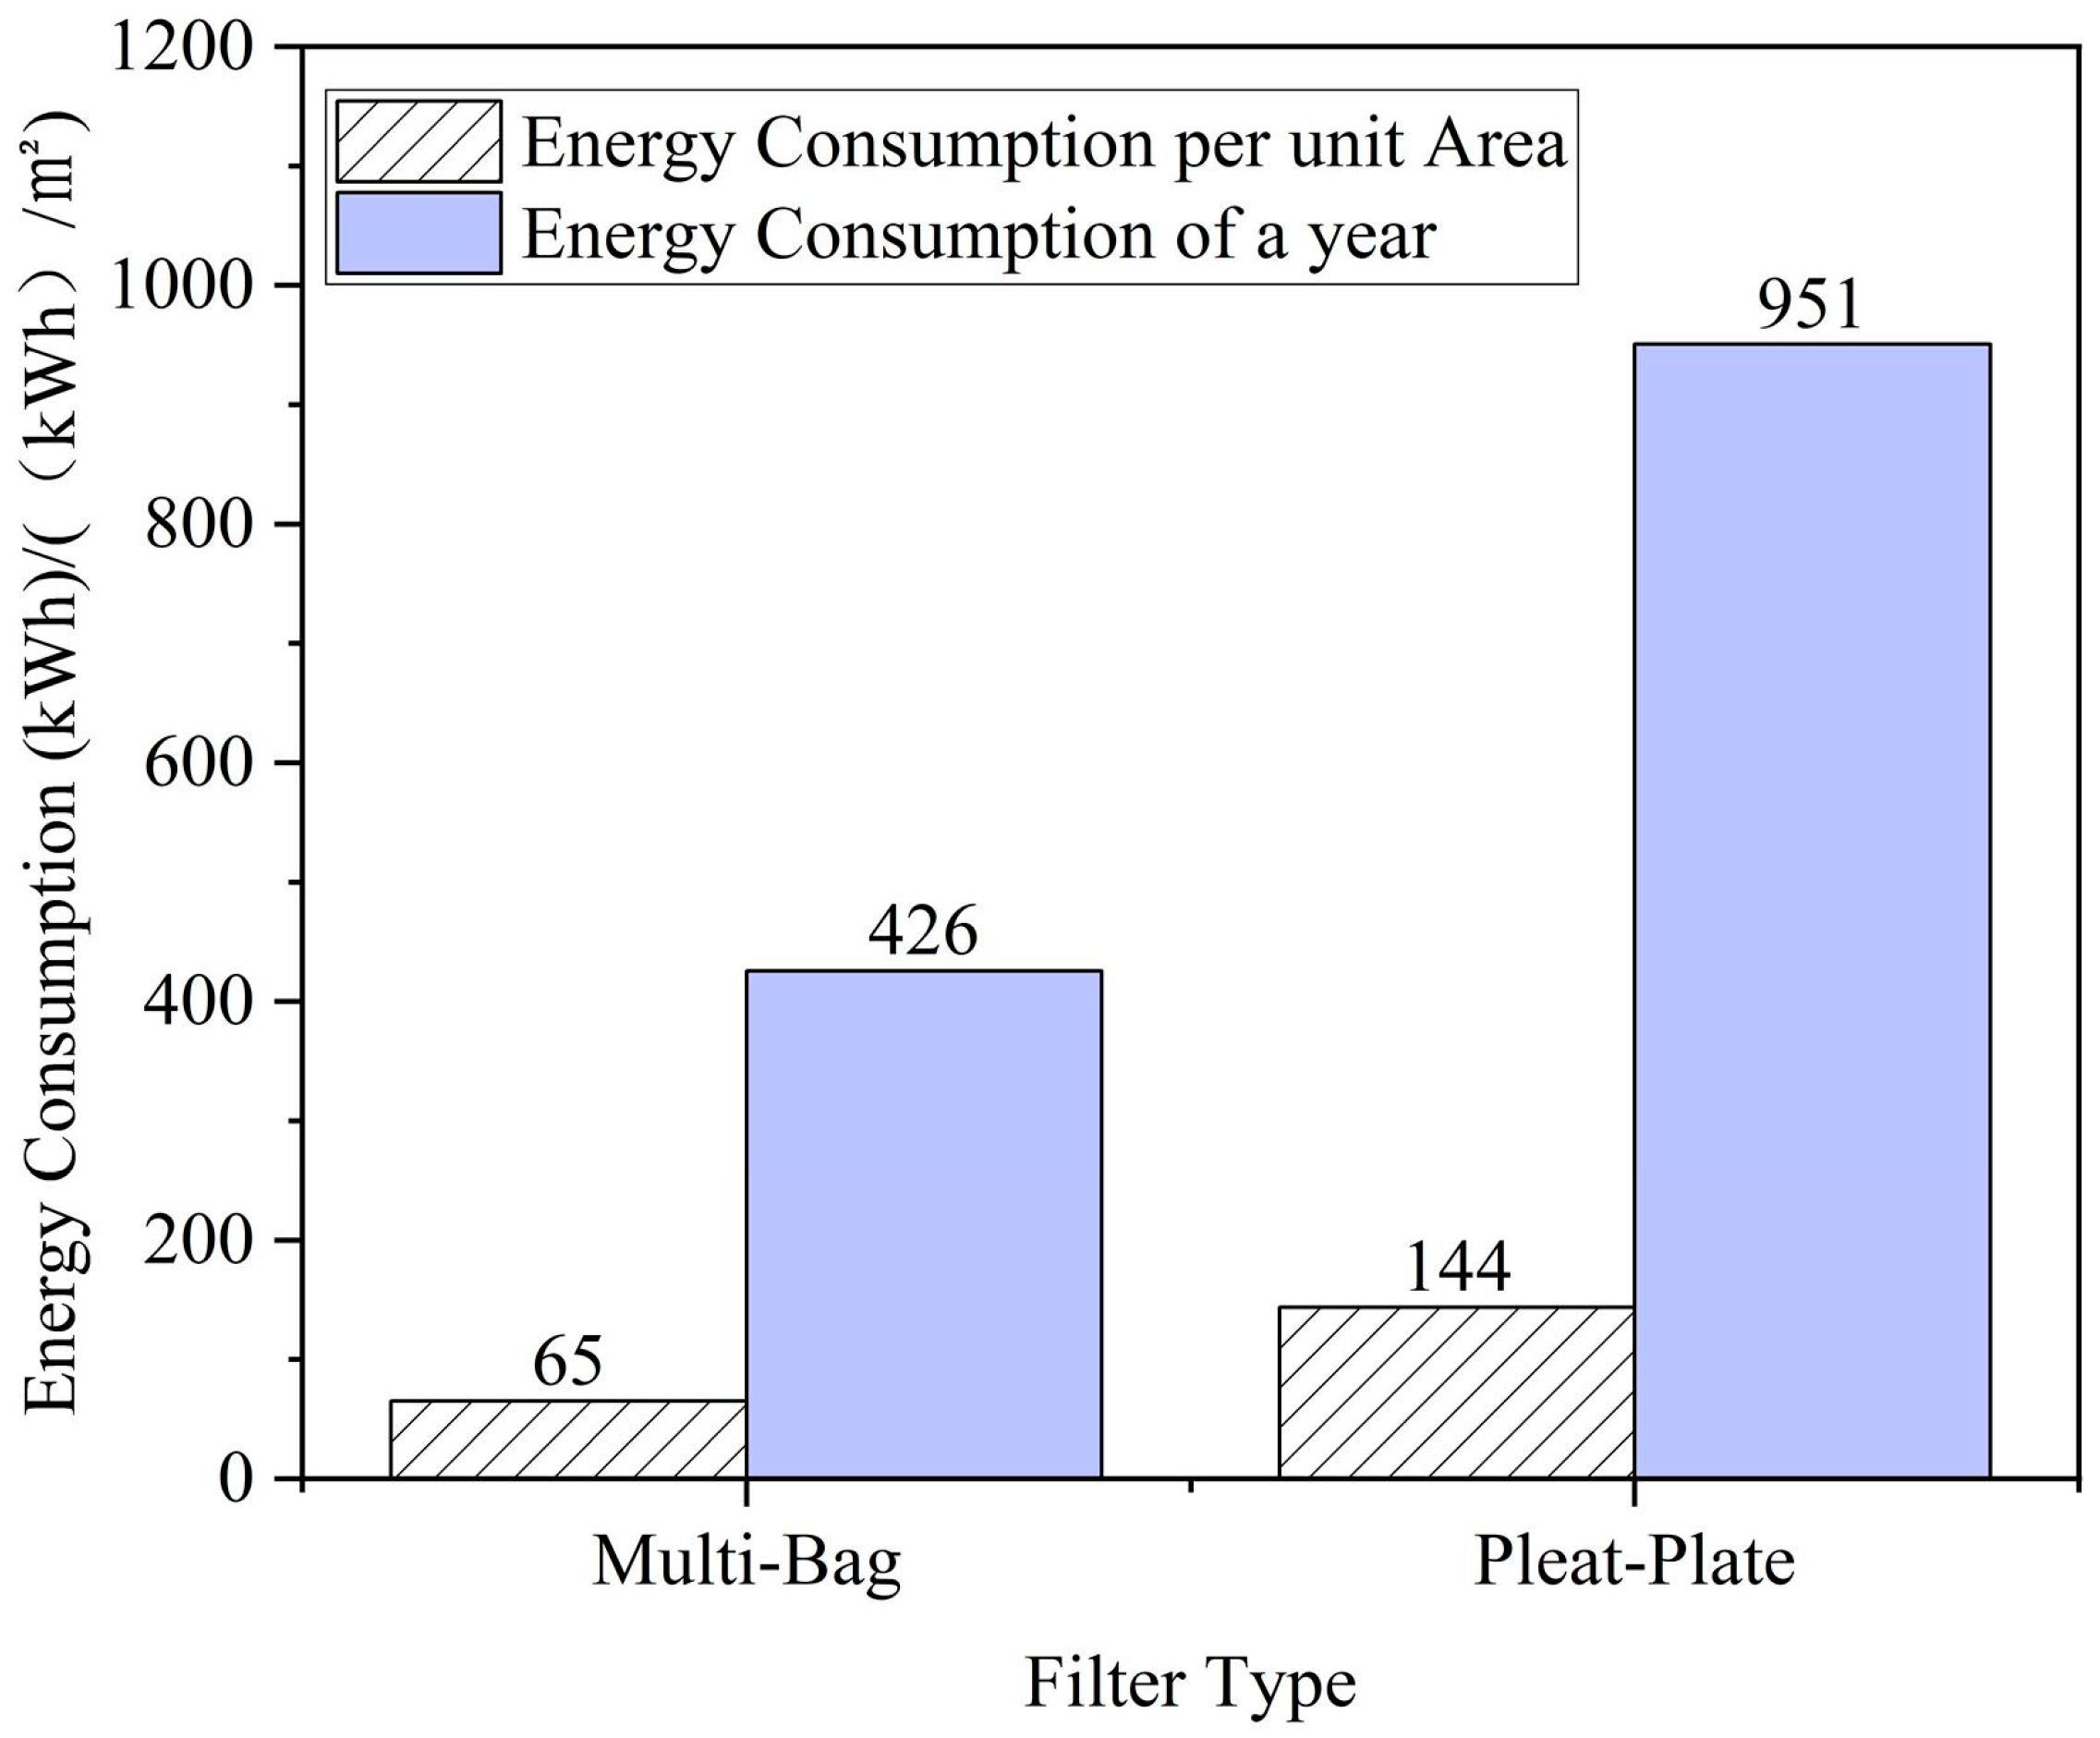
Combined with Equations (3) and (6), the energy consumption of the two tested filters is shown in Figure 5. The total energy consumption of the multi-bag filter over its whole operating life was 1278 kWh, while that of the pleat–plate filter was 2854 kWh. Normalized by unit filter material area, the energy consumption per unit filter material area of the multi-bag filter and the pleat–plate filter were 194 (kWh/m2) and 432 (kWh/m2), respectively (Figure 5). In this test, the filtration area of the pleat–plate filter (7.1 m2) was close to that of the multi-bag filter (6.6 m2), and the energy consumption per unit filter area of pleat–plate filter was 2.2 times that of the multi-bag filter. This energy consumption analysis method was practicable and useful for the comparative analysis of filters with significantly different filtration areas.
The air flow resistance, quality factor, resistance, and energy consumption of the two tested filters were compared and analyzed in detail to assess filter performance. Our findings indicate that there was no significant difference in Qr between the two tested filters. Therefore, further performance analysis was necessary. In an outdoor environment, the rate of change of resistance of the filter should more accurately determine whether the two filters were able to adapt to changes in outdoor PM2.5 concentration. Figure 6 shows the working resistance of the filters when monitoring outdoor PM2.5 concentration. Assuming that the final resistance is twice the initial resistance, the operating life of the multi-bag filter and the pleat–plate filter were 2232 h and 264 h, respectively. The operating life of the multi-bag filter was 8 times that of the pleat–plate filter [28]. The outdoor pollutant concentration characteristics determine the operating life of the filter, and this has been shown by field studies [29,30].
3.2. Relationship between Construction and Performance
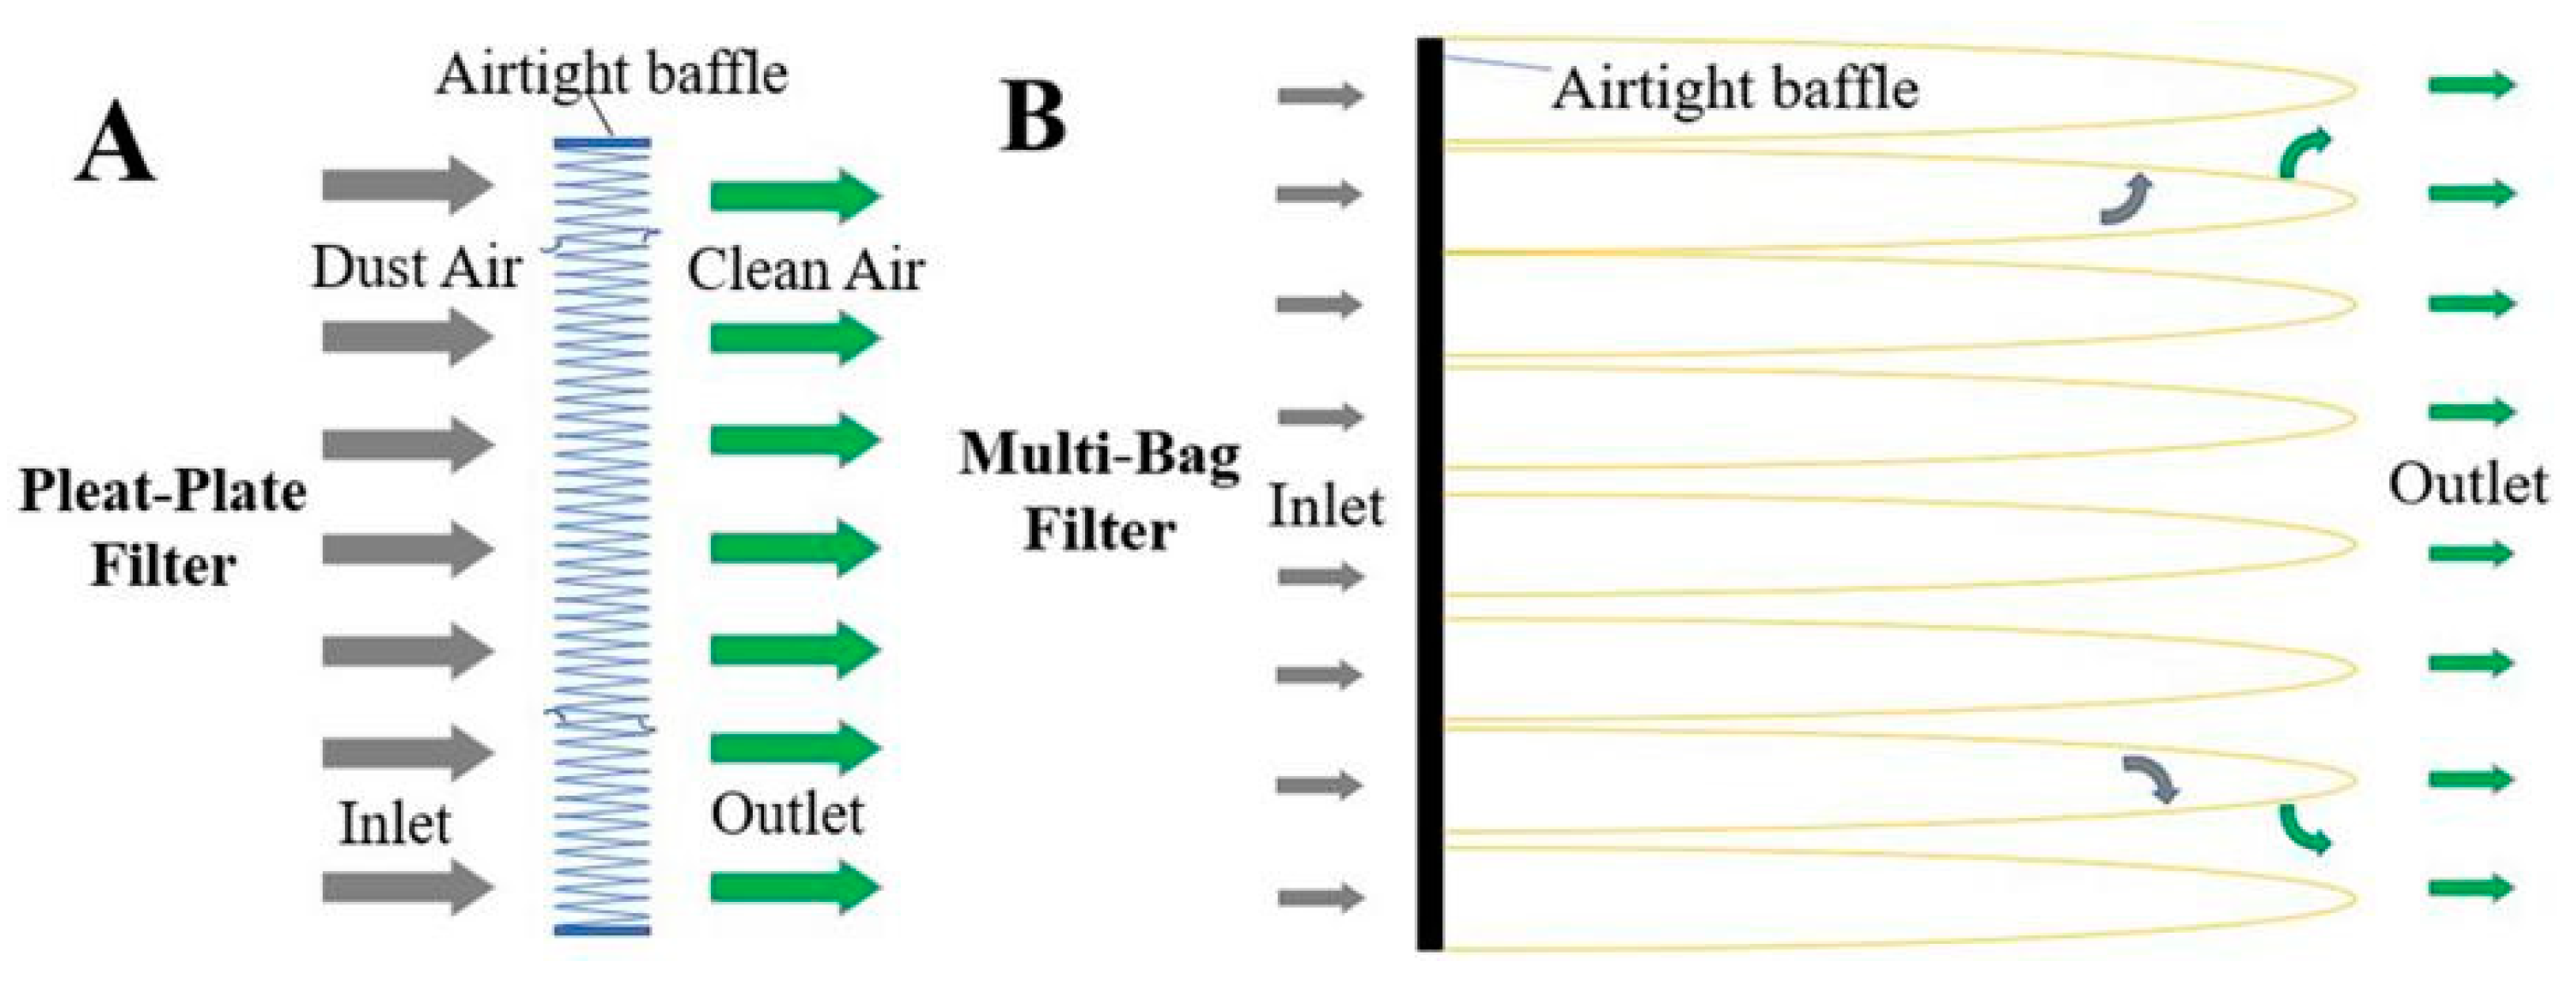
The multi-bag filter had a longer operating life and stronger dust holding capacity than the pleat–plate filter with similar filtration areas and the same air volume rate. Besides the chemical fiber filter media and their similar efficiency, the difference in performance might be due to their structures [14]. There were two main differences in the flow of the tested filters. The air flow through the multi-bag filter was a turning one, and that of the pleat–plate filter was straight, along with the fold structure [14,31] (Figure 7). For the pleat–plate filter, the air flow passes through the V-shaped inlet, rotates at a small angle, then passes through the filter medium, finally passing through the V-shaped outlet at a small angle. This is consistent with the results obtained by Fotovati on the basis of a CFD-DEM coupling model [32,33]. From the diversion of air flow, the diversion angle of the multi-bag filter is close to 90 before the air flow enters the filter medium, while the steering angle of the pleat–plate filter is smaller. For dusty air flow, large particles deviate from the streamline due to the inertial effect when turning [34]. Therefore, the blocking rate of the filter material unit of the multi-bag filter was higher than that of the pleat–plate filter.
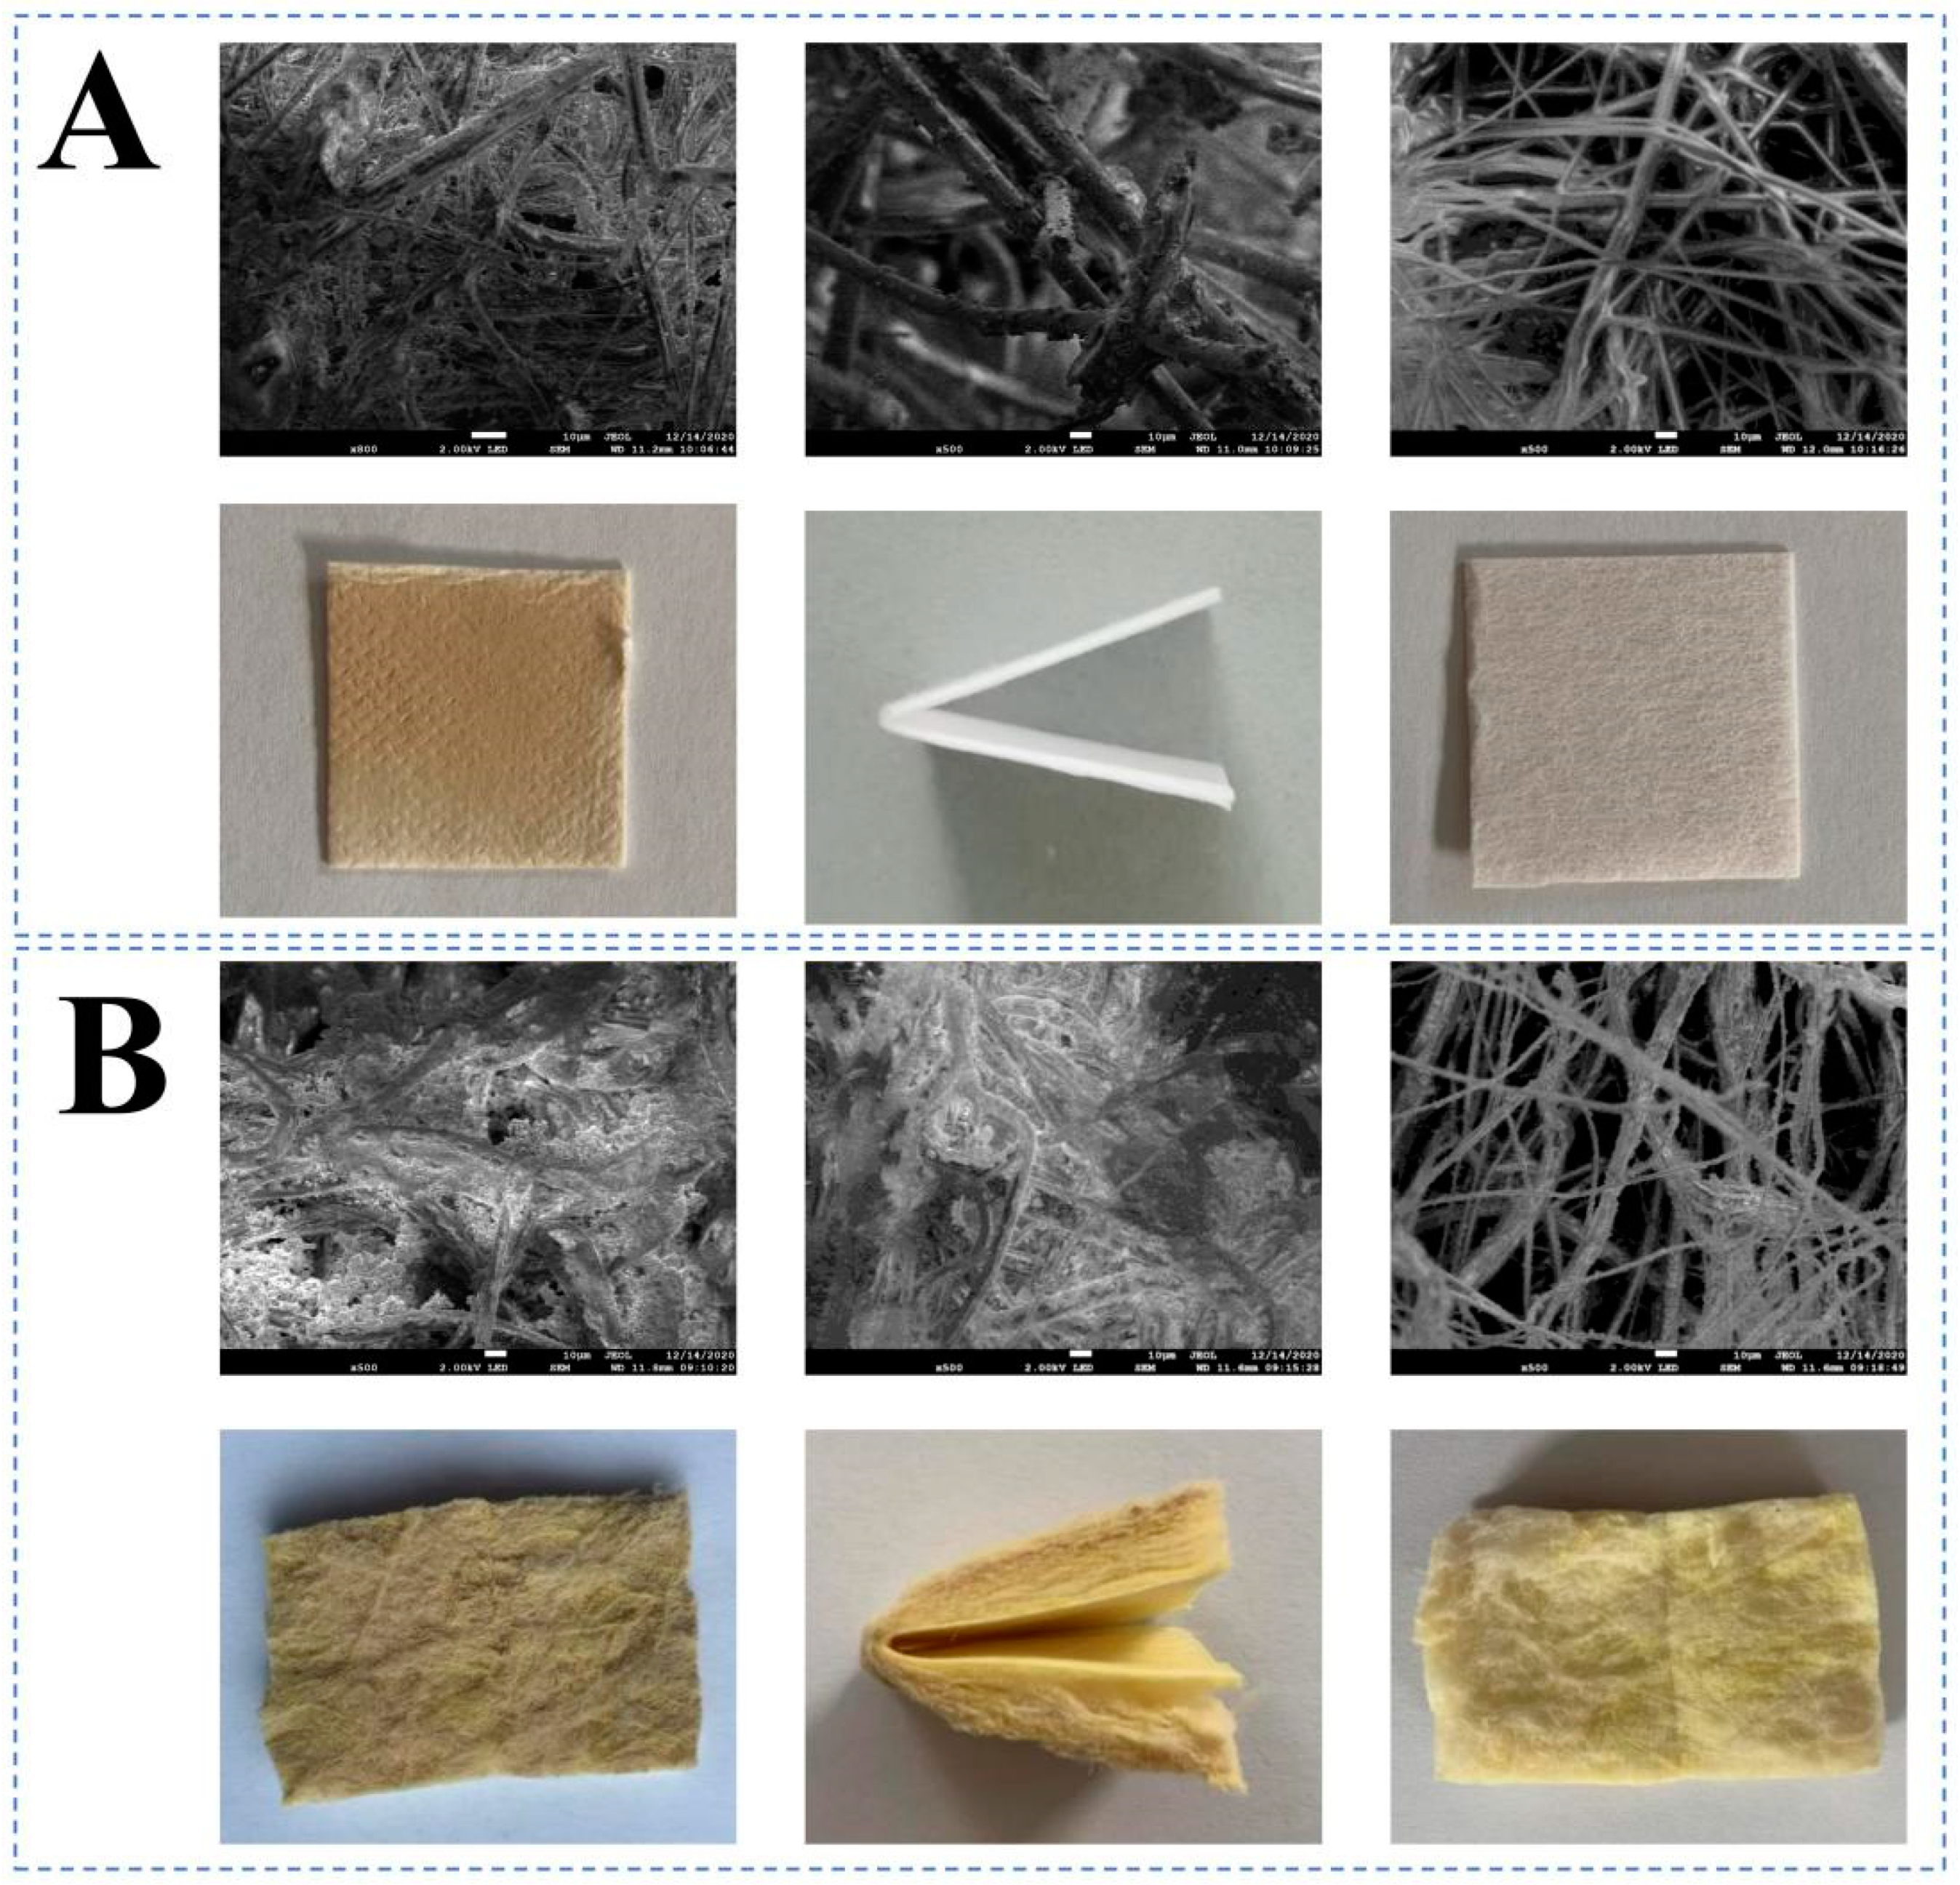
Figure 8 shows a surface image of the filter medium under dust holding conditions obtain with a scanning electron microscope (SEM). By comparing Figure 8a,b, it can be seen that the filtration depth of the pleat–plate filter was relatively shallow, and a large number of dendrites formed on the windward side of the particles accumulated on the fibers under dust holding conditions. With filtration, affected by the air flow and adjacent particles, the internal balance in the dendrites was destroyed [35]. The particle sliding phenomenon resulted in the collapse of the dendrites. The operating resistance increases sharply when pore blockage of the medium occurs [4]. In addition, the fibers in the middle and on the down-wind side are able to capture few particles. However, the multi-bag filter displayed more particle collection on both the windward and down-wind sides (Figure 8), leading to a large dust capacity. Similar results were found by [36], who reported that the filter adopted a high-density V-shaped pleat structure, causing the air flow in the pleat channel to become disordered, resulting in an uneven distribution of air flow. In addition, the field study also explained the deep filtration and surface filtration in the non-woven filter by an predicted model [37]. In this study, the high-density pleat number of the pleat–plate filter resulted in decreased pleat spacing in the filter paper, while the turbulence of the air flow in the pleat channel led to increased friction resistance between the air flow and the filter paper. This might be another reason for the high resistance increase rate of the pleat–plate filter.
4. Conclusions
In this study, initial resistance, quality factor, energy consumption and operation time were used to evaluate the performance of two selected class F8 filters (multi-bag type and pleat–plate type). The main conclusions are as follows:
(1) The resistance of the multi-bag filter was greater than that of the pleat–plate filter at the tested air volume. The Qr of the pleat–plate filter was better than that of the multi-bag filter. When the initial particle filtration efficiency was basically similar, the resistance increase rate of the multi-bag filter was much lower than that of the pleat–plate filter.
(2) The energy consumption of the multi-bag filter was lower than that of the pleat–plate filter. When measuring the outdoor average PM2.5 concentration, the operating life of the multi-bag filter was 8.5 times that of the pleat–plate filter.
(3) Combined with the analysis of the electron microscope photos after dust holding, the structure of the general ventilation filter affects its performance, and the dust holding capacity varied at different filtering depths.
In addition, many studies on the influence of static electricity and particle size, and their effect on the performance of chemical fiber filters, will be conducted under operating conditions in the future.
Author Contributions
Conceptualization, Y.L.; methodology, Y.L., P.C. and Y.W.; validation, Y.L., P.C. and Z.C.; formal analysis, Y.L. and P.C.; data curation, Y.L., P.C. and Y.W.; writing—original draft preparation, Y.L. and P.C.; writing—review and editing, Y.L. All authors have read and agreed to the published version of the manuscript.
Funding
This research was funded by the special fund project for technology innovation of Tianjin, grant number 21YDTPJC00560.
Institutional Review Board Statement
Not applicable.
Informed Consent Statement
Not applicable.
Data Availability Statement
Data available on request due to their robustness and restrictions on public sharing.
Acknowledgments
We would like to thank Liu Junjie and Zhang Xin of Tianjin University for their help in this present study.
Conflicts of Interest
The authors declare no conflict of interest.
References
- Koutrakis, P.; Briggs, S.; Leaderer, B. Source Apportionment of Indoor Aerosols in Suffolk and Onondaga Counties, New York. Environ. Sci. Technol. 1992, 26, 521–527. [Google Scholar] [CrossRef]
- Kakkar, P.; Jaffery, F.; Viswanathan, P.N. Specific Molecular Probes for Mechanistic Studies in Toxicology and Molecular Epidemiology for Risk Assessment. J. Environ. Sci. Health 1996, 14, 105–137. [Google Scholar] [CrossRef]
- Li, S.; Hu, S.; Xie, B.; Jin, H.; Xin, J. Influence of pleat geometry on the filtration and cleaning characteristics of filter media. Sep. Purif. Technol. 2010, 210, 38–47. [Google Scholar] [CrossRef]
- Qian, F.; Huang, N.; Zhu, X.; Lu, J. Numerical Study of the Gas-Solid Flow Characteristic of Fibrous Media Based on SEM Using CFD-DEM. Powder Technol. 2013, 249, 63–70. [Google Scholar] [CrossRef]
- Qian, F.; Huang, N.; Lu, J.; Han, Y. CFD-DEM Simulation of the Filtration Performance for Fibrous Media Based on the Mimic Structure. Comput. Chem. Eng. 2014, 71, 478–488. [Google Scholar] [CrossRef]
- Shu, Z.; Qian, F.; Fang, C. Numerical Simulation of Particle Spatial Distribution and Filtration Characteristic in the Pleated Filter Media Using OpenFOAM. Indoor Built Environ. 2020, 30, 1159–1172. [Google Scholar] [CrossRef]
- Cao, B.; Wang, S.; Dong, W.; Zhu, J.; Qian, F.; Liu, J.; Han, Y. Investigation of the Filtration Performance for Fibrous Media: Coupling of a Semi-Analytical Model with CFD on Voronoi-Based Microstructure. Sep. Purif. Technol. 2020, 251, 117364. [Google Scholar] [CrossRef]
- Liu, J.; Ren, S.; Xu, L. Comparison Test of Filtration Performance of Class F7 Air Filters. Heat. Vent. Air Cond. 2014, 44, 71–75. [Google Scholar]
- Ma, H.; Shen, H.; Shui, T.; Li, Q.; Zhou, L. Experimental Study on Ultrafine Particle Removal Performance of Portable Air Cleaners with Different Filters in an Office Room. Int. J. Environ. Res. Public Health 2016, 13, 102. [Google Scholar] [CrossRef] [Green Version]
- Chen, D.; Pui, D.; Benjamin, L. Optimization of Pleated Filter Designs Using a Finite-Element Numerical Model. Aerosol Sci. Technol. 1995, 23, 579–590. [Google Scholar] [CrossRef]
- Thomas, C.; Thomas, S. The Influence of Pleat Geometry on the Pressure Drop in Deep-Pleated Cassette Filters. Filtr. Sep. 2002, 39, 49–54. [Google Scholar]
- Tronville, P.; Sala, R. Minimization of Resistance in Pleated-Media Air Filter Designs: Empirical and CFD Approaches. HVAC&R Res. 2003, 9, 95–106. [Google Scholar]
- Vinh, N.; Kim, H. Electrospinning Fabrication and Performance Evaluation of Polyacrylonitrile Nanofiber for Air Filter Applications. Appl. Sci. 2016, 6, 235. [Google Scholar] [CrossRef] [Green Version]
- Zhang, X.; Liu, J.; Liu, X.; Liu, C. Performance Optimization of Airliner Cabin Air Filters. Build. Environ. 2021, 187, 107392. [Google Scholar] [CrossRef]
- Xu, T.; Ming, S. Laboratory Evaluation of Fan-Filter Units’ Aerodynamic and Energy Performance. J. IEST 2004, 47, 116–120. [Google Scholar] [CrossRef] [Green Version]
- Park, W.; Hwang, S.; Roh, J. Comparison of the relative performance efficiencies of melt-blown and glass fiber filter media for managing fine particles. Aerosol Sci. Technol. 2018, 52, 451–458. [Google Scholar]
- CEN, BS EN 779-2012. Particulate Air Filters for General Ventilation-Determination of the Filtration Performances; European Committee for Standardization: Brussels, Belgium, 2012. [Google Scholar]
- ASHRAE, ASHRAE 52.2-2017. Method of Testing General Ventilation Air-Cleaning Devices for Removal Efficiency by Particle Size; American Society of Heating, Refrigerating and Air-Conditioning Engineer: Atlanta, GA, USA, 2017. [Google Scholar]
- Dhaniyala, S.; Benjamin, L. Investigations of Particle Penetration in Fibrous Filters: Part I. Experimental. J. IEST 1999, 42, 32–40. [Google Scholar] [CrossRef]
- EUROVENT. EUROVENT 4/21-2014, Calculation Method for the Energy Use Related to Air Filters in General Ventilation Systems; European Committee for Standardization: Brussels, Belgium, 2014; pp. 1–8. [Google Scholar]
- Cao, Q.; Xu, Q.; Liu, W.; Lin, C.; Wei, D.; Steven, B.; Sharon, N.; Chen, Q. In-flight monitoring of particle deposition in the environmental control systems of commercial airliners in China. Atmos. Environ. 2017, 154, 118–128. [Google Scholar] [CrossRef]
- Zhang, X.; Fan, Y.; Tian, G.; Wang, H.; Zhang, H.; Xie, W. Influence of fiber diameter on filtration performance of polyester fibers. Therm. Sci. 2019, 23, 2291–2296. [Google Scholar] [CrossRef]
- He, J.; Shen, H.; Wu, Y.; Fang, M. Experimental Study on Resistance Influencing Factors of Clean Filter Material Used in Air Purification. Adv. Mater. Res. 2012, 393–395, 1224–1230. [Google Scholar] [CrossRef]
- Sothen, R.; Tatarchuk, B. A Semi-Empirical Pressure Drop Model: Part II—Multi-Element Pleated Filter Banks. Hvac R Res. 2009, 15, 269–286. [Google Scholar] [CrossRef]
- Park, S.; Joe, Y.; Shim, J.; Park, H.; Shin, W. Non-Uniform Filtration Velocity of Process Gas Passing through a Long Bag Filter. J. Hazard. Mater. 2019, 365, 440–447. [Google Scholar] [CrossRef] [PubMed]
- Chen, C.; Huang, S.; Chiang, C.; Hsiao, T.; Chen, C. Filter Quality of Pleated Filter Cartridges. Ann. Occup. Hyg. 2008, 52, 207–212. [Google Scholar] [PubMed] [Green Version]
- Feng, Z.; Cao, S. A newly developed electrostatic enhanced pleated air filters towards the improvement of energy and filtration efficiency. Sustain. Cities Soc. 2019, 49, 101569. [Google Scholar] [CrossRef]
- Saleh, A.; Tafreshi, H.; Pourdeyhimi, B. Service life of circular pleated filters vs. that of their flat counterpart. Sep. Purif. Technol. 2015, 156, 881–888. [Google Scholar] [CrossRef]
- Sae-Lim, W.; Tanthapanichakoon, W.; Kanaoka, C. Structural Improvement to Quadruple Service Life of a High-Efficiency Electret Filter. Sci. Technol. Adv. Mater. 2005, 6, 307–311. [Google Scholar] [CrossRef]
- Saleh, A.; Fotovati, S.; Tafreshi, H.; Pourdeyhimi, B. Modeling Service Life of Pleated Filters Exposed to Poly-Dispersed Aerosols. Powder Technol. 2014, 266, 79–89. [Google Scholar] [CrossRef]
- Théron, F.; Aurélie, J.; Laurence, L. Numerical and Experimental Investigations of the Influence of the Pleat Geometry on the Pressure Drop and Velocity Field of a Pleated Fibrous Filter. Sep. Purif. Technol. 2017, 182, 69–77. [Google Scholar] [CrossRef] [Green Version]
- Fotovati, S.; Hosseini, S.; Tafreshi, H.; Pourdeyhimi, B. Modeling Instantaneous Pressure Drop of Pleated Thin Filter Media during Dust Loading. Chem. Eng. Sci. 2011, 66, 4036–4046. [Google Scholar] [CrossRef]
- Fotovati, S.; Tafreshi, H.; Pourdeyhimi, B. A Macroscale Model for Simulating Pressure Drop and Collection Efficiency of Pleated Filters over Time. Sep. Purif. Technol. 2012, 98, 344–355. [Google Scholar] [CrossRef]
- Wang, H.; Wang, K.; He, Y.; Zheng, C. Simulation of Filtration Process for Multi-Fiber Filter Using the Lattice-Boltzmann Two-Phase Flow Model. J. Aerosol Sci. 2013, 66, 164–178. [Google Scholar] [CrossRef]
- Kasper, G.; Schollmeier, S.; Meyer, J. Structure and density of deposits formed on filter fibers by inertial particle deposition and bounce. J. Aerosol Sci. 2010, 41, 1167–1182. [Google Scholar] [CrossRef]
- Hasolli, N.; Park, Y.; Rhee, Y. Filtration Performance Evaluation of Depth Filter Media Cartridges as Function of Layer Structure and Pleat Count. Powder Technol. 2013, 237, 24–31. [Google Scholar] [CrossRef]
- Thomas, D.; Pacault, S.; Charvet, A. Composite fibrous filters for nano-aerosol filtration: Pressure drop and efficiency model. Sep. Purif. Technol. 2019, 215, 557–564. [Google Scholar] [CrossRef]
Figure 1.
Ventilation filter filtration performance test system and the tested filters: (a) multi-bag; (b): pleat–plate).
Figure 1.
Ventilation filter filtration performance test system and the tested filters: (a) multi-bag; (b): pleat–plate).
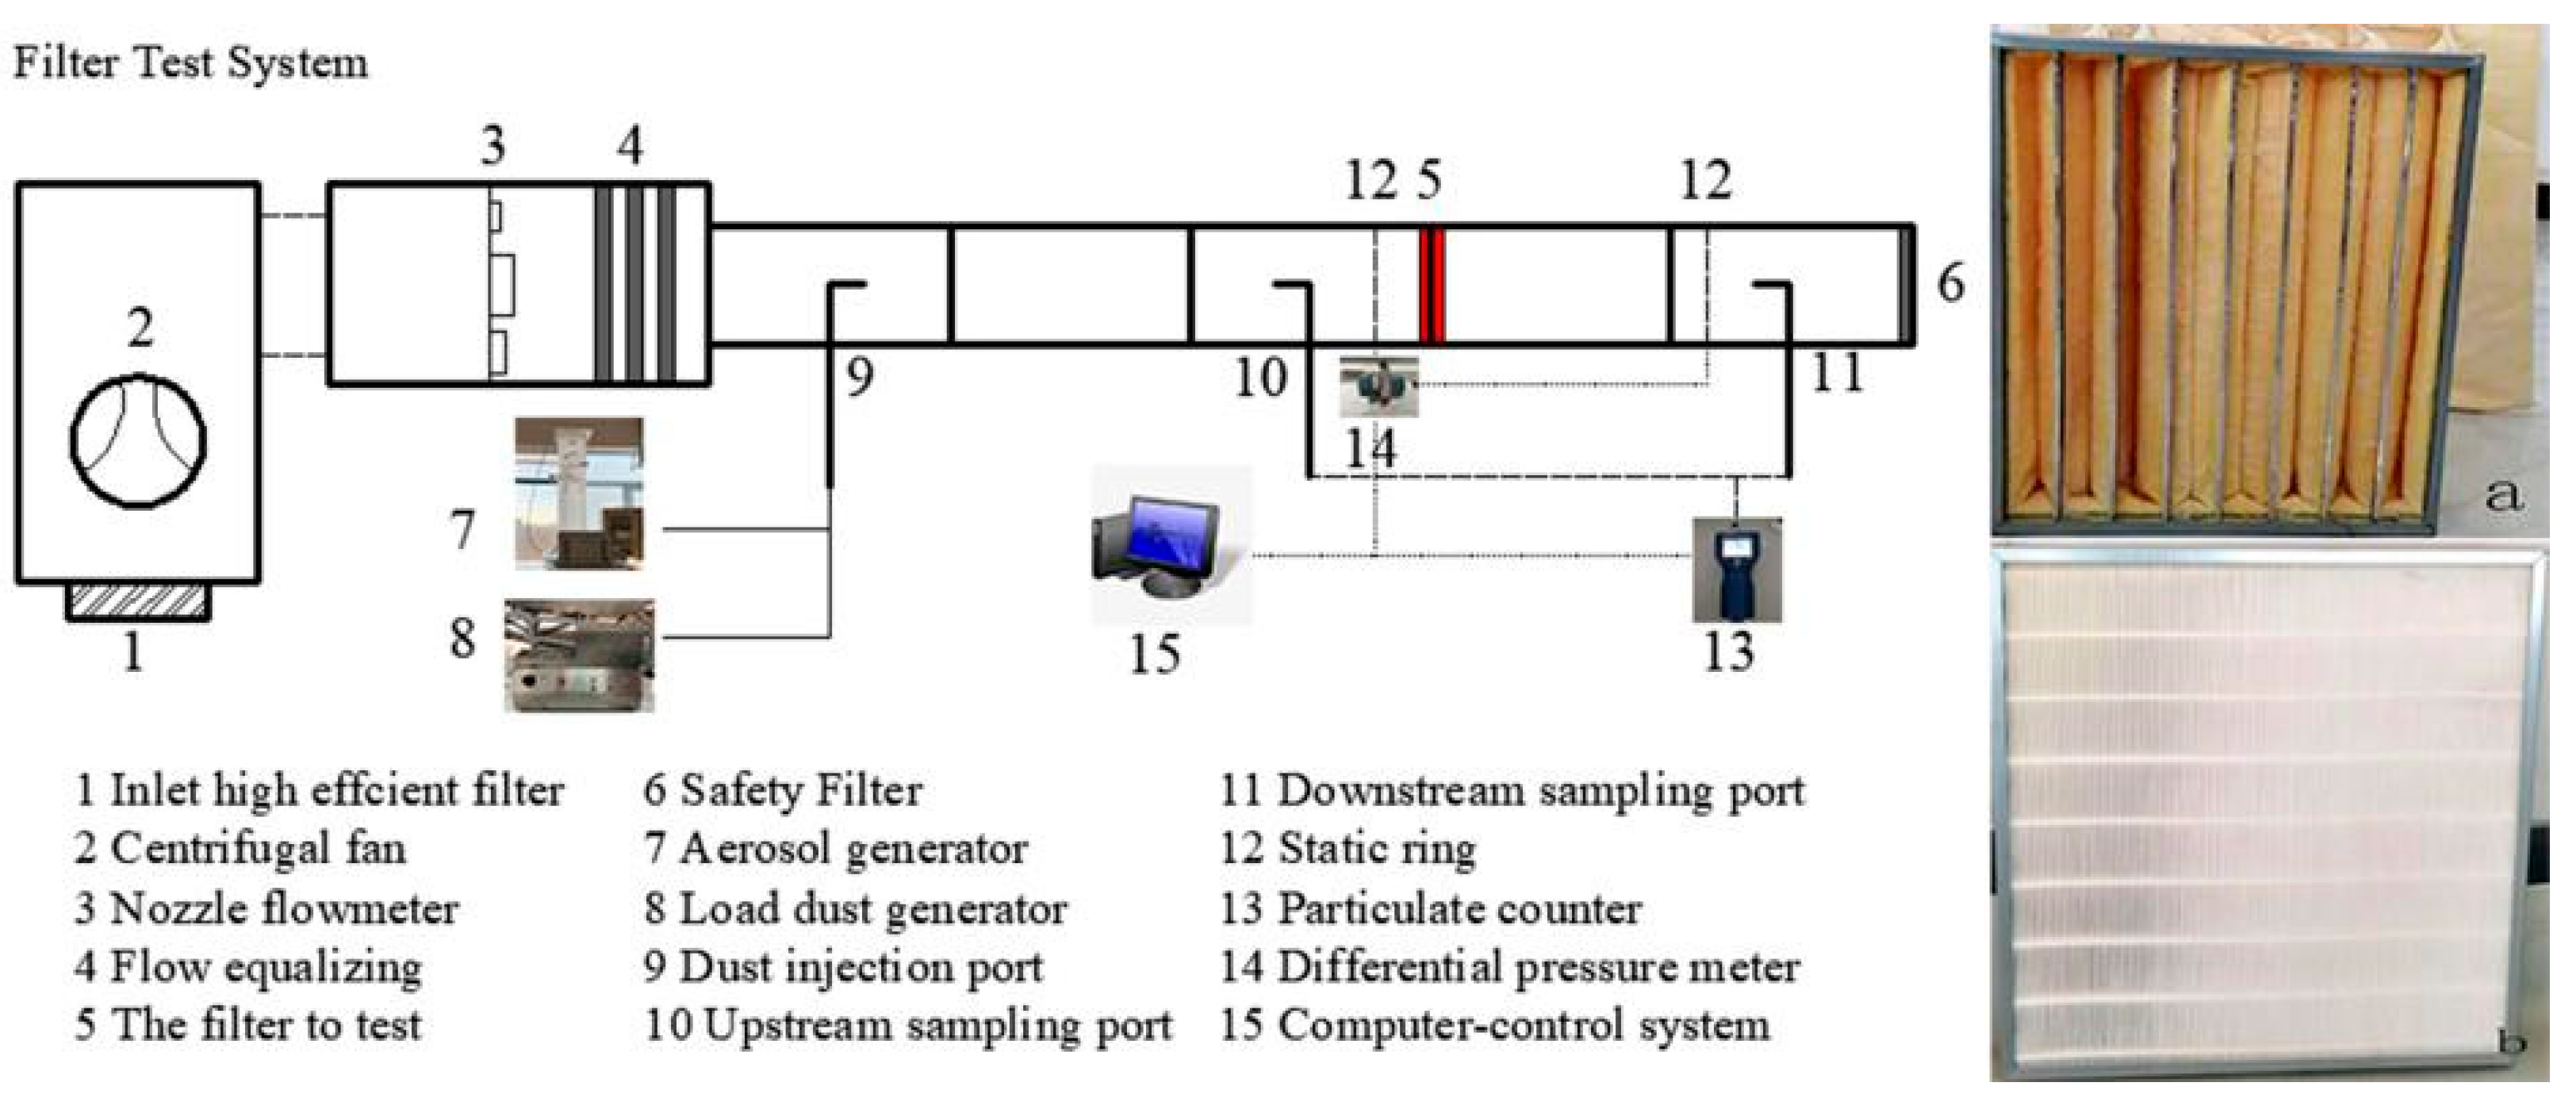
Figure 2.
The resistance of the tested filters with different filtration velocities.

Figure 3.
Quality factors (Qr) of the selected filters.
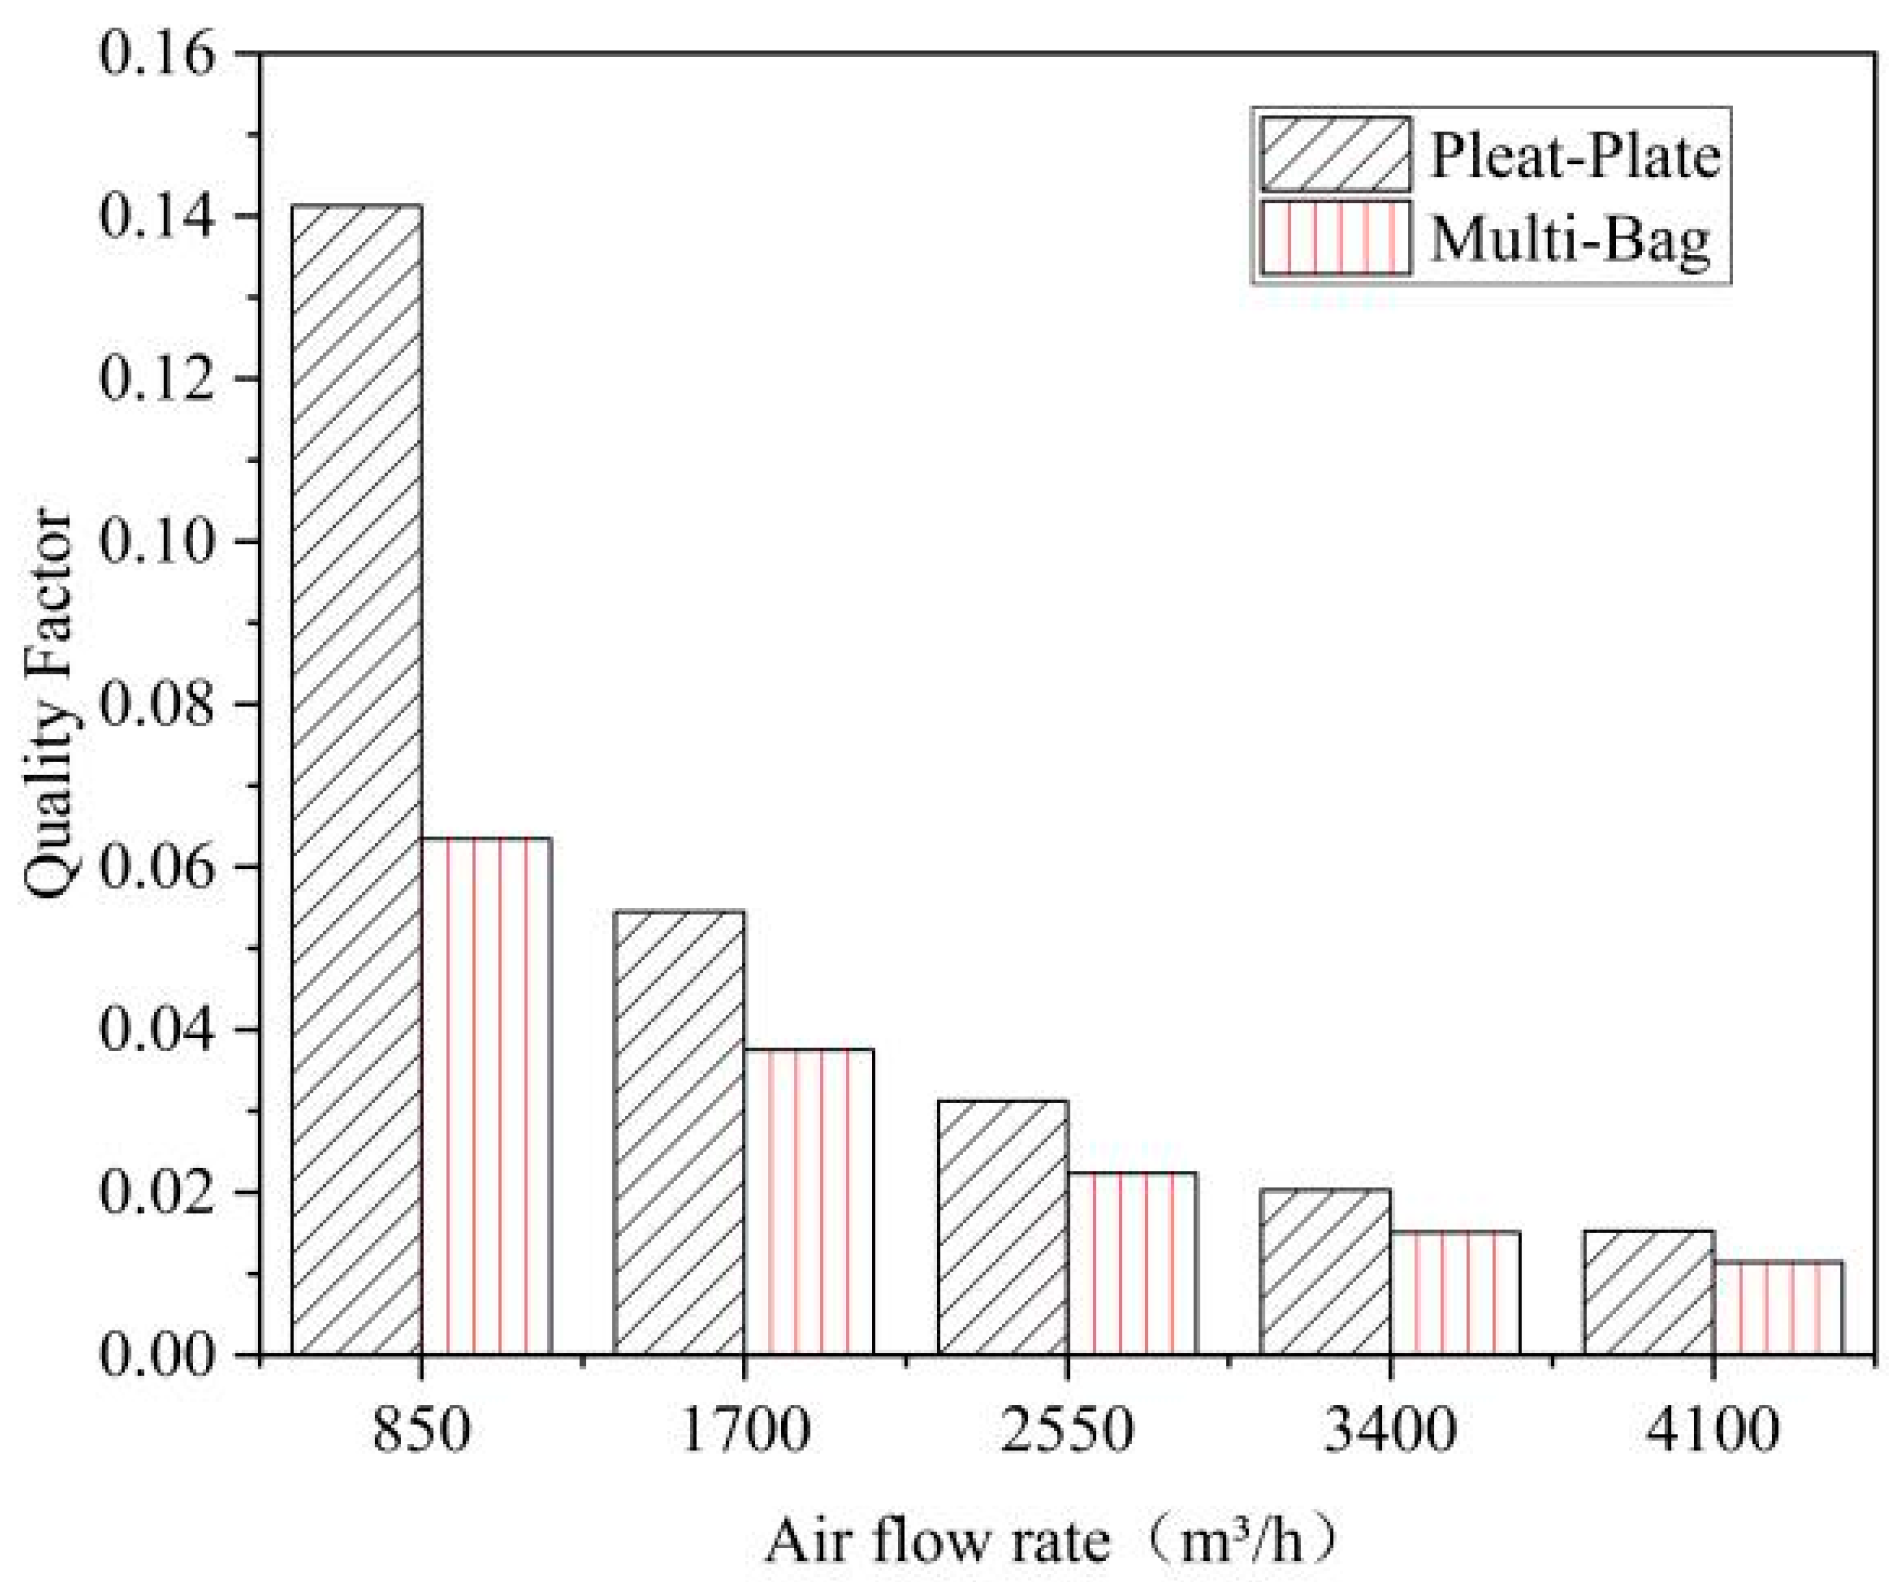
Figure 4.
Variation in the resistance of the tested filters with dust-holding capacity.

Figure 5.
The energy consumption of the two tested filters during their life cycle.

Figure 6.
The energy consumption of the two tested filters during their life cycle.
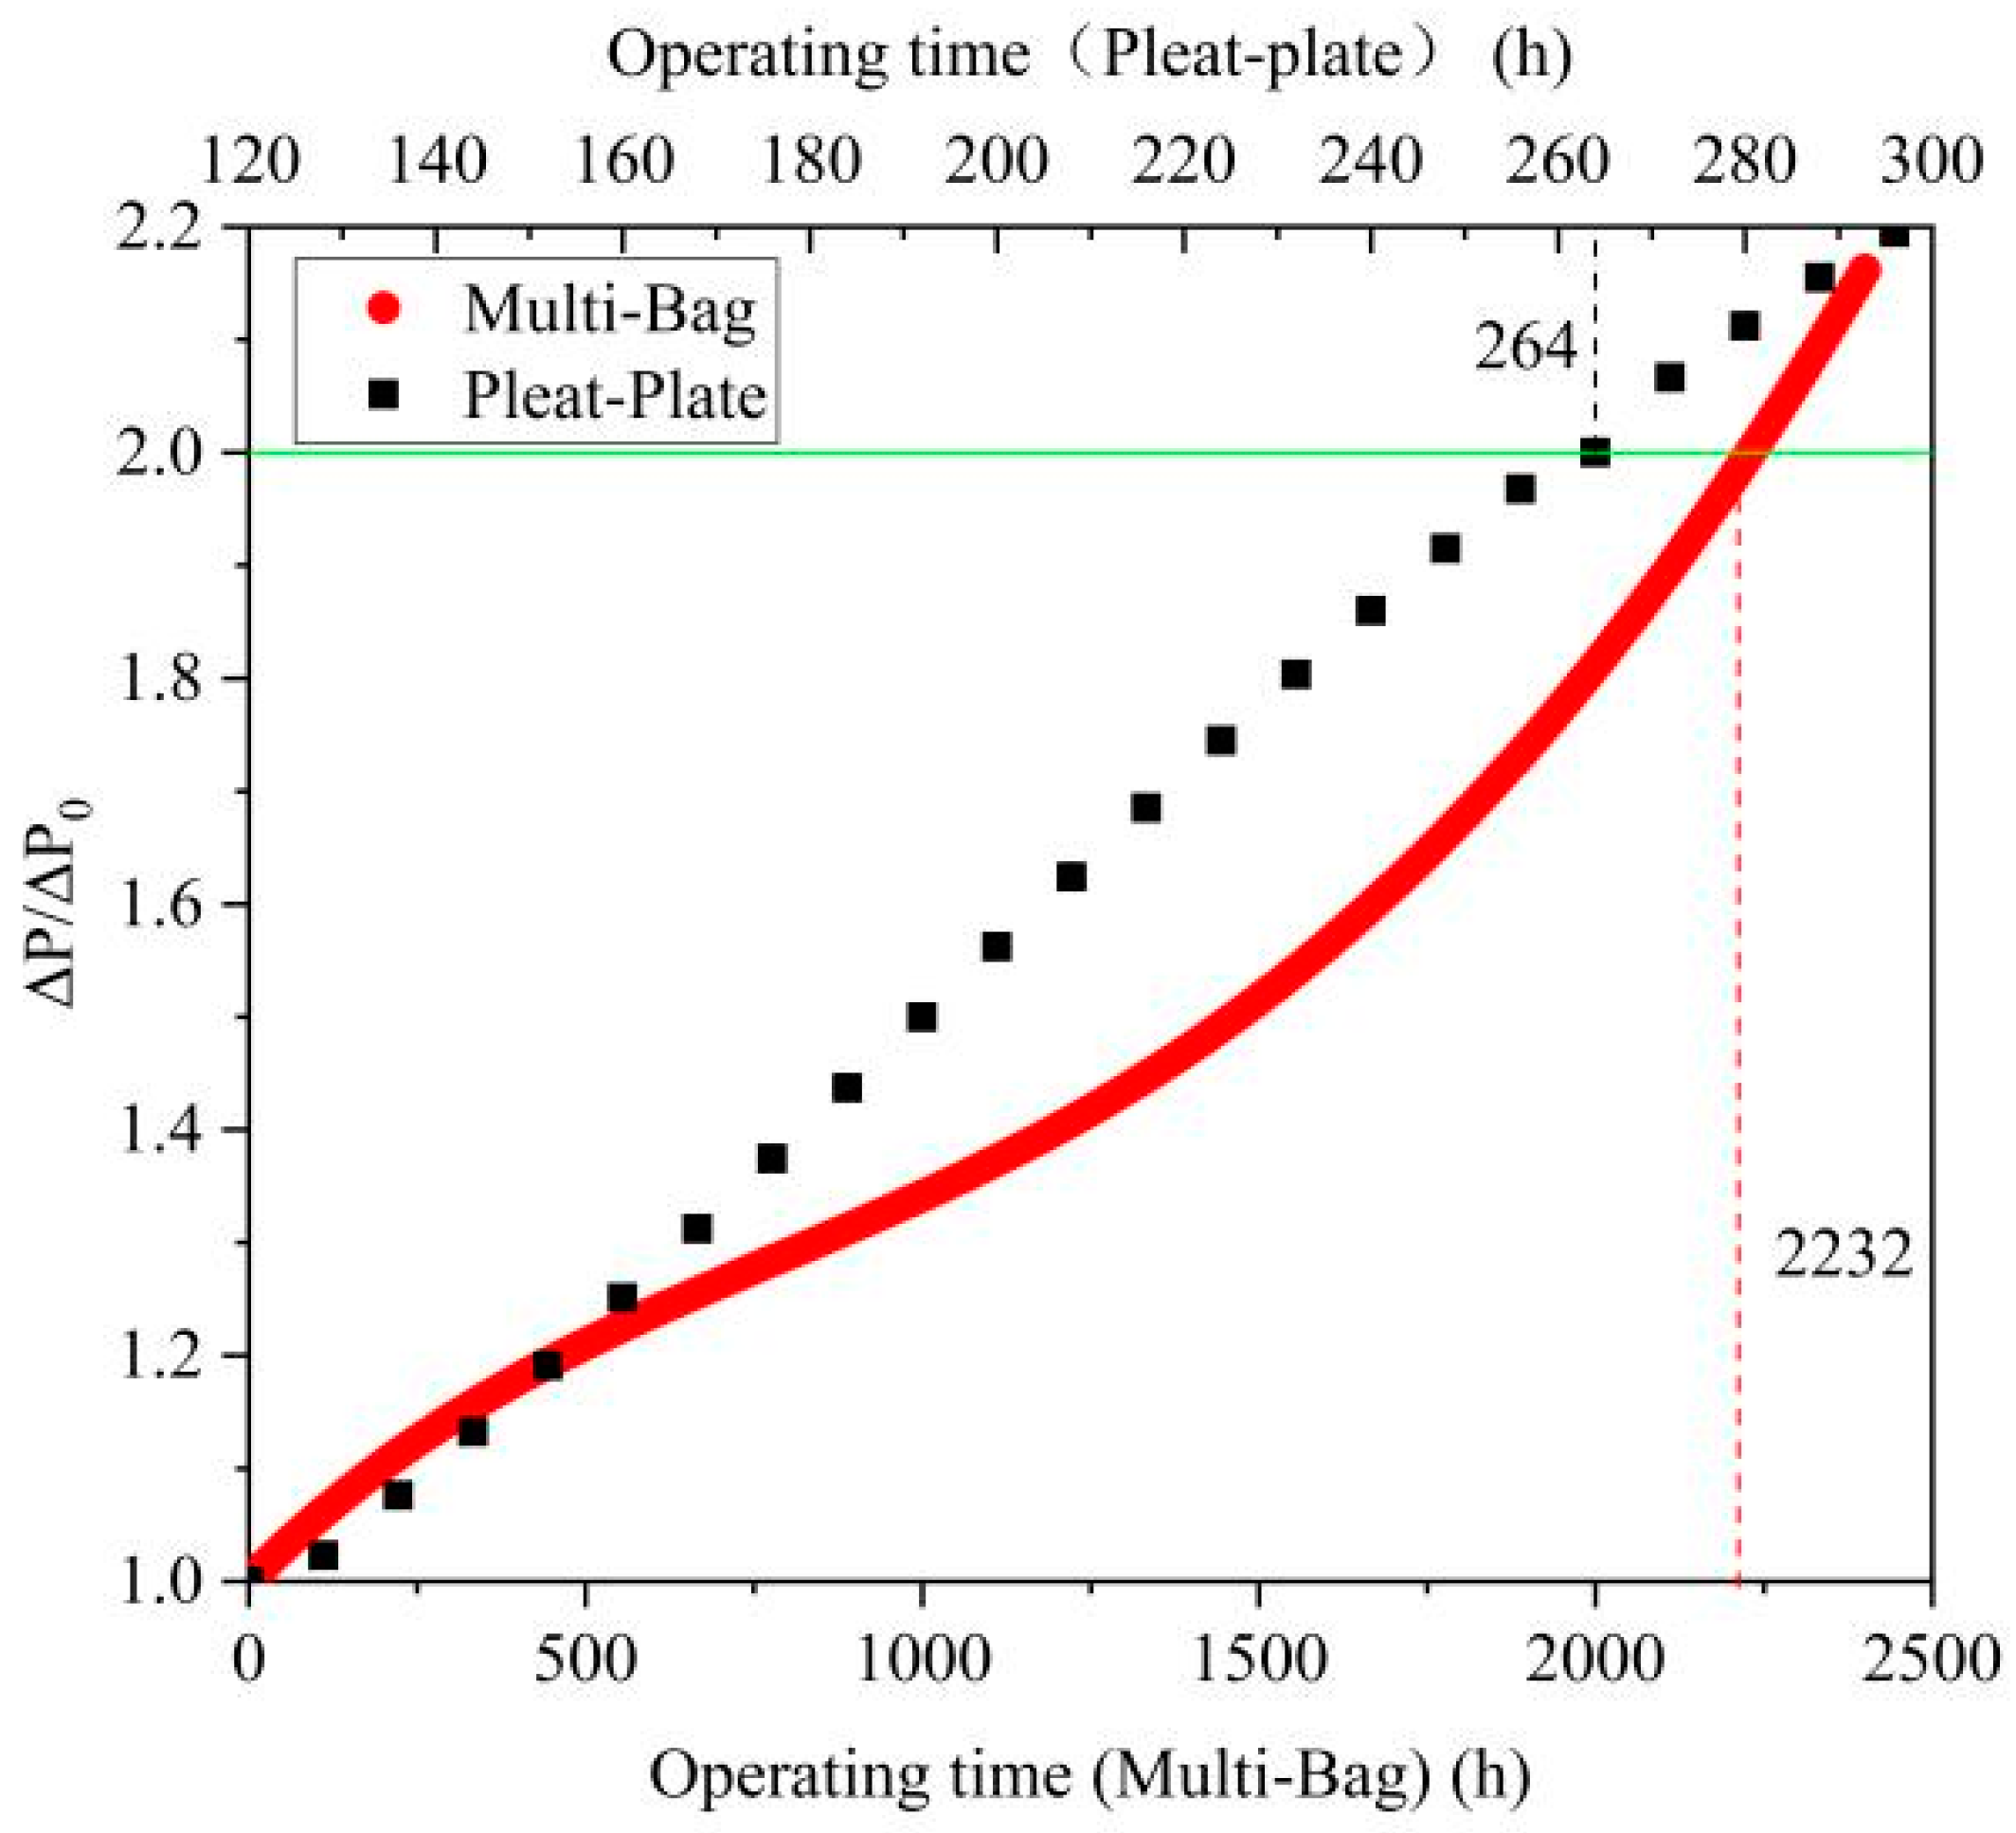
Figure 7.
Flow field characteristics of filters with different structures: (A) pleat–plate; (B) multi-bag.
Figure 7.
Flow field characteristics of filters with different structures: (A) pleat–plate; (B) multi-bag.

Figure 8.
The SEM and product photographs of the selected filter media. (A) Pleat–plate; (B) multi-bag. From left to right are the up-wind surface, cross-section, and down-wind surface images.
Figure 8.
The SEM and product photographs of the selected filter media. (A) Pleat–plate; (B) multi-bag. From left to right are the up-wind surface, cross-section, and down-wind surface images.


Table 1.
Basic information of the tested filter samples.
| Model | Structure | Filtration Area, m2 | Size (L × W × D), mm |
|---|---|---|---|
| D-F8 | Multi-Bag | 6.6 | 592 × 592 × 650 |
| B-F8 | Pleat–plate | 7.1 | 592 × 592 × 46 |
Publisher’s Note: MDPI stays neutral with regard to jurisdictional claims in published maps and institutional affiliations. |
© 2021 by the authors. Licensee MDPI, Basel, Switzerland. This article is an open access article distributed under the terms and conditions of the Creative Commons Attribution (CC BY) license (https://creativecommons.org/licenses/by/4.0/).
Share and Cite
MDPI and ACS Style
Li, Y.; Chai, P.; Wang, Y.; Cheng, Z. Assessment of Chemical Fiber Air Filter for General Ventilation. Atmosphere 2021, 12, 1636. https://doi.org/10.3390/atmos12121636
AMA Style
Li Y, Chai P, Wang Y, Cheng Z. Assessment of Chemical Fiber Air Filter for General Ventilation. Atmosphere. 2021; 12(12):1636. https://doi.org/10.3390/atmos12121636
Chicago/Turabian StyleLi, Yanju, Pengchang Chai, Yu Wang, and Zelin Cheng. 2021. "Assessment of Chemical Fiber Air Filter for General Ventilation" Atmosphere 12, no. 12: 1636. https://doi.org/10.3390/atmos12121636
Note that from the first issue of 2016, this journal uses article numbers instead of page numbers. See further details here.