
Spatial and Temporal Distribution Characteristics and Source Apportionment of VOCs in Lianyungang City in 2018

1
Lianyungang Environmental Monitoring Center of Jiangsu Province, Lianyungang 222001, China
2
Jiangsu Environmental Monitoring Center, Nanjing 210036, China
3
Key Laboratory for Aerosol-Cloud-Precipitation of China Meteorological Administration, School of Atmospheric Physics, Nanjing University of Information Science & Technology, Nanjing 210044, China
4
Laboratoire des Sciences du Climat et l’Environnement, CNRS-CEA-UVSQ, 91191 Gif sur Yvette, France
*
Author to whom correspondence should be addressed.
Atmosphere 2021, 12(12), 1598; https://doi.org/10.3390/atmos12121598
Submission received: 7 October 2021
/
Revised: 9 November 2021
/
Accepted: 11 November 2021
/
Published: 29 November 2021
(This article belongs to the Section Air Quality)
Abstract
:From April to September 2018, five sampling sites were selected in Lianyungang City for volatile organic compounds (VOCs) analysis, including two sampling sites in the urban area (Lianyungang City Environmental Monitoring Supersite and Mine Design Institute), one sampling site in the industrial area (Deyuan Pharmaceutical Factory), and two sampling sites from the suburb (Hugou Management Office and YuehaiLou). The results showed that the mean VOCs concentration followed this pattern: industrial area (36.06 ± 12.2 µg m−3) > urban area (33.47 ± 13.0 µg m−3) > suburban area (27.68 ± 9.8 µg m−3). The seasonal variation of the VOCs trend in the urban and suburban areas was relatively consistent, which was different from that in industrial areas. The concentration levels of VOCs components in urban and industrial areas were relatively close, which were significantly higher than that in suburban areas. The possible sources and relative importance of VOCs in Lianyungang City atmosphere were measured by the characteristic ratio of toluene/benzene (T/B), ethane/acetylene (E/E) and isopentane/TVOCs. The contribution of traffic sources to the VOCs in Lianyungang City was significant (T/B ~ 2), and there were obvious aging phenomena in the five sampling sites (E/E > 4). The ratio of isopentane/TVOCs in the contribution of gasoline volatilization sources in urban and suburban areas was significantly bigger than that in industrial areas. According to the maximum incremental reactivity (MIR) method, aromatics (40.32–58.09%) contributed the most to ozone formation potential (OFP) at the five sampling sites. The top 10 OFP species showed that controlling n-hexane and aromatics, such as benzene, toluene, xylene, and trimethylbenzene in Lianyungang City can effectively control ozone generation. Nineteen typical VOCs components were selected and the sources of VOCs from five sampling points were analyzed by the principal component analysis (PCA) model. The sources of VOCs in different areas in Lianyungang were relatively consistent. Five sources were analyzed at the two sampling sites in the urban area: industrial emission + plants, vehicle exhaust, fuel evaporation, combustion and industrial raw materials. Four sources were analyzed in the industrial area: industrial emission + plants, vehicle exhaust, fuel evaporation and combustion. Five sources were analyzed at the two sampling sites in the suburban area: industrial emission + plants, vehicle exhaust, fuel evaporation, combustion and solvent usage.
1. Introduction
With the expansion of the city scale and the continuous increase of car ownership, a large number of pollutants are discharged into the air, which has led to severe air pollution in China. The regional composite pollution characterized by O3 and PM2.5 has been increasingly prominent [1], especially in recent years, and ozone concentration on the ground has an increasing trend [2,3], which has become the main pollutant next to PM2.5. As an important precursor of O3 and secondary organic particles, volatile organic compounds (VOCs) are regarded as the fuel of an atmospheric photochemical reaction process [4], which play an important role in the tropospheric photochemical cycle. In recent years, increasing attention has been paid to VOCs. It is very important to study the VOCs pollution level, composition and air reaction activity for the implementation of the national air pollution control plan, and for the effective control of atmospheric O3 and PM2.5 pollution.
In the last 10 years, most cities in China have carried out studies on the characteristics and sources apportionment of VOCs. Most of the domestic studies were concentrated in the Yangtze River Delta [5,6,7,8,9], Beijing–Tianjin–Hebei [10,11] and Pearl River Delta [12,13]. Yang et al. [9] studied the VOCs characteristics and ozone formation potential in Nanjing urban area, and found that alkanes were the most important VOCs components, while aromatics and alkenes had larger ozone generation potential. An et al. [5] reported the seasonal variation in the northern suburban area in Nanjing. The results showed that the VOCs concentration was high in summer and low in winter. The concentrations of alkanes and alkyne were the highest in winter, the alkenes were the highest in summer, and the aromatics were the highest in autumn. Based on the observation results of O3 and its precursors at three different functional stations in Shanghai in summer, Wang et al. [8] found that the consumption level of VOCs in Shanghai urban area was less than half of that in western suburbs. Li et al. [10] conducted synchronous observation at Beijing, Gucheng and Quzhou in Beijing–Tianjin–Hebei. The results showed that alkanes were the largest group of NMHCs (>50%). Alkenes played a predominant role in VOCs reactivity (OH reaction rate). Alkenes and aromatics were the largest contributors (47.65–61.53% totally) to the total ozone formation potential (OFP). Zheng et al. [14] conducted one-year observation in an oil and gas station in Northwest China (2014–2015). Positive matrix factorization (PMF) analysis identified five sources: natural gas (62.6%), fuel volatilization (21.5%), combustion source (10.9%), oil refining process (3.8%) and asphalt (1.3%). Zhang et al. [12] conducted a comprehensive observation of C2–C4 alkenes in the Pearl River Delta region. PMF was used to analyze that the main sources. The result confirmed that vehicle exhaust and liquefied petroleum gas (LPG) were the two major sources. Vehicle exhaust alone contributed 32–49% ethylene and 35–41% propene. LPG contributed the most to butene (38–65%) and substantially to propene (23–36%). On the whole, the distribution characteristics of VOCs changed obviously, with seasonal and daily variation. Influenced by local pollutants emissions and long-distance transport, the concentration level and chemical composition of VOCs were also quite different in spatial distribution. Although many studies have been carried out in the Yangtze River Delta to study the temporal and spatial variation characteristics of VOCs, the observation time was limited to a few weeks or only one observation site to represent the characteristics of urban atmospheric VOCs [5,15,16,17]. The research on long-term sampling analysis of VOCs was relatively scarce, and the comparative study on the long-term change of VOCs in different functional areas were more limited. Lianyungang is located in the northern Yangtze River Delta, at the junction of Jiangsu and Shandong. It is very vulnerable to the influence of polluting transport from Shandong, Northern China and Northeast China. It was also close to the Yellow Sea in the East and had a relatively developed tourism industry. Therefore, five sampling sites were selected in Lianyungang City, including two urban sampling sites, one industrial sampling site, and two suburban sampling sites. VOCs were collected from 1 April to 30 September 2018. SUMMA canisters (Entech Instruments, Inc., Simi Valley, CA, USA) were used for the sampling and gas chromatography–mass spectrometer/flame ionization detector (GC-MS/FID)(Agilent Technologies, Inc., Wood Dale, IL, USA) were used to analyze the concentration level of VOCs in the ambient air. The pollution characteristics and differences in VOCs from the different regions of Lianyungang city were compared and analyzed. The VOCs activity was evaluated by calculating the O3 formation potential according to the maximum incremental reactivity (MIR) method and the most critical VOCs species for O3 formation were identified. The principal component analysis (PCA) model was used to analyze the source of VOCs at different sampling sites.
2. Materials and Methods
2.1. Sampling Time and Sites
In order to reflect the overall VOCs pollution characteristics in Lianyungang, five sampling sites were selected from the urban area, industrial zone and the suburb of Lianyungang, including the Lianyungang City Environmental Monitoring Supersite (Supersite), Mine Design Institute (MDI), Deyuan Pharmaceutical Factory (DY), Hugou Management Office (HG) and Yuehailou (YHB). The geographical distribution and specific information of the sampling sites were shown in Table 1 and Figure 1. The sampling sites of the Supersite and MDI were located in the urban area, DY were located in the industrial area, and HG and YHB were located in the suburbs. All these sampling sites were at high-altitude with open space and no buildings or trees around.
2.2. Sample Collection and Analysis
The sampling campaign was conducted from 1 April to 30 September 2018. Samples were taken every 6 days. There were 31 samples at each sampling site, with a total of 155 samples. The samples of VOCs were collected in 3 L stainless steel SUMMA canisters. The samples were collected from 10:00 to 10:00 the next day with a pre-calibrated sampling head. The sampling time lasted for 24 h. Before sampling, the SUMMA canister was cleaned at least 3 times. In order to ensure cleanliness, at least one canister was selected for each 10 cleaning samples, filled with high-purity nitrogen for 24 h, and analyzed as a sample. This was to ensure that the target compound could not be detected or lower than the detection limit.
VOCs sample collection and analysis refer to the provisions of “Ambient air-Determination of volatile organic compounds-Collected by specially-prepared canisters and analyzed by gas chromatography/mass spectrometry (HJ 759-2015)” [18]. After sample collection, the analysis was completed within 20 days The 117 VOCs species composed of PAMS, TO-15 and carbonyls mixed standard gases were qualitatively and quantitatively analyzed by ENTECH 7200 preconcentration instrument and gas chromatography–mass spectrometry. The atmospheric VOCs were concentrated by ENTECH 7100 preconcentration instrument (Entech Instruments Inc., Simi Valley, CA, USA), and the interfering substances such as water and CO2 were removed at the same time and then injected into the chromatographic column (AB-1MS; 60 m × 0.32 mm × 1.0 μm). The samples were separated by chromatography, and then monitored by mass spectrometry, and quantified by an internal standard method. Analysis quality control requirements: (1) the blank was lower than the method detection limit (including instrument blank and nitrogen blank); (2) the linearity (1 × 10⁻⁹, 2.5 × 10⁻⁹, 5 × 10⁻⁹, 10 × 10−9, 15 × 10−9, 20 × 10−9) required that the relative standard deviation (RSD) of the relative response factor of the target should be no more than 30%; (3) the precision of each point should be ≤10%; (4) to run a parallel sample every time. The concentration information of 116 VOC species (including 56 PAMS species, 1,3-butadiene, 36 halogenated hydrocarbons, 22 oxygen-containing VOCs and carbon disulfide) was obtained from the sample analysis of the VOCs SUMMA canister.
2.3. Other Data
The monitoring data of ambient air NO2, PM2.5 and O3 were obtained from the air automatic monitoring site of Lianyungang environmental monitoring station, which is a national control station. Meteorological data, such as wind speed and direction, were from the observation results of Jiangsu meteorological station in Lianyungang City. NO2 and PM2.5 monitors were regularly sampled and calibrated in accordance with national technical specifications. O3 monitors were traceable to the ozone primary standard reference Photometer (SRP52) of Jiangsu environmental monitoring center every year, and SRP52 was traceable to the ozone standard reference Photometer (SRP0) of US NIST every two years.
2.4. Principal Component Analysis
Principal component analysis (PCA) is a statistical method for the dimensionality reduction of a group of variables. It includes three steps: singular value decomposition, dimension selection and rotation. It was divided into the following steps. First, we standardized the data, as shown in Equation (1):
In Equation (1), Zik was the normalized concentration value (dimensionless), cik was the concentration of compound i in the k-th observation, ci was the arithmetic mean value of cik, and σi was the standard deviation. The basic formula of PCA method is shown as follows:
In Equation (2), Wij was the factor load (dimensionless), which is the correlation coefficient between compound i and factor j obtained from principal component analysis; Pjk was the factor score (dimensionless). More details about the PCA model can be found in the literature [19,20].
In this study, the PCA analysis module of SPSS software was used to analyze the mass concentration of VOCs components in Lianyungang, and the source of VOCs was determined according to the calculated component factors and the load values in each factor.
3. Results and Discussion
3.1. Meteorological Characteristics and Volatile Organic Compounds (VOCs) Characteristics in Different Seasons
Lianyungang City is in the southern part of the warm temperate zone. Due to the close proximity to the ocean, the climate type is classified as humid monsoon climate, with a few marine characteristics. The weather is cold and dry in winter and hot and rainy in summer. Figure 2 shows the wind rose map of the different seasons in Lianyungang. It showed that the prevailing wind direction was the same in spring and summer, mainly east, and ENE, NE, E and SN in autumn.
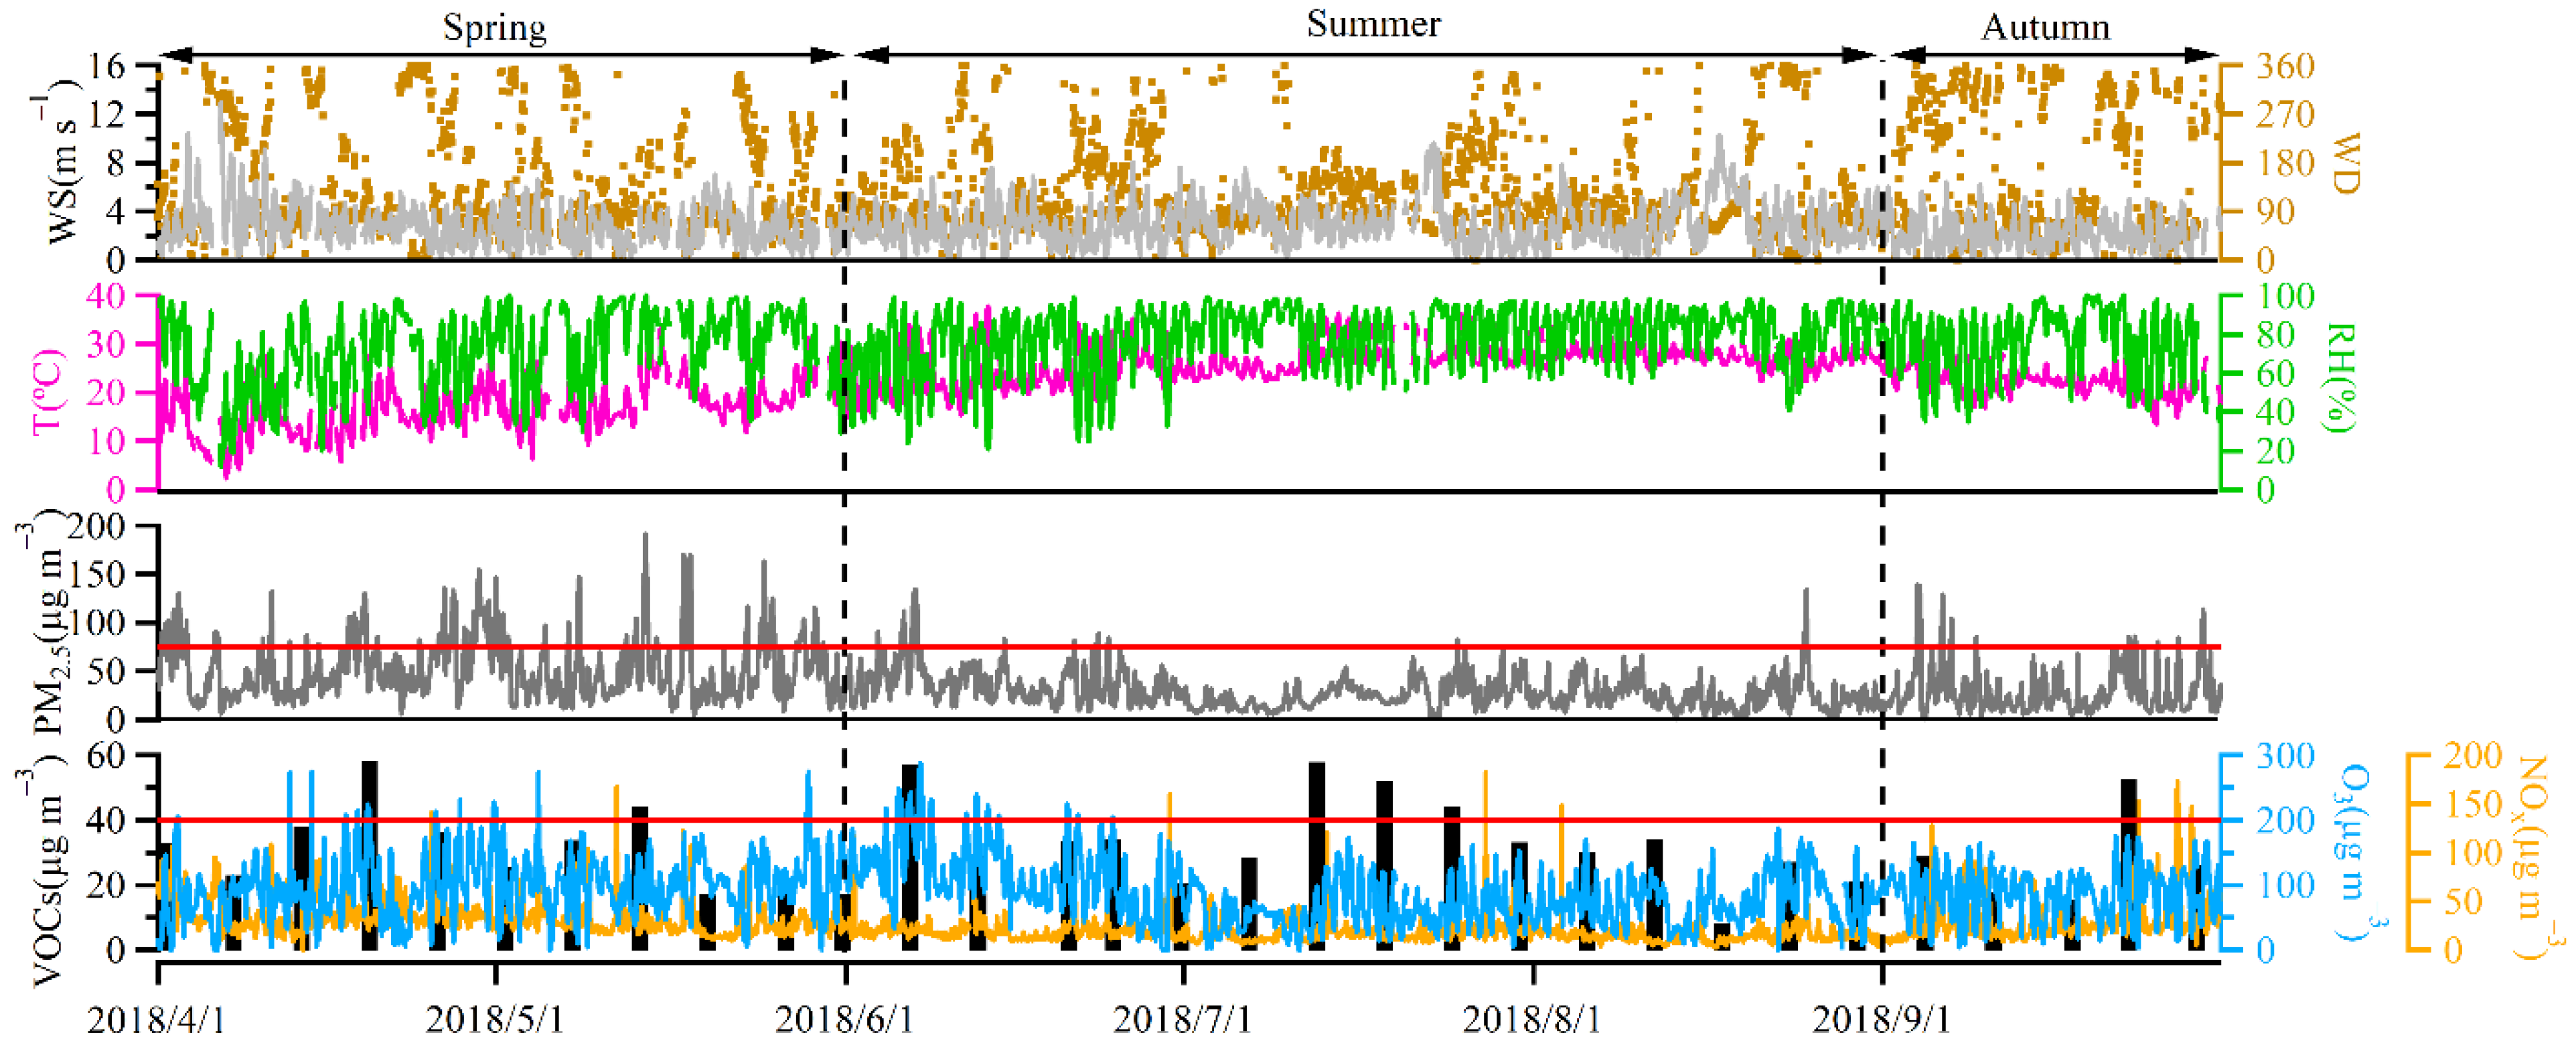
As shown in Figure 3, PM2.5 pollution in spring was relatively serious, and the concentration exceeded the secondary standard of national air quality. The average concentration of PM2.5 in spring was 51 ± 29.1 µg m−3, and PM2.5 concentration in summer was within the standard. The average concentration of PM2.5 in autumn was slightly lower than that in summer, but the average wind speed (2.15 ± 1.0 m s−1) in autumn was lower than that in the summer (2.93 ± 1.3 m s−1), which was not conducive to the diffusion of pollutants.
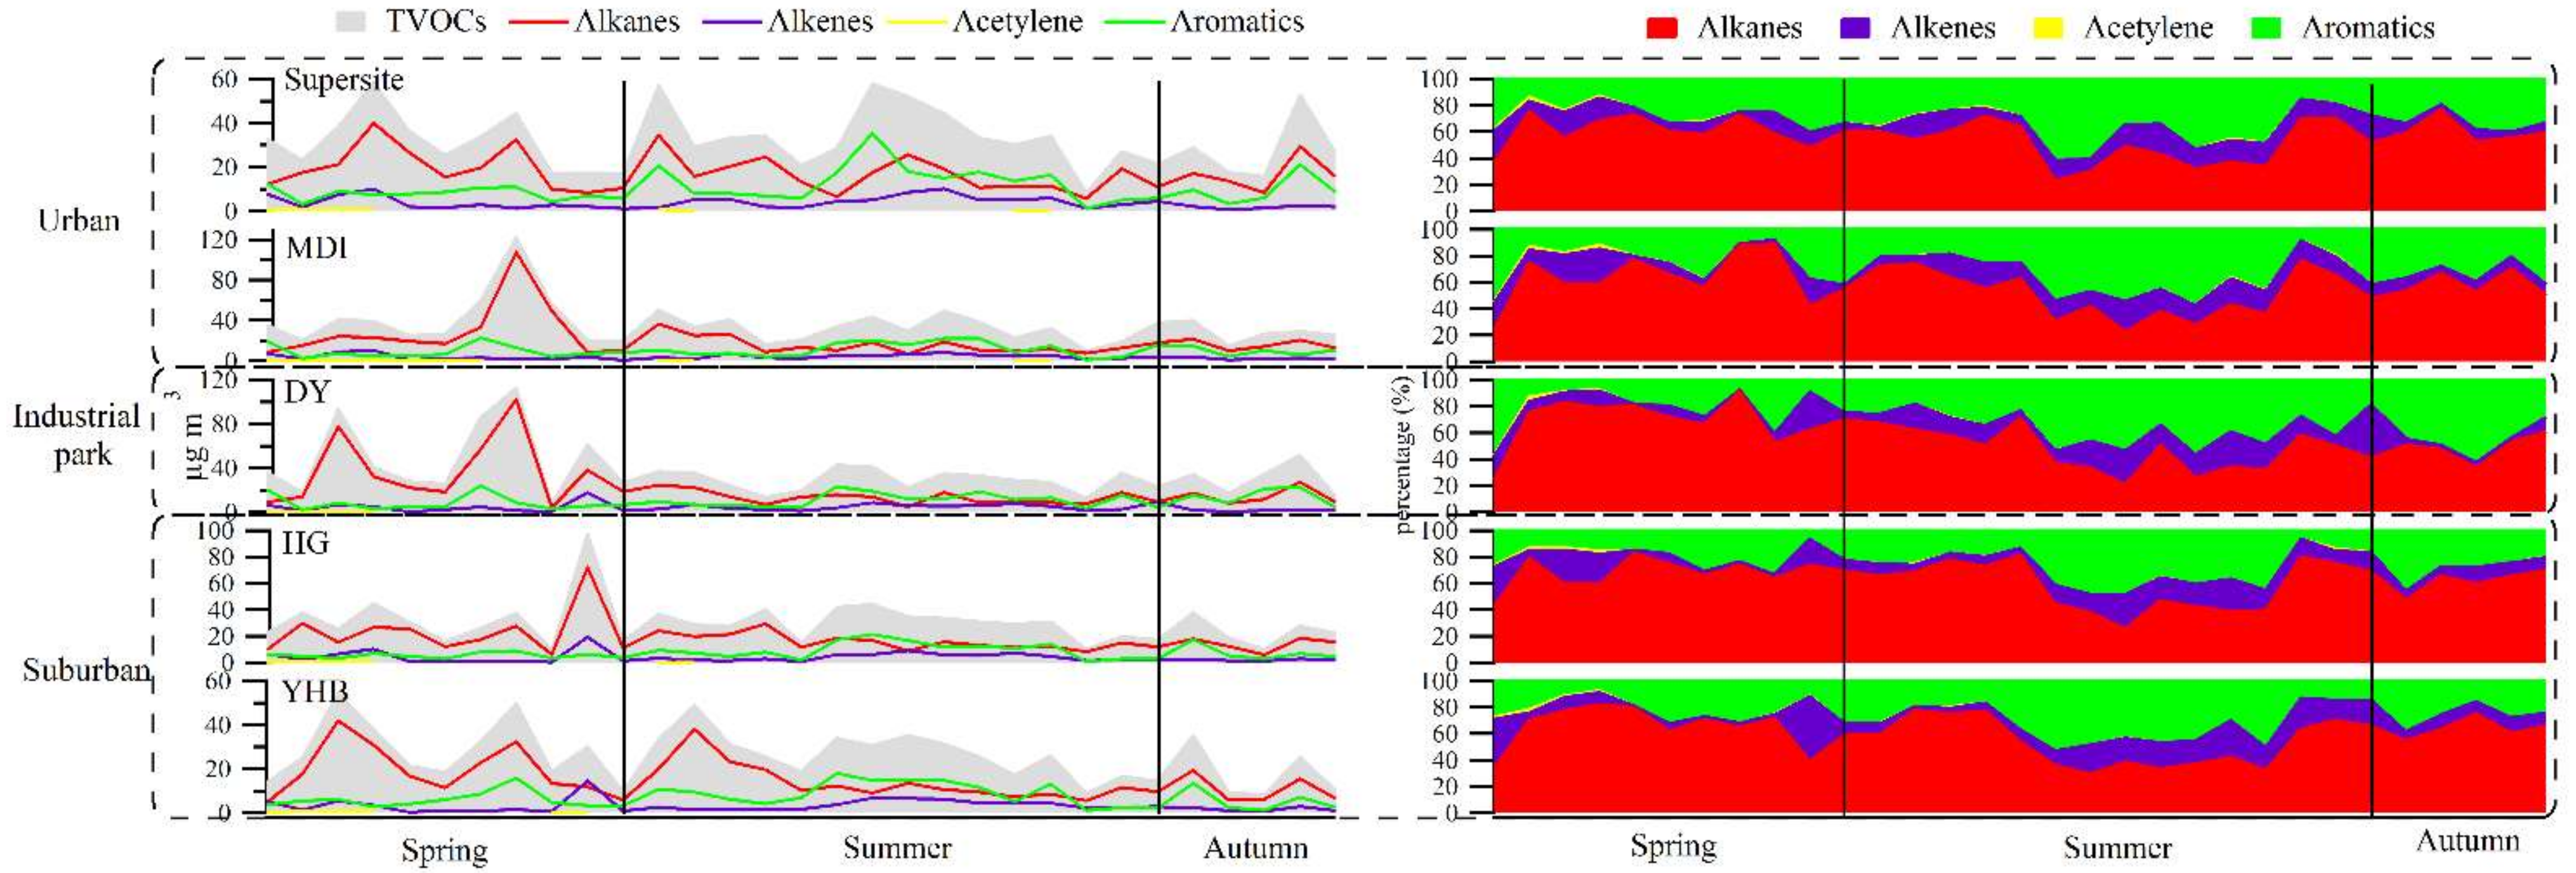
In Figure 3, the high value of ozone concentration appeared with the high value of VOCs concentration, of which the O3 pollution event on 6 June was the most obvious. The high value of VOCs concentration was observed in July, but there was no high ozone concentration. Combined with the meteorological parameters and Figure 4, it was not difficult to see that the dominant wind direction in Lianyungang was east on 12–24 July and the aromatics concentration increased significantly. Moreover, the high aromatics concentrations observed in DY, HG and YHB was earlier than that at the Supersite on 6 July. It showed that the high VOCs concentration was caused by pollution transmission from the east. As a result of the transport of pollutants, VOCs were transported by east wind from the east of Lianyungang to the Supersite, resulting in the increase of aromatics concentration and VOCs concentration.
By comparing the concentration of VOCs components at different sampling sites (Figure 4), there were regional differences in VOCs concentration, i.e., industrial area (36.06 ± 12.2 µg m−3) > urban area (33.47 ± 13.0 µg m−3) > suburban area (27.68 ± 9.8 µg m−3), but the proportions of the components were similar, all were alkanes > aromatics > alkenes > alkynes. At the HG site, alkanes and alkenes accounted for the highest proportion, for 60.47% and 12.90%, respectively, and aromatics accounted for the lowest proportion, for 25.50%. At the Supersite, alkanes contributed the lowest (54.09%) and aromatics the highest (32.86%).
The VOCs concentration had obvious seasonal variation, with the highest in spring and the lowest in summer. Due to the prevailing northeast wind in summer, the VOCs concentration at the Supersite was the highest in summer due to the impact of pollutant transport from the industrial and suburban areas. YHB was located around a scenic spot. In summer, due to the impact of human emissions in the tourism peak season, VOCs concentration was also maintained at a high level and reached the lowest level in autumn. The proportion of VOCs components also had obvious seasonal variations. The trend of VOC concentrations at the five sampling sites were relatively consistent, with the largest proportion of alkanes in spring. In summer, the proportion of aromatics and alkenes increased, and in autumn, the proportion of alkanes increased. Table 2, Table 3 and Table 4 showed the average concentrations of VOCs components at the five sampling sites in different seasons. Among the five sampling sites, the concentration of VOCs at YHB, which was located in the suburban area, was the lowest. Although the concentration of VOCs increased in spring and summer due to the impact of the tourist season, it was still at a lower level compared with other sampling sites.
Table 1, Table 2 and Table 3 analyze the differences in the concentration of VOCs between different sampling points in the same functional area. It can be seen from the table that the concentration of alkanes in the MDI in spring is significantly greater than that of the Supersite; the concentration of aromatics in the HG in autumn is significantly greater than that of the YHB.
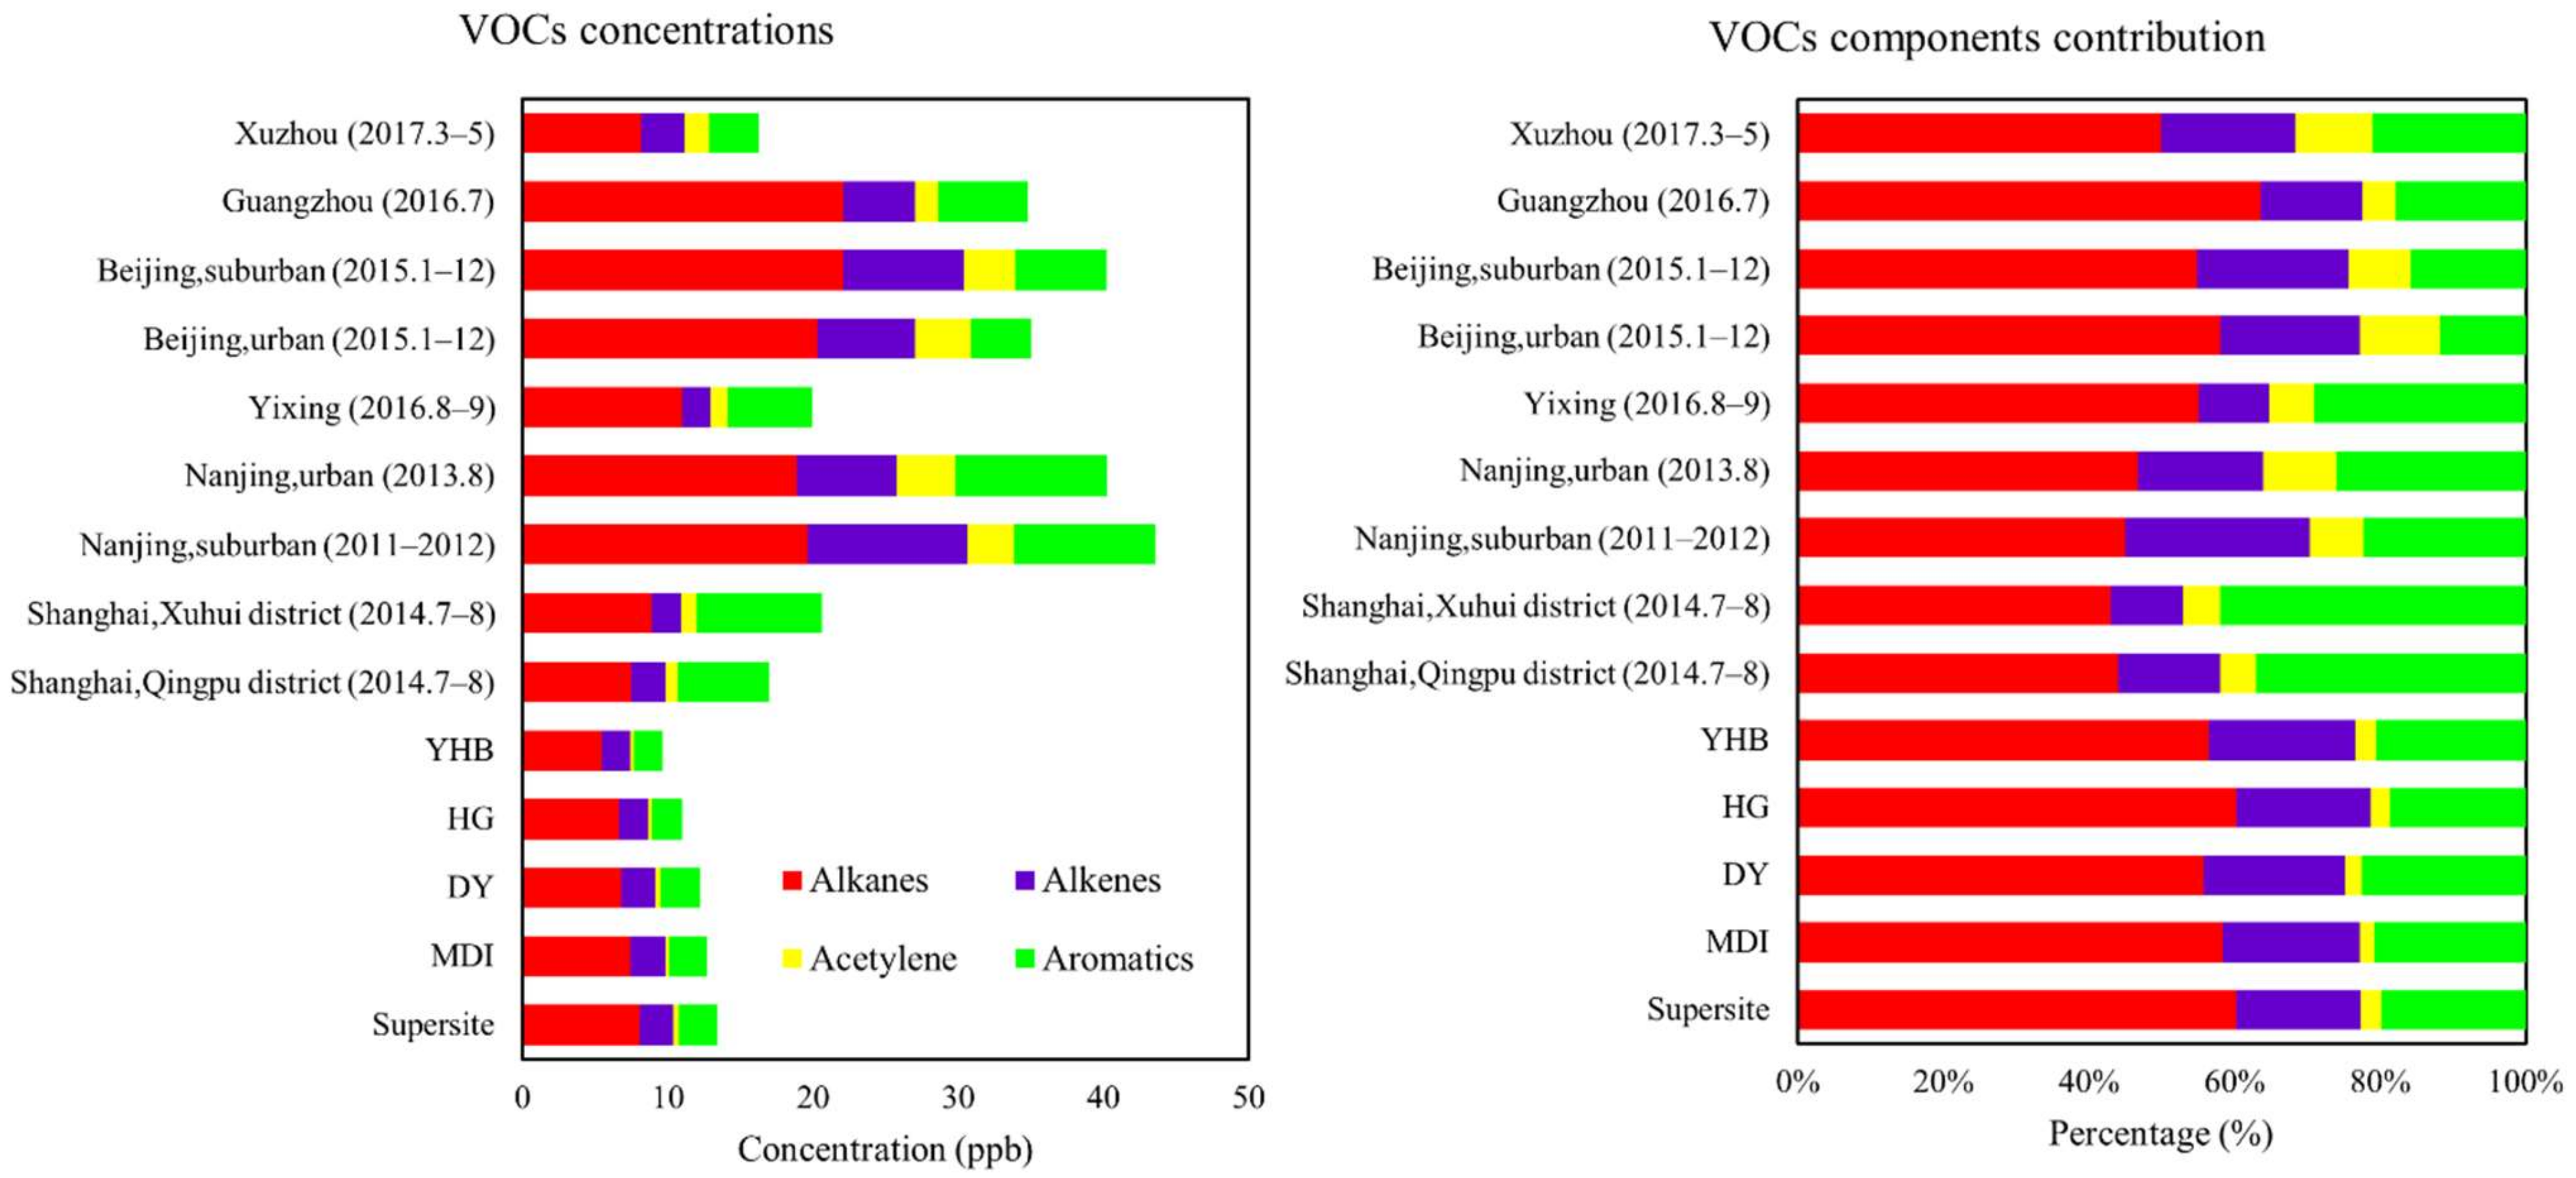
Comparing the concentrations and proportions of VOCs at the five sampling sites in Lianyungang with that in other cities (Figure 5), including Qingpu and Xuhui districts in Shanghai [8], Nanjing northern suburban area [5], Nanjing urban area [9], Yixing [21], urban and suburban areas in Beijing [22], Guangzhou [23] and Xuzhou [24] (for the convenience of comparison, the VOCs concentration was measured in ppb), it can be seen that the VOCs concentration in Lianyungang City was significantly lower than that in other cities. The concentrations of VOCs among the five sampling sites in Lianyungang were the highest at the Supersite, by 13.40 ppb, which was lower than that in Xuzhou (16.28 ppb), in which the VOC concentration was the lowest among other cities. The concentrations of VOCs in Beijing, Guangzhou and Nanjing were about 2–3 times higher than that in Lianyungang. The VOCs concentrations in the suburbs of Shanghai, Yixing and Xuzhou were relatively low, but they were also 20–100% higher than that in Lianyungang. The VOCs components were similar at the five sampling sites in Lianyungang. The proportions of alkanes, alkenes and aromatics were similar to those in Beijing, Guangzhou and Yixing. However, the proportion of acetylene was significantly lower than that in other cities. Therefore, the VOCs concentration in Lianyungang was lower than that in other cities in China, but the VOCs components were similar to those of other cities, while the proportion of acetylene was lower than that in other cities.
3.2. Seasonal Variation of VOCs Components
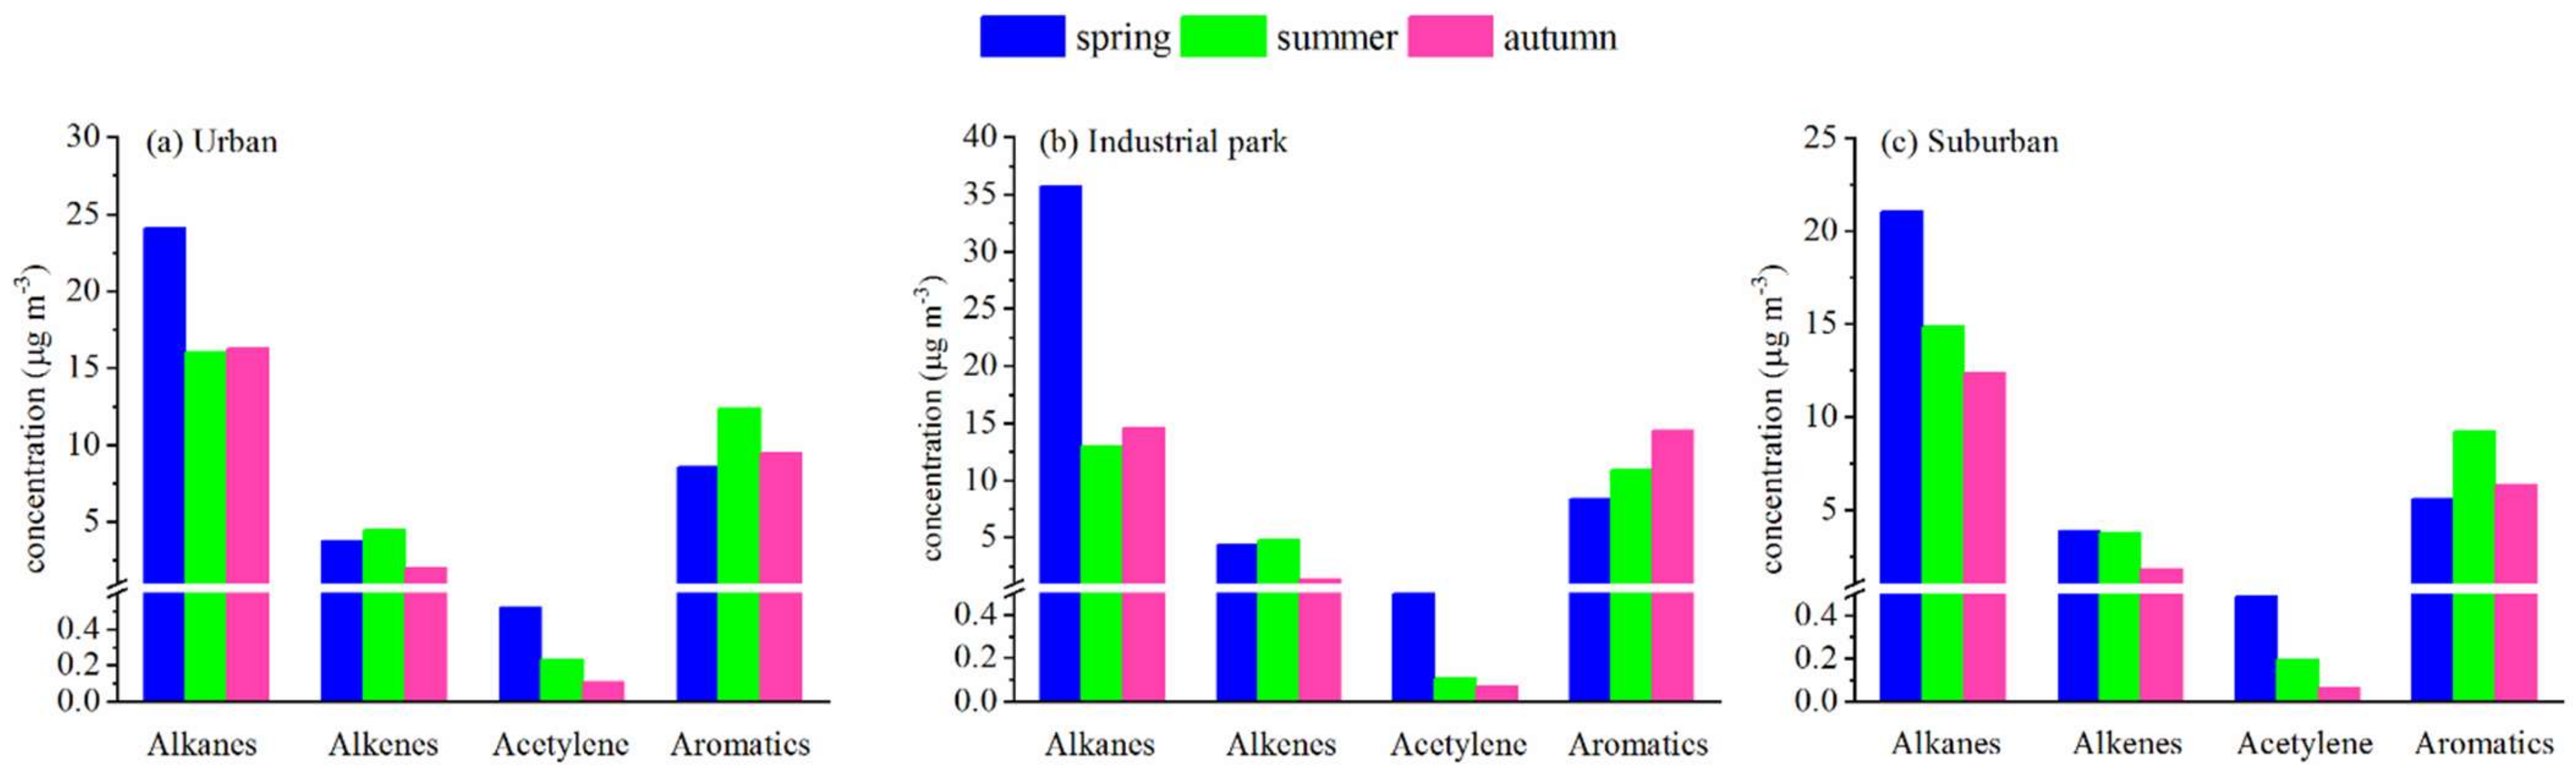
Figure 6 showed the seasonal comparison of VOCs components in different areas in Lianyungang. The concentrations of alkanes in urban, industrial and suburban areas were the highest in spring, by 24.11 ± 10.9 µg m−3, 35.72 ± 16.8 µg m−3 and 21.03 ± 12.0 µg m−3, respectively. The concentrations of alkanes in urban and industrial areas in summer were similar to those in autumn and the highest in spring. While the concentrations of alkanes in suburbs in summer were higher than those in autumn, by 14.85 ± 6.5 µg m−3 and 12.33 ± 5.2 µg m−3, respectively. The concentrations of alkenes in the suburban areas were similar in spring and summer, at 3.85 ± 1.5 µg m−3 and 3.77 ± 1.5 µg m−3, respectively, slightly lower than those in the urban and industrial areas. The seasonal variation trend of acetylene was consistent at different functional areas, the highest in spring (0.49 ± 0.2 µg m−3 − 0.52 ± 0.2 µg m−3), followed by that in summer (0.10 ± 0.0 µg m−3 − 0.23 ± 0.1 µg m−3) and the lowest in autumn (0.07 ± 0.0 µg m−3 − 0.10 ± 0.0 µg m−3). The concentration level of acetylene at different functional areas was also negligible for different seasons. The seasonal variations of aromatics concentrations in urban and suburban areas were similar, with the highest in summer (12.36 ± 5.8 µg m−3 and 9.22 ± 4.6 µg m−3) and the lowest in spring (8.55 ± 4.4 µg m−3 and 5.57 ± 4.1 µg m−3), while the highest in autumn (14.35 ± 6.8 µg m−3) and the lowest in spring (8.37 ± 4.2 µg m−3) in the industrial area. Due to the relatively stable aromatics emission sources, the wind speed in autumn was significantly smaller than that in spring and summer (Figure 2 and Figure 3), which was not conducive to the pollutants diffusion, the concentration of aromatics in industrial area was the highest in autumn. In general, the VOCs components seasonal variation trends in the urban and suburban areas were relatively consistent, which was different from that in industrial area. The concentrations levels of VOCs components in urban and industrial areas were relatively close, which is significantly higher than that in suburban areas.
3.3. Seasonal Variation of Typical VOCs Species
Table 5 showed the seasonal comparison of typical VOCs species in different areas in Lianyungang. The concentrations of ethane, propane, ethylene, and acetylene in urban, industrial and suburban areas were the highest in spring. Among them, the concentrations of ethane and propane in autumn were second only to those in spring and the lowest in summer; the concentration of ethylene and acetylene in summer was second only to spring and the lowest in autumn. In addition, the concentration of benzene also had the same seasonal variation in different functional areas, showing that it was greater in autumn than in spring than in summer.
The seasonal trend of isopentane concentration in urban and suburban areas was relatively consistent, with the highest concentration in autumn and the lowest in summer. The concentration levels of isopentane in the industrial area in summer and autumn were relatively consistent, 0.76 ± 0.6 and 0.94 ± 0.4µg m−3, respectively, which were slightly lower than the isopentane concentrations in urban and suburban areas. This may be due to the fact that the source of gasoline volatilization in industrial areas was smaller than that in urban and suburban areas.
The seasonal trends of ethylbenzene and m/p-xylene were similar in urban and suburban areas, and both were the highest in summer. The m/p-xylene in the industrial areas was the highest in autumn and the lowest in spring, which was in line with the changing trend of aromatic hydrocarbon components.
3.4. Specific Species Ratios
Because the emission ratio of different pollution sources to some specific VOC species were different, the possible sources and relative importance of VOCs in the atmosphere can be determined preliminarily by using these specific VOC species. It is generally believed that in urban areas, the ratio of toluene to benzene (T/B) of about 2 indicated that atmospheric VOCs was significantly affected by vehicle emissions [25]; if it was greater than 2, it may also be affected by solvent coating and industrial processes [26]; if it was significantly lower than 0.7, it may be affected by coal and biomass combustion [25,27,28]. In Figure 7, the T/B values at the five sampling sites are all around 2, indicating that the traffic source in Lianyungang had a significant contribution to the atmospheric VOCs.
Ethane/acetylene (E/E) is usually used to measure the atmospheric chemical reaction progress and photochemical age in air masses. According to Chen, et al. [6], the E/E ratio of fresh air mass was 0.47 ± 0.26. Because acetylene is more reactive than ethane, it is consumed relatively fast in atmospheric chemical reactions, and the E/E ratio changes with the photochemical process. The larger the value, the longer the photochemical age of air mass, and the more obvious the aging of air mass. In Figure 7, The E/E values were all greater than 4, indicating that obvious aging airmass existed at all five sampling sites. The airmass at HG was the most seriously aged, followed by that at DY, the sampling site in the industrial area. Combined with the geographical location of HG and DY in Figure 1, it can be seen that HG was surrounded by mountains on three sides, which was not conducive to the pollutants’ diffusion, leading to serious air mass aging. About 2 kilometers to the east of DY is the Huaguo Mountain scenic area, and the prevailing wind direction in Lianyungang was mainly east, which blocked the transportation of pollutants discharged by DY by east air flow, resulting in air mass aging.
Isopentane is the indicator for gasoline evaporation [29], and it can be seen from Figure 7 that the contributions of gasoline evaporation source in urban and suburban sampling sites were significantly greater than that in industrial area. Due to the high car ownership in urban area and the dense distribution of gas stations, the contribution of gasoline evaporation sources was large. Suburban sampling sites were located around the scenic spot, with a large flow of people and the contribution of vehicle gasoline evaporation and gas station gasoline evaporation was also large.
3.5. Ozone Formation Potential (OFP) Analysis
We used Carter’s research [30] to calculate the maximum incremental activity (MIR) correction value to calculate the ozone formation potential (OFP) of VOCs as shown in Equation (3):
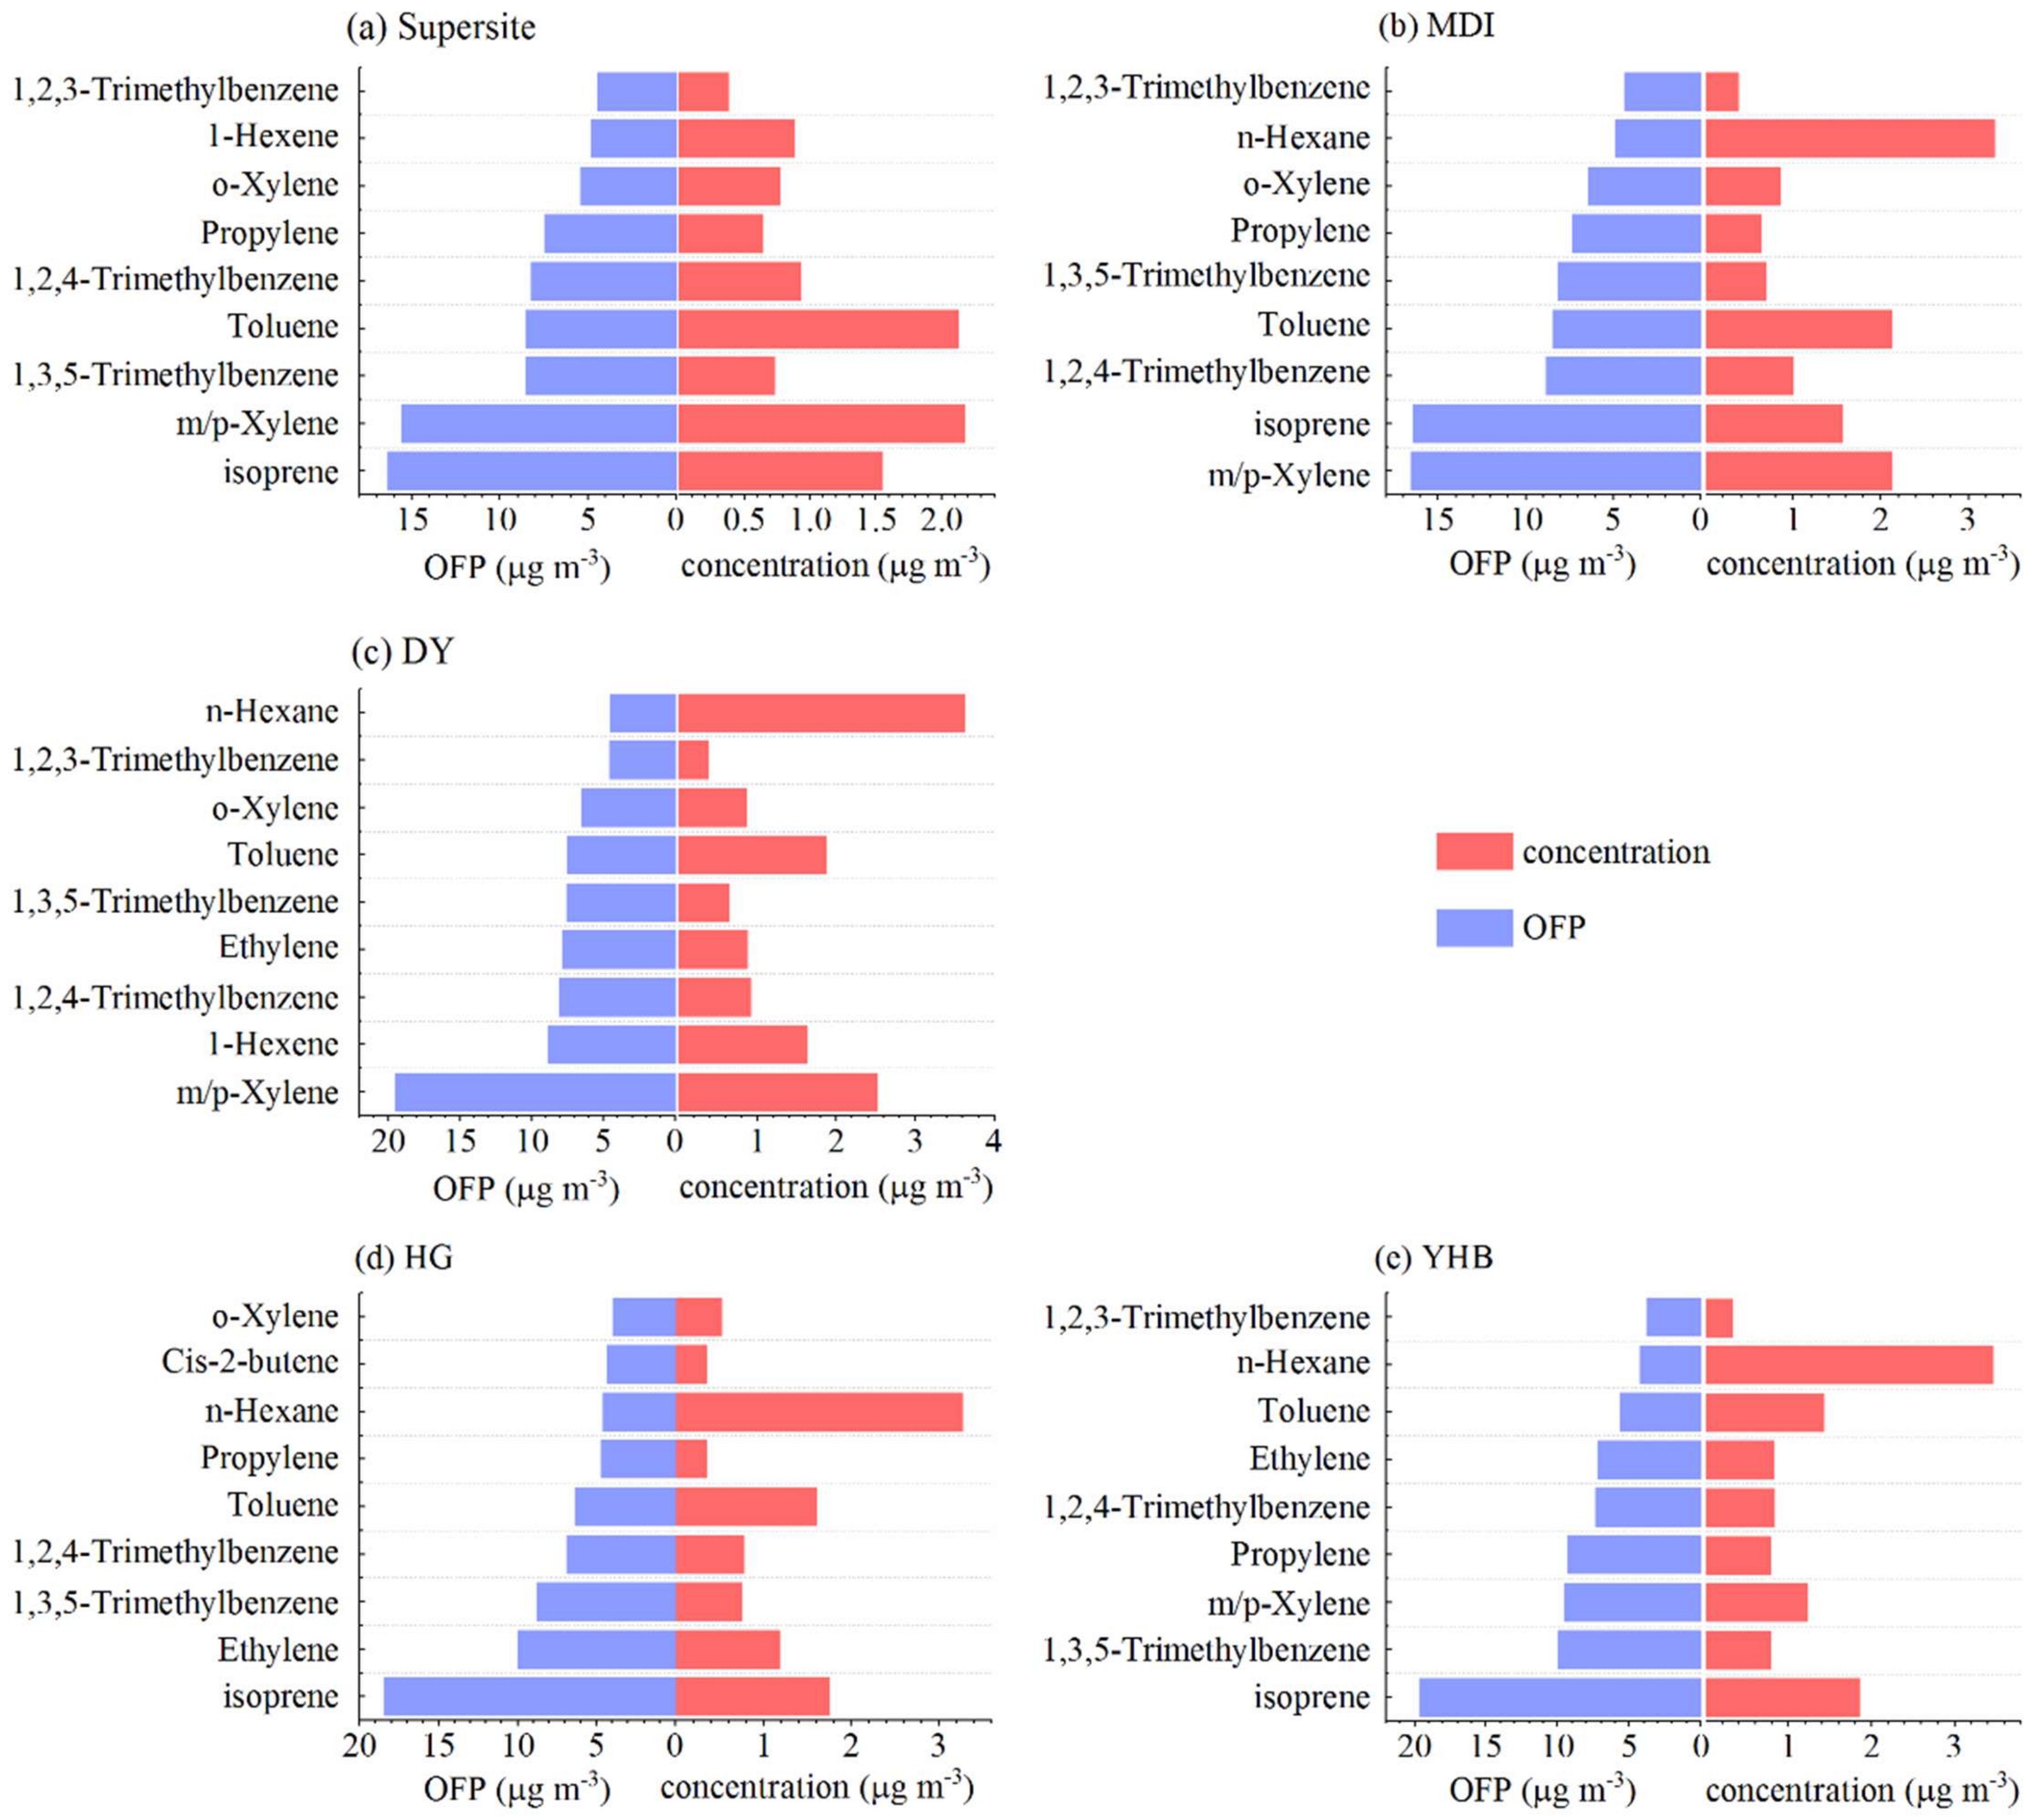
In the Equation (3), [VOCs]i was the measured atmospheric environmental VOCs species mass concentration, unit: µg m−3, MIRi was the ozone formation coefficient of compounds in the maximum incremental reaction. As shown in Table 6, the OFP of VOCs components in each sampling site during the observation period was calculated. Aromatics (40.32–58.09%) and alkenes (20.88–39.65%) contributed the most to OFP in each sampling site, followed by alkanes (21.03%) at DY. The OFP in the urban area was the largest, with an average of 141.38 ± 69.6 µg m−3, followed by that in the industrial area (127.74 ± 56.3 µg m−3), and that in the suburban area was the lowest, by 124.19 ± 55.9 µg m−3. It can be seen from Table 4 that the contributions of alkenes to the total OFP in urban and suburban areas were significantly higher than that in industrial area. In combination with the top 10 species of OFP in each sampling site in Figure 8, the OFP of isoprene in urban and suburban sampling points was very important to the total OFP, and the concentration level of isoprene was also high. However, isoprene did not appear in the top 10 species of OFP at the DY site in the industrial area, indicating that the vegetation coverage in urban and suburban areas was good. As a result, the contributions of alkenes to OFP were much higher than that at DY. n-Hexane was the highest concentration species in the top 10 species of OFP and, although its MIR coefficient was small, it was still the alkane species that contributed the most to OFP. In general, the control of n-hexane and aromatics (toluene, xylene and trimethylbenzene) in Lianyungang can effectively control the formation of ozone.
3.6. Principal Component Analysis (PCA)
Nineteen typical components of VOCs were selected and the sources of VOCs at the five sampling sites were analyzed by PCA. According to the research of Thurston (1987), when n ≥ m + 50 (n represents the number of samples, M represents the number of pollutants to be analyzed), reliable PCA results can be obtained. VOC concentrations data measured in Lianyungang met this requirement. Tables S1–S5 showed the PCA analysis results at the Supersite, MDI, DY, HG and YHB respectively. Only the load values greater than 0.4 are shown in the tables. The cumulative explanatory variance of each sampling site was 74.38%, 74.91%, 91.77%, 75.13% and 76.40% respectively.
It can be seen from Table S1 that five sources were identified at the Supersite. Factor 1 is mainly composed of propane, butane and pentane. Propane and butane are the main components of LPG/NG [31], and pentane is the tracer of gasoline evaporation [29,32]. Therefore, factor 1 is summarized as fuel evaporation. The higher load values in factor 2 were isoprene, ethylbenzene, xylene, styrene and trimethylbenzene, Isoprene was the tracer of plant emissions, and there were certain emissions in industrial processes [31], and the other components were also discharged from industrial processed. The main components of factor 3 were n-hexane, benzene, toluene, ethylbenzene and xylene. Hexane evaporates from gasoline and its additives [33]. Benzene, toluene, ethylbenzene and xylene were mainly from the exhausts of gasoline vehicles and motorcycles [34]. Therefore, it is proposed factor 3 was the emission source of vehicle exhausts. The main components of factor 4 were ethane, propane, ethylene and acetylene. The C2–C3 came from incomplete combustion processes [27]. It is proposed this factor was the combustion source. Factor 5 had the highest propylene loading value. Propylene was an important industrial raw material [12], and may also have come from incomplete combustion, thus, factor 5 was proposed to be the industrial raw materials source.
Tables S2–S5 summarize the sources of the other four sampling sites. Solvent usage source was analyzed at the HG and YHB sites, and the characteristic species was n-hexane [35]. According to Tables S2–S5, the VOCs sources in different areas of Lianyungang were relatively consistent, including industrial emissions, plants, vehicle exhaust, fuel evaporation, combustion, industrial raw materials and solvent usage.
4. Conclusions
- (1)
- Ozone pollution in Lianyungang was the most serious in May and June, and the high value of ozone concentration appeared at the same time with the high value of VOCs concentration. Comparing the concentration variation of VOCs at different sampling sites, they were industrial area (36.06 ± 12.2 µg m−3) > urban area (33.47 ± 13.0 µg m−3) > suburban area (27.68 ± 9.8 µg m−3).
- (2)
- The seasonal variation of VOCs was approximately the same in the urban and suburban areas, which was different from that in the industrial area. While the concentrations of different components were at similar levels in the urban and industrial areas, which were significantly higher than that in the suburban area.
- (3)
- The possible sources and relative importance of VOCs in Lianyungang City were measured by the ratio of toluene/benzene (T/B), ethane/acetylene (E/E) and isopentane /TVOCs. The results showed that traffic sources of VOCs may dominate in Lianyungang City (/B ~ 2), and there were obvious aging phenomena at the five sampling sites (E/E > 4). The ratio of isopentane/TVOCs implied that the contribution of gasoline volatilization sources in urban and suburban areas may contribute more than those in industrial area.
- (4)
- Aromatics (40.32–58.09%) contributed the most to OFP at the five sampling sites. The top 10 OFP species showed that controlling n-hexane and aromatics, such as benzene, toluene, xylene, and trimethylbenzene, in Lianyungang City can effectively control ozone generation.
- (5)
- The sources of VOCs in different areas in Lianyungang were relatively consistent. Five sources were analyzed at the two sampling sites in urban areas: industrial emission + plants, vehicle exhaust, fuel evaporation, combustion and industrial raw materials. Four sources were analyzed in industrial areas: industrial emission + plants, vehicle exhaust, fuel evaporation and combustion. Five sources were analyzed at the two sampling sites in the suburban area: industrial emission + plants, vehicle exhaust, fuel evaporation, combustion and solvent usage.
Supplementary Materials
The following are available online at https://www.mdpi.com/article/10.3390/atmos12121598/s1, Table S1: PCA analysis of VOCs at Supersite, Table S2: PCA analysis of VOCs at MDI, Table S3: PCA analysis of VOCs at DY, Table S4: PCA analysis of VOCs at HG, Table S5: PCA analysis of VOCs at YHB.
Author Contributions
Data curation, Y.Z.; Formal analysis, S.Z.; Methodology, L.T.; Writing—original draft, C.C.; Writing—review & editing, L.W. All authors have read and agreed to the published version of the manuscript.
Funding
This research was funded by Jiangsu Provincial Department of Ecology and Environment, grant number 2019023.
Institutional Review Board Statement
Not applicable.
Informed Consent Statement
Not applicable.
Acknowledgments
This work was supported by Jiangsu Provincial Fund on PM2.5 and O3 pollution mitigation (2019023). We also gratefully acknowledge the review provided by four anonymous reviewers.
Conflicts of Interest
The authors declare no conflict of interest.
References
- Guo, S.; Hu, M.; Zamora, M.L.; Peng, J.; Zhang, R. Elucidating severe urban haze formation in China. Proc. Natl. Acad. Sci. USA 2014, 111, 17373–17378. [Google Scholar] [CrossRef] [PubMed] [Green Version]
- Likun, X.; Tao, W.; Louie, P.K.K.; Luk, C.W.Y.; Blake, D.R.; Zheng, X. Increasing external effects negate local efforts to control ozone air pollution: A case study of Hong Kong and implications for other Chinese cities. Environ. Sci. Technol. 2014, 48, 10769–10775. [Google Scholar]
- Zhang, Q.; Yuan, B.; Shao, M.; Wang, X.; Liu, S. Variations of ground-level O3 and its precursors in Beijing in summertime between 2005 and 2011. Atmos. Chem. Phys. 2014, 14, 6089–6101. [Google Scholar] [CrossRef] [Green Version]
- Ke, L.; Jacob, D.J.; Liao, H.; Shen, L.; Bates, K.H. Anthropogenic drivers of 2013–2017 trends in summer surface ozone in China. Proc. Natl. Acad. Sci. USA 2019, 116, 422–427. [Google Scholar]
- An, J.L.; Zhu, B.; Wang, H.L.; Yang, H. Variation characteristics and source analysis of atmospheric VOCs in the northern suburbs of Nanjing. Environ. Sci. 2014, 12, 4454–4464. [Google Scholar]
- Chen, C.H.; Su, L.Y.; Wang, H.L.; Huang, C.; Li, L.; Zhou, M.; Qiao, Y.Z.; Chen, Y.R.; Chen, M.H.; Huang, H.Y.; et al. Annual variation characteristics and key active components of VOCs in Shanghai urban area. J. Environ. Sci. 2012, 32, 367–376. [Google Scholar]
- Gao, Z.J.; Gao, S.; Cui, H.X.; Fu, Q.Y.; Jin, D.; Liang, G.P.; Fang, F. Study on VOCs Characteristics and Activity of Typical Photochemical Process in Summer in a Chemical Industry District in Shanghai. J. Environ. Sci. 2017, 37, 1251–1259. [Google Scholar]
- Wang, H.L. The relationship between chemical depletion of volatile organic compounds and ozone production in Shanghai. Environ. Sci. 2015, 9, 3159–3167. [Google Scholar]
- Yang, X.X.; Tang, L.L.; Zhang, Y.J.; Mu, Y.F.; Wang, M.; Chen, W.T.; Zhou, H.C.; Hua, Y.; Jiang, R.X. Correlation analysis of characteristics of VOCs and O3 generation potential in Nanjing summer urban area. Environ. Sci. 2016, 2, 443–451. [Google Scholar]
- Li, L.; Xie, S.; Zeng, L.; Wu, R.; Jing, L. Characteristics of volatile organic compounds and their role in ground-level ozone formation in the Beijing-Tianjin-Hebei region, China. Atmos. Environ. 2015, 113, 247–254. [Google Scholar] [CrossRef]
- Luo, D.T.; Gao, J.; Wang, S.L.; Zhang, Y.C.; Zhang, M.; Chai, F.H. Analysis of characteristics of atmospheric volatile organic compounds and related pollutants in autumn in Beijing. J. Univ. Chin. Acad. Sci. 2014, 31, 329–336. [Google Scholar]
- Zhang, Y.; Wang, X.; Zhou, Z.; Lv, S.; Li, L. Sources of C2-C4 alkenes, the most important ozone nonmethane hydrocarbon precursors in the Pearl River Delta region. Sci. Total Environ. 2015, 502, 236–245. [Google Scholar] [CrossRef]
- Zou, Y.; Deng, X.J.; Zhu, D.; Gong, D.C.; Wang, H. Characteristics of 1 year of observational data of VOCs, NOx and O3 at a suburban site in Guangzhou, China. Atmos. Chem. Phys. 2015, 15, 6625–6636. [Google Scholar] [CrossRef] [Green Version]
- Zheng, H.; Kong, S.F.; Xing, X.L.; Mao, Y.; Hu, T.P.; Ding, Y.; Li, G.; Liu, D.T.; Li, S.L.; Qi, S.H. Monitoring of volatile organic compounds (VOCs) from an oil and gas station in northwest China for 1 year. Atmos. Chem. Phys. 2018, 18, 4567–4595. [Google Scholar] [CrossRef] [Green Version]
- Li, L.; An, J.Y.; Shi, Y.Y.; Zhou, M.; Wu, J. Source apportionment of surface ozone in the Yangtze River Delta, China in the summer of 2013. Atmos. Environ. 2016, 144, 194–207. [Google Scholar] [CrossRef]
- Shao, P.; An, J.L.; Xin, J.Y.; Wu, F.K.; Wang, J.X.; Ji, D.S.; Wang, Y.S. Source apportionment of VOCs and the contribution to photochemical ozone formation during summer in the typical industrial area in the Yangtze River Delta, China. Atmos. Res. 2016, 176, 64–74. [Google Scholar] [CrossRef]
- Xu, Z.; Huang, X.; Nie, W.; Chi, X.; Xu, Z.; Zheng, L.; Sun, P.; Ding, A. Influence of synoptic condition and holiday effects on VOCs and ozone production in the Yangtze River Delta region, China. Atmos. Environ. 2017, 168, 112–124. [Google Scholar] [CrossRef]
- Ministry of Ecology and Environment of the People’s Republic of China. Ambient Air-Determination of Volatile Organic Compounds-Collected by Specially-Prepared Canisters and Analyzed by Gas Chromatography/Mass Spectrometry (HJ 759-2015); Ministry of Ecology and Environment of the People’s Republic of China: Beijing, China, 2015. [Google Scholar]
- Thurston, G.D.; Spengler, J.D. A Quantitative Assessment of Source Contributions to Inhalable Particulate Matter Pollution in Metropolitan Boston. Atmos. Environ. 1987, 19, 9–25. [Google Scholar] [CrossRef]
- Miller, S.L.; Anderson, M.J.; Daly, E.P.; Milford, J.B. Source apportionment of exposures to volatile organic compounds. I. Evaluation of receptor models using simulated exposure data. Atmos. Environ. 2002, 36, 3629–3641. [Google Scholar] [CrossRef]
- Zhang, L.; Zhang, X.Z.; Qin, W.; Mao, J.J.; Qin, Y.H.; Xie, W.P.; Shi, W.K.; Chen, W.T. Analysis on the characteristics and source of atmospheric VOCs in Yixing City during the G20 Summit. Environ. Sci. 2017, 38, 2718–2727. [Google Scholar]
- Zhang, B.T.; An, X.X.; Wang, Q.; Yan, H.; Liu, B.X.; Zhang, D.W. Spatial-temporal distribution and reactivity characteristics of atmospheric VOCs in Beijing in 2015. Environ. Sci. 2018, 39, 4400–4407. [Google Scholar]
- Yu, X.F.; Cheng, P.; Gu, Y.G.; Li, M.; Tian, Z.L. Research on the potential of VOCs to generate ozone and SOA in summer in Guangzhou. China Environ. Sci. 2018, 38, 830–837. [Google Scholar]
- Li, C.L. Analysis on Pollution Characteristics of VOCs in the Atmosphere in Xuzhou City in Spring. Environ. Res. Monit. 2017, 4, 46–51. [Google Scholar]
- He, Q.S.; Yan, Y.L.; Li, H.Y.; Zhang, Y.Q.; Chen, L.G. Characteristics and reactivity of volatile organic compounds from non-coal emission sources in China. Atmos. Environ. 2015, 115, 153–162. [Google Scholar] [CrossRef]
- Tang, J.H.; Chu, K.W.; Chan, L.Y.; Chen, Y.J. Non-methane hydrocarbon emission profiles from printing and electronic industrial processes and its implications on the ambient atmosphere in the Pearl River Delta, South China. Atmos. Pollut. Res. 2014, 5, 151–160. [Google Scholar] [CrossRef] [Green Version]
- Liu, Y.; Shao, M.; Fu, L.; Lu, S.; Zeng, L.; Tang, D. Source profiles of volatile organic compounds (VOCs) measured in China: Part I. Atmos. Environ. 2008, 42, 6247–6260. [Google Scholar] [CrossRef]
- Wang, Q.; Geng, C.S.; Chen, W.; Shao, M. Emission factors of gaseous carbonaceous species from residential combustion of coal and crop residue briquettes. Front. Environ. Sci. Eng. 2013, 7, 66–76. [Google Scholar] [CrossRef]
- Tsai, W.Y.; Chan, L.Y.; Blake, D.R.; Chu, K.W. Vehicular fuel composition and atmospheric emission in South China: Hong Kong, Mecau, Guangzhou and Zhuhai. Atmos. Chem. Phys. 2006, 6, 3281–3288. [Google Scholar] [CrossRef] [Green Version]
- Carter, W.P.L. Development of ozone reactivity scales for volatile organic compounds. J. Air Waste Manag. Assoc. 1994, 44, 881–899. [Google Scholar] [CrossRef] [Green Version]
- McCarthy, M.C.; Aklilu, Y.A.; Brown, S.G.; Lyder, D.A. Source apportionment of volatile organic compounds measured in Edmonton, Alberta. Atmos. Environ. 2013, 81, 504–516. [Google Scholar] [CrossRef]
- Barletta, B.; Meinardi, S.; Rowland, F.S.; Chan, C.Y.; Wang, X.; Zou, S.; Chan, L.Y.; Blake, D.R. Volatile organic compounds in 43 Chinese cities. Atmos. Environ. 2005, 39, 5979–5990. [Google Scholar] [CrossRef] [Green Version]
- Wang, H.L.; Yang, Z.X.; Jing, S.A. Volatile organic compounds (VOCs) source profiles of on-road vehicle emissions in China. Sci. Total Environ. 2017, 607, 253–261. [Google Scholar]
- Qiao, Y.Z.; Wang, H.L.; Huang, C.; Chen, C.H.; Su, L.Y.; Zhou, M.; Xu, Y.; Zhang, G.F.; Chen, Y.R.; Li, L.; et al. VOCs source composition spectrum and atmospheric reaction activity of vehicle exhaust emissions. Environ. Sci. 2012, 33, 1071–1079. [Google Scholar]
- Mo, Z.W.; Lu, S.H.; Li, Y.; Shao, M.; Qu, H. Characteristics of VOCs Emissions from Typical Solvent-Using Enterprises in Beijing. China Environ. Sci. 2015, 35, 374–380. [Google Scholar]
Figure 1.
Location of sampling sites.
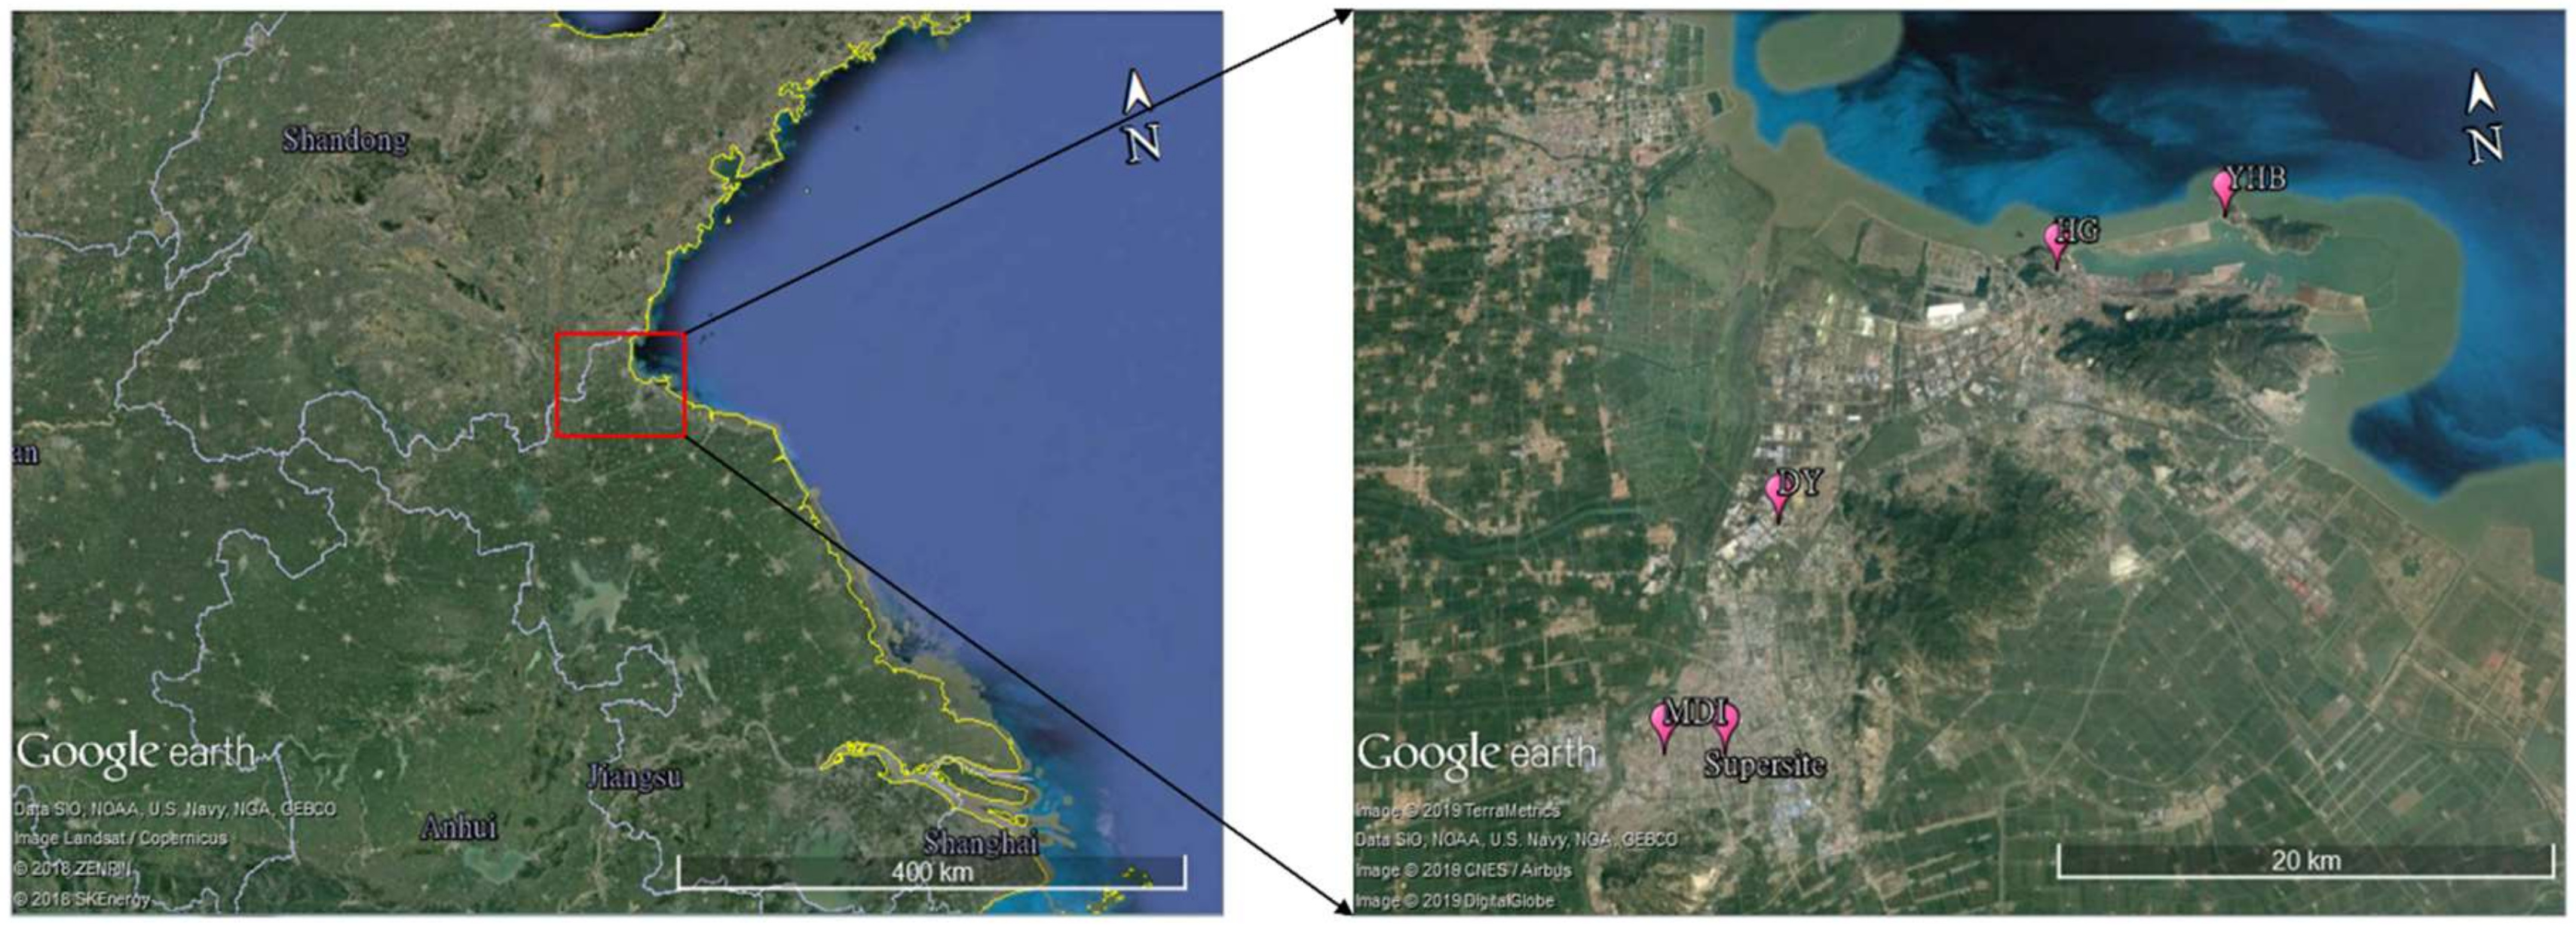
Figure 2.
Wind rose map of different seasons (April–September) in Lianyungang.
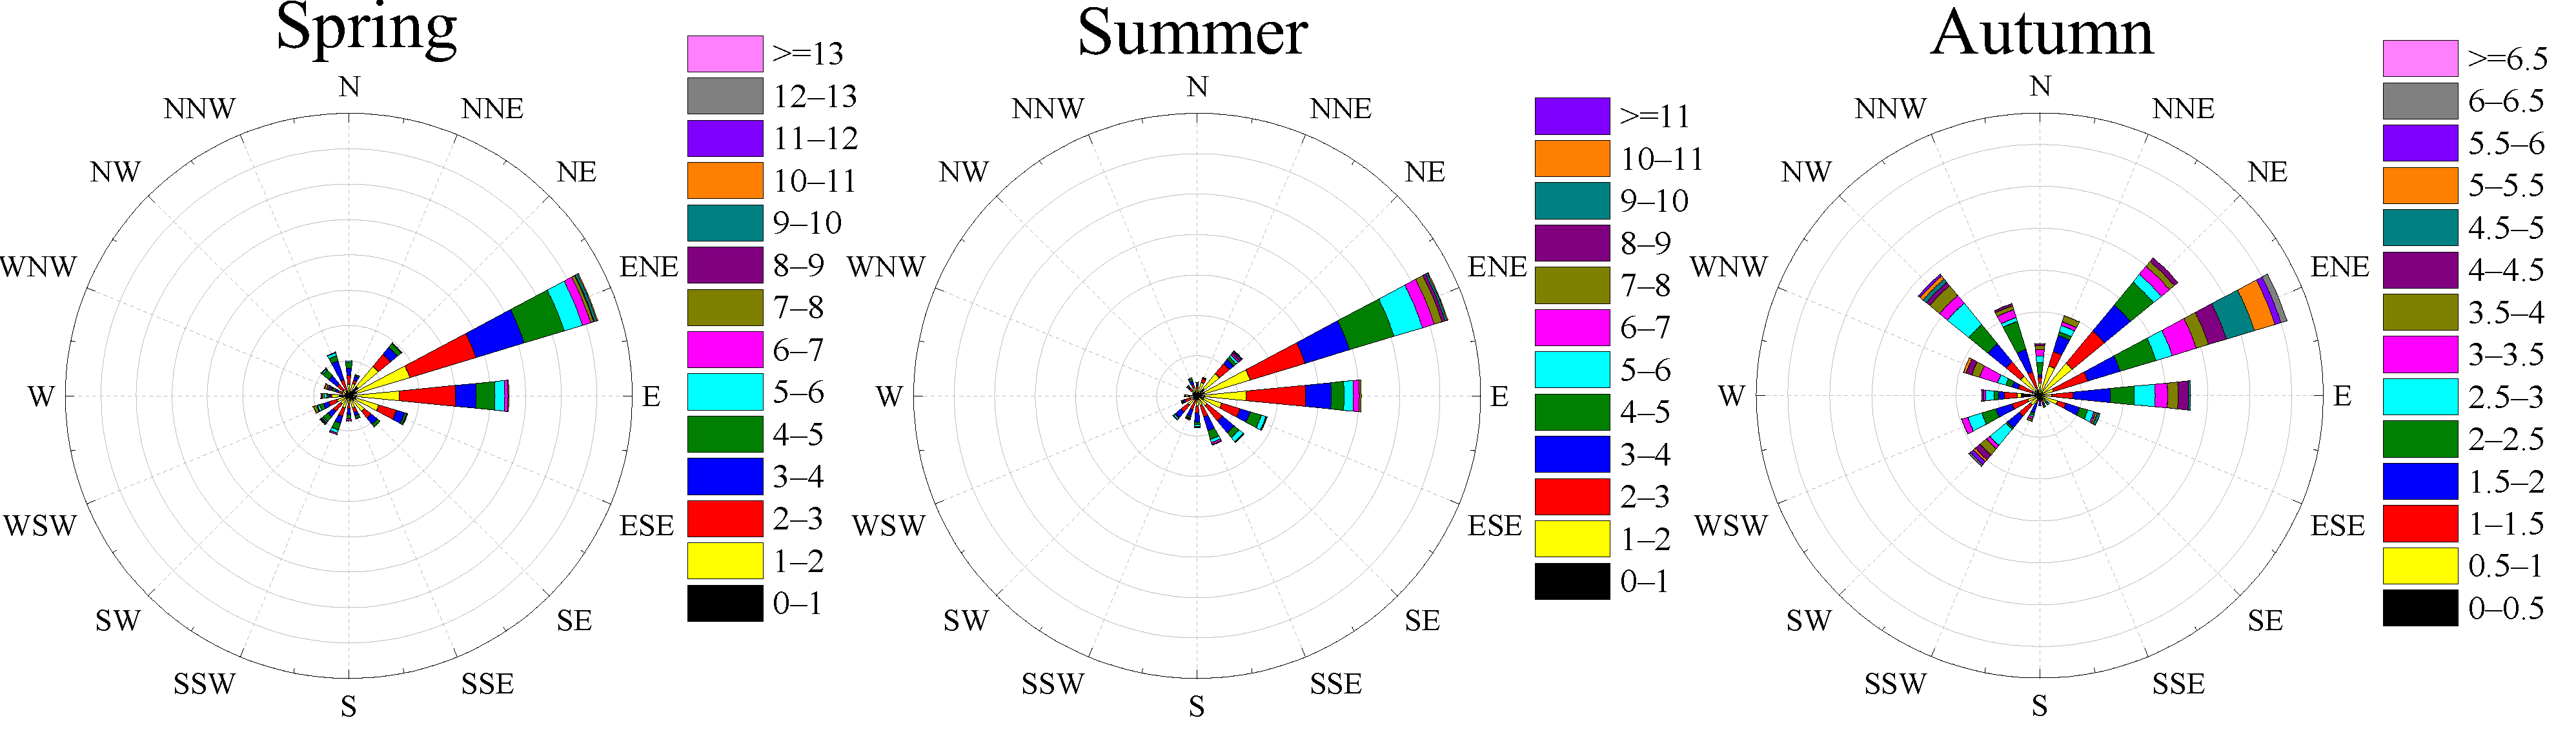
Figure 3.
Time series of meteorological parameters (wind speed (WS), wind direction (WD), temperature and relative humidity (RH)) and pollutants (PM2.5, ozone, NO2, and VOCs) in Lianyungang from April to September, VOCs concentration was sampled at the Supersite. Note: The red solid line indicates the concentration of the pollutant in the secondary standard of the “Ambient Air Quality Standard” (GB 3095–2012).

Figure 4.
Time series of volatile organic compounds (VOCs) concentrations and components contributions at the five sampling sites in Lianyungang from April to September.
Figure 4.
Time series of volatile organic compounds (VOCs) concentrations and components contributions at the five sampling sites in Lianyungang from April to September.

Figure 5.
Comparison of VOCs concentrations and each component’s contributions at the 5 sampling sites in Lianyungang with other cities.
Figure 5.
Comparison of VOCs concentrations and each component’s contributions at the 5 sampling sites in Lianyungang with other cities.

Figure 6.
Seasonal comparison of VOCs components in urban, industrial and suburban areas of Lianyungang.
Figure 6.
Seasonal comparison of VOCs components in urban, industrial and suburban areas of Lianyungang.

Figure 7.
Comparisons of the ratios of toluene/benzene, ethane/acetylene and isopentane/TVOCs at 5 sampling sites in Lianyungang.
Figure 7.
Comparisons of the ratios of toluene/benzene, ethane/acetylene and isopentane/TVOCs at 5 sampling sites in Lianyungang.
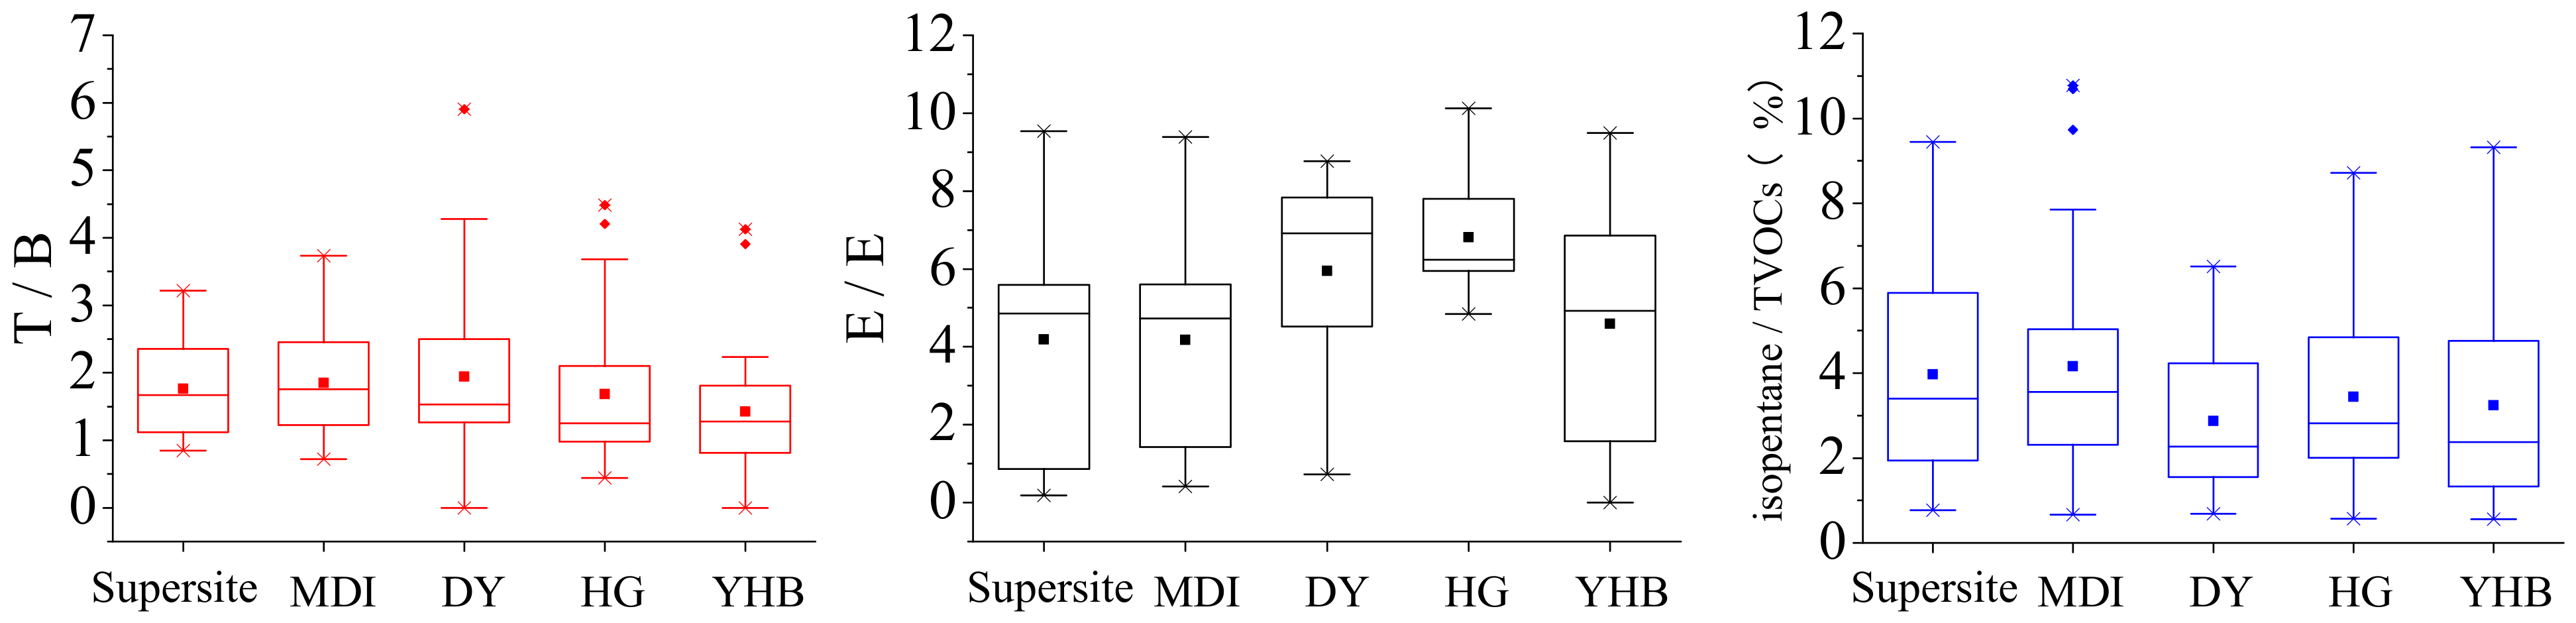
Figure 8.
Top 10 species of OFP and the corresponding concentrations at the five sampling sites in Lianyungang.
Figure 8.
Top 10 species of OFP and the corresponding concentrations at the five sampling sites in Lianyungang.


Table 1.
Specific information of sampling sites.
| Sampling Sites | Abbreviation | Longitude and Latitude | Functional Zones |
|---|---|---|---|
| Lianyungang City Environmental Monitoring Supersite | Supersite | 119.18° E, 34.59° N | Urban |
| Mine Design Institute | MDI | 119.14° E, 34.59° N | Urban |
| Deyuan Pharmaceutical Factory | DY | 119.34° E, 34.70° N | Industrial park |
| Hugou Management Office | HG | 119.37° E, 34.74° N | Suburban |
| Yuehai Building | YHB | 119.45° E, 34.77° N | Suburban |
Table 2.
Concentrations of VOC components at the 5 sampling sites in Lianyungang in spring.
| VOCs (µg m−3) | Supersite | MDI | DY | HG | YHB |
|---|---|---|---|---|---|
| Alkanes | 19.42 ± 10.1b | 28.80 ± 8.7a | 35.72 ± 16.9 | 22.99 ± 7.6a | 19.07 ± 5.9a |
| Alkenes | 3.69 ± 3.2a | 3.83 ± 3.4a | 4.38 ± 2.5 | 4.52 ± 3.3a | 3.19 ± 1.9a |
| Acetylene | 0.61 ± 0.2a | 0.43 ± 0.3a | 0.50 ± 0.2 | 0.59 ± 0.3a | 0.38 ± 0.2a |
| Aromatics | 7.92 ± 2.8a | 9.18 ± 6.6a | 8.37 ± 7.2 | 5.32 ± 2.0a | 5.82 ± 3.7a |
| VOCs | 31.65 ± 12.9a | 42.24 ± 13.4a | 48.96 ± 21.9 | 33.43 ± 10.0a | 28.45 ± 8.7a |
The data is the mean ± standard error. Note: Different lowercase letters indicate that the difference between different sampling points in the same functional area has reached a statistically significant level of 1%, the same below.
Table 3.
Concentrations of VOC components at the 5 sampling sites in Lianyungang in summer.
| VOCs (µg m−3) | Supersite | MDI | DY | HG | YHB |
|---|---|---|---|---|---|
| Alkanes | 16.47 ± 6.1a | 15.59 ± 6.5a | 13.02 ± 5.8 | 15.81 ± 4.6a | 13.89 ± 6.4a |
| Alkenes | 4.55 ± 2.5a | 4.45 ± 2.0a | 4.79 ± 2.5 | 3.99 ± 2.5a | 3.55 ± 1.9a |
| Acetylene | 0.32 ± 0.2a | 0.14 ± 0.0a | 0.10 ± 0.1 | 0.19 ± 0.1a | 0.21 ± 0.1a |
| Aromatics | 12.99 ± 8.6a | 11.75 ± 7.1a | 10.91 ± 6.0 | 9.40 ± 6.2a | 9.04 ± 5.4a |
| VOCs | 34.32 ± 12.5a | 31.94 ± 11.1a | 28.82 ± 9.4 | 29.39 ± 9.7a | 26.68 ± 8.8a |
Table 4.
Concentrations of VOC components at the 5 sampling sites in Lianyungang in autumn.
| VOCs (µg m−3) | Supersite | MDI | DY | HG | YHB |
|---|---|---|---|---|---|
| Alkanes | 16.79 ± 7.7a | 15.80 ± 5.0a | 14.63 ± 8.0 | 14.00 ± 5.1a | 10.66 ± 6.3a |
| Alkenes | 1.73 ± 0.7a | 2.28 ± 1.1a | 1.37 ± 0.5 | 1.98 ± 0.7a | 1.62 ± 1.0a |
| Acetylene | - | 0.10 ± 0.0 | 0.07 ± 0.0 | 0.07 ± 0.0 | - |
| Aromatics | 9.76 ± 6.8a | 9.16 ± 4.1a | 14.35 ± 8.1 | 7.29 ± 5.8a | 5.34 ± 5.1b |
| VOCs | 28.28 ± 14.8a | 27.34 ± 8.9a | 30.42 ± 15.1 | 23.34 ± 10.4a | 17.62 ± 12.2b |
Table 5.
Seasonal comparison of typical VOCs species in urban, industrial and suburban areas of Lianyungang.
Table 5.
Seasonal comparison of typical VOCs species in urban, industrial and suburban areas of Lianyungang.
| Functional Areas | Seasons | Ethane/ µg m−3 | Propane/ µg m−3 | Isopentane/ µg m−3 | Ethylene/ µg m−3 | Propylene/ µg m−3 | Acetylene/ µg m−3 | Benzene/ µg m−3 | Toluene/ µg m−3 | Ethylbenzene/ µg m−3 | M/P-Xylene/ µg m−3 |
|---|---|---|---|---|---|---|---|---|---|---|---|
| MyUrban | Spring | 2.13 ± 2.2 | 4.41 ± 2.1 | 1.21 ± 0.9 | 2.46 ± 3.3 | 0.77 ± 0.7 | 0.50 ± 0.3 | 1.24 ± 0.5 | 2.05 ± 1.3 | 0.58 ± 0.4 | 1.79 ± 2.1 |
| Summer | 0.48 ± 0.8 | 2.76 ± 1.4 | 1.15 ± 0.8 | 0.52 ± 0.5 | 0.66 ± 0.8 | 0.23 ± 0.2 | 1.00 ± 0.6 | 2.00 ± 1.1 | 0.77 ± 0.5 | 2.52 ± 1.7 | |
| Autumn | 0.53 ± 0.6 | 3.17 ± 1.8 | 1.69 ± 0.7 | 0.34 ± 0.1 | 0.28 ± 0.1 | 0.10 ± 0.0 | 1.35 ± 0.9 | 2.64 ± 1.7 | 0.53 ± 0.3 | 1.29 ± 0.8 | |
| Industrial park | Spring | 1.43 ± 2.0 | 3.19 ± 1.6 | 1.58 ± 1.8 | 1.86 ± 2.4 | 0.27 ± 0.2 | 0.50 ± 0.2 | 0.95 ± 0.4 | 2.04 ± 2.2 | 0.63 ± 0.7 | 2.11 ± 2.7 |
| Summer | 0.18 ± 0.1 | 1.89 ± 1.1 | 0.76 ± 0.6 | 0.34 ± 0.1 | 0.47 ± 0.4 | 0.10 ± 0.1 | 0.91 ± 0.6 | 1.76 ± 0.9 | 0.65 ± 0.3 | 2.70 ± 2.1 | |
| Autumn | 0.79 ± 1.1 | 2.96 ± 2.0 | 0.94 ± 0.4 | 0.29 ± 0.1 | 0.23 ± 0.1 | 0.07 ± 0.0 | 1.31 ± 1.1 | 1.83 ± 0.8 | 1.29 ± 1.1 | 2.78 ± 1.4 | |
| Suburban | Spring | 1.78 ± 2.3 | 2.69 ± 1.6 | 0.83 ± 0.8 | 1.84 ± 2.5 | 0.27 ± 0.3 | 0.46 ± 0.3 | 0.88 ± 0.4 | 1.36 ± 1.3 | 0.42 ± 0.4 | 0.89 ± 0.6 |
| Summer | 0.38 ± 0.5 | 1.93 ± 1.2 | 0.77 ± 0.5 | 0.39 ± 0.2 | 0.42 ± 0.3 | 0.19 ± 0.1 | 0.79 ± 0.5 | 1.55 ± 1.0 | 0.53 ± 0.2 | 1.73 ± 1.1 | |
| Autumn | 0.55 ± 0.7 | 2.31 ± 1.5 | 1.09 ± 0.7 | 0.37 ± 0.1 | 0.22 ± 0.1 | 0.07 ± 0.0 | 1.45 ± 1.1 | 1.72 ± 1.8 | 0.44 ± 0.4 | 0.81 ± 0.9 |
Table 6.
Ozone formation potential (OFP) of the VOC components at the five sampling sites during the observation period in Lianyungang.
Table 6.
Ozone formation potential (OFP) of the VOC components at the five sampling sites during the observation period in Lianyungang.
| OFP (µg m−3) | Supersite | MDI | DY | HG | YHB |
|---|---|---|---|---|---|
| Alkanes | 28.09 ± 15.2 | 29.17 ± 15.6 | 26.87 ± 14.0 | 24.99 ± 12.4 | 22.30 ± 12.6 |
| Alkenes | 39.16 ± 21.1 | 42.70 ± 22.4 | 26.67 ± 13.8 | 45.46 ± 22.8 | 51.67 ± 26.4 |
| Aromatics | 70.84 ± 34.6 | 72.29 ± 37.9 | 74.20 ± 28.6 | 47.60 ± 23.6 | 56.35 ± 29.3 |
| VOCs | 138.09 ± 70.2 | 144.66 ± 74.6 | 127.74 ± 65.2 | 118.05 ± 60.4 | 130.32 ± 66.8 |
Publisher’s Note: MDPI stays neutral with regard to jurisdictional claims in published maps and institutional affiliations. |
© 2021 by the authors. Licensee MDPI, Basel, Switzerland. This article is an open access article distributed under the terms and conditions of the Creative Commons Attribution (CC BY) license (https://creativecommons.org/licenses/by/4.0/).
Share and Cite
MDPI and ACS Style
Chen, C.; Wang, L.; Zhang, Y.; Zheng, S.; Tang, L. Spatial and Temporal Distribution Characteristics and Source Apportionment of VOCs in Lianyungang City in 2018. Atmosphere 2021, 12, 1598. https://doi.org/10.3390/atmos12121598
AMA Style
Chen C, Wang L, Zhang Y, Zheng S, Tang L. Spatial and Temporal Distribution Characteristics and Source Apportionment of VOCs in Lianyungang City in 2018. Atmosphere. 2021; 12(12):1598. https://doi.org/10.3390/atmos12121598
Chicago/Turabian StyleChen, Cheng, Lingrui Wang, Yunjiang Zhang, Shanshan Zheng, and Lili Tang. 2021. "Spatial and Temporal Distribution Characteristics and Source Apportionment of VOCs in Lianyungang City in 2018" Atmosphere 12, no. 12: 1598. https://doi.org/10.3390/atmos12121598
Note that from the first issue of 2016, this journal uses article numbers instead of page numbers. See further details here.