Atmosphere 2019, 10(7), 393; https://doi.org/10.3390/atmos10070393 - 13 Jul 2019
Cited by 14 | Viewed by 4187
Abstract
The aim of this study was to assess air quality by using medium-cost sensors in recreational areas that are not covered by permanent monitoring. Concentrations of air pollutants PM2.5, PM10, PM1, CO, O , NO in the Niedzica recreational area in
[...] Read more.
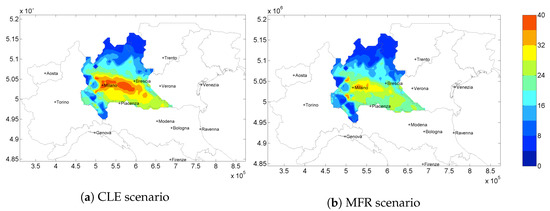
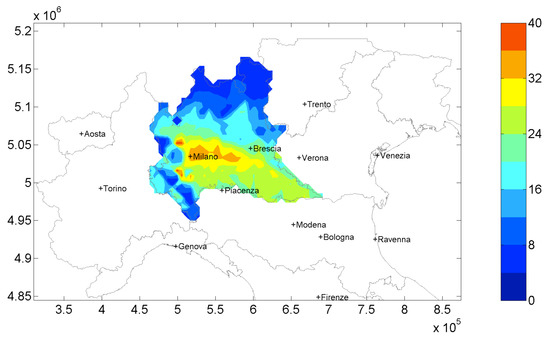
The aim of this study was to assess air quality by using medium-cost sensors in recreational areas that are not covered by permanent monitoring. Concentrations of air pollutants PM2.5, PM10, PM1, CO, O , NO in the Niedzica recreational area in southern Poland were obtained. The research revealed that in cold weather, particulate matter concentrations significantly exceeded acceptable levels determined for PM2.5 and PM10. The most important factor that affects air quality within the studied area seems to be the combustion of poor quality fuels for heating purposes. The information obtained by the research presented could be a useful tool for local authorities to make environmental decisions, based on the potential health impacts of poor air quality levels on the population.
Full article
(This article belongs to the Special Issue Sensors for Air Quality Assessment)
►
Show Figures
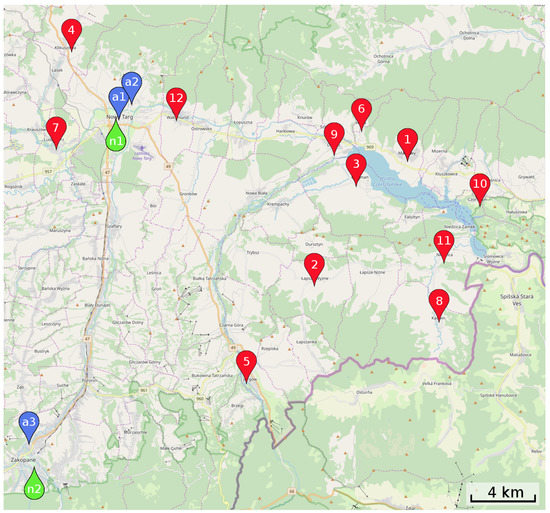
Figure 1


