Article

A Spatial and Temporal Risk Assessment of the Impacts of El Niño on the Tropical Forest Carbon Cycle: Theoretical Framework, Scenarios, and Implications

by
Adriane Esquivel-Muelbert
1,2,*,
Amy C. Bennett
1,*,
Martin J. P. Sullivan
1,
Jessica C. A. Baker
3,
Yoni Gavish
1,
Michelle O. Johnson
1,
Yunxia Wang
1,
Alexander Chambers-Ostler
1,
Marta Lisli Giannichi
1,3,
Luciene Gomes
1,
Michelle Kalamandeen
1,
Kanhu Charan Pattnayak
3 and
Sophie Fauset
4,*
1
School of Geography, University of Leeds, Leeds LS2 9JT, UK
2
School of Geography, Earth and Environmental Sciences, University of Birmingham, Birmingham B15 2TT, UK
3
School of Earth and Environment, University of Leeds, Leeds LS2 9JT, UK
4
School of Geography, Earth and Environmental Science, University of Plymouth, Plymouth PL4 8AA, UK
*
Authors to whom correspondence should be addressed.
Atmosphere 2019, 10(10), 588; https://doi.org/10.3390/atmos10100588
Submission received: 30 August 2019 / Revised: 16 September 2019 / Accepted: 24 September 2019 / Published: 27 September 2019
(This article belongs to the Special Issue Meteorological and Hydrological Droughts)

Abstract

:
Strong El Niño events alter tropical climates and may lead to a negative carbon balance in tropical forests and consequently a disruption to the global carbon cycle. The complexity of tropical forests and the lack of data from these regions hamper the assessment of the spatial distribution of El Niño impacts on these ecosystems. Typically, maps of climate anomaly are used to detect areas of greater risk, ignoring baseline climate conditions and forest cover. Here, we integrated climate anomalies from the 1982–1983, 1997–1998, and 2015–2016 El Niño events with baseline climate and forest edge extent, using a risk assessment approach to hypothetically assess the spatial and temporal distributions of El Niño risk over tropical forests under several risk scenarios. The drivers of risk varied temporally and spatially. Overall, the relative risk of El Niño has been increasing driven mainly by intensified forest fragmentation that has led to a greater chance of fire ignition and increased mean annual air temperatures. We identified areas of repeated high risk, where conservation efforts and fire control measures should be focused to avoid future forest degradation and negative impacts on the carbon cycle.

1. Introduction

El Niño events cause extreme warm and dry conditions in tropical regions [1]. These climate anomalies impact fundamental ecophysiological processes within tropical forests, compromising carbon uptake, increasing carbon emissions, and significantly affecting the global carbon cycle [2]. The carbon balance of tropical forests is disrupted by extreme heat [3,4,5] and reduced precipitation [6] (Supplementary Materials, Figure S1). However, the climate anomalies observed during El Niño vary across the tropics, and their impact on forests may depend on species adaptation to local conditions [5]. This variation in the response of tropical forests to El Niño, combined with the high diversity of these ecosystems [7] and the difficulties of collecting data in these remote areas, provides a major challenge to our understanding of El Niño impacts. Here, we integrated climate and forest fragmentation data to assess the potential risk El Niño events pose to tropical forests, accounting for species adaptation to the baseline climate and climate change.
Extreme climatic conditions can push tropical tree species toward their physiological limits. Carbon assimilation is reduced once air temperatures exceed the photosynthetic temperature optima [3]. Evapotranspirative demand increases with temperature, and plants may close their stomata to avoid water loss, reducing internal CO2 concentrations and therefore carbon assimilation in the leaf [8]. Plants also release more carbon under warmer conditions, as respiration rates tend to increase with short-term increases in temperature at both the leaf [4] and community level [9]. Reduced precipitation may affect soil moisture, which combined with higher evaporative demand, increases the chances of hydraulic failure [6]. Individually or in combination, these alterations to the physiology of trees may decrease tree growth and eventually lead to tree death [10,11], therefore reducing carbon sequestration of the forest during an El Niño event and increasing the release of carbon through the decomposition of dead biomass (Figure S1).
Perhaps the greatest El Niño impact on the global carbon cycle is from increased fire frequency, particularly in fragmented landscapes. Greater aridity during El Niño increases the flammability of tropical forests and, with an ignition source, forest fires become more likely [12] (Figure S1). Natural fires in moist tropical forests are rare, and most fires have an anthropogenic source. Thus, fires typically start near forest edges [13,14,15,16] where the microclimate is hotter and drier, and human activity in adjacent land increases the chance of ignition occurring [15,17].
The links between climate anomalies and the expected responses of tropical forests allow for an assessment of potential El Niño consequences based on a combination of climate and forest cover. While the spatial distribution of climate anomalies [18] (Figure 1a) seems to be a valuable proxy of the impact of El Niño [2], it ignores that tropical tree species may be plastic enough to adapt to recent changes [19] or that the composition of tree communities may shift to species more adapted to current conditions [20,21]. Under the assumption of adaptation, the consequences of climate anomalies should account for recent climate trends (Figure 1b) [22]. Additionally, variation in baseline conditions may also influence the extent to which extreme climatic events push plants toward their physiological threshold. For example, forests in hotter, drier areas may suffer more from a hot, dry climate anomaly (Figure 1d). Furthermore, the evolutionary history, composition, and functional characteristics of tropical trees vary across biogeographical regions [23]. These differences may imply different physiological limits between biogeographical regions, especially considering the distinctive baseline climate across the tropics [1,2]. If so, the baseline climate should be evaluated based on the climate conditions within each biogeographical region (Figure 1c) rather than the global extent of the biome (Figure 1d). Here, we developed a risk assessment framework to combine these hypotheses of the drivers of risk to the tropical forest carbon cycle during El Niño events. The aim of our work is to present these different hypotheses of the determinants of risk and discuss their implications. We focused our analyses on the assumptions of a global climatic threshold of tropical forest physiology (Figure 1d) and considered an El Niño anomaly to be a deviation from the mean climate (Figure 1a). We further examined single-factor changes from this framework (i.e., using a biogeographical threshold and calculating anomalies from a climate trend) to understand the implications of the different ways of accounting for the baseline climate and climate anomalies in the potential distribution of El Niño risk.
Our risk assessment approach combined El Niño climate anomalies, baseline climate, and forest fire ignition potential, allowing for a quantitative assessment of the implications of our hypothesized framework for the spatial and temporal distributions of El Niño risk over tropical forests. In a traditional risk assessment, risk is defined as the likelihood of an event occurring multiplied by the severity of an event if it occurred. Here, we considered likelihood (a) to be the susceptibility of a forest community to El Niño-induced negative alterations to the carbon cycle, defined from the baseline climate and extent of ignition potential, with hotter, drier, and more fragmented forests having a higher susceptibility; and severity (b) as the El Niño climate anomaly, with larger anomalies in hotter and drier conditions, meaning higher severity. We estimated the risk to the carbon balance for a particular grid cell relative to the other assessed grid cells by classifying the risk components between 1 and 10 based on the distribution of each variable (Figure 2), and this was comparable across El Niño events. Hence, this was an index of relative risk, rather than an absolute value. We generated risk maps by integrating baseline climate and El Niño anomalies under our definitions of risk to (i) assess the spatial and temporal patterns of El Niño risk to the tropical forest carbon cycle in the last three major El Niño events, (ii) use forest cover to identify the areas of greatest contribution to disruption of the global carbon cycle, (iii) determine the key drivers of risk, and (iv) examine the consequences of altering our definition of risk to account for spatial and temporal adaptation (Figure 1).

2. Methods

We assessed the risk to the tropical forest carbon cycle during the 1982–1983, 1997–1998, and 2015–2016 extreme El Niños (hereafter EN1982, EN1997, and EN2015, respectively) following the risk assessment framework presented in Figure 2. Although other definitions of risk are possible, our approach allowed us to assess the implications of our theoretical framework for El Niño risk. Precisely quantifying the mechanistic links between the drivers and the El Niño risk (Figure S1) was beyond the scope of this work: here, we simply assumed equal weight of all variables and a multiplicative relationship between susceptibility and severity to produce the risk. Risk scores (RS) were calculated for each 0.5° grid cell in the tropical moist broadleaf forest ecoregion [25] as the product of two components: the susceptibility (Su) and severity (Se) (RS = Su × Se). Alternative weights would shift risk patterns according to the relative contribution of the different elements (see Figure S6 for contributions).

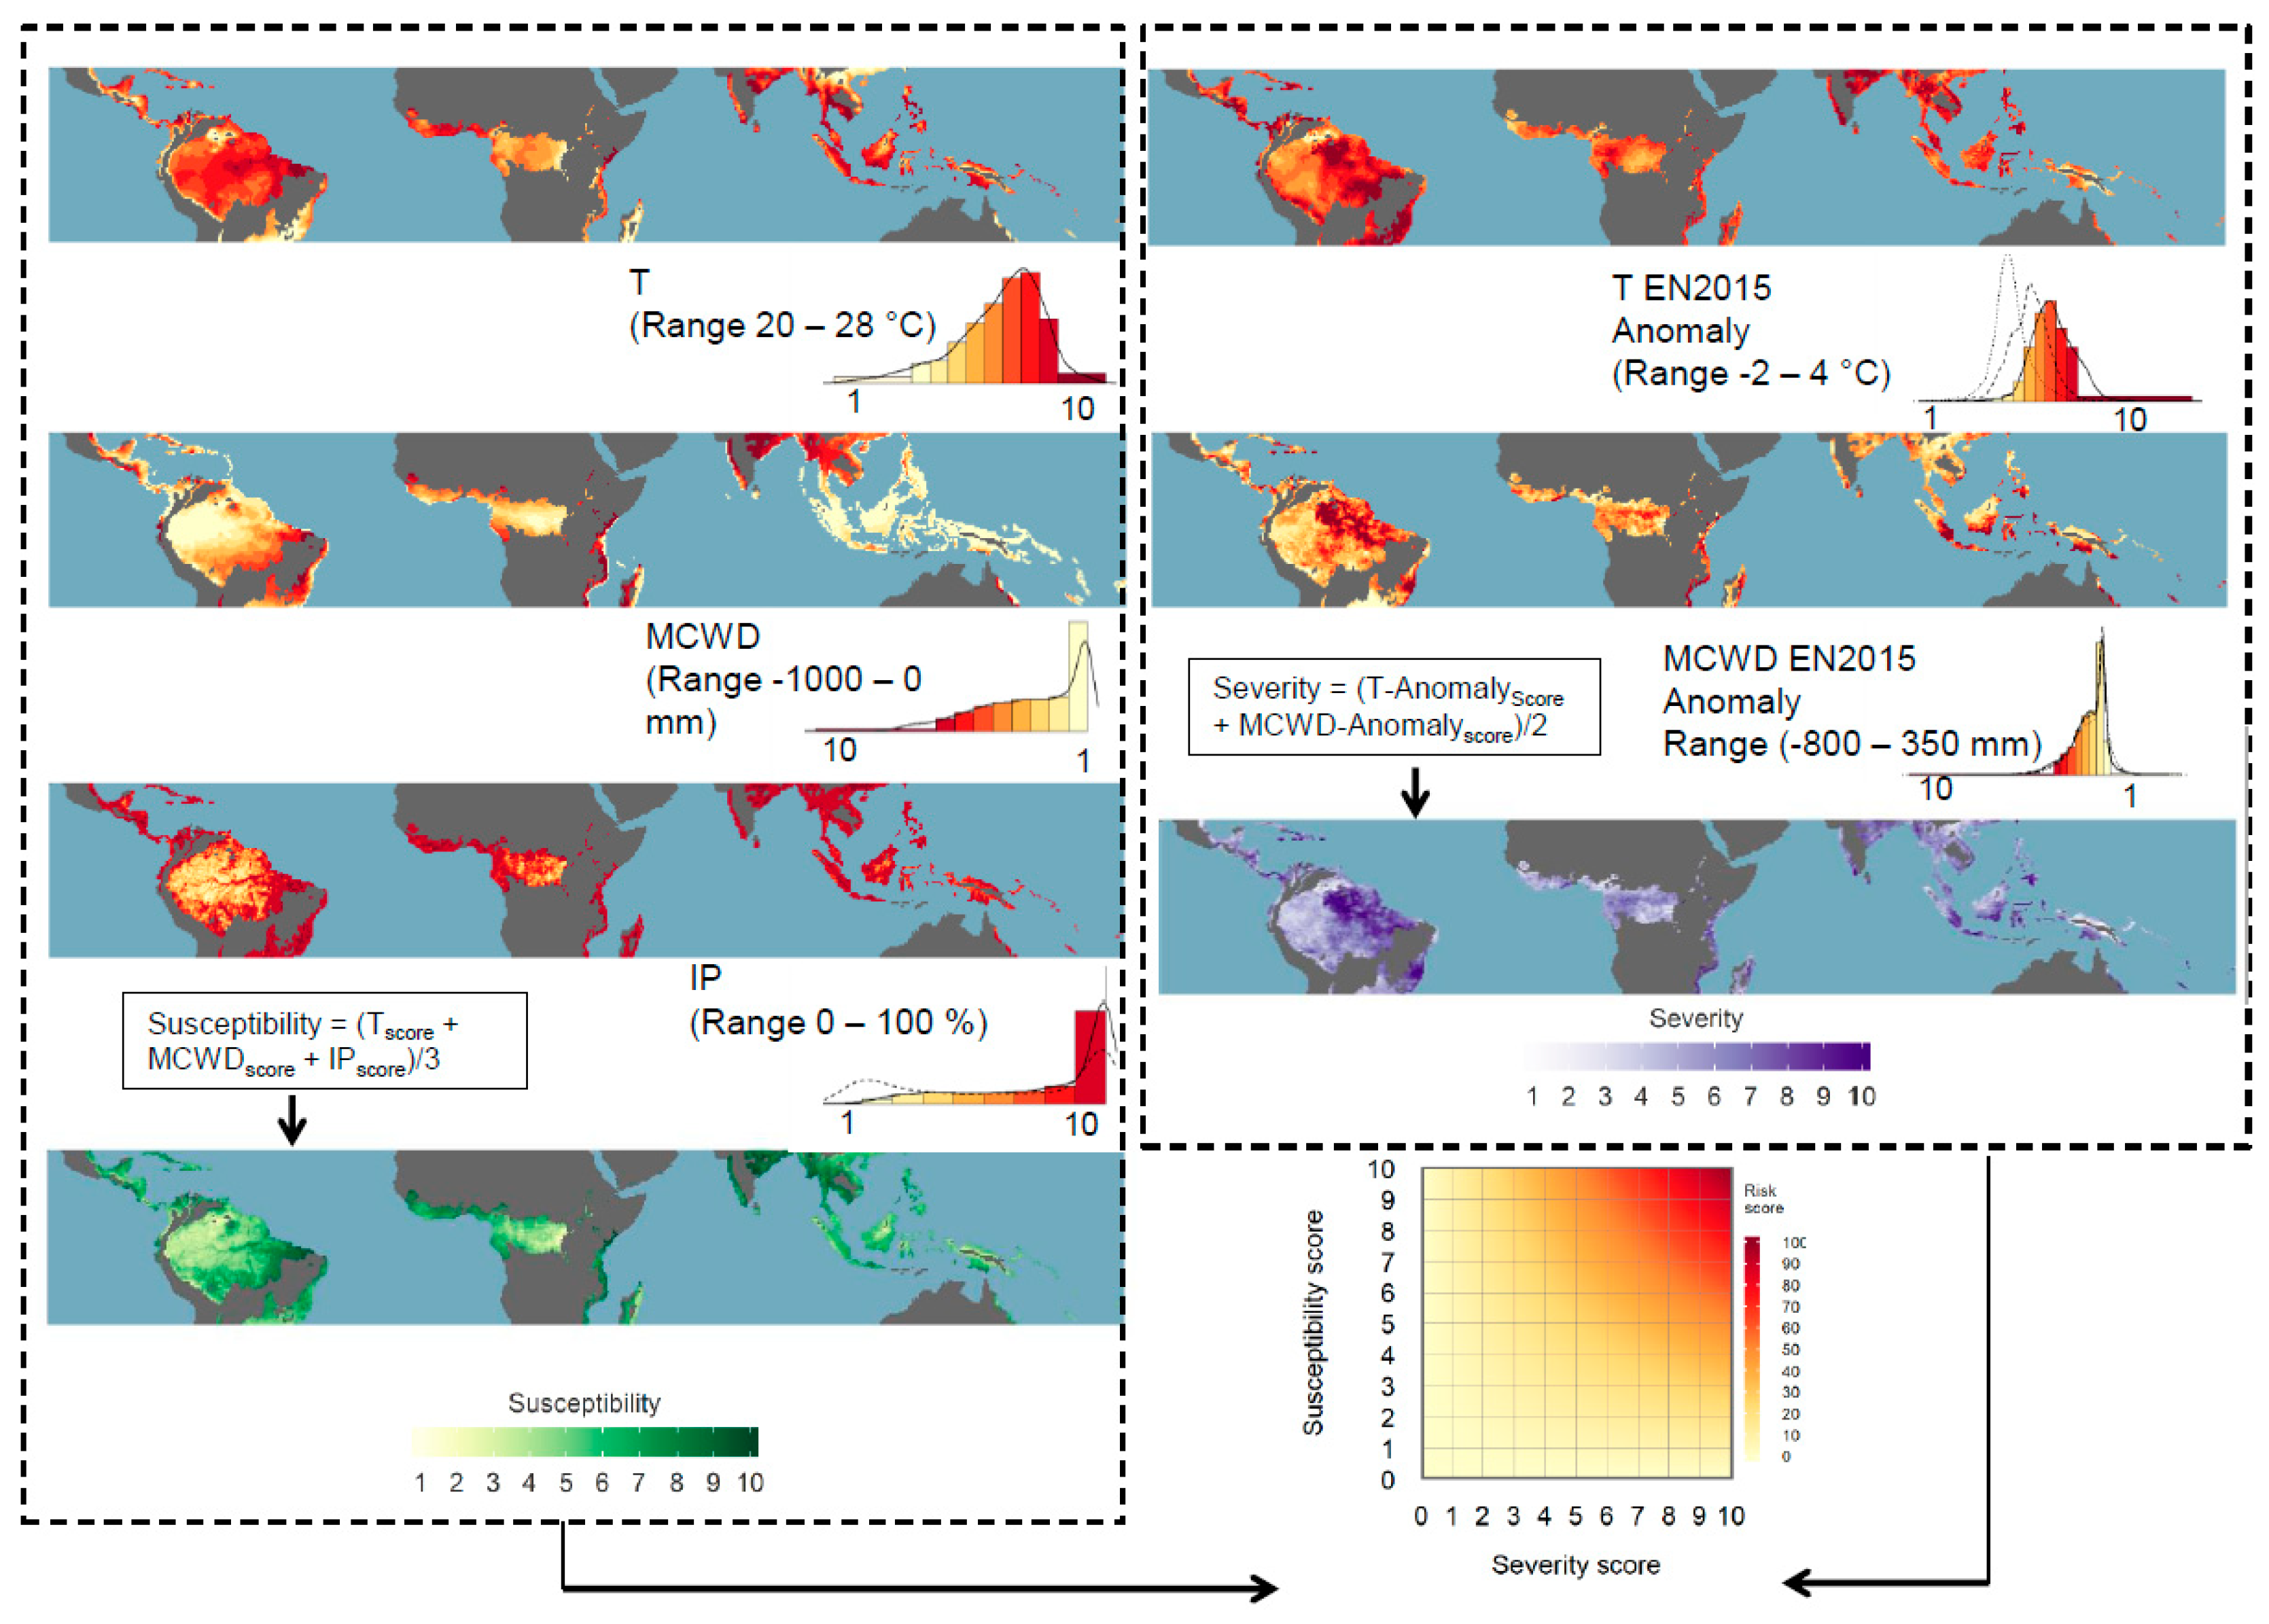
2.1. Susceptibility Scores

The susceptibility of an El Niño negatively impacting the carbon cycling of tropical forests was determined as a function of the baseline climate and forest fire ignition potential. First, suitable climate datasets (precipitation, P; surface temperature, T) were identified, compiled, and gridded to a 0.5° resolution (Supplementary Materials, Section S1). For each grid cell, we produced a T and a P time series between 1960 and 2016. Although performing the analysis at a 0.5° spatial resolution would mask some of the finer-scale heterogeneity in climate, particularly at forest edges, the results could still provide useful insights about spatial variation of the El Niño impacts. Station-based products were merged with remote-sensing and meteorological reanalysis datasets to optimize spatial and temporal coverage (Supplementary Materials, Section S1). For each grid cell, baseline means, i.e., the long-term average, of T and drought intensity, measured as the maximum cumulative water deficit (MCWD sensu [26]) (Supplementary Materials, Section S1), were calculated.
In addition to climate variables, we used forest edge as a proxy of forest proximity to a fire ignition source. We defined ignition potential (IP) as the percentage of forest within 1 km from natural or anthropogenic forest edge, normalized by the total forest area within the grid cell (Supplementary Materials, Section S2) [27]. Most fires in Amazonia start within a distance of 1 km of natural edges (rivers) and within 5 km of anthropogenic edges (roads) [13,14,15,16,28]. Forest edges were identified using the 30-m resolution Global Forest Change dataset [29]. Susceptibility would ideally be calculated using forest edge data for the year preceding each El Niño. However, as there were no global forest edge data available for EN1982 and EN1997, data from 2000, the first year available in the Global Forest Change dataset, were used to calculate edge for EN1982 and EN1997, while forest edge from 2014 was used for EN2015.
Ignition potential for years 2000 and 2015 and the mean T and MCWD between 1960 and 2016 were calculated for every tropical forest grid cell (Supplementary Materials, Section S2). These values were divided into 10 bins, where the 1st and 10th bin contained the 5th and 95th percentiles, and the remaining bins were at evenly spaced intervals (Figure 2). The position of these values across the 10 bins provided a 1 to 10 score relative to other grid cells. Susceptibility (Su) was then calculated on a per-pixel basis, as the mean of T, MCWD, and IP scores:
Su = (Tscore + MCWDscore + IPscore)/3.
For biogeographically defined susceptibility (Figure 1c), the binning process for climate variables was applied for each of three biogeographical regions (Americas, Africa, and the Indo-Pacific), grouped based on floristic and phylogenetic composition [23].

2.2. Severity Scores

Severity scores were calculated for each El Niño and were comprised of a T and MCWD component. Annual mean T values were calculated using data from May to April, as these 12 months were found to have the highest consecutive sea surface temperature (SST) anomalies in the Niño 3.4 region for each El Niño. T and MCWD anomalies (T’ and MCWD’) were then calculated as the deviation from the mean climate, which was estimated (1) using data from 1960 to 2016 to calculate mean-based severity and (2) using the 10 years before each El Niño event to calculate trend-based severity. Using 10-year baseline periods for the trend-based severity scores effectively allowed us to remove the influence of multidecadal climate variability, including long-term climate trends, on the anomaly calculations. As above, T’ and MCWD’ were binned and assigned a score from 1 to 10. Bins were created considering anomalies across all three El Niños, so severity scores were comparable across all events. Severity was calculated as the average of the T’ and MCWD’ scores:
Se = (T’score + MCWD’score)/2.
Although T and MCWD may not affect forests independently, the effect of the interactions between these variables on global forests are not yet clear. We decided to consider for a first approximation the simplest approach in our analyses: equal weightings and no interactions between T and P. With this approach, the severity could only be high if there were strong anomalies in both T and MCWD.

2.3. Comparing El Niño Risk Scores

To compare the spatial distribution of different El Niños, we calculated the Kendall’s τ coefficient of correlation (τ, range −1 to +1) between risk scores in different El Niños in each grid cell. To assess the statistical significance of these correlations, we took 1000 random samples of 100 grid cells, calculated τ on each sample, and calculated pseudo p-values based on the proportion of the resultant distribution of τ that overlapped zero. This approach dealt with the nonindependence of grid cells, which prevents the assessment of statistical significance using the τ test statistic.

2.4. Estimating El Niño Impact

We estimated the impact of each El Niño by multiplying risk by the area of forest and the area-based above-ground biomass found within each grid cell (impact = risk × forest area × forest biomass). The forest area of the grid cell was taken from the Global Forest Change dataset [29], and the forest biomass was taken from Avitabile et al. [30].

3. Results

3.1. Spatial and Temporal Distribution of Risk and Impact

The risk of El Niño impacting the tropical forest carbon cycle increased globally with time (mean risk score 22.8 in EN1982; 28.2 in EN1997; 37.9 in EN2015), with 82% of grid cells experiencing their greatest risk in 2015/2016 (Figure 3, Figure S2). However, some areas, particularly in Southeast Asia, experienced higher risk in previous El Niños, notably in EN1997 (Figure S2). The spatial pattern of risk was broadly consistent across the three El Niños (correlation between risk scores of each El Niño: τ = 0.49 − 0.54, p = 0.002). Areas with recurring high risk were Central America, the Eastern Amazon, the northern Atlantic forest, West Africa, coastal East Africa, India, the Bay of Thailand, and the southern edges of the Malaysian Islands (Figure 3). This recurring risk was partially due to the spatial distribution of susceptibility (baseline conditions), but also reflected positive correlations between the distribution of severity (climate anomalies) across El Niños (correlation between severity scores of each El Niño: τ = 0.25 − 0.34, p = 0.002) and spatial correlations between susceptibility and severity (EN82: τ = 0.14, p = 0.042; EN97: τ = 0.12, p = 0.102; EN15: τ = 0.19, p = 0.012; Figure S3). By accounting for forest cover and biomass distribution (Figure 4), we highlighted areas where El Niños were expected to have a greater impact on the tropical forest carbon cycle. Patterns of impact differed from risk, with those areas that were both at risk and were carbon-rich, such as the eastern Amazon and especially the Guiana Shield, the western Congo Basin, and central Borneo showing the highest impact scores (particularly in EN2015, when risk was highest) (Figure 4).

3.2. Drivers of Risk

The importance of severity as a driver of risk increased over time (Figure S3); however, neither severity nor susceptibility predominated as a driver of risk (Figure S4). Despite consistent spatial patterns of the El Niño MCWD anomaly, the dominant component of severity changed from MCWD in EN1982 (56.4 %) to T in EN2015 (59.8 %) (Figure S5). Pan-tropically, temperature was the dominant component of susceptibility when forest cover from the year 2000 was used, accounting for 40.7% of variation (Figure S6). Ignition potential became a more important component of susceptibility when 2014 forest cover was used (increasing from 34.3% of global susceptibility with 2000 forest cover to 41.7% of susceptibility with 2014 forest cover, Figure S6). However, the dominant component of susceptibility varied spatially: ignition potential dominated in the Asian islands, MCWD in India, and T in the Central Amazon (Figure S6). Ignition potential increased as a driver of susceptibility in Northern Amazonia, Central Africa, and Papua New Guinea (Figure S6).

3.3. Alternative Definitions of Risk

The spatial pattern of risk varied using different definitions. In general, we found that adding the susceptibility axis (Figure 5–top graph) as well as accounting for trends in climatic conditions (Figure 5–mid graph) had a considerable effect on the distribution of risk, while accounting for differences between biogeographic regions in baseline conditions had a less obvious effect (Figure 5–bottom graph). When analyzing the importance of considering baseline climate by comparing severity-only (Figure 1a) with mean-based severity and global susceptibility (Figure 3), the risk was higher in east Central Africa, Madagascar, and North and West Amazonia and was lower in East Amazonia, East Africa, and India (reflecting areas of low and high susceptibility) (Figure 5–top graph). The risk calculated using trend-based severity (Figure 1b) was lower for the Amazon Basin and Central Africa (Figure 5–mid graph), areas that experienced the greatest changes in climate in the 10 years prior to El Niño. The differences in risk when applying the biogeographically defined susceptibility (Figure 1c) were very subtle, with risk being lower in the Neotropics when considering global susceptibility (Figure 5–bottom graph).

4. Discussion

This is the first analysis to combine climate anomalies, baseline climate, and forest cover data to generate an index of potential El Niño risk to the tropical forest carbon cycle. Based on our hypotheses, our analysis shows the greatest relative risk from El Niño to be in the eastern Amazon Basin, India, the Bay of Thailand, the southern edges of the Malaysian islands, and East Africa. This spatial pattern was remarkably consistent across the last three major El Niño events. We also found that El Niño-driven climate anomalies have strengthened since EN1982, corroborating previous findings that EN2015 was stronger than EN1982 and EN1997 across the Amazon [18]. However, we also note that our findings are based on simple assumptions of the drivers of risk and hence should be taken with caution.
Do these spatial maps of relative El Niño risk match areas known to have been affected by El Niño? The predictive ability of our risk maps cannot be fully assessed at present due to a lack of pan-tropical observations of El Niño impacts at similar temporal and spatial resolutions. However, we can examine the most recent El Niño, for which more remotely sensed data were available. Liu et al. [2] presented a continentally resolved analysis of net biosphere exchange during EN2015 that we could compare our findings against. Our study identified ignition potential as the key risk variable in Asia, while risk in South America was mainly determined by drought and heat. These drivers of risk were consistent with Liu et al., who showed fire was the main driver of increased carbon flux in Asia, while decreased photosynthesis was the main driver in Amazonia, likely as a consequence of drought and high temperatures (Figure S1). Conversely, our risk metric underestimated the impact of EN2015 on tropical Africa, which reportedly lost 0.6 Gt of carbon during EN2015 [2]. This divergence between our predicted risk and the observations for Africa in EN2015 could have been caused by the adaptation of central African forests to a relatively low baseline T at a finer scale than what was captured by our biogeographic region-based risk metric or could have been due to a loss of carbon from savannas, which was not included in our study.
While our drivers of risk were similar to Liu et al. [2], our results diverged from their EN2015 observations in terms of which continent contributed the most to carbon flux disruption. When the contribution of each continent to the carbon flux anomaly was estimated by accounting for forest cover and biomass in each pixel (impact of EN2015), we observed an uneven spread across continents (contribution to global impact: South America 54.6%, Africa 20.4%, Indo-Pacific 25%). The eastern Amazon emerged as the region that contributed most to the global El Niño impact (Figure 5). This result differs from recent observations showing that the El Niño-driven carbon flux from each continent was fairly similar in magnitude [2]. However, our metric of carbon stocks was restricted to above-ground biomass, which ignored the large quantities of belowground carbon in peat soils within certain regions of the tropics [31]. Soil carbon is particularly important in Southeast Asia, where burning peat significantly contributed to carbon fluxes during EN2015 [2]. Our focus on aboveground carbon could explain why our estimate of the El Niño impact over this region was lower than what was observed. Meanwhile, in the Amazon, where aboveground biomass is the predominant driver of the carbon cycle, the areas identified as high-risk in this study corresponded with areas where fires occurred during EN2015 [32,33] (Figure S7), confirming the importance of integrating ignition potential into our risk metrics.
When applying the risk assessment framework to produce a relative risk measure, we assumed that T, MCWD, and IP contributed equally to susceptibility and that the T anomaly and MCWD anomaly contributed equally to severity. We acknowledge potential interactions between severity and susceptibility, which could have increased the relative risk scores in areas where both were high, and it is not yet clear whether these factors influence each other or what the nature of such interactions might be. Furthermore, since the factors affecting risk are complex, it is difficult to assign weights that will reflect the “real” relative contribution of the different components, and we wanted to avoid introducing additional uncertainty. As more data become available on the impact of El Niño on tropical forest carbon cycles, future studies should try to understand the relative contribution of each of these variables and their interactions to the El Niño risk. Such data would allow for quantitative tests of predictions from competing risk frameworks as well as allow for the calibration of the relative contributions of the different elements of susceptibility and severity.
When comparing our risk map to other definitions of risk (Figure 5), the greatest difference was found between the risk definition that ignored baseline climate (mean-based severity, Figure 1a) and our main risk definition (Figure 1a,d). By ignoring baseline climate, the risk was overestimated in areas with lower values of susceptibility, such as the Western Amazon, and was underestimated in areas of high susceptibility, such as India (Figure 5). In ecological terms, ignoring baseline climate as a contributor to the response to climate anomalies is equivalent to considering forests to be strongly adapted to local climate so that a given climatic change will impact all trees across the tropics in the same way. Although local adaptations are a reality and physiological tolerances are known to reflect local climate [34], El Niño may create extreme hot and dry conditions outside of the tropical forest climate envelope [35].
Comparing trend-based severity against mean-based severity allowed us to identify the areas where adaptation to recent climate change could have led to the biggest reduction in risk (negative values, Figure 5). Our analyses allowed us to compare risk considering that these areas may have adapted to ongoing changes in climate [20], which could have made them more resistant to climate anomalies. However, it is important to consider that the dynamics of tropical forests are slow, and under rapid climate change, forests may face further stress as a consequence of an altered baseline climate, so it is unclear which definition of risk best reflects reality. Further studies focusing on the dynamics of forest communities are particularly needed to address the areas under rapid change highlighted here.
The risk derived from biogeographically defined susceptibility was remarkably similar to globally defined susceptibility (Figure 5). Although this was somewhat surprising considering the differences in baseline climate between the three biogeographical regions [1,2], it highlights the similarities in total ranges of climatic conditions within each tropical continent that may or may not represent similar physiological tolerances. By characterizing trees’ physiological tolerances, we would be able to understand at which spatial scale physiological thresholds are observed and which are the processes that define them. To better account for biogeographical differences in species assemblages, future development of this framework could include the distributions of traits known to be linked to drought mortality (e.g., wood density and tree size [6,36]), fire resistance (e.g., tree size, bark thickness, and wood density [37]), and heat wave tolerance (e.g., leaf widths [38], isoprene emission [39]) in the susceptibility term.

Consequences of El Niño and Implications for Conservation

The drivers of risk highlighted here are likely to threaten not only the carbon cycle but also other vital elements of tropical forests. More than 40,000 tree species are found within this biome [7], and many of the areas at highest risk are also global biodiversity hotspots. Water availability is a fundamental driver of species diversity across the tropics [40], and thus an increase in the frequency and intensity of climate anomalies may greatly influence the biodiversity in this region. Changes to tropical forests may also have important consequences for the hydrological cycle. Transpiration from trees is known to contribute to regional rainfall [41], and the disruption of this process is likely to reduce P in regions downwind from the affected areas. Forest fires may alter the system for decades, and the short-term impacts of El Niño are also crucial. For instance, changes in the phenological cycle of tropical trees will alter the temporal distribution of resources and thus their availability at higher trophic levels. Importantly, any risk to these forests represents a threat to the millions of people from local communities that rely on the forest for food, water, shelter, and livelihood. The consistency in the spatial distribution of El Niño risk across the three previous El Niño events (Figure 3) shows regions where preventative action or adaptation may be necessary in order to reduce the impact of future El Niños on people and biodiversity.
The relative risk of El Niño to the tropical forest carbon cycle, as indicated by our theoretical framework, increased from EN1982 to EN2015 by nearly twofold (Figure 3) and was mainly driven by T and ignition potential (Figures S5 and S6). The variation in the spatial distribution of risk and its intensity can be partially attributed to the nature of different El Niño events. However, the observed increase in risk is somewhat conservative, as we used forest cover from 2000 for the analyses of 1982 and 1997. As fragmentation is likely to have been more extensive in the year 2000 when compared to previous years, the increase in risk observed here is expected to have been even greater if we had used the actual forest cover from 1982 and 1997. While human influence on the frequency of El Niño events is still debatable [42], the risks of future El Niños can be mitigated if policies to reduce fragmentation are explicitly accounted for in global agreements, in addition to essential action to limit rising temperatures. At local levels, reforestation efforts should be focused in areas of high El Niño risk associated with ignition potential (e.g., in Asia). Strategies to reduce fire are especially important in El Niño years [32], as fire occurrence is highly destructive and leaves a long legacy on the forest [43,44].

5. Conclusions

We provide a framework that integrates the ecology of tropical forests’ responses to climate with fragmentation and climate data to assess the potential risk of El Niño to the carbon cycle based on different hypothesized scenarios of forest response. We highlight the value of considering ecological processes when evaluating the expected impacts of climatic events on different ecosystems. This framework could be applied on a smaller scale (e.g., within a country) to other ecosystems (e.g., croplands) or to other types of climate anomalies or could be used to identify areas of higher risk under future climate conditions. Here, we showed that the relative risk, based on our theoretical framework, of El Niño negatively impacting the carbon cycle of global tropical forests has increased over time, with some areas repeatedly identified as being at high risk. Such high-risk hotspots should be considered a priority for global and local conservation, and steps must be taken to avoid fire ignition, deforestation, and forest degradation if these forests are to be protected. As global temperatures continue to rise, El Niño risk will universally increase across the tropical realm, pushing all tropical forests to their thermal limits.

Supplementary Materials

The following are available online at https://www.mdpi.com/2073-4433/10/10/588/s1, Section S1: Methods for calculating climate variables; Section S2: Methods for calculating forest ignition potential; Figure S1: El Niño drivers, processes, and impact; Figure S2: El Niño event in which grid cells experienced maximum risk; Figure S3: Susceptibility and severity maps; Figure S4: Drivers of the risk score—severity versus susceptibility; Figure S5: Drivers of severity—T versus MCWD; Figure S6: Drivers of susceptibility—T versus MCWD versus ignition potential; Figure S7: Validation of risk metric. Supporting data are available at: 10.6084/m9.figshare.9896339.

Author Contributions

All aspects of this study were developed collectively by the Selva Society, a group of PhD students and postdocs from the Ecology and Global Change cluster at the University of Leeds. A.E.-M., A.C.B., J.C.A.B., Y.G., and S.F. designed the study with input from all authors. A.C.B., J.C.A.B., K.C.P., and M.O.J. collated and processed the climate data used in the study. Y.W., A.C.-O., M.L.G., L.G., and M.K. prepared and processed the ignition potential data. Data analysis was performed by M.J.P.S. with contributions from all authors. A.E.-M., M.J.P.S., Y.G., and S.F. prepared the figures. The paper was written by all authors. All authors read, commented on, and approved the final version of the manuscript.

Funding

A.E.-M. and M.O.J. were supported by the NERC project TREMOR; A.E.-M. and M.J.P.S. were supported by the ERC grant T-Forces (291585); A.E.-M. was also supported by the ERC grant TreeMort (758873); and M.J.P.S. was also supported by a Royal Society grant (Global Challenge Research Fund: Sensitivity of Tropical Forest Ecosystem Services to Climate Changes) and a NERC grant (BIO-RED, NE/N012542/1). A.C.B. and A.C.-O. were funded by the Leeds-York NERC DTP (NE/L002574/1), Y.W. by the UoL and China Scholarship Council (201506300051), M.L.G. by a CNPq PhD scholarship (205774/2014-8), L.G. by the NERC Sustainable Gas Pathways for Brazil project, and Y.G. by a Horizon2020 ECOPOTENTIAL project, grant agreement 641762. S.F. was cofunded by the NERC (NE/K016431/1) FAPESP (2012/51509-8, 2012/51872-5) project ECOFOR and the ERC project GEM-TRAIT (321121).

Acknowledgments

The authors acknowledge Karina Melgaço and Bart Creeze, who helped to formulate the study and suggested following a risk assessment framework; Fernanda Coelho de Souza and Caroline Signori Müller, who contributed in the initial stages; and the Ecology and Global Change group at the University of Leeds (UoL), in particular Tim Baker and Sarah Batterman, for providing stimulating discussion. We thank Liana Anderson for making available the 2015 fire map, which was produced as part of the FATE project funded by the Brazilian Research Council (CNPQ-grants 458022/2013-6). We acknowledge the Priestley Society’s writing retreat at UoL where the first draft of this manuscript was written and the Women in Geography writing sessions at the University of Birmingham where the final stages of the manuscript were developed.

Conflicts of Interest

The authors declare no conflict of interest. The funders had no role in the design of the study; in the collection, analyses, or interpretation of data; in the writing of the manuscript; or in the decision to publish the results.

References

  1. Malhi, Y.; Wright, J. Spatial Patterns and Recent Trends in the Climate of Tropical Rainforest Regions. Philos. Trans. R. Soc. Lond. Ser. B Biol. Sci. 2004, 359, 311–329. [Google Scholar] [CrossRef] [PubMed]
  2. Liu, J.; Bowman, K.W.; Schimel, D.S.; Parazoo, N.C.; Jiang, Z.; Lee, M.; Bloom, A.A.; Wunch, D.; Frankenberg, C.; Sun, Y.; et al. Contrasting Carbon Cycle Responses of the Tropical Continents to the 2015–2016 El Niño. Science 2017, 358, eaam5690. [Google Scholar] [CrossRef] [PubMed]
  3. Lloyd, J.; Farquhar, G.D. Effects of Rising Temperatures and Co2 on the Physiology of Tropical Forest Trees. Philos. Trans. R. Soc. Lond. Ser. B Biol. Sci. 2008, 363, 1811–1817. [Google Scholar] [CrossRef] [PubMed]
  4. Heskel, M.A.; O’Sullivan, O.S.; Reich, P.B.; Tjoelker, M.G.; Weerasinghe, L.K.; Penillard, A.; Egerton, J.J.; Creek, D.; Bloomfield, K.J.; Xiang, J.; et al. Convergence in the Temperature Response of Leaf Respiration across Biomes and Plant Functional Types. Proc. Natl. Acad. Sci. USA 2016, 113, 3832–3837. [Google Scholar] [CrossRef] [PubMed]
  5. Slot, M.; Winter, K. In situ Temperature Response of Photosynthesis of 42 Tree and Liana Species in the Canopy of Two Panamanian Lowland Tropical Forests with Contrasting Rainfall Regimes. New Phytol. 2017, 214, 1103–1117. [Google Scholar] [CrossRef] [PubMed]
  6. Rowland, L.; da Costa, A.C.L.; Galbraith, D.R.; Oliveira, R.S.; Binks, O.J.; Oliveira, A.A.R.; Pullen, A.M.; Doughty, C.E.; Metcalfe, D.B.; Vasconcelos, S.S.; et al. Death from Drought in Tropical Forests Is Triggered by Hydraulics Not Carbon Starvation. Nature 2015, 528, 119–122. [Google Scholar] [CrossRef] [PubMed]
  7. Slik, J.F.; Arroyo-Rodríguez, V.; Aiba, S.I.; Alvarez-Loayza, P.; Alves, L.F.; Ashton, P.; Balvanera, P.; Bastian, M.L.; Bellingham, P.J.; Van Den Berg, E.; et al. An Estimate of the Number of Tropical Tree Species. Proc. Natl. Acad. Sci. USA 2015, 112, 7472–7477. [Google Scholar] [CrossRef]
  8. Slot, M.; Winter, K. In Situ Temperature Relationships of Biochemical and Stomatal Controls of Photosynthesis in Four Lowland Tropical Tree Species. Plant Cell Environ. 2017, 40, 3055–3068. [Google Scholar] [CrossRef]
  9. Clark, D.B.; Clark, D.A.; Oberbauer, S.F. Annual Wood Production in a Tropical Rain Forest in Ne Costa Rica Linked to Climatic Variation but Not to Increasing CO2. Glob. Chang. Biol. 2010, 16, 747–759. [Google Scholar] [CrossRef]
  10. McDowell, N.; Allen, C.D.; Anderson-Teixeira, K.; Brando, P.; Brienen, R.; Chambers, J.; Christoffersen, B.; Davies, S.; Doughty, C.; Duque, A.; et al. Drivers and Mechanisms of Tree Mortality in Moist Tropical Forests. New Phytol. 2018, 219, 851–869. [Google Scholar] [CrossRef]
  11. Condit, R.; Aguilar, S.; Hernandez, A.; Perez, R.; Lao, S.; Angehr, G.; Hubbell, S.P.; Foster, R.B. Tropical Forest Dynamics across a Rainfall Gradient and the Impact of an El Niño Dry Season. J. Trop. Ecol. 2004, 20, 51–72. [Google Scholar] [CrossRef]
  12. Chen, Y.; Morton, D.C.; Andela, N.; Van Der Werf, G.R.; Giglio, L.; Randerson, J.T. A Pan-Tropical Cascade of Fire Driven by El Niño/Southern Oscillation. Nat. Clim. Chang. 2017, 7, 906. [Google Scholar] [CrossRef]
  13. Fonseca, M.G.; Anderson, L.O.; Arai, E.; Shimabukuro, Y.E.; Xaud, H.A.; Xaud, M.R.; Madani, N.; Wagner, F.H.; Aragão, L.E. Climatic and Anthropogenic Drivers of Northern Amazon Fires during the 2015–2016 El Niño Event. Ecol. Appl. 2017, 27, 2514–2527. [Google Scholar] [CrossRef] [PubMed]
  14. Silva Junior, C.; Aragão, L.; Fonseca, M.; Almeida, C.; Vedovato, L.; Anderson, L. Deforestation-Induced Fragmentation Increases Forest Fire Occurrence in Central Brazilian Amazonia. Forests 2018, 9, 305. [Google Scholar] [CrossRef]
  15. Cochrane, M.A. Synergistic Interactions between Habitat Fragmentation and Fire in Evergreen Tropical Forests. Conserv. Biol. 2001, 15, 1515–1521. [Google Scholar] [CrossRef]
  16. Armenteras, D.; González, T.M.; Retana, J. Forest Fragmentation and Edge Influence on Fire Occurrence and Intensity under Different Management Types in Amazon Forests. Biol. Conserv. 2013, 159, 73–79. [Google Scholar] [CrossRef]
  17. Cano-Crespo, A.; Oliveira, P.J.; Boit, A.; Cardoso, M.; Thonicke, K. Forest Edge Burning in the Brazilian Amazon Promoted by Escaping Fires from Managed Pastures. J. Geophys. Res. Biogeosci. 2015, 120, 2095–2107. [Google Scholar] [CrossRef]
  18. Jiménez-Muñoz, J.C.; Mattar, C.; Barichivich, J.; Santamaría-Artigas, A.; Takahashi, K.; Malhi, Y.; Sobrino, J.A.; Van Der Schrier, G. Record-Breaking Warming and Extreme Drought in the Amazon Rainforest During the Course of El Niño 2015–2016. Sci. Rep. 2016, 6, 33130. [Google Scholar] [CrossRef]
  19. Yamori, W.; Hikosaka, K.; Way, D.A. Temperature Response of Photosynthesis in C3, C4, and Cam Plants: Temperature Acclimation and Temperature Adaptation. Photosynth. Res. 2014, 119, 101–117. [Google Scholar] [CrossRef]
  20. Fauset, S.; Baker, T.R.; Lewis, S.L.; Feldpausch, T.R.; Affum-Baffoe, K.; Foli, E.G.; Hamer, K.C.; Swaine, M.D. Drought-Induced Shifts in the Floristic and Functional Composition of Tropical Forests in Ghana. Ecol. Lett. 2012, 15, 1120–1129. [Google Scholar] [CrossRef]
  21. Esquivel-Muelbert, A.; Baker, T.R.; Dexter, K.G.; Lewis, S.L.; Brienen, R.J.; Feldpausch, T.R.; Lloyd, J.; Monteagudo-Mendoza, A.; Arroyo, L.; Álvarez-Dávila, E.; et al. Compositional Response of Amazon Forests to Climate Change. Glob. Chang. Biol. 2019, 25, 39–56. [Google Scholar] [CrossRef] [PubMed]
  22. Coelho, C.A.; Cavalcanti, I.A.; Costa, S.M.; Freitas, S.R.; Ito, E.R.; Luz, G.; Santos, A.F.; Nobre, C.A.; Marengo, J.A.; Pezza, A.B. Climate Diagnostics of Three Major Drought Events in the Amazon and Illustrations of Their Seasonal Precipitation Predictions. Meteorol. Appl. 2012, 19, 237–255. [Google Scholar] [CrossRef]
  23. Slik, J.F.; Franklin, J.; Arroyo-Rodríguez, V.; Field, R.; Aguilar, S.; Aguirre, N.; Ahumada, J.; Aiba, S.I.; Alves, L.F.; Anitha, K.; et al. Phylogenetic Classification of the World’s Tropical Forests. Proc. Natl. Acad. Sci. USA 2018, 115, 1837–1842. [Google Scholar] [CrossRef] [PubMed]
  24. Choat, B.; Jansen, S.; Brodribb, T.J.; Cochard, H.; Delzon, S.; Bhaskar, R.; Bucci, S.J.; Feild, T.S.; Gleason, S.M.; Hacke, U.G.; et al. Global Convergence in the Vulnerability of Forests to Drought. Nature 2012, 491, 752–755. [Google Scholar] [CrossRef] [PubMed]
  25. Olson, D.M.; Dinerstein, E.; Wikramanayake, E.D.; Burgess, N.D.; Powell, G.V.; Underwood, E.C.; D’amico, J.A.; Itoua, I.; Strand, H.E.; Morrison, J.C.; et al. Terrestrial Ecoregions of the World: A New Map of Life on Earth. BioScience 2001, 51, 933–938. [Google Scholar] [CrossRef]
  26. Aragao, L.E.O.; Malhi, Y.; Roman-Cuesta, R.M.; Saatchi, S.; Anderson, L.O.; Shimabukuro, Y.E. Spatial Patterns and Fire Response of Recent Amazonian Droughts. Geophys. Res. Lett. 2007, 34, 1–5. [Google Scholar] [CrossRef]
  27. Vedovato, L.B.; Fonseca, M.G.; Arai, E.; Anderson, L.O.; Aragao, L.E. The Extent of 2014 Forest Fragmentation in the Brazilian Amazon. Reg. Environ. Chang. 2016, 16, 2485–2490. [Google Scholar] [CrossRef]
  28. Armenteras, D.; Barreto, J.S.; Tabor, K.; Molowny-Horas, R.; Retana, J. Changing Patterns of Fire Occurrence in Proximity to Forest Edges, Roads and Rivers between Nw Amazonian Countries. Biogeosciences 2017, 14, 2755–2765. [Google Scholar] [CrossRef]
  29. Hansen, M.C.; Potapov, P.V.; Moore, R.; Hancher, M.; Turubanova, S.A.A.; Tyukavina, A.; Thau, D.; Stehman, S.V.; Goetz, S.J.; Loveland, T.R.; et al. High-Resolution Global Maps of 21st-Century Forest Cover Change. Science 2013, 342, 850–853. [Google Scholar] [CrossRef] [PubMed] [Green Version]
  30. Avitabile, V.; Herold, M.; Heuvelink, G.B.; Lewis, S.L.; Phillips, O.L.; Asner, G.P.; Armston, J.; Ashton, P.S.; Banin, L.; Bayol, N.; et al. An Integrated Pan-Tropical Biomass Map Using Multiple Reference Datasets. Glob. Chang. Biol. 2016, 22, 1406–1420. [Google Scholar] [CrossRef] [PubMed]
  31. Page, S.E.; Rieley, J.O.; Banks, C.J. Global and Regional Importance of the Tropical Peatland Carbon Pool. Glob. Chang. Biol. 2011, 17, 798–818. [Google Scholar] [CrossRef]
  32. Aragão, L.E.; Anderson, L.O.; Fonseca, M.G.; Rosan, T.M.; Vedovato, L.B.; Wagner, F.H.; Silva, C.V.; Junior, C.H.S.; Arai, E.; Aguiar, A.P.; et al. 21st Century Drought-Related Fires Counteract the Decline of Amazon Deforestation Carbon Emissions. Nat. Commun. 2018, 9, 536. [Google Scholar] [CrossRef] [PubMed]
  33. Silva Junior, C.H.; Anderson, L.O.; Silva, A.L.; Almeida, C.T.; Dalagnol, R.; Pletsch, M.A.; Penha, T.V.; Paloschi, R.A.; Aragão, L.E. Fire Responses to the 2010 and 2015/2016 Amazonian Droughts. Front. Earth Sci. 2019, 7, 97. [Google Scholar] [CrossRef]
  34. Engelbrecht, B.M.; Comita, L.S.; Condit, R.; Kursar, T.A.; Tyree, M.T.; Turner, B.L.; Hubbell, S.P. Drought Sensitivity Shapes Species Distribution Patterns in Tropical Forests. Nature 2007, 447, 80–82. [Google Scholar] [CrossRef] [PubMed]
  35. Zelazowski, P.; Malhi, Y.; Huntingford, C.; Sitch, S.; Fisher, J.B. Changes in the Potential Distribution of Humid Tropical Forests on a Warmer Planet. Philos. Trans. R. Soc. Lond. A Math. Phys. Eng. Sci. 2011, 369, 137–160. [Google Scholar] [CrossRef] [PubMed]
  36. Bennett, A.C.; McDowell, N.G.; Allen, C.D.; Anderson-Teixeira, K.J. Larger Trees Suffer Most During Drought in Forests Worldwide. Nat. Plants 2015, 1, 15139. [Google Scholar] [CrossRef] [PubMed]
  37. Brando, P.M.; Nepstad, D.C.; Balch, J.K.; Bolker, B.; Christman, M.C.; Coe, M.; Putz, F.E. Fire-Induced Tree Mortality in a Neotropical Forest: The Roles of Bark Traits, Tree Size, Wood Density and Fire Behavior. Glob. Chang. Biol. 2012, 18, 630–641. [Google Scholar] [CrossRef]
  38. Van Nieuwstadt, M.G.; Sheil, D. Drought, Fire and Tree Survival in a Borneo Rain Forest, East Kalimantan, Indonesia. J. Ecol. 2005, 93, 191–201. [Google Scholar] [CrossRef]
  39. Taylor, T.C.; Smith, M.N.; Slot, M.; Feeley, K.J. The Capacity to Emit Isoprene Differentiates the Photosynthetic Temperature Responses of Tropical Plant Species. Plant Cell Environ. 2019, 42, 2448–2457. [Google Scholar] [CrossRef]
  40. Esquivel-Muelbert, A.; Baker, T.R.; Dexter, K.G.; Lewis, S.L.; ter Steege, H.; Lopez-Gonzalez, G.; Monteagudo Mendoza, A.; Brienen, R.; Feldpausch, T.R.; Pitman, N.; et al. Seasonal Drought Limits Tree Species across the Neotropics. Ecography 2017, 40, 618–629. [Google Scholar] [CrossRef]
  41. Spracklen, D.V.; Arnold, S.R.; Taylor, C.M. Observations of Increased Tropical Rainfall Preceded by Air Passage over Forests. Nature 2012, 489, 282. [Google Scholar] [CrossRef] [PubMed]
  42. Cai, W.; Wang, G.; Dewitte, B.; Wu, L.; Santoso, A.; Takahashi, K.; Yang, Y.; Carréric, A.; McPhaden, M.J. Increased Variability of Eastern Pacific El Niño under Greenhouse Warming. Nature 2018, 564, 201–206. [Google Scholar] [CrossRef] [PubMed]
  43. Cochrane, M.A.; Schulze, M.D. Fire as a Recurrent Event in Tropical Forests of the Eastern Amazon: Effects on Forest Structure, Biomass, and Species Composition. Biotropica 1999, 31, 2–16. [Google Scholar] [CrossRef]
  44. Silva, C.V.; Aragão, L.E.; Barlow, J.; Espirito-Santo, F.; Young, P.J.; Anderson, L.O.; Berenguer, E.; Brasil, I.; Foster Brown, I.; Castro, B.; et al. Drought-Induced Amazonian Wildfires Instigate a Decadal-Scale Disruption of Forest Carbon Dynamics. Philos. Trans. R. Soc. B Biol. Sci. 2018, 373, 20180043. [Google Scholar] [CrossRef] [PubMed]
Figure 1. Conceptual framework of alternative effects of climate anomalies on ecosystems given baseline climate and recent climate change. (a) Climate anomalies are often measured as the difference between the mean baseline climate and the climatic condition at the anomaly (vertical lines). (b) To account for recent adaptations to climate change that could occur via change in community composition [20,21] (leading to resilience to the climate stressor), we can describe the anomaly as the difference between the recent climate trend and the climate conditions during the extreme climate event, i.e., the residuals from the trend line. (c) The physiological threshold (dashed line) for a given community might depend on the region where that community evolved and adapted [24]. If so, the physiological threshold can be defined regionally (considering adaptations to regional conditions), as in (c), where communities 1 (red) and 2 (blue) are equally close to a physiological threshold (double-headed arrow) due to the differ regional climates in which they occur regardless of their different baseline conditions. Alternatively, (d) we may consider that there is a global physiological threshold (black dashed line) that all tropical trees can tolerate, and the closer the baseline climate (*) is to this threshold, the higher the risk for a given community under the same climate anomaly. For instance, in (d), community 1 is at a higher risk than community 2, as a less intense anomaly is required for community 1 to reach the physiological threshold.
Atmosphere 10 00588 g001
Figure 2. Schematic of the calculation of the risk of an El Niño negatively affecting the tropical forest carbon cycle with examples from El Niño in 2015 (global baseline susceptibility and mean-based severity). Susceptibility of risk (left-hand side) is defined from forest fragmentation preceding the El Niño year, long-term mean temperature (T), and maximum cumulative water deficit (MCWD). Each pixel is given a 1–10 score for each variable. Susceptibility is the mean of these scores. The severity of the El Niño (right-hand side) is defined as the mean of the T anomaly score and the MCWD anomaly score. The susceptibility and severity scores are then multiplied together to produce the risk score. Risk scores are then multiplied by forest cover to quantify impact (not shown). Dotted and dashed lines on anomaly histograms refer to distributions in the 1982 El Niño and the 1997 El Niño, respectively. The dotted line on the ignition potential histogram refers to the distribution of edge extent in the year 2000.
Atmosphere 10 00588 g002
Figure 3. Risk of El Niños to the tropical forest carbon cycle. The top three maps show the distribution of risk scores in each El Niño. The bottom map shows the temporal consistency of high-risk El Niño as the number of El Niños in the top quartile of the risk score.
Atmosphere 10 00588 g003
Figure 4. Impact of El Niños on the tropical forest carbon cycle. The top three panels show the distribution of impact in each El Niño, i.e., risk weighted by forest cover and forest biomass from Reference [30]. The bottom map shows the temporal consistency of pixels that had high impact across El Niños, which was calculated as the total number of El Niños in which each pixel appeared in the top quartile of the impact score.
Atmosphere 10 00588 g004
Figure 5. Change in risk score under different definitions of risk. For each panel, we subtracted a definition of risk from our main risk definition based on our theoretical framework (mean-based severity × global susceptibility), which corresponds from to: top graph (Figure 1a only)–(Figure 1a combined with Figure 1d); mid graph (Figure 1b combined with Figure 1d)–(Figure 1a combined with Figure 1d); and bottom graph (Figure 1a combined with Figure 1c)–(Figure 1a combined with Figure 1d).
Atmosphere 10 00588 g005

