Impact of Biochar on Physicochemical Properties of Haplic Luvisol Soil under Different Land Use: A Plot Experiment


Institute of Agrophysics, Polish Academy of Sciences, 20-618 Lublin, Poland
*
Author to whom correspondence should be addressed.
Agronomy 2019, 9(9), 531; https://doi.org/10.3390/agronomy9090531
Submission received: 12 August 2019
/
Revised: 5 September 2019
/
Accepted: 9 September 2019
/
Published: 11 September 2019
(This article belongs to the Special Issue Interaction of Biochar on Organic Waste Composting)
Abstract
:There is limited information regarding the effect of biochar (BioC) on improving the fertility of degraded soils (fallow and grassland), particularly with respect to changes with time. The objective of the study was to evaluate, in a three-year field experiment, the influence of BioC on the physicochemical properties of Haplic Luvisol. BioC, obtained via wood waste pyrolysis at 650 °C, was applied to the soil of subplots under fallow and grassland at rates of 0, 1, 2, and 3 kg·m−2. Soil samples were collected eight times, from 2013 to 2015. Physicochemical characterization was performed for soil and BioC by analyzing density, pH, surface charge, as well as ash and organic carbon content. BioC’s influence on the physicochemical properties of degraded soils was determined by analyzing the changes in pH, specific surface area, radius, and volume of the micropore. The addition of BioC affected analyzed soils to varying degrees. In the case of the fallow, a positive effect on changes in these parameters was observed, particularly at the highest biochar dose and for the last year of the experiment. However, for the grassland, in most cases we observed the opposite trend—for example, pH and specific surface area values decreased with increasing biochar dose. We believe that it is necessary to examine how BioC affects sorption properties of organic matter of fallow and grassland soils, as well as the BioC’s influence on humic acids of these soils as a function on BioC dose and function of time.
1. Introduction
During recent decades, allowing for farmland to fallow [1] and the abandonment of semi-natural grasslands [2] have been considered as effective tools in improving the self-rehabilitation of arable soils. Cessation of traditional forms of agricultural land use has become a relevant phenomenon, until it resulted in a strong decline in ecosystems [1,2]. Hence, the current trend is fallow and grassland reclamation. Agriculture is intensively evolved towards sustainable systems and organic farming; thus, it is necessary to seek solutions that would not influence soil conditions in a negative manner (e.g., by chemical and physical degradation). Biochar (BioC), which is a carbon-rich product obtained from biomass pyrolysis, might be a perspective soil amendment compound, due to its interesting physicochemical properties [3]. BioC might mitigate environmental problems, such as soil inorganic/organic contamination, soil acidity, salinization, low fertility, and limited crop production [4,5]. It can also be used as a sorbent for environmental contaminants, including heavy metals and organic contaminants [6]. However, the most important fact in our study is that BioC might be used to restore and reclaim infertile and degraded soils, because it improves soil quality through significant changes in its physicochemical and biological properties.
BioC is characterized by a highly developed porosity, surface area, and pH, which affect water adsorption, sorption capacity, and nutrient retention in soil [4]. BioC’s surface can exhibit hydrophilic, hydrophobic, acidic, and basic properties; hence, BioC can adsorb solutes from soil solutions, affecting micro- and macroelement retention [7,8]. The oxygen-containing functional groups on the BioC surface determine the acid/base properties of the material. The molar O/C ratio of a char expresses its surface hydrophilicity [9]. Several authors have reported that one of the notable effects of BioC addition to the soil is an increase in organic carbon [10,11]. Moreover, soil application of BioC resulted in a significant increase in soil pH [12] and cation exchange capacity (CEC) [13].
In agricultural systems, conserving soil organic carbon has been recognized as a strategy to reduce soil degradation. On the other hand, residue management, artificial addition of organic matter sources to the soil and clay mineral, and the sesquioxide of soil are the most important factors in both structural and aggregation improvement of soil [14]. The content of dissolved organic carbon (DOM) in BioCs play an important role in determining their application potential for environmental use. According to Smebye et al. [15] and Tang et al. [16], BioC added to degraded soils might have significant potential for their fertility and productivity improvement by enriching organic carbon as well as protecting plants against disease.
Soil physicochemical properties describe the relevant phenomena that play an important role, among others, in the maintenance of appropriate soil structure as well as plant nutrient migration, bioavailability, and supply. Pore structure and surface area are the most important physical properties of soil and they are responsible for various processes in soil. Many scientific reports have reviewed the potential impact of BioC on soil physical, physicomechanical, and hydrological properties [17,18]. Ahmed and Raghavan [19] investigated the influence of wood-derived BioC on the physicomechanical properties of silt loam soil. They found that BioC amendment caused a decline in bulk density of this soil, as well as an increase in moisture content, in comparison to non-amendment soil. These changes in soil mechanical properties can adversely affect soil workability; moreover, the biochar-amended silt loam soil was more susceptible to compaction.
There are also many studies that demonstrate how BioC addition affects the physicochemical properties of agriculturally cultivated soils [20,21]. However, these are mainly model studies, whereas there is almost no information regarding BioC’s potential influence on the physicochemical properties of fallow and grassland soils and on improving their fertility (plot experiment, several years of BioC impact on the soil).
The main goal of these studies was to investigate the effect of BioC addition on he physicochemical properties (such as density, ash content, pH, negative surface charge, specific surface area, as well as volume and radius of micropores) of soils under fallow and grassland as a function of BioC dose and the three-year impact time.
2. Materials and Methods
2.1. Field Experiment
The studies were conducted on a Haplic Luvisol (according to the IUSS Working Group WRB, 2006). The experimental plots (four grassland and four fallow sub-plots, each of 20 m2) were located in the southern–eastern Poland (51°15′ N; 22°35′ E). During the experiment, the fallow plots were maintained without plants, whereas the grassland was managed through cutting. The BioC used in the experiment was obtained on the way of the wood waste pyrolysis at 650 °C (Fluid S.A. company)—pyrolysis time: 15 min., heating rate: about 3 °C·s−1 [22,23]. Dry product was uniformly surface applied in subplots at the amount of 0 (control) 1, 2, 3 kg·m−2 in June 2013. Subsequently, in the case of fallow, the BioC was mixed to a depth of 0–0.15 m(surface layer) while using a rototiller, and it was left on the surface in the case of grassland. Cybulak et al. [24] and Usowicz et al. [25] described the plot experiment in detail. The soil samples were collected from each plot in July, November, and March: two times in 2013 (starting from July), three times in 2014, and three times in 2015 (the last one in November). The above terms were marked as numbers from 1 to 8. The collected material was dried at 25 °C, sieved through a 1 mm sieve, and then grounded.
2.2. Soil and BioC Characterization
The physicochemical properties were determined for both soil and BioC samples. Density (d) was analyzed while using the pycnometric method (Ultrapycnometer 1000, Quantachrome, Graz, Austria). Organic carbon content (Corg) was assayed by both Tiurin (soil samples) and Alten (BioC samples) titration methods [26]. The ash content (A) was determined as BioC and soil calcination in the muffle furnace (FCF 12 SP, Czylok, Jastrzębie – Zdrój, Poland) at 550 °C for 5.5 h. Ash content represents the incombustible component (mineral components) remaining after the sample is completely burned [27]. The pH was measured in H2O and 0.01 mol·dm−3 CaCl2 solution (Multifunction pH–meter CX–505, Elmetron, Zabrze, Poland). The negative surface charge (Q) was calculated at pH 9 from potentiometric titration curves recorded for aqueous suspensions of soil or BioC (0.5% w/w) titrated with 0.1 M NaOH (on the basis of 1M NaCl) in pH range of 3–10 by using a TitroLine 7000 automatic titrator (SI Analytics, Mainz, Germany) [28]. The specific surface area (S) was obtained in agreement with the Polish standard method (PN-Z-19010-1, 1999) [29].
The determination of S was based on the application of the Brunauer, Emmet, and Teller (BET) equation [30]:
where: N is the amount of adsorbed water vapor and CBET is a constant that is related to the energy of surface interactions. When applied to the adsorption data in the range of relative pressures 0<p · p0−1>0.35, x = p· p0−1 enables the monolayer capacity (Nm) to be obtained.
Multiplying the amount of gas adsorbed in a monolayer by the area occupied by its single molecule, the overall amount of the soil surface can be estimated from the equation:
where L is the Avogadro number (6.023 · 10−23 molecules per mole), M is the molecular weight of gas or vapor (gram per mole), and σ is the molecule cross-sectional area for gas or vapor (10.508 · 10−20 m2 for a water molecule).
Volume (V) and radius (R) of the micropore were estimated from the water vapor sorption isotherms, according to the BET theory [31].
The R and the V volume of the micropore were related to the desorption pressure by the Kelvin equation for the hemispherical meniscus with zero water-solid contact angle [32].
where Vw is molar volume of adsorbate (m3·mol−1), σw is water surface tension (J·m2), α is water-solid contact angle (assumed α = 0), r is the curvature of the meniscus, R is the universal gas constant, and T is the measurement temperature.
where Vc is total volume of the micropores, V is the volume of the micropores at given p·p0−1, Vi is the volume of the micropores with radius ri, and f(ri) is the pore fraction in a given range of pore sizes.
The average radius of the micropores (R) was calculated as:
Casagrande measured particle size distribution with a Prószyński modification sieve-sedimentation method [33].
2.3. Analysis of BioC Influence on Soil Physicochemical Properties
BioC influence on soil physicochemical properties were determined by analyzing pH, Q, S, R, and V values (explained in more detail in Section 2.2).
Statistical analysis was performed while using Statistica 12.0 (StatSoft Inc., Tulsa, OK, USA): one-way analysis of variance (ANOVA), and post hoc analysis (HSD Tuckey test, α = 0.05).
3. Results and Discussion
3.1. Physicochemical Properties of Soils and BioC
Table 1 presents the physicochemical properties of investigated soils and BioC.
Soils collected from fallow, as well from grassland, were characterized by a density (d) value of approximately 2.60 g·cm−3, which was typical for mineral soils. The standard value of d for all mineral soils is 2.65 g·cm−3 and it is identical to quartz density. According to Rühlmann [34], the typical d values for mineral soils range from 2.4 to 2.9 g·cm−3. Slight differences in soil particle density were connected with various amounts of soil mineral and organic components.
Both analyzed soils contained a relatively low content of organic matter, expressed as low values of Corg and high content of A. Grassland revealed a slightly higher Corg concentration due to the presence of green biomass and, consequently, the higher activity of microorganisms. The pH of the soils was weakly acidic—slightly higher for the grassland. The examined soils were characterized by low Q values (slightly higher in the case of the grassland in reference to fallow), a result that indicated the low content of organic structures (mainly carboxylic and phenolic groups), dissociating to the negative surface charge [28].
Soil samples that were taken from fallow and grassland were characterized by S, V, and R values typical for mineral soils (Table 1). Scientific reports have shown that these parameters are changed in the ranges of 14–60m2⋅g−1, 11–20 µl⋅g−1, and < 10 nm, for S, V, and R, respectively [30].
The properties of wood-derived BioC that were used in the experiment were significantly different from those values found in soils. The BioC was characterized by a low d value (1.46 g·cm−3), typical for organic materials. Brewer at al. found a similar value of BioC skeletal d [35]—miscanthus and wood-derived BioC density ranged from 1.34 to 1.96 g·cm−3 and increased with higher pyrolysis temperatures. The relatively low A content of ~43% and high Corg content of ~15% indicated a high concentration of organic matter in BioC mass, in reference to the studied soils. On the other hand, the relatively high ash content suggests that BioC can be effective in providing nutrients to the soil. Moreover, BioC was characterized by alkaline pH (values: 8.25 and 7.21, measured in H2O and CaCl2, respectively), which most likely resulted from the presence of alkaline cations [36]. The much higher Q value in relation to the soils indicated the presence of various functional groups in the organic compounds of BioC [37]; these functional groups indicate that BioC has favorable sorption properties.
The BioC that was used in the experiment was characterized by a relatively high S value (69.9 m2·g−1)—significantly higher in comparison to the values of investigated soils (Table 1). However, numerous studies have shown that BioC S values substantially vary. For example, BET surface area for different wood BioCs covers the range from >1 to 317 m2·g−1, for grass BioC from >1 to 387 m2·g−1 [35], for BioC from applewood from ~10 m2·g−1 to 79.4 m2·g−1 [35], and for BioC from flax fibre: 5.9 to 45.6 m2·g−1 [38]. Ahmad et al. [39] summarized the important parameters that were collected from recently published studies on BioC production; the BioCs that were produced from animal litter and solid waste feedstock exhibited lower surface areas in comparison to BioCs that were produced from crop residue and wood biomass, even at higher pyrolysis temperatures. According to Sokołowska [29], the S of organic materials is higher than the one describing mineral soils. This result was due to the adsorption and absorption of water vapor, the presence of polar functional groups that are the adsorption centers for water molecules, as well as due to the strong polar affinity of polar adsorbates for organic materials [7,40]. A relatively low R-value being determined for BioC indicated a significant content of small particles with a high degree of dispersion.
The wood-derived BioC was also characterized by scanning electron microscopy (SEM) (Figure 1).
3.2. The Effect of BioC Addition on Physicochemical Properties of the Soil under Fallow and Grassland
3.2.1. The Effect of BioC Addition on Soil Density
The effect of wood-derived BioC on the density of the loess soil was ambiguous and it exhibited differences. The d values of amended soil under fallow were in the range of 2.61–2.63 g·cm−3 (for 1 kg·m−2 BioC), 2.60–2.63 g·cm−3 (for 2 kg·m−2 BioC), and 2.59–2.64 g·cm−3 (for 3 kg·m−2 BioC), whereas the d values of soil under grassland were 2.59–2.62 g·cm−3 (for 1 kg·m−2 BioC), 2.58–2.61 g·cm−3 (for 2 kg·m−2 BioC), and 2.20–2.63 g·cm−3 (for 3 kg·m−2 BioC). When considering the low density of biochar in relation to soil density, a decrease in d value could be expected during the experiment, which has not been confirmed by the results of our research. Pranagal et al. [41] investigated the effect of BioC addition on the basic physical properties of Haplic Podzol in a six-year field experiment. Their results also showed that the values of particle d are in the range of 2.62–2.63 g·cm−3 and they are characterized by small differences in relation to the control samples. Moreover, this experiment demonstrated a decrease of particle d after BioC application to the soil. In particular, the effect of BioC addition was observed in the surface layer (0–0.10 m), but this effect did not persist for a long time.
The lack of a clear effect of biochar on soil density was probably due to the relatively small volume of BioC per volume of soil tested.
3.2.2. Effect of BioC Addition on Soil pH
PH is one of the main factors influencing other physicochemical properties, as well as soil fertility. This parameter is conditioned by natural and anthropogenic factors [42]. The main mechanism explaining the capacity of biochar to buffer soil pH is considered to be the association and dissociation reaction of the oxygen-containing groups on the surface of BioCs. In Figure 2A,B, the relative changes in pH values of samples that were collected from fallow and from grassland soil amended with BioC are shown.
BioC application in the initial period after its addition to the fallow soil (1st term) caused an increase in the pH values (Figure 2A). These results are consistent with the findings of Amoakwah et al. [43], who showed that BioC added to a tropical sandy loam significantly increased the soil pH. Liao and Thomas [44] in their research on the influence of BioC particle size on soil pH, found that small-particle-sieved BioC had the largest liming effect, increasing the substrate pH values by an additional ~0.3 pH units in comparison to other BioCs. Similarly, Shah et al. [45] showed that BioC addition to the soil caused a considerable increase in soil pH immediately after its application (at day 0 of incubation period); the soil pH increased with increasing BioC dosage, and these effects were maintained during all of the incubation periods (50 days). In the case of those studies, the maximum increase of 8.0% in soil pH was observed with a BioC dose of 20 t·ha−1 as compared to a 7.3% increase while using 10 t·ha−1 and 4% with 5 t·ha−1. Moreover, during five days of incubation, a general increase in soil pH was observed—the highest increase was 3.31% at a biochar dose of 20 t·ha−1. However, the results also showed that this increase was not sustained to the same extent during later incubation periods. The periodic decreases and increases in the soil pH values that were observed for subsequent periods of our experiment were most likely associated with mineralization processes of organic matter derived from BioC or by the instability of the weather conditions during sampling [46]. In the last year of the experiment (eighth term), a significant increase of pH values was observed in fallow soil amended with BioC, in relation to control soil. Nelissen et al. [47], studying the impact of a woody BioC on properties of a sandy loam soil and spring barley, have shown that BioC has a long-term effect, only observed a few years after its application to the soil. The increase in soil pH values may be explained by the presence of ashes in the BioC. Ashes are rich in oxides and hydroxides of alkali metals, which are easily dissolved and react rapidly with the soil, thereby increasing its pH [48]. These results are consistent with Mierzwa–Hersztek et al. [49], whose research showed that alkaline substances are easily released from BioC. Their results also showed a positive correlation between pH of the soil and soil’s enzymatic activity—BioC might contain labile substrates that enhance the activity of soil microorganisms.
When considering the BioC effect on pH, it should be noticed that the liming effect could also depend on pyrolysis process conditions (temperature). In the case of our studies, the BioC was produced by wood waste pyrolysis at 650 °C, so most carboxyl or hydroxyl functional groups were destroyed and final product exhibited higher pH than any biochar obtained at lower temperature. As a consequence, the liming capacity of the BioC that was used in the experiment is significant. In the case of the grassland, the BioC addition resulted in a decrease in pH values (Figure 2B). This result was probably related to an intensified nitrification process that was associated with the activities of Nitrosomonas and Nitrobacter bacteria [50]. The higher amount of these bacteria in grassland soil (in comparison to fallow soil) leads to a more rapid conversion of ammonium ions to nitrates with simultaneous hydrogen ion release. A higher liming effect of the BioC on the fallow can also result from lower initial pH of the fallow (pH of control plot - 6.21) as compared to grassland (6.72). These findings may lead to the conclusion that biochar improves the pH on more acidic soils.
3.2.3. Effect of BioC Addition on Soil Surface Negative Charge
Data that were obtained from potentiometric titration allowed for estimating the surface negative charge values (Q) in fallow and grassland amended with BioC (Table 2).
The variable surface charge occurs on the surface of many soil components, such as on the surface of organic matter. Its values depend on the relative content of acidic surface groups [28]. BioC, which is characterized by a high surface negative charge value (Table 1), added to the fallow and grassland did not have an obvious effect on the Q values (Table 2) and, consequently, on the content of strongly acidic functional groups of the soil.
BioC addition to the fallow soil, at the rate of 2 and 3 kg ⋅ m−2, caused a significant increase of Q values in the eighth term (as compared to the first term), confirming the conclusion regarding its long-term effect [47], whereas the addition of the highest BioC dose to this soil caused a decrease in the Q value (Table 2). Such interesting observations might be a consequence of blocking the soil pores containing the functional groups by a smaller fraction of BioC, which was introduced in a higher amount. In the last year of the experiment (eighth term), a significant increase of Q values was also observed for the grassland at every BioC dose. This increase was likely related to the fact that BioC introduced organic matter with a variable surface charge.
3.2.4. Effect of BioC Addition on Soil Surface Properties
BioCs are considered to develop a negative charge from oxidation with aging, a process that may create additional interaction mechanisms for adsorption properties. Figure 3 shows an example of experimental adsorption isotherms that were obtained for soil samples collected from fallow and grassland in the first term of the field experimental (July 2013). According to the BET classification [32], all of the curves belong to the same class, namely to the type II (S-shaped isotherms), typical for the physical adsorption process. These are monolayer-multilayer isotherms that are normally obtained for non-porous or macroporous materials. The curves are characterized by the sharpness of the knee of the isotherm. The rounded knee suggests a low net heat of adsorption and low adsorbent/water vapor interaction.
The isotherms were characterized by the occurrence of a small inflection at low values of relative water vapor pressure p · p0−1 ≈ 0.1, more or less steep in the central part (p·p0−1 from ~ 0.1 to ~ 0.8), and a rapid increase in the quantity of adsorbed water vapor from p·p0−1 ≈ 0.8 (Figure 3).
Figure 4A,B show the maximum values of the water vapor adsorption at p·p0−1 ≈ 1.
For the fallow, at the highest BioC dose (3 kg·m−2), a significant increase of the analyzed parameters took place (Figure 4A). In the case of the grassland, a negative correlation was observed—water vapor adsorption decreased with increasing BioC dose (Figure 4B). According to Brantley et al. [51], low doses of BioC that were obtained from wood waste do not improve soil water retention and, consequently, soil sorption properties are also not improved. Cybulak et al. [24], studying BioC’s influence on the hygroscopic moisture content of podzolic soil, also showed a similar trend—decreasing values of the discussed parameter with increasing BioC dose. The sorption of gases depends on the nature of the soil solids and soil organic matter. The literature shows that BioC, when added to the soil, modified its sorption properties in different ways. Aller et al. [52] have evaluated the degree of hydrophobicity of fresh and aged BioCs. A water drop penetration test indicated that aged BioCs are more hydrophilic than fresh ones and BioCs become less hydrophobic after additional wetting-drying treatments. Arthur et al. [40] observed an increase in water vapor sorption in a sandy loam soil with birch wood BioC in two subsequent years, a result that is attributed to the S value of BioC aging for 19 months. Mukherejee et al. [53] compared the physicochemical characteristics of newly made and 15-month field-aged BioCs and biochar-soil mixtures in terms of the effect on pyrogenic organic matter addition evolving in the environment over time. The authors found that, after aging, the BioC exhibited a significant increase in cation exchange capacity (CEC), average appearance of anion capacity, significant decreases in pH, ash content, and nanopore surface area, and a relative increase in O-containing functional groups. According to Singh and Cowie [54], BioC can influence native soil organic carbon mineralization through primary effects. They observed that BioC stimulates native organic carbon mineralization in soils with low organic carbon content. The mineralization effect decreases in time, which is possibly due to the depletion of labile soil organic carbon from initial positive priming as well as potentially its stabilization induced by BioC organo-mineral interactions. Paetsch et al. [55] investigated the effect of BioC on water availability and microbial properties of grassland soil during three months’ incubation under optimum and drought conditions—BioC amendments caused considerable increases in soil organic carbon mineralization, despite water stress. Yang et al. [56] observed the influence of pH, ionic strength, and particle size on transport and retention of BioC particles in porous media. Kumari et al. analyzed the effect of BioC on the dispersibility of water-dispersible colloids [21]. They found that the content of water-dispersible colloids increased with the rate of BioC application. In conclusion, it is difficult to predict how BioC will modify soil sorption properties. The level of modification depends on the type of BioC biomass, BioC age, type of soil, content of organic matter in the soil, etc.
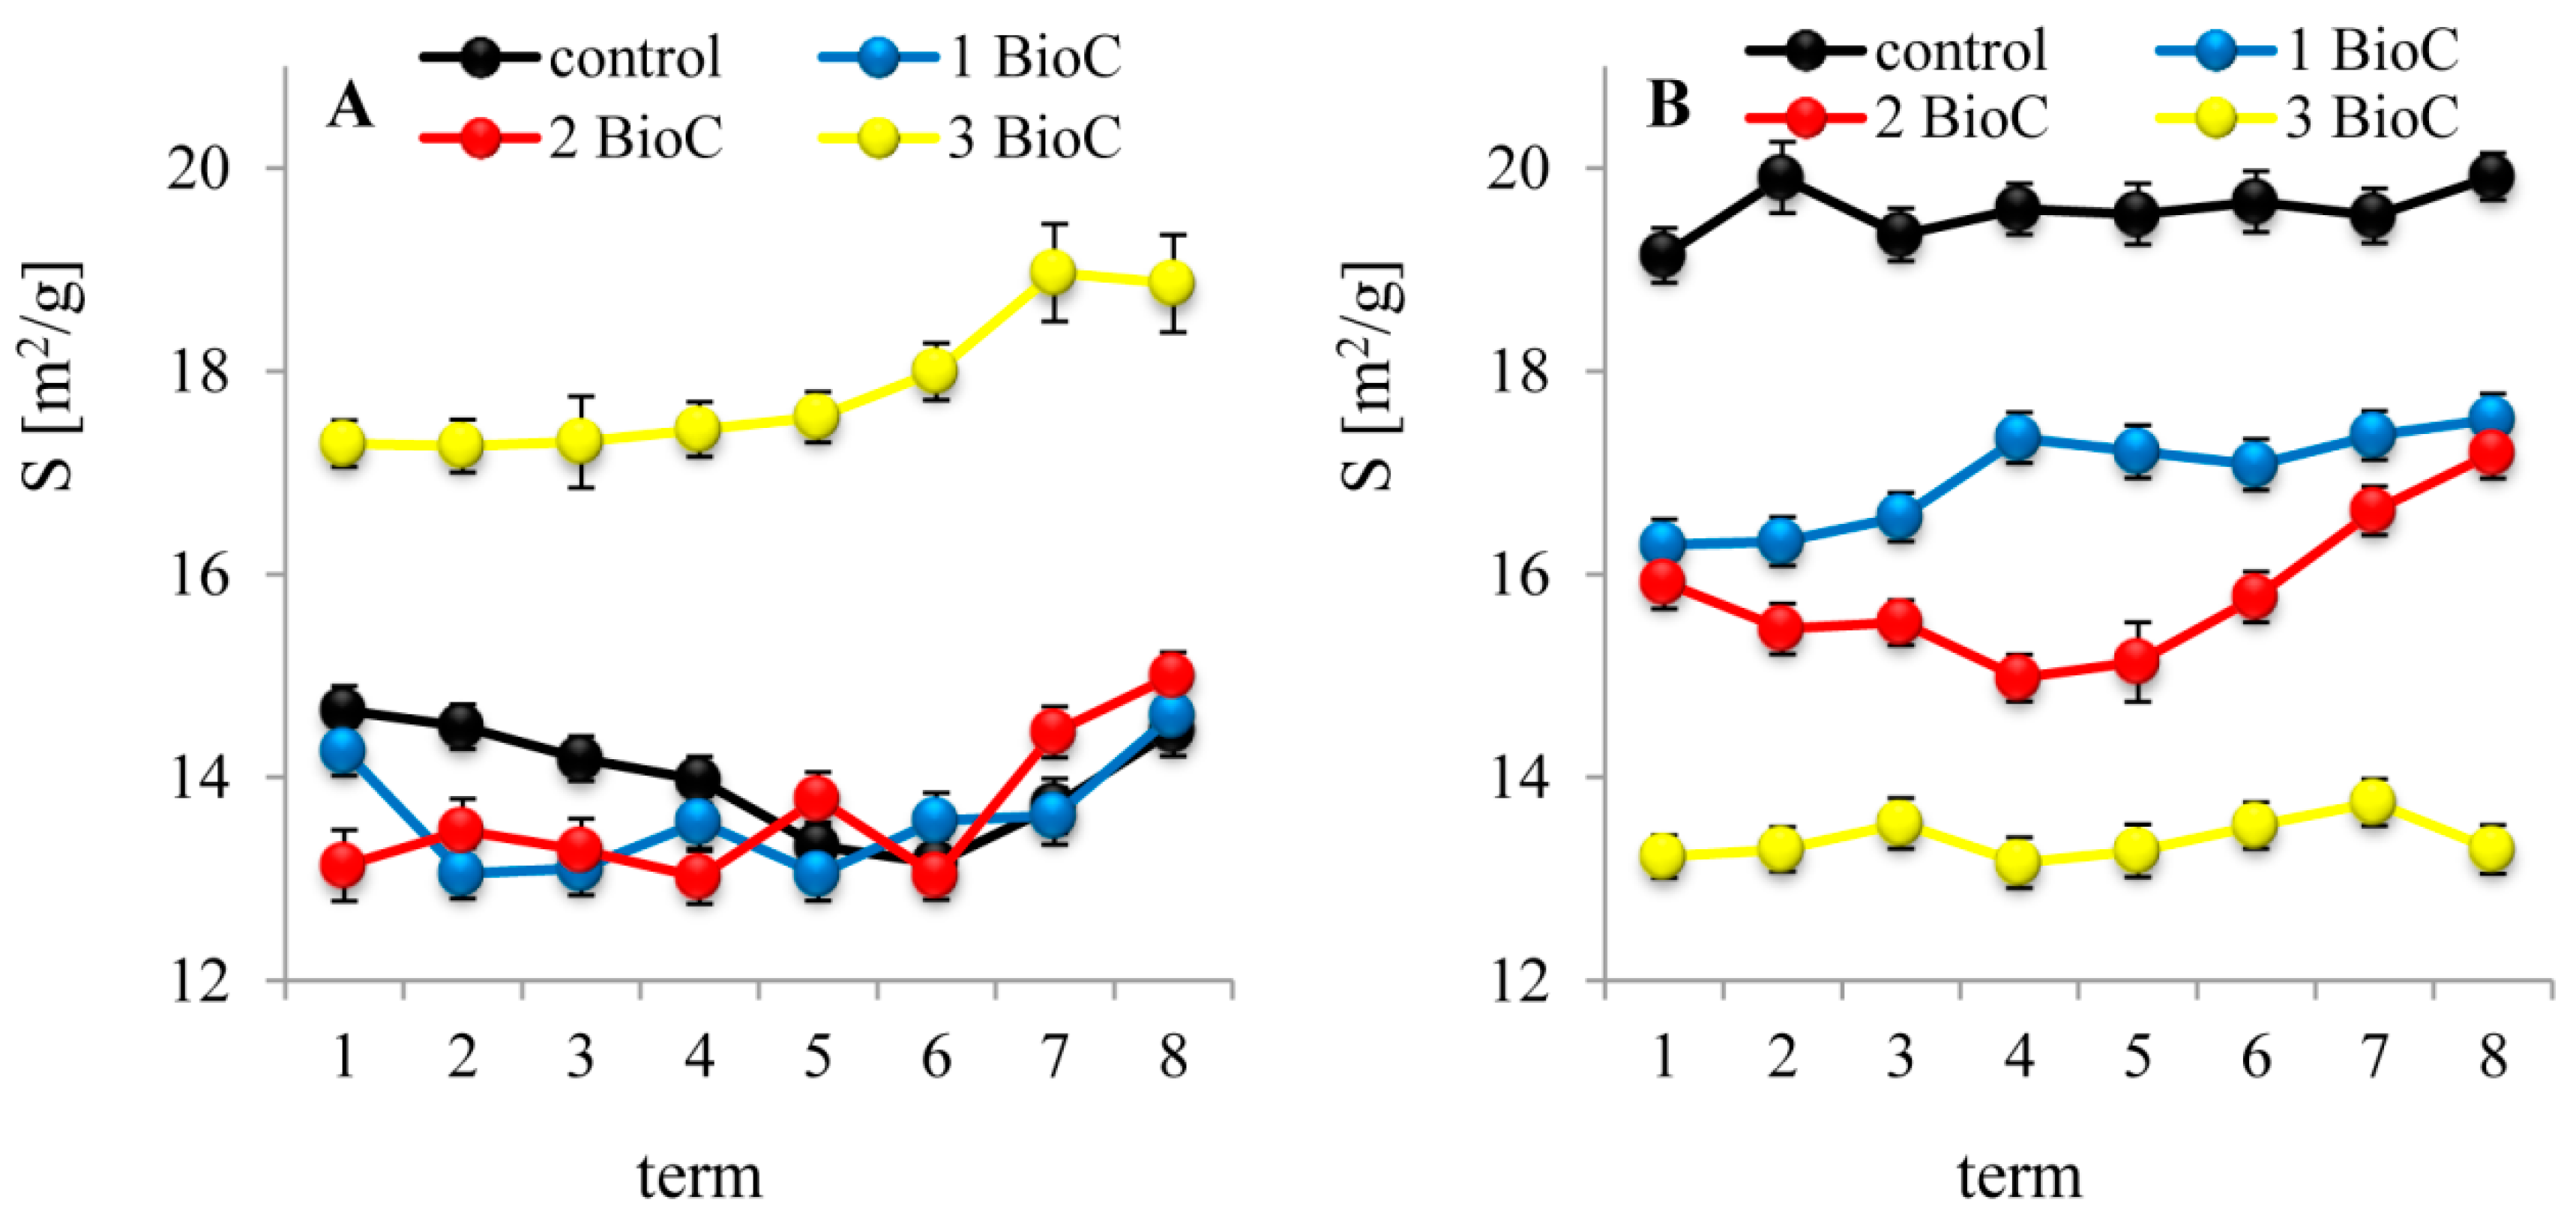
Data that were obtained from water vapor sorption isotherms enabled the estimation of S values, as presented in Figure 5A,B.
The S values of amended soil under fallow were in range 13.05–14.60 m2·g−1 (for 1 kg·m−2 BioC), 13.02–15.00 m2·g−1 (for 2 kg·m−2 BioC), and 17.26–18.97 m2·g−1 (for 3 kg·m−2 BioC), whereas the S values of soil under grassland were 16.29–17.53 m2·g−1 (for 1 kg·m−2 BioC), 14.98–17.19 m2·g−1 (for 2 kg·m−2 BioC), and 13.16–13.75 m2·g−1 (for 3 kg·m−2 BioC). S is one of the most important parameters highly correlated with the physical and chemical properties of soil [57]. The S values are not only determined by soil particle size, soil porosity, and number of polar functional groups on the soil surface, but also by the quantity and quality of mineral (mainly clay minerals) and organic (mainly humic substances) colloidal particles [58]. Therefore, S measurements can be used to indicate changes that are caused by the addition of organic material, such as BioC.
The results of the three-year experiment showed that BioC addition had various influences on the S values of differently cultivated soils—fallow and grassland. In the case of fallow, only the highest BioC dose (Figure 5A) caused a significant increase in values of the discussed parameter. This result is consistent with the studies of Jatav et al. [12] and Zhang et al. [59], which showed an increase of soil S after BioC addition. According to the literature, the increase of S results from the creation of nanometer-range pyrogenetic pores due to the growth of high-density turbostratic crystallites [60]. The S value could also increase due to progressive degradation of the residues of hemicelluloses, cellulose, and lignin, and the formation of new bundles or channels. Moreover, BioC is characterized by numerous functional groups of polar nature that occur mainly on the outer surfaces of pores. These polar groups constitute adsorption center for water vapor molecules and might strongly influence the values of S [61]. According to Liu et al. [62] increase in the S values in soils could be the process of ash dissolving– especially SiO2 transformation to the soluble anions. In the case of the grassland, increased BioC dose caused a decrease in the S values (Figure 5B). It is likely that there were almost no polar groups on the grassland soil surface or that its porosity was so low, where BioC addition could not elevate the S in this case. Moreover, the surface polar groups could have been blocked by calcium cations that were derived from BioC carbonate decomposition.
Table 3; Table 4 show changes in the values of volume (V) and radius (R) of the micropore in soil samples that were collected from fallow and grassland amended with BioC.
Analyses of the microporosity in samples that were collected from fallow soil amended with BioC showed significant changes both in V (Table 3) and R (Table 4) values during the three years of the experiment. The addition of increasing BioC doses did not proportionally affect the R-values in relation to control values at a specific term. An unambiguous effect of BioC was also not observed as a function of time (terms: 1st–8th). A significant increase in V values was only observed for the highest BioC dose. The volume and size of soil pores determine many important phenomena occurring in the soil [63]. A significant part of the S is related to the small pore surface, because they have a role of dominant adsorption sites [64]. Verheijen et al. [65] showed that the soil pore network could be affected by BioC’s inherent porosity (as well as its other characteristics) in several ways. BioC particle size, pore size distribution and connectivity, the mechanical strength of the bioC particles, and the translocation and interaction of bioC particles in the soil are all determining factors that will lead to different outcomes in different soils. In the case of the grassland, the addition of BioC, despite its large S and high microporosity (Table 1), did not significantly affect the values of V and R of the soil most likely, because, as Głąb and Kulig [66] have shown, soil porosity depends on many factors, such as mineral and granulometric composition, tillage system, and soil structure. Głąb et al. [67] determined the effect of different rates of BioCs on the physical properties of sandy soil. In a pot experiment with a mixture of sandy soil (texture as loamy sand) and BioCs (from miscanthus and winter wheat), bulk density and total porosity of the sandy soil were found to depend on the rate and size of biochar. BioC particle size significantly affected all the pore fractions, and the addition of BioC to soil caused an increase in small pore (<50 μm) volume, a decrease in the volume of pores with a diameter between 50–500 μm, and they did not impact on pores that were larger than 500 μm. In contrast, small particles of BioC reduced the volume of pores of diameters below 0.5 μm and increased the volume of larger pores with diameter 0.5–500 μm. Higher doses of BioC added to soil increased the volume of all pores with diameter <500 μm. On the other hand, Das and Ghosh [68] investigated the effect of different BioCs on porosity and bulk density on amended sandy soil. The results showed that the soil porosity increased with increasing application rate in the case of all BioC types. The initial porosity of the sandy loam soil was 54.38% in control (without BioC), increasing to 65.67% with the application of maize BioC, 64.42% with Lantana camara BioC, and 63.42% with pine needle BioC. Ouyang and Zhang [69] found similar results in coarse sandy soil, and it is therefore possible that the BioC doses used in our experiment were insufficient in terms of improving microporosity of the grassland soil.
Generally, according to the literature, BioC as a soil amendment has been wide ranging and the results have been mixed due to the complexity of interactions between BioC, soils, and crops. A meta-analysis of the effects of BioC on soil suggests that this material is most effective for acidic, degraded, and coarse-textured soils [70]. Insight into the reactions of BioC in soil showed that the benefits of using it as a soil amendment are probably based on the liming effect, increases in cation exchange capacity, sorption of organic matter, and changes in th soil structure.
4. Conclusions
Our study has demonstrated that the addition of wood-derived BioC to degraded soils influenced the dynamics of changes in the examined physicochemical parameters, including surface properties. These alterations might lead to fertility and productivity improvements of soil. However, BioC addition affected cultivated soils to varying degrees.
Significant changes in physicochemical parameters were primarily observed in the final year of the experiment and with the highest BioC dose, with BioC added to the fallow soil causing a significant increase in pH, S, and V values. The changes in R-values were ambiguous, regardless of BioC dose and as a function of time.
On the other hand, the results that were obtained for the grassland soil illustrated that BioC addition caused a significant decrease in pH and S values. Moreover, no clear changes were observed in the microporosity of this soil under BioC supplementation.
BioC that was added to the fallow and grassland soil did not have a clear effect on the Q values or on strongly acid functional group content of the soil.
Author Contributions
Conceptualization, M.C., Z.S., P.B.; methodology, Z.S.; software, M.C.; Z.S.; validation, M.C., Z.S., P.B.; formal analysis, M.C.; investigation, M.C.; resources, Z.S.; data curation, M.C.; Z.S.; writing – original draft preparation, M.C.; writing – review and editing, Z.S., P.B.; visualization, M.C.; supervision, Z.S.; project administration, M.C.; Z.S.; funding acquisition, Z.S.
Funding
Research was partially conducted under the project “Water in soil - satellite monitoring and improving the retention using biochar” no. BIOSTRATEG3/345940/7/NCBR/2017 which was financed by Polish National Centre for Research and Development in the framework of “Environment, agriculture and forestry”-BIOSTRATEG strategic R&D programme. The APC was funded by the Institute of Agrophysics, PAS, Lublin, Poland.
Conflicts of Interest
The authors declare no conflict of interest. The funders had no role in the design of the study; in the collection, analyses, or interpretation of data; in the writing of the manuscript, or in the decision to publish the results.
References
- Li, G.; Wu, C.; Gao, W. Effects of short-term fallow managements on soil microbial properties: A case study in China. Appl. Soil Ecol. 2018, 125, 128–137. [Google Scholar] [CrossRef]
- Rosenthal, G. Secondary succession in a fallow central European wet grassland. Flora 2010, 205, 153–160. [Google Scholar] [CrossRef]
- Glaser, B.; Wiedne, K.; Seeling, S.; Schmidt, H.-P.; Gerber, H. Biochar organic fertilizers from natural resources as substitute for mineral fertilizers. Agron. Sustain. Dev. 2015, 35, 667–678. [Google Scholar] [CrossRef]
- Ding, Y.; Liu, Y.; Liu, S.; Huang, X.; Li, Z.; Tan, X.; Zeng, G.; Zhou, L. Potential benefits of biochar in agricultural soils: A review. Pedosphere 2017, 27, 645–661. [Google Scholar] [CrossRef]
- Palansooriya, K.N.; Ok, Y.S.; Award, Y.M.; Lee, S.S.; Sung, J.K.; Kautsospyros, A.; Moon, D.H. Impact of biochar application on upland agriculture: A review. J. Environ. Manag. 2019, 234, 52–64. [Google Scholar] [CrossRef] [PubMed]
- Pearl, E.N. Impact of Biochar on Metal and Hydrophobic Organic Contaminats: A Tool for Environmental Remediation (An Overview). Chem. Biomol. Eng. 2017, 2, 165–172. [Google Scholar]
- Uchimiya, M.; Chang, S.C.; Klasson, K.T. Screening biochars for heavy metal retention in soil: Role of oxygen functional groups. J. Hazard. Mater. 2011, 190, 432–441. [Google Scholar] [CrossRef]
- Yao, Y.; Gao, B.; Zhang, M.; Inyang, M.; Zimmerman, A.R. Effect of biochar amendment on sorption and leaching of nitrate, ammonium and phosphate in a sandy soil. Chemosphere 2012, 89, 1467–1471. [Google Scholar] [CrossRef]
- Chun, Y.; Sheng, G.; Chiou, G.T.; Xing, B. Compositions and sorptive properties of crop residue—Derived chars. Environ. Sci. Technol. 2004, 38, 4649–4655. [Google Scholar] [CrossRef]
- Utomo, W.H. Rice husk biochar for rice based cropping system in acid soil. The characteristics of rice husk biochar and its influence on the properties of acid sulphate soils and rice growth in West Kalimantan, Indonesia. J. Agric. Sci. 2010, 2, 39–47. [Google Scholar]
- Sukaronto; Utomo, W.H.; Kusuma, Z.; Nugroho, W.H. Soil Fertility Status, Nutrient Uptake and Maize (Zea mays L.) Yield Following Biochar and Cattle Manure Application on Sandy Soils of Lombok, Indonesia. J. Trop. Agric. 2011, 49, 47–52. [Google Scholar]
- Jatav, H.S.; Jayant, H.; Kumar, S.; Kumar, V.; Chattopadhya, A.; Dhawal, S.K.; Singh, Y.V. Role of Biochar: In agriculture sector its implication and perspective. Int. J. Chem. Stud. 2017, 5, 14–18. [Google Scholar]
- Nigussie, A.; Kissi, E.; Misganaw, M.; Ambaw, G. Effect of Biochar Application on Soil Properties and Nutrient Uptake of Lettuces (Lactuca sativa) Grown in Chromium Polluted Soils. Am. Eurasian J. Agric. Environ. Sci. 2012, 12, 369–376. [Google Scholar]
- Karami, A.; Homaee, M.; Afzalinia, S.; Ruhipour, H.; Basirat, S. Organic resource management: Impacts on soil aggregate stability and other soil physicochemical properties. Agric. Ecosyst. Environ. 2012, 148, 22–28. [Google Scholar] [CrossRef]
- Smebye, A.; Alling, V.; Vogt, R.D.; Gadmar, T.C.; Mulder, J.; Cornelissen, G.; Hale, S.E. Biochar amendment to soil changes dissolved organic matter content and composition. Chemosphere 2016, 142, 100–105. [Google Scholar] [CrossRef] [PubMed]
- Tang, J.; Zhu, W.; Kookana, R.; Katayama, A. Characteristics of biochar and its application in remediation of contaminated soil. J. Biosci. Bioeng. 2013, 116, 653–659. [Google Scholar] [CrossRef] [PubMed]
- Omondi, M.O.; Xia, X.; Nahayo, A.; Liu, X.; Karai, P.K.; Pan, G. Quantification of biochar effect on soil hydrological properties using meta-analysis of literature data. Geoderma 2016, 274, 28–34. [Google Scholar] [CrossRef]
- Bianco-Canqui, H. Biochar and soil physical properties. Soil Sci. Soc. Am. J. 2017, 81, 687–711. [Google Scholar] [CrossRef]
- Ahmed, A.; Raghavan, V. Influence of wood—Derived biochar on the physico-mechanical and chemical characteristics of agricultural soils. Int. Agrophys. 2018, 32, 1–10. [Google Scholar] [CrossRef]
- Agegnehu, G.; Bass, A.M.; Nelson, P.N.; Bird, M.I. Benefits of biochar, compost and biochar—Compost for soil quality, maize yield and greenhouse gas emissions in a tropical agricultural soil. Sci. Total Environ. 2016, 543, 295–306. [Google Scholar] [CrossRef]
- Kumari, K.G.I.D.; Moldrup, P.; Paradelo, M.; Elsgaard, L.; de Jonge, L.W. Effect of biochar on deispersibility of colloids in agricultural soils. J. Environ. Qual. 2017, 46, 143–152. [Google Scholar] [CrossRef] [PubMed]
- Cybulak, M.; Sokołowska, Z.; Boguta, P.; Tomczyk, A. Influence of pH and grain size on physicochemical properties of biochar and released humic substances. Fuel 2019, 240, 334–338. [Google Scholar] [CrossRef]
- Gładki, J. Biochar as a chance for sustainable development. In On the Basis of the Work and Own Research of FLUID, 2nd ed.; Malec, K., Ed.; Apla Sp.J.: Sędziszów, Poland, 2017. [Google Scholar]
- Cybulak, M.; Sokołowska, Z.; Boguta, P. Hygroscopic moisture content of podzolic soil with biochar. Acta Agrophys. 2016, 23, 533–543. [Google Scholar]
- Usowicz, B.; Lipiec, J.; Łukowski, M.; Marczewski, W. The effect of biochar application on thermal properties and albedo of loess soil under grassland and fallow. Soil Till. Res. 2016, 164, 45–51. [Google Scholar] [CrossRef]
- Kosaka, J.; Honda, C.; Iseki, A. A new rapid and accurate method for the determination of carbon in soils. Soil Sci. Plant Nutr. 1959, 5, 77–83. [Google Scholar] [CrossRef]
- Sarkar, D.K. Fuels and Combustion. In Thermal Power Plant: Design and Operation, 1st ed.; Elservier Inc.: Amsterdam, The Netherlands, 2015; pp. 91–137. [Google Scholar]
- Boguta, P.; Sokołowska, Z. Interactions of humic acids with metals. Acta Agrophys. Monogr. 2013, 2, 1–112. [Google Scholar]
- Sokołowska, Z.; Józefaciuk, G.; Bowanko, G. Adsorption of gases or vapors on solids. In Physical Chemistry of Soil Surface and Pore Properties; Józefaciuk, G., Sokołowska, Z., Hajnos, M., Eds.; Institute of Agrophysics, PAS: Lublin, Poland, 2004; pp. 30–36. [Google Scholar]
- Gregg, S.J.; Sing, K.S. Adsorption, Surface area and Porosity, 2nd ed.; Academic Press: London, UK, 1978. [Google Scholar]
- Skic, K.; Boguta, P.; Sokołowska, Z. Analysis of the sorption properties of different soils using water vapour adsorption and potentiometric titration methods. Int. Agrophys. 2016, 30, 369–374. [Google Scholar] [CrossRef] [Green Version]
- Józefaciuk, G. Effect of the size of aggregates on pore characteristics of minerals measured by mercury intrusion and water—Vapor desorption techniques. Clays Clay Miner. 2009, 57, 587–602. [Google Scholar] [CrossRef]
- Ryżak, M.; Bartmiński, P.; Bieganowski, A. Methods for determination of particle size distribution of mineral soils. Acta Agrophys. Monogr. 2009, 4, 1–84. [Google Scholar]
- Rühlmann, J.; Körschens, M.; Graefe, J. A new approach to calculate the particle density of soils considering properties of the soil organic matter and the mineral matrix. Geoderma 2006, 130, 272–283. [Google Scholar] [CrossRef]
- Brewer, C.E.; Chuang, V.J.; Masiello, C.A.; Gonnermann, H.; Gao, X.; Dugan, B.; Driver, L.E.; Panzacchi, P.; Zygourakis, K.; Davies, C.A. New approaches to measuring biochar density and porosity. Biomass Bioenergy 2014, 66, 176–185. [Google Scholar] [CrossRef]
- Lehmann, J.; Joseph, S. Biochar for environmental management: An introduction. In Biochar for Environmental Management, 2nd ed.; Lehmann, J., Joseph, S., Eds.; Earthscan: London, UK, 2009; pp. 1–12. [Google Scholar]
- Esmaeelnejad, L.; Shorafa, M.; Gorji, M.; Hosseini, S.M. Impacts of Woody Biochar Particle Size on Porosity and Hydraulic Conductivity of Biochar-Soil Mixtures: An Incubation Study. Commun. Soil Sci. Plan. 2017, 48, 1710–1718. [Google Scholar] [CrossRef]
- Illingworth, J.; Williams, P.T.; Rand, B. Characterisation of biochar porosity from pyrolysis of biomass flax fibre. J. Energy Inst. 2013, 86, 63–70. [Google Scholar] [CrossRef] [Green Version]
- Ahmad, M.; Rajapaksha, A.U.; Lim, J.E.; Zhang, M.; Bolan, N.; Mohan, D.; Vithanager, M.; Lee, S.S.; Ok, Y.S. Biochar as sorbent for contaminant management in soil and water: A review. Chemosphere 2014, 99, 19–33. [Google Scholar] [CrossRef] [PubMed]
- Arthur, E.; Tuller, M.; Moldrup, P.; de Jonge, L.W. Effect of biochar and manure amendments on water vapor sorption in a sandy loam soil. Geoderma 2015, 243–244, 175–182. [Google Scholar] [CrossRef]
- Pranagal, J.; Oleszczuk, P.; Tomaszewska–Krojańska, D.; Kraska, P.; Różyło, K. Effect of biochar application on the physical properties of Haplic Podzol. Soil Till. Res. 2017, 174, 3–10. [Google Scholar] [CrossRef]
- Bolt, G.H. Soil pH, an early diagnostic tool: Its determination and interpretation. In History of Soil Science, 2nd ed.; Yaloon, D.H., Berkowicz, S., Eds.; Catena Verlag: Reiskirchen, Germany, 1997; Volume 29, pp. 177–210. [Google Scholar]
- Amoakwah, E.; Frimpong, K.A.; Okae-Anti, D.; Arthur, E. Soil water retention, air flow and pore structure characteristics after corn cob biochar application to a tropical sandy loam. Geoderma 2017, 307, 189–197. [Google Scholar] [CrossRef]
- Liao, W.; Thomas, S. Biochar Particle Size and Post—Pyrolysis Mechanical Processing Affect Soil pH, Water Retention Capacity and Plant Performance. Soil Syst. 2019, 3, 14. [Google Scholar] [CrossRef]
- Shah, T.; Khan, S.; Shah, Z. Soil respiration, pH and EC as influenced by biochar. Soil Environ. 2017, 36, 77–83. [Google Scholar] [CrossRef]
- Józefaciuk, G.; Szatanik-Kloc, A. Soil Acidity and its Effect on Plants. Acta Agrophys. Monogr. 2002, 59, 1–90. [Google Scholar]
- Nelissen, V.; Ruysschaert, G.; Manka’Abusi, D.; D’Hose, T.; De Beuf, K.; Al-Barri, B.; Cornelis, W.; Boeckx, P. Impact of a woody biochar on properties of a sandy loam soil and spring barley during a two-year field experiment. Eur. J. Agron. 2015, 62, 65–78. [Google Scholar] [CrossRef]
- da Silva, I.C.B.; Basilio, J.J.N.; Fernandes, L.A.; Colen, F.; Sampaio, R.A.; Frazao, L.A. Biochar from different residues on soil properties and common bean production. Sci. Agric. 2016, 74, 278–382. [Google Scholar] [CrossRef]
- Mierzwa-Hersztek, M.; Gondek, K.; Klimkowicz-Pawlas, A.; Kopeć, M.; Losak, T. Effect of coapplication of poultry litter biochar and mineral fertilisers on soil quality and crop yield. Zemdirb. Agric. 2018, 105, 203–210. [Google Scholar] [CrossRef]
- Rondon, M.A.; Lehmann, J.; Ramirez, J.; Hurtado, M. Biological nitrogen fixation by common beans (Phaseolus vulgaris L.) increases with biochar additions. Biol. Fert. Soils 2007, 43, 699–708. [Google Scholar] [CrossRef]
- Brantley, K.E.; Brye, K.R.; Savin, M.C.; Longer, D.E. Biochar Source and Application Rate Effects on Soil Water Retention Determined Using Wetting Curves. Open J. Soil Sci. 2015, 5, 1–10. [Google Scholar] [CrossRef] [Green Version]
- Aller, D.; Rathke, S.; Laird, D.; Cruse, R.; Hatfield, J. Impacts of fresh and aged biochars on plant available water and water use efficiency. Geoderma 2017, 307, 114–121. [Google Scholar] [CrossRef]
- Mukherejee, A.; Zimmerman, A.R.; Hamdan, R.; Cooper, W.T. Physicochemical changes in pyrogenic organic matter (biochar) after 15 months of field aging. Solid Earth 2014, 5, 693–704. [Google Scholar] [CrossRef] [Green Version]
- Singh, B.P.; Cowie, A.L. Long—Term influence of biochar on native organic carbon mineralisation in a low—Carbon clayey soil. Sci. Rep. 2014, 4, 3687. [Google Scholar] [CrossRef]
- Paetsch, L.; Mueller, C.W.; Kögel-Knabner, I.; von Lützow, M.; Girardin, C.; Rumpel, C. Effect of in-situ aged and fresh biochar on soil hydraulic conditions and microbial C use under drought conditions. Sci. Rep. 2018, 8, 6852. [Google Scholar] [CrossRef]
- Yang, W.; Bradford, S.A.; Wang, Y.; Sharma, P.; Shang, J.; Li, B. Transport of biochar colloids in saturated porous media in the presence of humic substances or proteins. Environ. Pollut. 2019, 246, 855–863. [Google Scholar] [CrossRef]
- Theng, B.K.G.; Rostori, G.G.; Santi, C.A.; Percival, H.J. An improved method for determining the specific surface areas of topsols with varied organic matter, texture and clay mineral composition. Eur. J. Soil Sci. 1999, 50, 309–316. [Google Scholar] [CrossRef]
- Benito, P.; Bortolotti, V.; Fornasari, G.; Vannini, M. Evaluation of effect of soil organic matter on pores by 1H time—Domain magnetic resonance relaxometry and adsorption—Desorption of N2. Eur. J. Soil Sci. 2016. [Google Scholar] [CrossRef]
- Zhang, M.; Cheng, G.; Feng, H.; Sun, B.; Zhao, Y.; Chen, H.; Chen, J.; Chen, M.; Dyck, M.; Wang, X.; et al. Effects of straw and biochar amendments on aggregate stability, soil organic carbon and enzyme activities in the Loess Plateau, China. Environ. Sci. Pollut. Res. 2017, 24, 10108–10120. [Google Scholar] [CrossRef] [PubMed]
- Hyvaluoma, J.; Hannula, M.; Arstila, K.; Wang, H.; Kulju, S.; Rasa, K. Effects of pyrolysis temperature on the hydrologically relevant porosity of willow biochar. J. Anal. Appl. Pyrolysis 2018, 134, 446–453. [Google Scholar] [CrossRef] [Green Version]
- Boguta, P.; Sokołowska, Z.; Skic, K.; Tomczyk, A. Chemically engineered biochar—Effect of concentration and type of modifier on sorption and structural properties of biochar from wood waste. Fuel 2019, 256, 1–10. [Google Scholar] [CrossRef]
- Liu, P.; Liu, W.J.; Jinag, H.; Chen, J.J.; Li, W.W.; Yu, H.Q. Modification of bio-char derived from fast pyrolysis of biomass and its application in removal of tetracyckline from aqueous solution. Bioresour. Technol. 2012, 21, 235–240. [Google Scholar] [CrossRef]
- Anovitz, L.M.; Cole, D.R. Characterization and analysis of porosity and pore structures. Rev. Mineral. Geochem. 2015, 80, 61–164. [Google Scholar] [CrossRef]
- Heister, K. How accessible is the specific surface area of minerals? A comparative study with Al—Containig minerals as model susbtances. Geoderma 2016, 263, 8–15. [Google Scholar] [CrossRef]
- Verheijen, F.; Jeffery, S.; Bastos, A.C.; van der Velde, M.; Daifas, I. Biochar Application to Soils. A Critical Scientific Review of Effects on Soil Properties, Processes and Functions; European Commision: Luxembourg, 2010; pp. 1–162. [Google Scholar]
- Głąb, T.; Kulig, B. Effect of mulch and tillage system on soil porosity under wheat. Soil Till. Res. 2008, 99, 169–178. [Google Scholar] [CrossRef]
- Głąb, T.; Palmowska, J.; Zaleski, T.; Gondek, K. Effect of biochar application on soil hydrological properties and physical quality of sandy soil. Geoderma 2016, 281, 11–20. [Google Scholar] [CrossRef]
- Das, S.K.; Ghosh, G.K. Soil hydro-physical Environment as Influences by Different Biochar Amendments. Int. J. Bio-Resour. Stress Manag. 2017, 8, 668–673. [Google Scholar] [CrossRef]
- Ouyang, L.; Zhang, R. Effects of biochars derived from different feedstocks and pyrolysis temperatures on soil physical and hydraulic properties. J. Soil Sediments 2013, 13, 1561–1572. [Google Scholar]
- Jeffery, S.; Verheijen, F.G.A.; van der Velde, M.; Bastos, A.C. A quantitative review of the effects of biochar application to soils on crop productivity using meta—Analysis. Agric. Ecosyst. Environ. 2011, 144, 175–187. [Google Scholar] [CrossRef]
Figure 1.
Micrographs of BioC obtained from electron microscope scanning electron microscopy (SEM) TESCAN model, VEGA 3 LMV.
Figure 1.
Micrographs of BioC obtained from electron microscope scanning electron microscopy (SEM) TESCAN model, VEGA 3 LMV.
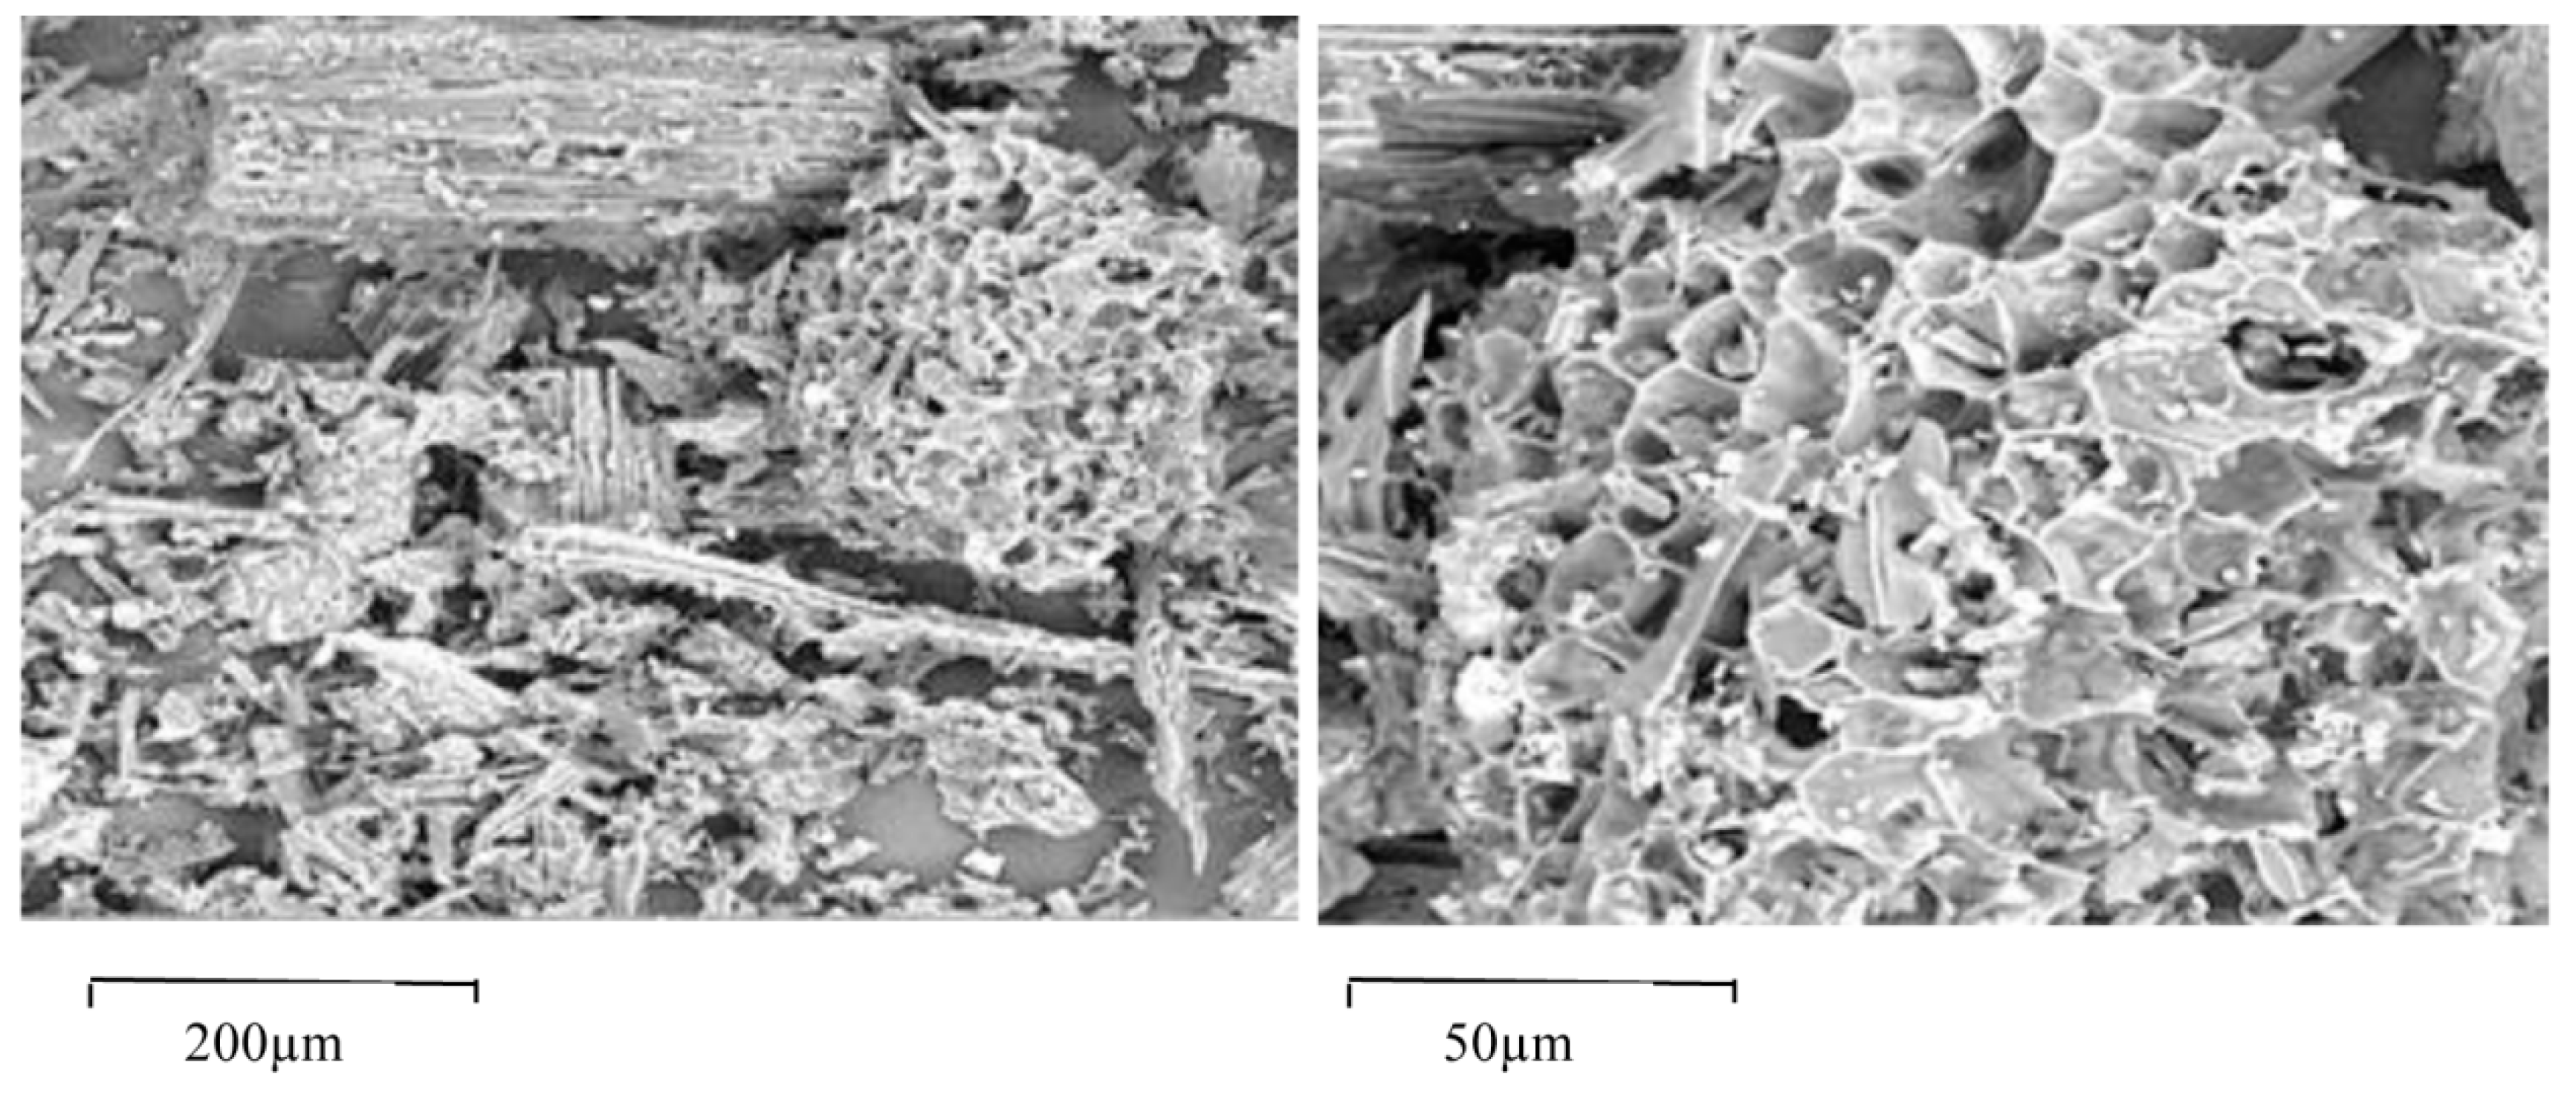
Figure 2.
Relative changes in pH values of soil samples collected from fallow (A) and grassland (B) amended with BioC (1, 2, 3 kg·m−2 BioC) as a function of time (terms: 1st-8th). Average values from three replicates in each term, ± standard deviation, C – control soil.
Figure 2.
Relative changes in pH values of soil samples collected from fallow (A) and grassland (B) amended with BioC (1, 2, 3 kg·m−2 BioC) as a function of time (terms: 1st-8th). Average values from three replicates in each term, ± standard deviation, C – control soil.
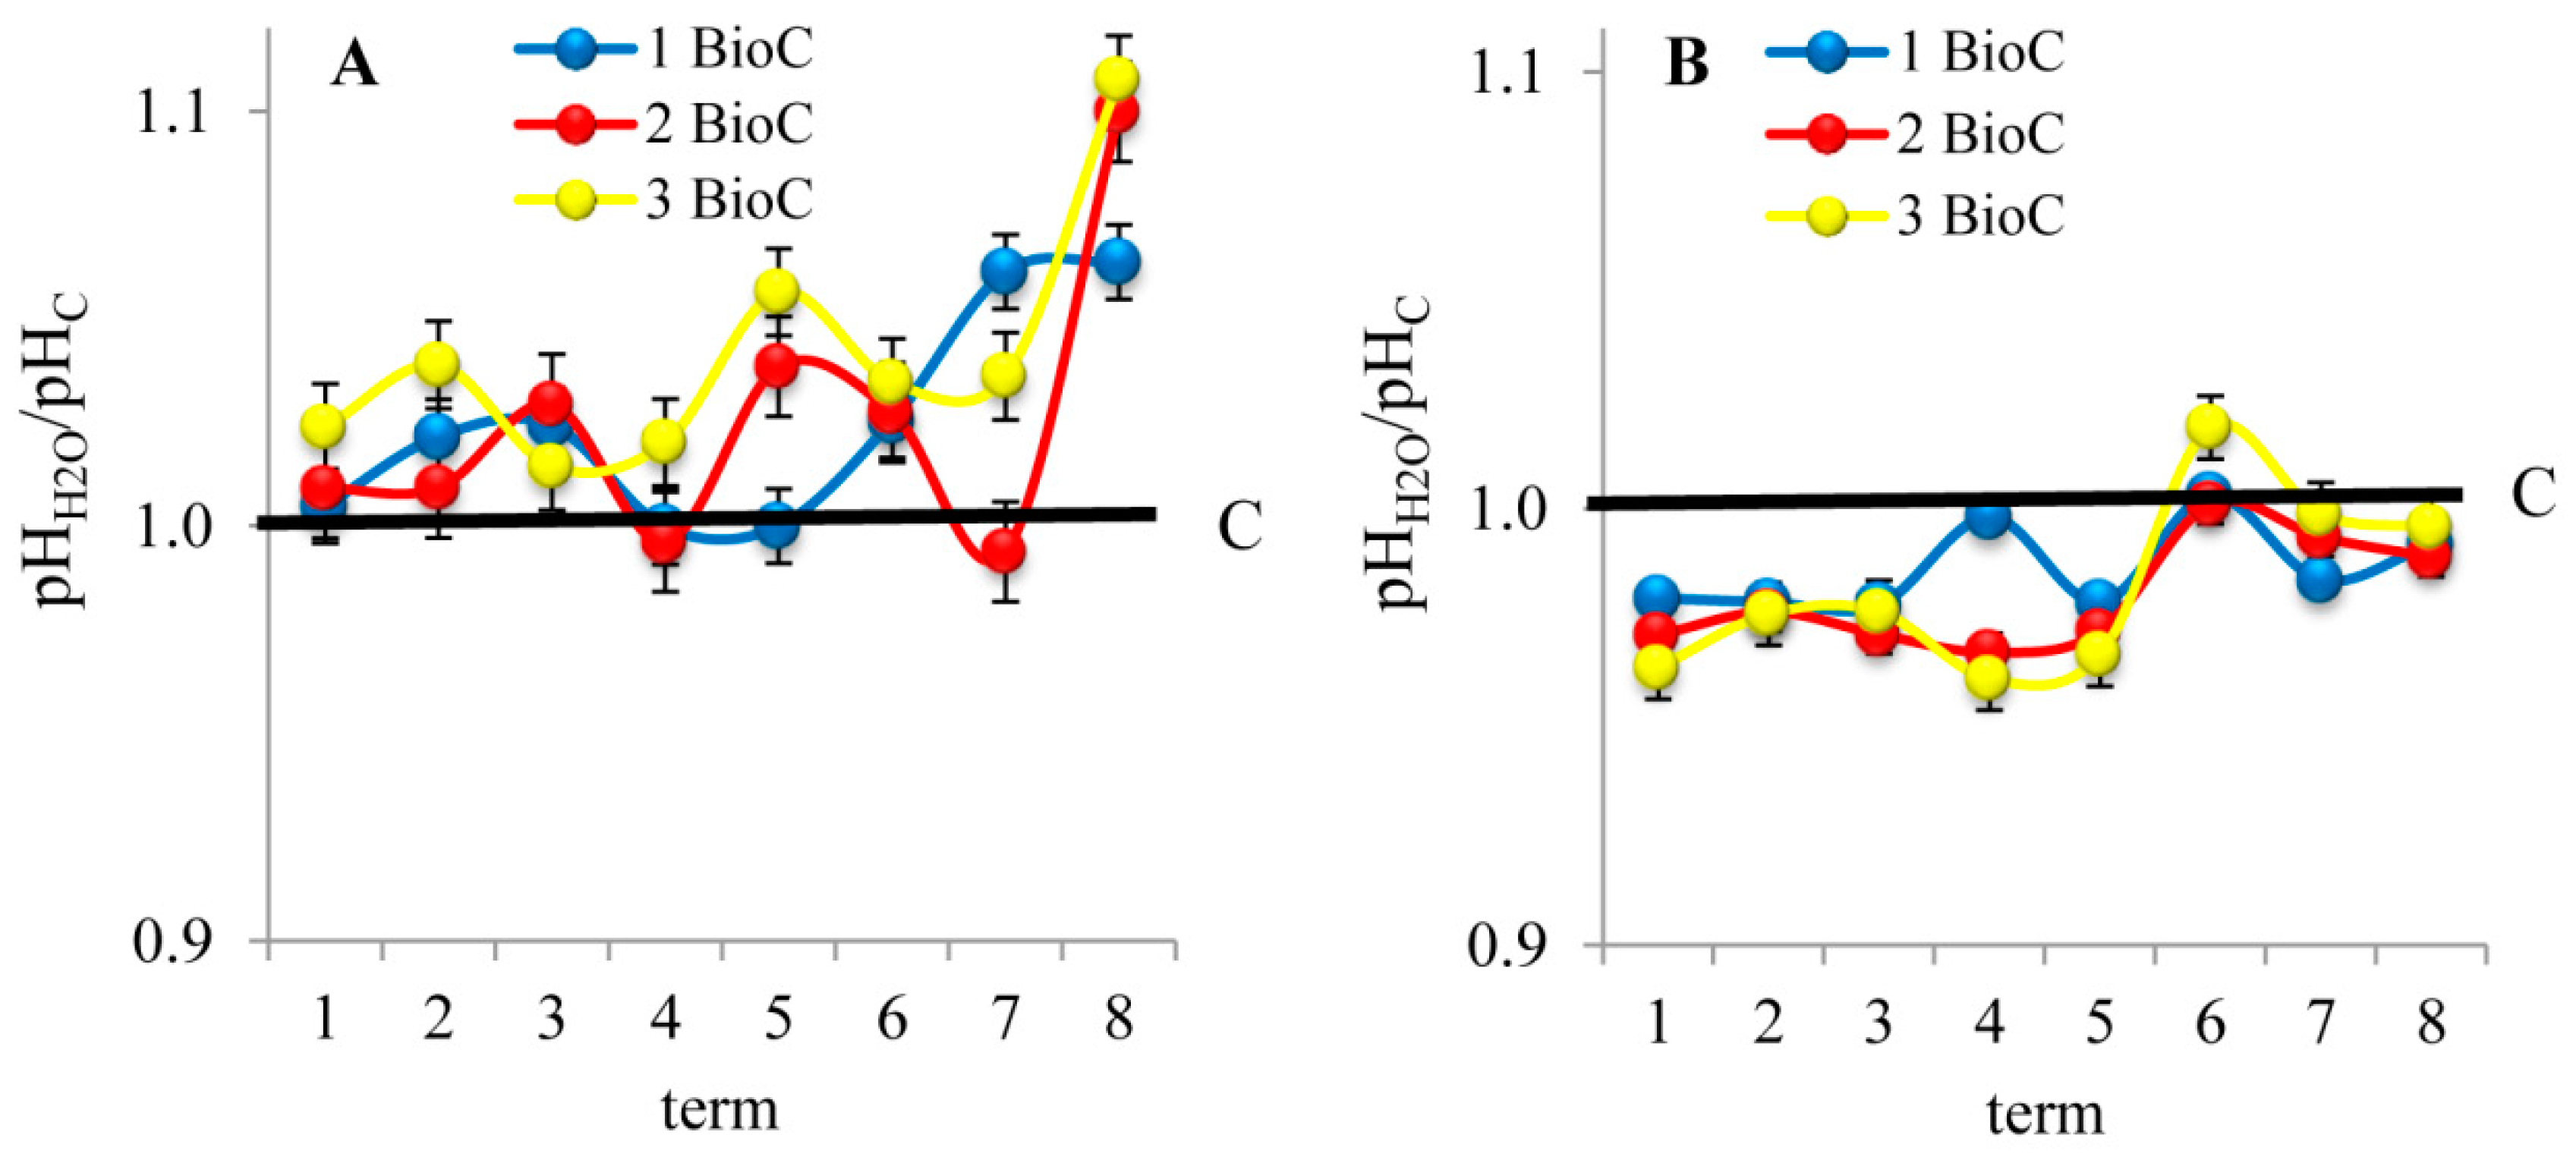
Figure 3.
Selected water vapor adsorption isotherms for soil samples collected from fallow and grassland amended with BioC (0 and 2 kg ⋅ m−2) at first term of field experiment. Average values from three replicates in each term, ± standard deviation.
Figure 3.
Selected water vapor adsorption isotherms for soil samples collected from fallow and grassland amended with BioC (0 and 2 kg ⋅ m−2) at first term of field experiment. Average values from three replicates in each term, ± standard deviation.
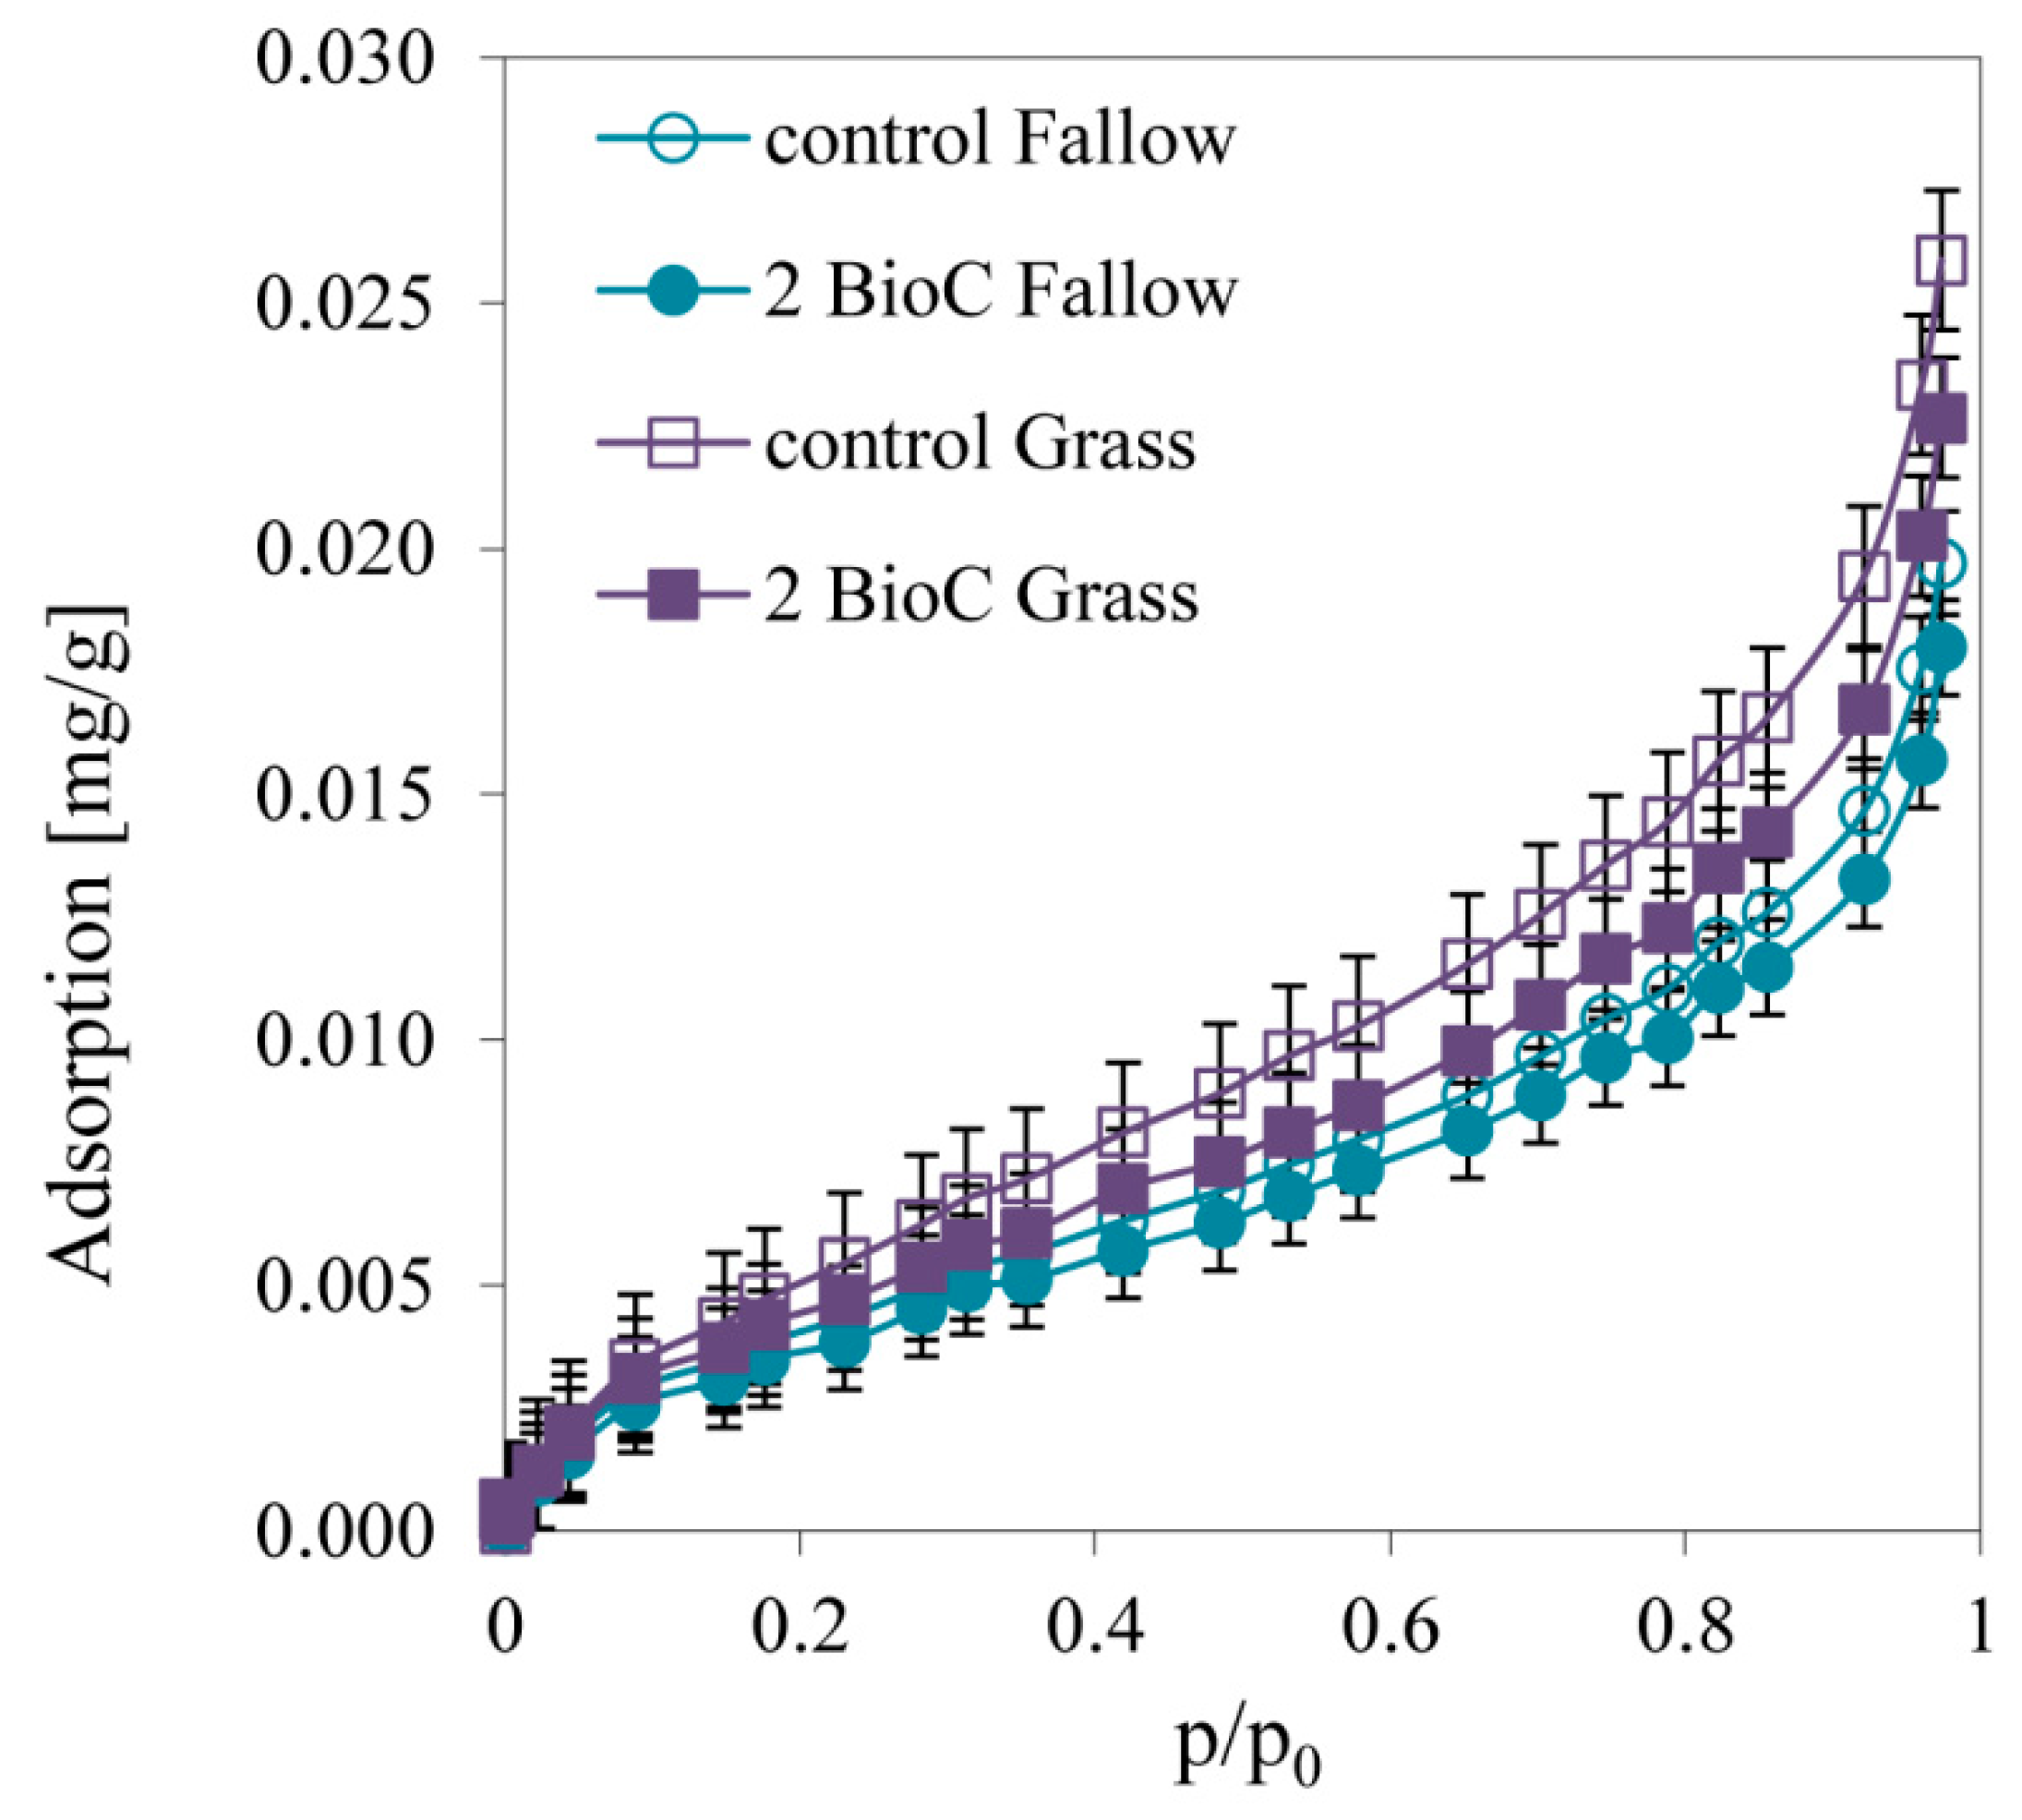
Figure 4.
Changes in maximum values of water vapor adsorption in soil samples collected from fallow (A) and grassland (B) amended with BioC (0, 1, 2, 3 kg·m−2 BioC) as a function of time (terms: 1st-8th). Average values from three replicates in each term, ± standard deviation. Other letter designations indicate significant differences between values at p < 0.05.
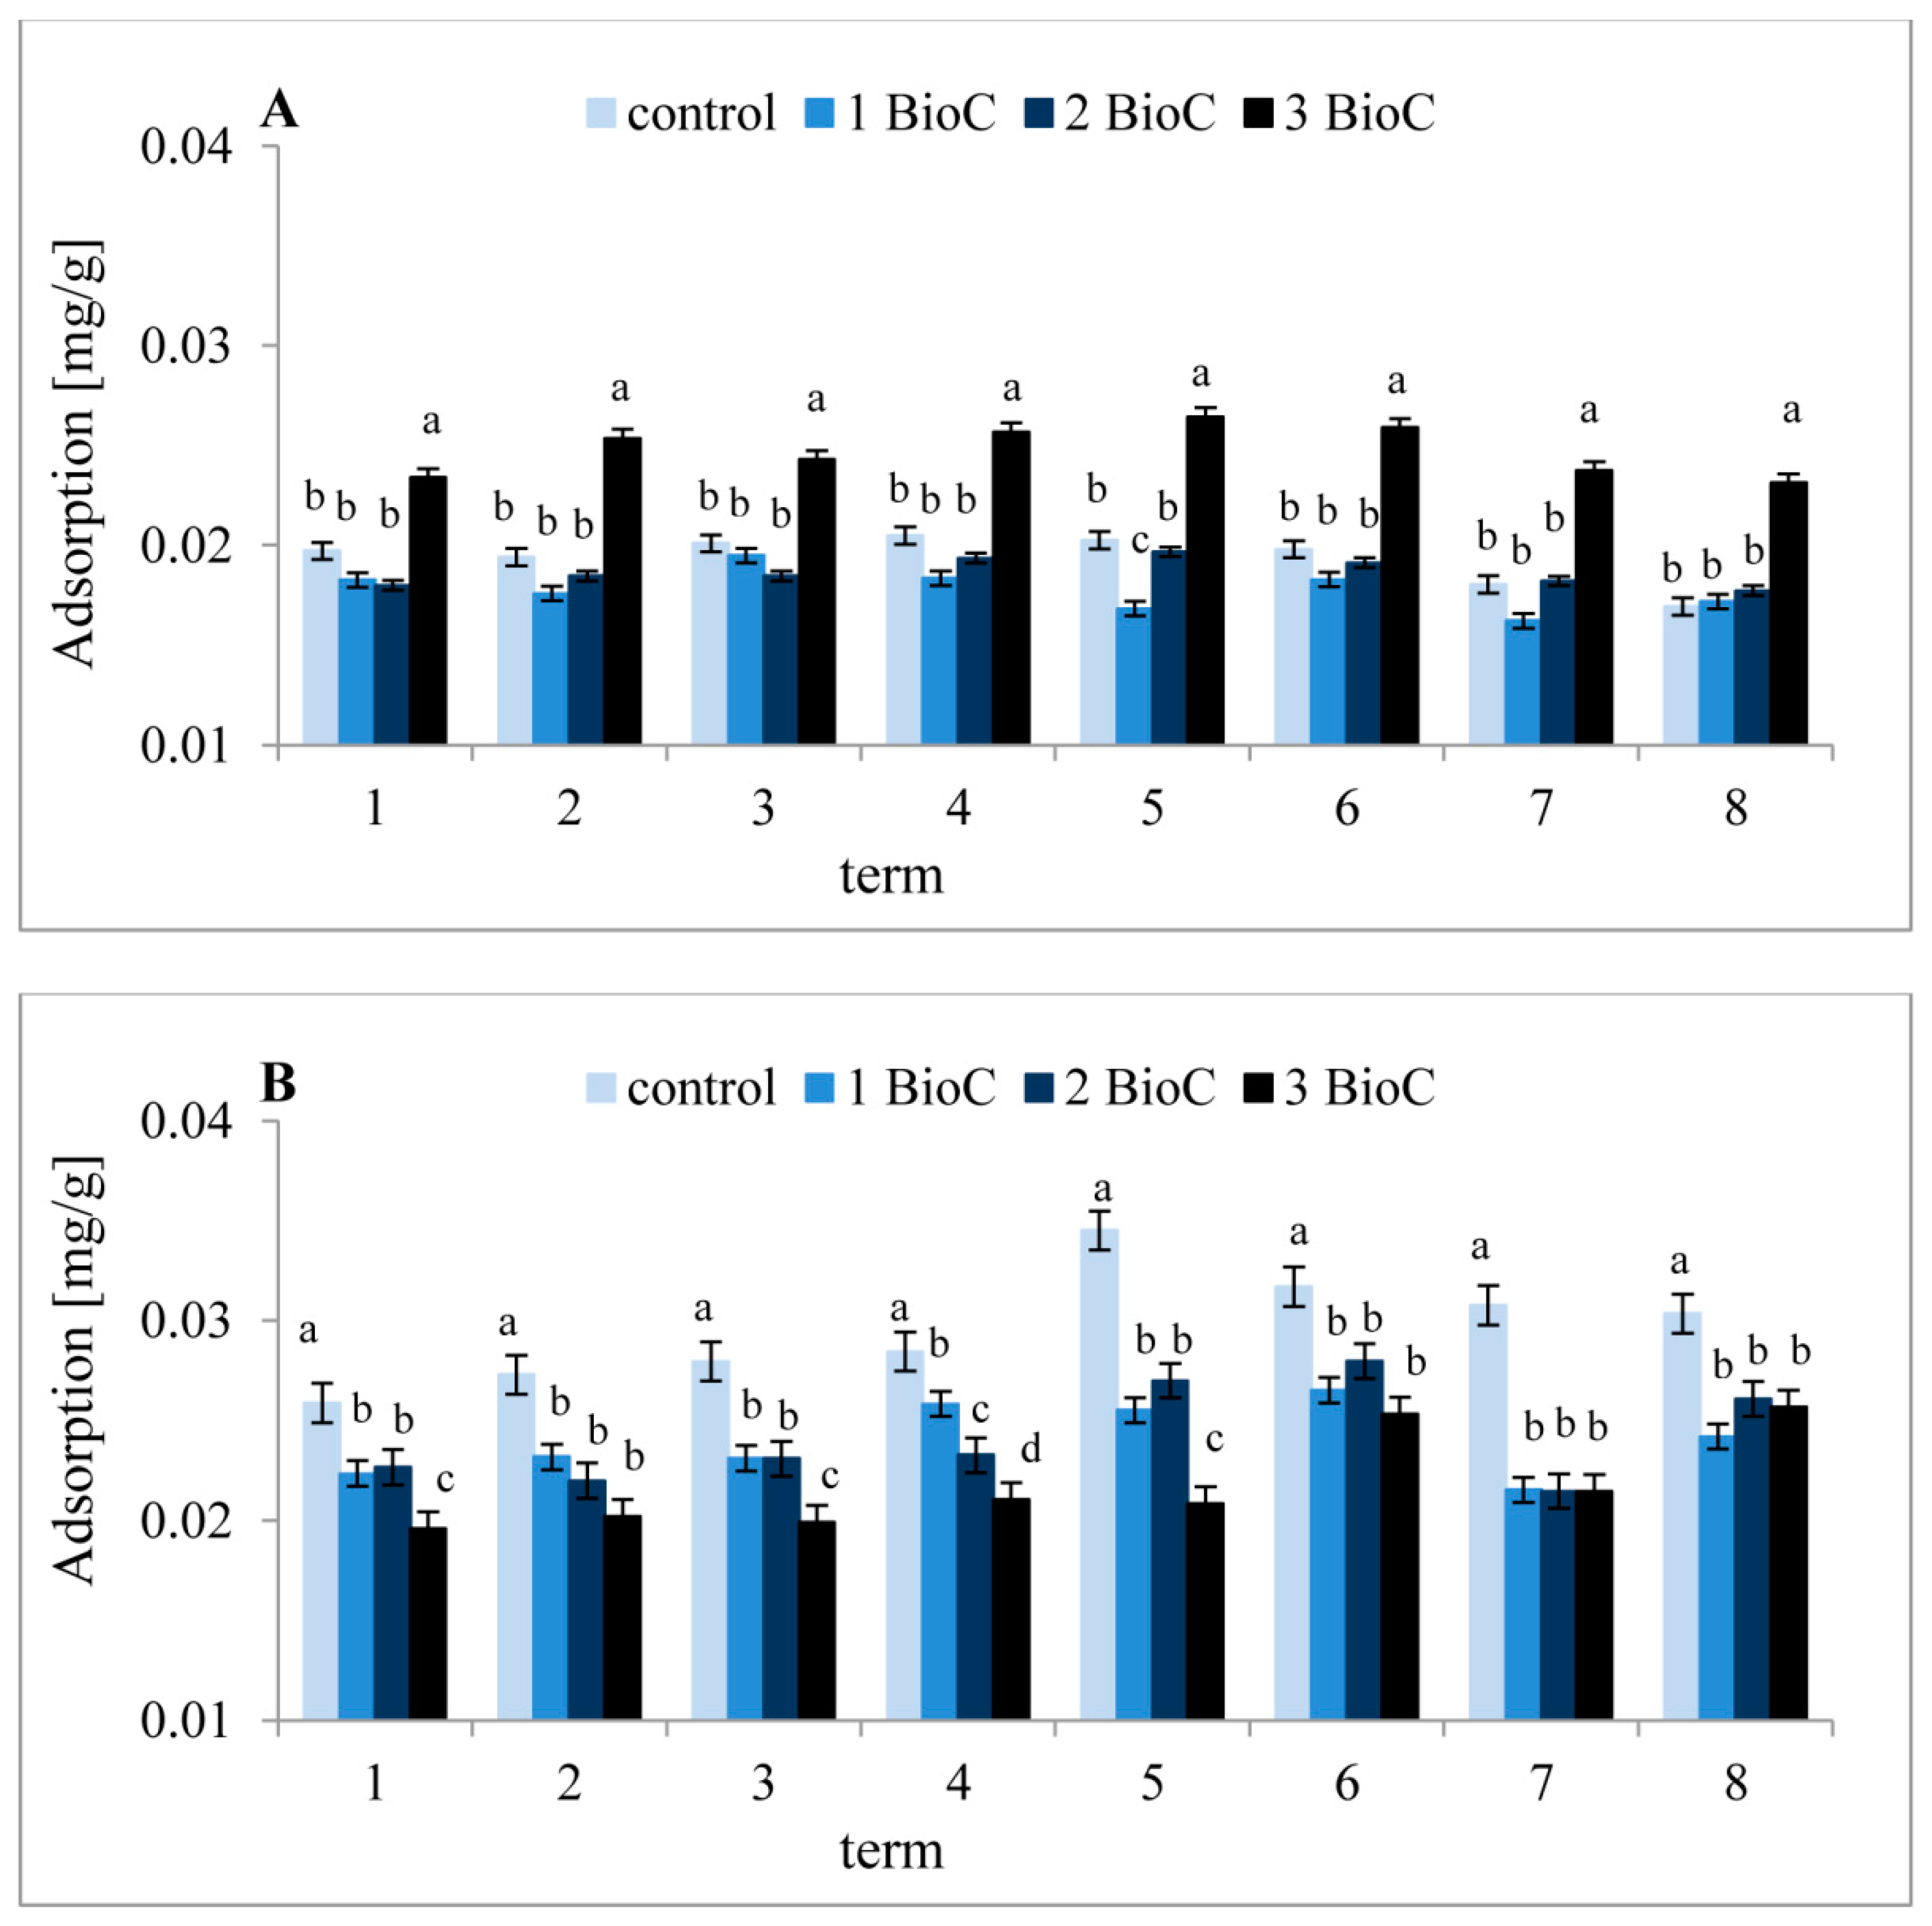
Figure 5.
Changes in specific surface area (S) values in soil samples collected from fallow (A) and grassland (B) amended with BioC (0, 1, 2, 3 kg·m−2 BioC) as a function of time (terms: 1st-8th). Average values from three replicates in each term, ± standard deviation.
Figure 5.
Changes in specific surface area (S) values in soil samples collected from fallow (A) and grassland (B) amended with BioC (0, 1, 2, 3 kg·m−2 BioC) as a function of time (terms: 1st-8th). Average values from three replicates in each term, ± standard deviation.


Table 1.
Physicochemical characteristics of soils and biochar (BioC).
| Material | d | Corg | A | pH (H2O) | pH (CaCl2) | Q | S | V | R |
|---|---|---|---|---|---|---|---|---|---|
| (g⋅cm−3) | (%) | (%) | (cmol⋅kg−1) | (m2⋅g−1) | (µl⋅g−1) | (nm) | |||
| Fallow | 2.61 | 0.98 | 97.3 | 6.21 | 5.52 | 5.90 | 14.0 | 13.0 | 9.20 |
| Grassland | 2.60 | 1.02 | 96.7 | 6.72 | 6.13 | 7.10 | 17.0 | 18.0 | 9.50 |
| Biochar | 1.46 | 15.4 | 43.2 | 8.25 | 7.21 | 107 | 69.9 | 45.8 | 5.16 |
d–density; A–ash content; Corg –organic carbon; Q–surface charge; S–specific surface area; V–volume of the micropore, R–radius of the micropore.
Table 2.
Values of the surface negative charge (Q, cmol⋅kg−1) in soil samples collected from fallow and grassland amended with BioC (0, 1, 2, 3 kg·m−2) for first and eighth term. Average values from three replicates in each term. Other numbers designations (1, 2, 3) indicate significant differences (between values at p < 0.05) among treatments for the same sampling date.
| Fallow | |||||||
| Term | 0 kg ⋅m−2 | 1 kg ⋅m−2 | 2 kg ⋅m−2 | 3 kg ⋅m−2 | Min | Max | p |
| 1 | 25.86 ± 0.02 | 16.34 ± 0.03 | 16.58 ± 0.02 | 33.94 ± 0.02 | 3.94 | 6.58 | <0.05 |
| 8 | 43.52 ± 0.02 | 34.42 ± 0.03 | 18.06 ± 0.03 | 25.80 ± 0.01 | 3.52 | 8.06 | <0.05 |
| Grassland | |||||||
| Term | 0 kg ⋅m−2 | 1 kg ⋅m−2 | 2 kg ⋅m−2 | 3 kg ⋅m−2 | Min | Max | p |
| 1 | 17.20 ± 0.03 | 33.16 ± 0.02 | 26.82 ± 0.01 | 26.38 ± 0.01 | 3.16 | 7.20 | <0.05 |
| 8 | 35.96 ± 0.02 | 27.08 ± 0.03 | 36.42 ± 0.02 | 18.82 ± 0.02 | 5.96 | 8.82 | <0.05 |
Table 3.
Changes in values of total volume of micropore (V, µl⋅g−1) in soil samples collected from fallow and grassland amended with BioC (0, 1, 2, 3 kg·m−2) in terms: 1st–8th. Average values from 3 replicates in each term. Other letter designations (a, b, c, d, e f, g, h) indicate significant differences (between values at p < 0.05) in terms. Other numbers designations (1, 2, 3) indicate significant differences (between values at p < 0.05) among treatments for the same sampling date.
| Fallow | |||||||
| Term | 0 kg ⋅m−2 | 1 kg ⋅m−2 | 2 kg ⋅m−2 | 3 kg ⋅m−2 | Min | Max | p |
| 1 | 213.55 ± 0.04d | 310.52 ± 0.02h | 310.89 ± 0.01h | 116.63 ± 0.02g | 10.52 | 16.63 | <0.05 |
| 2 | 213.48 ± 0.02d | 212.63 ± 0.02f | 213.44 ± 0.02e | 118.25 ± 0.02e | 12.63 | 18.25 | <0.05 |
| 3 | 313.05 ± 0.05e | 116.47 ± 0.06a | 312.12 ± 0.02g | 214.51 ± 0.01h | 12.12 | 16.47 | <0.05 |
| 4 | 213.95 ± 0.03c | 213.04 ± 0.03d | 213.38 ± 0.03f | 117.62 ± 0.02f | 13.04 | 17.62 | <0.05 |
| 5 | 312.74 ± 0.01f | 312.11 ± 0.01g | 214.07 ± 0.02d | 120.20 ± 0.02a | 12.11 | 20.20 | <0.05 |
| 6 | 214.31 ± 0.01b | 312.93 ± 0.02e | 214.34 ± 0.01c | 118.89 ± 0.01d | 12.93 | 18.89 | <0.05 |
| 7 | 313.05 ± 0.05e | 313.60 ± 0.01c | 215.39 ± 0.01a | 119.34 ± 0.01b | 13.05 | 19.34 | <0.05 |
| 8 | 215.11 ± 0.01a | 214.65 ± 0.01b | 215.08 ± 0.03b | 119.28 ± 0.01c | 14.65 | 19.28 | <0.05 |
| Min | 12.73 | 10.52 | 10.89 | 14.51 | |||
| Max | 15.11 | 16.47 | 15.39 | 20.20 | |||
| p | <0.05 | <0.05 | <0.05 | <0.05 | |||
| Grassland | |||||||
| Term | 0 kg ⋅m−2 | 1 kg ⋅m−2 | 2 kg ⋅m−2 | 3 kg ⋅m−2 | Min | Max | p |
| 1 | 118.12 ± 0.04g | 216.14 ± 0.02f | 216.26 ± 0.04f | 313.97 ± 0.02g | 13.97 | 18.12 | <0.05 |
| 2 | 119.93 ± 0.03e | 217.47 ± 0.04e | 316.32 ± 0.03f | 415.14 ± 0.04e | 15.14 | 19.93 | <0.05 |
| 3 | 119.73 ± 0.03f | 215.01 ± 0.02g | 215.55 ± 0.03g | 214.27 ± 0.03f | 14.27 | 19.73 | <0.05 |
| 4 | 119.91 ± 0.01e | 218.15 ± 0.04d | 316.81 ± 0.01e | 415.14 ± 0.01e | 15.14 | 19.91 | <0.05 |
| 5 | 123.92 ± 0.03c | 218.66 ± 0.04c | 219.54 ± 0.04c | 315.85 ± 0.05d | 15.85 | 23.92 | <0.05 |
| 6 | 123.51 ± 0.01d | 220.17 ± 0.02b | 220.72 ± 0.03b | 319.54 ± 0.04b | 19.54 | 23.51 | <0.05 |
| 7 | 125.35 ± 0.05b | 218.13 ± 0.03d | 218.21 ± 0.02d | 218.35 ± 0.03c | 18.13 | 25.35 | <0.05 |
| 8 | 126.28 ± 0.10a | 222.98 ± 0.02a | 223.22 ± 0.03a | 222.93 ± 0.02a | 22.93 | 26.28 | <0.05 |
| Min | 18.12 | 15.01 | 15.55 | 13.97 | |||
| Max | 26.28 | 22.98 | 23.22 | 22.93 | |||
| p | <0.05 | <0.05 | <0.05 | <0.05 | |||
Table 4.
Changes in values of total radius of micropore (R, nm) in soil samples collected from fallow and grassland amended with BioC (0, 1, 2, 3 kg·m−2) in terms: 1st–8th. Average values from 3 replicates in each term. Other letter designations (a, b, c, d, e, f, g, h) indicate significant differences (between values at p < 0.05) in terms. Other numbers (1, 2, 3) designations indicate significant differences ( between values at p < 0.05) among treatments for the same sampling date.
| Fallow | |||||||
| Term | 0 kg ⋅m−2 | 1 kg ⋅m−2 | 2 kg ⋅m−2 | 3 kg ⋅m2 | Min | Max | p |
| 1 | 29.16 ± 0.04f | 111.14 ± 0.05c | 110.46 ± 0.05d | 28.62 ± 0.04g | 8.62 | 11.14 | <0.05 |
| 2 | 29.61 ± 0.02d | 110.23 ± 0.05d | 110.35 ± 0.06d | 29.70 ± 0.03d | 9.70 | 10.35 | <0.05 |
| 3 | 27.54 ± 0.05g | 27.55 ± 0.05f | 27.24 ± 0.03f | 19.18 ± 0.03e | 7.24 | 9.18 | <0.05 |
| 4 | 19.35 ± 0.05e | 19.89 ± 0.03e | 19.45 ± 0.06e | 28.92 ± 0.03f | 8.92 | 9.89 | <0.05 |
| 5 | 29.63 ± 0.04d | 45.46 ± 0.06h | 110.35 ± 0.05d | 37.06 ± 0.06h | 5.46 | 10.35 | <0.05 |
| 6 | 210.87 ± 0.06c | 111.49 ± 0.04b | 111.46 ± 0.04c | 210.65 ± 0.05c | 10.65 | 11.49 | <0.05 |
| 7 | 121.04 ± 0.05a | 36.02 ± 0.03g | 213.27 ± 0.04b | 214.05 ± 0.05b | 6.02 | 21.04 | <0.05 |
| 8 | 312.92 ± 0.12b | 213.69 ± 0.03a | 213.45 ± 0.05a | 114.31 ± 0.04a | 12.92 | 14.31 | <0.05 |
| Min | 7.54 | 5.46 | 7.24 | 7.06 | |||
| Max | 21.04 | 13.69 | 13.45 | 14.31 | |||
| p | <0.05 | <0.05 | <0.05 | <0.05 | |||
| Grassland | |||||||
| Term | 0 kg ⋅m−2 | 1 kg ⋅m−2 | 2 kg ⋅m−2 | 3 kg ⋅m−2 | Min | Max | p |
| 1 | 19.50 ± 0.03f | 19.74 ± 0.05f | 19.94 ± 0.05f | 19.54 ± 0.04g | 9.50 | 9.94 | 0.05 |
| 2 | 19.75 ± 0.05e | 19.92 ± 0.06e | 110.16 ± 0.06e | 110.15 ± 0.05e | 9.75 | 10.16 | 0.05 |
| 3 | 19.41 ± 0.04f | 28.65 ± 0.05h | 28.74 ± 0.04h | 19.59 ± 0.03fg | 8.65 | 9.59 | <0.05 |
| 4 | 28.91 ± 0.06g | 29.04 ± 0.04g | 19.73 ± 0.04g | 19.67 ± 0.04f | 8.91 | 9.73 | <0.05 |
| 5 | 210.55 ± 0.05d | 210.92 ± 0.03d | 210.85 ± 0.05d | 111.30 ± 0.03d | 10.55 | 11.30 | <0.05 |
| 6 | 210.83 ± 0.04c | 111.60 ± 0.03c | 111.34 ± 0.05c | 111.84 ± 0.04c | 10.83 | 11.84 | <0.05 |
| 7 | 114.84 ± 0.05a | 114.62 ± 0.04a | 114.21 ± 0.07a | 114.75 ± 0.05a | 14.21 | 14.84 | 0.05 |
| 8 | 114.20 ± 0.03b | 213.55 ± 0.05b | 213.63 ± 0.05b | 213.77 ± 0.03b | 13.55 | 14.20 | <0.05 |
| Min | 8.91 | 8.65 | 8.74 | 9.54 | |||
| Max | 14.84 | 14.62 | 14.21 | 14.75 | |||
| p | <0.05 | <0.05 | <0.05 | <0.05 | |||
© 2019 by the authors. Licensee MDPI, Basel, Switzerland. This article is an open access article distributed under the terms and conditions of the Creative Commons Attribution (CC BY) license (http://creativecommons.org/licenses/by/4.0/).
Share and Cite
MDPI and ACS Style
Cybulak, M.; Sokołowska, Z.; Boguta, P. Impact of Biochar on Physicochemical Properties of Haplic Luvisol Soil under Different Land Use: A Plot Experiment. Agronomy 2019, 9, 531. https://doi.org/10.3390/agronomy9090531
AMA Style
Cybulak M, Sokołowska Z, Boguta P. Impact of Biochar on Physicochemical Properties of Haplic Luvisol Soil under Different Land Use: A Plot Experiment. Agronomy. 2019; 9(9):531. https://doi.org/10.3390/agronomy9090531
Chicago/Turabian StyleCybulak, Marta, Zofia Sokołowska, and Patrycja Boguta. 2019. "Impact of Biochar on Physicochemical Properties of Haplic Luvisol Soil under Different Land Use: A Plot Experiment" Agronomy 9, no. 9: 531. https://doi.org/10.3390/agronomy9090531
Note that from the first issue of 2016, this journal uses article numbers instead of page numbers. See further details here.