1. Introduction
Subsurface crops (such as carrots, sugar beets, potatoes, etc.) are important economic crops in China, ranking among the highest in both planting scale and total yield worldwide. Among them, carrots have become one of the most representative characteristic economic crops in China because of their rich nutritional value and wide market demand [
1,
2,
3]. However, the edible part of carrot grows underground, unlike ground crops such as corn, rice, wheat, and cotton, and its harvesting process is completely dependent on excavation operations. At present, the domestic carrot harvest is still dominated by manual operations, which have the problems of high labor intensity and low production efficiency, which seriously reduce the comprehensive economic benefits of carrot production [
4,
5,
6]. In addition, due to the non-standard planting agronomy and the inconsistent ridge planting mode, if there is a deviation in the forward direction of the digging shovel during the harvest operation, it will inevitably lead to missed digging, less digging, or damage, which will not only cause losses, but also further increase the cost of re-excavation. Therefore, the realization of accurate row-following in the harvesting process has become the key to improving the quality and efficiency of subsurface crop harvesting operations such as carrots. In this context, it is of great significance to carry out the design and research of the automatic row device for carrot harvesting to promote the mechanization and intelligent development of subsurface crop production in China.
At present, in view of the demand for row-following operations for various agricultural machineries and equipment and the development of automatic row-following technology according to the different ways of perception, it can be divided into contact and non-contact approaches.
The contact automatic row-following technology mainly obtains the row-following information through a physical contact between the mechanical structure and the crop. Mechanical structures such as dividers, guide rods, or tactile sensors are usually used. When the agricultural machinery deviates from the crop row, these devices will be in physical contact with the crop stems on the soil or the root systems of the subsurface crop. The resulting displacement is directly converted into control signals, requiring an adjustment through the mechanical connecting rod or sensor, and the actuator is driven to adjust the direction of the agricultural machinery. Taking the TBH45T traction sugar beet combine harvester as the carrier, Wu et al. [
7] constructed an automatic row-following system for the sugar beet combine harvester by using electronic control technology. Based on the four-bar linkage mechanism, Wang et al. [
8,
9] optimized the automatic row-following system of the traction sugar beet combine harvester and developed an automatic row-following digging and harvesting test bench suitable for subsurface crops. Jia et al. [
10] designed a soft-shaft tactile sensor based on the mechanical threshold of corn stalks to identify and locate corn. Xu et al. [
11] designed a tactile sensor based on critical pressure values according to the mechanical parameters of grape vines and acquired the position of grape plants. Zhang et al. [
12] designed an automatic row-following device for a cotton topping machine and used an angle sensor to convert the rotation angle of the detection rod into the offset of cotton plants. In addition, according to the characteristic ridge cultivation of subsurface crops, Li et al. [
13] used ridge detection instead of root detection and designed an automatic row-following system for a potato harvester. Through the contact between the arc-shaped detection plate and the side of the ridge, the ridge profile was directly tracked, and the excavation position was consistently controlled toward the center of the ridge to achieve automatic row-following.
This row-following technology features a relatively simple structure, low cost, and high reliability. However, the performance of the system depends on continuous and regular crop rows. In cases of severe plant offset, the detection rod may lose its target, resulting in missed excavations; additionally, if the harvester speed is high, a slight overshoot also may easily run out of control, so it is mainly suitable for low-speed operation scenarios [
14]; moreover, the frequent contact between the detection rod and crops can cause the wear and deformation of sensors and mechanical components, consequently increasing equipment maintenance and replacement costs.
The non-contact automatic row-following technology mainly uses various sensors to remotely sense the environment and realize the adjustment of crop rows. Ma [
15] designed a four-ridge and eight-row peanut strip harvester based on automatic row-following. An ultrasonic sensor was used to detect the distance change between the ridge surface and the connecting rod of the profiling wheel to judge the deviation degree of the forward direction. Nagasaka et al. [
16] introduced an RTK-GPS system to realize the automatic row-following control of a rice picker. Compared with the mechanical contact automatic row-following methods, this method is not affected by missing plants and crooked plants. Owing to their excellent environmental perception capabilities, machine vision-based methods have evolved into a core research area for detecting crop row structures, with successful implementations in row crops including potatoes [
17], corn [
18], and sugar beets [
19,
20]. Such approaches avoid physical contact with crops, eliminating the risk of mechanical damage at the source. However, they also present significant limitations: ultrasonic detection is susceptible to surface weeds and significant terrain variations; satellite navigation technology is costly and relies on stable satellite signals and preset paths [
21]; and machine vision technology is highly sensitive to environmental lighting conditions, variations in crop growth stages, and field weeds. When applied to carrots—a crop with large leaves and severe inter-row occlusion—the algorithmic recognition accuracy for actual crop row structures remains inadequate [
22,
23].
In summary, the existing research on ridged carrots remains limited, and traditional contact devices lack adaptability to complex three-dimensional ridge shapes. Their single lateral control struggles to ensure row-following accuracy when facing ridge surface fluctuations. Based on this analysis, this study proposes the following core hypothesis: by constructing a coordinated sensing system for lateral row-following and vertical profiling and adopting a fuzzy PID-based collaborative control strategy, the carrot harvester can dynamically adjust the position of the digging mechanism under complex ridge conditions, achieving an accurate tracking of carrot crop rows. To verify this hypothesis, this study establishes the following objectives: (1) design and implement an automatic row-following device that integrates lateral detection and ridge surface fluctuation monitoring; (2) design a fuzzy PID controller to coordinate the lateral and vertical stepper motors for digging device position adjustment; (3) apply response surface methodology to systematically analyze the effects of key working parameters on operation performance and determine the optimal parameter configuration; (4) conduct field experiments to verify the actual row-following accuracy under the optimal parameter configuration.
2. Materials and Methods
2.1. Research Subject
The subject of this study was the carrot cultivar ‘Chengshanhong No. 1’, sourced from Xiaoxian County, Suzhou City, Anhui Province, China. The carrots were cultivated using a single-row planting pattern on individual ridges.
2.2. Measurement of Physical Parameters and Planting Characteristics of Carrots
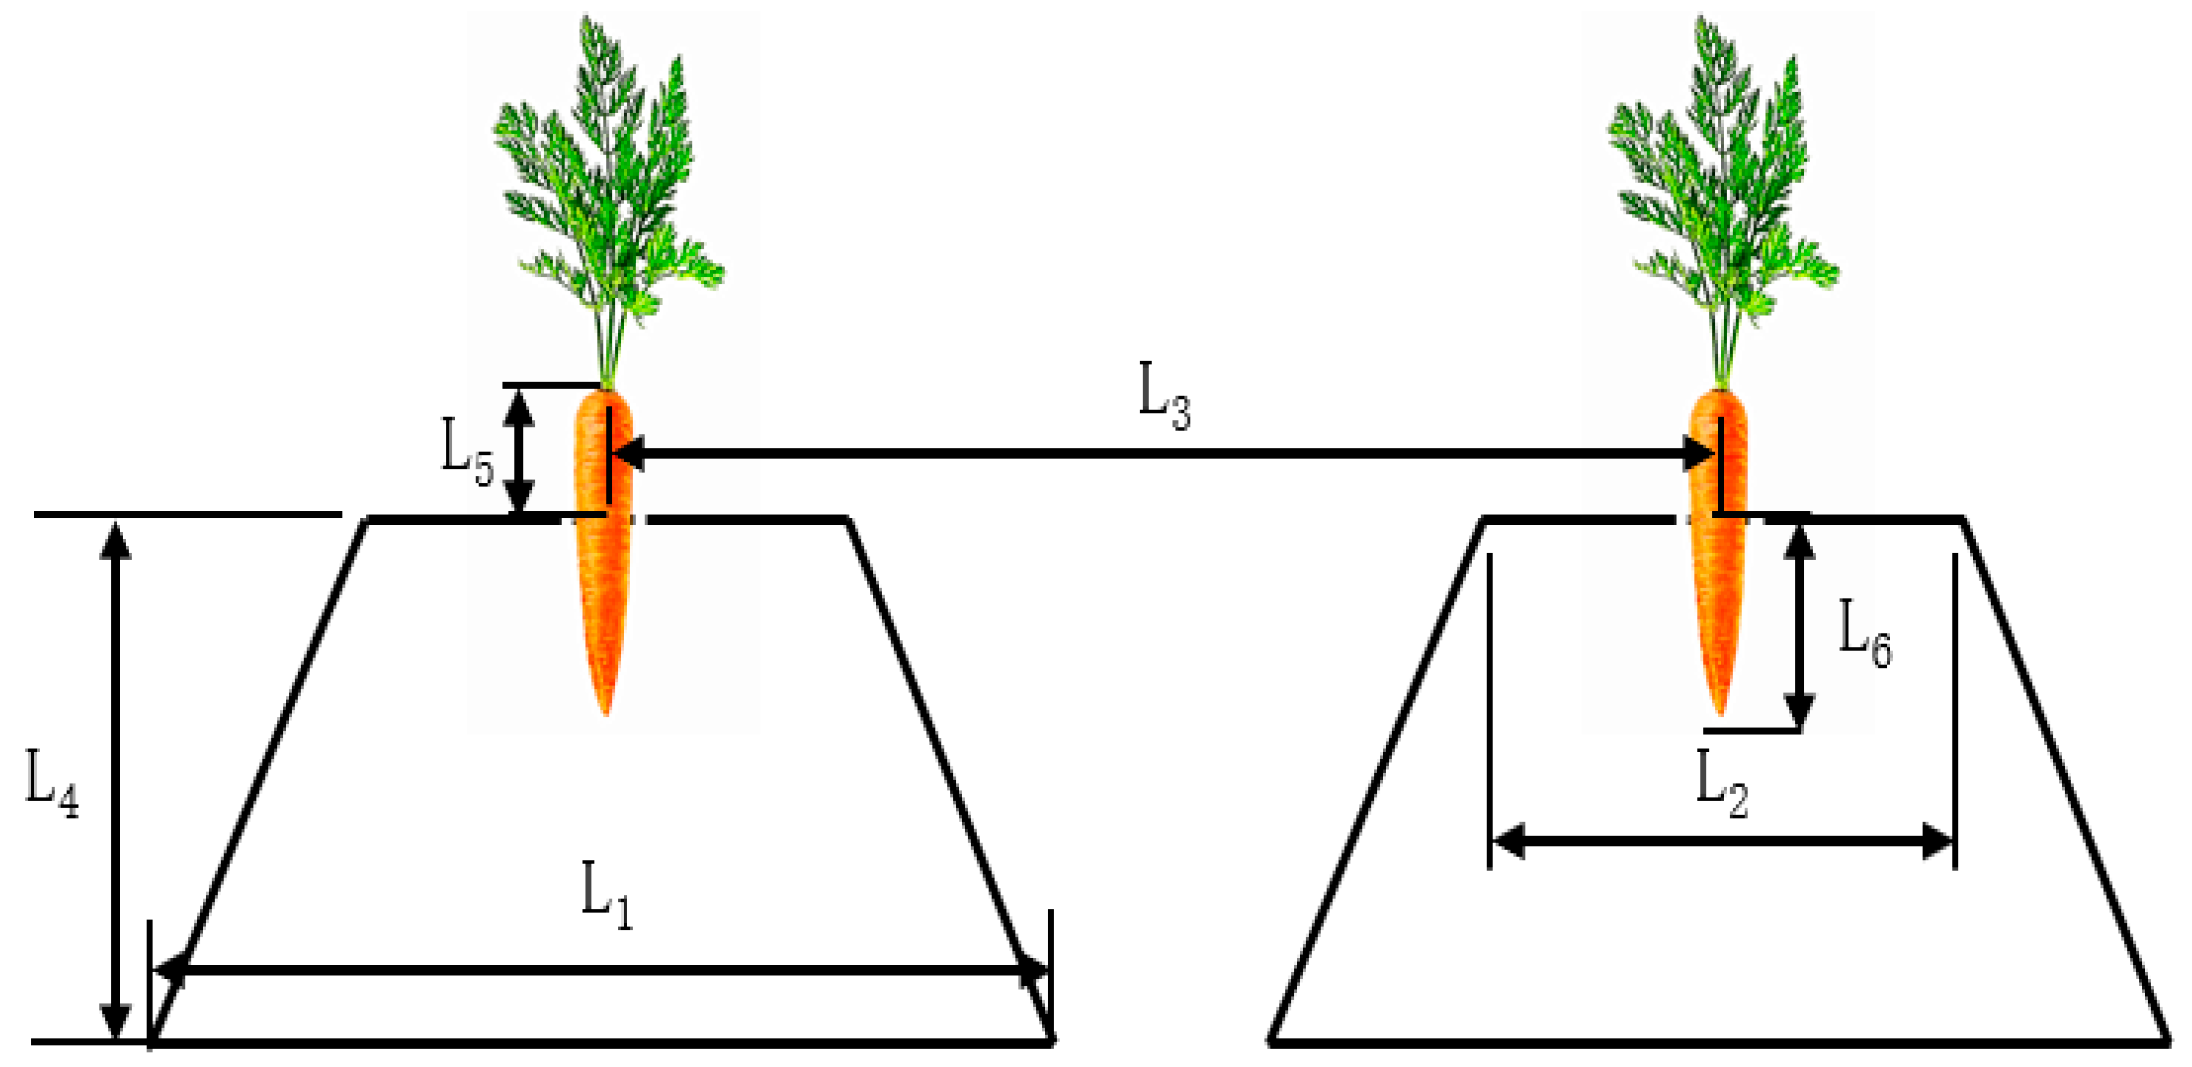
The diameter, circumference, and weight of carrot roots were measured using a vernier caliper, a metric ruler, and a digital electronic scale, respectively. A tape measure was employed to determine agronomic parameters, such as ridge height and ridge dimensions. The measurement process for the physical and agronomic characteristics of the carrots is illustrated in
Figure 1.
2.3. Working Principle of Mechanical Contact Row-Following Devices
2.3.1. Working Principle
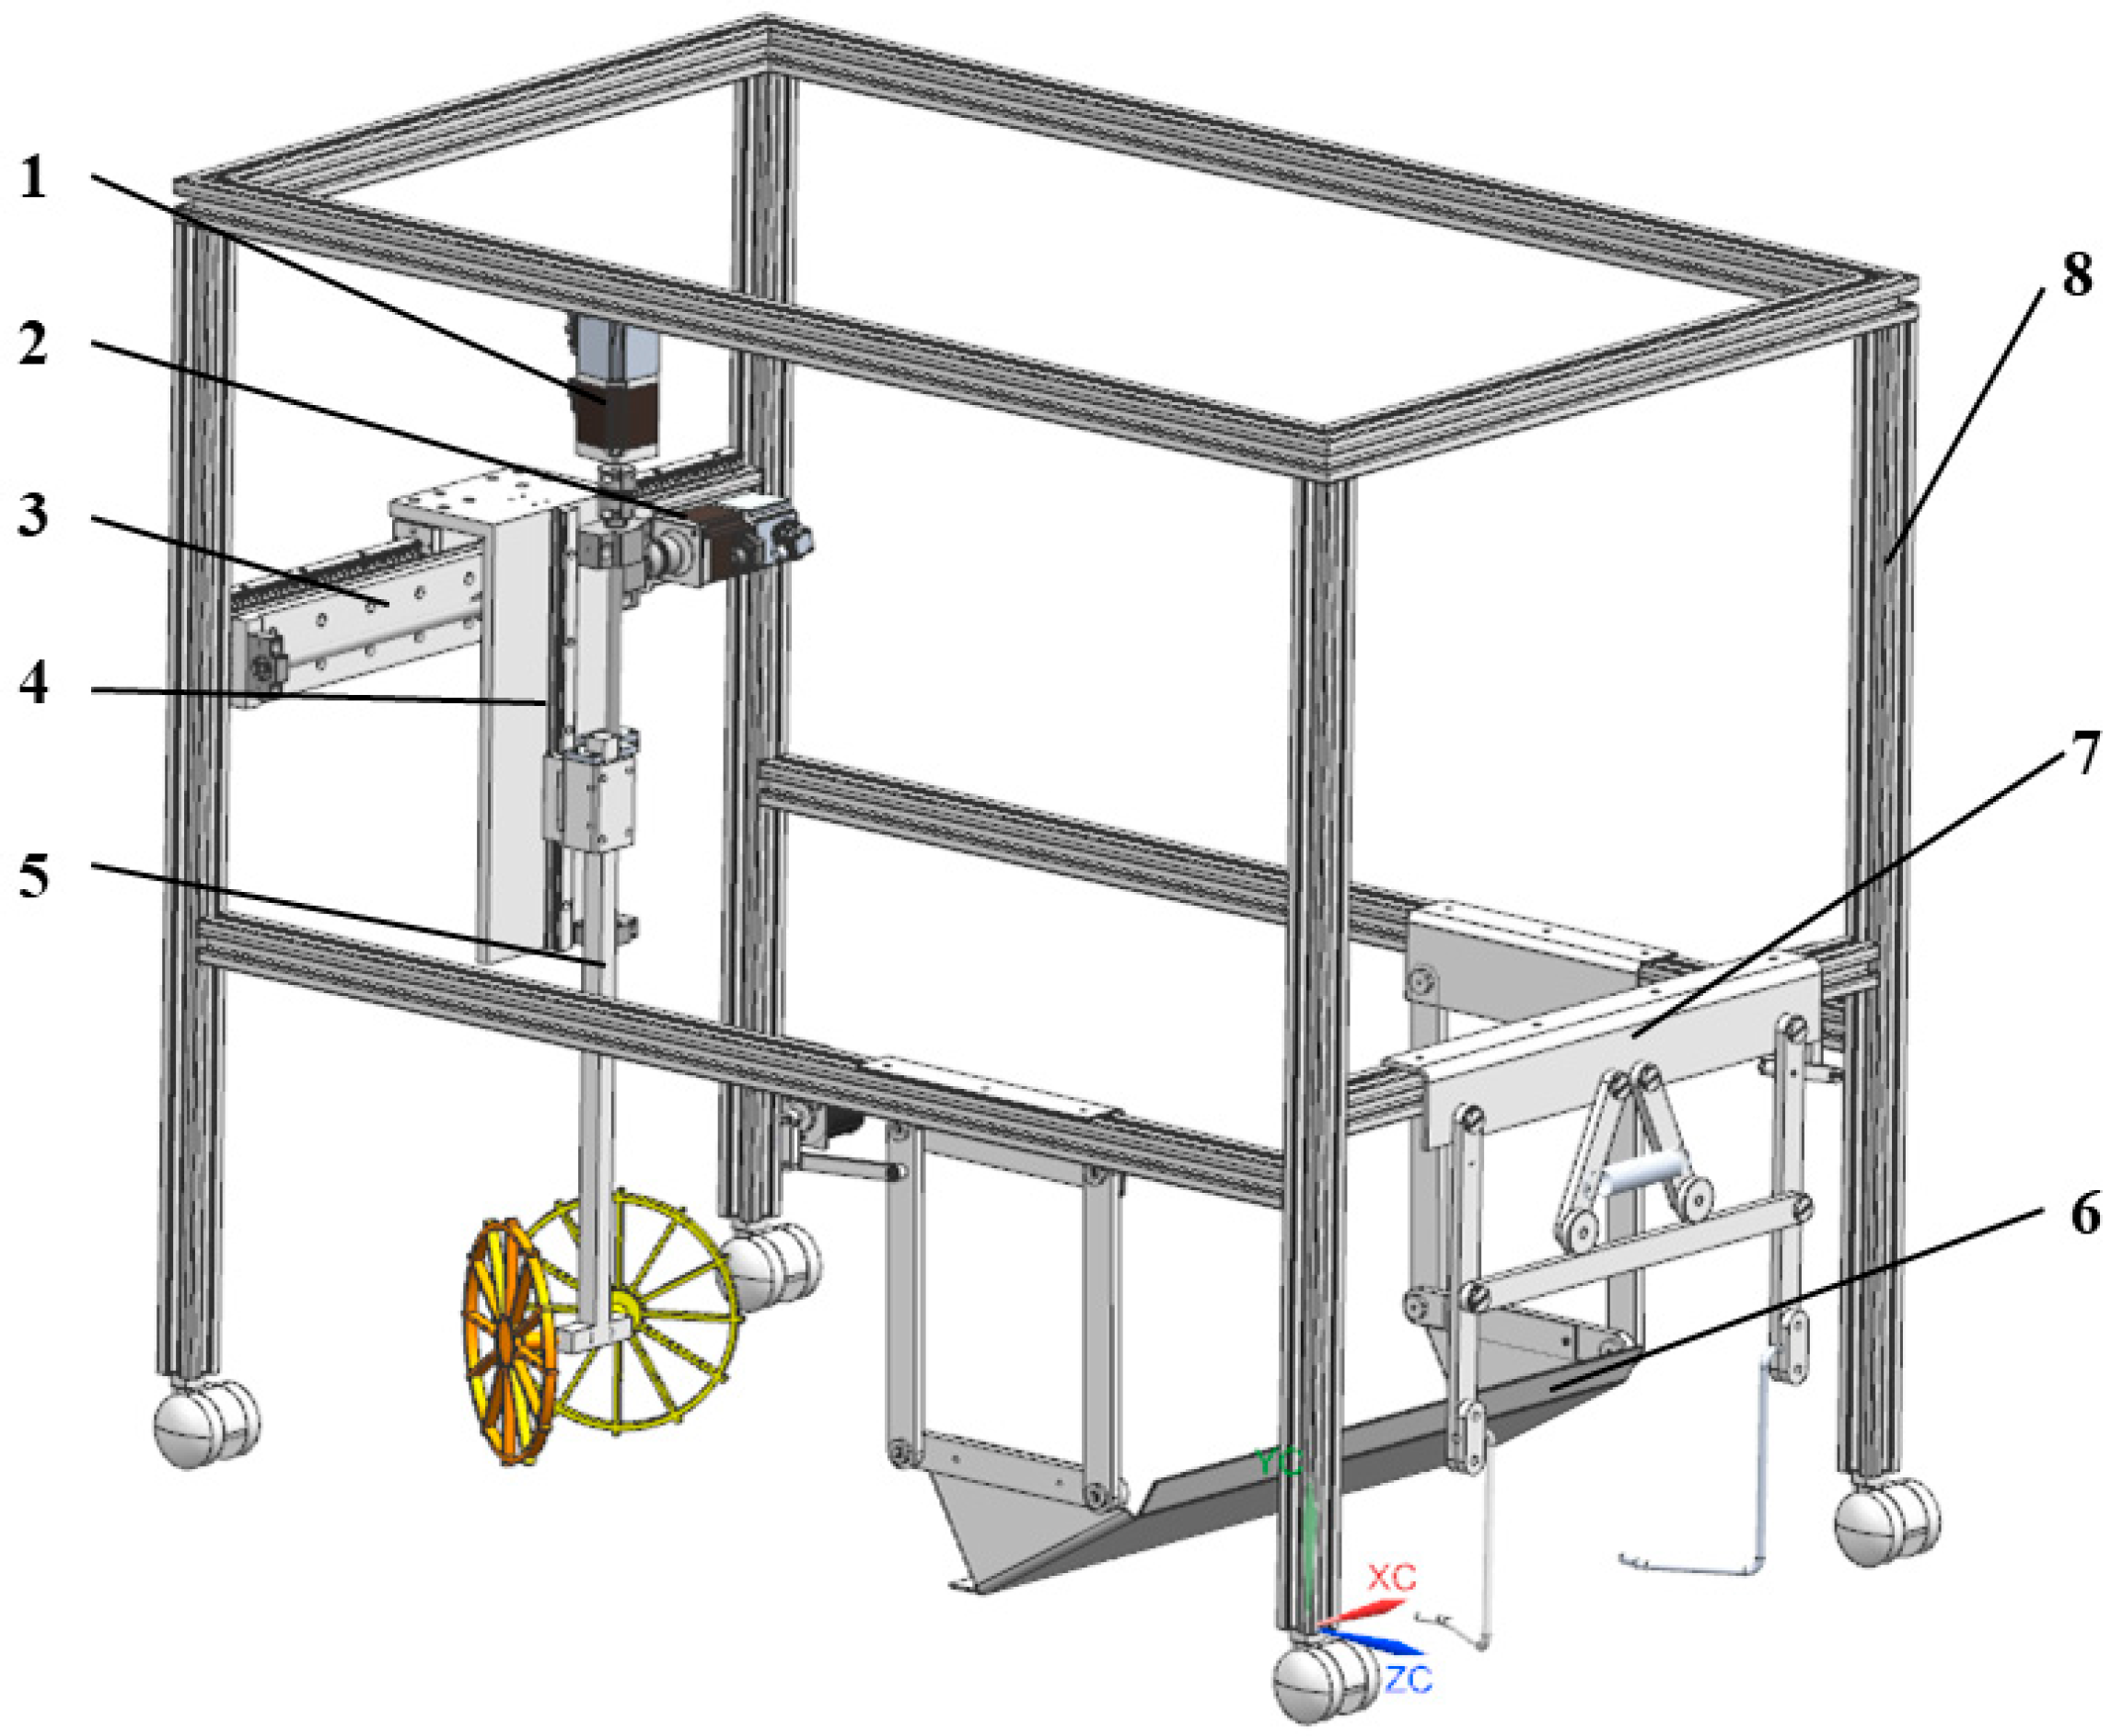
In this paper, a contact-based automatic row-following device is designed. The device mainly includes a lateral detection mechanism, ridge surface floating detection mechanism, digging mechanism, main frame, lateral stepper motor, vertical stepper motor, lateral screw guide rail, and vertical screw guide rail. The overall configuration is shown in
Figure 2.
The working principle is as follows: During the harvesting process, if the carrot exhibits no lateral offset or only minimal offset, it can smoothly pass through the two detection rods of the lateral detection mechanism. When the carrot demonstrates a lateral offset, it will touch the detection rod on the corresponding side, causing rod deflection. The deflection motion will drive the shaft of the angle sensor to rotate. The controller then calculates the precise offset based on the angle signal provided by the sensor and controls the lateral motor to drive the digging mechanism for lateral adjustment, thereby achieving accurate lateral row-following. At the same time, the ridge surface floating detection mechanism remains suspended above the carrot plant. When ridge surface fluctuation leads to variations in carrot height, the detection plate will move vertically and drive the sensor shaft to rotate. The controller subsequently calculates the height change based on this angle signal and controls the vertical motor to adjust the height of the digging mechanism to achieve vertical profiling.
2.3.2. Key Components
Lateral Detection Mechanism
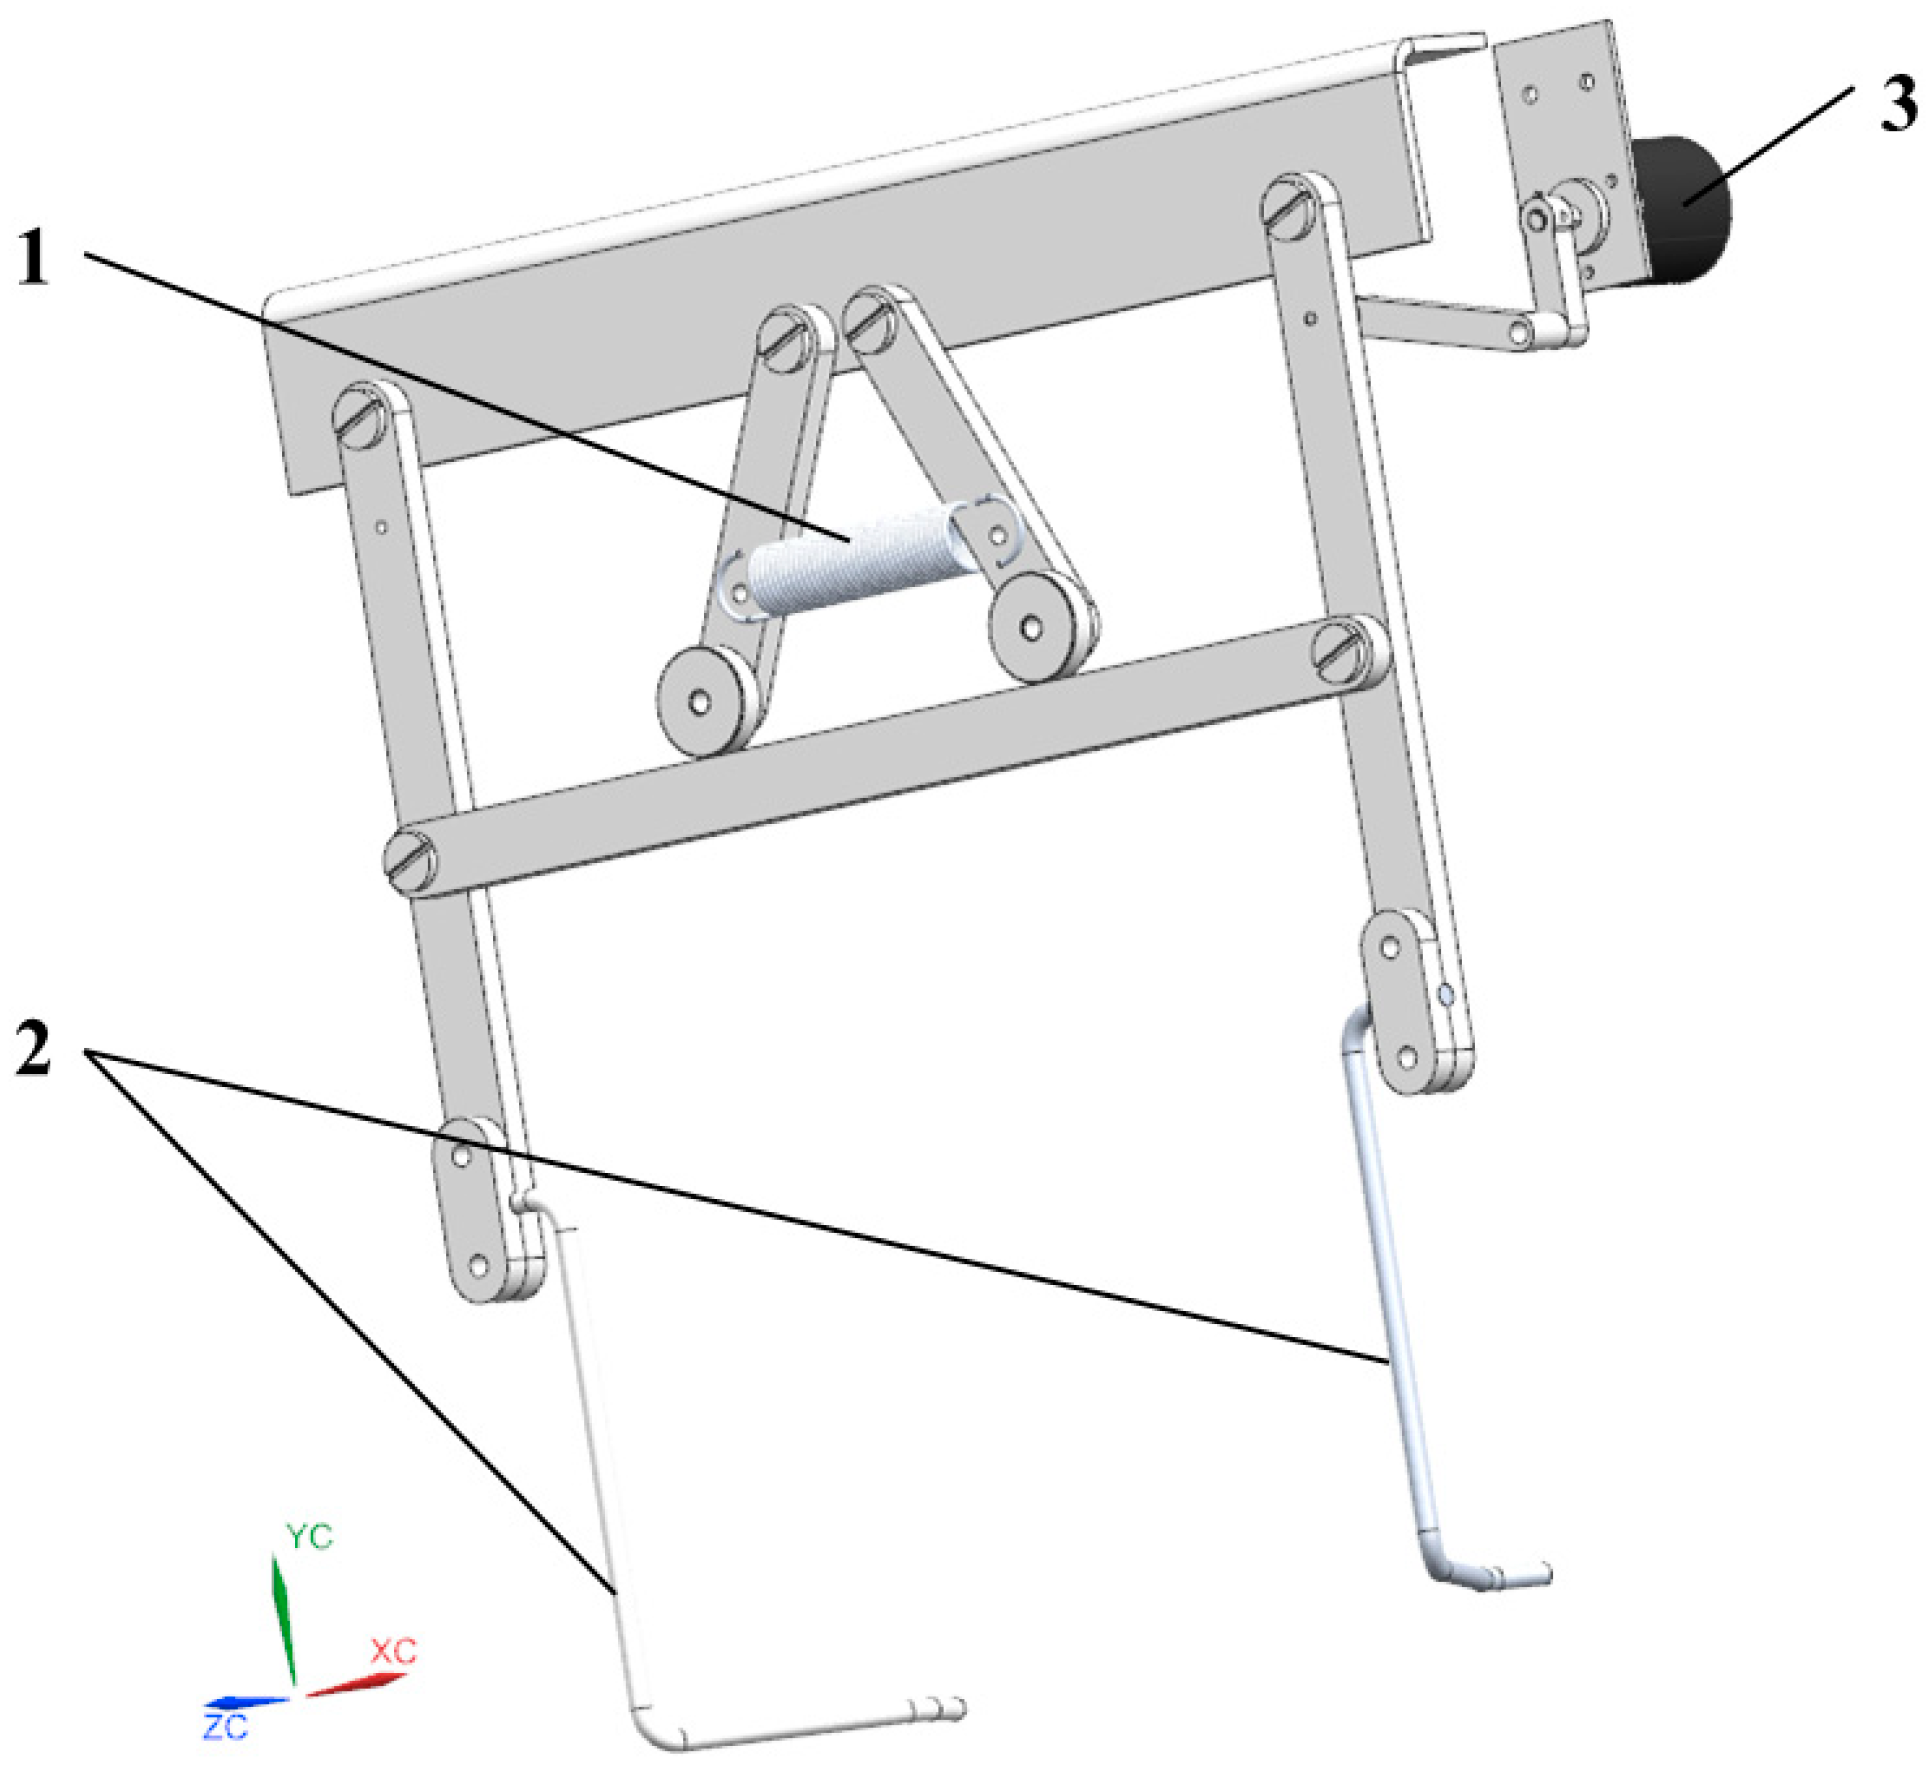
The core components of the lateral detection mechanism mainly include a pair of guide detection rods, angle sensors, and reset springs. The structure is shown in
Figure 3. The guide detection rod converts the offset into its own rotation angle through contact with the offset carrot root; the angle sensor monitors and feeds back the rotation angle of the guide detection rod to the controller in real time. The reset spring provides the restoring torque, which drives the guide detection rod back to the neutral position after the carrot passes. The working diagram of the guide detection rod is shown in
Figure 4.
Ridge Surface Floating Detection Mechanism
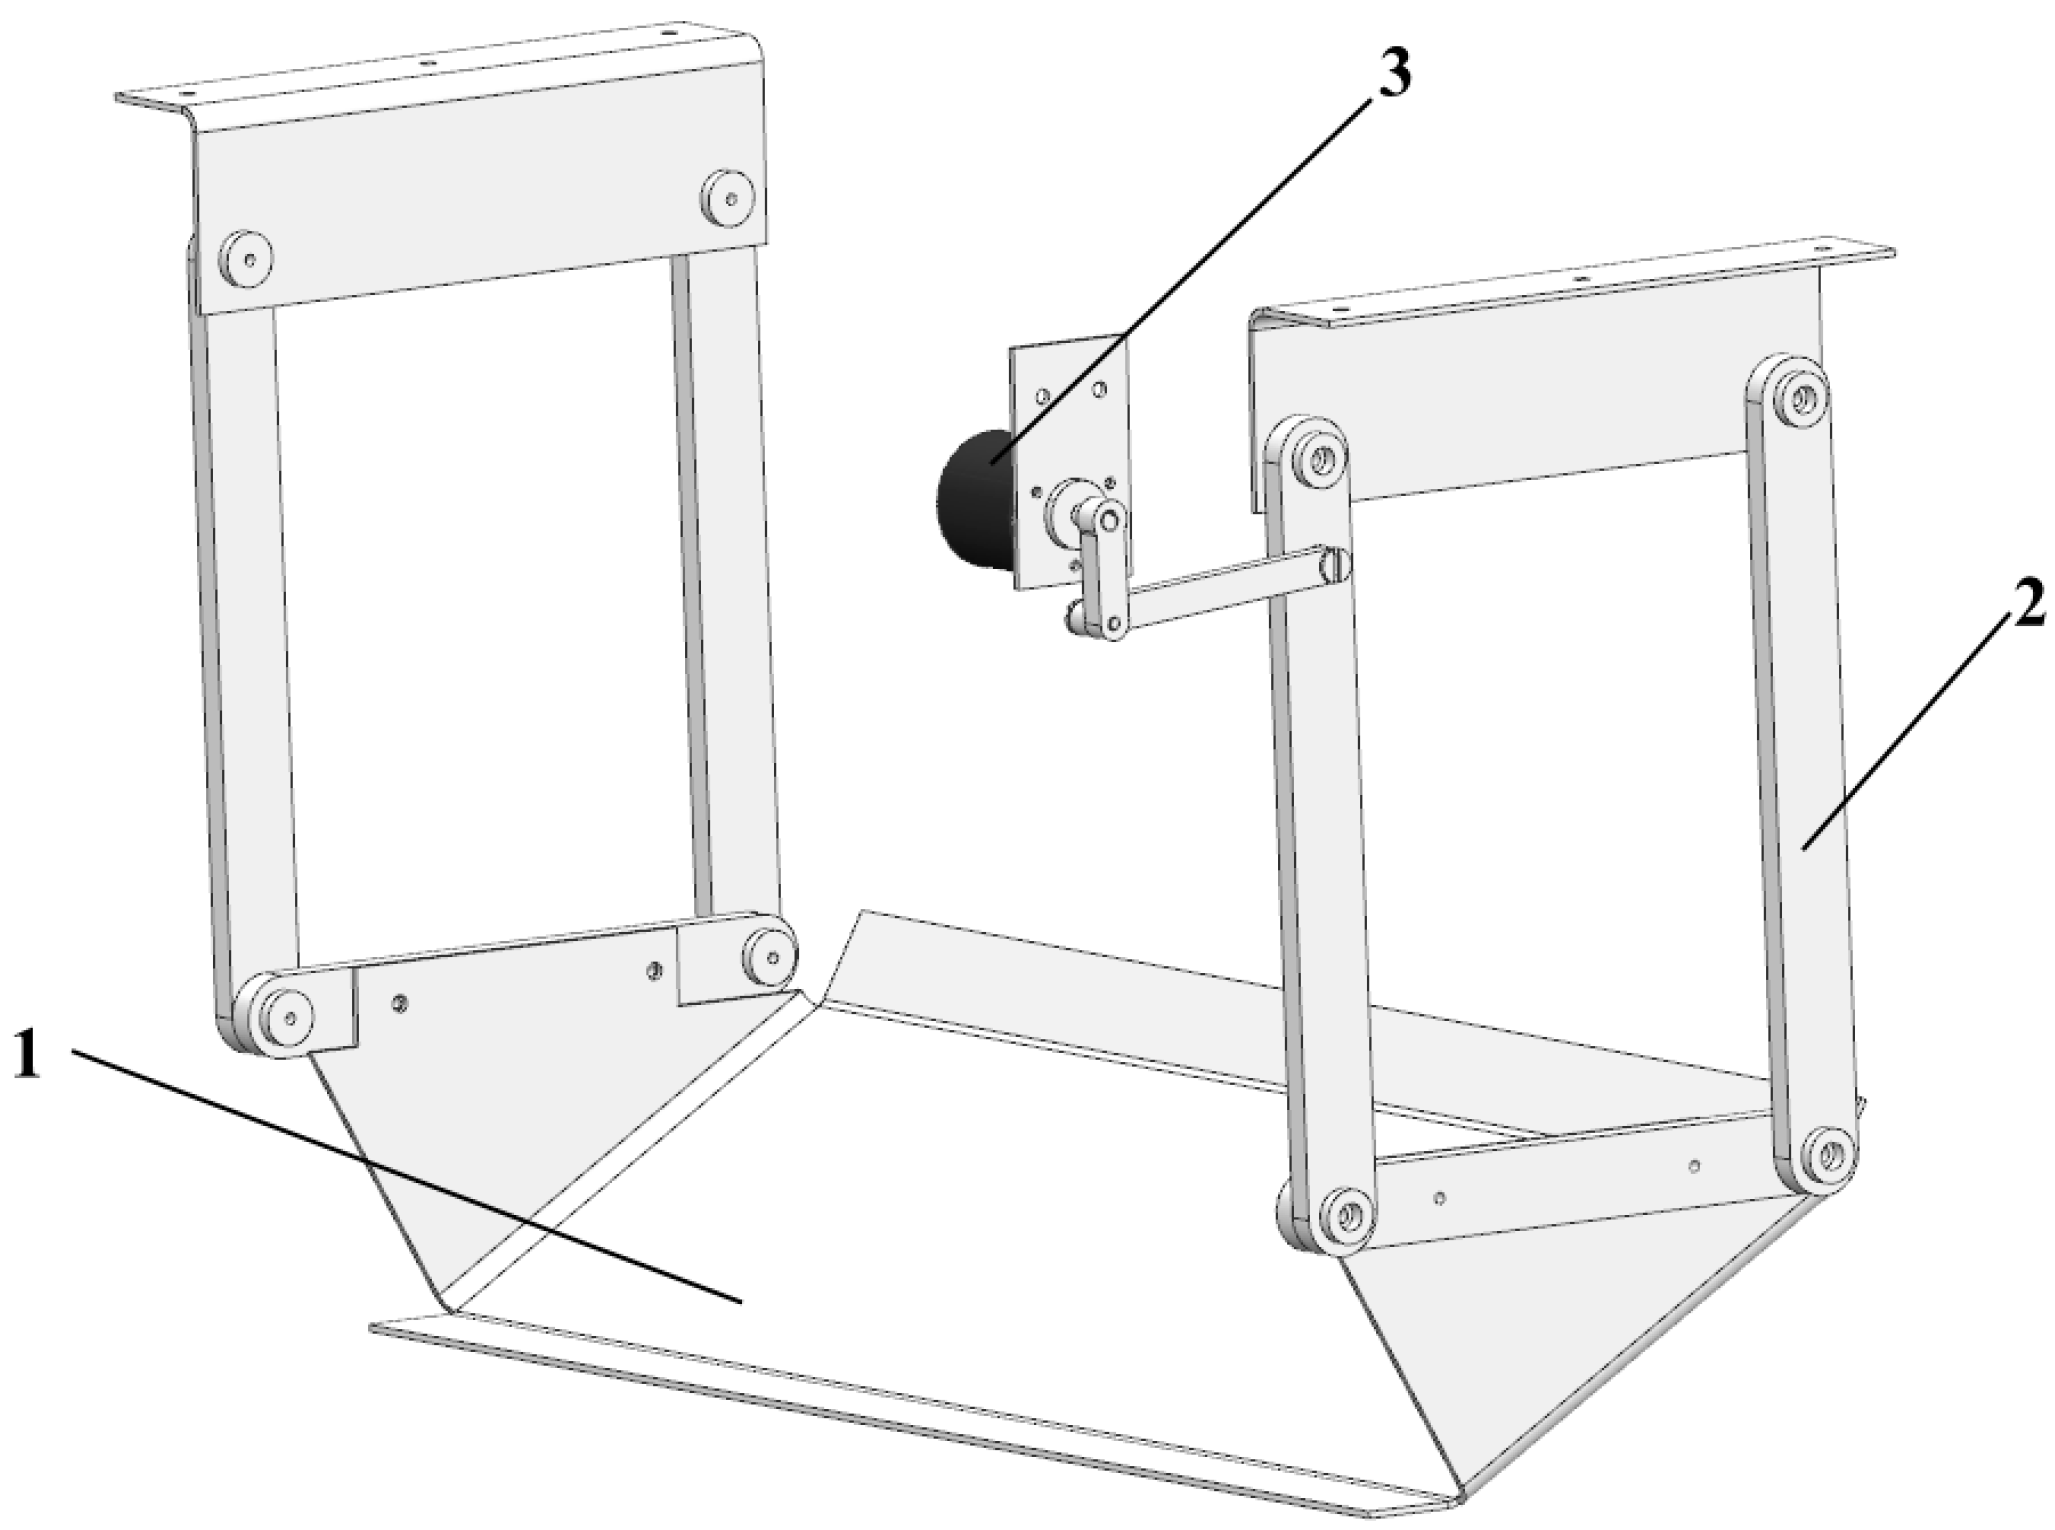
The core components of the ridge surface floating detection mechanism include a profiling plate, a rotary mechanism, and an angle sensor. The structure is shown in
Figure 5. Before operation, the profiling plate is adjusted to the preset initial height. After starting work, the profiling plate rotates with the ridge surface fluctuation, converting the terrain elevation change into its own angle change in real time. The rotation is transmitted through the rotary mechanism and monitored in real time by the angle sensor. Finally, the rotation angle signal is fed back to the controller to provide the core input for the closed-loop control of the digging height.
2.4. Design of Control System
2.4.1. System Structure and Hardware Components
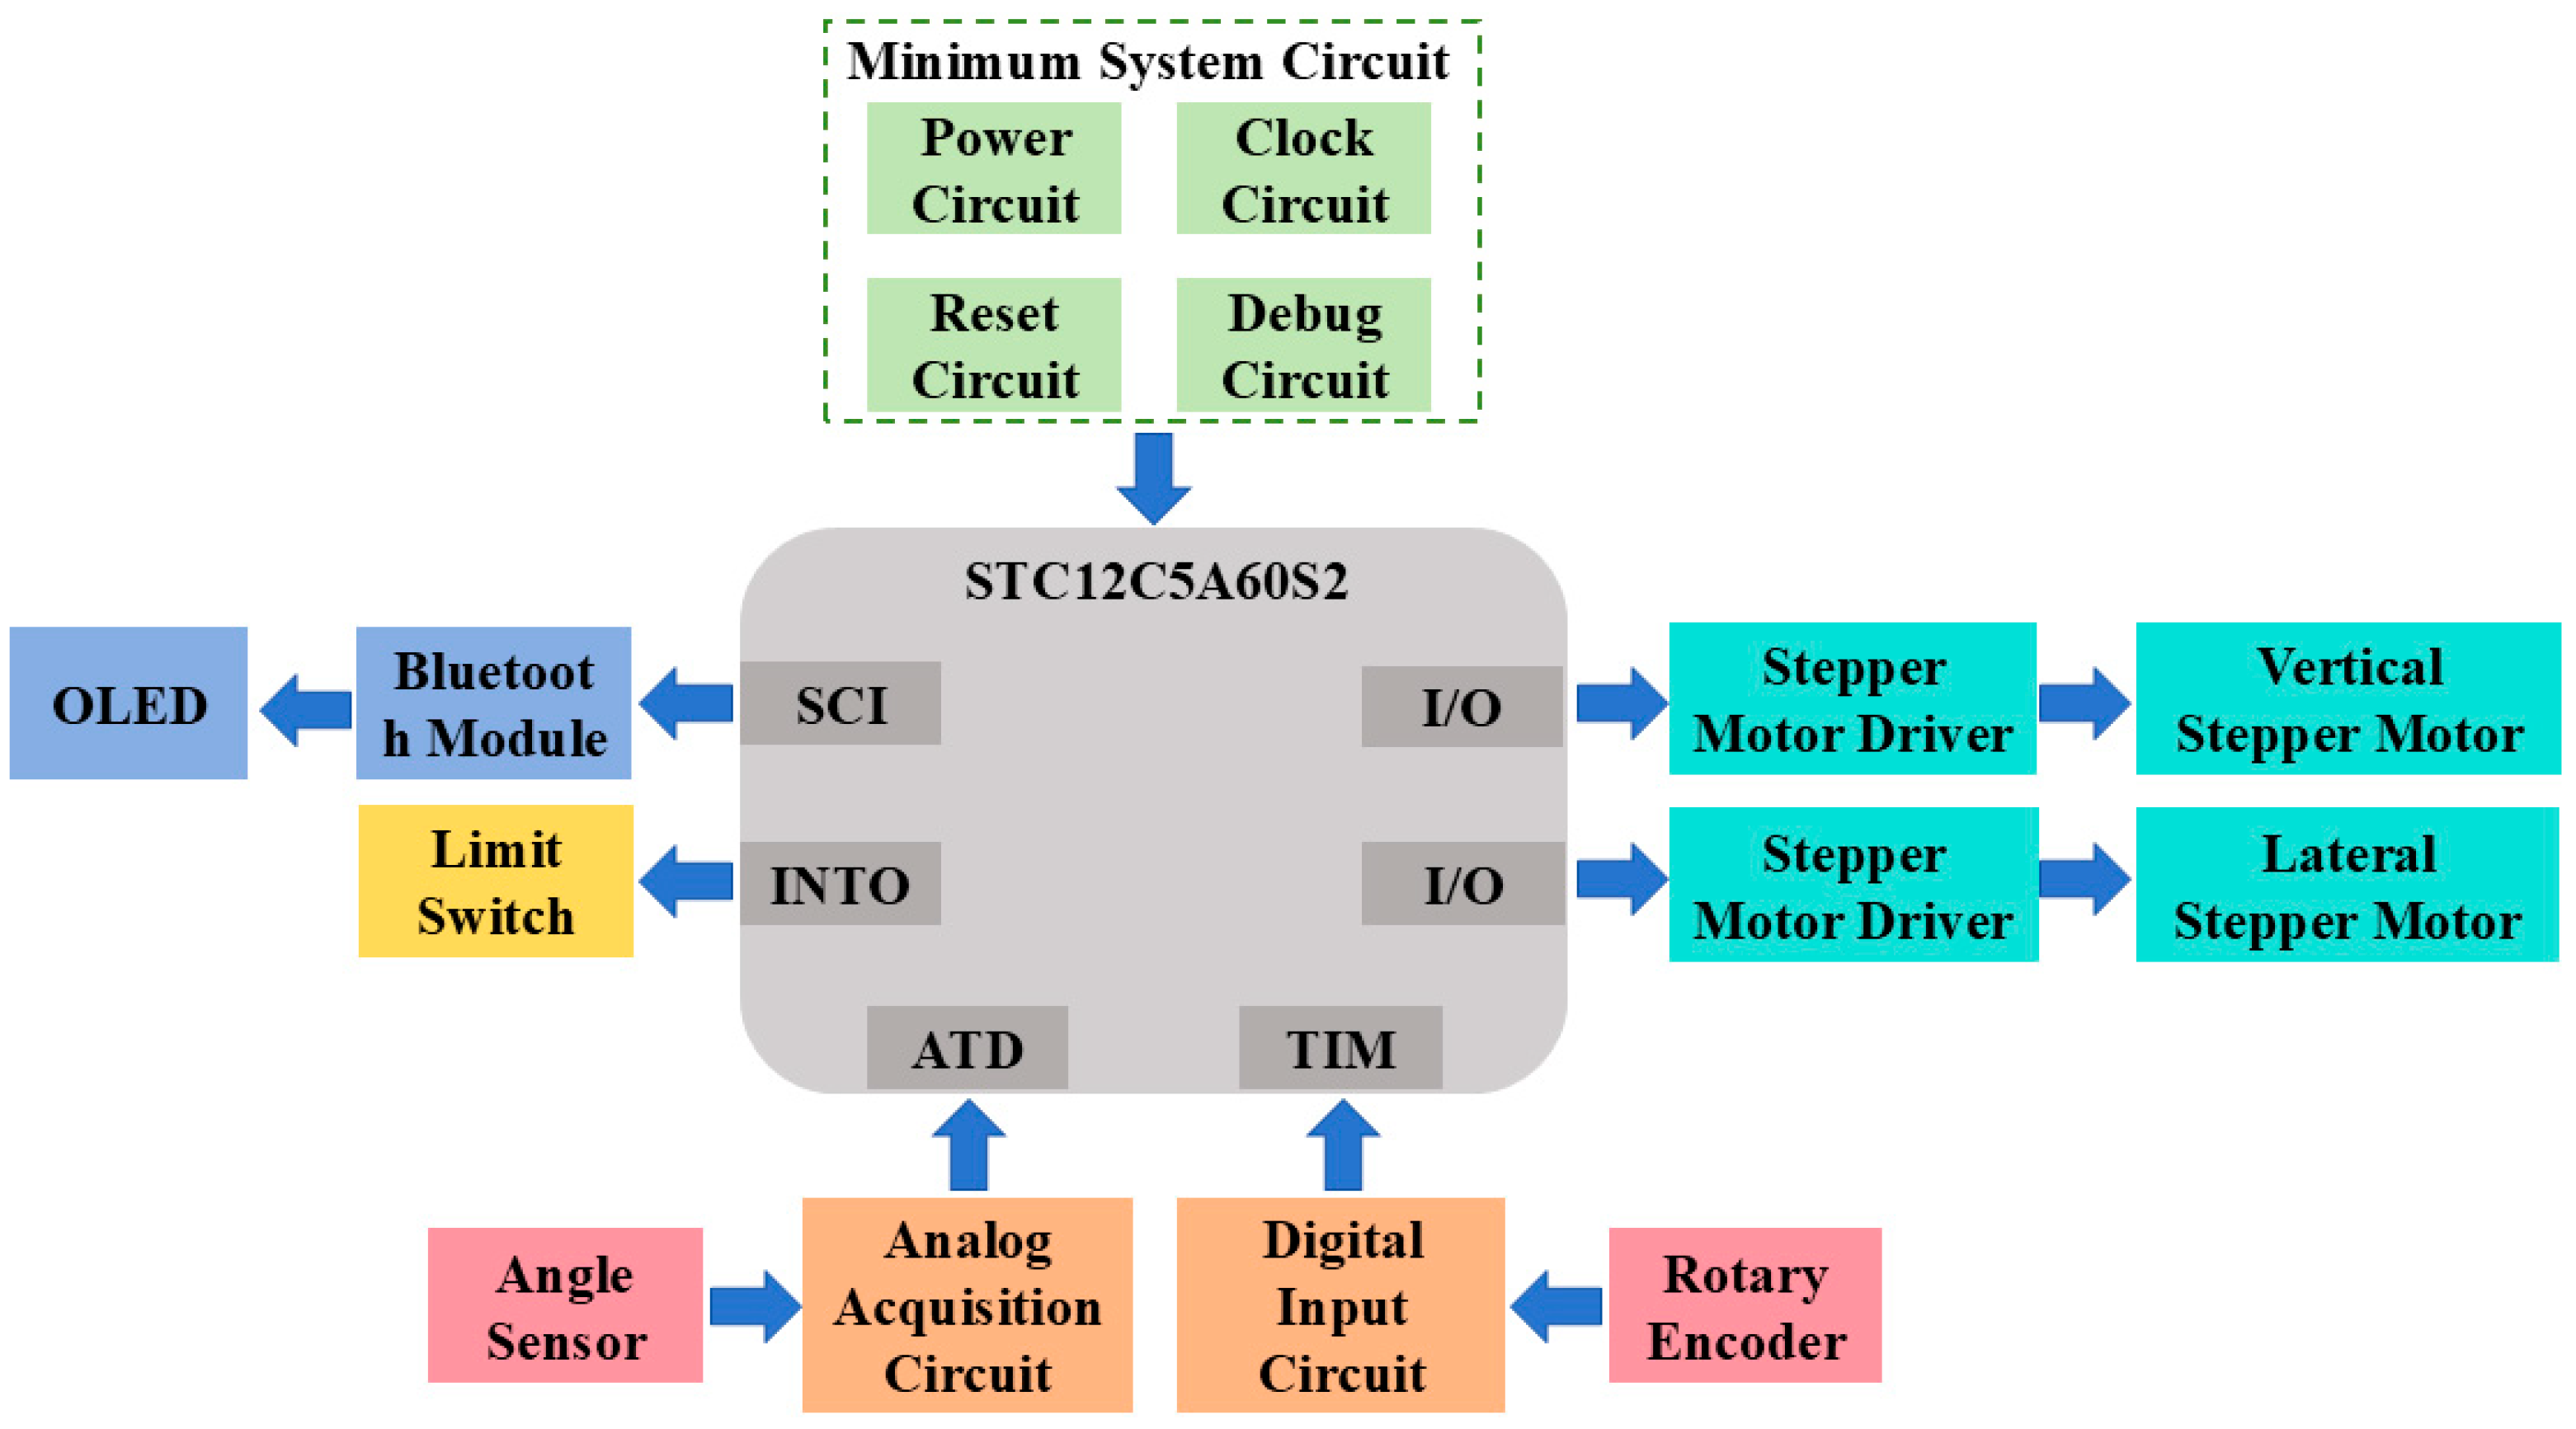
The control system of the automatic row-following device uses the STC12C5A60S2 single-chip microcomputer as the control core, consisting of the minimum system circuit, analog signal acquisition circuit, digital signal acquisition circuit, serial communication circuit, and other components. The structure is shown in
Figure 6.
According to the above system structure requirements, the core hardware components of the device’s control system have been selected and configured, with the key components summarized in
Table 1.
2.4.2. Software Design and Functionality
The control system program in this paper is developed in C language and integrated into the Keil μVision (5.38.0.0) development environment to complete the writing, compilation, and debugging processes. The main program flowchart of the control system is shown in
Figure 7. First, all sensors, Bluetooth modules, control devices, etc., are initialized. The system begins collecting sensor data and performs necessary processing according to the set parameters. Based on the sensor’s angle data, the control algorithm is invoked for automatic adjustment, and the control signal output by the algorithm determines the motor’s operational response. The system transmits data to external devices in real time through the Bluetooth module, including current sensor positions, facilitating real-time monitoring of the system’s operating status. When a limit switch is triggered, the system responds promptly through an external interrupt routine, stops motor movement, and adjusts the control strategy to prevent mechanical damage. The aforementioned signal acquisition system operates in a continuous cycle: the program consistently accepts sensor feedback data, executes the control algorithm, transmits data to the Bluetooth module, and remains ready to respond to limit switch interrupt commands at any time.
The system operation follows these principles:
(1) When the detection rod deflects, the system detects the numerical change and determines the motor’s start/stop operation.
(2) In lateral adjustment: A left deflection of the detection rod causes a clockwise rotation of the angle sensor shaft, positive rotation of the motor screw, and leftward movement of the digging device; a right deflection results in a counterclockwise sensor rotation, motor screw reversal, and rightward shifting of the digging device.
(3) In vertical adjustment: A forward swing of the profiling plate produces a clockwise angle sensor rotation, forward motor screw motion, and downward movement of the digging device; a backward swing leads to a counterclockwise sensor rotation, motor screw reversal, and upward motion of the digging device.
(4) When either the detection rod or profiling plate reaches its displacement limit, the limit switch triggers and activates the interrupt response system.
(5) The LCD displays real-time data, enabling visual monitoring of deflection angles.
2.4.3. Design of Fuzzy PID-Based Control Strategy
To realize the accurate harvesting of the automatic row-following device, based on the principle of fuzzy PID control, this paper designs a set of coordinated control systems integrating lateral row-following and vertical profiling. The control principle is shown in
Figure 8. In the lateral direction, when the carrot and the crop row have a lateral offset, the detection rod produces the corresponding angular displacement, and the angle sensor detects the offset in real time and feeds it back to the controller. The controller then sends a control signal to the lateral stepping motor to drive the screw to rotate, thereby driving the entire digging device to move laterally. In the vertical direction, the angle sensor obtains the ridge surface height information in real time through the ridge surface floating detection mechanism. Based on this information, the controller also sends a control signal to the vertical stepping motor to realize active profiling. The motor rotation angles of the two subsystems are collected at the same time and used as position feedback to form a closed loop. Through coordinated operation, accurate row-following under complex ridge conditions is achieved.
The displacement deviation e and the deviation change rate are used as the inputs of the fuzzy controller, where . The quantized values of and serve as the inputs to the fuzzy logic system, and the corresponding fuzzy linguistic variables are defined as and . The outputs of the controller are the corrections of PID parameters, namely , , and . Fuzzy control rules constitute the core of the fuzzy PID controller. By querying the fuzzy rule table established based on expert experience, the system performs fuzzy reasoning on the inputs and to obtain the output fuzzy quantities. Then, the centroid method is applied to transform the fuzzy quantities into precise correction values (, , ). The obtained correction values are added to the initially tuned PID parameters, generating the self-adjusted new parameters that are subsequently applied to the PID control to achieve precise control of the system.
For each rule, the fuzzy relation from
to
,
, and
can be generated. Taking
as an example, the fuzzy relation
of rule
is obtained through the following implication operation:
Among them, , , and are the fuzzy subsets corresponding to , , and under this rule, respectively.
The total fuzzy relation matrix R is obtained by the union of fuzzy relations of all rules:
For the input precise quantities
and
, after fuzzification and composition with the total fuzzy relation
, the output fuzzy set
is obtained through synthetic reasoning:
The process of obtaining and is the same.
The center of gravity method is used to defuzzify the fuzzy set of the output, and the formula of the accurate output value is obtained as follows:
Among them, represents the adjustment amount for the proportional gain ; represents the j-th discrete candidate value from the predefined universe of discourse for the output variable; represents the membership degree of the candidate value belonging to the final output fuzzy set ; and represents the total number of discrete points in the output universe of discourse.
2.5. Simulation Analysis
2.5.1. Static Simulation Based on SolidWorks
In the lateral detection mechanism, the working state of the detection rod directly affects the working accuracy and harvesting quality of the automatic row-following system. To ensure the operational reliability of the lateral detection mechanism and avoid structural damage from overload, static analysis of the detection rod is performed to obtain its mechanical response under the contact load from carrot stems.
Based on previous physical tests, the average mechanical fracture force of carrot stems was approximately 50 N, which serves as the load input condition for static analysis in this study. The SolidWorks (2019) Simulation finite element analysis module is used to simulate the stress and strain of the detection rod. In the simulation model, the top end of the detection rod is constrained as a fixed boundary, and a vertical load of 50 N is applied to the contact area between the detection rod and the carrot to simulate the stress state during actual operation. The maximum stress distribution and maximum deformation displacement of the detection rod under this condition are calculated through finite element simulation. The obtained maximum stress value is compared with the yield strength of the detection rod material to verify whether the static strength meets safety requirements. Simultaneously, the maximum displacement is used to evaluate whether stiffness affects detection accuracy. The material properties of the detection rod are shown in
Table 2.
2.5.2. Dynamic Simulation Based on RecurDyn
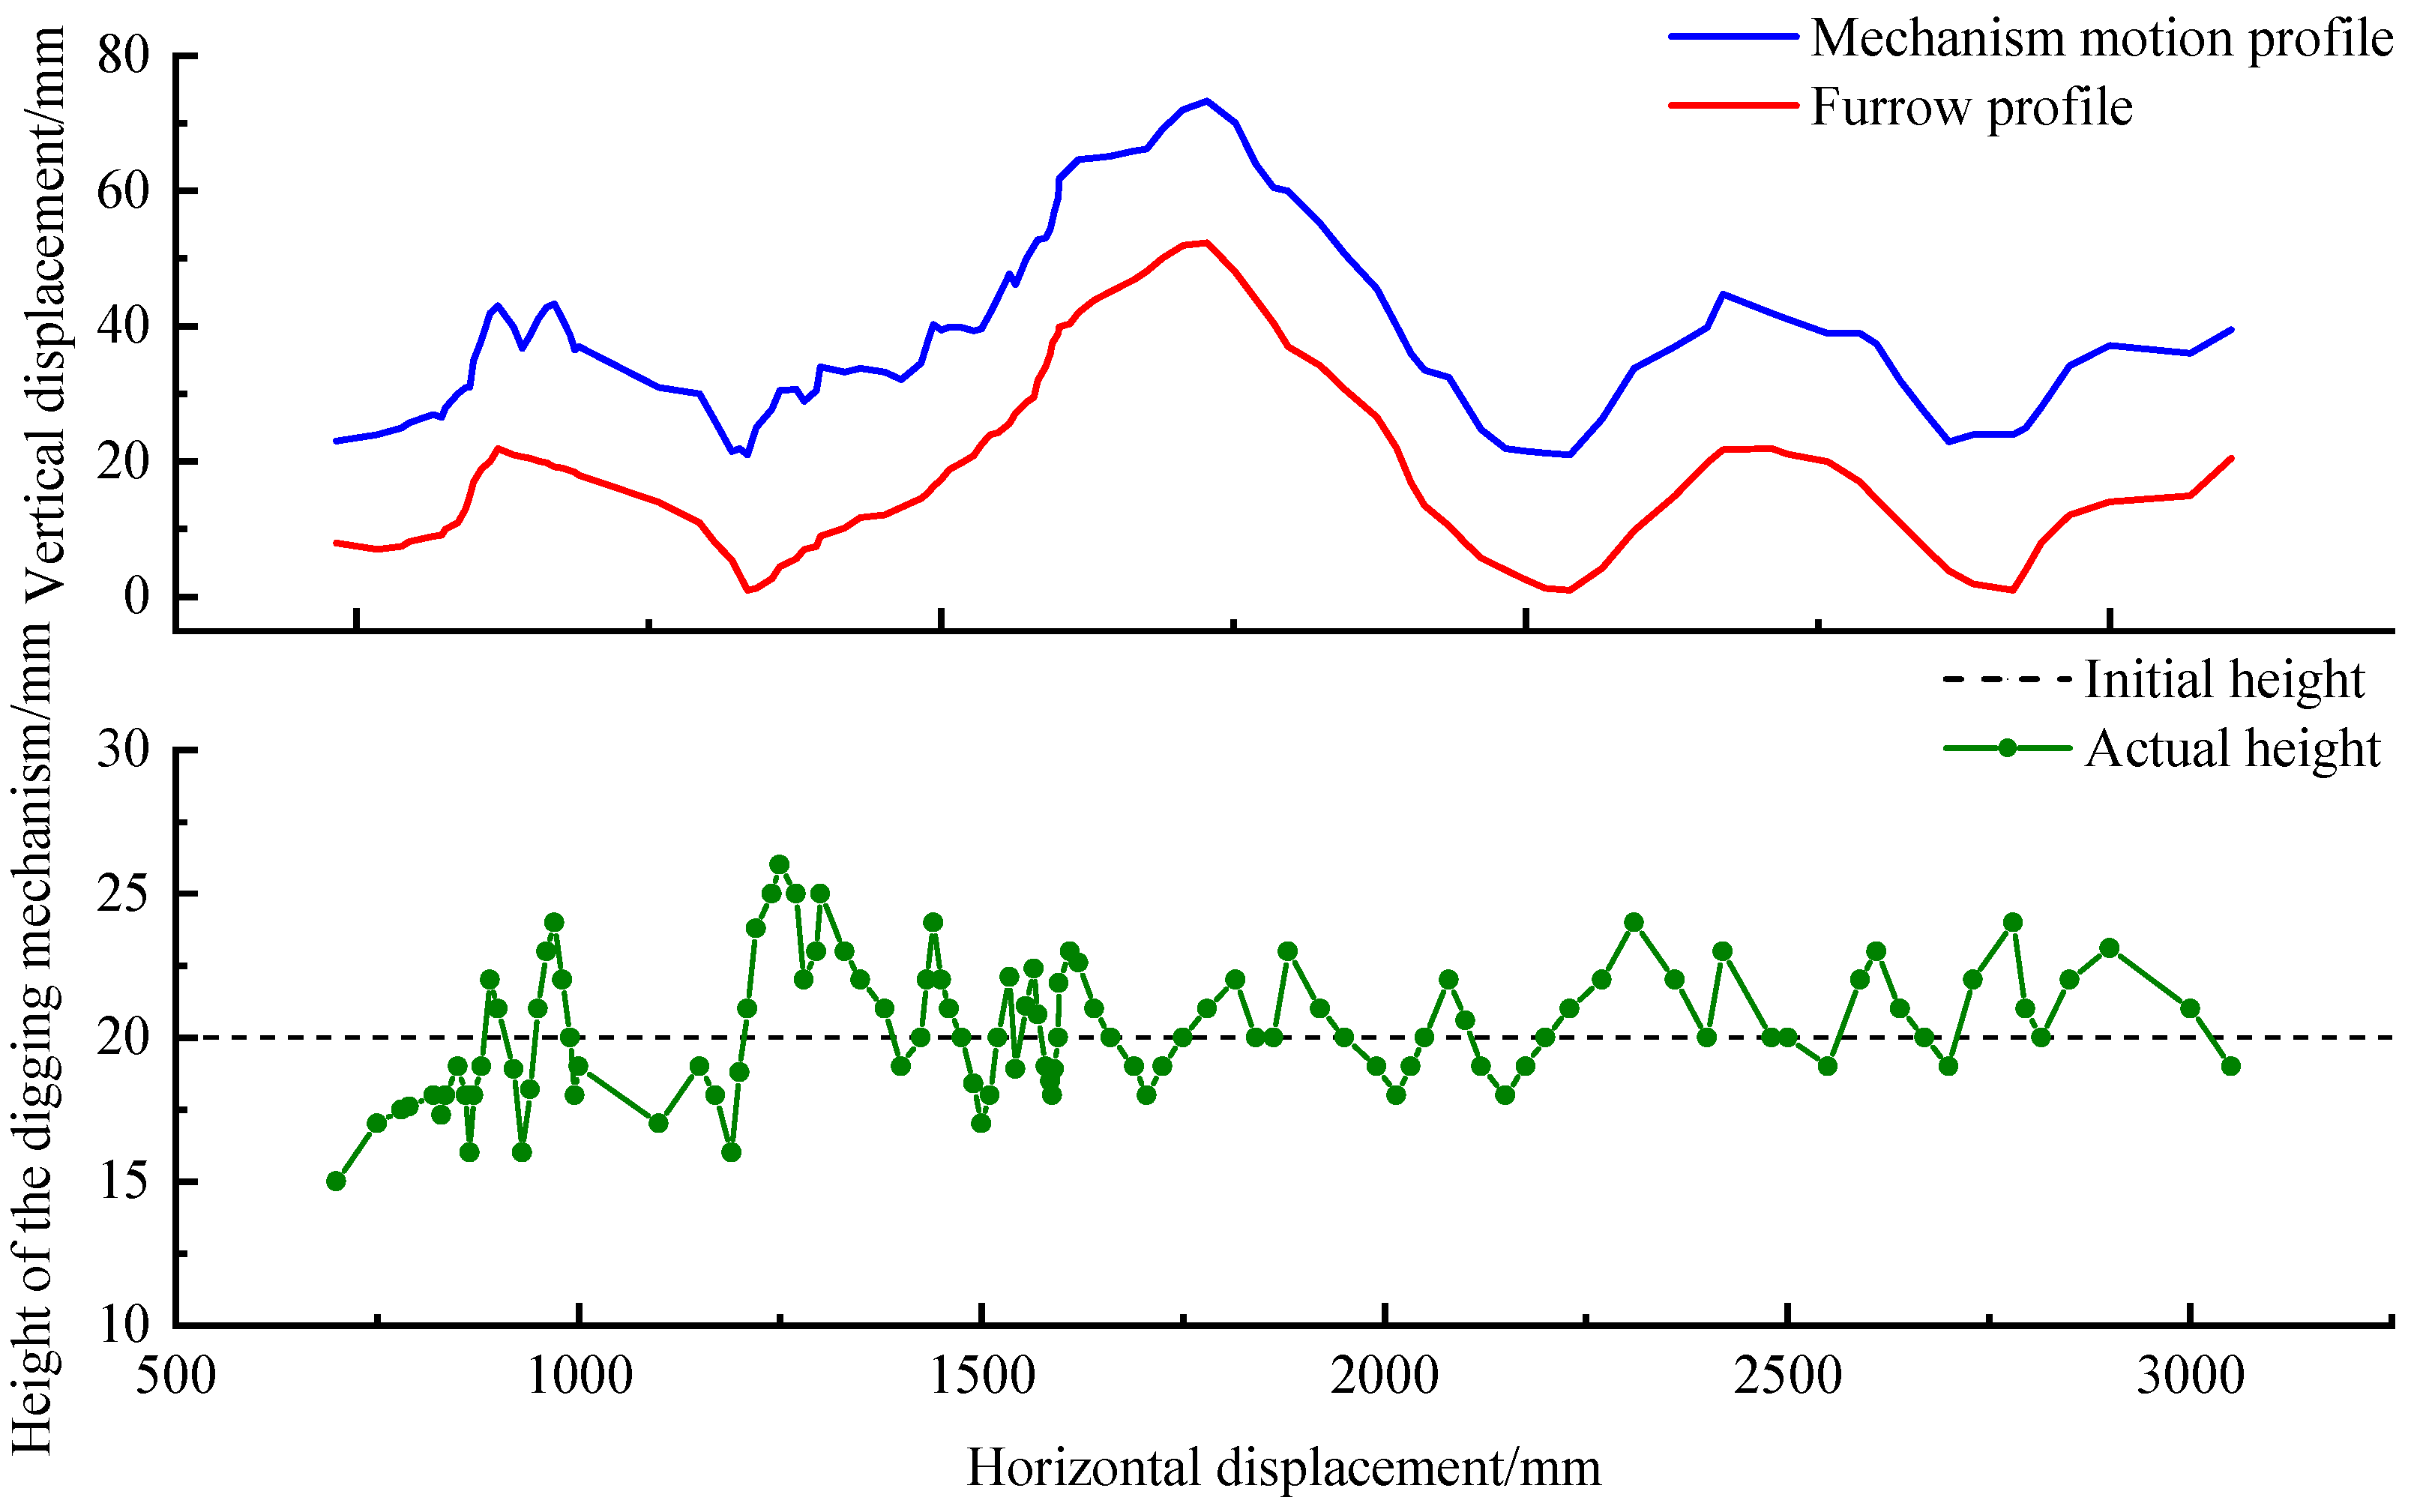
In order to explore the dynamic profiling performance of the ridge surface floating detection mechanism under undulating terrain, this study builds a virtual prototype model based on the multi-body dynamics software RecurDyn (2023). In the simulation process, the undulation range of the ridge surface is set to 0–80 mm, and the forward speed of the mechanism is 0.8 m/s. The driving function ‘800time’ is applied to the movement constraints of the profiling plate and the ridge surface to simulate the real travel process. In order to collect motion data, Marker_1 is set at the contact point between the profiling plate and the ground to extract the contour curve of the ridge surface, and Marker_2 is set at the front end of the profiling plate to record the motion trajectory of the mechanism, so as to provide the basis for the subsequent profiling accuracy analysis.
2.5.3. Control System Simulation Based on Simulink
In order to verify the performance of the designed fuzzy PID controller, this study builds a control system simulation model based on MATLAB/Simulink (R2020a) and compares it with traditional PID control. The PID initial parameters were obtained through a systematic trial-and-error approach. The simulation model uses a dual-step signal as the system input, with a simulation time of 15 s, aiming to compare the actual responses of different control algorithms to different target input commands. The input signal is shown in
Figure 9.
2.6. Field Test
In order to verify the actual operation effect of the designed automatic row-following device for carrot harvesters, this study conducted field experiments to investigate the influence of different experimental factors on the row-following accuracy and profiling capability of the lateral detection mechanism and the ridge surface floating detection mechanism, providing the basis for parameter optimization of the device.
2.6.1. Test Conditions and Evaluation Criteria
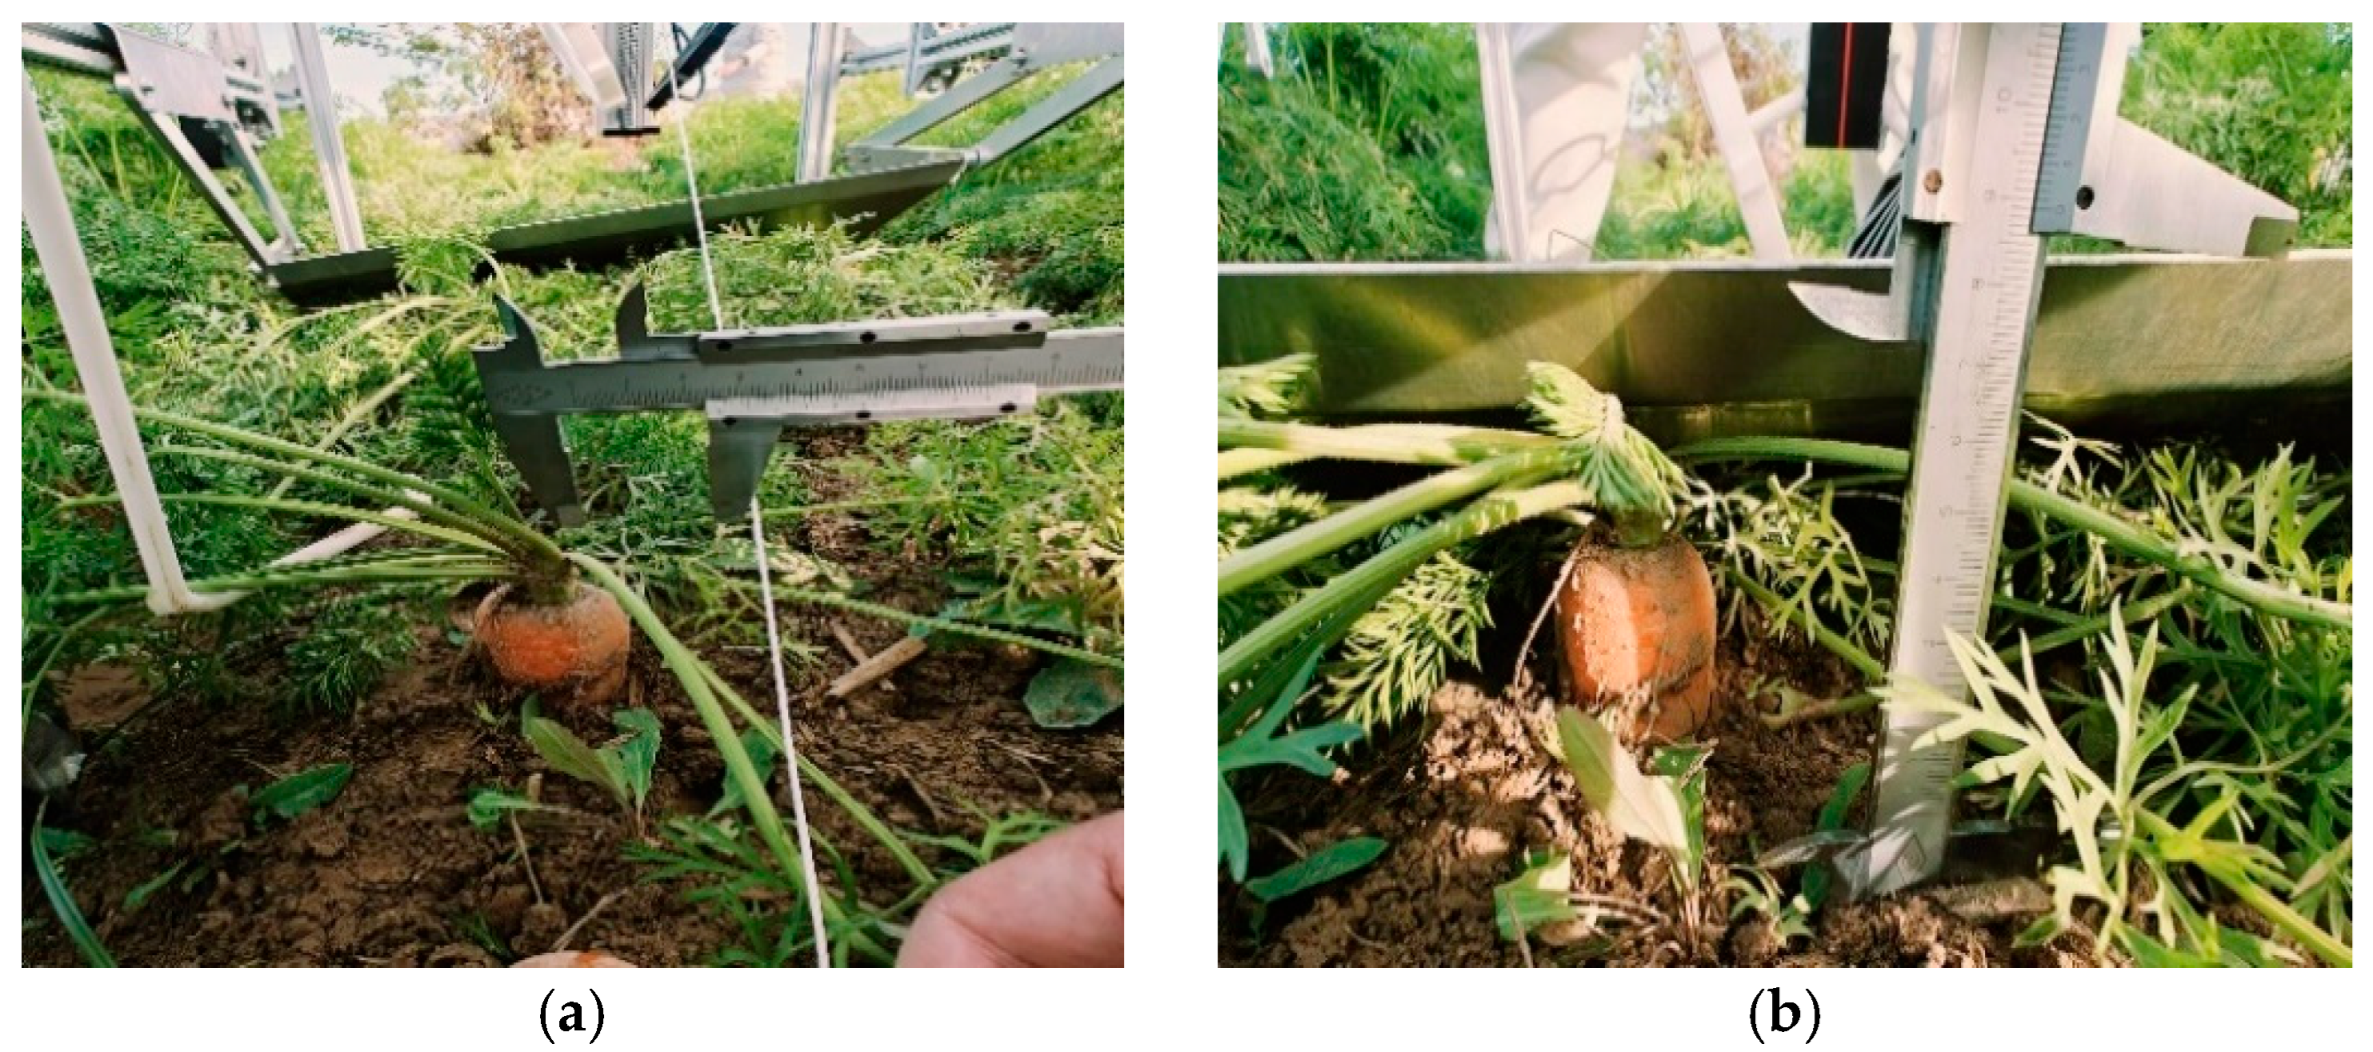
The field experiment of this study was conducted at the carrot planting base in Xiaoxian County, Suzhou City, Anhui Province. The carrots in the test area were planted using the single-ridge single-row cultivation method. The geometric specifications of the ridge are as follows: ridge bottom width 65 cm, ridge surface width 44 cm, ridge spacing 70 cm, and ridge height 19 cm. The average height of the carrot ridge surface was 3 cm, the average carrot depth was 19 cm, and the plant spacing was 10–15 cm. The test site is shown in
Figure 10.
In order to evaluate the harvesting operation quality of the carrot harvester, this study comprehensively considered the actual requirements of operational quality specifications and testing and established the mean lateral deviation and the mean vertical deviation as independent evaluation indices for the lateral detection mechanism and the ridge surface floating detection mechanism, respectively. The mean lateral deviation is defined as follows: After the carrot harvester achieves stable continuous operation, uniform sampling is conducted along the longitudinal direction of the carrot ridge, measuring the lateral distance between the centerline of the digging mechanism and the ideal carrot row at each sampling point. The average of the absolute values of these measurements constitutes this index. The mean vertical deviation is defined as follows: under the same conditions, the vertical height distance between the bottom surface of the digging component and the carrot ridge surface is measured at each sampling point, and the average of the absolute values of these measurements constitutes this index. The measurement method is shown in
Figure 11. The specific calculation formulas are as follows:
Among the above variables, is the mean lateral deviation, cm; is the mean vertical deviation, cm; is the number of sampling points; is the lateral deviation at the i-th sampling point, cm; and is the vertical deviation at the i-th sampling point, cm.
2.6.2. Experimental Design
Response Surface Experimental Design for the Lateral Detection Mechanism
To optimize the working performance of the lateral detection mechanism, this study employs the Box–Behnken central composite design principle, selecting forward speed (A), motor speed (B), and spring stiffness (C) as experimental factors. Each factor is set at three levels, with specific factor levels presented in
Table 3. A total of 17 experimental points were designed, and the interaction effects of various factors on detection performance were analyzed using response surface methodology. The experimental data were processed using professional statistical analysis software to determine the optimal working parameter combination for the mechanism.
Response Surface Methodology for the Ridge Surface Floating Detection Mechanism
For the ridge surface floating detection mechanism, based on the Box–Behnken experimental design method, a three-factor three-level experimental scheme was established with forward speed (A), motor speed (B), and initial height of the profiling plate (C) as independent variables. The factor levels are shown in
Table 4. This study arranged a total of 17 experimental groups to investigate the influence of various parameters on the floating profiling performance through response surface analysis. The data were processed using statistical software to determine the optimal parameter configuration for the mechanism.
3. Results and Analysis
3.1. Measurement Results of Carrot Physical Parameters
The agronomic parameters of carrots were measured, and the obtained physical parameters are presented in
Table 5.
3.2. Results and Analysis of Static Analysis
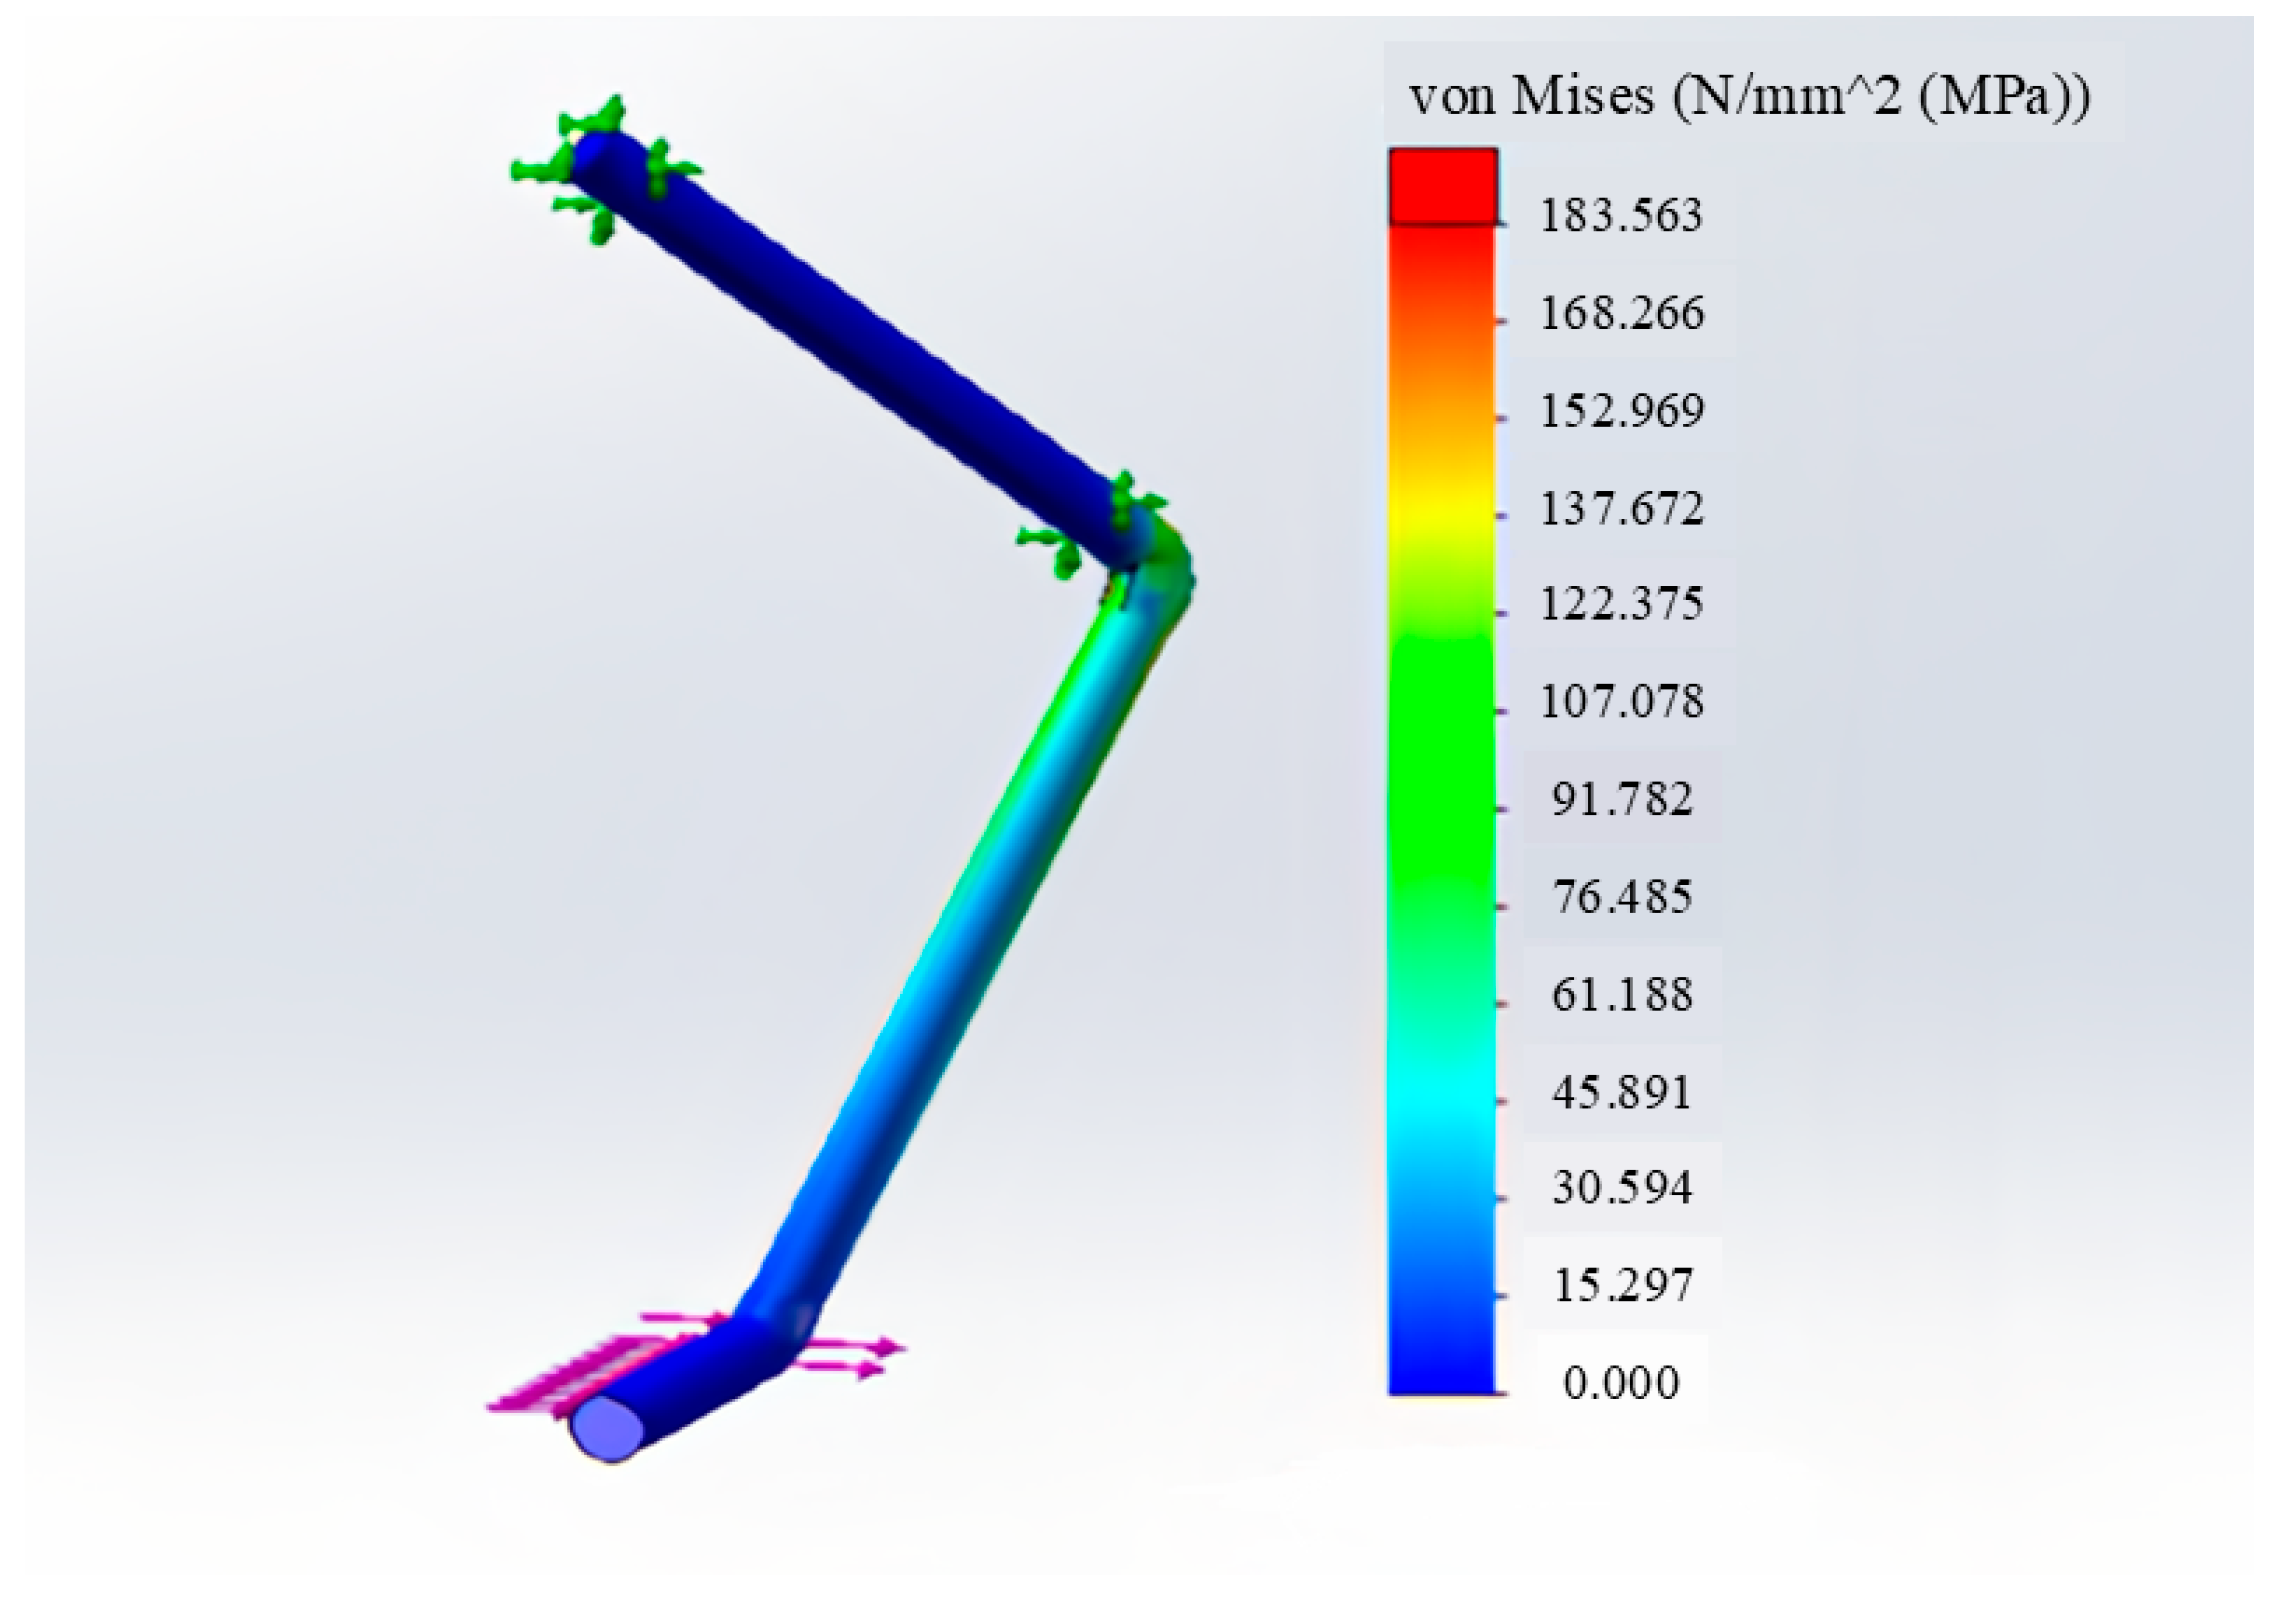
In the established simulation environment, static analysis was performed on the detection rod of the lateral detection mechanism. The stress contour and displacement contour of the detection rod are shown in
Figure 12 and
Figure 13. The results indicate that the maximum equivalent stress of the detection rod is 183.563 MPa, and the maximum elastic deformation displacement is 0.9289 mm.
In terms of strength, according to the material properties of the detection rod, the yield strength of Q235A is 235 MPa. The analyzed maximum stress does not exceed the material’s yield limit, and the calculated safety factor equals 1.28, indicating a certain safety margin for the structure. In terms of stiffness, the deformation displacement of 0.9289 mm is minimal, and its impact on the measurement results of the angular displacement sensor after mechanism conversion is essentially negligible, thereby ensuring the accuracy of the detection rod offset detection.
3.3. Results and Analysis of Dynamc Simulation
Based on the established simulation environment, the dynamic simulation results of the ridge surface floating mechanism are shown in
Figure 14. It can be observed that the trajectory of the profiling plate generally follows the variation trend of the ridge contour, indicating that the ridge surface floating mechanism can effectively track the terrain under fluctuating ridge conditions, demonstrating the expected profiling performance. Using an initial digging mechanism height of 20 mm as the reference, the trajectory data of the two marker points were processed and analyzed. The difference between the two trajectories represents the actual height of the digging mechanism. The comparison results are shown in the graph. The results indicate that the actual digging mechanism height remains stable within the range of 15–26 mm. The maximum positive deviation of the digging mechanism height is 6 mm, the maximum negative deviation is −5 mm, and the average absolute deviation is 1.78 mm. These results demonstrate that the deviation meets the performance requirements of the ridge surface profiling mechanism and validates the rationality of the mechanism design.
3.4. Simulation Results and Analysis of Control Algorithm
In the established simulation environment, the fuzzy PID control employed in this study is compared with traditional PID control. The system response under a double-step signal input is shown in
Figure 15. The results demonstrate that, in terms of dynamic response, the fuzzy PID exhibits a superior response speed and stability. Specifically, during the two step–response phases, the settling times are 0.44 s and 0.41 s, respectively. Compared to the traditional PID control, which has settling times of 1.67 s and 1.45 s, the fuzzy PID achieves a speed improvement of over 70%. Additionally, the traditional PID control shows overshoots of 6% and 3% in the two responses, respectively, while the fuzzy PID control exhibits no significant overshoot.
In terms of system robustness, under different step responses, the performance metrics of traditional PID control vary considerably, whereas the fuzzy PID control enables adaptive parameter adjustments, resulting in nearly identical response characteristics under both step conditions. This reflects the algorithm’s consistency across different working conditions. The results indicate that, compared to traditional PID control, the fuzzy PID control effectively suppresses system overshoot while enhancing the response speed and demonstrates a superior control stability under varying working conditions.
3.5. Results and Analysis of Regression and Response Surface for the Lateral Detection Mechanism
3.5.1. Regression Results and Analysis for the Lateral Detection Mechanism
The forward speed, motor speed, and spring stiffness are used as independent variables
A,
B, and
C, and the mean lateral deviation is used as the target response value Y for regression modeling. The regression analysis results are shown in
Table 6. Finally, a quadratic polynomial regression equation was constructed (only significant influencing factors were retained, that is,
p < 0.005):
The results of
Table 6 show that the overall regression model is statistically highly significant, with a significance level of
p < 0.0001. The lack-of-fit test yields a
p-value of 0.2096 (>0.05), indicating that the lack-of-fit is not significant, indicating that the model fits well and can support the response value prediction based on the regression equation. In addition, the model regression coefficient
R2 = 0.9960 and the adjusted regression coefficient
R2 = 0.9909, indicating that 99.09% of the data can be used to explain the model, reflecting that the regression equation has a high prediction reliability and data fitting efficiency.
It can be seen that the linear terms of motor speed, forward speed, and spring stiffness have a highly significant impact on the mean lateral deviation (p < 0.01). The main effect relationship of each factor is as follows: B > A > C, that is, motor speed > forward speed > spring stiffness. The second-order interaction terms AB and AC have a highly significant effect on the mean lateral deviation (p < 0.01), while BC has no significant effect on the mean lateral deviation (p > 0.05).
3.5.2. Response Surface Results and Analysis for the Lateral Detection Mechanism
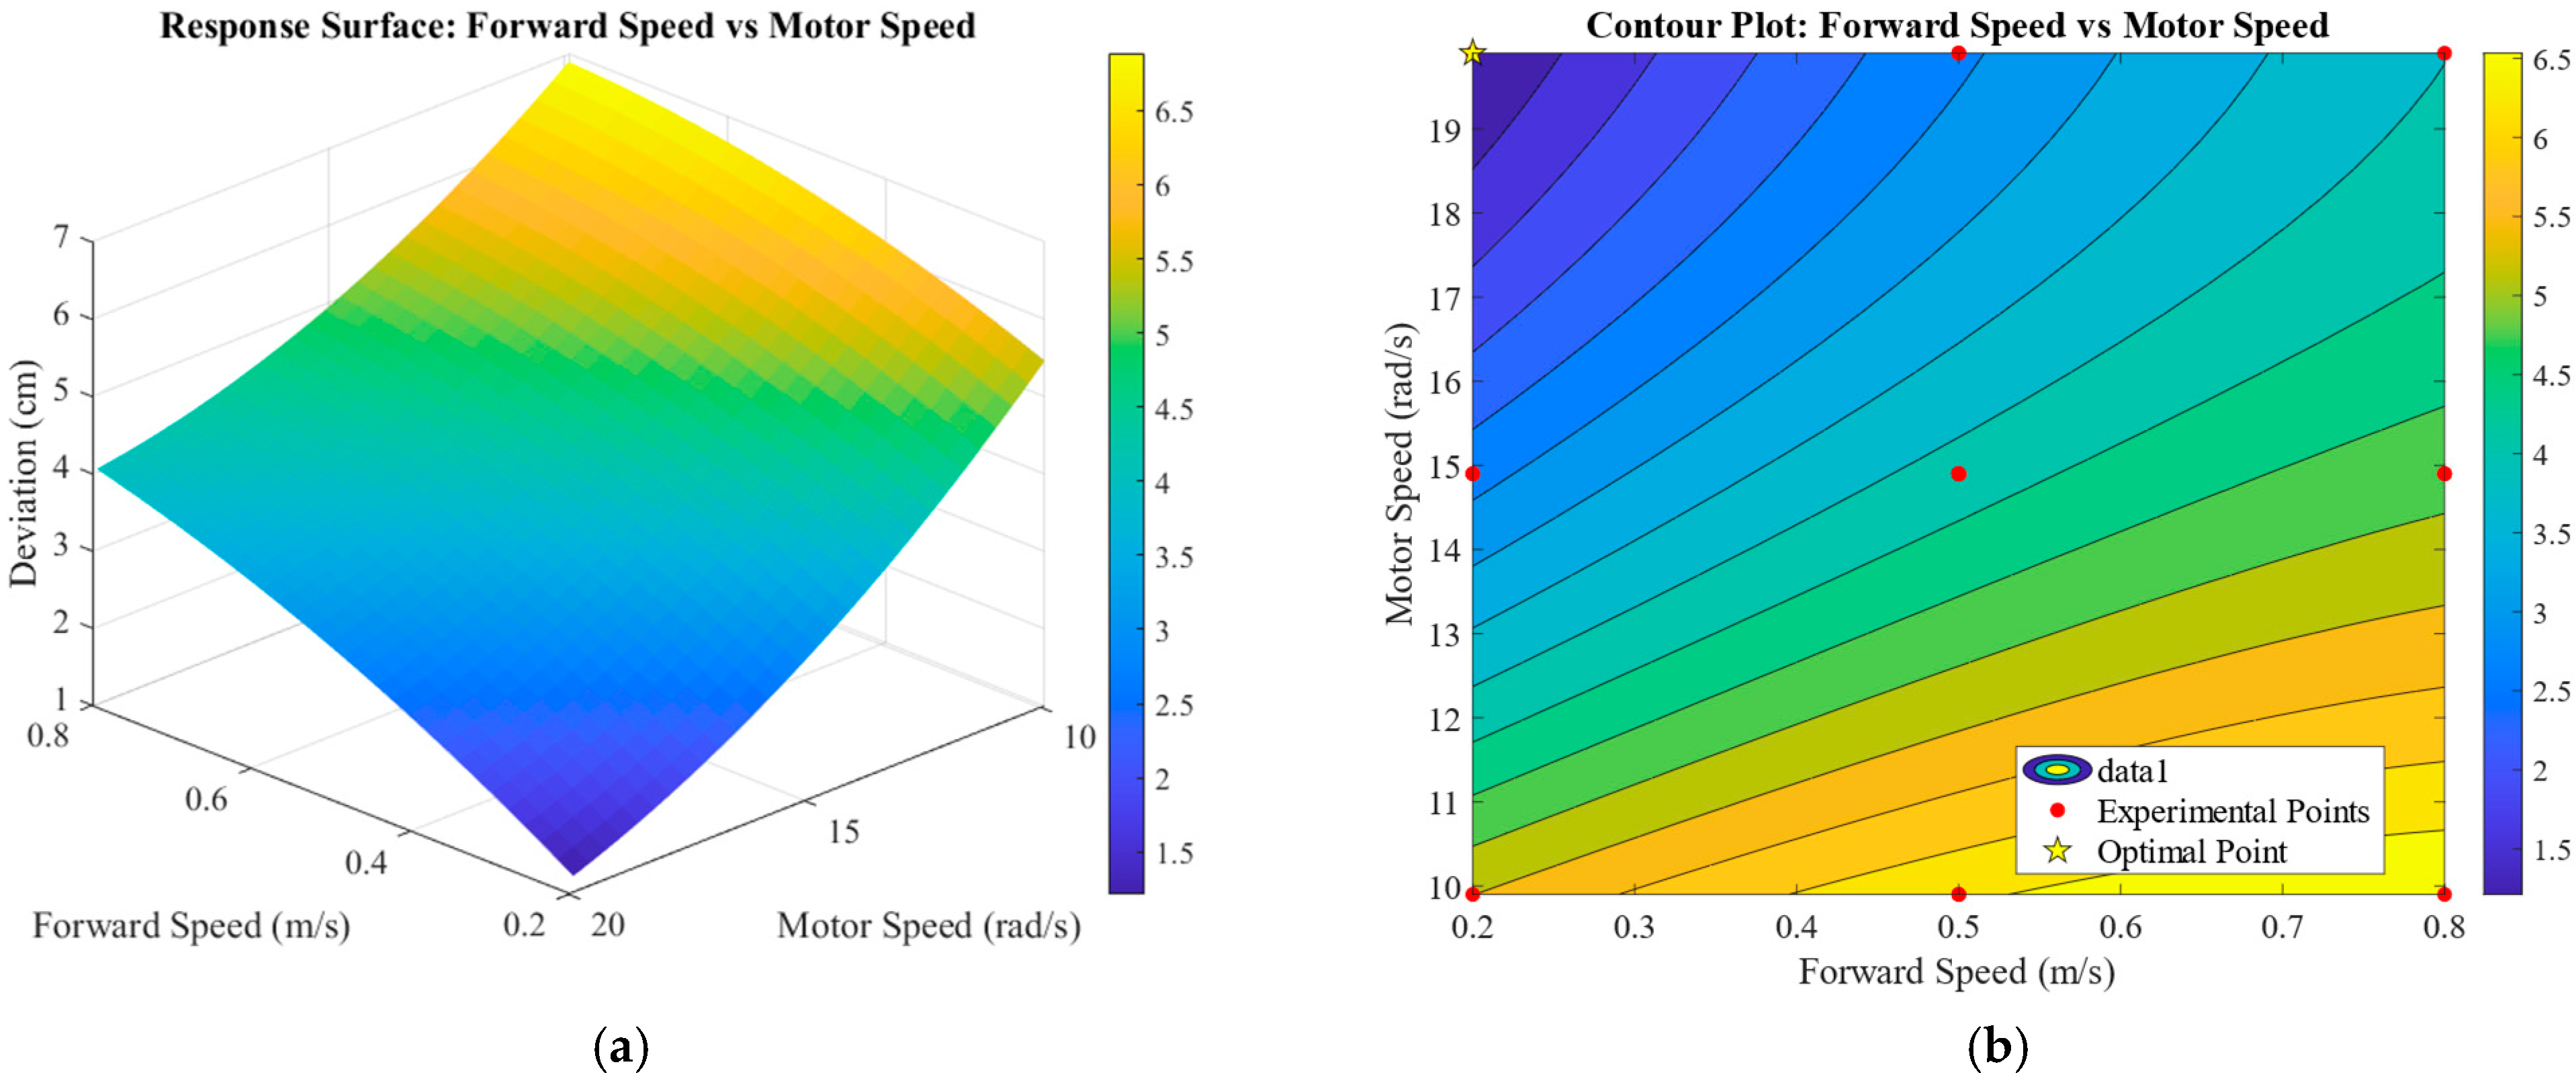
The interaction between forward speed and motor speed is shown in
Figure 16. When the forward speed is in the lower range, the gradient of the mean lateral deviation decreases with increasing motor speed and then gradually levels off. In contrast, when the forward speed increases to a higher level, this gradient first declines rapidly and then stabilizes. Furthermore, the overall slope of the response surface becomes progressively steeper as the forward speed increases, indicating that the synergistic effect of these two variables on the response value intensifies at higher speeds.
These observed characteristics collectively demonstrate a significant interaction between forward speed and motor speed. Under the condition of considering only their interaction, the mean lateral deviation reaches its minimum value when the forward speed is approximately 0.2–0.35 m/s and the motor speed is within the range of 17.9–19.9 rad/s. The steeper gradient associated with changes in motor speed, compared to that of forward speed, indicates that motor speed has a greater influence on the mean lateral deviation than forward speed does.
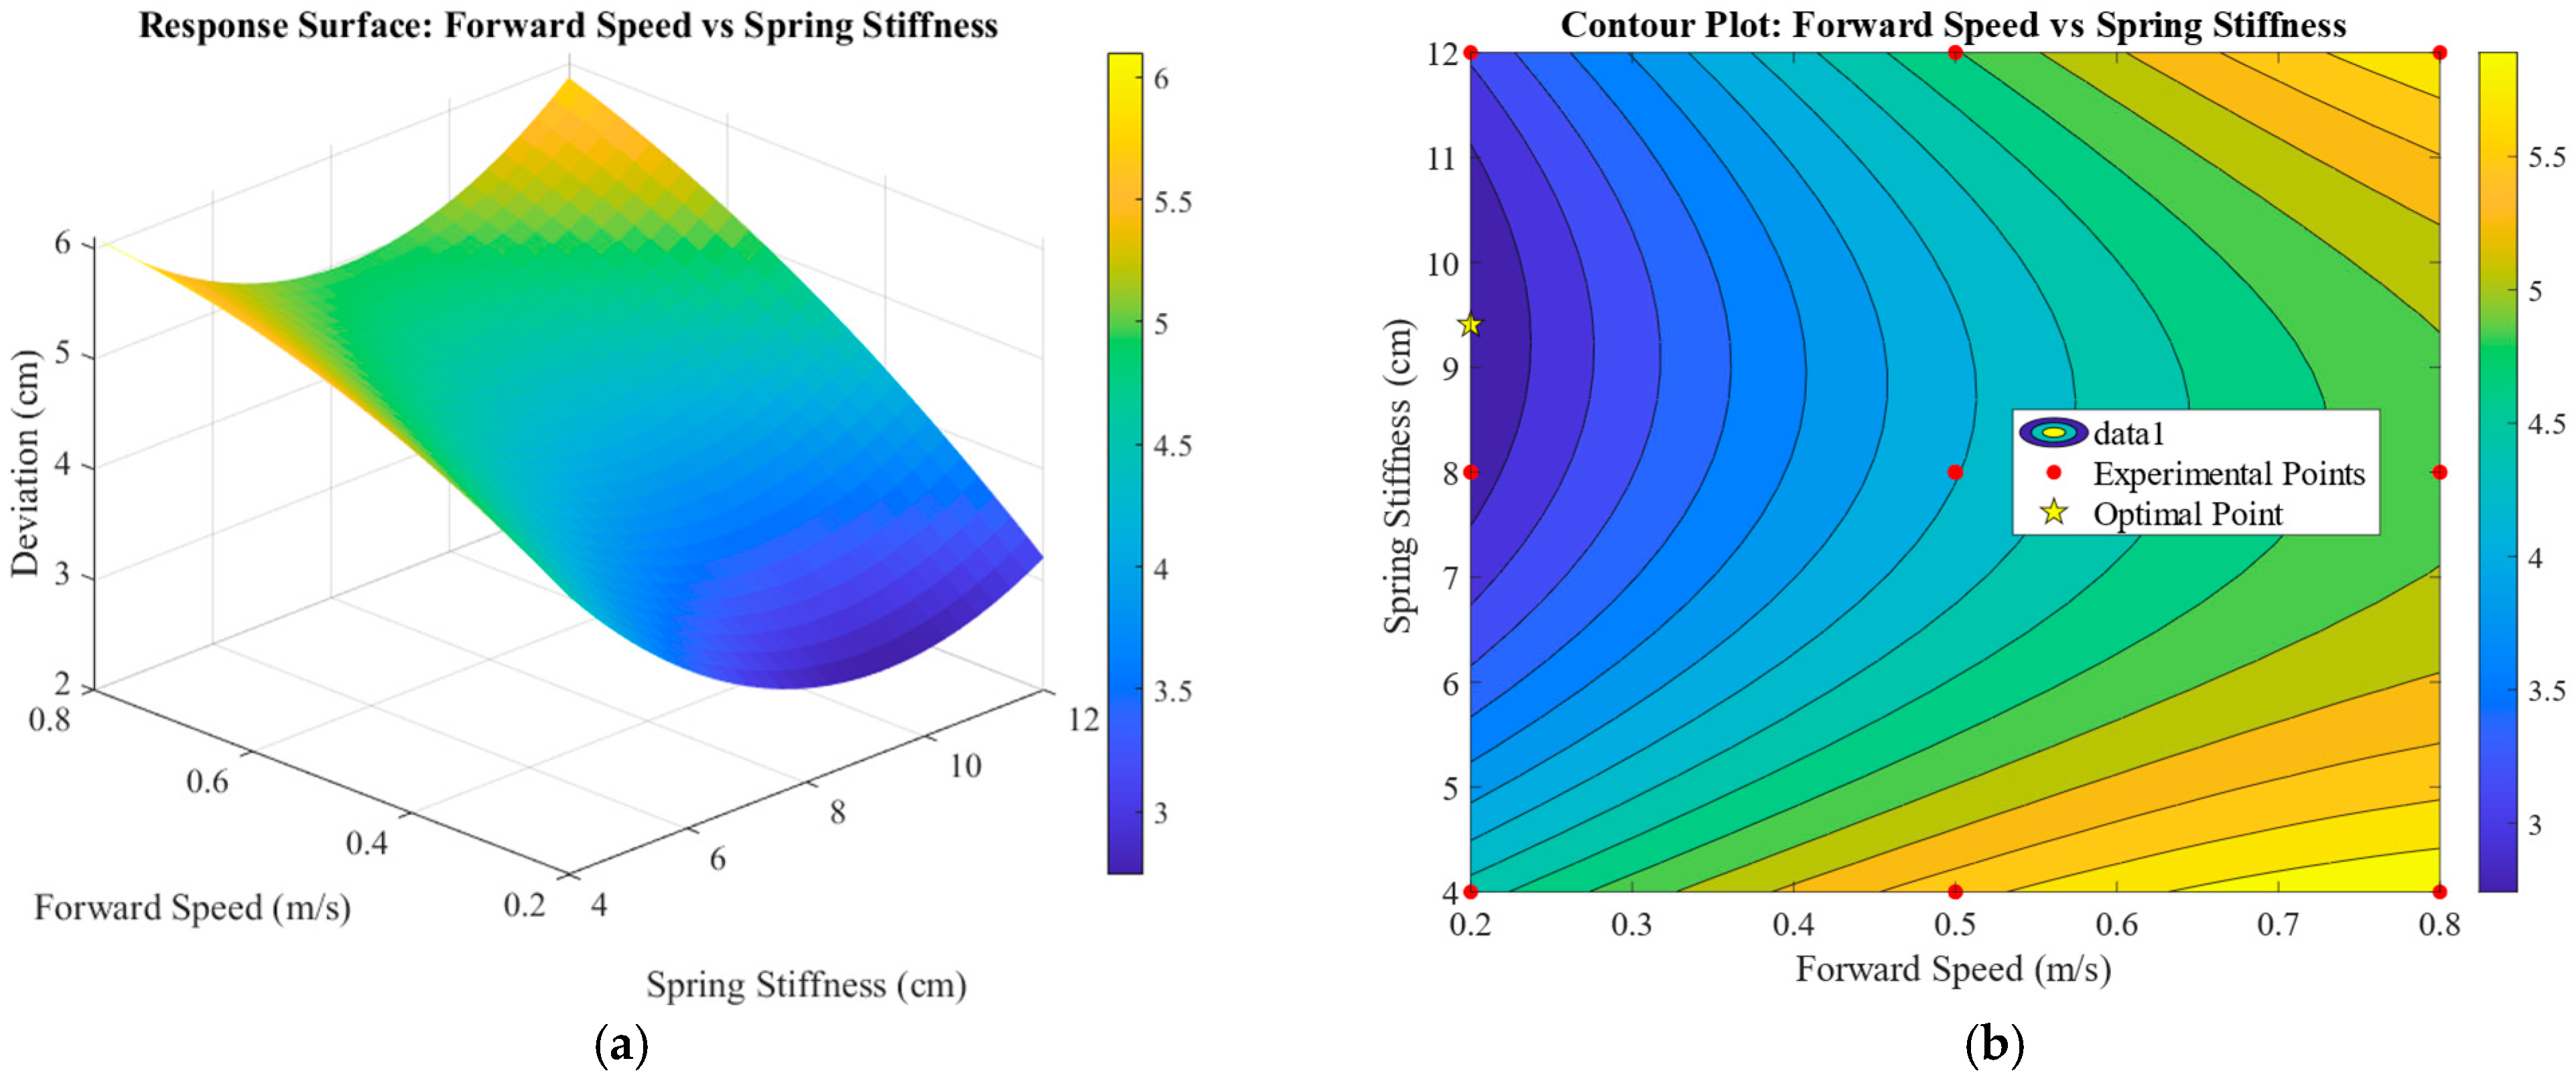
The interaction effect between forward speed and spring stiffness is shown in
Figure 17. Within the response surface representing the
AC interaction, the gradient of change in the mean lateral deviation exhibits a progressively steeper trend as the forward speed increases. This indicates that the synergistic effect of these two factors on the response value intensifies with higher speeds. Concurrently, the rate of change demonstrates a non-linear relationship with increasing spring stiffness, characterized by an initial gradual decrease followed by a gradual increase. This pattern reflects that the influence of spring stiffness on the response value is relatively moderate within the intermediate range but becomes more pronounced at the extremes. Furthermore, the magnitude of change in the gradient of the mean lateral deviation as spring stiffness increases varies depending on the specific value of the forward speed. This observation confirms the existence of a significant interaction between forward speed and spring stiffness.
Under the condition of considering only their interaction, the mean lateral deviation reaches its minimum value when the forward speed is approximately 0.2–0.35 m/s and the spring stiffness falls within the range of 8–12 N/cm. The steeper gradient associated with changes in forward speed, compared to that of spring stiffness, indicates that forward speed exerts a greater influence on the mean lateral deviation than spring stiffness does.
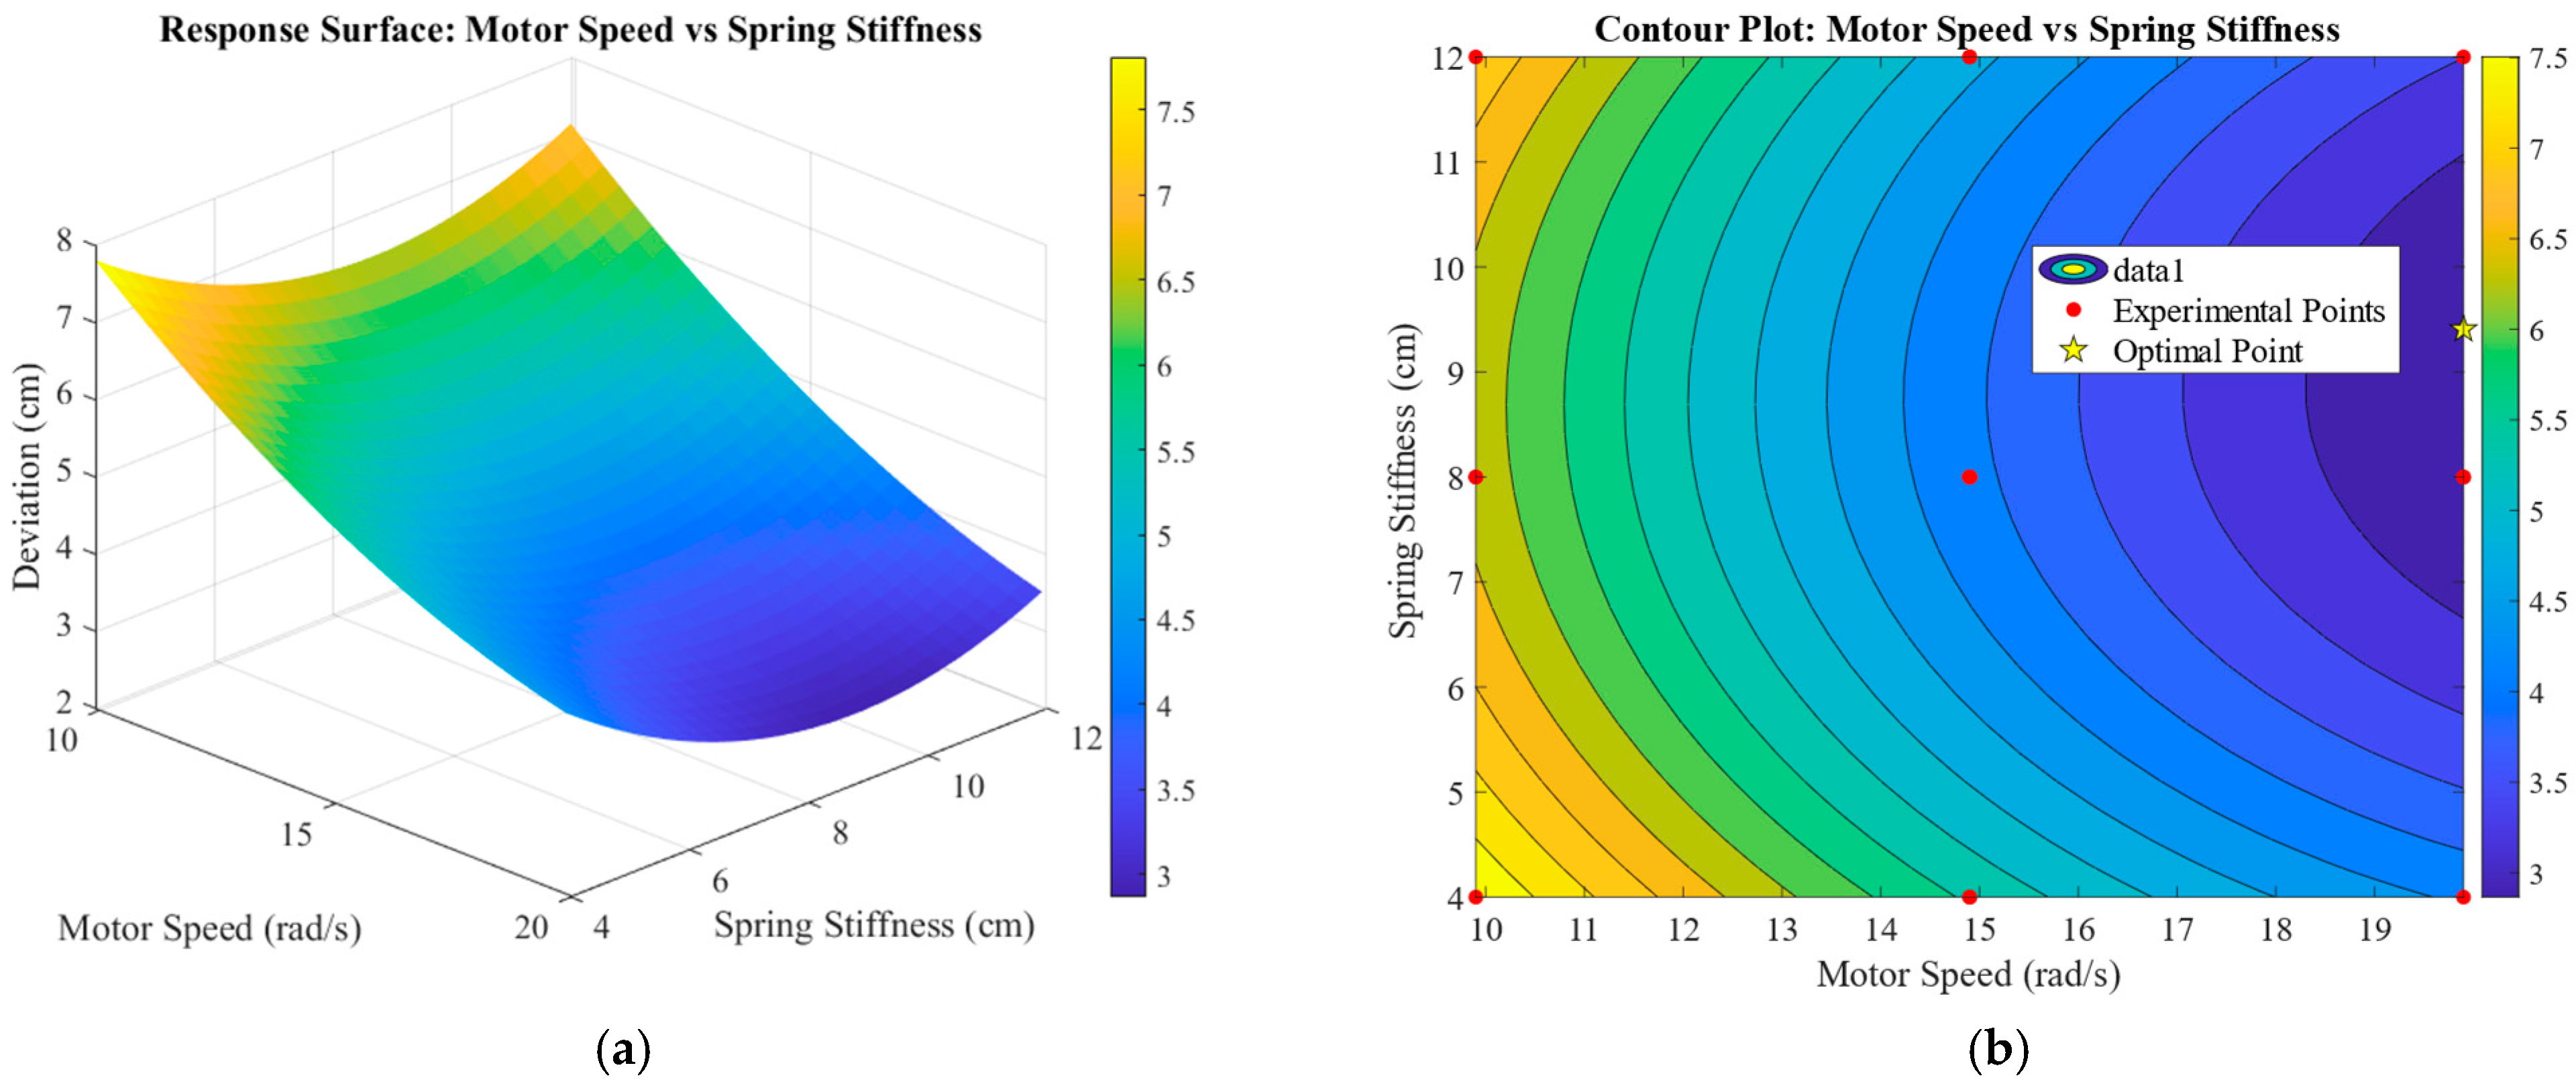
The interaction between motor speed and spring stiffness is shown in
Figure 18. Within the
BC interaction response surface, the gradient of change in the mean lateral deviation exhibits an initial decrease followed by an increase as the spring stiffness increases. This pattern indicates that the interactive effect of these two factors is relatively moderate within the medium stiffness range but becomes significantly enhanced at the extreme stiffness values. Simultaneously, the gradient of change demonstrates a gradual decreasing trend with increasing motor speed, suggesting that higher motor speeds attenuate the influence of spring stiffness on the response value.
Under the condition of considering only their interaction, the mean lateral deviation reaches its minimum value when the motor speed is within the range of 17.9–19.9 rad/s and the spring stiffness falls between 6 and 10 N/cm. The steeper gradient associated with changes in motor speed, compared to that of spring stiffness, indicates that motor speed has a greater influence on the mean lateral deviation than spring stiffness does.
3.6. Results and Analysis of Regression and Response Surface for the Ridge Surface Floating Detection Mechanism
3.6.1. Regression Results and Analysis for the Ridge Surface Floating Detection Mechanism
The forward speed, motor speed, and initial height of the profiling plate are used as independent variables
A,
B, and
C, and the mean vertical deviation is used as the target response value
Y for regression modeling. The regression analysis results are shown in
Table 7. Finally, a quadratic polynomial regression equation was constructed (only significant influencing factors were retained, that is,
p < 0.005):
As can be seen from
Table 7, the overall regression model is highly statistically significant (
p < 0.0001), while its lack-of-fit term is not significant (
p = 0.4883 > 0.05). The coefficient of determination (
R2) is 0.9880, and the adjusted
R2 is 0.9725, indicating that 97.25% of the data variability can be explained by the model. This demonstrates the relatively high reliability of the regression equation.
An analysis of the relevant data indicates that the linear terms of forward speed, motor speed, and initial profiling plate height have a highly significant influence on the mean vertical deviation (p < 0.01). Based on the magnitude of the F-values, the order of primary factor effects is A > B > C; that is, forward speed has the greatest influence, followed by motor speed, and then the initial profiling plate height. Among the quadratic interaction terms, the AC interaction has a highly significant effect on the mean vertical deviation (p < 0.01), while the effects of the AB and BC interactions are not significant (p > 0.05).
3.6.2. Response Surface Results and Analysis for the Ridge Surface Floating Detection Mechanism
The interaction between forward speed and motor speed is shown in
Figure 19. The rate of change in the mean vertical deviation decreases gradually as the motor speed increases, while the mean vertical deviation itself increases progressively with higher forward speed. Under the condition of considering only their interaction, the mean vertical deviation reaches its minimum value when the forward speed is approximately 0.2–0.35 m/s and the motor speed is within the range of 32.65–34.9 rad/s. The steeper gradient associated with forward speed, compared to that of motor speed, indicates that forward speed has a greater influence on the mean vertical deviation than motor speed does.
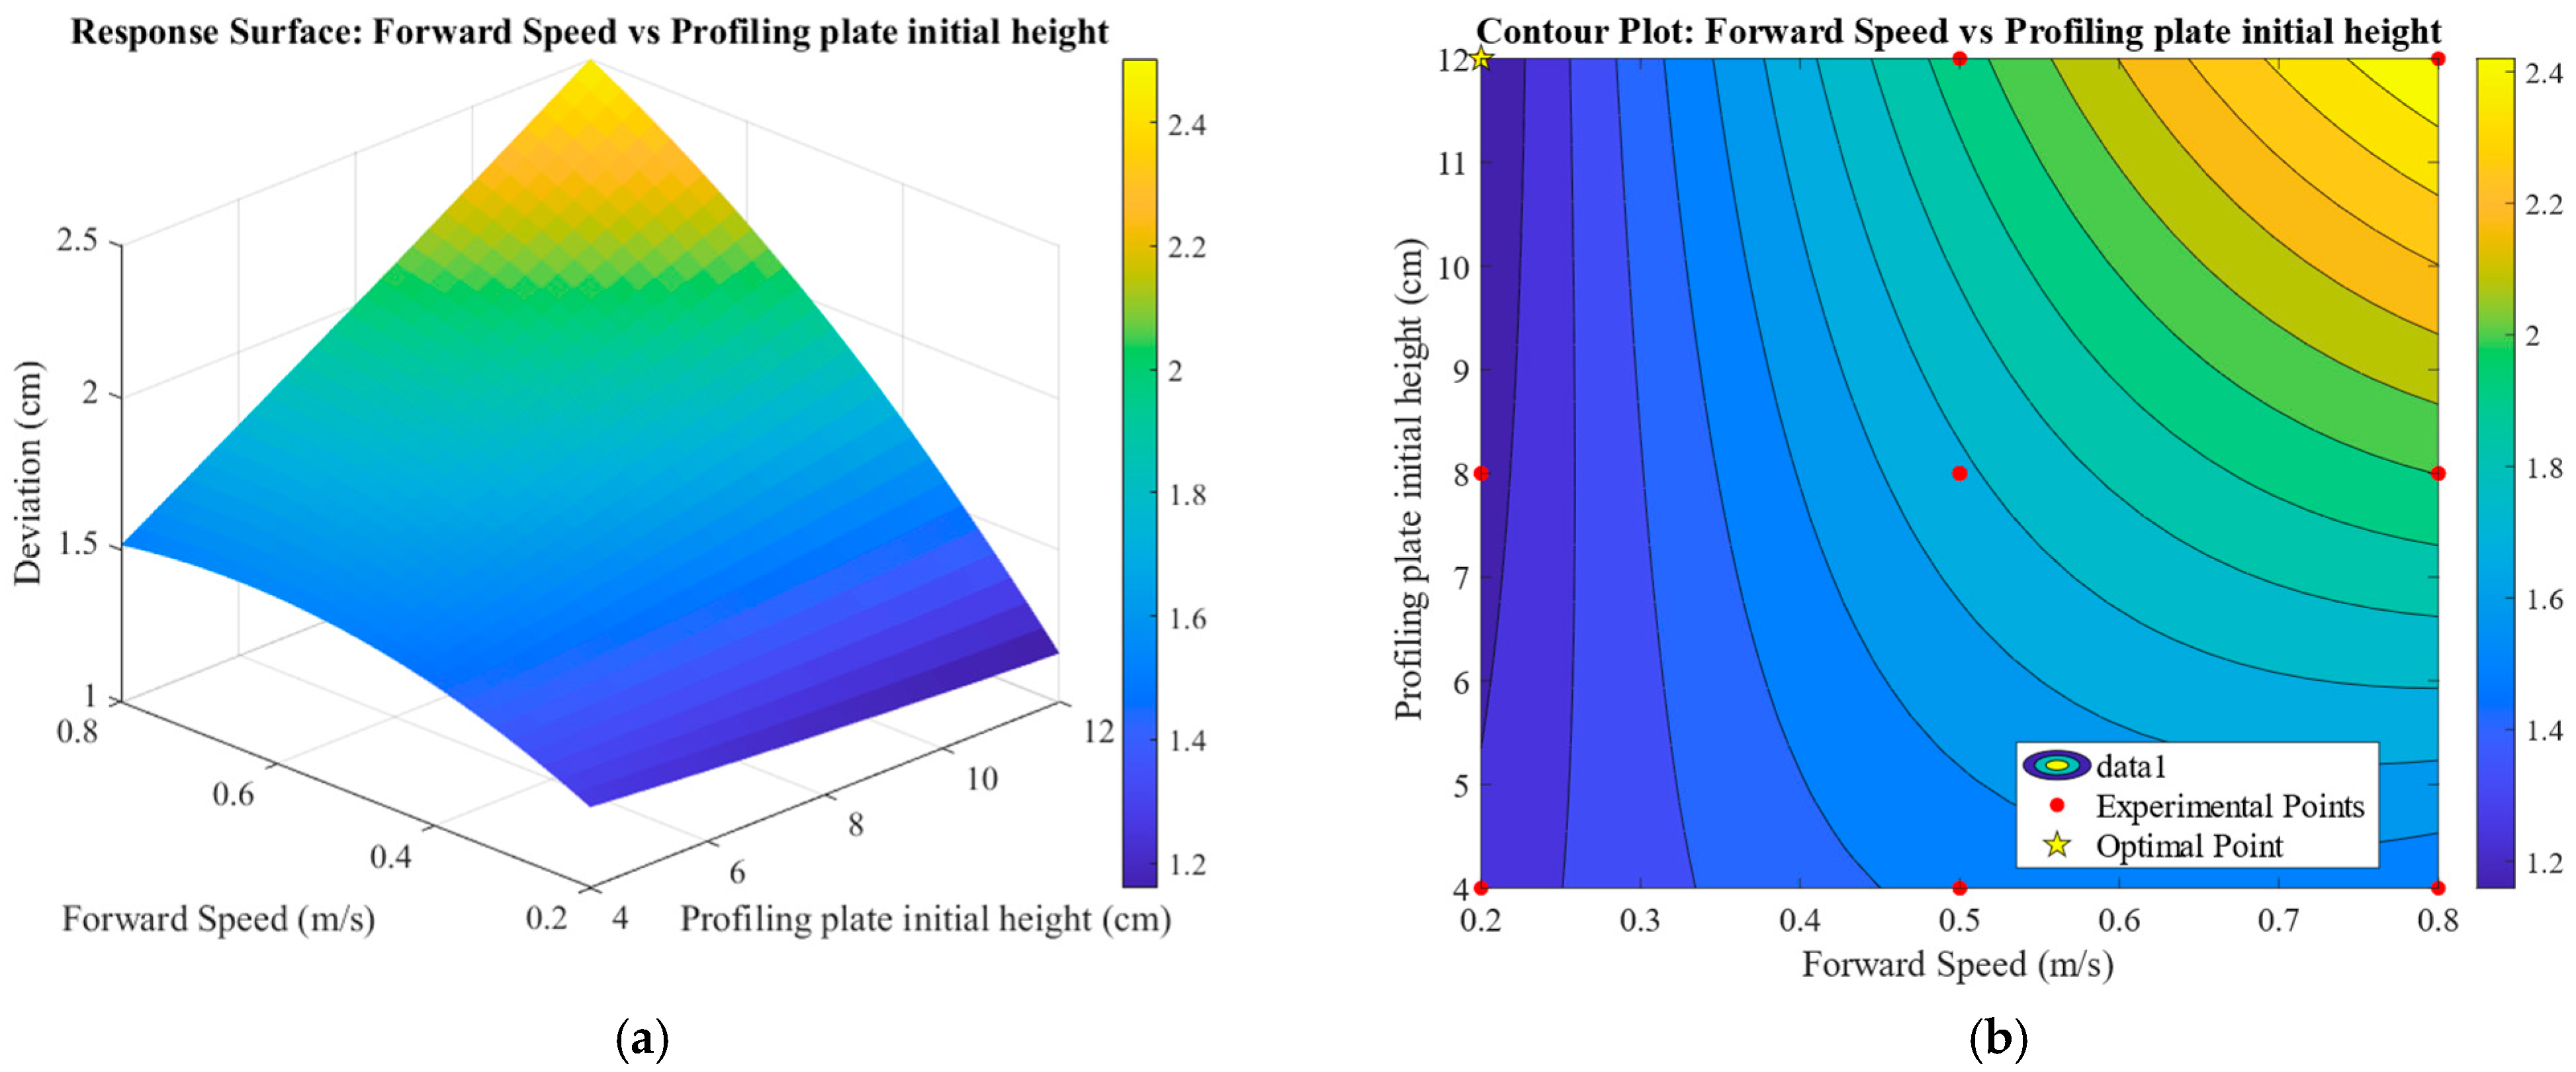
The interaction between forward speed and the initial height of the profiling plate is shown in
Figure 20. The mean vertical deviation exhibits a gradual increase with rising forward speed. When the forward speed is small, the rate of change in the mean vertical deviation shows a gentle trend as the initial height of the profiling plate increases. Conversely, when the forward speed is large, the rate of change in the mean vertical deviation demonstrates a gradually increasing trend with the increase in the initial height of the profiling plate.
These patterns collectively indicate a significant interaction between the initial height of the profiling plate and the forward speed. When considering only the interaction between these two factors, the mean vertical deviation reaches its minimum value within the approximate ranges of 0.2–0.35 m/s for forward speed and 8–12 cm for the initial height of the profiling plate. The steeper gradient associated with forward speed, compared to that of the initial height of the profiling plate, indicates that forward speed has a greater influence on the mean vertical deviation than the initial height of the profiling plate does.
The interaction between motor speed and the initial height of the profiling plate is shown in
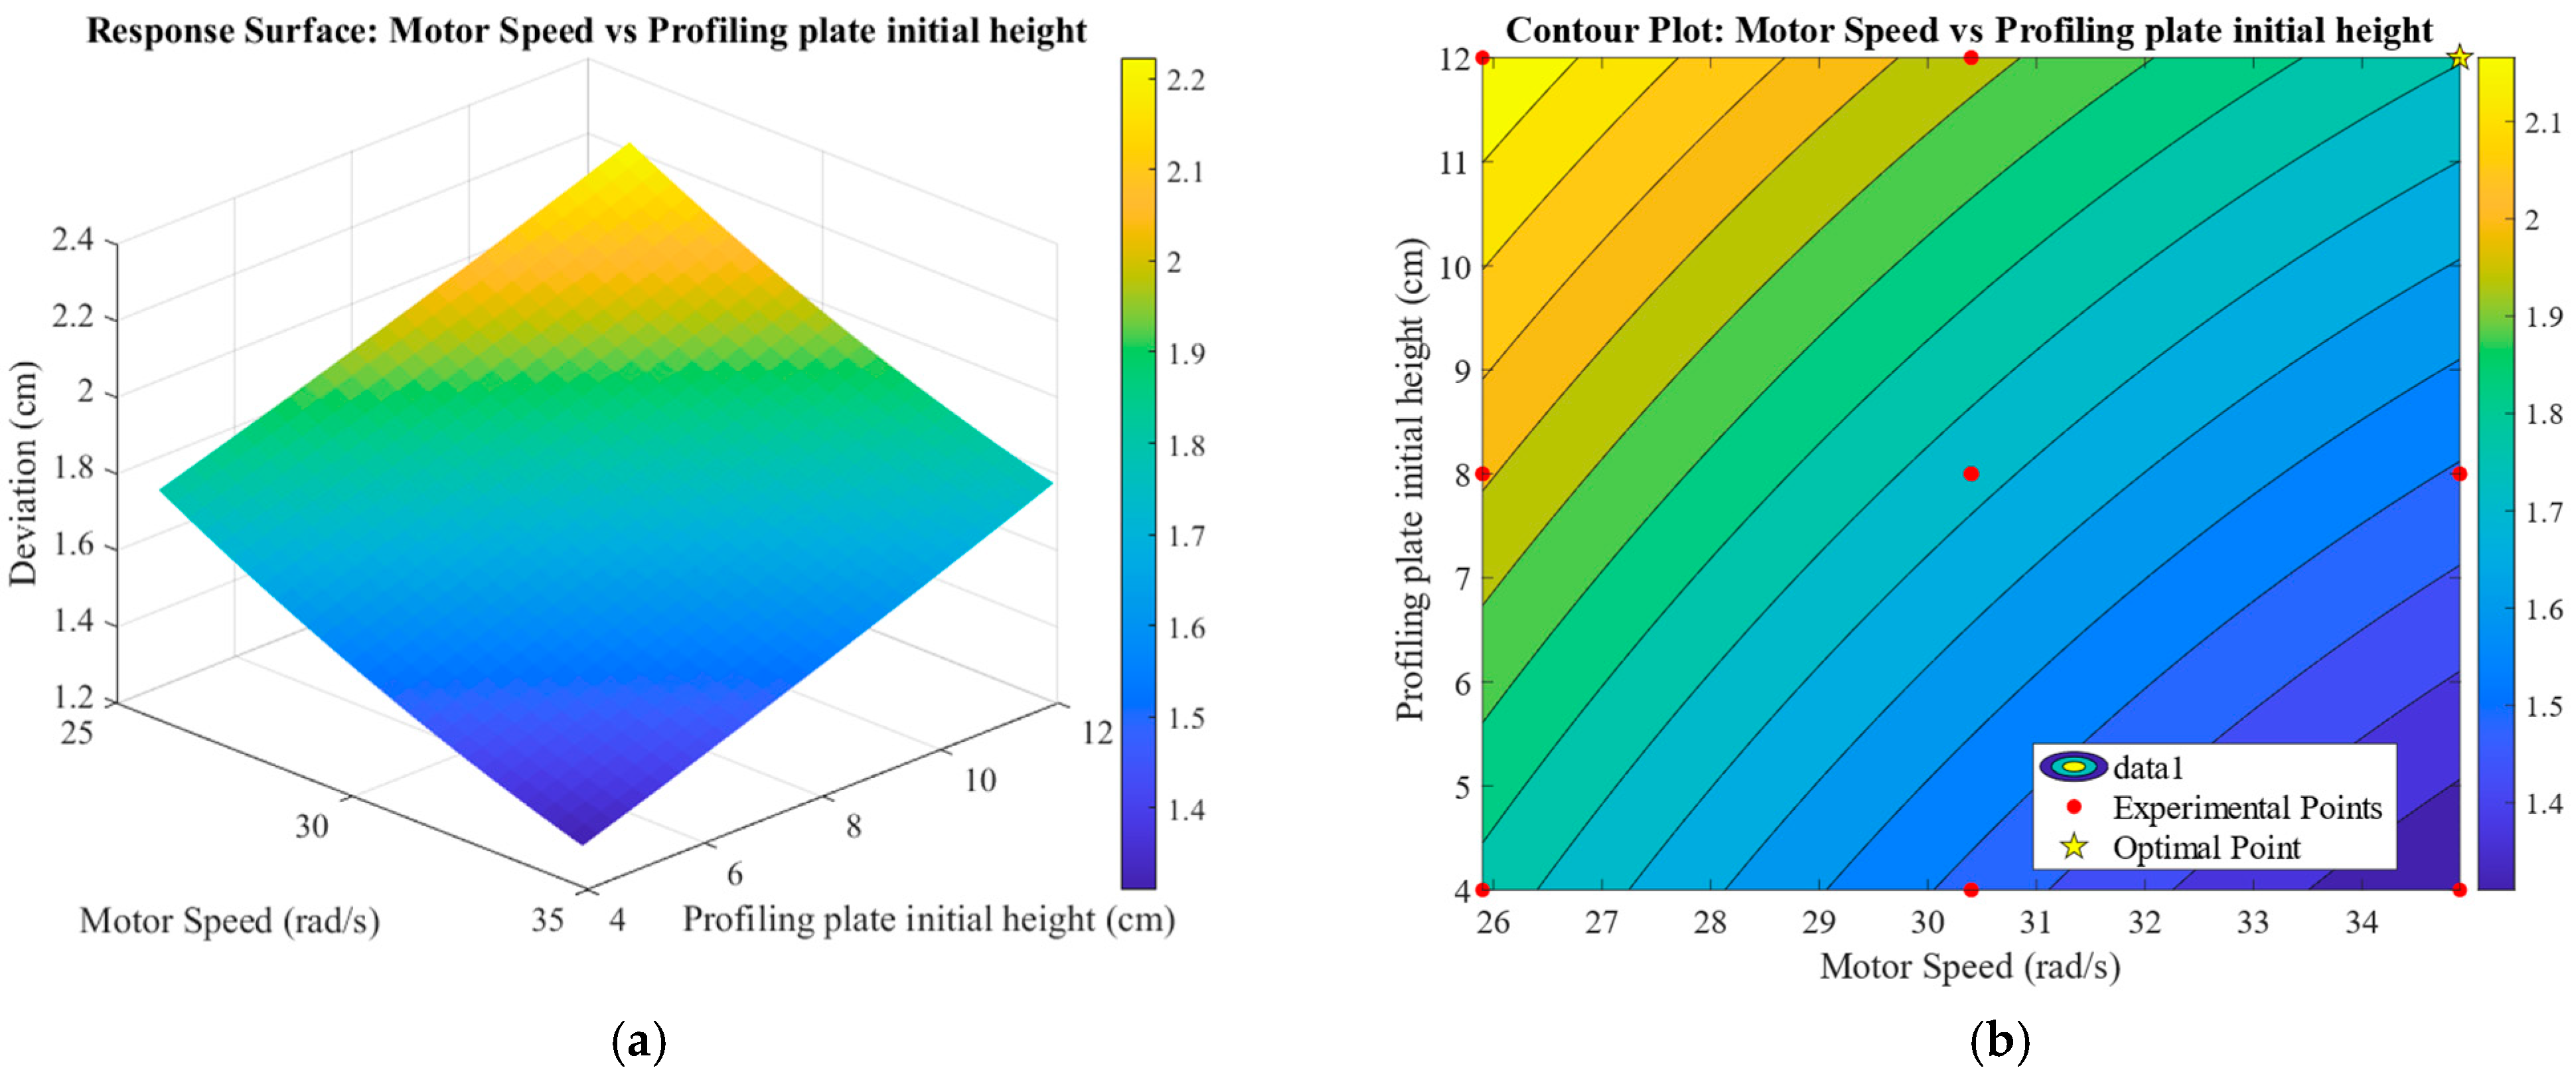
Figure 21. The mean vertical deviation exhibits a gradual decrease with increasing motor speed, while its rate of change shows a gradual increase with a greater initial height of the profiling plate. When considering only the interaction between these two factors, the mean vertical deviation reaches its minimum value within the motor speed range of 32.65–34.9 rad/s and the initial profiling plate height range of 4–8 cm.
3.7. Field Test Validation and Optimization
The operation parameters of the core components of the automatic row-following device are optimized and matched in order to obtain the best operation parameters for the operation performance. According to the analysis of the response surface test results, when the lateral motor speed is 19.89 rad/s, the forward speed is 0.20 m/s, and the spring stiffness is 9.41 cm/N, the predicted minimum mean lateral deviation is obtained. The minimum mean lateral deviation value is 1.087 cm; when the vertical motor speed is 34.89 rad/s, the forward speed is 0.20 m/s, and the initial profiling plate height is 11.99 cm, the predicted minimum mean vertical deviation is obtained, and the minimum mean vertical deviation is 0.995 cm.
According to the actual conditions of the test, the conditions under the minimum mean lateral deviation are corrected to the lateral motor speed of 19.9 rad/s, the forward speed of 0.20 m/s, and the spring stiffness of 9.4 cm/N; the condition under the minimum mean vertical deviation is corrected so that the vertical motor speed is 34.9 rad/s, the forward speed is 0.20 m/s, and the initial profiling plate height is 12 cm. Under this optimal condition, three parallel experiments were carried out, and the average value of the mean lateral deviation of the three experiments was calculated to be 1.118 cm, with a standard deviation of 0.257 cm. The average value of the mean vertical deviation was 0.986 cm, and the standard deviation was 0.016 cm. It is calculated that the deviations between these experimental values and the predicted value were not more than 5%, which confirms the good correlation between the predicted and experimental results.
4. Discussion
This paper successfully designs an automatic row-following device for carrot harvesting based on contact-based perception and fuzzy PID control. The test results demonstrate that the device achieves a high row-following accuracy under complex ridge conditions.
In this paper, the fuzzy PID controller is selected based on the comprehensive consideration of the complexity and engineering feasibility of agricultural field operations. Compared with the traditional PID control, the fuzzy PID does not depend on an accurate mathematical model and can realize adaptive adjustments of the parameters, which means that the system can effectively deal with a complex working environment. From the comparison with the traditional PID, it is also verified that the controller exhibits a smaller overshoot and stronger stability. Although there are more advanced control schemes, such as PID based on artificial intelligence (such as a neural network), fuzzy PID does not need to rely on a large amount of training data, and its rule base is transparent and interpretable. Based on the comprehensive consideration of control performance and engineering implementation complexity, the fuzzy control PID scheme is determined.
By comparing this device with the automatic row-following systems reported in the existing literature, its innovative value can be more clearly demonstrated. Compared with conventional contact-based approaches, this study introduces the concept of ridge surface profiling. Traditional contact-based devices focus solely on lateral deviation, whereas this study achieves an active compensation for longitudinal deviation by integrating a ridge surface floating detection mechanism, resulting in an enhanced adaptability to complex working environments.
In terms of industrial application, this device shows great potential. Its key components (stepper motor, general sensor, PLC controller) are mature products, and the cost is controllable. The whole system can be used as an independent module, which is convenient to install on the existing harvester and reduces the threshold of technology promotion. To achieve the final industrialization, the follow-up work should pay more attention to the adaptability of different platforms and regional agronomic conditions, as well as the durability and reliability testing of the system.
Although this study has achieved positive results, there are still some limitations. (1) Environmental adaptability: Field experiments were mainly carried out underground at a specific test site, and different operating environments may affect the detection performance and the response of the control system. (2) Crop varieties and agronomic differences: Experiments were only carried out for specific carrot varieties, and there were significant differences in the morphological and mechanical properties of different varieties. In addition, the different agronomic specifications in different regions lead to different ridge parameters, which may not match the current system parameters. (3) System reliability and durability: At present, the reliability evaluation of the system has not been carried out for long-term use, and the reliability and durability of key components need to be verified by longer tests.
Based on this, future research work will focus on the following directions: (1) developing adaptive control strategies (such as fuzzy adaptive PID) to make the system obtain a better response ability and adaptability; (2) explore the automatic row-following sensor fusion scheme (such as contact–vision integration), while maintaining the robustness of the system; enhance the predictability of the operating environment and intelligent decision-making ability in order to obtain better operating results; (3) implement a modular design of the control system to evaluate its versatility in harvesting other subsurface crops.
5. Conclusions
This study presents a comprehensive solution addressing the need for automatic row-following in mechanized carrot harvesting. The main conclusions are as follows:
(1) A system architecture for ‘lateral row-following–vertical profiling’ coordinated sensing and control is proposed. This architecture extends the traditional single lateral control of the digging device to coordinated spatial pose adjustment, establishing a new design paradigm for enhancing the intelligence of subsurface crop harvesters.
(2) The intrinsic relationship between operational parameters and performance metrics is revealed. The primary and secondary factors affecting lateral row-following accuracy are lateral motor speed, forward speed, and spring stiffness. The primary and secondary factors influencing vertical profiling accuracy are forward speed, vertical motor speed, and the initial height of the profiling plate.
(3) The field test results demonstrate that, under the optimal parameter combination—a forward speed of 0.2 m/s, lateral motor speed of 19.9 rad/s, spring stiffness of 9 N/cm, vertical motor speed of 34.9 rad/s, and profiling plate initial height of 12 cm—the average value of the mean lateral and mean vertical deviations were 1.118 cm and 0.986 cm, respectively, meeting the agronomic requirements for carrot harvesting.
Author Contributions
Conceptualization, X.S., C.J., X.Z., and Z.L.; methodology, X.S., C.J., X.Z., and Z.L.; software, X.S. and X.Z.; supervision, C.J. and Z.L.; investigation, X.S., C.J., X.Z., and Z.L.; writing—original draft preparation, X.S. and X.Z.; writing—review and editing, X.S., C.J., X.Z., and Z.L.; English language and style, C.J. and Z.L.; visualization, X.S. and X.Z.; funding acquisition, C.J. All authors have read and agreed to the published version of the manuscript.
Funding
This research was funded by the Youth Fond of Natural Science Foundation of China (Project No. 52405244).
Institutional Review Board Statement
Not applicable.
Data Availability Statement
The original contributions presented in this study are included in the article. Further inquiries can be directed to the corresponding author.
Acknowledgments
The authors would like to thank all teachers and students for their invaluable support.
Conflicts of Interest
The authors declare no conflicts of interest.
References
- Wang, J.W.; Guan, R.; Gao, P.X.; Zhou, W.Q.; Tang, H. Design and Experiment of Single Disc to Top Cutting Device for Carrot Combine Harvester. Trans. Chin. Soc. Agric. Mach. 2020, 51, 73–81. [Google Scholar] [CrossRef]
- Wang, B.K.; Hu, Z.C.; Gu, F.W.; Cao, M.Z.; Sun, Y.J. Analysis and Evaluation of the Experimental Effect of Double-Disc Knife-Cutting Device for Carrot Combine Harvester. Agriculture 2025, 15, 682. [Google Scholar] [CrossRef]
- Wang, Q.; Gao, P.X.; Wang, J.W.; Na, M.J.; Tang, H. Design and Experiment of Intelligent Monitor System for Carrot Combine Harvester. Trans. Chin. Soc. Agric Mach. 2022, 53, 118–128. [Google Scholar] [CrossRef]
- Zhao, T.; Mi, Y.H.; Ji, L.F.; Zhang, J.Y.; Chen, G.H. Design of Carrot Harvester Based on Wisefish Creative Modelling. Comput. Informatiz. Mech. Syst. 2025, 8, 48–51. [Google Scholar] [CrossRef]
- Wang, J.W.; Li, X.; Gao, P.X.; Na, M.J.; Wang, Q. Design and Experiment of High Efficiency Drag Reducing Shovel for Carrot Combine Harvester. Trans. Chin. Soc. Agric Mach. 2020, 51, 93–103. [Google Scholar] [CrossRef]
- Shao, Z.T.; Wang, J.S.; Zhao, Z.H.; Zhang, D.C.; Liu, Y. Analysis of Motion and Mechanical Properties of Digging Parts of Carrot Combine Harvester. Agric. Mech. Res. 2024, 46, 49–54+59. [Google Scholar] [CrossRef]
- Wu, H.C.; Hu, Z.C.; Peng, B.L.; Gu, F.W.; Wang, H.O.; Wang, B.K. Development of auto-follow row system employed in pull-type beet combine harvester. Trans. CSAE 2013, 29, 17–24. [Google Scholar] [CrossRef]
- Wang, S.Y.; Hu, Z.C.; Chen, C.; Gao, X.M.; Gu, F.W.; Wu, H.C. Bench test and analysis on performance of autofollow row for traction sugar beet combine harvester. Trans. Chin. Soc. Agric. Mach. 2020, 51, 103–112+163. [Google Scholar] [CrossRef]
- Wang, S.Y.; Hu, Z.C.; Wu, H.C.; Wu, F.; Peng, B.L.; Gu, F.W. Development of an autofollow row control system for a mechanized harvesting test bench for underground crops. Trans. ASABE 2019, 62, 1663–1672. [Google Scholar] [CrossRef]
- Jia, H.L.; Li, S.S.; Wang, G.; Liu, H.L. Design and experiment of seedling avoidable weeding control device for intertillage maize. Trans. ASABE 2018, 34, 15–22. [Google Scholar] [CrossRef]
- Xu, L.M.; Yu, C.C.; Liu, W.; Yuan, Q.C.; Ma, S.; Duan, Z.Z.; Xing, J.J. Optimal design on auto obstacle avoidance mechanism of intra-row weeder for trellis cultivated grape. Trans. ASABE 2018, 34, 23–30. [Google Scholar] [CrossRef]
- Zhang, J.G.; Zheng, C.; Zhao, J.; Zhang, R.X.; Zhao, X.Z.; Li, F.T. Design and experiment of auto-follow row device for cotton topping machine. Trans. Chin. Soc. Agric. Mach. 2021, 52, 93–101. [Google Scholar] [CrossRef]
- Li, T.; Zhou, J.; Xu, W.Y.; Zhang, H.; Liu, C.G. Design and test of auto-follow row system employed in root and stem crops harvester. Trans. Chin. Soc. Agric. Mach. 2019, 50, 102–110. [Google Scholar]
- He, C.X.; Gong, L.; Miao, Z.H.; Han, K.L.; Hao, F.P. Automatic Row-follow Control Method for Cotton Picker Based on Parallel Trajectory Navigation. Trans. Chin. Soc. Agric. Mach. 2024, 55, 34–41. [Google Scholar] [CrossRef]
- Ma, N.; Wang, D.; Shang, S.Q.; He, X.L.; Xu, N.; Guo, P.; Zhao, Z.L.; Zhao, Z. Design and testing of peanut strip-laying harvester of four ridges and eight rows based on automatic alignment. J. Gansu Agric. Univ. 2021, 56, 159–168. [Google Scholar] [CrossRef]
- Nagasaka, Y.; Umeda, N.; Kanetai, Y.; Taniwaki, K.; Sasaki, Y. Autonomous guidance for rice transplanting using global positioning and gyroscopes. Comput. Electron. Agric. 2004, 43, 223–234. [Google Scholar] [CrossRef]
- Yang, R.; Zhai, Y.; Zhang, J.; Zhang, H.; Tian, G.; Zhang, J.; Huang, P.; Li, L. Potato Visual Navigation Line Detection Based on Deep Learning and Feature Midpoint Adaptation. Agriculture 2022, 12, 1363. [Google Scholar] [CrossRef]
- Yang, Y.; Zhou, Y.; Yue, X.; Zhang, G.; Wen, X.; Ma, B.; Xu, L.Y.; Chen, L.Q. Real-time detection of crop rows in maize fields based on autonomous extraction of ROI. Expert Syst. Appl. 2023, 213, 118826. [Google Scholar] [CrossRef]
- Silva, D.R.; Cielbiak, G.; Gao, J.F. Vision based crop row navigation under varying field conditions in arable fields. Comput. Electron. Agric. 2024, 217, 108581. [Google Scholar] [CrossRef]
- Meng, J.G.; Xian, W.D.; Li, F.X.; Li, Z.; Li, J.J. A monocular camera-based algorithm for sugar beet crop row extraction. Eng. Agric. 2024, 44, e20240034. [Google Scholar] [CrossRef]
- Ding, F.; Huang, H.X.; Luo, X.W.; Zhang, W.Y.; Zhang, Z.G.; Pan, J.K.; He, W.S.; Liu, C.K.; Tong, Z.Y. Design and experiment for automatic row-alignment harvesting method of cotton picker based on contact sensor and GNSS/IMU fusion. Comput. Electron. Agric. 2025, 238, 110813. [Google Scholar] [CrossRef]
- Jiang, C.X.; Miao, K.S.; Hu, Z.C.; Gu, F.W.; Yi, K.C. Image Recognition Technology in Smart Agriculture: A Review of Current Applications Challenges and Future Prospects. Processes 2025, 13, 1402. [Google Scholar] [CrossRef]
- Sun, T.; Le, F.X.; Cai, C.; Jin, Y.K.; Xue, X.K.; Cui, L.F. Soybean–Corn Seedling Crop Row Detection for Agricultural Autonomous Navigation Based on GD-YOLOv10n-Seg. Agriculture 2025, 15, 796. [Google Scholar] [CrossRef]
- GB/T 700-2006; Carbon Structural Steels. Standardization Administration of China: Beijing, China; Standards Press of China: Beijing, China, 2006. Available online: http://www.weboos.com.cn:8096/assets/basicStandard/std_11284.pdf (accessed on 24 October 2025).
Figure 1.
Carrot agronomic parameters. L1: width of the ridge bottom, mm; L2: width of the ridge surface, mm; L3: distance between two ridges, mm; L4: height of the ridge, mm; L5: carrot exposure height above the ridge, mm; L6: carrot root depth in soil, mm.
Figure 1.
Carrot agronomic parameters. L1: width of the ridge bottom, mm; L2: width of the ridge surface, mm; L3: distance between two ridges, mm; L4: height of the ridge, mm; L5: carrot exposure height above the ridge, mm; L6: carrot root depth in soil, mm.
Figure 2.
Overall structure of the automatic row-following device. 1. Lateral stepper motor; 2. vertical stepper motor; 3. lateral screw guide rail; 4. vertical screw guide rail; 5. digging mechanism; 6. ridge surface floating detection mechanism; 7. lateral detection mechanism; 8. main frame.
Figure 2.
Overall structure of the automatic row-following device. 1. Lateral stepper motor; 2. vertical stepper motor; 3. lateral screw guide rail; 4. vertical screw guide rail; 5. digging mechanism; 6. ridge surface floating detection mechanism; 7. lateral detection mechanism; 8. main frame.
Figure 3.
Structural diagram of the lateral detection mechanism. 1. Reset springs; 2. guide detection rod; 3. angle sensor.
Figure 3.
Structural diagram of the lateral detection mechanism. 1. Reset springs; 2. guide detection rod; 3. angle sensor.
Figure 4.
Schematic diagram of the guide detection rod. (a) Left deviation; (b) no deviation; (c) right deviation.
Figure 4.
Schematic diagram of the guide detection rod. (a) Left deviation; (b) no deviation; (c) right deviation.
Figure 5.
Structural diagram of the ridge surface floating detection mechanism. 1. Profiling plate; 2. rotary mechanism; 3. angle sensor.
Figure 5.
Structural diagram of the ridge surface floating detection mechanism. 1. Profiling plate; 2. rotary mechanism; 3. angle sensor.
Figure 6.
Structural diagram of control system.
Figure 6.
Structural diagram of control system.
Figure 7.
Flowchart of main program.
Figure 7.
Flowchart of main program.
Figure 8.
Schematic diagram of simulated fuzzy PID control system.
Figure 8.
Schematic diagram of simulated fuzzy PID control system.
Figure 9.
Dual-step target input command.
Figure 9.
Dual-step target input command.
Figure 10.
Images of the experimental process. (a) Guide detection rod of lateral detection mechanism. (b) Ridge surface floating detection mechanism.
Figure 10.
Images of the experimental process. (a) Guide detection rod of lateral detection mechanism. (b) Ridge surface floating detection mechanism.
Figure 11.
Deviation measurement test. (a) Lateral deviation; (b) vertical deviation.
Figure 11.
Deviation measurement test. (a) Lateral deviation; (b) vertical deviation.
Figure 12.
Stress contour plot of the detection rod.
Figure 12.
Stress contour plot of the detection rod.
Figure 13.
Displacement contour plot of the detection rod.
Figure 13.
Displacement contour plot of the detection rod.
Figure 14.
The dynamic simulation results of the ridge surface floating mechanism.
Figure 14.
The dynamic simulation results of the ridge surface floating mechanism.
Figure 15.
Comparison of responses for different control algorithms.
Figure 15.
Comparison of responses for different control algorithms.
Figure 16.
Effects of forward speed and motor speed on mean lateral deviation. (a) Response surface plot. (b) Contour plot.
Figure 16.
Effects of forward speed and motor speed on mean lateral deviation. (a) Response surface plot. (b) Contour plot.
Figure 17.
Effects of forward speed and spring stiffness on mean lateral deviation. (a) Response surface plot. (b) Contour plot.
Figure 17.
Effects of forward speed and spring stiffness on mean lateral deviation. (a) Response surface plot. (b) Contour plot.
Figure 18.
Effects of motor speed and spring stiffness on mean lateral deviation. (a) Response surface plot. (b) Contour plot.
Figure 18.
Effects of motor speed and spring stiffness on mean lateral deviation. (a) Response surface plot. (b) Contour plot.
Figure 19.
Effects of forward speed and motor speed on mean vertical deviation. (a) Response surface plot. (b) Contour plot.
Figure 19.
Effects of forward speed and motor speed on mean vertical deviation. (a) Response surface plot. (b) Contour plot.
Figure 20.
Effects of forward speed and profiling plate initial height on mean vertical deviation. (a) Response surface plot. (b) Contour plot.
Figure 20.
Effects of forward speed and profiling plate initial height on mean vertical deviation. (a) Response surface plot. (b) Contour plot.
Figure 21.
Effects of motor speed and profiling plate initial height on mean vertical deviation. (a) Response surface plot. (b) Contour plot.
Figure 21.
Effects of motor speed and profiling plate initial height on mean vertical deviation. (a) Response surface plot. (b) Contour plot.
Table 1.
Control system hardware parameters.
Table 1.
Control system hardware parameters.
| Component | Model | Product Information | Key Parameters/Specifications |
|---|
| Microprocessor | STC12C5A60S2 | STC Micro Co., Ltd., Shenzhen, China | 8-bit architecture, 60 MHz clock, 60 KB Flash, 10-bit ADC |
| Motor | HST130-M04025 | Jiangsu Whistone Electromechanical Technology Co., Ltd., Changzhou, China | Rated power 1 kW, rated current 4 A, rated speed 2500 rpm |
| Motor Driver | DM542C | Jiangsu Whistone Electromechanical Technology Co., Ltd., Changzhou, China | Output current 1.0–4.2 A, input voltage 12–32 VDC, supports pulse/direction control |
| Angle Sensor | P3022V1CW360L | Shanghai Paisi Automation Technology Co., Ltd., Shanghai, China | 5 V supply, 12-bit resolution, 0–360° range, 0–5 V analog output |
| Speed Sensor | E6HZ-CWZ6C | OMRON Automation (China) Co., Ltd., Shanghai, China | 5 V supply, NPN open collector output, phases A, B, Z |
Table 2.
Material properties of the detection rod and the base channel plate [
24].
Table 2.
Material properties of the detection rod and the base channel plate [
24].
| Component Name | Material | Density kg/m3 | Elastic Modulus MPa | Poisson’s Ratio |
|---|
| Q235A | 7850 | 2.1 × 10⁵ | 0.3 | 235 |
Table 3.
Experimental design for response surface of the lateral detection mechanism.
Table 3.
Experimental design for response surface of the lateral detection mechanism.
| Level | Factor |
|---|
| A—Forward Speed (m/s) | B—Motor Speed (rad/s) | C—Spring Stiffness (N/cm) |
|---|
| −1 | 0.2 | 9.9 | 4 |
| 0 | 0.5 | 14.9 | 8 |
| 1 | 0.8 | 19.9 | 12 |
Table 4.
Experimental design for response surface of the floating detection mechanism.
Table 4.
Experimental design for response surface of the floating detection mechanism.
| Level | Factor |
|---|
| A—Forward Speed (m/s) | B—Motor Speed (rad/s) | C—Initial Height of the Profiling Plate (cm) |
|---|
| −1 | 0.2 | 25.9 | 4 |
| 0 | 0.5 | 30.4 | 8 |
| 1 | 0.8 | 34.9 | 12 |
Table 5.
Carrot physical characteristic parameters.
Table 5.
Carrot physical characteristic parameters.
| No. | Diameter (mm) | Circumference (mm) | Length (cm) | Weight with Leaves (g) | Weight Without Leaves (g) |
|---|
| Upper | Middle | Lower | Upper | Middle | Lower | Canopy Height | Root Depth |
|---|
| 1 | 39.9 | 35.0 | 28.9 | 133.2 | 118.7 | 85.0 | 49.6 | 21.8 | 160.6 | 113.0 |
| 2 | 50.0 | 43.2 | 27.6 | 164.5 | 135.2 | 112.9 | 52.8 | 20.2 | 331.9 | 267.7 |
| 3 | 44.3 | 41.6 | 30.8 | 130.3 | 116.5 | 99.8 | 47.8 | 24.9 | 150.6 | 109.9 |
| 4 | 40.3 | 37.7 | 31.6 | 128.5 | 122.9 | 100.8 | 43.2 | 26.7 | 154.3 | 121.9 |
| 5 | 43.6 | 40.9 | 29.9 | 133.5 | 129.8 | 103.1 | 55.5 | 23.2 | 158.8 | 118.3 |
| 6 | 43.6 | 39.2 | 26.7 | 140.5 | 124.5 | 98.8 | 32.3 | 25.5 | 189.3 | 140.8 |
| 7 | 51.2 | 36.58 | 31.69 | 166.8 | 128.0 | 112.5 | 49.2 | 19.8 | 299.5 | 232.7 |
| 8 | 37.7 | 31.6 | 19.9 | 130.0 | 107.8 | 83.9 | 48.1 | 21.5 | 174.6 | 125.2 |
| 9 | 34.8 | 31.8 | 21.9 | 116.7 | 136.0 | 106.5 | 53.4 | 22.8 | 280.6 | 207.3 |
| 10 | 50.2 | 38.8 | 30.3 | 161.4 | 136.0 | 106.5 | 52.3 | 21.7 | 280.6 | 207.3 |
| 11 | 40.6 | 34.6 | 27.3 | 141.2 | 123.1 | 106.5 | 39.9 | 17.6 | 212.7 | 161.7 |
| 12 | 37.2 | 24.0 | 15.0 | 128.8 | 94.5 | 71.8 | 55.9 | 23.2 | 214.0 | 120.9 |
| 13 | 41.2 | 30.1 | 24.3 | 136.4 | 107.8 | 93.2 | 51.3 | 23.6 | 178.3 | 128.0 |
| 14 | 39.5 | 32.0 | 20.0 | 134.5 | 113.5 | 101.5 | 53.5 | 16.3 | 202.1 | 130.7 |
| 15 | 43.2 | 35.7 | 22.56 | 142.0 | 120.5 | 98.0 | 56.5 | 19.8 | 263.0 | 167.3 |
| 16 | 39.3 | 34.3 | 26.6 | 138.2 | 118.8 | 100.5 | 53.8 | 22.3 | 187.0 | 145.0 |
| 17 | 46.5 | 39.4 | 32.6 | 154.0 | 131.5 | 109.0 | 49.5 | 22.1 | 285.3 | 212.9 |
| 18 | 43.9 | 35.4 | 19.5 | 144.0 | 129.0 | 98.5 | 58.5 | 24.9 | 242.3 | 165.8 |
| 19 | 47.7 | 42.8 | 29.0 | 157.8 | 145.4 | 127.2 | 47.5 | 18.5 | 279.4 | 211.2 |
| 20 | 44.2 | 39.4 | 24.6 | 145.0 | 131.2 | 99.0 | 46.7 | 22.3 | 286.2 | 211.5 |
Table 6.
Parameter and error estimates from statistical analysis of lateral detection mechanism.
Table 6.
Parameter and error estimates from statistical analysis of lateral detection mechanism.
| Source | Coefficient | Std. Error | t-Value | p-Value | Sig. | SS | df | MS | F-Value |
|---|
| Mean lateral deviation | | | | <0.001 | **** | 41.968 | 9 | 4.663 | 194.88 |
| Intercept | 4.2 | 0.069 | 60.71 | <0.001 | **** | | | | |
| A | 1.0625 | 0.055 | 19.43 | <0.001 | **** | 9.031 | 1 | 9.031 | 377.43 |
| B | −1.775 | 0.055 | −32.46 | <0.001 | **** | 25.205 | 1 | 25.205 | 1053.34 |
| C | −0.3875 | 0.055 | −7.09 | 0.0002 | *** | 1.201 | 1 | 1.201 | 50.20 |
| AB | 0.35 | 0.077 | 4.53 | 0.003 | ** | 0.49 | 1 | 0.49 | 20.48 |
| AC | 0.275 | 0.077 | 3.56 | 0.009 | ** | 0.303 | 1 | 0.303 | 12.64 |
| BC | −0.05 | 0.077 | −0.65 | 0.539 | ns | 0.01 | 1 | 0.01 | 0.42 |
| A2 | −0.2875 | 0.075 | −3.81 | 0.007 | ** | 0.348 | 1 | 0.348 | 14.54 |
| B2 | 0.4875 | 0.075 | 6.47 | 0.0003 | *** | 1.001 | 1 | 1.001 | 41.82 |
| C2 | 1.0125 | 0.075 | 13.43 | <0.001 | **** | 4.316 | 1 | 4.316 | 180.39 |
| Residual | | | | | | 0.168 | 7 | 0.024 | |
| Lack-of-fit | | | | 0.2096 | ns | 0.108 | 3 | 0.036 | 2.39 |
| Total | | | | | | 42.135 | 16 | | |
Table 7.
Parameter and error estimates from statistical analysis of vertical detection mechanism.
Table 7.
Parameter and error estimates from statistical analysis of vertical detection mechanism.
| Source | Coefficient | Std. Error | t-Value | p-Value | Sig. | SS | df | MS | F-Value |
|---|
| Mean vertical deviation | | | | <0.001 | **** | 2.48 | 9 | 0.276 | 63.94 |
| Intercept | 1.7308 | 0.029 | 58.95 | <0.001 | **** | | | | |
| A | 0.3986 | 0.023 | 17.17 | <0.001 | **** | 1.271 | 1 | 1.271 | 294.94 |
| B | −0.2359 | 0.023 | −10.16 | <0.001 | **** | 0.445 | 1 | 0.445 | 103.27 |
| C | 0.2203 | 0.023 | 9.49 | <0.001 | **** | 0.388 | 1 | 0.388 | 90.04 |
| AB | −0.025 | 0.033 | −0.76 | 0.471 | ns | 0.0025 | 1 | 0.0025 | 0.58 |
| AC | 0.2738 | 0.033 | 8.34 | <0.001 | **** | 0.300 | 1 | 0.300 | 69.55 |
| BC | 0.0098 | 0.033 | 0.30 | 0.775 | ns | 0.00038 | 1 | 0.00038 | 0.09 |
| A2 | −0.1284 | 0.032 | −4.01 | 0.005 | ** | 0.069 | 1 | 0.069 | 16.11 |
| B2 | 0.0366 | 0.032 | 1.14 | 0.290 | ns | 0.0056 | 1 | 0.0056 | 1.31 |
| C2 | 0.0089 | 0.032 | 0.28 | 0.790 | ns | 0.00033 | 1 | 0.00033 | 0.08 |
| Residual | | | | | | 0.004 | 7 | 0.004 | |
| Lack-of-fit | | | | 0.488 | ns | 0.004 | 3 | 0.004 | 0.97 |
| Total | | | | | | 0.004 | 16 | 0.004 | |
| Disclaimer/Publisher’s Note: The statements, opinions and data contained in all publications are solely those of the individual author(s) and contributor(s) and not of MDPI and/or the editor(s). MDPI and/or the editor(s) disclaim responsibility for any injury to people or property resulting from any ideas, methods, instructions or products referred to in the content. |
© 2025 by the authors. Licensee MDPI, Basel, Switzerland. This article is an open access article distributed under the terms and conditions of the Creative Commons Attribution (CC BY) license (https://creativecommons.org/licenses/by/4.0/).
