Abstract
We present the construction of a methodological proposal to determine which indicators should be considered in the monitoring and evaluation of water resource management in the irrigation districts in Colombia (Land Adequacy Districts). This document begins with a characterization of the subsector of land adequacy, presents the national and international background in the assessment of water resource management, and establishes the optimal scope given the experience of Colombian institutions, the current legal framework, and the quality of official information on subsector issues. Economic, social, water, and climate aspects are considered. Thirteen indicators were chosen from Product Management Indicators, Activity Management Indicators and Results, and Impact Indicators.
1. Introduction
Agriculture is the sector with the largest water usage and is characterized by management challenges and high productivity and economic goals [1]. The rational allocation of water resources for irrigation is critical to improve efficiency in the use of water resources and ensure food security, but effective control measures also need to be put in place for the sustainable use of water resources in irrigation areas [2]. Therefore, the use of irrigation water resources must be optimized through proper management that allows water governance by users [3].
While rain-fed agriculture relies on soil moisture generated from rainfall, irrigated agriculture focuses on the withdrawal of water from surface and groundwater sources [4]. When evaluating water resource management in irrigation, usually the focus is on the application of irrigation systems and conduction efficiency, the fraction of water consumed, and performance indicators, such as uniformity and efficiency [5,6].
Studies use various indicators to evaluate water resources in irrigation districts, including economic, environmental, technical, management, social, and political factors [7,8,9,10,11,12]. Defining the indicators to assess the state and use of water might contribute to the development of a methodological framework and baselines that could be used in lands with similar characteristics [13].
Water productivity, which refers to the increase in the annual value of agricultural production attributable to an annual volume of irrigation water inflow, is one of the indicators that links technical factors with economic and production expectations [14,15,16].
Other research focuses on the use of tools that allow the assessment of irrigation management performance. Indicators are grouped into categories of improvement aspects, such as better operation and maintenance, timely delivery, efficient water use, satisfactory irrigation service, financial performance, and agricultural productivity [17,18,19].
Irrigation districts emerged at the end of the nineteenth century as a private initiative to develop an infrastructure for the irrigation of banana plantations in the department of Magdalena (Colombia). Therefore, governments in the second half of the twentieth century promoted so-called “Land Adequacy” (LA) by strengthening its institutional framework around a public policy that significantly increased the area of irrigation coverage in the country [20].
The LA Public policy should be monitored and evaluated to determine its effects on the rural population and the agricultural economy. Consequently, mechanisms for monitoring government goals, which are principally responsible for the increase in irrigation coverage, have been established. From the institutional framework of the Colombian State, a series of regional indicators (the National Management Evaluation System and Results (SINERGIA)) emerged jointly with other sectors of the economy by evaluating the success or failure of irrigation management programs [21].
Afterward, the Agricultural Rural Planning Unit (UPRA—known as Unidad de Planificación Rural Agropecuaria in Spanish) generated the baseline of LA indicators as a starting point for various analyses of the subsector serving regional land adequacy diagnosis [16]. The number of indicators employed is a key factor, which relies on quantified performance details (e.g., research, management, public information) and the examination of irrigation and drainage disciplines (water balance, economics, environment, management) [16].
Considering all the above, the research question posed here is “How may indicators be selected that are sufficient and appropriate for evaluating irrigation districts’ water resource management and facilitating decision making?” A specific methodological difficulty arises in selecting, estimating, and correctly formulating the set of indicators suitable for evaluating the management of LA.
This research focuses on the logical framework methodology. This is a valuable tool for conceptualizing and designing indicators to support the process of project conceptualization, design, execution, and evaluation [22]. Firstly, an analysis of the stakeholders involved (farmers, managers, government) and the problems associated with the generation of a list of indicators that met the proposed goals was performed. With these results, the final selection and validation of the indicators were achieved using two main parameters: the value chain and the Clear, Relevant, Economic, Adequate, Measurable, and Sensitive (CREAMS) methodology [23].
2. Materials and Methods
A methodology is a system of topics, practices, techniques, procedures, and rules used by those working in a discipline [24]. The proposed methodology provides tools and processes to follow and obtain a set of indicators (battery) suitable for estimating the management of water resources made by the Land Adequacy Districts (LADs). It incorporates different tools such as subroutines, which give a logical, applicable result, under the regulatory legal framework for Colombia. Figure 1 presents the methodological scheme described in seven steps: (1) an analysis of the stakeholders involved, (2) the identification and analysis of the problem, (3) a Vester matrix, (4) a problem tree, (5) an analysis of alternatives and optimal strategies, (6) a logical framework matrix, and (7) the selection of indicators.

Figure 1.
General methodological scheme.
2.1. Step 1: Stakeholder Analysis
The expectations of the stakeholders involved should be an important factor in the design of projects that seek to influence the
Well-being of a community by providing an opportunity for their empowerment [25,26]. Consequently, those interested in land adequacy (LA) should be initially identified in order to clarify who is concerned with measuring or evaluating the management of a LAD with respect to water resources.
To determine the expectations of those involved, the individuals and their importance in the LAD are characterized and classified by the roles they play into the following categories: authorities and implementers (AUs), beneficiaries (BEs), funders (FNs), and researchers and support personnel (IAs) [27]. Their importance is considered by estimating the power they have to affect the management of the district and the intensity of expectations, which indicates the degree of involvement with management. According to the baseline established by UPRA, both aspects are rated from 1 to 5, where 1 is the lowest strength or expectation and 5 is the highest strength or expectation [28].
2.2. Step 2: Identify and Analyze the Problem
To establish the main problem and approach to the evaluation strategy, it is necessary to consider all the associated problems by specifying the causes and effects of the central problem. To this end, a list of problems that in this case affect the subsector of land adequacy was drawn up. Workshops were held within the framework of the territorial strategy, in the construction of the plans for the productive and social ordering of rural property (POPSPR). Within the methodological process for the formulation of these plans, a diagnosis of the agricultural territorial system or model was made, which showed as by-products the problems and potentialities of different dimensions, such as productivity, social, ecosystemic, economic, and infrastructural (relating to goods and services) dimensions, among others [29].
The socio-productive dimension describes and diagnoses the status of the water resources and the adequacy of the lands of the territories at a general scale, identifying challenges and opportunities from the perspective of productive alternatives that emphasize administrative political areas. The goal of the validation workshops in the territory was to guarantee that the rural and territorial actors’ visions are aligned with the diagnoses given by reviewing the identified issues for confirmation or deletion and the inclusion of those issues not previously addressed.
At this stage of the preparation of the study, all approaches are working hypotheses that should be evaluated according to the deepening of the studies, including the consultation of those affected through participatory methods [22].
2.3. Step 3: Vester Matrix
It is considered a valuable and practical operational research tool to identify causes, effects, and central problems affecting a project. The matrix allows for relations of dependence or influence between one problem and another on a scale of 0 to 3: zero (0): it does not cause it; one (1): it causes it indirectly or has a very weak causal relationship; two (2): it causes it semi-directly or has a medium causal relationship, and three (3): it causes it directly or has a strong causal relationship [30].
Each problem is crossed with the others and the results of quantifying the dependence and influence between them are analyzed before being placed in a Cartesian plane. Then, each problem is classified according to the resulting typology given by the positioning of the influence (x) and dependence (y) as a result of the sum of the rows and columns, according to the Vester matrix. Problems with low dependence and influence on others, for example, are considered or classed as indifferent.
2.4. Step 4: Problem Tree—Objectives
The location of the elements in the Cartesian plane allows us to identify the central problem as well as the main causes and effects, which can subsequently be schematized in the problem tree.
This step seeks to find solutions to the problems identified by converting them to objectives. An objectives tree is constructed by following the order proposed in the problems tree, giving the issues a positive meaning, and presenting the appropriate objective to solve them. In the tree of objectives, what once were the causes (roots of the tree) must now be the means to achieve the central objective [22]. For example, it can be established that: “The Land Adequacy Districts manage the water resources effectively”.
2.5. Step 5: Analysis of Alternatives and Optimal Strategy
The objective tree’s means are operationalized by finding the actions that are most likely to realize them [22]. The recommended actions allow for the procurement of methods that eliminate the cause of the problem, allowing for the acquisition of components and their associated activities. The input for the analytical structure of the research is what is indicated in the tree of objectives, as well as the actions, components, and activities.
2.6. Step 6: Logical Framework Matrix
The logical framework matrix summarizes what the project intends to do by establishing key assumptions and parameters regarding how inputs and outputs will be monitored and evaluated [31].
The logical framework matrix must synthesize the activities, outputs, and results; therefore, one column is composed of the narrative of the objectives and another is composed of the indicators for the achievement of the results. In total, it consists of four sections: goal, purpose, components, and activities, as summarized in Table 1 [22].

Table 1.
Description of the narrative summary of objectives. Source: Adapted from [22].
2.7. Step 7: Selecting Indicators: Structuring and Validation
As components of the logical framework matrix, those indicators that allow the evaluation of the fulfillment of the activities and contain the necessary components to fulfill the purpose of the study must be selected or designed. These indicators can originate from other studies of the same nature or be designed specifically, as long as they allow each proposed objective to be evaluated [23]. To conduct this selection and validation, two methodologies were used here: value chain and CREAMS.
- -
- Value chain methodology
Once the indicators have been selected and classified, a value chain is applied to determine which of them has utility for the achievement of the main objective.
The value chain is formed by following the simplified public value-generation model shown in Figure 2 and proposed by SINERGIA [21]. It is used as a practical filter to obtain the indicators for effective Management and Results.
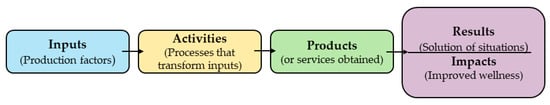
Figure 2.
Value chain structure. Source: authors’ elaboration adapted from [21].
The developments in the tree of objectives and the results obtained in the analytical structure of the project are considered for the elaboration of the value chain.
- -
- CREAMS
The CREAMS methodology [23] allows the evaluation of each indicator considered (after the value chain), based on 6 basic criteria or guidelines: clarity, relevance, economy, adequacy, measurability, and sensitivity (Figure 3).

Figure 3.
CREAMS methodology for the selection of indicators. Source: authors’ elaboration adapted from [23].
The evaluation consists of giving a grade from 1 to 5 to each of the criteria and then averaging their ratings to obtain a final score for each indicator. The criteria for each indicator should be graded by people with experience and knowledge in the subject [32].
All ratings are averaged by criterion and indicator, and, as a filter, the indicator must be rated above the 25th percentile of all ratings.
3. Results
3.1. Categorization of Stakeholders and Associated Problems
The positioning and characterization of stakeholders involved in the management of water resources in the DATs are presented in Table 2. The actors involved with the greatest interest in the monitoring and evaluation of water resource management correspond to the public institutions that govern the policy.
Table 2.
Positioning and characterization of stakeholders involved in the management of water resources in DATs in Colombia.
From the workshops for the identification of problems and potentialities of the agricultural territorial system in two territorial units of Colombia, twenty-one problems were selected and classified according to the Vester matrix (Table 3).
Table 3.
Classification of the problem.
Problems are located in a Cartesian plane (Figure 4) for their subsequent categorization by crossing them with each other and by analyzing the results of quantifying the relationships of dependence and influence between them.
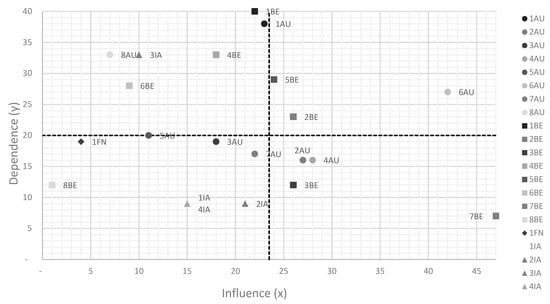
Figure 4.
Influence and dependency on the identified problem.
With the central problem identified, the causal relationships between all the problems in the problem tree are sketched, as shown in Figure 5, where the causes and effects are determined by the items located in the Cartesian plane.

Figure 5.
Tree of identified problems regarding the management of water resources in irrigation districts.
3.2. Objectives and Analytical Structure of the Study
The classification of objectives was shown in Table 4.
Table 4.
Classification of proposed logical framework objectives.
Based on the findings identified so far in the process, the objectives (means) that can be considered as concrete actions are ME5, ME7, ME8, and ME9. The proposed actions are set out in Table 5, and the respective components and activities are presented in Table 6.
Table 5.
Proposed actions.
Table 6.
Proposed components and activities.
3.3. Logical Framework Matrix
The logical framework matrix (LFM) is presented in the modified structure of the logical framework methodology proposed. This matrix arises as the result of the sequential and participatory analysis of the problems addressed in the management of water resources by DATs (Table 7).
Table 7.
Logical framework matrix: pre-selected management indicators.
3.4. Selection of Management Indicators
This began with a list of indicators (129) from various publications referring to the state of the art of water resource management in irrigation districts. These indicators were categorized into five main typologies: water balance or water yield, agricultural production, socioeconomic and financial, energy, and environmental sustainability.
The pre-selected indicators are recorded in the LFM (Table 7), which in turn includes the hydro-climatological and anthropic intervention indicators of the National Water Study, 2018 [25]. In this matrix, a differentiation was made between what should be considered as variables and what as indicators, considering that there is a contrast between these two terms with respect to their measurement and composition. The result at this step was forty-six (46) indicators.
The value chain (Figure 6) was structured based on the pre-selected indicators of Table 7 that add value to the study and by including or rethinking new indicators that are key to evaluating the management of water resources made by LADs. In this case, only management and result indicators were considered, given that impacts are a fundamental part of the evaluation of public policies. In total, seventeen indicators were obtained, as shown in Table 8.
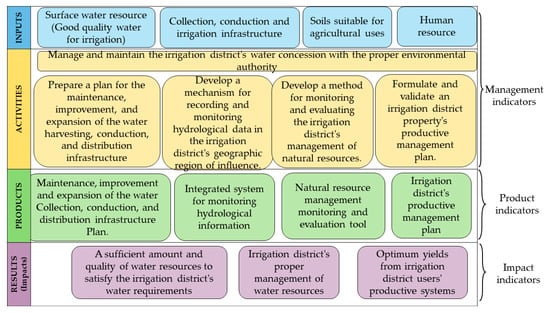
Figure 6.
Value chain to evaluate the management of water resources by LADs.
Table 8.
Management indicators and results of the value chain.
Finally, we present the evaluation of each indicator by qualifying the CREAMS criteria, obtained from the assessment of professionals with wide experience in the subject of ADT in Colombia. The qualification threshold was 3.55; thus, the results in Table 9 were obtained. Those that exceeded this limit were considered as part of the recommended battery of indicators.
Table 9.
Evaluation results according to the CREAMS methodology.
4. Discussion
The logical framework as a methodological tool was the central axis used to estimate the indicators that would be key to evaluating the management of water resources in the districts under consideration here. This tool allowed those elements of a problem to be identified that, when translated into concrete actions, could have a beneficial impact on land adequacy beneficiaries.
Stakeholder participation in formulating a problem gives solid validity to the research. The main reason is that the involvement of stakeholders allows the direction of efforts to solve the problem in question and produce benefits to the farmers who consider irrigation as the solution compete with their agricultural products and at the same time ensures the environmental sustainability needed to continue their way of life and obtain sustenance.
In the case of workshops used as a strategy to determine the indicators, it is key to define an objective and practical scope and to see that it is made explicit and disseminated among those who participate in order to avoid the exercise being skewed by the interests of the attendants. The aim is to obtain an impartial exercise and thus achieve the proposed objectives.
The entities of the national order, reflected in the institutionalism of the agricultural and environmental sectors, are emerging as the most interested actors in the management of the districts for the efficient use of the resource from the perspective of multisectoral demand. However, there is an increasing awareness by the beneficiaries of the land adequacy of implementing monitoring and evaluation practices to the use and management of natural resources.
It was very useful to follow the parameters of the entities in charge of monitoring and evaluating public policies, such as the DNP and the UPRA, to frame the analysis of problems and the structuring of objectives that must be included in the evaluation of the management of water resources by Land Adequacy Districts (LADs). These parameters are the products of public policies to provide irrigation and drainage to the lands of agricultural use in Colombia.
The validation tools of the processes implemented in the proposed methodology, such as the value chain and the pre-selected indicators (evaluation according to the CREAMS criteria), are an excellent filter for defining which indicators should comprise the final battery. They are also useful to ratify those indicators that are already being used to evaluate the management of the districts.
It is recommended to join forces at the interdisciplinary level, to complement and coordinate the concepts of management around natural resources, since the aim must be not only to achieve those resources that meet the input needs of the productive systems but also to seek sustainability over time and increase the well-being of the population, especially the rural population.
5. Conclusions
The classification and typification of the obtained indicators provides support to individuals who make decisions and implement the relevant methodological procedures. Water use in irrigation districts should be monitored and evaluated as a separate project within each organization. Deficient and unjustified rural public policies, poor monitoring of hydrological variables affecting the district, and the deterioration of infrastructure are among the main causes that generate the problems faced in irrigation districts characterized by poor water resource management. The effects are reflected in the high cost of water tariffs, low water availability and quality, and low crop productivity.
Finally, thirteen (13) indicators were selected and formed the battery of proposed indicators. They are estimated to be key to measuring and evaluating water resource management in the Land Adequacy Districts in Colombia and were classified into three (3) main categories: Product Management Indicators, Activity Management Indicators and Results, and Impact Indicators.
Author Contributions
Conceptualization, J.L.M.-T. and M.A.V.-M.; methodology, J.L.M.-T., M.A.V.-M. and A.F.R.-V.; validation, J.L.M.-T., M.A.V.-M. and A.F.R.-V.; writing—original draft preparation, J.L.M.-T., M.A.V.-M. and A.F.R.-V.; writing—review and editing, J.L.M.-T., M.A.V.-M., A.F.R.-V. and O.L.G.-N. All authors have read and agreed to the published version of the manuscript.
Funding
This research and the APC were funded by Universidad Nacional de Colombia and the Ministry of Science, Technology, and Innovation (MinCiencias).
Data Availability Statement
The data presented in this study are available on request from the corresponding author.
Conflicts of Interest
The authors declare no conflict of interest.
References
- Alamanos, A.; Mylopoulos, N.; Loukas, A.; Gaitanaros, D. An Integrated Multicriteria Analysis Tool for Evaluating Water Resource Management Strategies. Water 2018, 10, 1795. [Google Scholar] [CrossRef]
- Xuebin, Q.I.; Huang, Z.; Qiao, D.; Zhang, X.; Li, P.; Andersen, M.N. Research advances on thereasonable water resources allocation in irrigation district. Adv. Water Sci. 2015, 26, 287–295. [Google Scholar]
- Aguilar-Sánchez, G.; De La Cruz-Ángeles, J. Gestión del Agua En El Distrito 011, Los Módulos de Riego De Acámbaro Y Salvatierra, Guanajuato México. Rev. Geográfica América Cent. 2016, 2, 153. [Google Scholar] [CrossRef][Green Version]
- Calzadilla, A.; Rehdanz, K.; Tol, R.S.J. The economic impact of more sustainable water use in agriculture: A computable general equilibrium analysis. J. Hydrol. 2010, 384, 292–305. [Google Scholar] [CrossRef]
- Pereira, L. Indicadores de Desempenho de Sistemas Hídricos E de Sistemas de Rega. In El Agua En Iberoamérica. Aspectos de La Problemática de Las Tierras Secas; AF Cirelli e E.M. Abraham. CYTED XVII; CYTED: Buenos Aires, Argentina, 2003; pp. 131–140. [Google Scholar]
- Galindo, A.; Corell, M.; Martín-Palomo, M.J.; Teresa, C. Combination of Indicators for Increasing Irrigation Sustainability. Definition of a Hydrosustainable Index. In Proceedings of the EGU General Assembly Conference Abstracts, online, 19–30 April 2021. [Google Scholar] [CrossRef]
- Bos, M. Performance indicators for irrigation and drainage. Irrig. Drain Syst. 1997, 11, 119–137. [Google Scholar] [CrossRef]
- Iñiguez-Covarrubias, M.O.; Waldo, O.V.M. Productivity analysis of the Río Bravo irrigation districts using performance indicators. Ing. Agríc. Biosist. 2020, 12, 131–158. [Google Scholar] [CrossRef]
- Alvarez, I.; Manrique, O.; Cid, E.P. Sustainability indicators for the use of water in irrigation systems. Univ. Cienc. 2022, 11, 10. Available online: http://revistas.unica.cu/uciencia (accessed on 23 March 2022).
- Vázquez, V.M.O.; Poyato, E.C.; Díaz, J.A.R.; Lugo, J.L.M.; Hernández, M.L.H. Determinación de indicadores de gestión en los módulos del Distrito de Riego No. 041, Río Yaqui (Sonora, México). Rev. Fac. Cienc. Agrar. 2017, 49, 149–168. [Google Scholar]
- Moreno-Pérez, M.F.; Roldán-Cañas, J. Assessment of irrigation water management in the Genil-Cabra (Córdoba, Spain) irrigation district using irrigation indicators. Agric Water Manag. 2013, 120, 98–106. [Google Scholar] [CrossRef]
- Soto-García, M.; Martínez-Alvarez, V.; García-Bastida, P.A.; Alcon, F.; Martin-Gorriz, B. Effect of water scarcity and modernisation on the performance of irrigation districts in south-eastern Spain. Agric. Water Manag. 2013, 124, 11–19. [Google Scholar] [CrossRef]
- Salomón, M.; Ríos, C.G.; Rubio, C.; Galárraga, R.; Abraham, E. Indicadores de uso del agua en una zona de los Andes centrales de Ecuador. Estudio de la cuenca del Río Ambato. Ecosistemas 2008, 17, 14. [Google Scholar]
- Bos, M.G.; Burton, M.A.; Molden, D.J. (Eds.) Irrigation and Drainage Performance Assessment: Practical Guidelines; CABI: London, UK, 2005. [Google Scholar] [CrossRef]
- Sakthivadivel, R.; De Fraiture, C.; Molden, D.J.; Perry, C.; Kloezen, W. Indicators of Land and Water Productivity in Irrigated Agriculture. Int. J. Water Resour. Dev. 1999, 15, 161–179. [Google Scholar] [CrossRef]
- Lorite, I.J.; García-Vila, M.; Carmona, M.A.; Santos, C.; Soriano, M.A. Assessment of the Irrigation Advisory Services’ Recommendations and Farmers’ Irrigation Management: A Case Study in Southern Spain. Water Resour. Manag. 2012, 26, 2397–2419. [Google Scholar] [CrossRef]
- Alcon, F.; García-Bastida, P.A.; Soto-García, M.; Martínez-Alvarez, V.; Martin-Gorriz, B.; Baille, A. Explaining the performance of irrigation communities in a water-scarce region. Irrig. Sci. 2017, 35, 193–203. [Google Scholar] [CrossRef]
- Muema, F.; Home, P.; Raude, J. Application of Benchmarking and Principal Component Analysis in Measuring Performance of Public Irrigation Schemes in Kenya. Agriculture 2018, 8, 162. [Google Scholar] [CrossRef]
- Wang, Y.; Wu, J. An Empirical Examination on the Role of Water User Associations for Irrigation Management in Rural China. Water Resour. Res. 2018, 54, 9791–9811. [Google Scholar] [CrossRef]
- Perfetti, J.J.; Bravo-Ureta, B.E.; García, A.; Blanco, J.; Jara-Rojas, R.; Moraga, C.; Paredes, G. Adecuación de tierras y el desarrollo de la agricultura colombiana: Políticas e instituciones. Fedesarrollo 2019, 447, 456. [Google Scholar]
- DNP. Guía Para el Seguimiento de Políticas Públicas; Departamento Nacional de Planeación: Bogotá D.C., Colombia, 2018. Available online: www.dnp.gov.co (accessed on 17 February 2019).
- Ortegón, E.; Pacheco, J.F.; Prieto, A. Metodología del Marco Lógico Para la Planificación, el Seguimiento y la Evaluación de Proyectos y Programas; Naciones Unidas, CEPAL; Latinoamericano y del Caribe de Planificación Económica y Social. 2015. Available online: http://www.cepal.org/publicaciones/Ilpes/0/LCL2350P/manual42.pdf (accessed on 23 February 2022).
- DNP. Guia Metodológica Para la Formulación de Indicadores; Departamento Nacional de Planeación. Scripto Gómez y Rosales: Bogotá D.C., Colombia, 2009. Available online: www.dnp.gov.co (accessed on 17 February 2019).
- Aston, B. 9 Ejemplos de Metodología de un Proyecto, Simplificados. Metodologías de Gestión de Proyectos. Published 2022. Available online: https://thedigitalprojectmanager.com/es/metodologias-gestion-proyectos-simplificadas/ (accessed on 23 April 2019).
- Li, R.; Verhagen, W.J.C.; Curran, R. Stakeholder-oriented systematic design methodology for prognostic and health management system: Stakeholder expectation definition. Adv. Eng. Inform. 2020, 43, 101041. [Google Scholar] [CrossRef]
- Fraser, E.D.G.; Dougill, A.J.; Mabee, W.E.; Reed, M.; McAlpine, P. Bottom up and top down: Analysis of participatory processes for sustainability indicator identification as a pathway to community empowerment and sustainable environmental management. J. Environ. Manag. 2006, 78, 114–127. [Google Scholar] [CrossRef]
- Forero, A.; Cuéllar, A.; Castellanos, A.; Gómez, A.; Rojas, C.; Flórez, C.; Repetto, E.; Alvarado, S. Guía Para la Etapa de Administración, Operación, Mantenimiento y Manejo Integral de Distritos de Adecuación de Tierras; UPRA: Bogotá, Colombia, 2018. Available online: https://www.upra.gov.co/web/guest/publicaciones (accessed on 20 February 2019).
- UPRA. Linea Base de Indicadores de Usos Agropecuarios y Adecuación de Tierras; Unidad de Planificación Rural Agropecuaria: Bogotá D.C., Colombia, 2015. [Google Scholar]
- Massiris, Á. Definición de Modelo Territorial Agropecuario y Estrategia de Ocupación y Uso del Territorio Agropecuario; UPRA: Bogotá D.C., Colombia, 2016. Available online: https://www.upra.gov.co/web/guest/publicaciones (accessed on 20 February 2019).
- Betancourt, D.F. Matriz de Vester Para la Priorización de Problemas. Published 19 June 2016. Available online: www.ingenioempresa.com/matriz-de-vester (accessed on 14 June 2019).
- Golini, R.; Kalchschmidt, M.; Landoni, P. Adoption of project management practices: The impact on international development projects of non-governmental organizations. Int. J. Proj. Manag. 2015, 33, 650–663. [Google Scholar] [CrossRef]
- Zall Kusec, J.; Rist, R.C. Ten Stteps to a Results-Based Monitoring and Evaluation System; World Bank: Washington, DC, USA, 2004; Available online: www.worldbank.org (accessed on 5 November 2020).
- IDEAM. Estudio Nacional del Agua 2018; IDEAM: Bogotá D.C., Colombia, 2019. Available online: http://ideam.gov.co/web/guest (accessed on 15 October 2020).
- Córcoles, J.I.; de Juan, J.A.; Tarjuelo, J.M. La gestión del agua y la energía en el regadío mediante técnicas de Benchmarking. Español 2010, 106, 28. [Google Scholar]
Publisher’s Note: MDPI stays neutral with regard to jurisdictional claims in published maps and institutional affiliations. |
© 2022 by the authors. Licensee MDPI, Basel, Switzerland. This article is an open access article distributed under the terms and conditions of the Creative Commons Attribution (CC BY) license (https://creativecommons.org/licenses/by/4.0/).