Article

Increasing the Activity of Sugarcane Sucrose Phosphate Synthase Enhanced Growth and Grain Yields in Transgenic Indica Rice

by
Reza Anugrah Mulyatama
1,2,
Intan Ria Neliana
2,
Widhi Dyah Sawitri
3,
Hitoshi Sakakibara
4,5,
Kyung-Min Kim
6 and
Bambang Sugiharto
2,7,*
1
Graduate School of Biotechnology, University of Jember, Jember 68121, Indonesia
2
Center for Development of Advanced Science and Technology (CDAST), University of Jember, Jember 68121, Indonesia
3
Department of Agronomy, Faculty of Agriculture, University of Gadjah Mada, Yogyakarta 55281, Indonesia
4
RIKEN Center for Sustainable Resource Sciences, Yokohama 230-0045, Japan
5
Graduate School of Bioagricultural Sciences, Nagoya University, Nagoya 464-8601, Japan
6
Division of Plant Biosciences, School of Applied Biosciences, College of Agriculture & Life Science, Kyungpook National University, Daegu 702-701, Republic of Korea
7
Department of Biology, Faculty of Mathematics and Natural Science, University of Jember, Jember 68121, Indonesia
*
Author to whom correspondence should be addressed.
Agronomy 2022, 12(12), 2949; https://doi.org/10.3390/agronomy12122949
Submission received: 28 October 2022 / Revised: 22 November 2022 / Accepted: 23 November 2022 / Published: 24 November 2022

Abstract

:
Sucrose is the primary form of mobile photoassimilates, and its level is regulated by sucrose-phosphate synthase (SPS) in plants. Increasing in the SPS activity was accompanied by an increase in sucrose accumulation. This study was designed to examine the effect of the overexpression sugarcane SoSPS1 gene on sucrose metabolizing enzymes, growth, and grain yield of indica rice. The SoSPS1 gene was constructed in a binary vector under the control of a rice ubiquitin promoter and transformed into indica rice using an Agrobacterium vector. Five lines of transgenic rice were selected to develop homozygous transgenic lines and used for analysis. The overexpression of the SoSPS1 gene significantly increased the transcript and protein levels, followed by increasing in SPS activity and sucrose content in the leaves of the transgenic rice lines. Moreover, the activity of soluble acid invertase (SAI) was elevated rather than sucrose synthase (SuSy) in the transgenic lines. The increase in the sucrose-degrading enzymes leads to an increase in plant growth and development. The plant height and number of tillers were significantly higher in the transgenic line compared to non-transgenic (NT) rice. In addition, the amylose content, the number of seeds per panicle, and the weight of 1000 grains of seed, including dry biomass weight, were increased in the transgenic lines. The results indicated that enhancement of SPS activity, as well as sucrose content, provides a higher carbon partitioning for higher growth and productivity of the transgenic rice lines.

1. Introduction

Rice (Oryza sativa L.) is the most widely consumed and major staple food crop in Asian countries. Japonica and indica are two main subspecies of Asian cultivated rice. Several attempts have been made to increase its productivity, particularly japonica rice. In indica rice, there are many reports of developing biotic and abiotic stress-tolerant rice cultivars [1,2]. However, the strategies for increasing yield are still limited. To address these issues, a strategy to increase biomass by improving the carbon assimilation process has been proposed.
The types of photoassimilates differ among species. For example, rice leaves are known as sugar-forming leaves because the sucrose accumulation is higher than that in starch in leaves [3,4]. Increased accumulation of sucrose as the main photosynthate accommodates the partitioning of carbon between sucrose and starch and affects the grain characteristics in cereal yields, including rice [3,5,6]. The physiological characteristics of sugar-forming leaves remain unclear. Sucrose in the leaves, source tissue, is further translocated into the sink organs via the phloem to control the cellular metabolism, cell wall biosynthesis, and respiration or is converted to starch for storage [7,8,9]. In order to accommodate excess assimilation due to increased photosynthetic rate, carbohydrate is utilized and transported in response to high sucrose in rice leaves. Therefore, source-sink balance in sucrose metabolism is an important point in mediating the regulation of carbon partitioning in plants.
In higher plants, the accumulation of sucrose is regulated by sucrose metabolism enzymes. The key enzyme that catalyzes the reaction for the formation of sucrose-6-phosphate (S6P) is sucrose-phosphate synthase (SPS, EC 2.4.1.14), and the formation of free sucrose and inorganic phosphate is catalyzed by sucrose-phosphate phosphatase (SPP, EC 3.1.3.24). Under certain physiological conditions, sucrose is cleaved by the readily reversible reaction of sucrose synthase (SuSy, EC 2.4.1.13). In contrast, the breakdown of sucrose into hexoses is regulated by an irreversible reaction of invertases, which are localized in the cytosol, cell wall, or vacuole [10,11,12]. There are several reports associating sucrose accumulation in leaves with increased SPS activity [13,14]. Many studies have been conducted in order to understand the role of SPS in sucrose accumulation. Overexpression of SPS resulted in increased sucrose accumulation in transgenic tomatoes [15,16] and Arabidopsis thaliana [17]. Elevated SPS activity in leaves can reportedly be used as an indicator of improved yield character in different species, such as in rice [3], cotton [18], and potato [19]. In sugarcane, SoSPS1 is abundantly expressed in photosynthetic organs and considered a representative of the regulation of carbon allocation [20,21]. Previous studies on transgenic sugarcane revealed that overexpressing SoSPS1 induces enhancement of sugarcane biomass production [22,23].
In this study, we investigated the effect of overexpressing sugarcane SPS (SoSPS1) in indica rice to elucidate the role of SPS in improving rice yield. Therefore, in addition to the yield characterization, we analyzed the enzyme regulation responsible for sucrose metabolism in transgenic rice. Overexpression of the SoSPS1 gene increased SPS activity and sucrose content, followed by the increase in activities of sucrose degrading enzymes. The overexpression of the SoSPS1 gene enhanced plant height, the number of tillers, and grain yield in transgenic rice.

2. Materials and Methods

2.1. Plant Material and Agrobacterium-Mediated Transformation

Mature, dry seeds of indica rice (Oryza sativa) cultivars named Ciherang, supplied by the Indonesian Center for Rice Research, were used for callus induction. The rice seeds were dehusked, sterilized with 70% ethanol for 5 min, soaked with 1% sodium hypochlorite for 10 min, and rinsed with sterile water four times. Embryogenic callus was induced by incubation of the sterilized seeds in callus induction media (CIM3) media containing 3 mg/L 2,4-dichlorophenoxyacetic acid (2,4-D) as previously described [24]. The embryogenic callus was dissected and co-cultivated with Agrobacterium tumefaciens GV3101 harboring binary vector of pBIUbi-SoSPS1 in MS basal media containing 100 mg/L acetosyringone for three days. The pBIUbi-SoSPS1 vector construct was developed by replacing the 35S promoter in the pBI121-SoSPS1 construct [22] with the rice ubiquitin promoter [25]. After co-cultivation, the infected calli were rinsed with sterilized water containing 500 mg/L cefotaxime to remove Agrobacterium. The calli were then incubated on CIM3 containing 500 mg/L cefotaxime without antibiotic selection for a week and were subsequently transferred to regeneration media (RM2) [24] containing 50 mg/L kanamycin for antibiotic selection with illumination. After five successive cycles on the selection media, regenerated plantlets were transferred to pots containing sand media supplied with Hoagland solution in growth chambers for two weeks, followed by transplantation to pots containing soil media and grown in phytotron till maturity under controlled conditions. The growth conditions were set at a temperature of 25–27 °C and humidity 70–80%.
The harvested T1 seeds were germinated on a seed tray for a month and randomly selected using PCR among the transformants. The five selected clones were transplanted in pots containing soil and grown in the greenhouse until maturity. T2 seeds were similarly selected and grown to develop T3 seeds. After germination of T3 seeds and PCR analysis, the selected T3 plants were grown in triplicates to maturity in the greenhouse for analysis and characterization. The terms T1, T2, and T3 were defined according to the previously described report [26].

2.2. Genomic PCR Analysis

Total genomic DNA was extracted from 2.5 g leaves of transgenic lines and non-transgenic (NT) rice as previously described [27] with little modifications. The leaves were pulverized in liquid nitrogen in a mortar and pestle, and the powder was continuously ground in 5 mL extraction buffer containing 100 mM Tris-HCl (pH 8), 50 mM EDTA, 500 mM NaCl, 5% (w/v) SDS, and 5 mM β-mercaptoethanol. After incubation at 65 °C for 10 min, 2.5 mL of 5 M potassium acetate was added, followed by incubation on ice for 10 min. The solution was then centrifugated at 12,000× g for 10 min, and isopropanol was added to precipitate the DNA. The DNA pellet was dissolved in 10 mM TE buffer, and RNA contamination was removed by adding RNAase. The amount of DNA was measured using a NanoVue spectrophotometer (GE Healthcare, Chicago, IL, USA) at 260 nm.
PCR analysis was conducted to detect the nptII gene as the marker using primers as previously described [22]. The steps of the PCR reaction include pre-denaturation at 95 °C for 5 min, followed by 30 cycles of denaturing at 95 °C for 30 s, annealing at 55 °C for 30 s, elongation at 72 °C for 1 min, and final extension for at 72 °C for 5 min. The primers nucleotides sequences were 5′-TGAATGAACTGCAGGACGAG-3′ and AGCCAACGT ATGTCCTGAT for forward and reversed primer, respectively. The PCR reaction was performed in a T100 thermal cycler (Bio-Rad Laboratories, Hercules, CA, USA), and the PCR product was separated using 1% (w/v) agarose gel electrophoresis and documented with GelDoc (Major Science, Saratoga, CA, USA).

2.3. Transcript Levels of Sucrose Phosphate Synthase Gene

In order to determine transcript levels of the SoSPS1 gene, total RNA was extracted in triplicates from T3 generation rice by grinding the leaves in liquid nitrogen and isolated using RNAprep pure plant plus kit (Tiangen, Beijing, China) following the manufacturer’s instructions. In order to avoid DNA contamination, the isolated total RNA was treated with DNAse and stored at −80 °C after quantification using a Nanovue spectrophotometer (GE Healthcare). One microgram of total RNA was converted to cDNA using oligo(dT) primer with the iScript cDNA synthesis kit (Bio-Rad Laboratories) at 46 °C for 20 min, according to the manufacturer’s protocol. The abundance of SoSPS1 transcripts was quantified using LightCycler® 480 SYBR green I master mix (Roche, Basel, Switzerland) on a CFX connect real-time detection system (Bio-Rad Laboratories), using pair of primer SoSPS1-F (5′-AATTTGGGCTGAGGTGATGC-3′) and SoSPS1-R (5′-ATGATCCTCGCGTTGTCAAG-3′). Reaction conditions for the real-time PCR were 95 °C for 2 min, followed by 40 cycles of 95 °C for 5 s and 60 °C for 10 s. The Actin expression was determined using the primer pair Actin F (5′-GAGCAAGAGTTGGAAACTGCC-3′) and Actin R (5′-ATGGCTGGAAGAGGACCTCAG-3′) and used as the reference gene.

2.4. Protein Extraction, Enzyme Assay, and Immunoblotting

Fully developed young leaves were harvested during the daytime in triplicates and immediately frozen in liquid nitrogen for protein and sucrose analysis. One gram of frozen leaves was pulverized in liquid nitrogen, and the frozen powder was continuously ground in three-time volume (w/v) of extraction buffer containing 50 mM MOPS-NaOH (pH 7.5), 10 mM MgCl2, 1 mM EDTA, 2.5 mM dithiothreitol (DTT), 1 mM phenylmethanesulfonyl fluoride (PMSF) in the presence of 10 percent polyvinylpyrrolidone (PVP). After centrifugation at 14,000× g at 4 °C for 10 min, the supernatant containing soluble proteins was desalted using Sephadex G-25 (Pharmacia, Wilmington, NJ, USA) and stored at −80 °C for enzymatic analysis. Protein concentration was measured spectrophotometrically using Bradford reagent (Bio-Rad Laboratories).
Activities of SPS, SuSy, and soluble acid invertase (SAI) were determined in the desalted crude extract according to previously described methods [22]. SPS activity was assayed in the direction of sucrose-6 phosphate formation. In short, the extract samples were incubated for 0, 5 and 10 min at 25 °C and the reactions were terminated using 1 M NaOH. After addition of 0.25 mL resorcinol (1%) and 0.75 mL of 30% HCl, the developed color was measured using spectrophotometer at 520 nm. SuSy activity was measured in the direction of sucrose cleavage using 30 µL desalted extract and 70 µL reaction mixture containing 20 mM Tris-HCl (pH 7.0), 100 mM sucrose, 4 mM UDP and incubated at 37 °C for 30 min. SAI was also detected in the direction of sucrose degradation using 50 μL desalted leaf extract that was added to 50 μL reaction mixture containing 1 M sodium acetate buffer (pH 4.5), 0.25 M sucrose and incubated at 37 °C for 30 min. The reactions were terminated by heating at 95 °C for 5 min and the content of resultant reducing sugar from SuSy and SAI activities were determined using DNS (3:5-dinitrosalicylic acid) reagent with a spectrophotometer at 540 nm.
To detect SPS protein levels, immunoblot analysis was conducted using a specific antibody against sugarcane SPS [21]. Soluble protein extract (30 µg) was separated using SDS-PAGE (12% and 5% acrylamide gels) and transferred onto the Immobilon-P transfer membrane (Millipore, Burlington, MA, USA) using semi-dry trans-blotter (Bio-Rad Laboratories). The membrane was then incubated with polyclonal antibody against sugarcane SPS diluted in TBS containing 0.5% skimmed milk and incubated overnight. After washing three times with TBS, the membrane was incubated with the alkaline phosphatase-conjugated goat anti-rabbit IgG secondary antibody (Bio-Rad Laboratories) for 60 min. The SPS protein band was visualized by incubating the membrane with a mixture of the substrate, 5-bromo-4-chloro 3-indolyl-phosphate (BCIP), and nitroblue tetrazolium (NBT) (Bio-Rad Laboratories).

2.5. Sucrose Analysis in Rice Leaves

Frozen rice leaves (2 g) were ground in liquid nitrogen followed by continuous grinding in 5 mL of methanol: chloroform: water mixture (12:5:3), then incubated at 60 °C for 10 min. After centrifugation at 5000× g, the pellet was rinsed with the mixture and the supernatant fractions from five successive washes were pooled. The combined supernatants were dried at 40 °C using rotary evaporator and the residues were dissolved in distilled water. Concentration of sucrose was determined using HPLC (Hitachi, Tokyo, Japan) according to the previously described method [22].

2.6. Analysis of Amylose Content in Rice Grain

Amylose content of defatted rice flour was analyzed using the iodine reagent method [28]. Defatted rice flour (20 mg) was taken in 50 mL test tube and 10 mL of 1 N KOH was added. The suspension was mixed using a vortex. The dispersed sample was transferred into a 100 mL volumetric flask and 1 molL−1 HCl (5 mL) was added followed by the addition of 0.5 mL of iodine reagent. The solution was diluted to 100 mL and the absorbance was measured at 620 nm using spectrophotometer after incubating for 20 min at 30 °C. Pure amylose was used for the preparation of the standard curve to calculate amylose content (Sigma, St. Louis, MI, USA).

2.7. Plant Growth and Productivity

The plant growth rate was observed regularly by measuring plant height and number of tillers at one, two, and three months after transplanting (MAP). The observation was conducted in triplicates until plant growth reached the maximum growth stage. At harvest, the panicle was removed from plants, and rice shoot biomass was dried in an oven at 105 °C for three days, then, the dry weight of the biomass was measured. The productivity of rice was determined by measuring the number of seeds per panicle and the weight of 1000 seeds.

2.8. Statistical Analysis

Statistical analyses were performed in triplicates and represented as the mean ± standard errors. Statistical significance was calculated using Dunnett’s-test with an ANOVA to determine significant differences. The p-value of 0.05 and 0.01 was considered as statistically significant differences.

3. Results

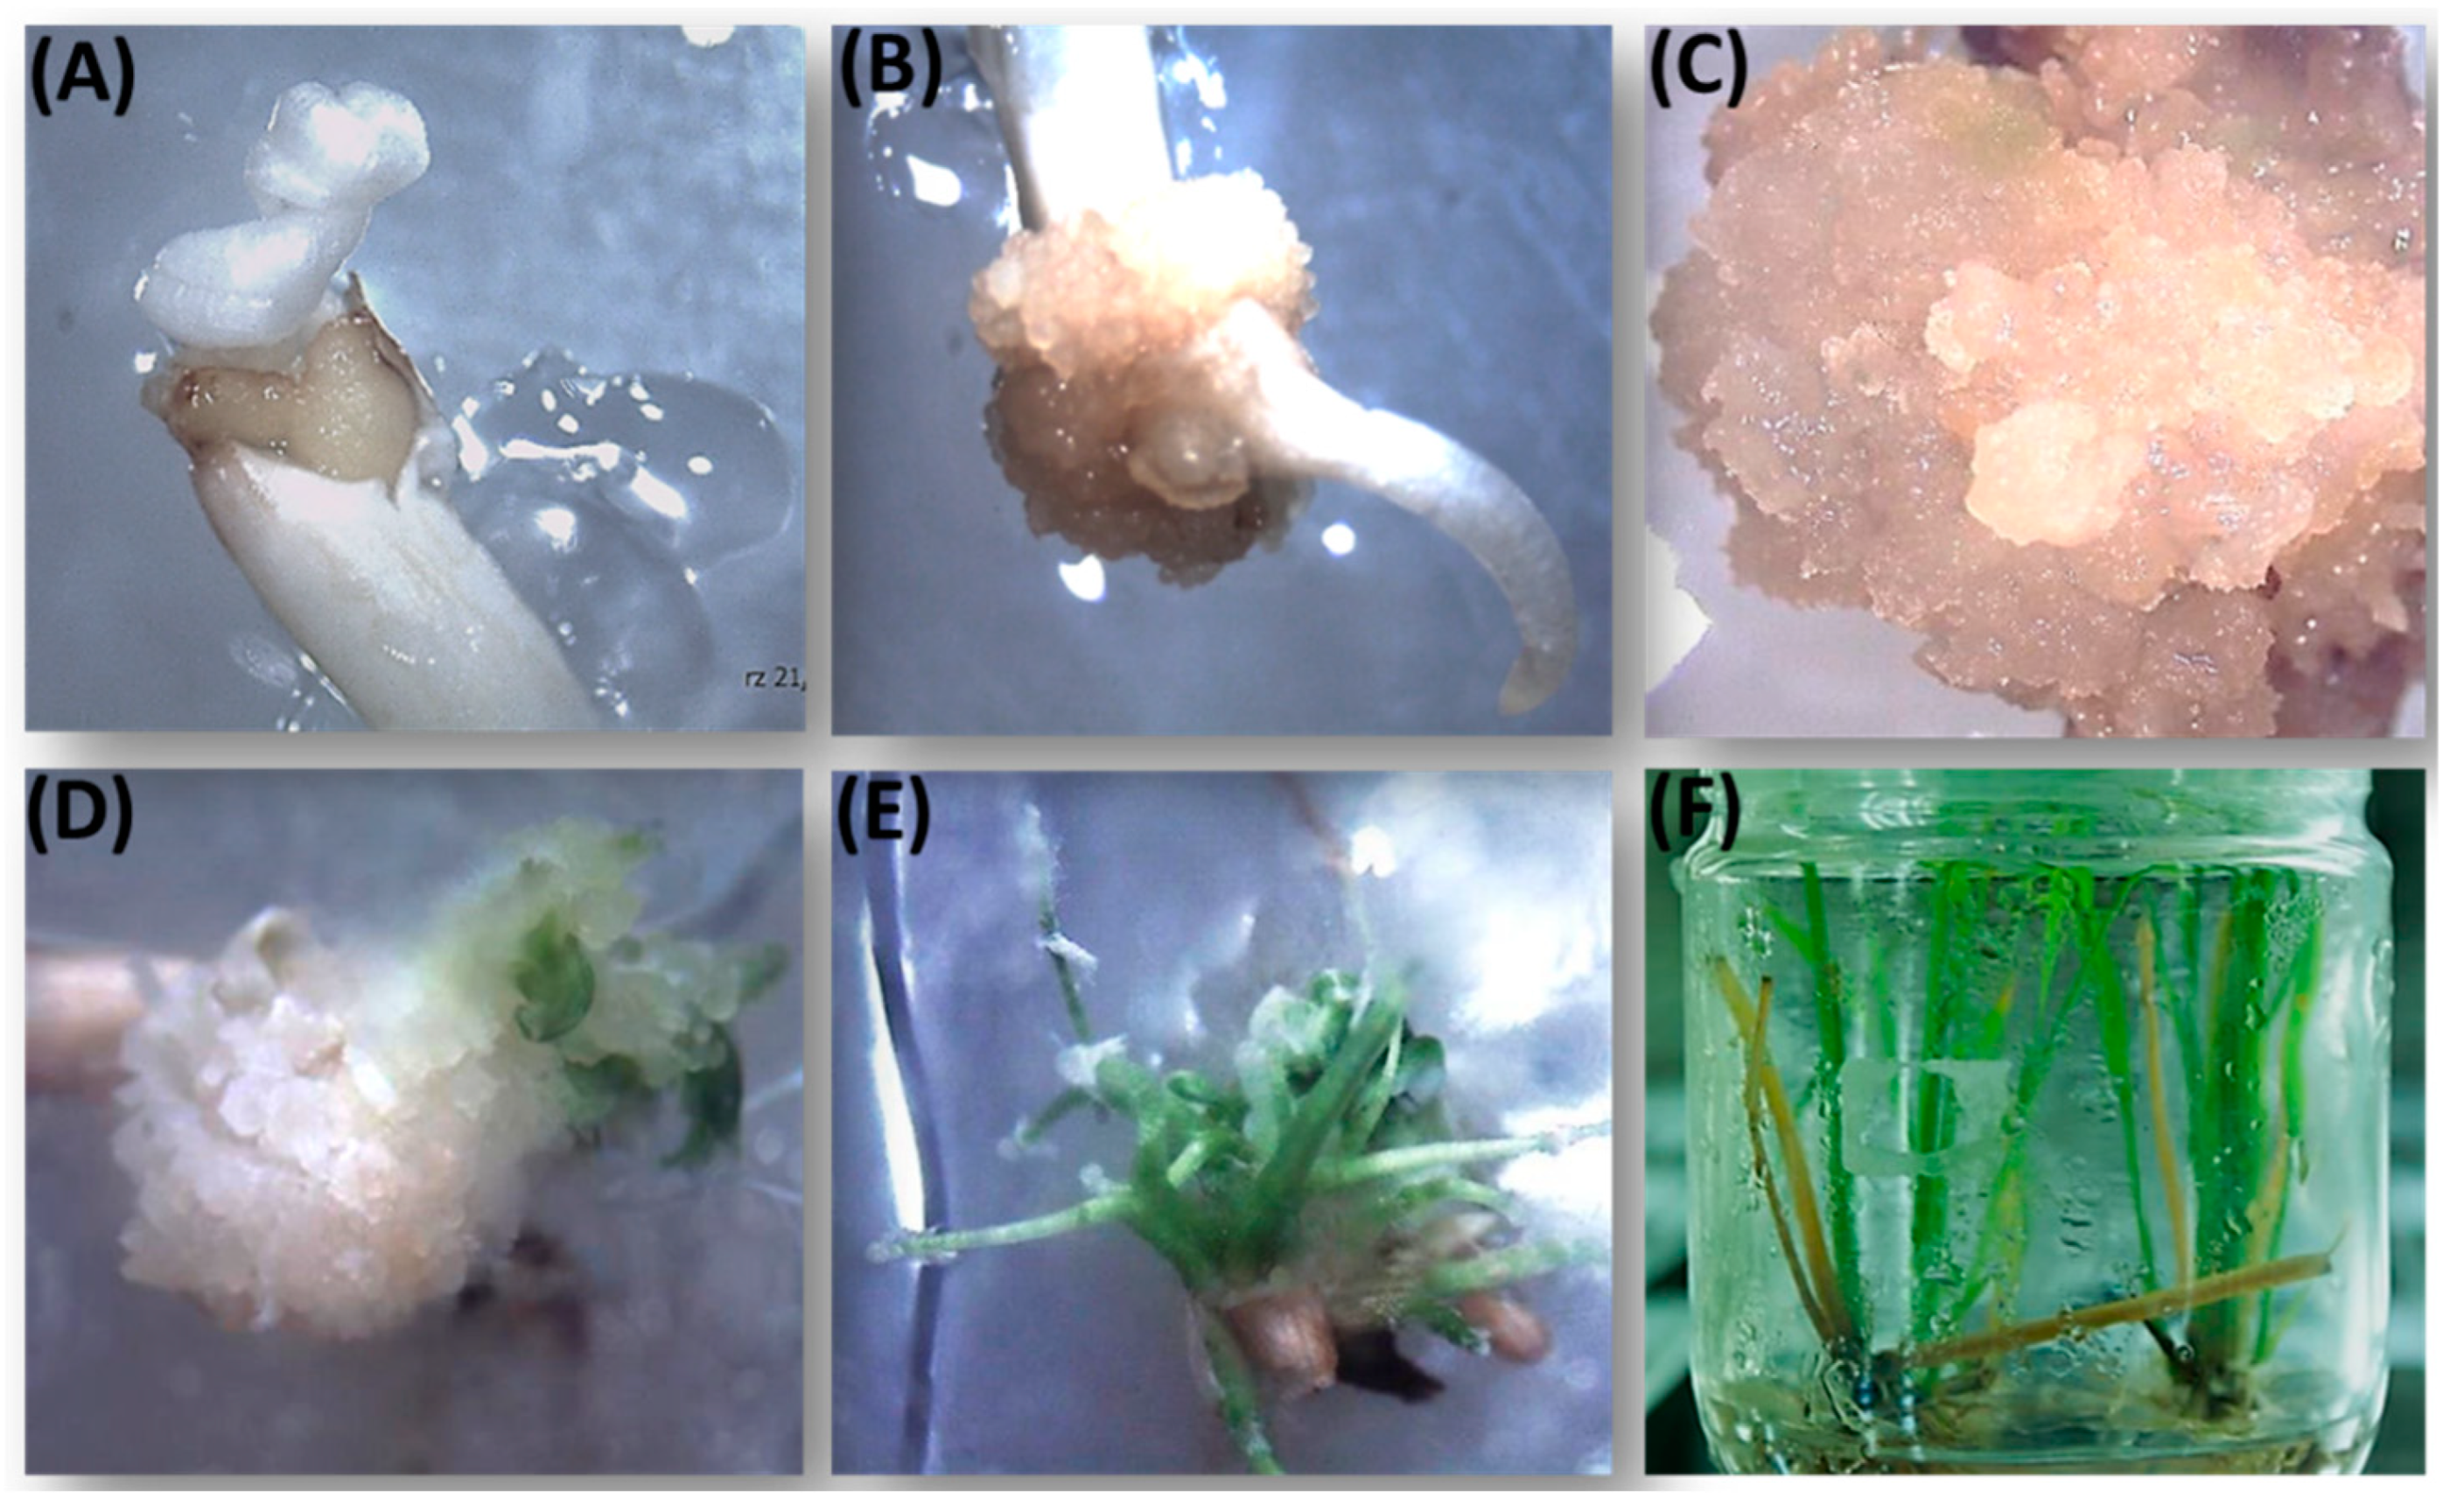
3.1. Rice Transformation and Molecular Analysis of the Transformants

Rice transformation was conducted using an embryogenic callus that was induced by incubating the seeds of rice cultivars Ciherang in the MS basal medium containing 2,4-D (4 ppm) for two weeks, as previously described [24]. The embryogenic calli with a yellowish-white appearance and compact and globular structures were separated (Figure 1A,B) and used for co-cultivation with Agrobacterium. The infected calli were transferred to the selection media containing 2 ppm 1-naphthaleneacetic acid (NAA) and 4 ppm kinetin and incubated under illumination to regenerate plantlets (Figure 1C–E). The callus developed green spots and regenerated into antibiotic-resistant plantlets. Eleven antibiotic-resistant plantlets were generated from two independent experiments (Figure 1F). The plantlets were acclimated in the growth chamber and transferred to the greenhouse for further analysis.
To determine transgene integration, genomic DNA was isolated from rice leaves and used for the detection of the nptII marker gene using PCR analysis. Among the 11 acclimated plants, 10 transgenic rice lines were confirmed to contain transgene of nptII, and it was absent in the NT rice, which was used as the control (Figure S1A). In order to obtain stable transgenic lines (homozygosity), five lines from a seedling of the T1 generation were randomly screened using PCR analysis and successively grown in the greenhouse until the T3 generation. This PCR screening was conducted because the transgenic lines turned yellowish-albino and died during kanamycin selection. Amplification of the nptII gene showed a corresponding DNA band with a molecular size of 550 kb in the screened transgenic lines of SPS4, SPS7, SPS9, SPS10, and SPS11 (Figure S1B). The DNA bands were consistently visible in the T1, T2, and T3 generations. The resulting seeds from the T3 generation were assumed as homozygous, stable transgenic lines, stored in the cold, and used for molecular and biochemical analysis.

3.2. The RNA Transcript and Protein Expression of Sucrose-Phosphate Synthase

The relative expression of the SoSPS1 gene in the five stable transgenic lines and NT rice was determined using quantitative RT-PCR (qRT-PCR). Actin was used as a reference gene for the calculation of relative gene expression. The level of an RNA transcript of the SoSPS1 gene in the transgenic lines was 1.6–2.4 fold higher than those in NT rice (Figure 2A). Among the transgenic lines, the SPS4 line showed the highest transcription level, but the level was comparable to the other transgenic lines.
In order to validate the effect of increased SoSPS1 gene expression on protein levels, immunoblot analysis was conducted according to the previously described method [22]. All transgenic lines showed the expression of SPS protein with an approximate molecular size of 120 kDa. The levels of SPS protein were increased in all transgenic lines corresponding to the transcript levels (Figure 2B). Interestingly, the polyclonal sugarcane SPS antibody did not cross-react with rice SPS (NT). A similar result was reported that the antibody raised against maize SPS did not cross-react with rice SPS protein [3].
Gene expression results were validated and reflected in the protein levels as well as the enzyme activity. SPS activity was significantly increased in the five transgenic lines compared to those in the NT rice (Figure 2C). SPS4 transgenic line showed the highest increase in activity was approximately 3-fold higher than in the NT. The variation in SPS activity was parallel to the transcript levels, except for the SPS11 line, which showed a lesser increase in enzyme activity. The lower SPS activity might be due to inefficient activation of the transgene sugarcane SPS in the transgenic line, as reported by [3].

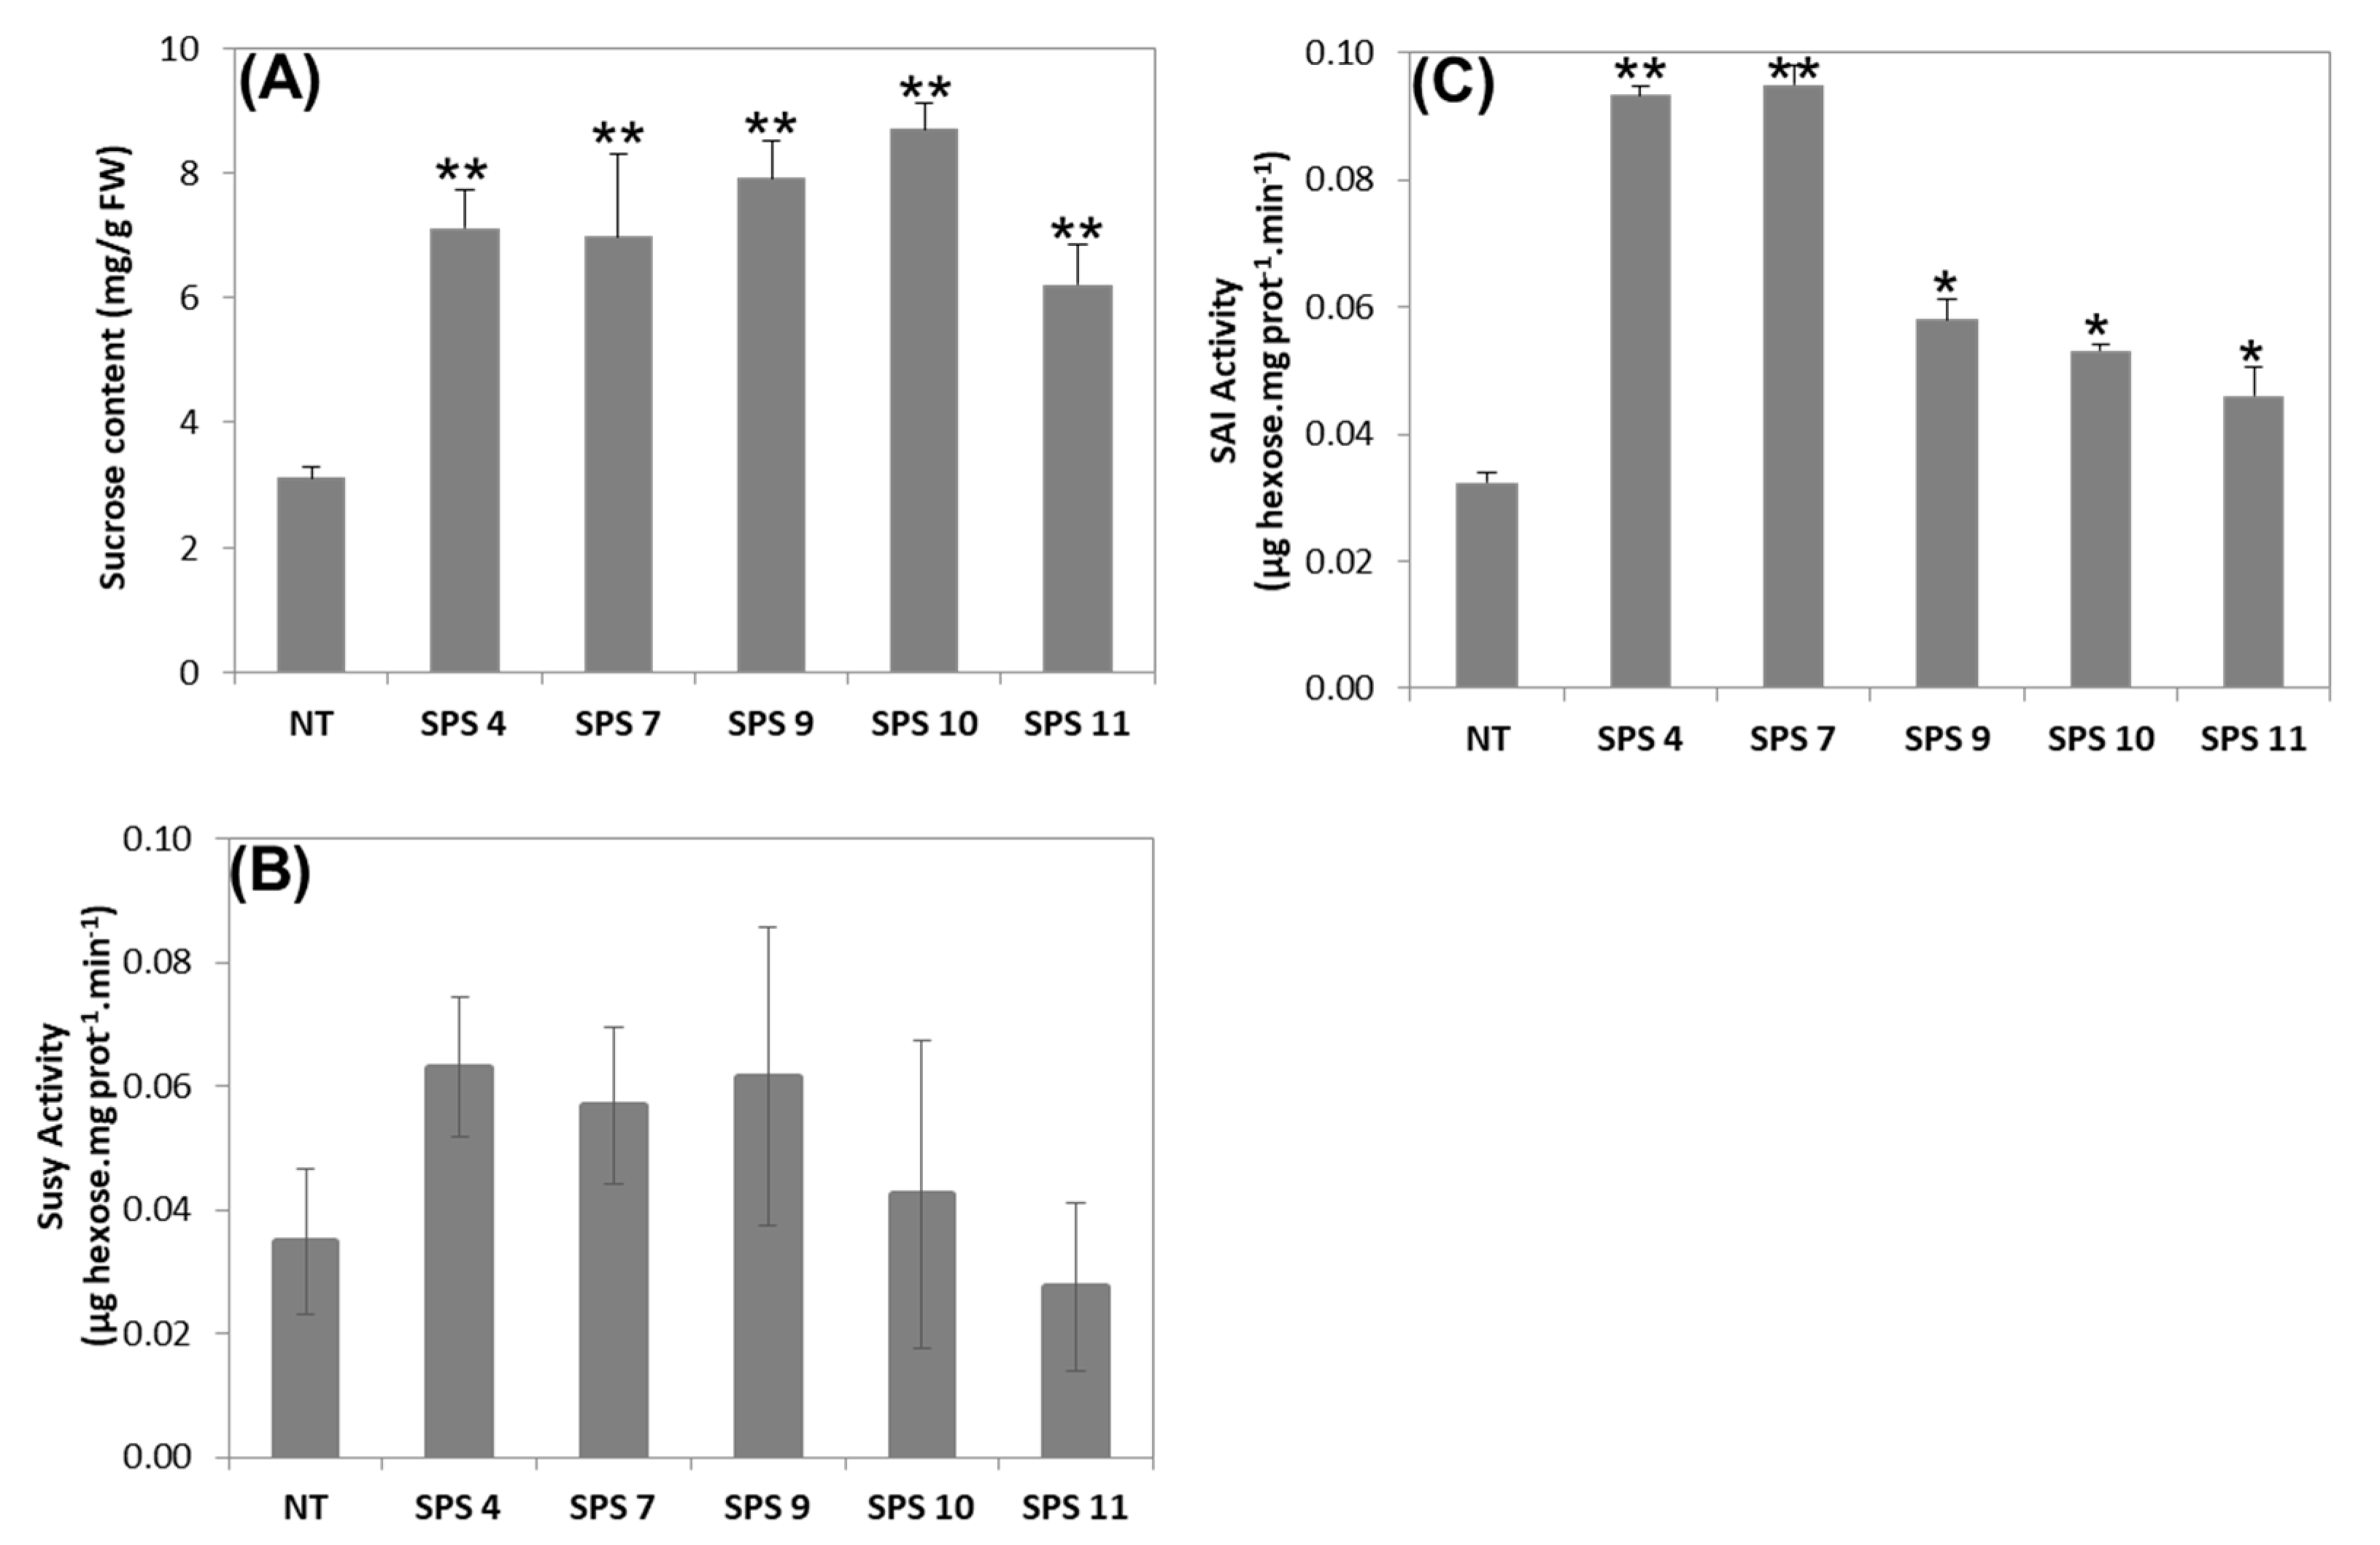
3.3. Sucrose Content and Activity of Sucrose Degrading Enzymes

In plants, sucrose and starch are the end products of the photosynthetic carbon assimilation pathway. The concentration of sucrose in the leaves of the transgenic lines and NT was measured to determine the effect of SPS activity on sucrose content. As expected, sucrose content was significantly increased in leaves of the five stable transgenic lines compared to those of NT rice in response to increased SPS activity (Figure 3A).
It was previously reported that the elevation of SPS activity was accompanied by increasing activity of sucrose-degrading enzymes in transgenic sugarcane [22]. In plants, SuSy and SAI are sucrose-degrading enzymes. Measurement of enzyme activity showed that SuSy activity was not significantly increased in the leaves of the transgenic lines. The activity was slightly lower in SPS11 lines compared to those of the NT rice (Figure 3B). However, SAI activity was significantly increased (1.5–3 fold) in all transgenic lines (Figure 3C). The increase in SAI activity was significantly higher as compared to the increase in SuSy activity in the transgenic lines. These different responses might be due to the involvement of distinct biochemical pathways and carbon partitioning in the transgenic line. An increase in the activity of SuSy leads to increased cell wall synthesis and starch content [29], whereas SAI supports plant growth and development by the generation of ATP and NADH [9]. These results suggest that sucrose is degraded by SAI and SuSy in the leaves, and partly sucrose, which is not being degraded is exported for starch synthesis in the seed.

3.4. Plant Growth and Production

Sucrose is the primary product of carbon assimilation and is used to provide energy and carbon sources for plant growth. In order to determine the effect of the introduction of SPS sugarcane on plant growth, plant height and the number of tillers were observed regularly at one, two, and three months after transplantation (MAP). The plant height was defined by the measurement of the shoot from the base up to the leaf tip. Observation of plant growth showed that all transgenic lines grew faster compared to NT rice at one MAP. The transgenic lines continued to grow, and the plant height was significantly increased in all transgenic lines at the maximum growth stage (3 MAP) (Table 1). Compared to the NT rice, the plant height in transgenic plants was increased by 29.4% in the maximum plant growth stage. The number of tillers was higher at the beginning of 1 MAP and significantly increased at 2–3 MAP (Table 1). The increase in tiller number reached higher levels than the increment in plant height (up to 53.2% compared to NT rice). Furthermore, all the shoot tillers produced panicles. These results indicate that enhancement of SPS activity, as well as sucrose content, provides higher carbon partitioning for the growth and development of plants.
Differences in the vegetative growth rate affect the generative phase and plant productivity. In order to determine the rice grain yield, the content of amylose, the number of seeds per panicle, and the weight of 1000 grains were determined. Starch is the major polysaccharide in rice seeds and is composed of a mixture of amylose and amylopectin. The ratio of amylose to amylopectin affects the properties of rice starch [30]. Measurement of amylose content showed a significant increase in rice seeds, and the grain weight of 1000 seeds was significantly increased in all transgenic lines (Table 2). The rice-grain size was bigger in the transgenic lines (Figure S2). Seed number per panicle was significantly increased in all transgenic lines (41.2–79.2%) as compared to those of NT rice (Table 2). After removing the panicle, the rice biomass was separately dried up in an oven, and the dry weight was measured. The dry weight of the biomass was significantly increased in SPS4 and SPS7 transgenic lines. Representative plants belonging to the five transgenic lines were photographed at the grain-filling stage and consistently showed a higher growth rate compared to that of NT (Figure 4). By considering the increases in tiller number, grain number per panicle, and grain weight, the rice grain yield per plant was increased compared to those of the NT rice plants. Overexpression of a maize SPS gene was reported to improve the yield characteristics of potatoes under field conditions [19]. These results indicate that the overexpression of the SoSPS1 gene increased the supply of carbon from the source to sink tissue in transgenic rice.

4. Discussion

We have shown that overexpression of the SoSPS1 gene significantly increased SPS activity concomitant with sucrose content in leaves of transgenic rice. Interestingly, increasing the sucrose content enhanced the sucrose-degrading activities of SAI and Susy. This result was in parallel with the previous finding that increasing sucrose content enhanced sucrose degrading enzyme activity in transgenic sugarcane [22]. Previous studies have reported similar effects of overexpression of the SPS gene on increased plant growth in transgenic tobacco [13], Brachypodium distachyon [31], and sugarcane [23]. Sucrose is degraded by SAI and Susy to generate glucose and fructose, which subsequently enters into distinct biochemical pathways such as respiration, biosynthesis of cell wall polysaccharides, and storage compounds. In this study, sucrose was cleaved and resulted in greater growth of transgenic rice as revealed by significantly increased in plant height, number of tiller as well as number of seed per panicle (Table 1 and Table 2). Several reports also showed that overexpression of the SPS gene retarded senescence in transgenic rice [3], potato [19], and tobacco [13]. Although chlorophyll content was not measured, the retardation in leaf senescence might be responsible for extending photosynthetic activity and sucrose export to improve the growth and productivity of transgenic rice. These results indicate that sucrose is an important factor which provides energy and strengthens the carbon skeleton for plant growth.
Sucrose cleavage by SuSy yields UDP-glucose, which is used as a substrate for cell wall development and cellulose production [29]. Overexpression of the SPS gene has been reported along with altered fiber traits in cotton fiber cells [18] and longer fiber in transgenic tobacco [13]. Consequently, the total stem biomass was increased in transgenic tobacco compared to the control. Similarly, overexpression of the SoSPS1 gene increased dry-weight biomass in all transgenic rice lines (Table 2). The increase in SuSy activity was lower as compared to SAI in the transgenic lines, which might have consequences in fiber synthesis; however, this requires further examination. The entry of sucrose into cellular metabolism in plants reveals that invertase is required for normal growth but not SuSy [32]. This different carbon partitioning between transgenic rice and tobacco or cotton might be dependent on the species.
Sucrose is the end-product of photosynthetic carbon assimilation that plays important role in plant growth and development. The synthesized sucrose in leaves is subjected to cleavage for metabolite production or export to sink tissue via the sucrose loading and unloading mechanisms. In order to maintain a concentration gradient in the sink tissue, sucrose is converted into other molecules, such as starch. The increase in starch content in the sink tissue was reported in transgenic potato overexpressing maize SPS gene [19]. Sugar is not only used as a carbon and energy source but also plays pivotal roles as a signaling molecule. Many reviews have discussed the various aspects of sugar regulation in plants [12,33,34,35,36]. Therefore, manipulating the rate of synthesis, transport, and degradation of sucrose affects plant growth and development. In this study, increasing sucrose synthesis by overexpression of the SoSPS1 gene resulted in the enhancement of sucrose degrading activities followed by improvement of the growth and development of transgenic rice. Similar to other organisms, plant development requires crucial nutrients such as soluble sugar. The sugar levels affect the developmental processes of plants, such as seedling development, leaf formation, organ number, flowering, and tuber formation [37]. Sucrose is cleaved by invertase and SuSy into hexose for biomass accumulation in plants. Additionally, sugar controls metabolism, growth, stress responses and development from embryogenesis to senescence [33]. Furthermore, sucrose can act as a signaling molecule that regulates distinct aspects of plant development. Genetic analysis revealed that sugar activates hexokinase (HXK) and controls different molecular mechanisms at multiple levels, including transcription, translation, and enzyme activity [33,36]. For example, HXK plays important role in tuber root development and starch accumulation in cassava [38], and HXK can repress the expression of some photosynthetic genes in response to high glucose (sugar) concentrations [39,40]. The sugar-signaling sensor is a highly complex process that remains a mystery and needs to be elucidated [41]. Therefore, we hypothesize that the increasing sucrose cleavage in the SPS overexpressed transgenic rice can be directed to ensure the maintenance of sugar homeostasis. The sucrose content cannot drastically increase and should be degraded or translocated to prevent repression of gene expression. Understanding the fundamental mechanisms involved in sugar signaling will provide opportunities for improving plant growth and productivity.

5. Conclusions

The overexpression of the sugarcane SoSPS1 gene significantly increased the transcript and SPS activity as well as sucrose content in the transgenic indica rice. The increase in sucrose was followed by the increase in SAI and SuSy in the transgenic lines. The increase in the sucrose degrading enzymes leads to enhance plant growth and grain yield of the transgenic lines compared to non-transgenic (NT) rice.

Supplementary Materials

The following supporting information can be downloaded at: https://www.mdpi.com/article/10.3390/agronomy12122949/s1, Figure S1: PCR amplification of nptII genomic DNA of rice in T0 (A) and T1, T2, and T3 (B) generation. Genomic DNA was extracted from the leaves of T1, T2, T3, and NT (non-transgenic) rice and used for PCR amplification using a set of primers for nptII. PCR amplified DNA was separated on 1% agarose gel and photographed using GelDoc; Figure S2: Comparison of the rice-grain size between the transgenic lines and NT rice.

Author Contributions

Conceptualization, B.S., H.S. and K.-M.K.; methodology, B.S. and R.A.M.; validation, W.D.S. and B.S.; formal analysis, R.A.M. and I.R.N.; investigation, R.A.M. and I.R.N.; data curation, R.A.M. and I.R.N.; writing—original draft preparation, B.S. and W.D.S.; writing—review and editing, B.S. and H.S.; supervision, B.S.; project administration, W.D.S.; funding acquisition, B.S. and K.-M.K. All authors have read and agreed to the published version of the manuscript.

Funding

This research received no external funding.

Institutional Review Board Statement

Not applicable.

Informed Consent Statement

Not applicable.

Data Availability Statement

Not applicable.

Acknowledgments

The authors would like to Risky Mulana Anur for helping with statistical analysis.

Conflicts of Interest

Authors declare no conflict of interest.

References

  1. Mohanty, A.; Kathuria, H.; Ferjani, A.; Sakamoto, A.; Mohanty, P.; Murata, N.; Tyagi, A. Transgenics of an Elite Indica Rice Variety Pusa Basmati 1 Harbouring the CodA Gene Are Highly Tolerant to Salt Stress. Theor. Appl. Genet. 2002, 106, 51–57. [Google Scholar] [CrossRef] [PubMed]
  2. Nagadhara, D.; Ramesh, S.; Pasalu, I.C.; Rao, Y.K.; Krishnaiah, N.V.; Sarma, N.P.; Bown, D.P.; Gatehouse, J.A.; Reddy, V.D.; Rao, K.V. Transgenic Indica Rice Resistant to Sap-Sucking Insects: Transgenic Rice Resistant to Sap-Sucking Insects. Plant Biotechnol. J. 2003, 1, 231–240. [Google Scholar] [CrossRef] [PubMed]
  3. Ono, K.; Ishimaru, K.; Aoki, N.; Takahashi, S.; Ozawa, K.; Ohkawa, Y.; Ohsugi, R. Characterization of a Maize Sucrose–Phosphate Synthase Protein and Its Effect on Carbon Partitioning in Transgenic Rice Plants. Plant Prod. Sci. 1999, 2, 172–177. [Google Scholar] [CrossRef]
  4. Okamura, M.; Hirose, T.; Hashida, Y.; Ohsugi, R.; Aoki, N. Suppression of Starch Accumulation in ‘Sugar Leaves’ of Rice Affects Plant Productivity under Field Conditions. Plant Prod. Sci. 2017, 20, 102–110. [Google Scholar] [CrossRef] [Green Version]
  5. Gesch, R.W.; Vu, J.C.V.; Boote, K.J.; Hartwell Allen, L.; Bowes, G. Sucrose-phosphate Synthase Activity in Mature Rice Leaves Following Changes in Growth CO 2 Is Unrelated to Sucrose Pool Size. New Phytol. 2002, 154, 77–84. [Google Scholar] [CrossRef] [Green Version]
  6. Wang, L.; Lu, Q.; Wen, X.; Lu, C. Enhanced Sucrose Loading Improves Rice Yield by Increasing Grain Size. Plant Physiol. 2015, 169, 01170. [Google Scholar] [CrossRef] [PubMed] [Green Version]
  7. Kutschera, U.; Heiderich, A. Sucrose Metabolism and Cellulose Biosynthesis in Sunflower Hypocotyls. Physiol. Plant. 2002, 114, 372–379. [Google Scholar] [CrossRef] [PubMed]
  8. Maloney, V.J.; Park, J.-Y.; Unda, F.; Mansfield, S.D. Sucrose Phosphate Synthase and Sucrose Phosphate Phosphatase Interact in Planta and Promote Plant Growth and Biomass Accumulation. J. Exp. Bot. 2015, 66, 4383–4394. [Google Scholar] [CrossRef] [Green Version]
  9. Sturm, A. Invertases. Primary Structures, Functions, and Roles in Plant Development and Sucrose Partitioning. Plant Physiol. 1999, 121, 1–8. [Google Scholar] [CrossRef] [Green Version]
  10. Huber, S.C.; Huber, J.L. Role And Regulation of Sucrose-Phosphate Synthase in Higher Plants. Annu. Rev. Plant. Physiol. Plant. Mol. Biol. 1996, 47, 431–444. [Google Scholar] [CrossRef]
  11. Salerno, G. Origin of Sucrose Metabolism in Higher Plants: When, How and Why? Trends Plant Sci. 2003, 8, 63–69. [Google Scholar] [CrossRef] [PubMed]
  12. Koch, K. Sucrose Metabolism: Regulatory Mechanisms and Pivotal Roles in Sugar Sensing and Plant Development. Curr. Opin. Plant Biol. 2004, 7, 235–246. [Google Scholar] [CrossRef] [PubMed]
  13. Park, J.-Y.; Canam, T.; Kang, K.-Y.; Ellis, D.D.; Mansfield, S.D. Over-Expression of an Arabidopsis Family A Sucrose Phosphate Synthase (SPS) Gene Alters Plant Growth and Fibre Development. Transgenic Res. 2008, 17, 181–192. [Google Scholar] [CrossRef]
  14. Hashida, Y.; Hirose, T.; Okamura, M.; Hibara, K.; Ohsugi, R.; Aoki, N. A Reduction of Sucrose Phosphate Synthase (SPS) Activity Affects Sucrose/Starch Ratio in Leaves but Does Not Inhibit Normal Plant Growth in Rice. Plant Sci. 2016, 253, 40–49. [Google Scholar] [CrossRef] [PubMed]
  15. Worrell, A.C.; Bruneau, J.M.; Summerfelt, K.; Boersig, M.; Voelker, T.A. Expression of a Maize Sucrose Phosphate Synthase in Tomato Alters Leaf Carbohydrate Partitioning. Plant Cell 1991, 3, 1121–1130. [Google Scholar] [CrossRef] [Green Version]
  16. Galtier, N.; Foyer, C.H.; Huber, J.; Voelker, T.A.; Huber, S.C. Effects of Elevated Sucrose-Phosphate Synthase Activity on Photosynthesis, Assimilate Partitioning, and Growth in Tomato (Lycopersicon Esculentum Var UC82B). Plant Physiol. 1993, 101, 535–543. [Google Scholar] [CrossRef] [Green Version]
  17. Signora, L.; Galtier, N.; Skot, L.; Lucas, H.; Foyer, C.H. Over-Expression of Sucrose Phosphate Synthase in Arabidopsis thaliana Results in Increased Foliar Sucrose/Starch Ratios and Favours Decreased Foliar Carbohydrate Accumulation in Plants after Prolonged Growth with CO2 Enrichment. J. Exp. Bot. 1998, 49, 669–680. [Google Scholar] [CrossRef] [Green Version]
  18. Haigler, C.H.; Singh, B.; Zhang, D.; Hwang, S.; Wu, C.; Cai, W.X.; Hozain, M.; Kang, W.; Kiedaisch, B.; Strauss, R.E.; et al. Transgenic Cotton Over-Producing Spinach Sucrose Phosphate Synthase Showed Enhanced Leaf Sucrose Synthesis and Improved Fiber Quality under Controlled Environmental Conditions. Plant Mol. Biol. 2007, 63, 815–832. [Google Scholar] [CrossRef]
  19. Ishimaru, K.; Hirotsu, N.; Kashiwagi, T.; Madoka, Y.; Nagasuga, K.; Ono, K.; Ohsugi, R. Overexpression of a Maize SPS Gene Improves Yield Characters of Potato under Field Conditions. Plant Prod. Sci. 2008, 11, 104–107. [Google Scholar] [CrossRef]
  20. Sugiharto, B.; Sakakibara, H.; Sumadi; Sugiyama, T. Differential Expression of Two Genes for Sucrose-Phosphate Synthase in Sugarcane: Molecular Cloning of the CDNAs and Comparative Analysis of Gene Expression. Plant Cell Physiol. 1997, 38, 961–965. [Google Scholar] [CrossRef]
  21. Sawitri, W.D.; Narita, H.; Ishizaka-Ikeda, E.; Sugiharto, B.; Hase, T.; Nakagawa, A. Purification and Characterization of Recombinant Sugarcane Sucrose Phosphate Synthase Expressed in E. coli and Insect Sf9 Cells: An Importance of the N-Terminal Domain for an Allosteric Regulatory Property. J. Biochem. 2016, 159, 599–607. [Google Scholar] [CrossRef] [PubMed] [Green Version]
  22. Anur, R.M.; Mufithah, N.; Sawitri, W.D.; Sakakibara, H.; Sugiharto, B. Overexpression of Sucrose Phosphate Synthase Enhanced Sucrose Content and Biomass Production in Transgenic Sugarcane. Plants 2020, 9, 200. [Google Scholar] [CrossRef] [Green Version]
  23. Suherman; Wijayanto, S.I.; Anur, R.M.; Neliana, I.R.; Dewanti, P.; Sugiharto, B. Field Evaluation on Growth and Productivity of the Transgenic Sugarcane Lines Overexpressing Sucrose-Phosphate Synthase. Sugar Tech 2022, 24, 1689–1698. [Google Scholar] [CrossRef]
  24. Azizah, K.A.; Restanto, D.P.; Sugiharto, B. Enhancement of Regeneration Efficiency through Callus Induction Media Using 2,4-Dicholorophenoxyacetic Acid in Indica Rice (Oryza sativa L. Var. Ciherang). J. Ilmu Dasar 2017, 18, 91–98. [Google Scholar] [CrossRef] [Green Version]
  25. Wang, J.; Jiang, J.; Oard, J.H. Structure, Expression and Promoter Activity of Two Polyubiquitin Genes from Rice (Oryza sativa L.). Plant Sci. 2000, 156, 201–211. [Google Scholar] [CrossRef] [PubMed]
  26. Xu, R.-F.; Li, H.; Qin, R.-Y.; Li, J.; Qiu, C.-H.; Yang, Y.-C.; Ma, H.; Li, L.; Wei, P.-C.; Yang, J.-B. Generation of Inheritable and “Transgene Clean” Targeted Genome-Modified Rice in Later Generations Using the CRISPR/Cas9 System. Sci. Rep. 2015, 5, 11491. [Google Scholar] [CrossRef] [PubMed] [Green Version]
  27. Apriasti, R.; Widyaningrum, S.; Hidayati, W.N.; Sawitri, W.D.; Darsono, N.; Hase, T.; Sugiharto, B. Full Sequence of the Coat Protein Gene Is Required for the Induction of Pathogen-Derived Resistance against Sugarcane Mosaic Virus in Transgenic Sugarcane. Mol. Biol. Rep. 2018, 45, 2749–2758. [Google Scholar] [CrossRef]
  28. Buttery, R.G.; Ling, L.C.; Juliano, B.O.; Turnbaugh, J.G. Cooked Rice Aroma and 2-Acetyl-1-Pyrroline. J. Agric. Food Chem. 1983, 31, 823–826. [Google Scholar] [CrossRef]
  29. Stein, O.; Granot, D. An Overview of Sucrose Synthases in Plants. Front. Plant Sci. 2019, 10, 95. [Google Scholar] [CrossRef] [Green Version]
  30. Park, I.M.; Ibáñez, A.M.; Shoemaker, C.F. Rice Starch Molecular Size and Its Relationship with Amylose Content. Starch—Stärke 2007, 59, 69–77. [Google Scholar] [CrossRef]
  31. Falter, C.; Voigt, C.A. Improving Biomass Production and Saccharification in Brachypodium Distachyon through Overexpression of a Sucrose-Phosphate Synthase from Sugarcane. J. Plant Biochem. Biotechnol. 2016, 25, 311–318. [Google Scholar] [CrossRef] [Green Version]
  32. Barratt, D.H.P.; Derbyshire, P.; Findlay, K.; Pike, M.; Wellner, N.; Lunn, J.; Feil, R.; Simpson, C.; Maule, A.J.; Smith, A.M. Normal Growth of Arabidopsis Requires Cytosolic Invertase but Not Sucrose Synthase. Proc. Natl. Acad. Sci. USA 2009, 106, 13124–13129. [Google Scholar] [CrossRef] [PubMed] [Green Version]
  33. Rolland, F.; Baena-Gonzalez, E.; Sheen, J. Sugar Sensing and Signaling In Plants: Conserved and Novel Mechanisms. Annu. Rev. Plant Biol. 2006, 57, 675–709. [Google Scholar] [CrossRef] [PubMed] [Green Version]
  34. Wind, J.; Smeekens, S.; Hanson, J. Sucrose: Metabolite and Signaling Molecule. Phytochemistry 2010, 71, 1610–1614. [Google Scholar] [CrossRef]
  35. Eveland, A.L.; Jackson, D.P. Sugars, Signalling, and Plant Development. J. Exp. Bot. 2012, 63, 3367–3377. [Google Scholar] [CrossRef] [PubMed] [Green Version]
  36. Smeekens, S.; Hellmann, H.A. Sugar Sensing and Signaling in Plants. Front. Plant Sci. 2014, 5, S185–S205. [Google Scholar] [CrossRef] [Green Version]
  37. Gibson, S.I. Control of Plant Development and Gene Expression by Sugar Signaling. Curr. Opin. Plant Biol. 2005, 8, 93–102. [Google Scholar] [CrossRef]
  38. Geng, M.-T.; Yao, Y.; Wang, Y.-L.; Wu, X.-H.; Sun, C.; Li, R.-M.; Fu, S.-P.; Duan, R.-J.; Liu, J.; Hu, X.-W.; et al. Structure, Expression, and Functional Analysis of the Hexokinase Gene Family in Cassava. Int. J. Mol. Sci. 2017, 18, 1041. [Google Scholar] [CrossRef] [Green Version]
  39. Lastdrager, J.; Hanson, J.; Smeekens, S. Sugar Signals and the Control of Plant Growth and Development. J. Exp. Bot. 2014, 65, 799–807. [Google Scholar] [CrossRef]
  40. Aguilera-Alvarado, G.P.; Sánchez-Nieto, S. Plant Hexokinases Are Multifaceted Proteins. Plant Cell Physiol. 2017, 58, 1151–1160. [Google Scholar] [CrossRef]
  41. Cho, Y.-H.; Yoo, S.-D.; Sheen, J. Regulatory Functions of Nuclear Hexokinase1 Complex in Glucose Signaling. Cell 2006, 127, 579–589. [Google Scholar] [CrossRef] [PubMed]
Figure 1. Agrobacterium-mediated transformation of indica rice (Oryza sativa cv. Ciherang). (A) Induction of embryogenic callus from rice seed explant; (B) Two weeks old embryogenic callus was separated; (C) Infected callus developed green spot; (D,E) Regeneration of callus into plantlets; (F) Growth of antibiotic-resistant plantlets.
Agronomy 12 02949 g001
Figure 2. Expression levels of SPS gene in leaves of transgenic lines and non-transgenic rice. (A) Transcript levels of SPS were determined using qRT-PCR and expressed as relative gene expression using Actin as the reference gene. (B) Protein levels of SPS were detected using immunoblot using sugarcane SoSPS1 antibody. (C) Activities of SPS were measured spectrophotometrically. Values are presented as mean ± SD from three individual plants. Asterisks * and ** denote statically significant differences at Dunnett’s-test: p ≤ 0.05 and p ≤ 0.01, respectively.
Agronomy 12 02949 g002
Figure 3. Sucrose content, SuSy, and SAI activities in leaves of NT and transgenic rice lines. Sucrose and total soluble protein were separately extracted from the rice leaves as described in the Material and Method. Values are presented as mean ± SD from three independent plants. Asterisks * and ** denote statistically significant differences at Dunnett’s-test: p ≤ 0.05 and p ≤ 0.01, respectively.
Agronomy 12 02949 g003
Figure 4. The photograph of NT and five selected transgenic lines on the maximum growth rate. NT, SPS4, SPS7, SPS9, SPS10, and SPS11 represent non-transgenic (NT) and transgenic lines.
Agronomy 12 02949 g004
Table 1. The vegetative growth rate of NT and transgenic rice lines grown in a greenhouse. The plant height and number of tillers were regularly observed, starting from 1 up to 3 MAP. Values are presented as mean ± SD from three individual plants, and asterisks * and ** denote different significance levels at Dunnett’s-test: p ≤ 0.05 and p ≤ 0.01, respectively.
LinesTiller Number Plant Height (cm)
1 MAP2 MAP3 MAP1 MAP2 MAP3 MAP
NT8.67 ± 0.57 14.67 ± 1.52 25.67 ± 2.08 14.43 ± 1.01 35.61 ± 1.65 67.00 ± 2.00
SPS 411.33 ± 1.52 *23.33 ± 2.51 **37.01 ± 2.64 **19.97 ± 1.94 *45.33 ± 3.75 **81.67 ± 3.79 **
SPS 711.67 ± 1.15 *21.00 ± 2.00 **39.33 ± 3.05 **19.87 ± 2.10 *43.67 ± 1.15 **86.67 ± 3.21 **
SPS 912.00 ± 2.64 *24.67 ± 1.52 **34.33 ± 3.05 **17.23 ± 2.25 43.00 ± 0.87 **79.33 ± 0.58 **
SPS 1010.67 ± 1.15 *21.67 ± 0.57 **37.33 ± 3.05 **17.27 ± 1.74 43.80 ± 1.45 **81.00 ± 3.46 **
SPS 119.67 ± 1.1518.00 ± 2.00 35.33 ± 3.51 **15.83 ± 1.26 38.33 ± 0.76* 77.00 ± 1.00 **
Table 2. Amylose content and grain yield of NT and transgenic rice lines were grown in a greenhouse. The dry weight was measured after removing the panicle, and the rice biomass was dried up before measurement. The amylose content and grain yield were measured at the harvest. Values are presented as mean ± SD from three individual plants, and asterisks * and ** denote different significance levels at Dunnett’s-test: p ≤ 0.05 and p ≤ 0.01, respectively.
LinesAmylose (%)Grain Number Per Panicle1000-Grain Weight (g)Dry Weight (g)
NT43.48 ± 2.78 94.67 ± 11.06 22.69 ± 0.51 56.41 ± 4.51
SPS 457.08 ± 5.36 **152.67 ± 15.53 **24.89 ± 0.38 *76.78 ± 8.41 *
SPS 751.33 ± 2.67 **169.67 ± 30.17 **25.36 ± 0.91 *81.58 ± 11.35 *
SPS 949.37 ± 0.80 * 152.33 ± 18.01 **24.35 ± 0.15 *73.31 ± 15.56
SPS 1054.41 ± 1.61 **133.67 ± 20.13 * 24.39 ± 0.37 *70.45 ± 17.79
SPS 1149.84 ± 1.06 * 138.33 ± 8.96 * 24.95 ± 0.16 *66.69 ± 16.18
Publisher’s Note: MDPI stays neutral with regard to jurisdictional claims in published maps and institutional affiliations.

