Article

Physiological and Agronomic Traits of Certain Sugarcane Genotypes Grown under Field Conditions as Influenced by Early Drought Stress

by
Nithaya Leanasawat
1,
Manit Kosittrakun
1,
Watanachai Lontom
1 and
Patcharin Songsri
2,3,*
1
Department of Biology, Faculty of Science, Khon Kaen University, Khon Kaen 40002, Thailand
2
Department of Agronomy, Faculty of Agriculture, Khon Kaen University, Khon Kaen 40002, Thailand
3
Northeast Thailand Cane and Sugar Research Center, Faculty of Agriculture, Khon Kaen University, Khon Kaen 40002, Thailand
*
Author to whom correspondence should be addressed.
Agronomy 2021, 11(11), 2319; https://doi.org/10.3390/agronomy11112319
Submission received: 26 September 2021 / Revised: 12 November 2021 / Accepted: 13 November 2021 / Published: 16 November 2021
(This article belongs to the Special Issue Cultivar Development and Management Strategies for Sugarcane)

Abstract

:
Drought is one of the important problems that drastically affect sugarcane production in several countries. The objective of this research was to investigate the effects of early drought stress on physiological parameters and agronomic traits of six sugarcane genotypes under field conditions. The experiment was arranged in a split plot in a completely randomized block design with three replications. The main plot was represented by three different water regimes: field capacity (FC), ½FC and rain-fed (RF), whereas the subplot consisted of six sugarcane genotypes: KK3 (drought tolerant), Q117 (drought tolerant), LK92-11 (drought susceptible), Ths98-271 (S. spontaneum), KK08-214 (the F1 hybrid derived from S. spontaneum × S. officinarum) and E08-4-019 (the F1 hybrid derived from Erianthus sp. × S. officinarum). The six sugarcane genotypes were subjected to three irrigation treatments. The 45-day-old plants of all sugarcane genotypes were exposed to drought by withholding water for 72 days. Certain photosynthetic parameters were measured in the leaves of four-month-old plants. Certain cane yield parameters were measured in the 12-month-old plants. The results showed that early drought stress decreased the maximum quantum yield of PSII efficiency, net photosynthetic rate, transpiration rate and stomatal conductance. Drought stress significantly (p ≤ 0.01) decreased cane yield. The cane yield and sugar yield of KK3 were significantly (p ≤ 0.01) higher than those of the other genotypes. The wild-type sugarcane and the F1 hybrids derived from the wild and commercial sugarcane could maintain better photosynthetic performance while encountering early drought stress.

1. Introduction

Sugarcane is a significantly productive crop used as the main source of sugar. Moreover, it is used for ethanol production and renewable biofuel energy [1]. Sugarcane plantations are expanding in areas where irrigation is needed. The productivity of a crop grown under drought stress is less than its potential when it is grown under normal precipitation or irrigation. In northeastern Thailand, most field crops are grown on sandy soils with rapid water drainage [2]. Sugarcane is traditionally cultivated in the dry season (November–January). The amount of water supplied by rain is insufficient and the early-season sugarcane plants can be damaged by delayed rain leading to drought. As a result, they are often exposed to early-season drought. To cope with this problem, using drought-tolerant cultivars is an important way to increase sugarcane production in drought-affected areas.
Water deficit stress leads to damaged physiological processes in plants [3,4]. Cell damage is caused by drought stress which affects the growth and yield stability of plants [5,6,7]. The reduction in growth is associated with a decrease in leaf gas exchange [8,9]. Photosynthesis is sensitive to water stress [10]. It is affected not only by the decline of stomatal conductance but also by the level of chloroplast damage under severe stress [11,12,13]. The net photosynthetic rates and stomatal conductance of sugarcane leaves decline after exposure to drought [14,15,16]. The tolerant sugarcane cultivars exhibited better photosynthetic performance than the sensitive cultivar [17]. Photosynthetic rate, stomatal conductance, canopy conductance, and transpiration rate are also used as indirect selection criteria for stress tolerance [18,19,20,21].
The reduction in the process of photosynthesis results in plant yield deterioration under water stress conditions [22]. Drought stress significantly reduces yield and physiological processes in sugarcane [23,24,25,26]. Stalk number and stalk height are influenced by water stress conditions during the initial growth phase [27]. Water stress was reported to reduce cane yield by more than 50% [26]. Water deficit affects cane yield parameters and juice quality traits of sugarcane under field conditions [28].
Many physiological traits, such as the maximum quantum yield of PSII efficiency (Fv/Fm), Soil Plant Analysis Development (SPAD) value, net photosynthetic rate and stomatal conductance have been investigated and suggested for yield improvement under drought stress [5,7,18]. Differences in physiological responses under drought stress are consistent with yield differences [29]. Understanding water stress-response mechanisms is important for drought-tolerant sugarcane breeding.
Several physiological and agronomical measurements in sugarcane have been investigated but comparing research results is limited by variable growth conditions, as well as cultivar and environmental differences. Therefore, the objective of this study was to investigate the physiological responses and to evaluate agronomic traits and sugar-related traits in certain sugarcane genotypes under drought conditions. The information on the physiological basis under drought stress in sugarcane could be useful in developing drought-tolerant sugarcane cultivars or clones. Moreover, measurement of physiological traits of net photosynthetic rate, transpiration rate and stomatal conductance may be useful for early detection of drought-tolerant sugarcane genotypes.

2. Materials and Methods

2.1. Experimental Design

The irrigation and plant treatments were arranged in a split-plot in a randomized complete block design with three replications. The main plot is the irrigation regime, while the subplot is sugarcane genotype. One genotype consisted of four rows of sugarcane plants with two buffer rows between sampled rows. The plot size for each sugarcane genotype was 4.5 m in length, with a spacing of 1.5 m between rows and 0.5 m between plants.

2.2. Plant Material

In this experiment, six sugarcane genotypes were used. The main plot was represented by three different water regimes: field capacity (FC), ½FC and rain-fed (RF), whereas the subplot consisted of six sugarcane genotypes: KK3 (drought tolerant), Q117 (drought tolerant), LK92-11 (drought susceptible), Ths98-271 (S. spontaneum), KK08-214 (the F1 hybrid derived from S. spontaneum × S. officinarum) and E08-4-019 (the F1 hybrid derived from Erianthus sp. × S. officinarum).

2.3. Irrigation Treatments

The six sugarcane genotypes were grown at the Department of Agronomy, Faculty of Agriculture, Khon Kaen University (16°28′22.9″ N 102°48′37.9″ E, 200 m above sea level) on 6 January 2017 and harvested on 25 December 2017. The soil physical properties including permanent wilting point, field capacity and available water were measured. Sugarcane plants in each plot were supplied with the NPK (N-P2O5-K2O) 15-15-15 fertilizer at the rate of 312.5 kg/ha when they were planted and when they were six months old. Soil moisture was measured at weekly intervals using the gravimetric method. The six sugarcane genotypes were subjected to three irrigation regimes: full irrigation (field capacity, FC), ½FC and rain-fed (RF). The 45-day-old plants were exposed to drought by withholding water for 72 days. Subsequently, the six-month-old plants started to recover from early drought stress after receiving the rainwater in May 2017. The data were collected four and six months after planting. The final harvest was made 12 months after planting.

2.4. Soil Moisture Measurement and Meteorological Conditions

Soil moisture was measured using the gravimetric method. The soil was sampled at three different soil depths below the soil surface: 0–15, 15–45 and 45–60 cm. Each sample was weighed and oven-dried at 105 °C for 72 h. The soil under each water regime was sampled and soil moisture content was calculated as follows:
Soil moisture content (%) = [(Wet weight − Dry weight)/Dry weight] × 100
The soil type at the experimental site was classified as Yasothorn soil series, which are characterized by loamy sand soil (79.16% sand, 16.26% silt and 4.58% clay).
The data on rainfall, temperature, and relative humidity were collected from the weather station (Watchdog 2700, Path computation element group, Arnsberg, Germany) located at the experimental field belonging to the Department of Agronomy, Faculty of Agriculture, Khon Kaen University (16°28′22.9″ N 102°48′37.9″ E, 200 m above sea level).

2.5. Plant Growth and Physiological Measurements

Stalk height was measured from the ground to the top visible dewlap leaf. Leaf greenness was non-destructively determined in the topmost visible dewlap leaf using a SPAD-502 chlorophyll meter (Spectrum Technologies, Aurora, IL, USA). The maximum quantum yield of PSII efficiency was estimated using Handy PEA chlorophyll fluorometer during 9:00–10:30 am. It was sunny during this time period. The ambient climate was as follows: air temperature (29.3 °C), relative humidity (60%) and light intensity (1608 µmol m−2 s−1). Light intensity was measured using Lux meter MLM-1010 (Minipa, São Paulo, Brazil). Electrolyte leakage was determined using the method of Filek et al. [30].
The photosynthetic parameters were analyzed through a Li-6400XT portable photosynthesis system equipped with a 6400-02B LED light source (Li-Cor Inc., Lincoln, NE, USA) between 09:00 and 12:00 am. The following conditions were used: 400 µmolmol−1 of CO2 concentration, 1500 µmol m−2s−1 of light intensity, 500 µmol s−1 of flow rate and temperature at 30 °C. Net photosynthetic rate and gas exchange parameters were measured and automatically calculated using LI-6400XT. Instantaneous water use efficiency (WUEi) was calculated using the following formula:
WUEi = A/E
where A is a net photosynthetic rate and E is a transpiration rate [31].

2.6. Agronomic Measurements at Harvest

The field-grown sugarcane was manually harvested on 25 December 2017 and two middle rows of each plot were weighed to measure cane yield (tons of cane/ha). Stalk diameter was determined at 1 m above the ground. The internode length and total fresh cane weight per hectare were recorded. Juice quality in terms of brix, pol and purity were analyzed. After juice extraction, the fresh and dry weight of the remaining stalks was weighed for calculating fiber content. Commercial cane sugar (CCS) content was measured and calculated according to the method outlined by Ehsanullah et al. [32]. Sugar yield was calculated from:
Sugar yield = (Cane yield × CCS)/100

2.7. Statistical Analysis

The data were subjected to analysis of variance (ANOVA) and treatment means were compared by least significant difference (LSD) test using Statistix 10 software.

3. Results

3.1. Soil Moisture Content and Meteorological Conditions

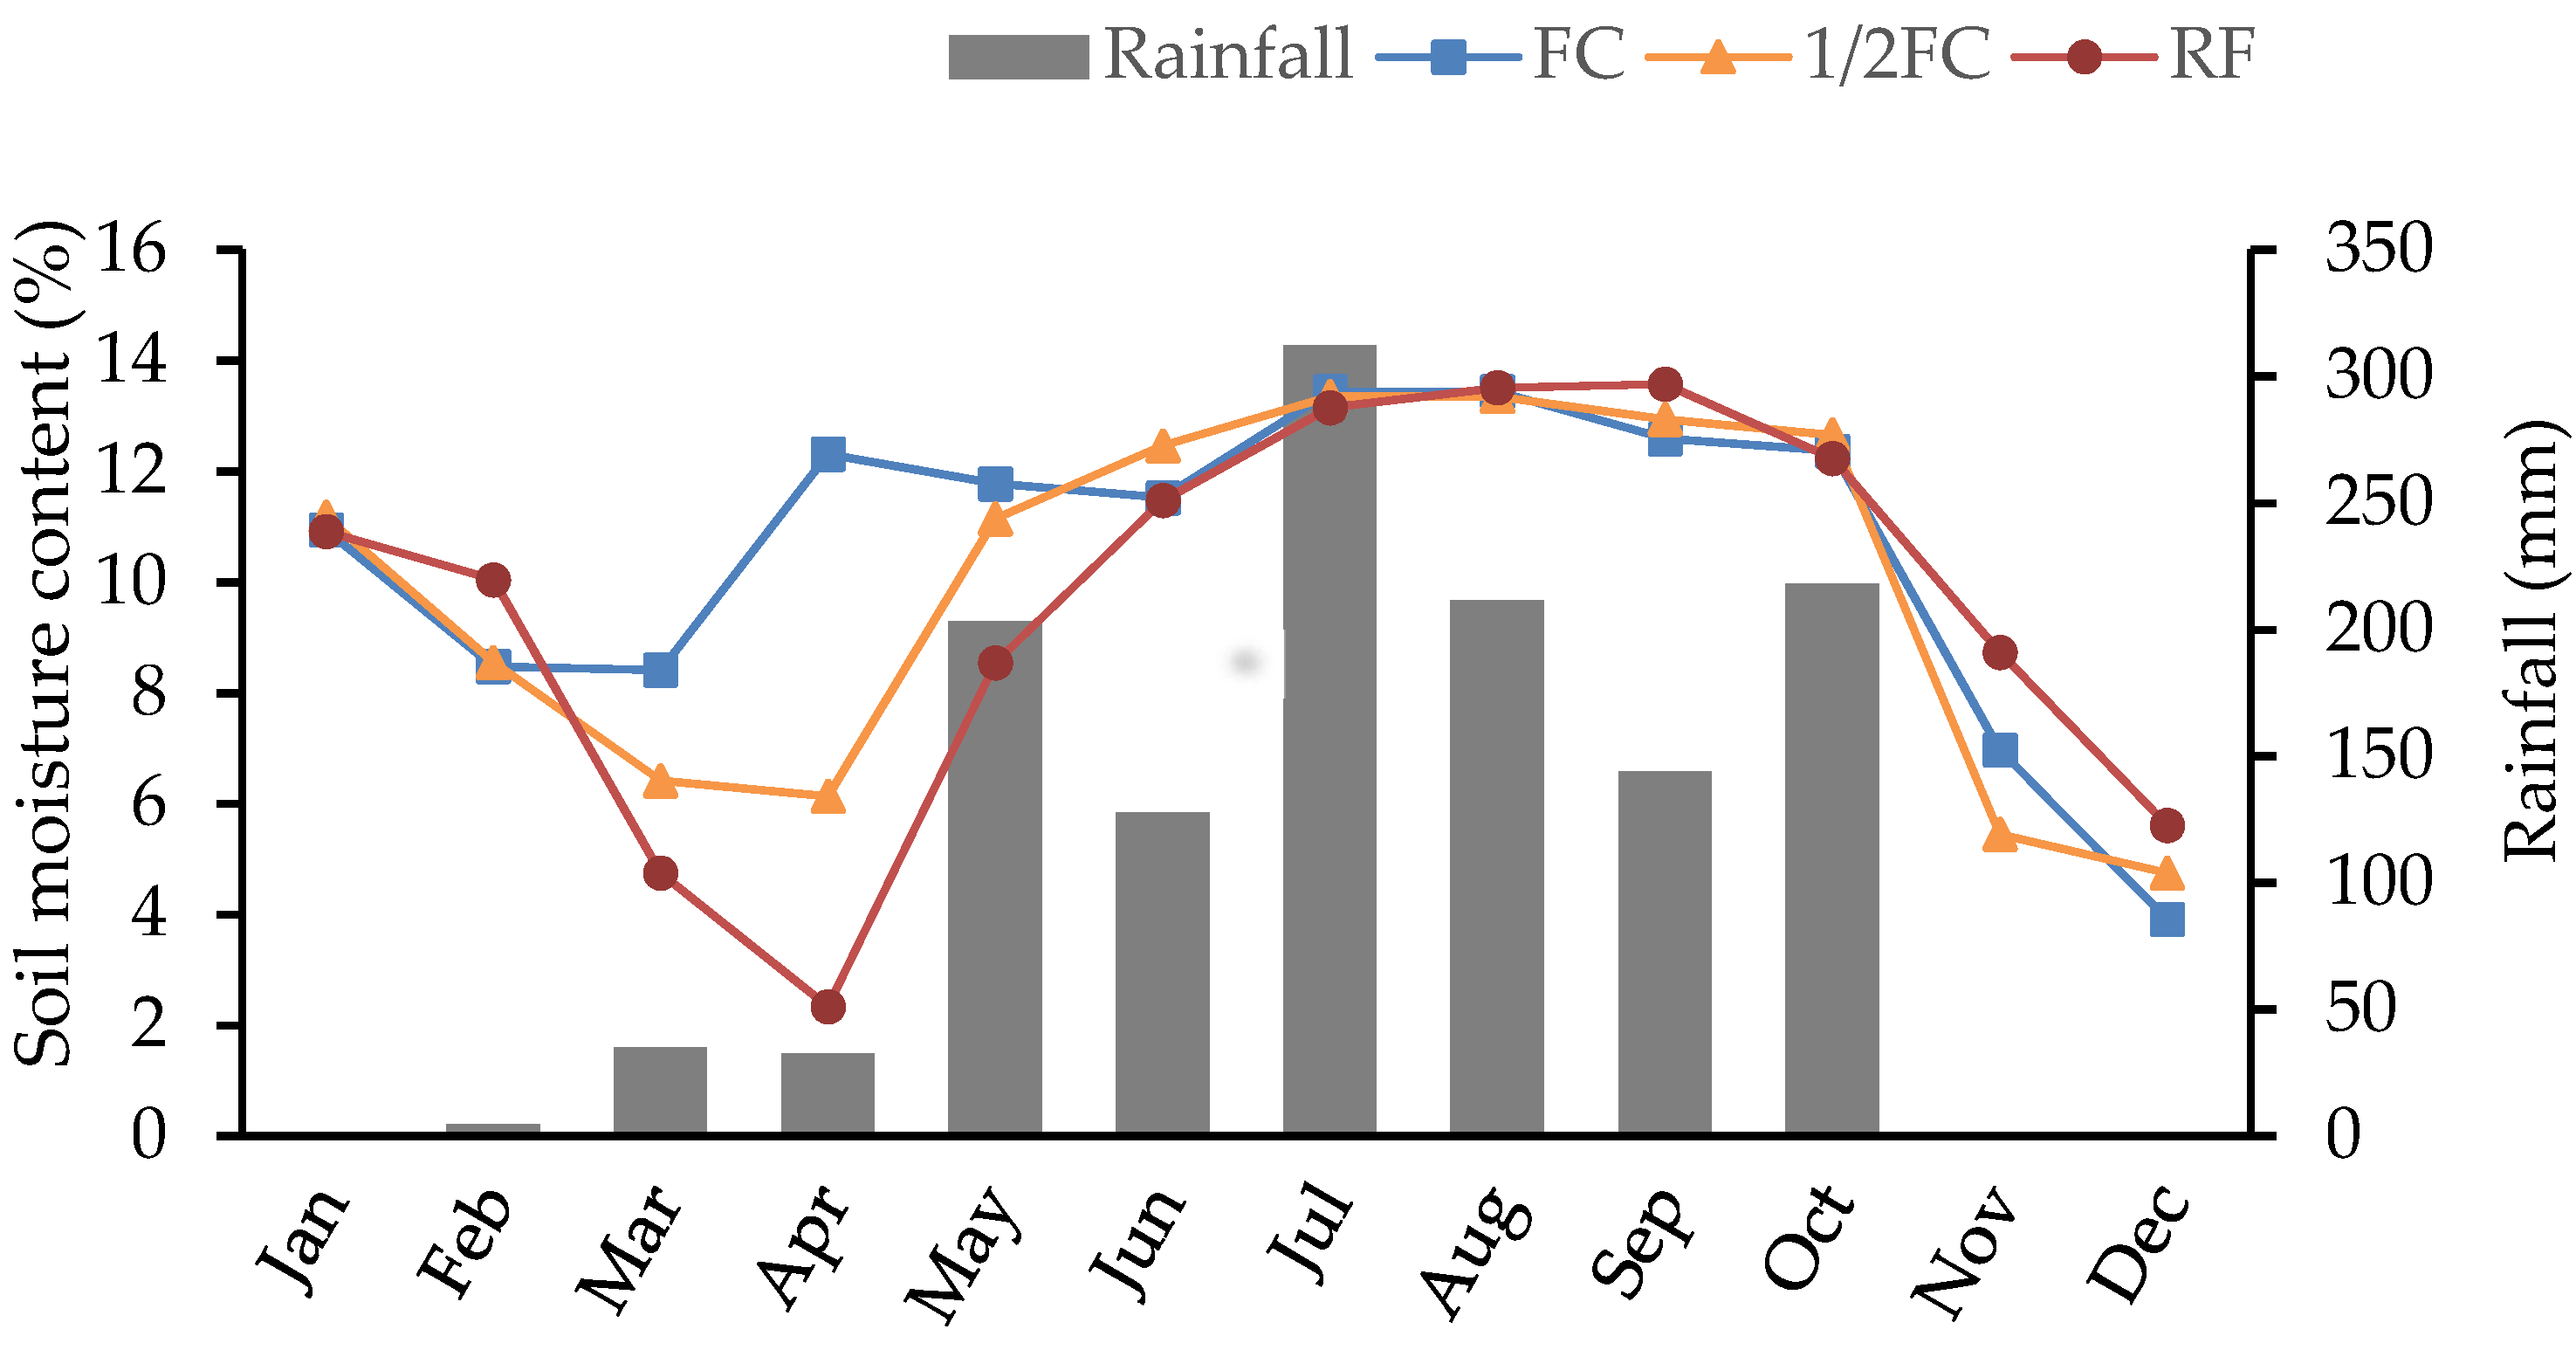
3.1.1. Soil Moisture Content

The soil moisture contents determined from soil physical properties were 13.73% for field capacity and 4.19% for permanent wilting point. During 72 days of water stress treatments, the soil moisture content at 15–45 cm below the soil surface decreased to ½FC. The average soil moisture content under FC conditions was 12.31%, while the value gradually dropped to 6.13 and 2.34% under ½FC and RF conditions, respectively (Figure 1). The moisture content for the soil receiving additional irrigation water (under FC conditions) was close to FC.
The amount of additional water (287.28, 113.99 and 62.07 mm under FC, ½FC and RF conditions, respectively) was applied through drip irrigation. The total annual rainfall received during January–December 2017 was 1431.10 mm. Thus, the total amounts of water received were 1718.38, 1545.09 and 1493.17 mm under FC, ½FC and RF conditions, respectively.

3.1.2. Meteorological Conditions

Maximum and minimum temperature, daily rainfall, and relative humidity were recorded during the entire experimental period from the weather station located near the experimental site. These data are shown in Figure S1. During the drought stress period (February–April), the maximum air temperature ranged from 36.1 to 31.3 °C and the minimum air temperature ranged between 18.1 and 24.3 °C. The relative humidity was in the range of 49.6 to 60.0%, with an average of 56.4% (Figure S1). The recorded rainfall in this period was 43.4 mm.
During the recovery period (May–October 2017), the maximum air temperature ranged from 31.5 to 34.2 °C and the minimum air temperature ranged between 24.1 and 24.4 °C. The relative humidity was in the range of 73.6–87.9%, with an average of 82.7%. The recorded rainfall in this period was 1382.5 mm, while the highest rainfall (319.7 and 319.7 mm, respectively) was observed in July and August.

3.2. Physiological Characteristics of Six Sugarcane Genotypes

3.2.1. Effect of Early Drought Stress on Growth and Physiological Parameters

Mean squares for stalk height and diameter, SPAD value and electrical leakage are shown in Table 1. The interaction between water regime (W) and sugarcane genotype (G) was found for stalk height and diameter as well as SPAD value and maximum quantum yield of PSII efficiency.
Drought stress decreased stalk height in all the six sugarcane genotypes (Table 2). This parameter varied from 117.25 to 61.42 cm under FC conditions, while Q117 and LK92-11 showed the maximum and minimum values, respectively. Under ½FC conditions, the maximum stalk height was observed in KK08-214, whereas the minimum value was found in LK92-11 (32.75 cm). Under RF conditions, E08-4-019 and KK08-214 had the highest stalk height (63.58 and 62.50 cm, respectively) and LK92-11 had the lowest stalk height (24.17 cm).
At the tillering stage, stalk diameter was significantly different among genotypes (Table 2). Under FC conditions, the highest average value was observed in KK3 (3.02 cm), and the lowest value was found in Ths98-271 (1.08 cm). A significant reduction of stalk diameter under drought stress was observed in LK92-11 and KK3.
SPAD value varied from 51.53 to 35.10 under FC conditions and from 43.70 to 32.80 under ½FC conditions, while the range in SPAD value was between 48.47 and 31.30 under RF conditions (Table 3). SPAD value was highest in E08-4-019 and lowest in Q117 (under RF conditions. E08-4-019 exhibited a less reduction in SPAD value (5.95%), while KK08-214 showed the greatest decline in this value (20.28%) under RF conditions.
Electrolyte leakage values were not significantly different among water regimes (Table 3). The sugarcane genotypes expressed differential responses in terms of electrolyte leakage under FC and ½FC conditions. However, the electrolyte leakage among genotypes showed no significant difference under RF conditions. The electrolyte leakage under FC conditions ranged from 24.83% (in E08-4-019) to 15.64% (in KK08-214). Under ½FC conditions, the highest and lowest values were found in LK92-11 (27.36%) and Q117 (15.76%), respectively.
The maximum quantum yield of PSII efficiency values of Ths98-271 and KK08-214 were significantly (p ≤ 0.05) higher than those of the other genotypes under ½FC conditions (Table 4). Q117 showed the lowest maximum quantum yield of PSII efficiency (0.747) under RF conditions.

3.2.2. Effect of Early Drought Stress on Photosynthetic Parameters after 72 Days of Drought Period

Gas exchange responses were different among genotypes in both the well-watered and water-stressed plants (Table 5). The results showed that drought stress caused significant decreases in net photosynthetic rate, transpiration rate and stomatal conductance. However, there was no significant difference in water use efficiency. Water regime interacted with sugarcane genotype. The sugarcane genotypes differentially responded to water regimes.
The net photosynthetic rate of the sugarcane plants varied slightly from 35.78 to 40.66 µmol CO2 m−2s−1 under FC conditions (Table 6). Ths98-271 and KK08-214 had significantly (p ≤ 0.01) higher values of this parameter than the other genotypes under ½FC conditions. The lowest net photosynthetic rate under RF conditions was observed in Q117. Ths98-271 and E08-4-019 exhibited higher values than the other genotypes under RF conditions. Drought stress significantly decreased the net photosynthetic rates of LK92-11, Q117 and KK3 (−33.00, −31.41 and −31.36%, respectively) under RF conditions. However, the net photosynthetic rates of E08-4-091 under the three water regimes were not different.
The stomatal conductance of all the sugarcane genotypes ranged from 0.234 to 0.314 mol H2O m−2s1 under FC conditions (Table 6). The results showed the maximum value in LK92-11, while the minimum value was observed in E08-4-019. Under ½FC conditions, the stomatal conductance of Ths98-271 was higher than those of the other genotypes. Q117 showed the lowest value under RF conditions, while there was a considerable reduction of 54.0% in the stomatal conductance of LK92-11 due to early drought stress.
Transpiration rates were not significantly different among genotypes under FC conditions. The values ranged from 3.08 to 3.75 mmol H2Om−2s−1 (Table 6). The transpiration rates ranged from 2.13 to 3.86 mmol H2O m−2s−1 under ½FC conditions. The highest transpiration rate under ½FC conditions was noticed in Ths98-271. The range in transpiration rates was between 2.05 and 3.69 mmol H2O m−2s−1 under RF conditions. E08-4-019 had a significantly (p ≤ 0.01) higher value than the other genotypes under RF conditions. In addition, E08-4-019 showed a 19.71% increase in transpiration rate, while the other genotypes exhibited decreased transpiration rates.
No significant difference in water use efficiency was observed among genotypes and treatments (Table 6). The water use efficiency values under FC conditions ranged from 10.29 to 11.93 µmol CO2 mmol−1 H2O. Under ½FC conditions, water use efficiency ranged from 10.66 to 12.19 µmol CO2 mmol−1 H2O, while the highest value was observed in KK3. This sugarcane cultivar also showed the highest water use efficiency value (12.70) under RF conditions.

3.2.3. Effect of Early Drought Stress on Photosynthetic Parameters under Recovery Conditions

Table 7 shows the mean squares for photosynthetic parameters in the leaves of six sugarcane genotypes following two months of rehydration (six months after planting). The net photosynthetic rate, stomatal conductance and water use efficiency were not significantly different among water regimes after rehydration. The genotype x water regime interaction was significant for net photosynthetic rate, stomatal conductance and water use efficiency.
During the drought stress period, the photosynthetic activity tended to decrease. However, the photosynthetic parameters showed a good recovery after re-watering.
The net photosynthetic rate varied from 31.07 to 42.23 µmol CO2m−2s−1 under FC conditions and from 32.10 to 43.33 µmol CO2m−2s−1 under ½FC conditions, while the range in net photosynthetic rate was between 32.03 and 43.13 µmol CO2m−2s−1 under RF conditions (Table 8). After rehydration, KK3, LK92-11, E08-4-019 and Q117 exhibited the increase in net photosynthetic rate with their respective values being recorded at 71.73, 30.64, 26.47 and 11.10 % under ½FC conditions. Under RF conditions, the increase in net photosynthetic rate was observed in Q117, KK08-214, LK92-11, KK3 and E08-4-019 (30.52, 22.67, 21.86, 21.56 and 9.14%, respectively).
After re-watering, stomatal conductance and transpiration rate increased (Table 8). The range of stomatal conductance was between 0.205 and 0.398 mol H2O m−2s−1 under FC conditions. Under ½FC conditions, the highest average values were found in KK3 (0.478 mol H2O m−2s−1) and E08-019 (0.440 mol H2O m−2s−1) and the lowest average value was observed in Q117 (0.217 mol H2O m−2s−1). Under RF conditions, the highest average value was found in E08-019 (0.441 mol H2O m−2s−1) and the lowest average value was observed in Q117 (0.200 mol H2O m−2s−1).
The pattern of transpiration rate was similar to that of net photosynthetic rate (Table 8). Under RF conditions, the transpiration rates of E08-019 and KK3 were significantly (p ≤ 0.01) higher than those of the other genotypes.
The water use efficiency values under FC conditions ranged from 8.20 to 10.05 µmol CO2 mmol−1 H2O with Q117 showing the highest value and Ths98-271 exhibiting the lowest value (Table 8). Under ½FC conditions, the water use efficiency ranged from 8.56 to 10.17 µmol CO2 mmol−1 H2O, while the highest value was observed in Q117. Under RF conditions, water use efficiency ranged from 8.88 to 10.78 µmol CO2 mmol−1 H2O.

3.3. Effect of Early Drought Stress on Agronomic Traits

There were no significant differences in stalk height and diameter under FC, ½FC, and RF conditions (Table 9). However, significant (p ≤ 0.01) differences in stalk height and diameter were found among sugarcane genotypes. Ths98-271 had the lowest stalk height in comparison with the other genotypes. KK3 and LK92-11 had significantly (p ≤ 0.01) larger stalk diameters than the other genotypes (Table 10).
The single stalk weight of all the sugarcane genotypes under FC and ½FC conditions was significantly (p < 0.05) greater than that under RF conditions (Table 10). The highest average values were found in KK3 (1.475 kg), and LK92-11 (1.392 kg) and the lowest average value was detected in Ths98-271 (0.144 kg).
The average millable cane values among genotypes were significantly different. Millable cane was highest in Ths98-271 (602,750 stalks/ha) and lowest in Q117 (75,890 stalks/ha) (Table 10). The significant decreases in millable cane were observed under ½FC (200,220 stalks/ha) and RF conditions (206,710 stalks/ha) in comparison with under FC conditions (251,260 stalks/ha).
The mean of internode length in the controlled plants ranged from 11.11 (in Q117) to 14.78 cm (in Ths98-271) (Table 11). Under ½FC conditions, internode length ranged from 11.71 (in Q117) to 13.93 cm (in KK3). Under RF conditions, the value ranged from 11.86 (in KK3) to 16.02 cm (in KK08-214). Drought reduced the average internode length in many genotypes, whereas KK08-214 and Q117 showed increased internode length under RF conditions.
The fiber content of Ths98-271, KK08-214, E08-4-019 and LK92-11 increased under drought conditions (Table 11). The maximum fiber content was recorded in Ths98-271, while the minimum fiber content was observed in LK92-11 under FC, ½FC and RF conditions.
The results demonstrated that different water regimes resulted in significant differences in cane yield, while sugar yields among water regimes showed no significant difference (Table 12). The interaction between water regime and genotype (W × G) was observed in cane yield, sugar yield and commercial cane sugar. Cane yield varied from 188.66 to 68.33 tons/ha under FC conditions. Under ½FC conditions, the value varied from 147.23 to 75.89 tons/ha (Table 13). The cane yield of KK3 was significantly higher than those of the other genotypes under FC and ½FC conditions. The decrease in cane yield was observed in E08-4-019 and KK3 (37.00 and 21.96%, respectively) under ½FC conditions. The value varied from 117.32 to 46.79 tons/ha under RF conditions. KK3, E08-4-019, LK92-11 and KK08-214 had high cane yields, while Q117 had the lowest cane yield under RF conditions. The decrease in cane yield was observed in KK3, Q117 and E08-4-019 (37.82, 31.53 and 15.35%, respectively) under RF conditions (Table 13).
The sugar yield of KK3 was significantly higher than those of the other genotypes under ½FC conditions (Table 13). The value decreased in Ths98-271, E08-4-019, LK92-11 and KK3 (94.70, 51.21, 2.84 and 2.61%, respectively) under ½FC conditions. The sugar yield of KK3 and LK92-11 were significantly higher than those of the other genotypes under RF conditions. The lowest value was recorded in Ths98-271. The decrease in sugar yield was observed in E08-4-019, Q117 and KK3 (42.94, 21.84 and 14.75%, respectively) under RF conditions.
The pattern of commercial cane sugar is shown in Table 14. The commercial cane sugar ranged from 1.10% in S. Spontaneum (Ths98-271) to 10.49% in Q117 under FC conditions. The values under ½FC conditions ranged between 0.06% in Ths98-271 and 10.86% in LK92-11. The commercial cane sugar ranged from 2.27% (in Ths98-271) to 12.12% (in Q117) under RF conditions. The values were significantly increased in KK3 under ½FC and RF conditions (24.74 and 36.97% respectively).

4. Discussion

4.1. Physiological Responses to Early Drought in Six Sugarcane Genotypes

4.1.1. Effect of Early Drought Stress on Growth and Physiological Parameters

Plant growth decreases under water stress conditions. The reduction in plant growth under drought is caused by altered plant water relations, decreased CO2 assimilation, cellular oxidative stress, membrane damage of affected tissues and inhibition of enzyme activities [8,33]. In our study, early drought stress decreased stalk height in all the six sugarcane genotypes. It was reported that in maize, the decrease of growth in response to drought was related to the whole-plant and organ-specific response processes [34]. The difference in drought stress response in terms of stalk diameter depends on sugarcane genotype [24]. The electrolyte leakage of leaf samples is related to membrane damage caused by oxidative stress. Cell membrane injury is induced; therefore, electrolyte and ions can diffuse [30,35,36]. In the previous studies, the increase in the electrolyte leakage in sensitive sugarcane under drought conditions was reported by Sudhakar et al. [37] and Reyes et al. [38]. Under ½FC conditions, the highest and lowest values were found in LK92-11 and Q117, respectively. However, the electrolyte leakage among genotypes showed no significant difference under RF conditions.
The thylakoid membranes are destroyed which directly or indirectly affect the chlorophyll content under drought stress conditions [39]. Drought causes a decline in the SPAD value of sugarcane leaves after exposure to drought [11,12,40]. SPAD value was employed in screening drought tolerance in sugarcane [5] and under the condition of drought stress, it could be used for screening for drought-tolerant and drought-sensitive genotypes.
Measurement of chlorophyll fluorescence from photosystem II (PSII) has become a useful method for the determination of mechanisms of photosynthesis and to study the effects of various environmental conditions on photosynthetic reactions [41,42]. The chlorophyll fluorescence parameter is used as the drought stress indicator in sugarcane [11,17,26,43]. Souza et al. [44] found that the maximum quantum yield of PSII efficiency decreased in sugarcane leaves after exposure to reduced rainfall. In our study, the decreased maximum quantum yield of PSII efficiency during drought stress was observed in Q117, LK92-11 and E08-4-019. The resistant genotypes seem to show less photosynthetic sensitivity to water shortage [13]. The drought-tolerant genotypes exhibit the higher maximum quantum yield of PSII efficiency which can be classified as drought tolerance [45]. In our study, the maximum quantum yield of PSII efficiency values of Ths98-271 and KK08-214 were higher than those of the other genotypes under ½FC conditions. The characteristics, such as the higher maximum quantum yield of PSII efficiency during drought stress and better recovery after re-watering are observed in the tolerant genotypes rather than in the sensitive genotypes.

4.1.2. Effect of Drought Stress on Photosynthetic Parameters under Drought and Recovery Conditions

The effect of drought on photosynthesis is associated with a large decrease in stomatal conductance due to stomatal closure in response to drought [39]. The reduction of stomatal conductance due to drought stress can affect photosynthetic processes. Many studies on sugarcane reported that greater stomatal closure and reduced transpiration were found in varieties considered to be more sensitive to drought stress [11,19,40]. However, drought-tolerant spring wheat cultivars have smaller stomata sizes and lower stomatal conductance. They are able to maintain relative water content and produce higher grain yield under drought stress conditions [46]. In our study, net photosynthetic rate, stomatal conductance and transpiration rate significantly decreased under drought stress conditions. Sugarcane photosynthetic parameters change with the change in soil moisture [21]. Photosynthetic parameters including net photosynthetic rate and stomatal conductance decreased during 21 days of the drought stress period. However, after re-watering, photosynthesis immediately recovered [21]. Medeiros et al. [14] also studied the effect of drought stress on two sugarcane genotypes exposed to drought for four and eight days. The net photosynthetic rate, stomatal opening and transpiration rate were decreased significantly. After re-watering for two days, RB962962 sugarcane plants recovered rapidly.
Several studies have shown that drought has a drastic effect on photosynthetic traits, such as net photosynthetic rate [14,15,17]. Low soil moisture and high air temperature generally occur together, and drought leads to evapotranspiration and affects photosynthesis under field conditions [47]. Endres et al. [19] reported that sugarcane variety RB92579, which has a drought tolerance mechanism, had higher transpiration and photosynthesis than the other varieties under low leaf water potential conditions. This variety had different responses to drought by reducing leaf water potential without greatly decreasing stomatal conductance and photosynthesis. Gomathi et al. [16] also found that the tolerant genotypes Co 99004 and Co 99008 transpired less water and showed relatively higher photosynthetic rates under drought conditions. Moreover, a strong reduction of transpiration rate was observed in more drought-sensitive sugarcane varieties when they were exposed to drought stress [14]. In specific sugarcane genotypes, the plants maintain photosynthetic activity and have deeper roots to allow plant water status maintenance [48]. Augustine et al. [49] reported that Erianthus arundinaceus IK76-81 had high stomatal conductance, transpiration rate and relative water content as well as a low photosynthetic rate under soil moisture stress.
In our study, it is interesting that S. spontaneum (Ths 98-271) had a higher net photosynthetic rate under early drought conditions. Similarly, Irvine [50] demonstrated that the photosynthetic rate on an area basis of S. spontaneum was greater than those of S. officinarum and hybrid cultivars. Moreover, KK3 was more tolerant and able to maintain higher photosynthetic activity after recovery and had higher cane yield and sugar yield under all three water regimes.
Water use efficiency is an important trait in the selection of drought-resistant varieties [11,51]. The tolerant sugarcane genotypes show higher intrinsic instantaneous water use efficiency and maintain higher water potential and photosynthetic capacity during water deficit [11]. During the drought stress period, KK3 exhibited the highest water use efficiency. However, no significant difference in this parameter was observed among genotypes and treatments.
The strategy in terms of spending or saving water depends on the timing, intensity of the drought period and sugarcane genotype at a particular location. The results suggest that maintaining photosynthetic performance during drought and recovery after re-watering at the stalk growth stage are important for determining the final yield in sugarcane.

4.2. Effect of Drought Stress on Agronomic Traits

Effect of Drought Stress on Yield and Yield Components

Drought stress significantly reduces yield in sugarcane [23,26,27]. Water deficit stress caused stunting, restriction of tillering which led to vacant and low millable stalk, and finally, the decreases in both cane and sugar yields after exposure to drought stress at the early growth stages and midseason [4]. Basnayake et al. [25] reported that water stress treatments reduced cane yield and total dry weight compared with irrigation treatments. Yield and its parameters showed remarkable changes due to inadequate water availability during the formative phase. The single stalk weight, cane height and internode length were reduced after withholding water for 90 days during the formative phase [52]. Prolonged drought stress reduced cane yield by around 21%, while the genotypes differed significantly for almost all the characters except stalk length and diameter under moderate drought stress conditions [53]. In our study, it was found that the decrease in cane yield was 1.32–37.82% under RF conditions. The cane yield of KK3 was higher than those of the other genotypes. The sugar yield of KK3 was significantly higher than those of the other genotypes under ½FC conditions. The sugar yields of KK3 and LK92-11 were significantly higher than those of the other genotypes under RF conditions. Klomsa-Ard et al. [54] reported that KK3 was the most superior genotype for sugar yield. It showed consistent stability and performance of sugar yield. Moreover, Songsri et al. [55] reported that KK3 and LK92-11 had high sugar yield and commercial cane sugar in both the plant and ratoon crops.
The millable cane decreased significantly under ½FC and RF conditions. This parameter was highest in Ths98-271 (602,750 stalks/ha). The results of our study are in agreement with those of Todd et al. [56], who reported that S. spontaneum population had a high stalk number.
The fiber content of Ths98-271, KK08-214, E08-4-019 and LK92-11 increased under early drought conditions. The maximum fiber content was observed in Ths98-271 under FC, ½FC and RF conditions. These results are consistent with those of Bull and Glasziou [57], who indicated that S. spontaneum had the greatest mean fiber content. Clones of S. spontaneum partitioned more photosynthate into the insoluble fiber fraction. Nair et al. [58] reported that the intergeneric hybrids between S. officinarum and E. procerus had low sucrose content. The BC1 progenies generated by crossing between the F1 and modern sugarcane cultivars showed significant improvement in stalk weight and sucrose content. It may be possible to develop varieties with a few more backcrosses.

5. Conclusions

Early drought stress induced decreases in net photosynthetic rate, transpiration rate and stomatal conductance of sugarcane plants. Differences among genotypes were mainly found in photosynthetic parameters. It seems likely that the wild-type sugarcane (Ths 98-271), KK08-214 and E08-4-019 could maintain better photosynthetic performance while encountering drought stress. Wild and commercial sugarcane exhibited better photosynthetic performance while being under recovery conditions. The multiple agronomic traits of six sugarcane genotypes were affected by early drought stress. Drought stress decreased cane yield in sugarcane. KK3 exhibited the ability to maintain physiological functions during drought and recovery after re-watering and showed higher cane yield and sugar yield than those of the other genotypes.

Supplementary Materials

The following are available online at https://www.mdpi.com/article/10.3390/agronomy11112319/s1, Figure S1: Average maximum and minimum temperature and relative humidity between January and December 2017.

Author Contributions

Conceptualization, M.K., P.S. and W.L.; conducting research, analyzing soil and plant samples, carrying out statistical analysis, N.L.; writing—original draft preparation, N.L.; writing—review and editing, M.K. and P.S. All authors have read and agreed to the published version of the manuscript.

Funding

This research was mainly funded by the Research and Researchers for Industries of the Thailand Science, Research and Innovation (grant number PHD58I0059) and Thai Sugar Millers Corporation, Limited. It was also partially funded by the Northeast Thailand Cane and Sugar Research Center (NECS), Khon Kaen University (KKU), Khon Kaen, Thailand.

Institutional Review Board Statement

Not applicable.

Informed Consent Statement

Not applicable.

Data Availability Statement

The data presented in this study are available within the article.

Acknowledgments

Special thanks are due to the Department of Biology, Faculty of Science and the Department of Agronomy, Faculty of Agriculture, Khon Kaen University for providing research facilities.

Conflicts of Interest

The authors declare no conflict of interest.

References

  1. Macrelli, S.; Mogensen, J.; Zacchi1, G. Techno-economic evaluation of 2nd generation bioethanol production from sugarcane bagasse and leaves integrated with the sugar-based ethanol process. Biotechnol. Biofuels 2012, 5, 22. [Google Scholar] [CrossRef] [Green Version]
  2. Prachaiyo, B. Farmers and forests: A changing phase in Northeast Thailand. Southeast Asian Stud. 2000, 38, 271–446. Available online: http://hdl.handle.net/2433/56758 (accessed on 1 November 2021).
  3. Lawlor, D.W.; Comic, G. Photosynthetic carbon assimilation and associated metabolism in relation to water deficits in higher plants. Plant Cell Environ. 2002, 25, 275–294. [Google Scholar] [CrossRef] [Green Version]
  4. Zingaretti, S.M.; Rodrigues, F.A.; Graca, J.P.; Pereira, L.M.; Lourenco, M.V. Sugarcane responses at water deficit conditions. In Water Stress, 1st ed.; Rahman, I.M.M., Ed.; IntechOpen: Shanghai, China, 2012; pp. 255–276. [Google Scholar] [CrossRef] [Green Version]
  5. Jangpromma, N.; Songsti, P.; Thammasirirak, S.; Jaisil, P. Rapid assessment of chlorophyll content in sugarcane using a SPAD chlorophyll meter across different water stress conditions. Asian J. Plant Sci. 2010, 9, 368–374. [Google Scholar] [CrossRef] [Green Version]
  6. Zhao, D.; Glaz, M.; Comstock, J.C. Sugarcane response to water-deficit stress during early growth on organic and sand soils. Am. J. Agric. Biol. Sci. 2010, 5, 403–414. [Google Scholar] [CrossRef] [Green Version]
  7. Cha-um, S.; Wangmoon, S.; Mongkolsiriwatana, C.; Ashraf, M.; Kirdmanee, C. Evaluating sugarcane (Saccharum sp.) cultivars for water deficit tolerance using some key physiological markers. Plant Biotechnol. 2012, 29, 431–439. [Google Scholar] [CrossRef] [Green Version]
  8. Inman-Bamber, N.G.; Smith, D.M. Water relations in sugarcane and response to water deficits. Field Crops Res. 2005, 92, 185–202. [Google Scholar] [CrossRef]
  9. Sato, A.M.; Catuchi, T.A.; Ribeiro, R.V.; Souza, G.M. The use of network analysis to uncover homeostatic responses of a drought-tolerant sugarcane cultivar under severe water deficit and phosphorus supply. Acta Physiol. Plant. 2010, 32, 1145–1151. [Google Scholar] [CrossRef]
  10. Griffiths, H.; Parry, M.A.J. Plant responses to water stress. Ann. Bot. 2002, 89, 801–802. [Google Scholar] [CrossRef] [Green Version]
  11. Silva, M.A.; Jifon, J.L.; Santos, C.M.; Jadoski, C.J.; Silva, J.A.G. Photosynthetic capacity and water use efficiency in sugarcane genotypes subject to water deficit during early growth phase. Braz. Arch. Biol. Technol. 2013, 56, 735–748. [Google Scholar] [CrossRef] [Green Version]
  12. Jain, R.; Chandra, A.; Venugopaplan, V.K.; Solomon, S. Physiological changes and expression of SOD and P5CS genes in response to water deficit in sugarcane. Sugar Tech 2015, 17, 276–282. [Google Scholar] [CrossRef]
  13. Ribeiro, R.V.; Machado, R.S.; Machado, E.C.; Machado, D.F.S.P.; Filho, R.M.; Landell, M.G.A. Revealing drought-resistance and productive patterns in sugarcane genotypes by evaluating both physiological responses and stalk yield. Exp. Agric. 2013, 49, 212–224. [Google Scholar] [CrossRef]
  14. Medeiros, D.B.; da Silva, E.C.; Nogueira, R.J.M.C.; Teixeira, M.M.; Buckeridge, M.S. Physiological limitations in two sugarcane varieties under water suppression and after recovering. Theor. Exp. Plant Physiol. 2013, 25, 213–222. [Google Scholar] [CrossRef] [Green Version]
  15. Natarajan, S.; Basnayake, J.; Lakshmanan, P.; Fukai, S. Genotypic variation in intrinsic transpiration efficiency correlates with sugarcane yield under rainfed and irrigated field conditions. Physiol. Plant. 2020, 172, 976–989. [Google Scholar] [CrossRef] [PubMed]
  16. Gomathi, R.; Vasantha, S.; Hemaprabha, G.; Alarmelu, S.; Shanthi, R.M. Evaluation of elite sugarcane clones for drought tolerance. J. Sugarcane Res. 2011, 1, 55–62. Available online: http://epubs.icar.org.in/ejournal/index.php/JSR/article/view/99240 (accessed on 1 November 2021).
  17. da Graca, J.P.; Rodrigues, F.A.; Farias, J.R.B.; da Oliveira, M.C.N.; Hoffmann-Campo, C.B.; Zingaretti, S.M. Physiological parameters in sugarcane cultivars submitted to water deficit. Braz. J. Plant Physiol. 2010, 22, 189–197. [Google Scholar] [CrossRef] [Green Version]
  18. Ashraf, M. Some important physiological selection criteria for salt tolerance in plants. Flora 2004, 199, 361–376. [Google Scholar] [CrossRef]
  19. Endres, L.; Silva, J.V.; Ferreira, V.M.; Souza Barbosa, G.V.D. Photosynthesis and water relations in Brazilian sugarcane. Open Agric. J. 2010, 4, 31–37. [Google Scholar] [CrossRef]
  20. Basnayake, J.; Jackson, P.A.; Inman-Bamber, N.G.; Lakshmanan, P. Sugarcane for water-limited environments. Variation in stomatal conductance and its genetic correlation with crop productivity. J. Exp. Bot. 2015, 66, 3945–3958. [Google Scholar] [CrossRef] [Green Version]
  21. Dinh, T.H.; Takaragawa, H.; Watanabe, K.; Nakabaru, M.; Kawamitsu, Y. Leaf photosynthesis response to change of soil moisture content in sugarcane. Sugar Tech 2019, 21, 949–958. [Google Scholar] [CrossRef]
  22. Zargar, S.M.; Gupta, N.; Nazir, M.; Mahajan, R.; Malik, F.A.; Sofi, N.R.; Shikari, A.B.; Salgotra, R.K. Impact of drought on photosynthesis: Molecular perspective. Plant Gene 2017, 11, 154–159. [Google Scholar] [CrossRef]
  23. Robertson, M.J.; Inman-Bamber, N.G.; Muchow, R.C.; Wood, A.W. Physiology and productivity of sugarcane with early and mid-season water deficit. Field Crops Res. 1999, 64, 211–227. [Google Scholar] [CrossRef]
  24. Silva, M.A.; Silva, J.A.G.D.; Enciso, J.; Sharma, V.; Jifon, J. Yield components as indicators of drought tolerance of sugarcane. Sci. Agric. 2008, 65, 620–627. [Google Scholar] [CrossRef] [Green Version]
  25. Basnayake, J.; Jackson, P.A.; Inman-Bamber, N.G.; Lakshmanan, P. Sugarcane for water-limited environments: Genetic variation in cane yield and sugar content in response to water stress. J. Exp. Bot. 2012, 63, 6023–6033. [Google Scholar] [CrossRef] [PubMed]
  26. Silva, M.D.A.; Jifon, J.L.; de Silva, J.A.G.; Sharma, V. Use of physiological parameters as fast tools to screen for drought tolerance in sugarcane. Braz. J. Plant. Physiol. 2007, 9, 193–201. [Google Scholar] [CrossRef] [Green Version]
  27. Silva, M.A.; Soares, R.A.B.; Landell, M.G.A.; Campana, M.P. Agronomic performance of sugarcane families in response to water stress. Bragantia 2008, 67, 655–661. [Google Scholar] [CrossRef] [Green Version]
  28. Hemaprabha, G.; Nagarajan, R.; Alarmelu, S.; Natarajan, U.S. Parental potential of sugarcane clones for drought resistance breeding. Sugar Tech 2006, 8, 59–62. [Google Scholar] [CrossRef]
  29. Lizana, C.; Wentworth, M.; Martinez, J.P.; Villegas, D.; Meneses, R.; Murchie, E.H.; Pastenes, C.; Lercari, B.; Vernieri, P.; Horton, P.; et al. Differential adaptation of two varieties of common bean to abiotic stress: I. Effects of drought on yield and photosynthesis. J. Exp. Bot. 2006, 57, 685–697. [Google Scholar] [CrossRef] [PubMed] [Green Version]
  30. Filek, M.; Walas, S.; Mrowiec, H.; Rudolphy-Skόrska, E.; Sieprawska, A.; Biesaga-Kościelniak, J. Membrane permeability and micro- and microelement accumulation in spring wheat cultivars during the short-term effect of salinity and PEG-induced water stress. Acta Physiol. Plant 2012, 34, 985–995. [Google Scholar] [CrossRef] [Green Version]
  31. Condon, A.G.; Richards, R.A.; Rebetzke, G.J.; Farquhar, G.D. Improving intrinsic water-use efficiency and crop yield. Crop Sci. 2002, 42, 122–131. [Google Scholar] [CrossRef]
  32. Ehsanullah, K.J.; Jamil, M.; Ghafar, A. Optimizing the row spacing and seeding density to improve yield and quality of sugarcane. Crop Environ. 2011, 2, 1–5. [Google Scholar]
  33. Farooq, M.; Wahid, A.; Kobayashi, N.; Fujita, D.; Basra, S.M.A. Plant drought stress: Effects, mechanisms and management. Agron. Sustain. Dev. 2009, 29, 185–212. [Google Scholar] [CrossRef] [Green Version]
  34. Wang, B.; Liu, C.; Zhang, D.; He, C.; Zhang, J.; Li, Z. Effects of maize organ-specific drought stress response on yields from transcriptome analysis. BMC Plant Biol. 2019, 19, 335. [Google Scholar] [CrossRef] [PubMed] [Green Version]
  35. Martineau, J.R.; Specht, J.E.; Williams, J.H.; Sullivan, C.Y. Temperature tolerance in soybeans: Evaluation of a technique for assessing cellular membrane thermostability. Crop Sci. 1979, 19, 75–78. [Google Scholar] [CrossRef]
  36. Bouchemal, K.; Bouldjadj, R.; Belbekri, M.N.; Ykhlef, N.; Djekoun, A. Differences in antioxidant enzyme activities and oxidative markers in ten wheat (Triticum durum Desf.) genotypes in response to drought, heat and paraquat stress. Arch. Agron. Soil Sci. 2016, 63, 710–722. [Google Scholar] [CrossRef]
  37. Sudhakar, P.; Latha, P.; Babu, A.M. Evaluation of sugarcane genotypes for high water use efficiency and thermostability tolerance under imposed moisture stress at formative stage. Sugar Tech 2010, 12, 72–75. [Google Scholar] [CrossRef]
  38. Reyes, J.A.O.; Carpentero, A.S.; Santos, P.J.A.; Delfin, E.F. Effects of water regime, genotype, and formative stages on the agro-physiological responses of sugarcane (Saccharum officinarum L.) to drought. Plants 2020, 9, 661. [Google Scholar] [CrossRef] [PubMed]
  39. Fang, Y.; Xiong, L. General mechanisms to drought response and their application in drought resistance improvement in plants. Cell. Mol. Life Sci. 2015, 72, 673–689. [Google Scholar] [CrossRef] [PubMed]
  40. Zhao, D.; Glaz, B.; Comstock, J.C. Sugarcane leaf photosynthesis and growth characters during development of water-deficit stress. Crop Sci. 2013, 53, 1066–1075. [Google Scholar] [CrossRef] [Green Version]
  41. Krause, G.H. Chlorophyll fluorescence and photosynthesis: The basics. Annu. Rev. Plant Biol. 1991, 43, 313–349. [Google Scholar] [CrossRef]
  42. Maxwell, K.; Johnson, G.N. Chlorophyll fluorescence: A practical guide. J. Exp. Bot. 2000, 51, 659–668. [Google Scholar] [CrossRef]
  43. Silva, M.A.; Jifon, J.L.; Silva, J.A.D.; Santos, C.M.D.; Shama, V. Relationships between physiological traits and productivity of sugarcane in response to water deficit. J. Agric. Sci. 2014, 152, 104–118. [Google Scholar] [CrossRef]
  44. Souza, A.P.; Grandis, A.; Arenque-Musa, B.C.; Buckeridge, M. Diurnal variation in gas exchange and nonstructural carbohydrates throughout sugarcane development. Funct. Plant Biol. 2018, 45, 865–876. [Google Scholar] [CrossRef] [PubMed]
  45. Silva, M.A.; Jifon, J.L.; Sharma, V.; Silva, J.A.G.; Caputo, M.M.; Damaj, M.B.; Guimaraes, E.R.; Ferro, M.I.T. Use of physiological parameters in screening drought tolerance in sugarcane genotypes. Sugar Tech 2011, 13, 191–197. [Google Scholar] [CrossRef]
  46. Baloch, M.J.; Dunwell, J.; Khan, N.U.; Jatoi, W.A.; Khakhwani, A.A.; Vessar, N.F.; Gul, S. Morpho-physiological characterization of spring wheat genotypes under drought stress. Int. J. Agric. Biol. 2013, 15, 945–950. [Google Scholar]
  47. Mir, R.R.; Zaman-Allah, M.; Sreenivasulu, N.; Trethowan, R.; Varshney, R.K. Integrated genomics, physiology and breeding approaches for improving drought tolerance in crops. Theor. Appl. Genet. 2012, 125, 625–645. [Google Scholar] [CrossRef] [Green Version]
  48. Endres, L.; Santos, C.M.; Silva, J.V.; Barbosa, G.V.S.; Silva, A.L.J.; Froehlich, A.; Teixeira, M.M. Inter-relationship between photosynthetic efficiency, Δ13C, antioxidant activity and sugarcane yield under drought stress in field conditions. J. Agron. Crop Sci. 2019, 205, 433–446. [Google Scholar] [CrossRef]
  49. Augustine, S.M.; Syamaladevi, D.P.; Premachandran, M.N.; Ravichandran, V.; Subramonian, N. Physiological and molecular insights to drought responsiveness in Erianthus spp. Sugar Tech 2015, 17, 121–129. [Google Scholar] [CrossRef]
  50. Irvine, J.E. Relations of photosynthetic rate and leaf and canopy characters of sugarcane yield. Crop Sci. 1975, 15, 671–676. [Google Scholar] [CrossRef]
  51. Silva, A.L.C.; Costa, W.A.J.M. Varietal variation in stomatal conductance, transpiration and photosynthesis of commercial sugarcane varieties under two contrasting water regimes. Trop. Agric. Res. Ext. 2009, 12, 97–102. [Google Scholar] [CrossRef]
  52. Hemaprabha, G.; Swapna, S.; Lavanya, D.L.; Sajitha, B.; Venkataramana, S. Evaluation of drought tolerance potential of elite genotypes and progenies of sugarcane (Saccharum sp. hybrids). Sugar Tech 2013, 15, 9–16. [Google Scholar] [CrossRef]
  53. Ishaq, M.N.; Olaoye, G. Cane yield attributes and heritability of juice quality characters in sugarcane under moisture deficit conditions. Sugar Tech 2009, 11, 360–367. [Google Scholar] [CrossRef]
  54. Klomsa-Ard, P.; Jaisil, P.; Patanothai, A. Performance and stability for yield and component traits of elite sugarcane genotypes across production environments in Thailand. Sugar Tech 2013, 15, 354–364. [Google Scholar] [CrossRef]
  55. Songsri, P.; Nata, J.; Bootprom, N.; Jongrungklang, N. Performances of elite sugarcane genotypes for agro-physiological traits in relation to yield potential and ratooning ability under rain-fed conditions. J. Agron. 2020, 19, 1–13. [Google Scholar] [CrossRef] [Green Version]
  56. Todd, J.; Wang, J.; Glaz, B.; Sood, S.; Ayala-Silva, T.; Nayak, S.N.; Glynn, N.C.; Gutierrez, O.A.; Kuhn, D.N.; Tahir, M.; et al. Phenotypic characterization of the Miami World Collection of sugarcane (Saccharum spp.) and related grasses for selecting a representative core. Genet. Resour. Crop Evol. 2014, 61, 1581–1596. [Google Scholar] [CrossRef]
  57. Bull, T.A.; Glasziou, K.T. The evolutionary significance of sugar accumulation in Saccharum. Aust. J. Biol. Sci. 1963, 16, 737–742. [Google Scholar] [CrossRef] [Green Version]
  58. Nair, N.V.; Mohanraj, K.; Sunadaravelpandian, K.; Suganya, A.; Selvi, A.; Appunu, C. Characterization of an intergeneric hybrids of Erianthus procerus × Saccharum officinarum and its backcross progenies. Euphytica 2017, 213, 267–277. [Google Scholar] [CrossRef]
Figure 1. Soil moisture content at 15–45 cm below soil surface and rainfall between January and December 2017; FC = field capacity, ½FC = ½ field capacity and RF = rain fed.
Agronomy 11 02319 g001
Table 1. Mean squares for stalk height and diameter, Soil Plant Analysis Development (SPAD) value, electrolyte leakage (EL) and maximum quantum yield of PSII efficiency (Fv/Fm) of six sugarcane genotypes under early drought conditions (determined four months after planting).
Source of VariancedfStalk HeightStalk DiameterSPAD ValueELFv/Fm
Block263.400.25021.682.130.000085
Water regime (W)211,496.60 **0.883 ns156.54 **2.28 ns0.001844 *
Error (a)450.800.2199.715.420.000112
Genotype (G) 5 2800.10 **3.084 **219.61 **55.46 **0.000746 **
W × G 10263.30 **0.241 *24.50 **21.06 ns0.000318 *
Error (b)30112.000.0998.859.93 0.000135
**,* and ns indicate significance at p ≤ 0.01, significance at p ≤ 0.05 and non-significance, respectively.
Table 2. Stalk height and diameter of six sugarcane genotypes under early drought conditions (determined four months after planting).
GenotypeStalk Height (cm)Stalk Diameter (cm)
FC½FCRFFC½FCRF
Ths98-271100.42 ± 6.60 Aa59.17 ± 4.37 Bb45.02 ± 4.75 Cbc1.08 ± 0.28 Ac1.43 ± 0.54 Ac1.00 ± 0.17 Ac
KK08-214105.17 ± 14.00 Aa91.67 ± 12.41 ABa62.50 ± 18.19 Bab1.83 ± 0.06 Ab1.87 ± 0.12 Abc1.77 ± 0.38 Aab
E08-4-019105.00 ± 14.86 Aa66.67 ± 11.43 Bb63.58 ± 10.36 Ba1.40 ± 0.20 Abc1.53 ± 0.25 Abc1.38 ± 0.26 Abc
KK374.67 ± 10.68 Ab43.83 ± 1.26 Bc34.08 ± 3.00 Bcd3.02 ± 0.51 Aa1.97 ± 0.41 Bb2.03 ± 0.23 Ba
Q117117.25 ± 1.09 Aa61.00 ± 7.76 Bb39.70 ± 3.25 Ccd2.73 ± 0.58 Aa2.50 ± 0.43 Aa1.98 ± 0.36 Aa
LK92-1161.42 ± 18.45 Ab32.75 ± 6.72 Bc24.17 ± 6.17 Bd3.02 ± 0.50 Aa2.63 ± 0.18 ABa2.27 ± 0.19 Ba
FC = field capacity, ½FC = ½ field capacity and RF = rain fed. Different uppercase letters indicate significant differences among irrigation treatments in each genotype; different lowercase letters indicate significant differences among genotypes in each irrigation treatment by LSD at p ≤ 0.05.
Table 3. Soil Plant Analysis Development (SPAD) value and electrolyte leakage (EL) of six sugarcane genotypes under early drought conditions (determined four months after planting).
GenotypeSPAD ValueEL (%)
FC½FCRFFC½FCRF
Ths98-27145.30 ± 0.36 Ab43.70 ± 5.39 Aa37.33 ± 5.06 Ab18.95 ± 3.66 Aab16.22 ± 2.28 Abc17.61 ± 5.04 Aa
KK08-21440.10 ± 0.52 Ac40.23 ± 2.57 Aa31.97 ± 7.15 Ab15.64 ± 3.61 Ab18.37 ± 5.11 Abc16.79 ± 1.73 Aa
E08-4-01951.53 ± 1.70 Aa43.03 ± 2.44 Ba48.47 ± 2.15 Aa24.83 ± 4.68 Aa20.69 ± 2.29 ABb18.04 ± 0.95 Ba
KK342.57 ± 3.01 Abc34.27 ± 3.62 Bb37.50 ± 0.90 Abb18.30 ± 0.40 Ab18.41 ± 1.83 Abc20.89 ± 3.61 Aa
Q11735.10 ± 2.10 Ad32.80 ± 1.08 ABb31.30 ± 1.51 Bb16.10 ± 1.49 Ab15.76 ± 2.26 Ac19.14 ± 1.97 Aa
LK92-1143.57 ± 2.72 Abc41.93 ± 0.84 Aa36.63 ± 2.93 Bb21.49 ± 4.22 Bab27.36 ± 0.80 Aa20.12 ± 1.22 Ba
FC = field capacity, ½FC = ½ field capacity and RF = rain fed. Different uppercase letters indicate significant differences among irrigation treatments in each genotype; different lowercase letters indicate significant differences among genotypes in each irrigation treatment by LSD at p ≤ 0.01.
Table 4. Maximum quantum yield of PSII efficiency (Fv/Fm) of six sugarcane genotypes under early drought conditions (determined four months after planting).
GenotypeFv/Fm
FC½FCRF
Ths98-2710.796 ± 0.001 Ab0.800 ± 0.007 Aa0.798 ± 0.007 Aa
KK08-2140.799 ± 0.001 Ab0.792 ± 0.007 Aab0.789 ± 0.011 Aa
E08-4-0190.798 ± 0.004 Ab0.780 ± 0.006 Cbc0.788 ± 0.004 Ba
KK30.794 ± 0.007 Ab0.772 ± 0.008 Ac0.775 ± 0.022 Aab
Q1170.798 ± 0.002 Ab0.773 ± 0.020 ABbc0.747 ± 0.031 Bb
LK92-110.806 ± 0.003 Aa0.775 ± 0.008 Bbc0.782 ± 0.003 Ba
FC = field capacity, ½FC = ½ field capacity and RF = rain fed. Different uppercase letters indicate significant differences among irrigation treatments in each genotype; different lowercase letters indicate significant differences among genotypes in each irrigation treatment by LSD at p ≤ 0.05.
Table 5. Mean squares for net photosynthetic rate (A), transpiration rate (E), stomatal conductance (gs) and water use efficiency (WUE) of six sugarcane genotypes under early drought conditions (determined four months after planting).
Source of VariancedfAEgsWUE
Block27.4920.267870.000356.806
Water regime (W)2127.926 **1.67186 *0.0403 **1.087 ns
Error (a)44.5100.178640.00022.808
Genotype (G)5150.659 **1.20583 **0.00633 *0.911 ns
W × G 10 71.384 **0.58557 *0.00582 **1.814 ns
Error (b)3019.4800.269670.001721.453
**,* and ns indicate significance at p ≤ 0.01, significance at p ≤ 0.05 and non-significance, respectively.
Table 6. Net photosynthetic rate (A), transpiration rate (E), stomatal conductance (gs) and water use efficiency (WUE) of six sugarcane genotypes under early drought conditions (determined four months after planting).
GenotypeNet Photosynthetic Rate (µmol CO2 m−2s−1)Transpiration Rate (mmol H2O m−2s−1 )
FC½FCRFFC½FCRF
Ths98-27140.25 ± 2.44 AB44.49 ± 3.33 Aa38.83 ± 2.42 Ba3.75 ± 0.23 A3.86 ± 0.95 Aa3.14 ± 0.34 Aab
KK08-21437.42 ± 2.88 AB41.17 ± 2.85 Aa31.97 ± 3.61 Babc3.65 ± 0.34 A3.61 ± 0.25 Aab2.87 ± 0.34 Aabc
E08-4-01936.67 ± 2.60 A33.30 ± 1.27 Ab39.52 ± 9.22 Aa3.08 ± 0.14 A2.88 ± 0.72 Aabc3.69 ± 0.95 Aa
KK336.76 ± 5.19 A35.35 ± 2.04 Ac25.23 ± 1.42 Bab3.47 ± 0.55 A2.13 ± 0.52 Cc2.82 ± 0.38 Babc
Q11735.78 ± 4.04 A28.90 ± 5.42 Bbc24.54 ± 6.42 Bc3.17 ± 0.82 A2.70 ± 0.23 ABbc2.05 ± 0.41 Bc
LK92-1140.66 ± 1.50 A29.99 ± 4.03 Bbc27.24 ± 4.95 Bbc3.44 ± 0.17 A2.75 ± 0.24 Bbc2.46 ± 0.41 Bbc
GenotypeStomatal conductance (mol H2O m−2s−1)Water use efficiency (µmol CO2 mmol−1 H2O)
FC½FCRFFC½FCRF
Ths98-2710.268 ± 0.037 Aab0.272 ± 0.068 Aa0.209 ± 0.010 Aab10.79 ± 1.1811.86 ± 2.1612.49 ± 1.82
KK08-2140.286 ± 0.039 Aab0.253 ± 0.022 Aab0.171 ± 0.029 Bbc10.29 ± 0.5811.48 ± 1.4711.13 ± 0.26
E08-4-0190.234 ± 0.030 Ab0.193 ± 0.026 Abc0.244 ± 0.062 Aa11.93 ± 1.3511.93 ± 2.2710.74 ± 0.24
KK30.280 ± 0.058 Aab0.132 ± 0.020 Cc0.208 ± 0.016 Bab10.64 ± 1.2412.19 ± 2.1312.70 ± 1.66
Q1170.243 ± 0.046 Aab0.155 ± 0.031 Bc0.124 ± 0.041 Bc11.59 ± 1.7010.66 ± 1.0511.87 ± 0.84
LK92-110.314 ± 0.015 Aa0.175 ± 0.042 Bc0.141 ± 0.038 Bbc11.85 ± 0.9110.90 ± 0.8711.07 ± 0.20
FC = field capacity, ½FC = ½ field capacity and RF = rain fed. Different uppercase letters indicate significant differences among irrigation treatments in each genotype; different lowercase letters indicate significant differences among genotypes in each irrigation treatment by LSD at p ≤ 0.05.
Table 7. Mean squares for net photosynthetic rate (A), transpiration rate (E), stomatal conductance (gs) and water use efficiency (WUE) of six sugarcane genotypes under recovery conditions (determined six months after planting).
Source of Variance dfAEgsWUE
Block219.8750.182210.003920.74543
Water regime (W)24.364 ns0.53344 *0.00561 ns1.56514 ns
Error (a)40.6990.065550.000860.36104
Genotype (G)5132.589 **3.11207 **0.0501 **2.33369 **
W × G 1015.597 **0.50565 **0.01002 **0.71195 *
Error (b)303.4750.1055400.002600.29859
**,* and ns indicate significance at p ≤ 0.01, significance at p ≤ 0.05 and non-significance, respectively.
Table 8. Net photosynthetic rate (A), transpiration rate (E), stomatal conductance (gs) and water use efficiency (WUE) of six sugarcane genotypes under recovery conditions (determined six months after planting).
GenotypeNet Photosynthetic Rate (µmol CO2 m−2s−1)Transpiration Rate (mmol H2O m−2s−1)
FC½FCRFFC½FCRF
Ths98-27139.11 ± 1.12 Ab37.94 ± 2.37 Ac37 ± 1.43 Acd4.77 ± 0.12 Aa4.13 ± 0.25 Bc3.82 ± 0.09 Bbc
KK08-21441.06 ± 1.17 Aab37.42 ± 1.35 Ac39.21 ± 2.64 Abc4.39 ± 0.14 Aab4.20 ± 0.17 Ac4.34 ± 0.62 Aab
E08-4-01938.60 ± 1.65 Ab42.11 ± 2.24 Aab43.13 ± 1.74 Aa3.99 ± 0.56 Ab4.92 ± 0.24 Aab4.86 ± 0.21 Aa
KK342.23 ± 1.27 Aa43.33 ± 1.65 Aa42.98 ± 0.24 Aab4.61 ± 0.41 ABa5.03 ± 0.14 Aa4.52 ± 0.06 Ba
Q11731.07 ± 2.50 Ac32.10 ± 0.99 Ad32.03 ± 3.1 Ae3.09 ± 0.21 Ac3.17 ± 0.20 Ad2.97 ± 0.22 Ad
LK92-1141.02 ± 2.41 Aab39.18 ± 3.19 Abc33.20 ± 2.53 Bde4.45 ± 0.33 Aab4.30 ± 0.66 Abc3.26 ± 0.31 Bcd
GenotypeStomatal conductance (mol H2O m−2s−1)Water use efficiency (µmol CO2 mmol−1 H2O)
FC½FCRFFC½FCRF
Ths98-2710.398 ± 0.033 Aa0.317 ± 0.034 Bc0.293 ± 0.013 Bbc8.20 ± 0.16 Bb9.22 ± 0.82 ABb9.69 ± 0.51 Abc
KK08-2140.364 ± 0.033 Aab0.330 ± 0.025 Ac0.376 ± 0.101 Aab9.35 ± 0.27 Aab8.92 ± 0.35 Ab9.09 ± 0.72 Ac
E08-4-0190.305 ± 0.072 Ab0.440 ± 0.034 Aab0.441 ± 0.070 Aa9.78 ± 1.05 Aa8.56 ± 0.50 Ab8.88 ± 0.14 Ac
KK30.387 ± 0.065 Bab0.478 ± 0.013A a0.396 ± 0.014 Ba9.19 ± 0.56 ABab8.62 ± 0.35 Bb9.50 ± 0.13 Abc
Q1170.205 ± 0.016 Ac0.217 ± 0.027 Ad0.200 ± 0.026 Ac10.05 ± 0.75 Aa10.17 ± 0.85 Aa10.78 ± 0.35 Aa
LK92-110.368 ± 0.041 Aab0.364 ± 0.102 Abc0.229 ± 0.032 Bc9.24 ± 0.42 Aab9.18 ± 0.77 Ab10.21 ± 0.52 Aab
FC = field capacity, ½FC = ½ field capacity and RF = rain fed. Different uppercase letters indicate significant differences among irrigation treatments in each genotype; different lowercase letters indicate significant differences among genotypes in each irrigation treatment by LSD at p ≤ 0.05.
Table 9. Mean squares for single stalk weight, stalk height, stalk diameter, internode length and fiber content of six sugarcane genotypes under early drought conditions.
Source of VariancedfSingle
Stalk Weight
Stalk HeightStalk DiameterInternode LengthFiber ContentMillable Cane
Block20.00111047.830.0172.241.2813.26 × 108
Water regime (W)20.0665 *1807.72 ns0.078 ns5.19 ns10.199 ns1.39 × 1010 *
Error (a)40.00452286.640.0872.441.4791.35 × 109
Genotype (G)52.4588 **3198.10 **5.681 **7.63 **402.445 **3.71 × 10¹¹ **
W × G 100.0357 ns1633.67 ns0.059 ns4.75 *4.507 **5.84 × 10⁹ ns
Error (b)300.0345784.540.0351.630.8223.16 × 109
**,* and ns indicate significance at p ≤ 0.01, significance at p ≤ 0.05 and non-significance, respectively.
Table 10. Single stalk weight, stalk height, stalk diameter and millable cane of six sugarcane genotypes grown under well-watered (FC) and water-stressed (½FC and RF) conditions.
TreatmentSingle Stalk Weight (kg)Stalk Height (cm)Stalk Diameter (cm)Millable Cane (stalks/ha) × 103
Water regime (W)
FC0.840 ± 0.580 A315.54 ± 42.98 A1.86 ± 0.77 A251.26 ± 224.59 A
½FC0.898 ± 0.523 A307.88 ± 27.93 A1.88 ± 0.75 A200.22 ± 189.79 B
RF0.776 ± 0.448 B295.67 ± 36.32 A1.76 ± 0.80 A206.71 ± 179.60 B
Genotype (G)
Ths98-2710.144 ± 0.020 e270.79 ± 32.80 b0.66 ± 0.14 e602.75 ± 103.58 a
KK08-2140.694 ± 0.202 c310.87 ± 38.48 a1.53 ± 0.18 c172.82 ± 39.08 c
E08-4-0190.451 ± 0.171 d309.06 ± 39.49 a1.32 ± 0.35 d281.89 ± 101.50 b
KK31.475 ± 0.171 a305.35 ± 39.15 a2.59 ± 0.22 a101.64 ± 11.89 d
Q1170.875 ± 0.183 b326.08 ± 22.74 a2.25 ± 0.15 b75.89 ± 22.62 d
LK92-111.392 ± 0.245 a316.04 ± 25.99 a2.65±0.16 a81.40 ± 13.37 d
F-test
W*nsns*
G********
W × G nsnsnsns
FC = field capacity, ½FC = ½ field capacity and RF = rain fed. **,* and ns indicate significance at p ≤ 0.01, significance at p ≤ 0.05 and non-significance, respectively. Different uppercase letters indicate significant differences among irrigation treatments in each genotype; different lowercase letters indicate significant differences among genotypes in each irrigation treatment by LSD at p ≤ 0.05.
Table 11. Internode length and fiber content of six sugarcane genotypes grown under well-watered (FC) and water-stressed (½FC and RF) conditions.
GenotypeInternode Length (cm)Fiber Content (%)
FC½FCRFFC½FCRF
Ths98-27114.78 ± 0.05 Aab13.86 ± 0.10 Aab13.53 ± 1.41 Aab27.35 ± 1.45 Ba26.63 ± 0.80 Ba31.45 ± 1.15 Aa
KK08-21413.18 ± 0.80 ABc12.22 ± 1.59 Bab16.02 ± 2.41 Aa17.83 ± 0.81 Bb21.03 ± 2.05 Ab20.70 ± 1.60 ABb
E08-4-01915.34 ± 0.88 Aa12.29 ± 2.32 Aab13.32 ± 2.79 Aab19.45 ± 0.65 Bb19.90 ± 0.76 ABb20.85 ± 0.45 Ab
KK314.63 ± 0.39 Aabc13.93 ± 0.19 Aa11.86 ± 1.74 Bb12.90 ± 1.25 Ac12.73 ± 0.50 Acd13.20 ± 0.70 Ac
Q11711.11 ± 0.64 Ad11.71 ± 0.49 Ab12.21 ± 0.76 Ab13.23 ± 0.90 Ac12.97 ± 0.12 Ac12.80 ± 0.20 Ac
LK92-1113.32 ± 1.41 Ac11.91 ± 0.37 Aab12.16 ± 0.10 Ab9.73 ± 0.64 Bd11.07 ± 0.38 Ad10.50 ± 0.36 ABd
FC = field capacity, ½FC = ½ field capacity and RF = rain fed. Different uppercase letters indicate significant differences among irrigation treatments in each genotype; different lowercase letters indicate significant differences among genotypes in each irrigation treatment by LSD at p ≤ 0.05.
Table 12. Mean squares for sugar yield, cane yield and commercial cane sugar (CCS) of six sugarcane genotypes under early drought conditions.
Source of VariancedfCane YieldSugar YieldCCS
Block2105.704.0985.41
Water regime (W)22071.36 **3.140 ns5.04
Error (a)433.471.5331.25
Genotype (G)57828.81 **187.044 **129.47 **
W × G 10962.24 **7.005 **3.42 **
Error (b)30127.831.7550.84
** and ns indicate significance at p ≤ 0.01 and non-significance, respectively.
Table 13. Cane yield and sugar yield of six sugarcane genotypes grown under well-watered (FC) and water-stressed (½FC and RF) conditions.
GenotypeCane Yield (tons/ha)Sugar Yield (tons/ha)
FC½FCRFFC½FCRF
Ths98-27182.95 ± 3.48 Acd89.73 ± 3.13 Acd81.85 ± 6.80 Ab0.925 ± 0.913 Ad0.049 ± 0.085 Ae1.883 ± 1.321 Ad
KK08-214108.45 ± 10.50 Abc122.62 ± 11.73 Ab106.79 ± 3.57 Aa8.874 ± 2.492 Ac10.467 ± 2.173 Ab9.604 ± 1.234 Ab
E08-4-019132.80 ± 15.65 Ab83.66 ± 0.98 Cde112.41 ± 1.16 Ba7.998 ± 0.843 Abc3.902 ± 0.463 Bd4.563 ± 0.065 Bc
KK3188.66 ± 10.98 Aa147.23 ± 3.48 Ba117.32 ± 9.46 Ca14.697 ± 0.857 Aa14.314 ± 1.687 Aa12.53 ± 1.294 Aa
Q11768.33 ± 15.26 Ad75.89 ± 2.85 Ae46.79 ± 0.36 Bc7.255 ± 2.425 Ac8.054 ± 1.353 Ac5.670 ± 0.060 Ac
LK92-11120.48 ± 28.20 Ab102.92 ± 10.78 Ac109.11 ± 11.79 Aa11.424 ± 1.025 Ab11.100 ± 1.315 Ab12.002 ± 1.332 Aa
FC = field capacity, ½FC = ½ field capacity and RF = rain fed. Different uppercase letters indicate significant differences among irrigation treatments in each genotype; different lowercase letters indicate significant differences among genotypes in each irrigation treatment by LSD at p ≤ 0.01.
Table 14. Commercial cane sugar (CCS) of six sugarcane genotypes grown under well-watered (FC) and water-stressed (½FC and RF) conditions.
GenotypeCCS (%)
FC½FCRF
Ths98-2711.10 ± 1.10 ABd0.06 ± 0.09 Bd2.27 ± 1.46 Ae
KK08-2147.29 ± 1.59 Ac8.47 ± 1.00 Ab8.98 ± 0.86 Ac
E08-4-0196.70 ± 0.17 Ac4.66 ± 0.50 Bc4.06 ± 0.10 Bd
KK37.79 ± 0.02 Bbc9.72 ± 1.04 Aab10.67 ± 0.36 Ab
Q11710.49 ± 2.12 Aa10.58 ± 1.41 Aa12.12 ± 0.22 Aa
LK92-119.69 ± 1.44 Aab10.86 ± 1.62 Aa11.00 ± 0.36 Aab
FC = field capacity, ½FC = ½ field capacity and RF = rain fed. Different uppercase letters indicate significant differences among irrigation treatments in each genotype; different lowercase letters indicate significant differences among genotypes in each irrigation treatment by LSD at p ≤ 0.01.
Publisher’s Note: MDPI stays neutral with regard to jurisdictional claims in published maps and institutional affiliations.

