Article

Temporal Changes Analysis of Soil Properties Associated with Ganoderma boninense Pat. Infection in Oil Palm Seedlings in a Controlled Environment

by
Mohd H. A. Aziz
1,
Siti Khairunniza-Bejo
2,3,4,*,
Aimrun Wayayok
2,3,4,
Fazirulhisyam Hashim
5,6,
Naoshi Kondo
7 and
Aiman N. N. Azmi
2
1
Department of Science and Technology, Faculty of Humanities, Management and Science, Universiti Putra Malaysia, Bintulu Campus, Bintulu 97008, Malaysia
2
Department of Biological and Agricultural Engineering, Faculty of Engineering, Universiti Putra Malaysia, Serdang 43400, Malaysia
3
Smart Farming Technology Research Centre, Universiti Putra Malaysia, Serdang 43400, Malaysia
4
Institute of Plantation Studies, Universiti Putra Malaysia, Serdang 43400, Malaysia
5
Department of Computer and Communication Systems Engineering, Faculty of Engineering, Universiti Putra Malaysia, Serdang 43400, Malaysia
6
Wireless and Photonics Networks Research Centre, Faculty of Engineering, Universiti Putra Malaysia, Serdang 43400, Malaysia
7
Laboratory of Bio-Sensing Engineering, Graduate School of Agriculture, Kyoto University, Kyoto 606-8502, Japan
*
Author to whom correspondence should be addressed.
Agronomy 2021, 11(11), 2279; https://doi.org/10.3390/agronomy11112279
Submission received: 16 September 2021 / Revised: 28 October 2021 / Accepted: 1 November 2021 / Published: 11 November 2021

Abstract

:
Basal stem rot (BSR) disease of oil palm (Elaeis guineensis Jacq.) spreads through the contact of the plant roots with Ganoderma boninense (G. boninense) Pat. inoculum in the soil. The soil properties can be altered by growing seedlings with or without G. boninense inoculum. In the early stage of infection, the symptoms are difficult to detect. Therefore, an understanding of the environmental soil conditions of the plant is crucial in order to indicate the presence of the fungus. This paper presents an analysis of the temporal changes of the soil properties associated with the G. boninense infection in oil palm seedlings. A total of 40 seedlings aged five months were used in the study, comprising 20 inoculated (infected seedlings: IS) and 20 control (healthy seedlings: HS) seedlings. The seedlings were grown in a greenhouse for six months (24 weeks) under a controlled environmental temperature and humidity. The data of the soil moisture content (MC in %), electrical conductivity (EC in µS/cm), and temperature (T in °C) for each seedling were collected daily using three MEC10 soil sensors every hour and then transferred to the ThingSpeak cloud using a 3G Internet connection. Based on the results, the mean MC and EC showed a decreasing trend, while the mean T showed an increasing trend in both HS and IS during the six-month monitoring period. The overall mean in both the monthly and weekly analysis of MC, EC, and T was higher in HS than IS. However, in the monthly analysis, a Student’s t-test at a 5% significance level showed that only the soil MC and EC were significantly different between HS and IS, while in the weekly analysis, HS was significantly different from IS in all parameters. This study suggests that soil MC, EC, and T can be used as indicators of the G. boninense infection, especially for the weekly data.

1. Introduction

Oil palm (Elaeis guineensis Jacq.) is the most important commodity crop in Malaysia as it yields millions of tons of crude palm oil per year. Malaysia is the second-largest palm oil producer and exporter in the world (after Indonesia), with approximately 18 million tons exported per year. However, the palm oil industry in Malaysia is threatened by basal stem rot (BSR) disease caused by the wood-rotting fungus, Ganoderma boninense (G. boninense), which reduces oil palm production [1]. According to [2], the yearly loss in Malaysia due to this disease could be up to USD 360 million and it is considered as the biggest threat to the palm oil industry of the country [1].
G. boninense is a soil-borne fungus which inoculates the host through soil [3,4]. One of the primary routes of infection appears to be through root contact with inoculum sources in the soil [5,6,7]. The penetration of intact roots by G. boninense occurs before the infection gradually spreads towards the stem base (bole). The further developments of the disease will finally destroy the vascular system and cause symptoms of water and nutrient deficiency [8].
Generally, the survival of a soil-borne fungal infection is significantly related to soil moisture content [9,10,11,12], nutrient content [13,14] and temperature [15,16,17], either directly or indirectly [18]. A high soil moisture content of coastal soils might encourage G. boninense to grow [19]. Soils with a poor drainage and a high water retention capacity might favour BSR disease. However, this finding was contradicted in a report by Chang [12] that suggested flooding the infected area as a way to control the disease spread, based on the inability of G. boninense to survive in a condition of high soil moisture, which was tested under laboratory conditions. Therefore, it can be concluded that there might be a certain range of soil moisture content that favours the occurrence of G. boninense infection. Measuring the soil electrical conductivity (EC) is one of the common methods used to estimate the nutrient content and salinity of the soil. The EC of a soil sample is mostly influenced by the concentration and composition of nutrients in the form of ions [20,21,22]. EC levels that are too low indicate a low availability of nutrients, and EC levels that are too high indicate an excess of nutrients and/or other ions. Therefore, the EC levels need to be optimal to ensure a good soil fertility. Nutrient content is believed to be associated with the occurrence of the disease where a low soil nutrient might cause a greater abiotic stress to the oil palm seedlings, resulting in the early formation of the fruiting bodies of G. boninense, and a high disease incidence at 3 months after inoculation in a nursery [23]. This condition is associated with a low value of EC, while [24] proved that the supplementation of calcium, copper, and salicylic acid in oil palm seedlings inoculated with G. boninense inoculum was effective in suppressing the disease. Meanwhile, according to [25], for a plantation application in Malaysia, a non-saline soil (below 0.2 S/m) is most suitably used to plant the oil palm. A high salinity with a high water retention capacity is also associated with a higher BSR incidence of the mature trees in a plantation [26,27,28]. Under laboratory conditions, Nawawi and Ho [16] reported that G. boninense was found to grow at an optimum soil temperature between 27 to 30 °C, while Rees et al. [18] suggested that the infected seedlings grown under a shaded area showed symptoms of infection earlier than infected seedlings grown under direct sunlight. In general, the soil temperature is highly influenced by the intensity of sunlight on the soil surface [29,30].
A few studies involved 22 to 32 weeks of temporal monitoring associated with G. boninense infection in oil palm seedlings. Alexander et al. [31] and As’wad et al. [32] investigated the relationship between the rate of the disease spread and the ergosterol concentration in the plants. When a plant is infected, the plant defence mechanism starts to increase the ergosterol content to fight the infection. A higher amount of ergosterol in the first three months indicates that the palm defence mechanisms are activated, revealing that an early infection of the disease has occurred. Idris et al. [33], Rees et al. [7] and Breton et al. [34] observed the progress of the disease penetration through the roots which involved the effect of G. boninense inoculum size on the disease occurrence and the appearance of symptoms. The observation of the G. boninense invasion rate in the roots, as well as the effect of root injury in boosting the spread of the disease, can be achieved by using transmission electron microscopy (TEM).
Based on the literature, it can be concluded that an understanding of the soil properties of an infected plant might help in detecting the G. boninense occurrence at an early stage of infection. Temporal data could provide a further understanding of the progress and spread of the disease over time [35]. Therefore, this study aimed to analyse the temporal changes of the soil properties associated with G. boninense infection in oil palm seedlings at a weekly and monthly time scale. The soil properties that might have a significant influence on the ecology of the soil fungi, i.e., soil moisture content, electrical conductivity, and temperature were considered. As these parameters generally have a significant effect on the ecology of soil fungi, the conditions of soil planted with Ganoderma-infected seedlings might indicate a slight difference from the soil conditions of uninfected seedlings.

2. Materials and Methods

2.1. Study Area

The study was carried out at the transgenic greenhouse in the Institute of Tropical Agriculture and Food Security (ITAFoS), Universiti Putra Malaysia. The greenhouse was equipped with an air conditioner, humidifier, metal benches, a drip irrigation system, power supply, water tank, environmental sensor, and sunlight filter. All seedlings were placed on the benches in the greenhouse and grown under a controlled temperature and humidity. The temperature and humidity in the greenhouse were set to normal conditions, i.e., 28 to 32 °C for the environmental temperature and 60 to 90% for the environmental humidity. In total, 50 commercial Tenera (Dura × Pisifera) seedlings at the age of five months were used in the study. Twenty-five seedlings were inoculated with G. boninense inoculum (infected seedlings: IS), while another 25 seedlings were used as control (healthy seedlings: HS). However, only 40 seedlings (i.e., 20 HS and 20 IS) were used in the experiment and monitored as described in Section 2.3 below, while the remaining 10 seedlings were kept in the same greenhouse with the same management operation as a back-up if the seedlings used in the experiment died. The seedlings were infected with G. boninense using the technique proposed by Idris et al. [33] where the roots were attached to a Ganoderma rubber wood block (GRWB), while the roots of the control seedlings were attached to a rubber wood block without Ganoderma inoculum (RWB) using the sitting technique. The sitting technique involved positioning the seedling right on the upper part of the GRWB/RWB in a polybag (24 cm × 21 cm × 33 cm) as shown in Figure 1. GRWB is a rubber wood block colonised with G. boninense inoculum.
During the inoculation process, the preparation of the inoculated (infected) and uninoculated (healthy) seedlings were completed in two separate areas. This was to ensure that there was no physical contact between the healthy seedlings with GRWB. After the inoculation procedure, the seedlings were transplanted into 24 cm × 21 cm × 33 cm polybags comprising a mixture of 90% topsoil and 10% sand. The topsoil was taken from the agricultural land of University Agricultural Park, Universiti Putra Malaysia. The soil used was filtered using a soil sifter and dried under direct sunlight for three days. The seedlings were placed and arranged in the greenhouse based on a randomised complete block design (RCBD). The whole monitoring period of the study was six months (24 weeks). Two months after inoculation, two inoculated seedlings were taken from the back-up seedlings and were sent to the laboratory at the Department of Plant Protection, Faculty of Agriculture, Universiti Putra Malaysia, for a polymerase chain reaction (PCR) test to confirm the G. boninense infection. The samples were taken from the bole and roots of the seedlings. The specific primer of G. boninense designed by Utomo and Niepold [36]: Gan1: 5′-TTG ACT GGG TTG TAG CTG-3′ and Gan2: 5′-GCG TTA CAT CGC AAT ACA-3′ was used.
The seedlings in the greenhouse were watered using a drip irrigation system. The daily watering was scheduled from 9:10 am to 9:40 am every day with a total amount of 800 mL per seedling. Drippers were placed at three different points in the soil area of each seedling (Figure 2). The distance between each dripper was approximately 15 cm. This was to ensure that the water supplied to the soil surface was evenly distributed. The distance between the dripper and the stem of the seedlings was approximately 8 cm. Each seedling was fertilised every month at week 3, 8, 12, 16, and 21 using 50 g of solid nitrogen (N), phosphorus (P), and potassium (K) (NPK) fertiliser (15:15:15).

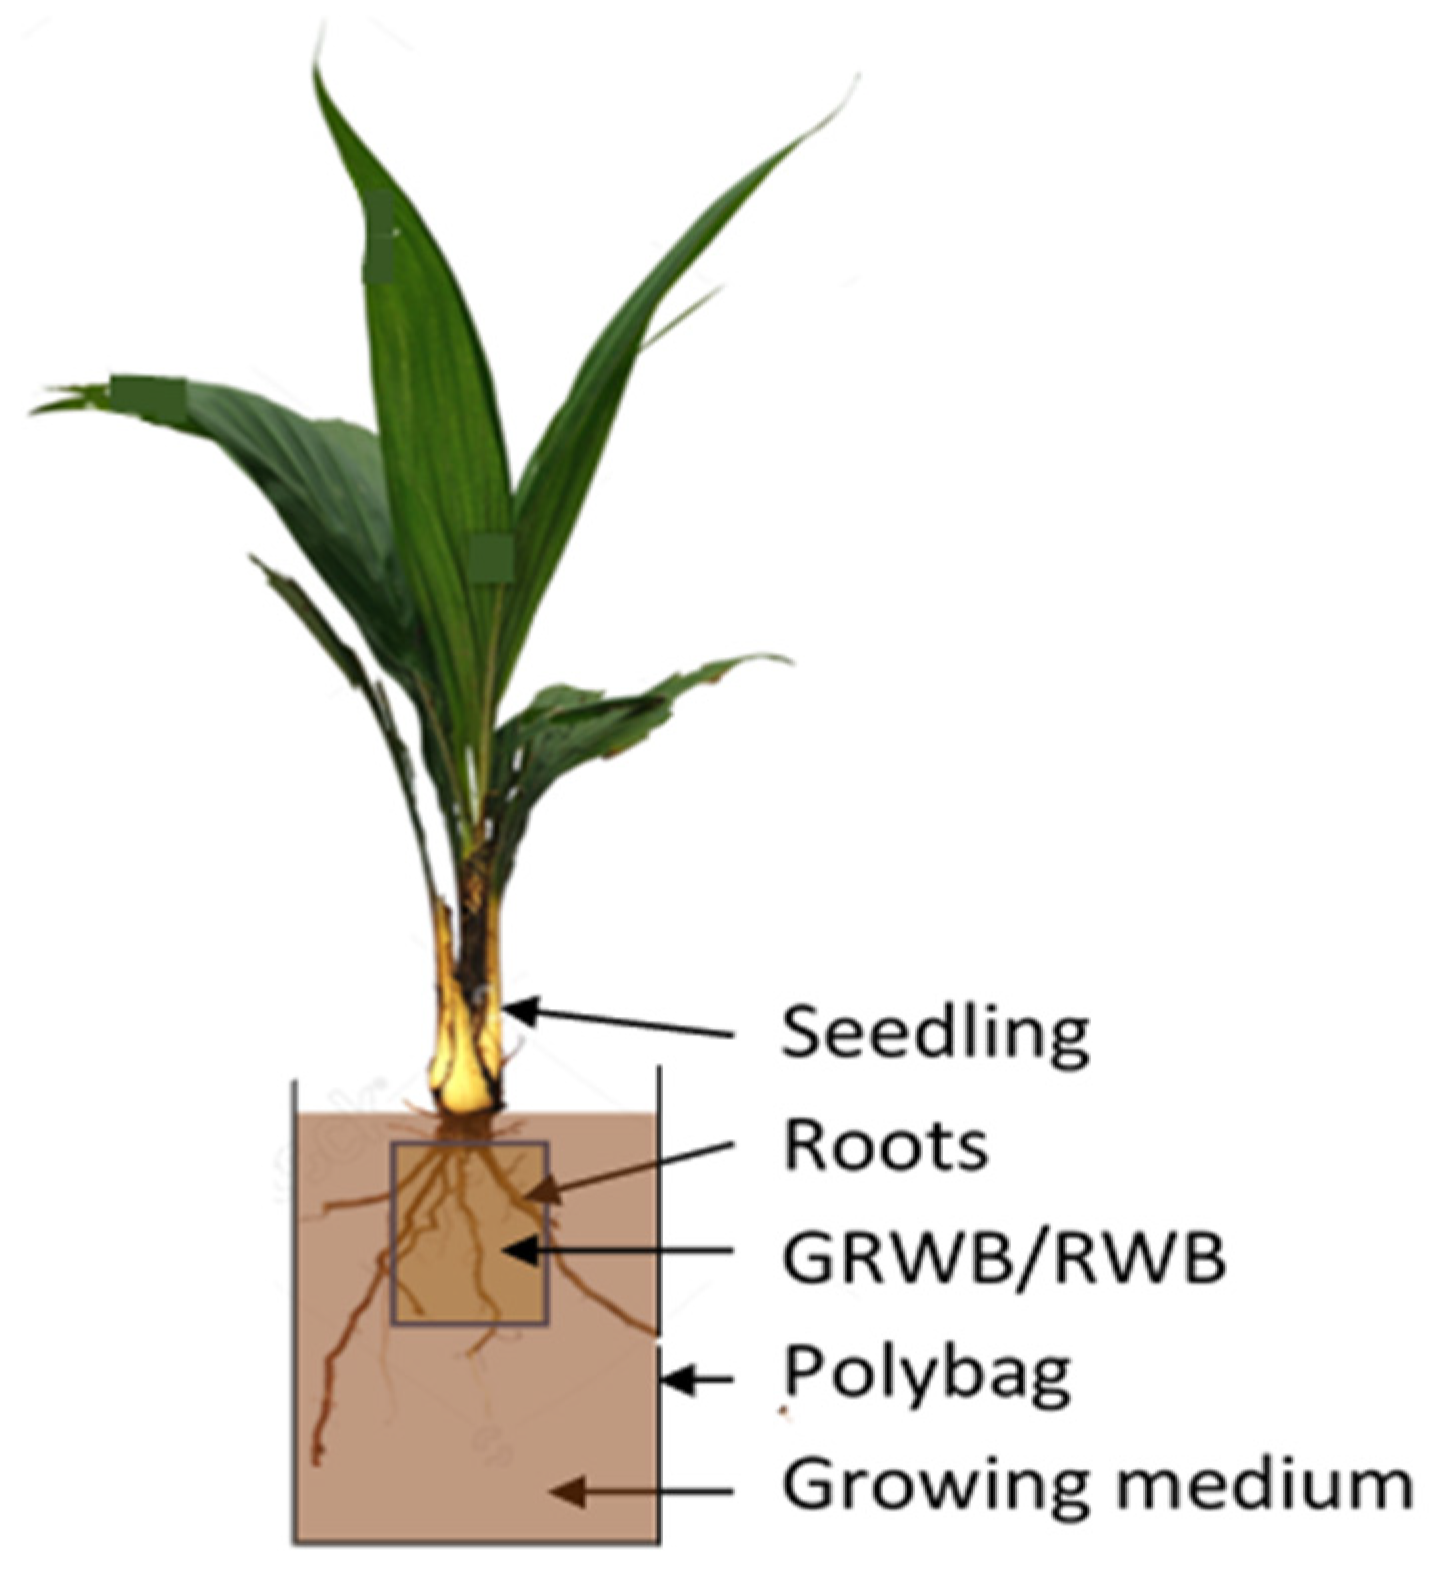
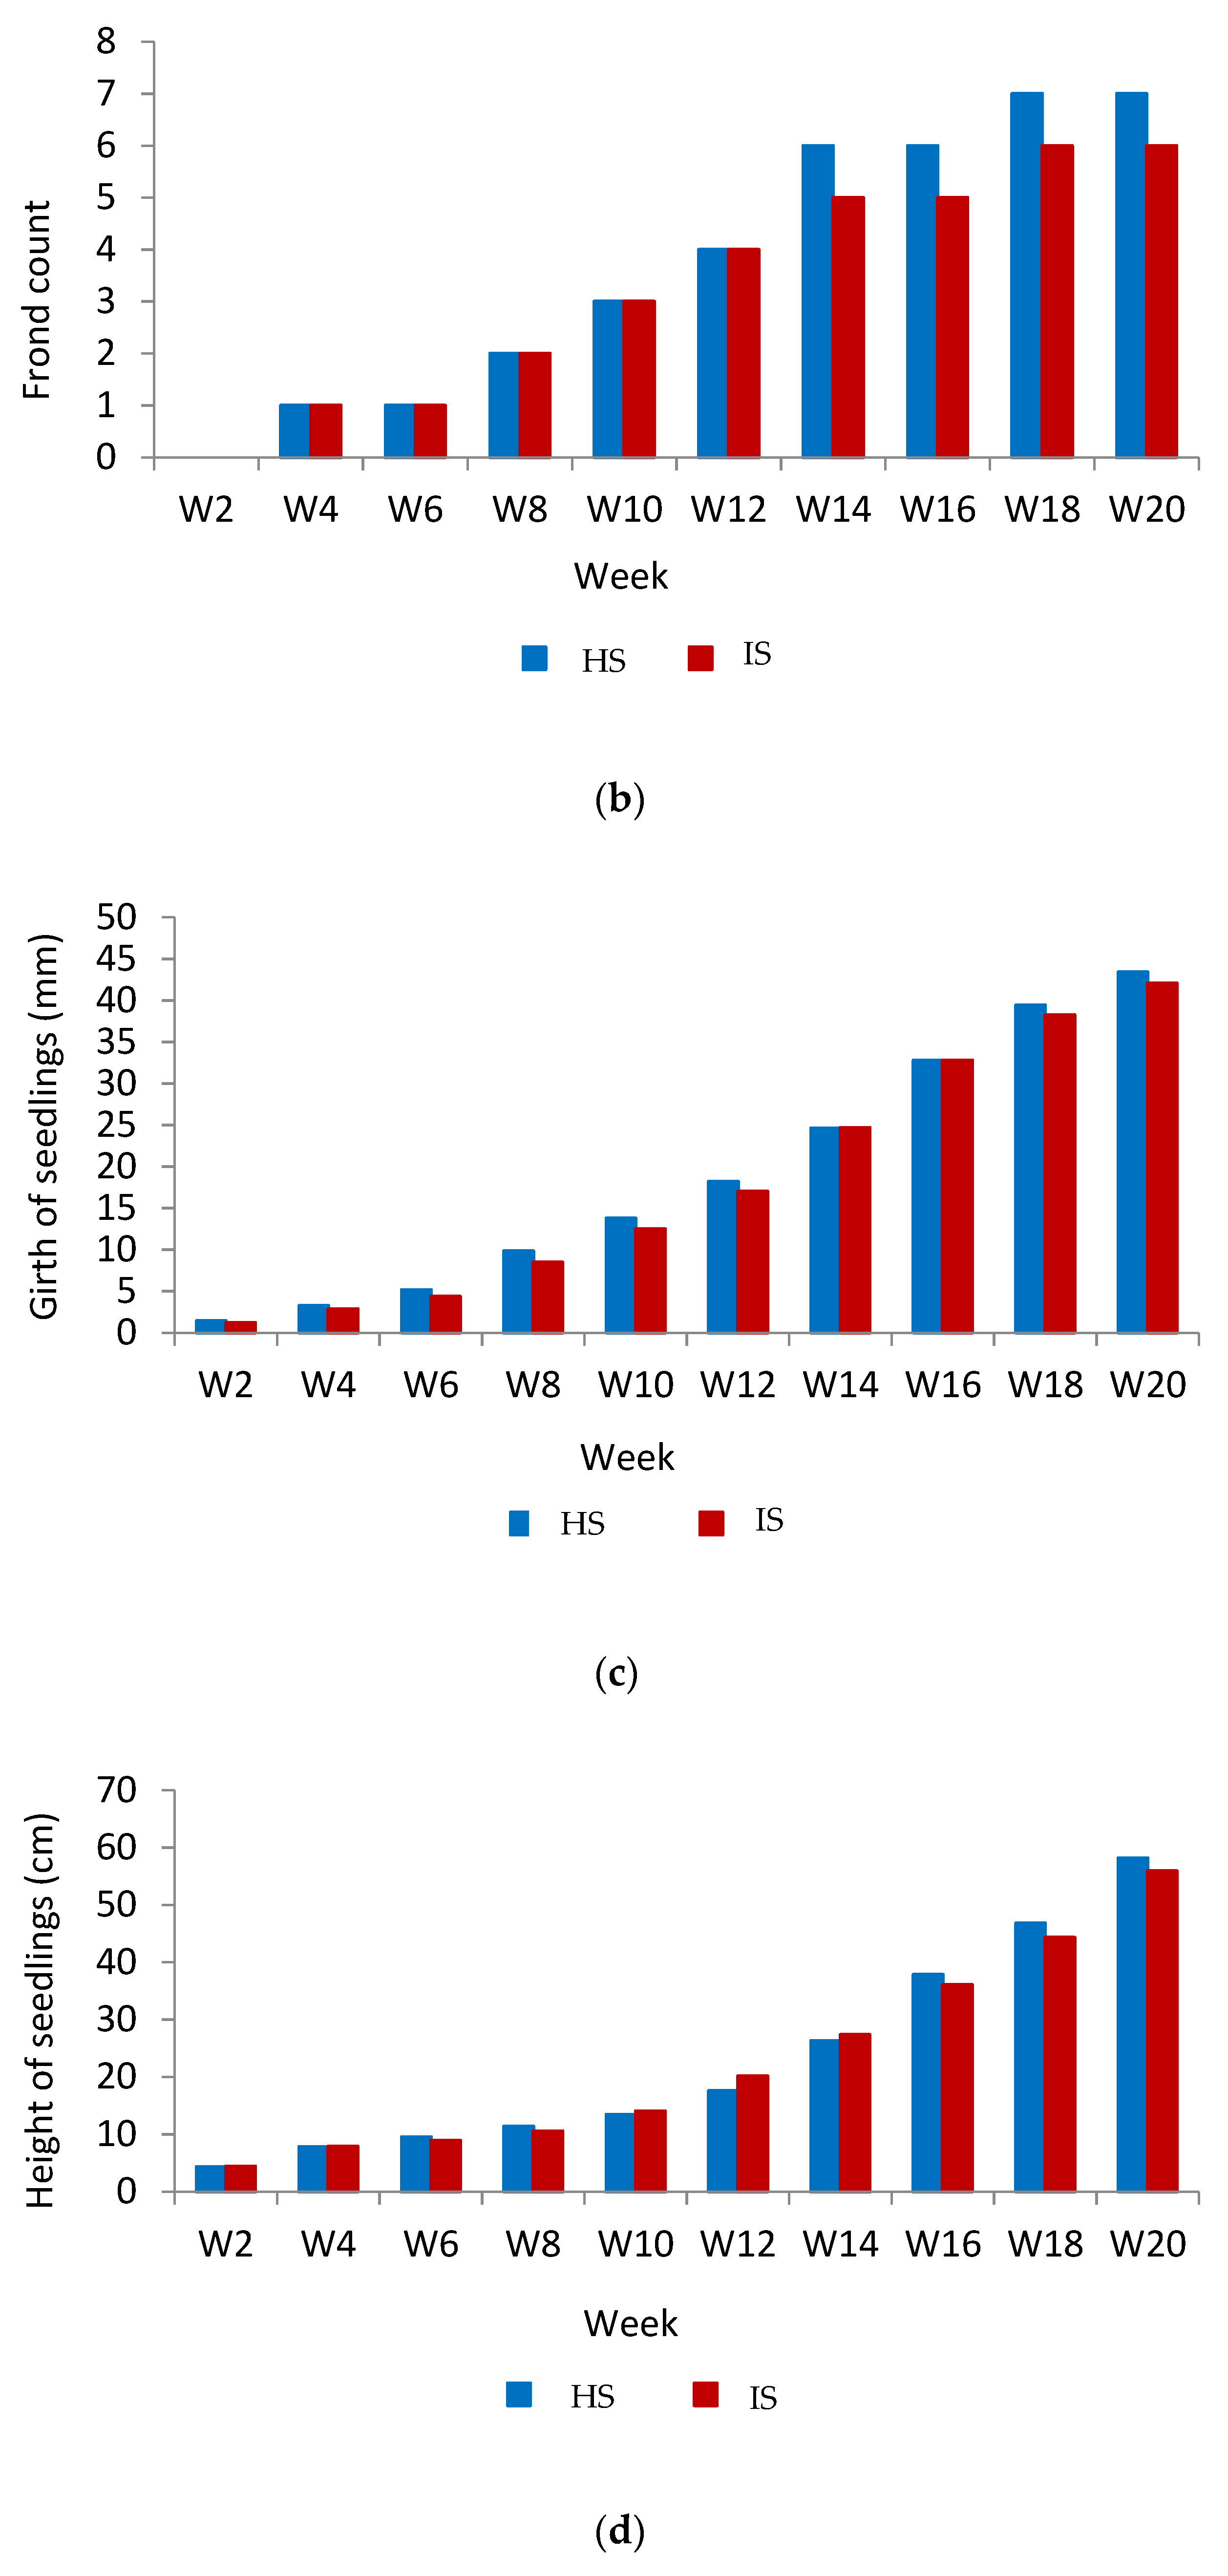
2.2. Physical Growth Measurement

There were four physical parameters measured during the study, namely chlorophyll content, measured using a Chlorophyll Meter SPAD-502 (Konica Minolta, Osaka, Japan); frond count, using manual counting; girth, using digital Vernier callipers (Mitutoyo Digital Calliper, Kanagawa, Japan); and height, using a measuring tape. The measurements were conducted every two weeks over the study period, where the first measurement was conducted immediately after transplanting as the initial growth of the seedlings.
Chlorophyll content was calculated from the average of 6 random readings of the top, middle, and bottom of the fully expanded left and right leaflets of the third frond using a technique proposed by Naidu et al. [37] and Rakib et al. [38]. The frond count was obtained by manually counting the fronds in every seedling. Fronds with more than 50% browning leaflets were excluded from the counting and considered as dry fronds. Girth was the diameter of the seedling stem. The measurement was taken at 2 cm above soil level. The height of the seedlings was measured from 2 cm above soil level to the tip of the highest frond. The highest fronds were identified by gathering all fronds to the centre of the polybag using the hand, and the highest frond appeared taller than the other fronds.

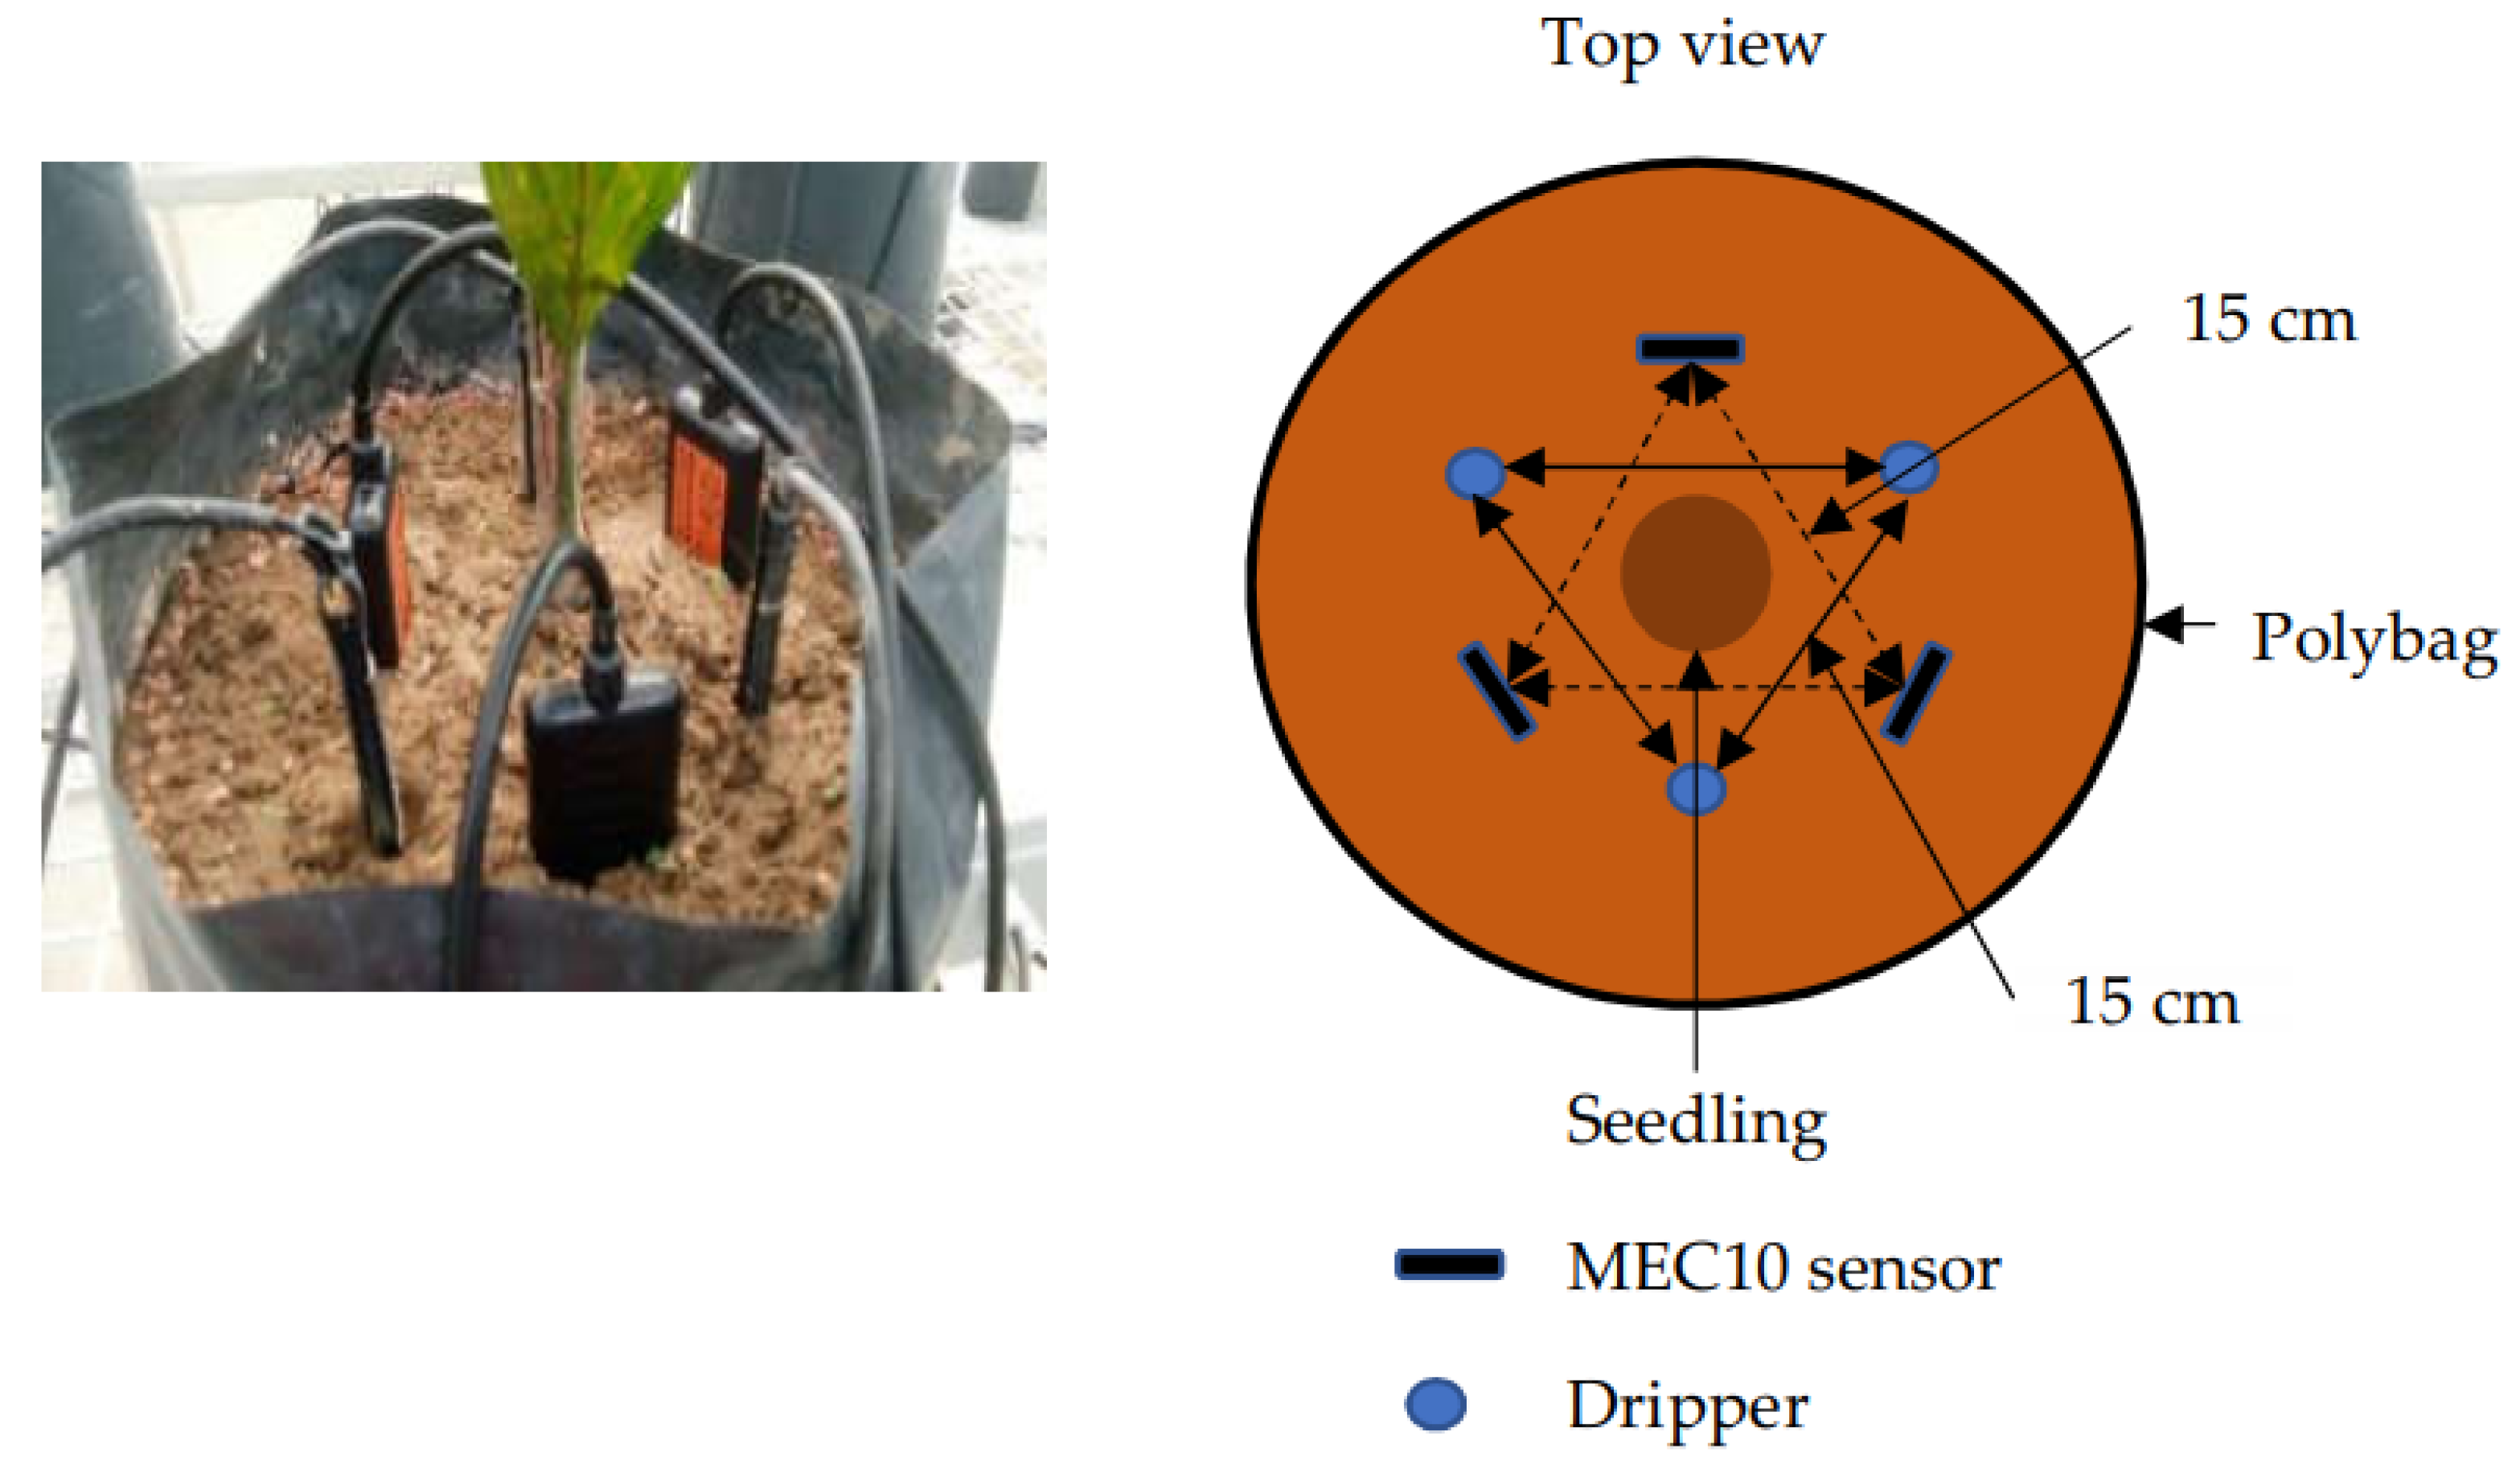
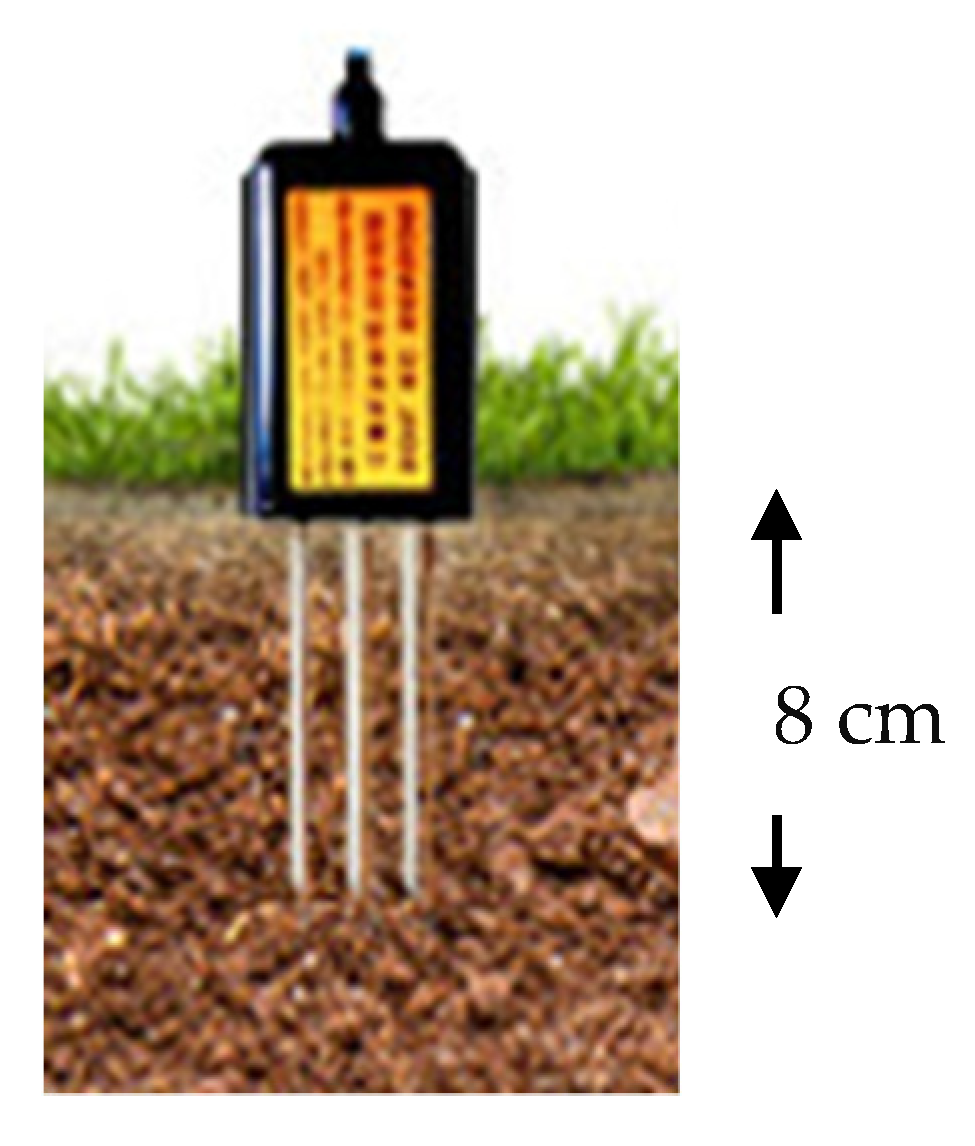
2.3. MEC10 Soil Sensor

A MEC10 soil sensor (Dalian Endeavour Technology Co., Ltd., Dalian, China) was used in this study to measure three soil parameters at a time: soil moisture content in volumetric water content (VWC in %), soil electrical conductivity (EC in µS/cm), and soil temperature (T in °C). It consisted of three stainless steel probes with 7 cm length each. It was a non-corrosive probe and could be continuously embedded into the soil without corroding.

2.4. Data Collection

The data were collected after two weeks of inoculation. Each soil medium in the polybag planted with the seedlings was monitored using three soil sensors simultaneously. The position of the MEC10 sensors was as shown in Figure 3. The probes of the sensors were embedded in the soil at 8 cm depth (Figure 3). There was generally a high concentration of roots in this layer as this was where the plants obtained much of their vital nutrients. The roots of the oil palm are generally not deeply rooted in the soil [39]. The data were collected for each hour every day for 24 weeks. Thus, for every hour, the sensors collected and transferred 120 readings of soil moisture content, soil electrical conductivity, and soil temperature to the ThingSpeak cloud using a 3G Internet connection. Data stored in the cloud were later downloaded for further analysis.

2.5. Data Analysis

Comparison of the healthy and infected seedlings was conducted using a paired-sample Student’s t-test available in Microsoft 365 Excel (Version 2108, Microsoft Corp., Redmond, WA, USA). The t-value of interest was the ratio of the mean difference between healthy and infected seedlings, i.e., HS-IS, at either the level of week or month, compared to its standard error.

3. Results and Discussion

Figure 4 shows the condition of the inoculated samples that were sent for a PCR test. Both samples (P1 and P6) did not show any physical symptoms of infection (Figure 4a), such as yellowing leaves. However, the boles showed a brown discolouration (Figure 4b). Based on the result of the PCR test (Figure 4c), a specific band size of approximately 160 to 170 bp was observed from all tested roots after gel electrophoresis, which indicated that the roots were infected with G. boninense.

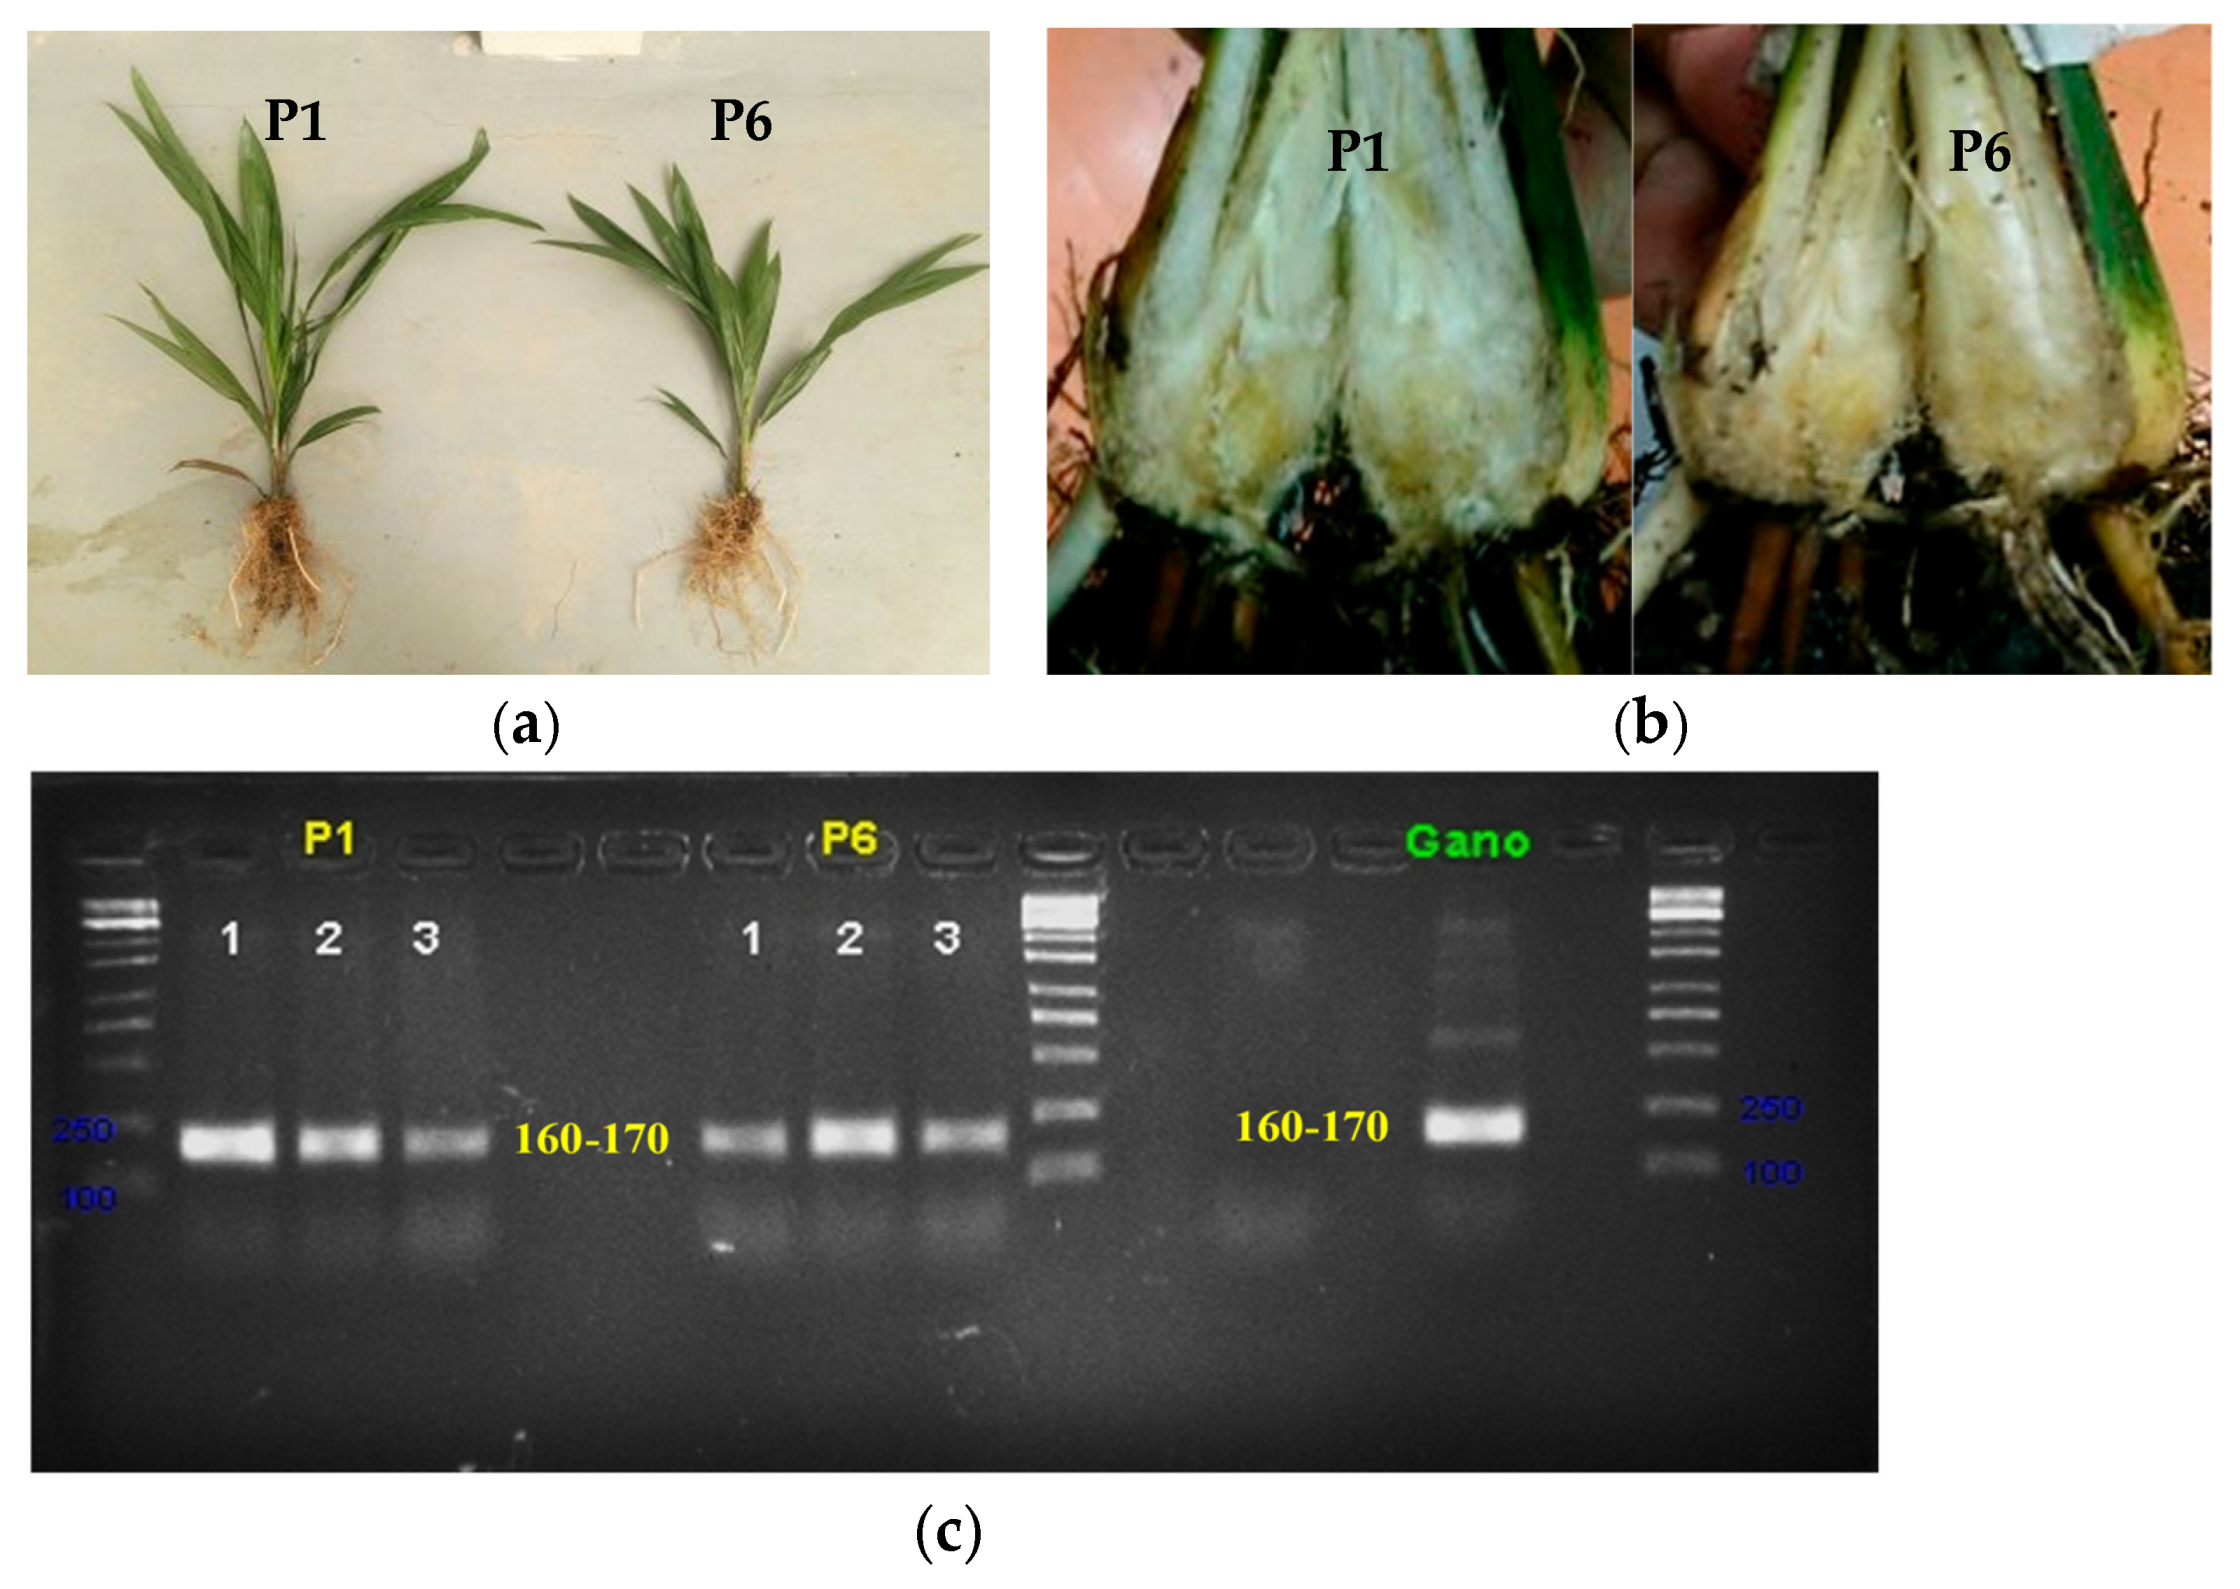
3.1. Analysis of Physical Properties

Overall, as shown in Figure 5, there was a trend between HS and IS for the (a) chlorophyll content, (b) frond count, (c) girth, and (d) height, where HS was higher most of the time, compared to IS seedlings. Many researchers agree that G. boninense infection may cause stunted oil palm seedlings in terms of chlorophyll content [38,40], frond count [37], girth [40,41], and height [41,42]. Stunted growth was typically due to nutrient deficiencies [43] caused by root damage. Other than damaging the roots, the infection also corrupted the xylem pathways and caused water stress.

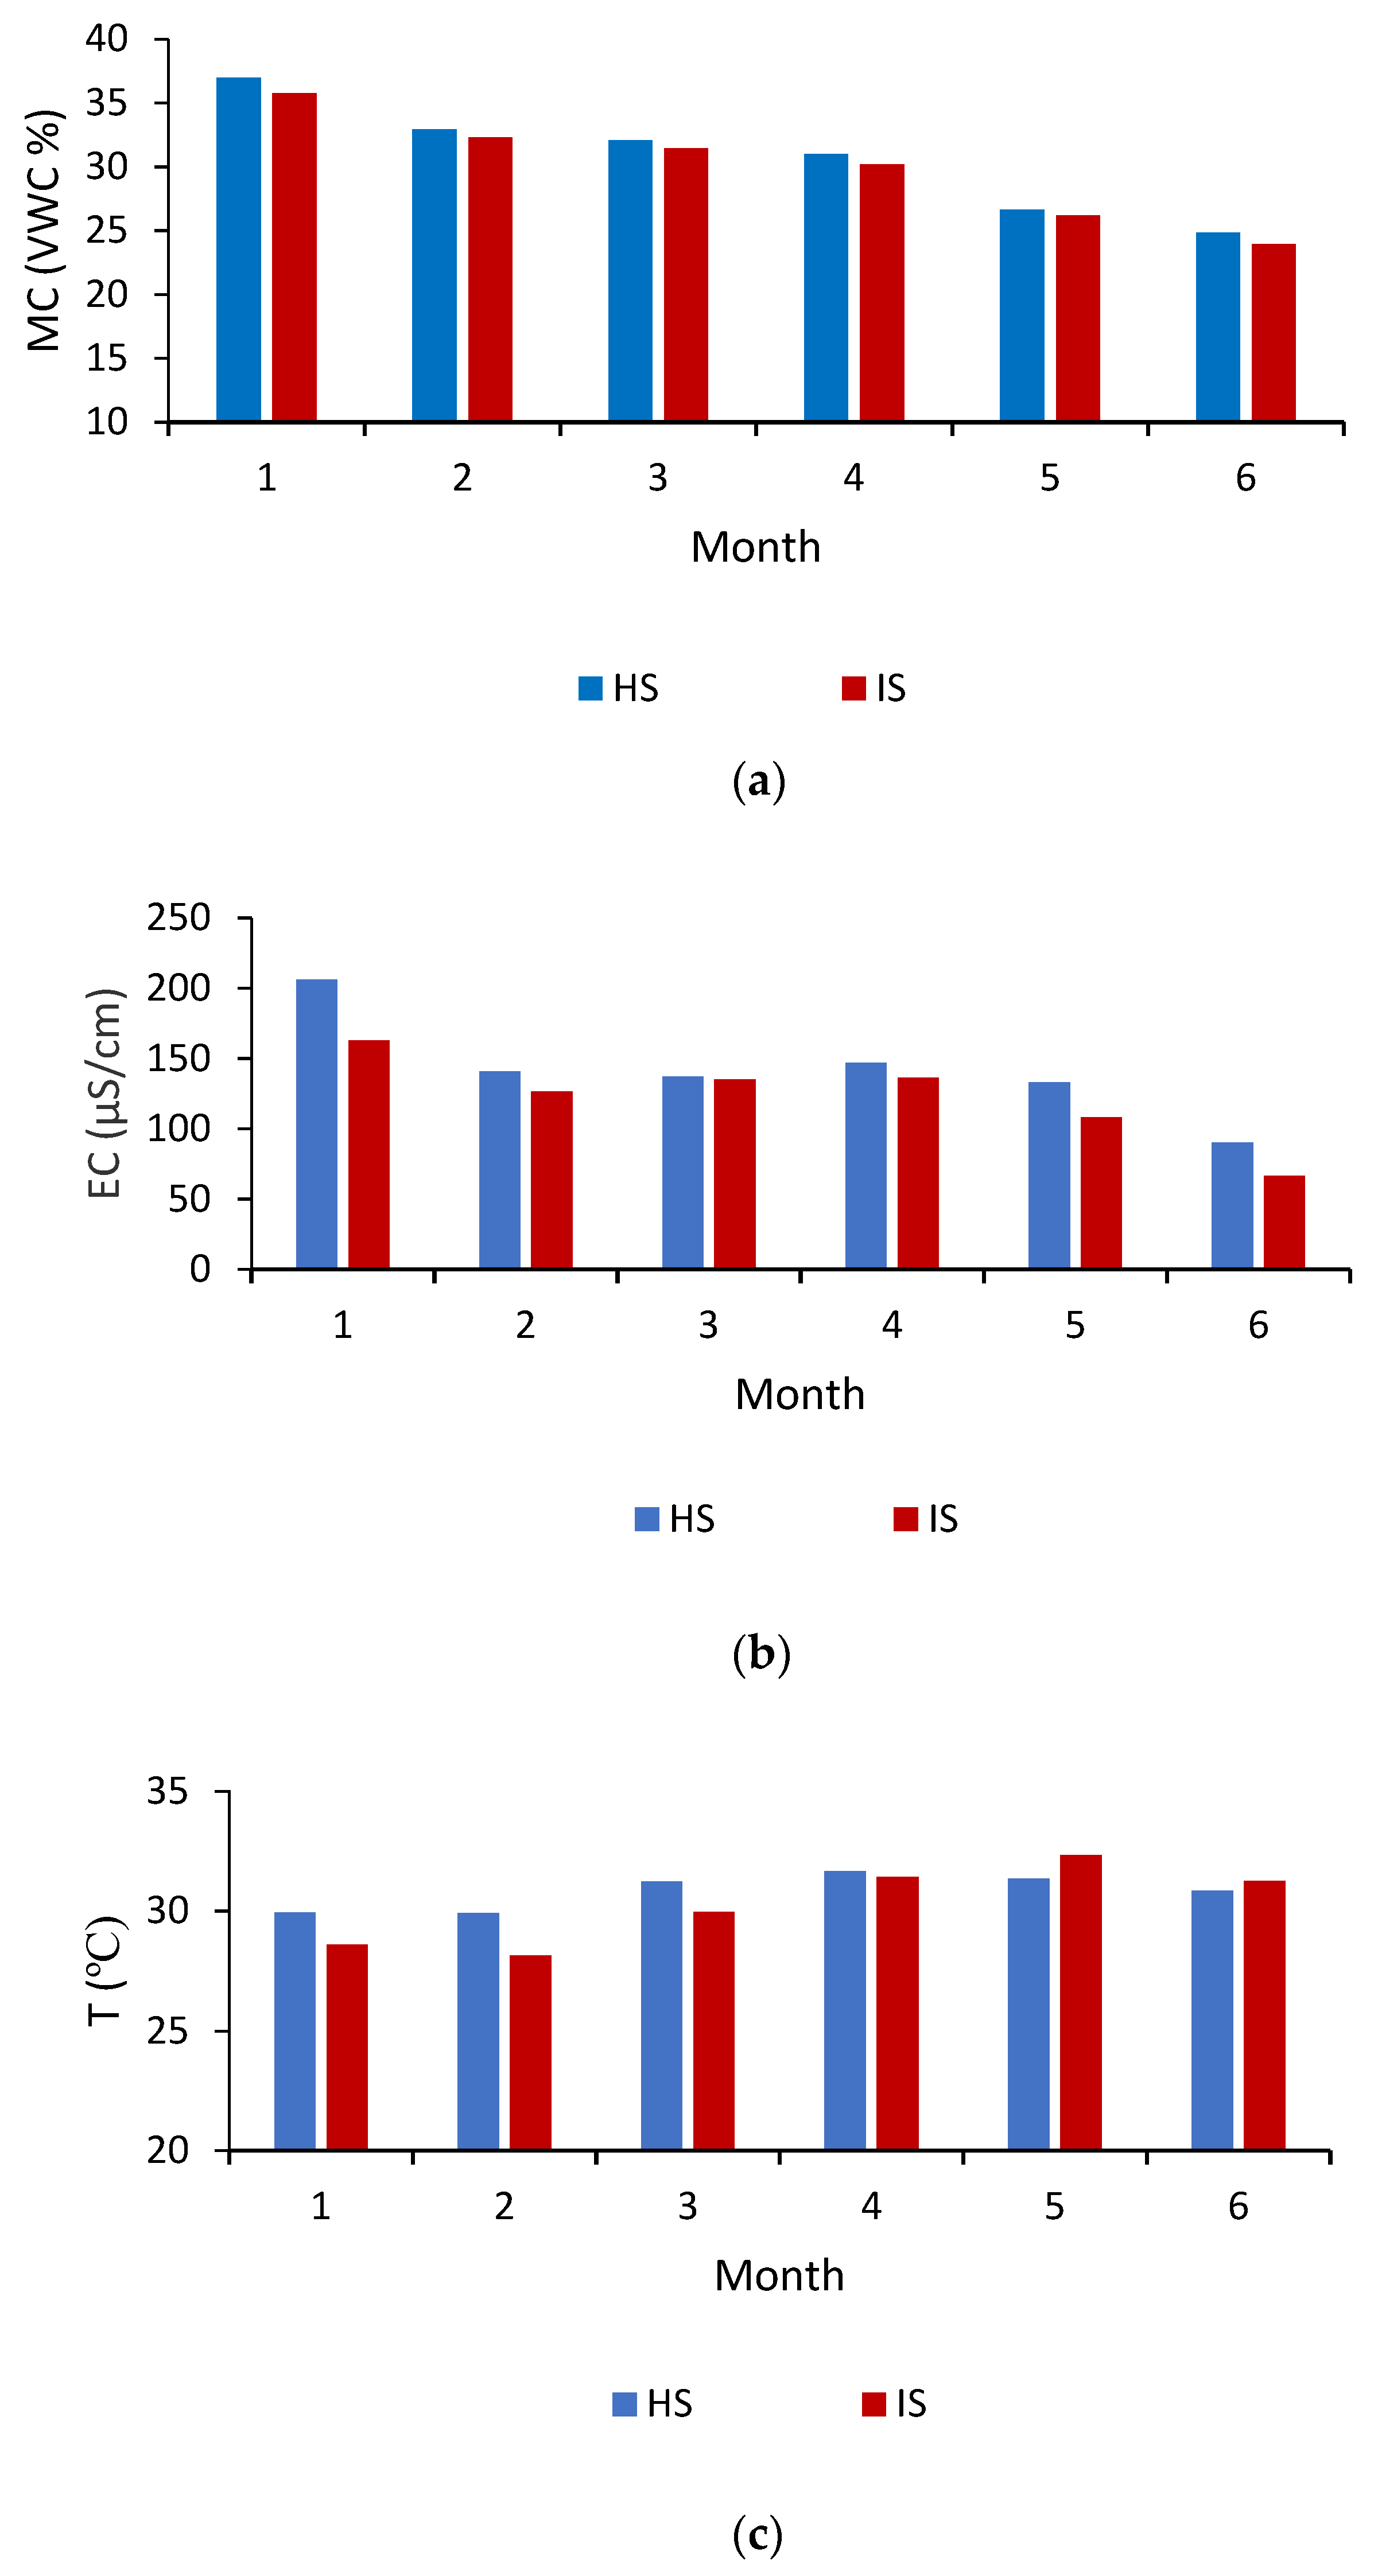
3.2. Monthly Analysis

Figure 6 illustrates the changes in the mean of soil MC, EC, and T over six months for both HS and IS. From the graph, MC and EC showed a decreasing trend over six months. However, the trend of the soil T between HS and IS was slightly different. In HS, the soil T showed an increasing trend until the fourth month and slightly decreased at the fifth and sixth month, while, for IS, the soil T showed an increasing trend until the fifth month and slightly decreased in the sixth month.
The decreasing trend in MC indicated that the amount of moisture content in the seedlings decreased as the seedlings aged. Generally, as a seedling or plant grows, the water absorption rate of the larger seedling or plant is higher due to the longer length of the roots [44] and larger root surface area [45], which causes a reduction in soil MC over the course of a month. In addition to the root surface area, the increased leaf surface area and, therefore, the increased transpiration rate also decreases the soil moisture content. In this study, the monitoring process started with 5-month-old seedlings. Therefore, an 11-month-old seedling would consume more water than a 5-month-old seedling. This condition also occurred for the soil EC. The decreased value of EC over the months could also be due to the increasing age of the seedlings. Generally, as a seedling or plant grows older, the rate of nutrient uptake is higher due to the wider spatial distribution of the roots [46] and an older root system age [47], which reduces soil EC over a month. In contrast to T, as the seedlings get older, the temperature increased over a month, except for the last two months in HS and the final month in IS. The increasing trend of soil T could be associated with a decreasing trend of soil MC over a month. Generally, as the MC in the soil decreased, the soil T increased [48]. The decreasing trend in the last two months in HS and in the final month in IS could be due to the shade effects of the canopy of the seedlings. As the seedlings age, the canopy size would become larger and cause the soil surface to be shaded by the canopy, thus resulting in a decrease in soil T. Figure 5 also shows that the MC and EC of HS were slightly higher than IS throughout the whole six months of monitoring. This result agrees with the research findings of Chang [12]. Meanwhile, the lower value of EC in IS could be due to the presence of G. boninense inoculum where generally the existence of fungus was reported as having the ability to utilise nutrients that may be available in the soil [49,50,51,52]. For soil T, the mean of HS was higher than IS only for the first four months, while in the last two months the mean of IS was higher than HS.
Table 1 shows the mean and p-value for each of the soil properties obtained using a Student’s t-test tested at a 5% significant level. Overall, average mean of MC, EC, and T in HS (MC = 30.74%; EC = 142.34 µS/cm; T = 30.82 °C) was higher than IS (MC = 29.96%; EC = 122.55 µS/cm; T = 30.28 °C). Based on the p-value in Table 1, the monthly analysis revealed that only MC and EC data had a significant difference between HS and IS. Therefore, a further analysis (weekly analysis) was undertaken to check if the weekly data could provide a better indicator in differentiating between HS and IS.

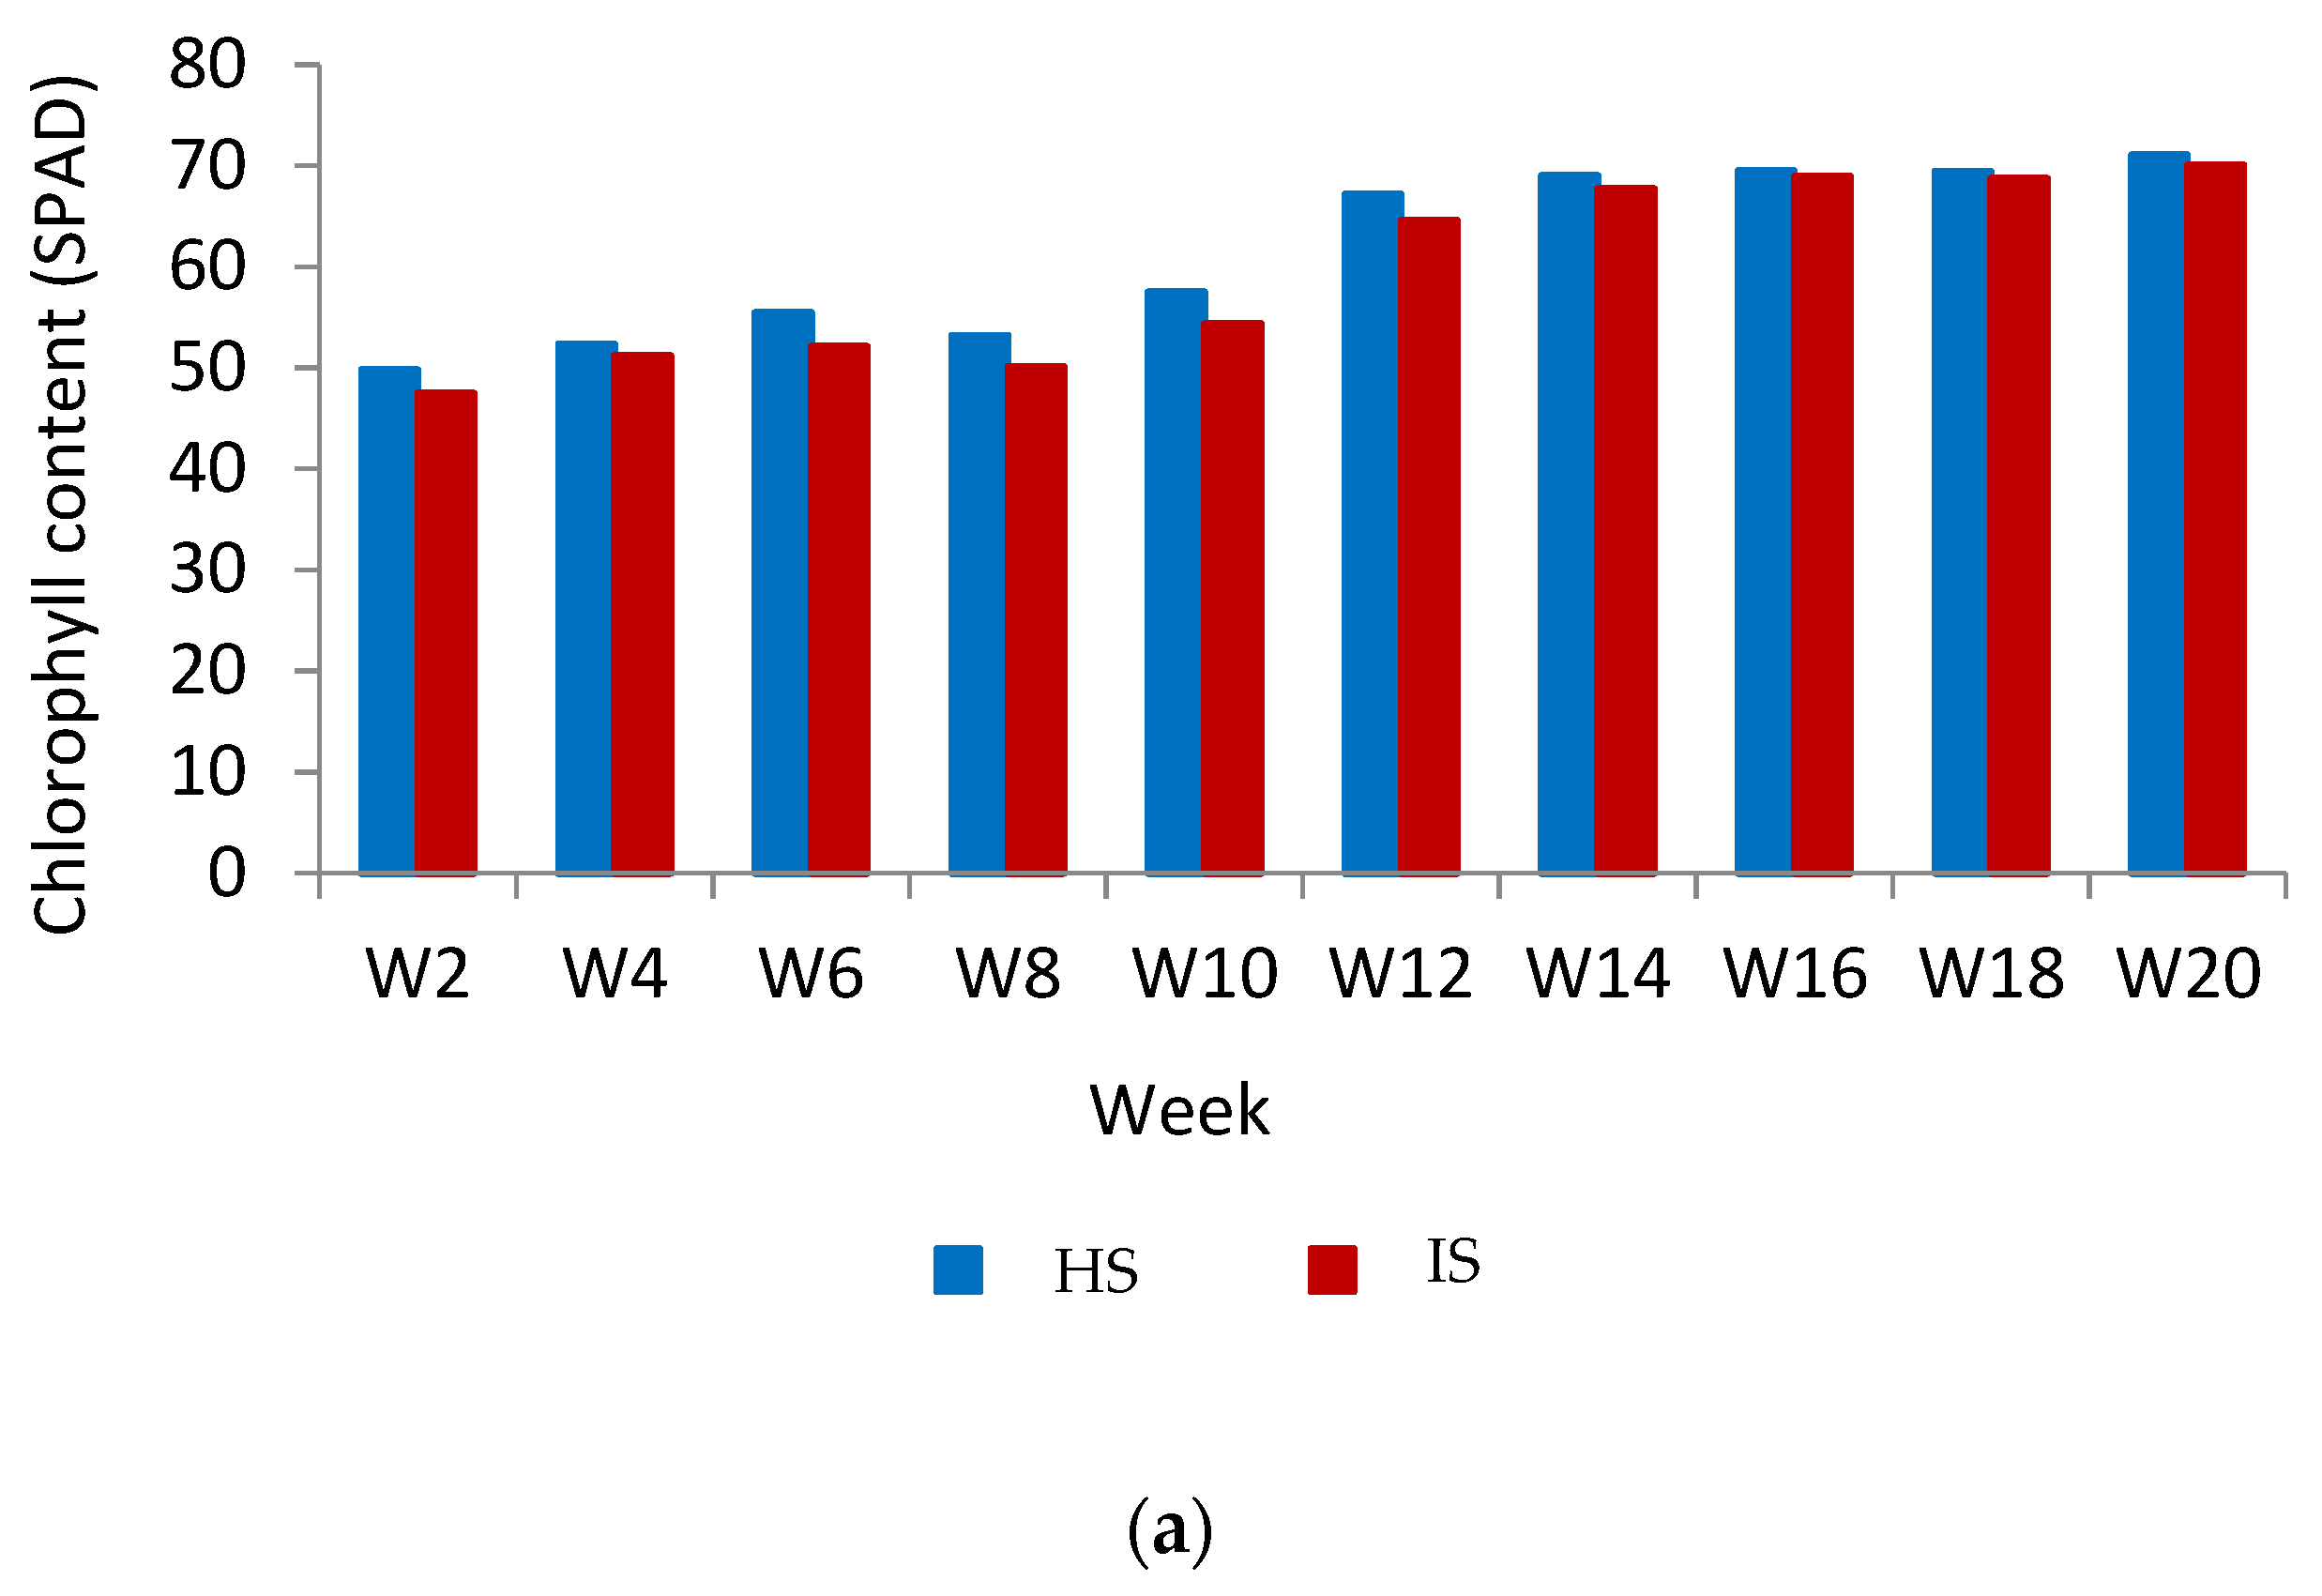
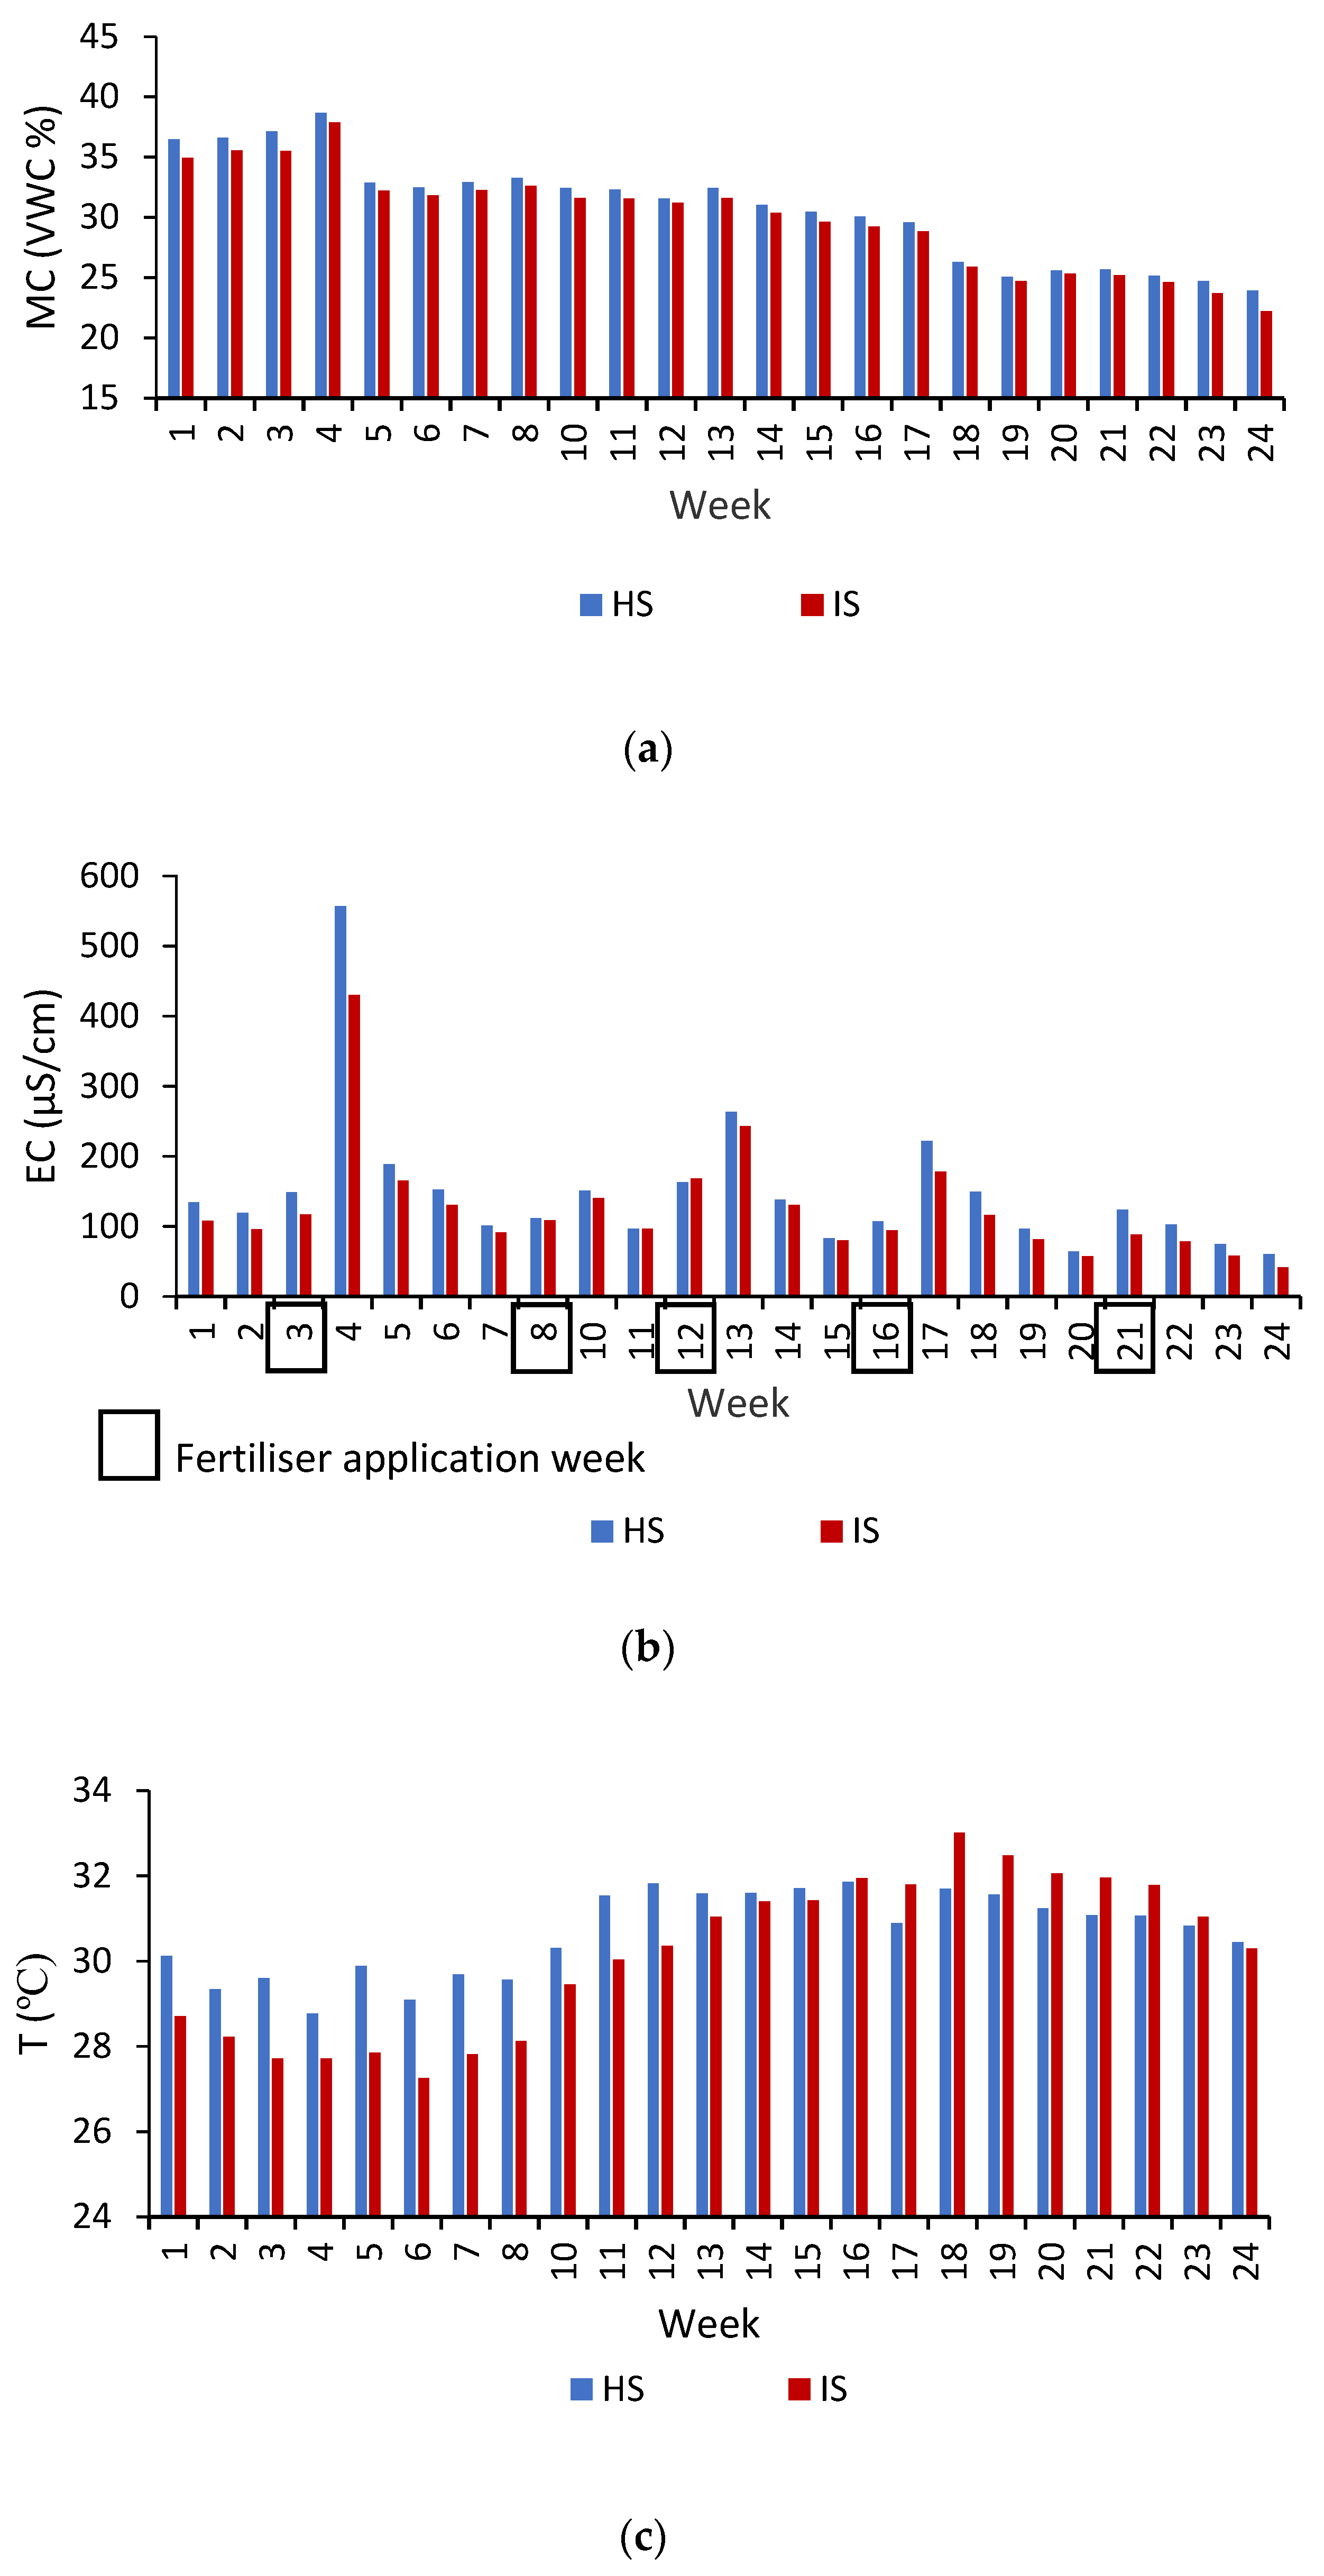
3.3. Weekly Analysis

Figure 7 shows the mean of the soil MC, EC, and T for every week. In general, MC showed a decreasing trend over 24 weeks. In this study, the data for week 9 was not available due to a technical error. Therefore, the data at week 9 was not analysed and mentioned throughout the manuscript. The mean of MC for both HS and IS was higher at the beginning of the monitoring week compared with the end of the monitoring week. The trend of the fluctuation of both HS and IS was similar for the whole 24 weeks of monitoring, where the MC showed an increasing trend from week 1 till week 4 and sharply decreased at week 5. The reason behind this sharp decrease is unknown. This could be due to the old age of the seedlings. It is also believed not to be due to the environmental conditions because the values of the environmental temperature and humidity data did not show a significant difference between weeks 4, 5, and 6. Starting from week 5 onwards, the MC gradually decreased, although there was slight upward trend particularly in weeks 7, 8, 13, 20, and 21. Overall, the MC for HS was higher than IS for the whole of the monitoring period.
In general, EC showed a decreasing trend over 24 weeks. However, the mean of the EC values fluctuated five times with the peak values occurring at weeks 4, 10, 13, 17, and 21. The increasing value of EC could be due to the fertiliser application activity completed at weeks 3, 8, 12, 16, and 21. Therefore, the mean of the EC values began to increase on and/or after the weeks in which the fertiliser was applied. An increase in the mean of the EC values was observed in HS and IS in response to the fertiliser application.
During the first 15 weeks of monitoring, the T of HS was significantly higher than IS, while for subsequent weeks, i.e., at week-16 to week-23, the mean of IS was significantly higher than HS. The trend of T for both HS and IS over the 24 weeks was almost similar. In the first 6 weeks of monitoring, the T gradually decreased until it began to rise again at week 7 and continuously increase until week 18. After week 18, the T started to decrease until it reached the temperature values of 30.44 °C and 30.29 °C for HS and IS, respectively. The environmental conditions of the study area were normal, where a high temperature and low humidity occurred during the day and a low temperature and high humidity occurred at night and in the early morning. Based on the ANOVA test, there were no significant differences in the environmental temperature across all of the weeks. Therefore, the rise of the soil temperature after week 11 might not be significantly influenced by the environmental temperature.
Table 2 shows the mean and p-value for each soil property. It is shown that the average mean of MC, EC, and T in HS (MC = 30.72%; EC = 148.18 µS/cm; T = 30.66 °C) was higher than IS (MC = 29.93%; EC = 125.99 µS/cm; T = 30.15 °C). Based on the p-value in Table 2, the weekly analysis revealed that all soil properties had a significant difference between HS and IS.

4. Conclusions

Generally, for every two weeks of measurement, the physical growth of HS in terms of chlorophyll content, frond count, girth, and height was higher than IS, while the trend of a higher soil MC and EC in HS was mostly consistent during the whole period of the monitoring, except for soil T where the IS was higher during the last third of the monthly and weekly monitoring. Soil MC and EC in both HS and IS showed decreasing trends over the months and weeks. This could because, as the age of the seedlings increased, the rate of water and nutrient uptake was higher, resulting in a decreased mean of MC and EC, respectively. In contrast, the soil T showed an increasing trend over the months and weeks. This could be associated with the decreasing trend of the soil MC where, in general, as the MC in the soil decreased, the soil T increased. Weekly analysis could provide a more detailed analysis especially concerning the effect of the fertiliser application at certain weeks. Based on the p-value, the soil MC and EC between HS and IS were significantly different in both the monthly and weekly analyses, while the soil T between HS and IS was only significantly different in the weekly analysis. In conclusion, this study provided the initial information to reveal the potential use of soil properties as an indicator of BSR occurrence. Moreover, the significant results of detection using weekly data gave promising opportunities for early detection even if there were no visual symptoms appearing on the infected plant. Although the proposed method showed promising results of detection, there is room for improvement. The current method uses three sensors per polybag and the data were collected every hour for every day. Therefore, an abundant amount of data was used, which was not economical. Thus, for the application under a controlled environment, the possibility of reducing the amount of data should be explored in the future. For an open-environment application, since there were many more uncontrolled variables, other variables that may influence the disease infection needed to be measured, such as soil pH, environmental temperature and humidity. Optimisation techniques could be used to identify significant input variables for disease detection using machine learning.

Author Contributions

Conceptualisation, M.H.A.A. and S.K.-B.; methodology, M.H.A.A. and S.K.-B.; software, M.H.A.A. and S.K.-B.; validation, S.K.-B.; formal analysis, M.H.A.A. and A.N.N.A.; investigation, M.H.A.A. and S.K.-B.; resources, S.K.-B.; data curation, M.H.A.A. and S.K.-B.; writing—original draft preparation, M.H.A.A.; writing—review and editing, S.K.-B., A.W., F.H., and N.K.; visualisation, M.H.A.A. and S.K.-B.; supervision, S.K.-B.; project administration, S.K.-B.; funding acquisition, S.K.-B. All authors have read and agreed to the published version of the manuscript.

Funding

This research was funded by the Malaysia Ministry of Higher Education (MOHE) and Universiti Putra Malaysia (UPM) under grant number LRGS-NANOMITE/5526305 and PRGS/2/2020/ICT09/UPM/02/1.

Conflicts of Interest

The authors declare no conflict of interest.

References

  1. Idris, S.; Arifin, D.; Swinburne, R.; Watt, A.A. The Identity of Ganoderma Species Responsible for BSR Disease of Oil Palm in Malaysia Morphological Characteristics; Malaysian Palm Oil Board: Kuala Lumpur, Malaysia, 2000; Volume 102, p. 77a.
  2. Chong, K.P.; Dayou, J.; Alexander, A. Pathogenic nature of Ganoderma boninense and basal stem rot disease. In Detection and Control of Ganoderma Boninense in Oil Palm Crop; Springer: Berlin/Heidelberg, Germany, 2017; pp. 5–12. [Google Scholar]
  3. Toh Choon, R.L.; Sariah, M.; Siti Mariam, M.N. Ergosterol from the soilborne fungus Ganoderma boninense. J. Basic Microbiol. 2012, 52, 608–612. [Google Scholar] [CrossRef]
  4. Sanderson, F.R. An insight into spore dispersal of Ganoderma boninense on oil palm. Mycopathologia 2005, 159, 139–141. [Google Scholar] [CrossRef]
  5. Turner, P.D. Oil Palm Diseases and Disorder; The Incorporated Society of Planters: Kuala Lumpur, Malaysia, 1981. [Google Scholar]
  6. Rees, R.W.; Flood, J.; Hasan, Y.; Potter, U.; Cooper, R.M. Basal stem rot of oil palm (Elaeis guineensis); mode of root infection and lower stem invasion by Ganoderma boninense. Plant Pathol. 2009, 58, 982–989. [Google Scholar] [CrossRef]
  7. Alexander, A.; Sipaut, C.S.; Dayou, J.; Chong, K.P. Oil palm roots colonisation by Ganoderma boninense: An insight study using scanning electron microscopy. J. Oil Palm Res. 2017, 29, 262–266. [Google Scholar] [CrossRef] [Green Version]
  8. Ahmadi, P.; Muharam, F.M.; Ahmad, K.; Mansor, S.; Abu Seman, I. Early detection of Ganoderma basal stem rot of oil palms using artificial neural network spectral analysis. Plant Dis. 2017, 101, 1009–1016. [Google Scholar] [CrossRef] [PubMed] [Green Version]
  9. Eastburn, D.M.; Butler, E.E. Effects of soil moisture and temperature on the saprophytic ability of Trichoderma harzianum. Mycologia 1991, 83, 257–263. [Google Scholar] [CrossRef]
  10. Garrett, S.D. Soil conditions and the root-infecting fungi. Biol. Rev. 1938, 13, 159–184. [Google Scholar] [CrossRef]
  11. Gill, J.S.; Sivasithamparam, K.; Smettem, K.R.J. Effect of soil moisture at different temperatures on Rhizoctonia root rot of wheat seedlings. Plant Soil 2001, 231, 91–96. [Google Scholar] [CrossRef]
  12. Chang, T. Effect of soil moisture content on the survival of Ganoderma species and other wood-inhabiting fungi. Plant Dis. 2003, 87, 1201–1204. [Google Scholar] [CrossRef] [PubMed] [Green Version]
  13. Yadav, J.; Verma, J.P.; Yadav, S.K.; Tiwari, K.N. Effect of salt concentration and pH on soil inhabiting fungus Penicillium citrinum Thom. for solubilization of tricalcium phosphate. Microbiol. J. 2011, 1, 25–32. [Google Scholar] [CrossRef]
  14. Rashid, M.I.; Mujawar, L.H.; Shahzad, T.; Almeelbi, T.; Ismail, I.M.; Oves, M. Bacteria and fungi can contribute to nutrients bioavailability and aggregate formation in degraded soils. Microbiol. Res. 2016, 183, 26–41. [Google Scholar] [CrossRef] [PubMed]
  15. Nawawi, A.; Ho, Y.W. Effect of temperature and pH on growth pattern of Ganoderma boninense from oil palm in Peninsular Malaysia. Pertanika 1990, 13, 303–307. [Google Scholar]
  16. Saremi, H.; Burgess, L.W. Effect of soil temperature on distribution and population dynamics of Fusarium species. J. Agric. Sci. Technol. 2000, 2, 119–125. [Google Scholar]
  17. Rees, R.W.; Flood, J.; Hasan, Y.; Cooper, R.M. Effects of inoculum potential, shading and soil temperature on root infection of oil palm seedlings by the basal stem rot pathogen Ganoderma boninense. Plant Pathol. 2007, 56, 862–870. [Google Scholar] [CrossRef]
  18. Liddell, C.M. Measurement and Control of Soil Temperature and Water Potential. In Methods for Research on Soilborne Phytopathogenic Fungi; Singleton, L.L., Mihail, S.D., Ruch, C.M., Eds.; The American Phytopathological Society: St. Paul, Minnesota, 1992; pp. 187–203. [Google Scholar]
  19. Gurmit, S. Ganoderma-the scourge of oil palm in the coastal area. In Proceedings of the Ganoderma Workshop, Bangi, Selangor, Malaysia; Palm Oil Research Institute of Malaysia: Kuala Lumpur, Malaysia, 1990; pp. 7–35. [Google Scholar]
  20. Rhoades, J.D. Salinity: Electrical conductivity and total dissolved solids. Methods Soil Anal. Part 3 Chem. Methods 1996, 5, 417–435. [Google Scholar]
  21. Shahid, S.A.; Zaman, M.; Heng, L. Introduction to soil salinity, sodicity and diagnostics techniques. In Guideline for Salinity Assessment, Mitigation and Adaptation Using Nuclear and Related Techniques; Springer: Cham, Switzerland, 2018; pp. 1–42. [Google Scholar]
  22. Corwin, D.L.; Yemoto, K. Salinity: Electrical conductivity and total dissolved solids. Soil Sci. Soc. Am. J. 2000, 84, 1442–1461. [Google Scholar] [CrossRef]
  23. Goh, Y.K.; Choon, K.L.; Cheng, C.R.; Tan, S.Y.; Cheah, L.W.; Ah Tung, P.G.; Goh, K.J. Effects of chemical properties of different soils on ganoderma disease in oil palm (Elaeis guineensis). Oil Palm Bull. 2017, 75, 17–26. [Google Scholar]
  24. Bivi, M.S.H.R.; Paiko, A.S.; Khairulmazmi, A.; Akhtar, M.S.; Idris, A.S. Control of basal stem rot disease in oil palm by supplementation of calcium, copper, and salicylic acid. Plant Pathol. J. 2016, 32, 396. [Google Scholar] [CrossRef] [Green Version]
  25. Baharuddin, M.F.T.; Masirin, M.I.M.; Hazreek, Z.A.M.; Azman, M.A.A.; Madun, A. Resistivity-Chemistry Integrated Approaches for Investigating Groundwater Salinity of Water Supply and Agricultural Activity at Island Coastal Area. J. Phys. Conf. Ser. 2018, 995, 012093. [Google Scholar] [CrossRef]
  26. Ariffin, D.; Idris, A.S.; Singh, G. Status of Ganoderma in oil palm. In Ganoderma Diseases of Perennial Crops; Flood, J., Bridge, P.D., Holderness, M., Eds.; CABI Publishing: Wallingford, UK, 2000. [Google Scholar]
  27. Singh, G. Ganoderma-the scourge of oil palms in the coastal areas. Planter 1991, 67, 421–444. [Google Scholar]
  28. Naher, L.; Yusuf, U.K.; Ismail, A.; Tan, S.G.; Mondal, M.M.A. Ecological status of Ganoderma and basal stem rot disease of oil palms (Elaeis guineensis Jacq.). Aust. J. Crop Sci. 2013, 7, 1723–1727. [Google Scholar]
  29. Kubisch, P.; Leuschner, C.; Coners, H.; Gruber, A.; Hertel, D. Fine root abundance and dynamics of stone pine (Pinus cembra) at the alpine treeline is not impaired by self-shading. Front. Plant Sci. 2017, 8, 602. [Google Scholar] [CrossRef] [PubMed] [Green Version]
  30. Bote, A.D.; Struik, P.C. Effects of shade on growth, production and quality of coffee (Coffea arabica) in Ethiopia. J. Hortic. For. 2011, 3, 336–341. [Google Scholar]
  31. Alexander, A.; Dayou, J.; Abdullah, S.; Phin, C.K. Differential Expression and Profile of Oil Palm Root-sterols Composition Related to Ganoderma boninense Infection. ASM Sci. J. 2019, 12, 40–47. [Google Scholar]
  32. As’wad, A.M.; Sariah, M.; Paterson, R.R.M.; Abidin, M.Z.; Lima, N. Ergosterol analyses of oil palm seedlings and plants infected with Ganoderma. Crop Prot. 2011, 30, 1438–1442. [Google Scholar] [CrossRef] [Green Version]
  33. Idris, A.S.; Kushairi, D.; Ariffin, D.; Basri, M.W. Technique for inoculation of oil palm germinated seeds with Ganoderma. MPOB Inf. Ser. 2006, 314, 1–4. [Google Scholar]
  34. Breton, F.; Hasan, Y.; Lubis, Z.; De Franqueville, H. Characterization of parameters for the development of an early screening test for basal stem rot tolerance in oil palm progenies. J. Oil Palm Res. 2006, 24–36. Available online: http://palmoilis.mpob.gov.my/publications/jopr2006sp-ms24.pdf (accessed on 31 October 2021).
  35. Santoso, H.; Gunawan, T.; Jatmiko, R.H.; Darmosarkoro, W.; Minasny, B. Mapping and identifying basal stem rot disease in oil palms in North Sumatra with QuickBird imagery. Precis. Agric. 2011, 12, 233–248. [Google Scholar] [CrossRef]
  36. Utomo, C.; Niepold, F. The development of diagnostic tools of Ganoderma in oil palm. Phytopathology 2000, 148, 507–514. [Google Scholar] [CrossRef]
  37. Naidu, Y.; Siddiqui, Y.; Rafii, M.Y.; Saud, H.M.; Idris, A.S. Inoculation of oil palm seedlings in Malaysia with white-rot hymenomycetes: Assessment of pathogenicity and vegetative growth. Crop Prot. 2018, 110, 146–154. [Google Scholar] [CrossRef]
  38. Rakib, M.R.M.; Borhan, A.H.; Jawahir, A.N. The relationship between SPAD chlorophyll and disease severity index in Ganoderma-infected oil palm seedlings. J. Bangladesh Agric. Univ. 2019, 17, 355–358. [Google Scholar] [CrossRef] [Green Version]
  39. Intara, Y.I.; Nusantara, A.D.; Supanjani, S.; Caniago, Z.; Ekawita, R. Oil palm roots architecture in response to soil humidity. Int. J. Oil Palm 2018, 1, 79–89. [Google Scholar]
  40. Goh, K.M.; Dickinson, M.; Alderson, P.; Yap, L.V.; Supramaniam, C.V. Development of an in planta infection system for the early detection of Ganoderma spp. in oil palm. J. Plant Pathol. 2016, 98, 255–264. [Google Scholar]
  41. Sapak, Z.; Meon, S.; Ahmad, Z.A.M. Effect of endophytic bacteria on growth and suppression of Ganoderma infection in oil palm. Int. J. Agric. Biol. 2008, 10, 127–132. [Google Scholar]
  42. Govender, N.T.; Mahmood, M.; Seman, I.A.; Wong, M.Y. The phenylpropanoid pathway and lignin in defense against ganoderma boninense colonized root tissues in oil palm (Elaeis guineensis Jacq.). Front. Plant Sci. 2017, 8, 1395. [Google Scholar] [CrossRef] [Green Version]
  43. Uchida, R. Essential nutrients for plant growth: Nutrient functions and deficiency symptoms. Plant Nutr. Manag. Hawaiis Soils 2000, 4, 31–55. [Google Scholar]
  44. Vetterlein, D.; Doussan, C. Root age distribution: How does it matter in plant processes? A focus on water uptake. Plant Soil 2016, 407, 145–160. [Google Scholar] [CrossRef]
  45. Tachibana, Y.; Ohta, Y. Root surface area, as a parameter in relation to water and nutrient uptake by cucumber plant. Soil Sci. Plant Nutr. 1983, 29, 387–392. [Google Scholar] [CrossRef]
  46. Bouillet, J.P.; Laclau, J.P.; Arnaud, M.; M’Bou, A.T.; Saint-André, L.; Jourdan, C. Changes with age in the spatial distribution of roots of Eucalyptus clone in Congo: Impact on water and nutrient uptake. For. Ecol. Manag. 2002, 171, 43–57. [Google Scholar] [CrossRef]
  47. Gao, S.; Pan, W.L.; Koenig, R.T. Integrated root system age in relation to plant nutrient uptake activity. Agron. J. 1998, 90, 505–510. [Google Scholar] [CrossRef]
  48. Lakshmi, V.; Jackson, T.J.; Zehrfuhs, D. Soil moisture–temperature relationships: Results from two field experiments. Hydrol. Process. 2003, 17, 3041–3057. [Google Scholar] [CrossRef]
  49. Talley, P.J.; Blank, L.M. Some factors influencing the utilization of inorganic nitrogen by the root rot fungus. Plant Physiol. 1942, 17, 52. [Google Scholar] [CrossRef] [PubMed] [Green Version]
  50. Nicholas, D.J.D. Utilization of inorganic nitrogen compounds and amino acids by fungi. Fungi 1965, 1, 349–376. [Google Scholar]
  51. Lussenhop, J. Mechanisms of microarthropod-microbial interactions in soil. Adv. Ecol. Res. 1992, 23, 1–33. [Google Scholar]
  52. Larsen, J.; Jaramillo-López, P.; Nájera-Rincon, M.; González-Esquivel, C.E. Biotic interactions in the rhizosphere in relation to plant and soil nutrient dynamics. J. Soil Sci. Plant Nutr. 2015, 15, 449–463. [Google Scholar] [CrossRef] [Green Version]
Figure 1. Sitting technique: positioning the seedling on the Ganoderma rubber wood block (GRWB)/Rubber wood block (RWB) during transplantation into a polybag.
Agronomy 11 02279 g001
Figure 2. Position of drippers and MEC10 sensors.
Agronomy 11 02279 g002
Figure 3. MEC10 probe sensors buried 8 cm deep in the soil.
Agronomy 11 02279 g003
Figure 4. Sample of infected seedlings: (a) physical condition, (b) brown discoloration at the bole of the seedlings, (c) PCR amplification using specific primer of G. boninense.
Agronomy 11 02279 g004
Figure 5. Comparison of (a) chlorophyll content, (b) frond count, (c) girth, and (d) height between healthy seedlings (HS) and infected seedlings (IS) for every two weeks of monitoring.
Agronomy 11 02279 g005aAgronomy 11 02279 g005b
Figure 6. Mean of soil (a) moisture content (MC), (b) electrical conductivity (EC), and (c) temperature (T) of healthy seedlings (HS) and infected seedlings (IS) over six months.
Agronomy 11 02279 g006
Figure 7. Mean of soil (a) moisture content (MC), (b) electrical conductivity (EC) and (c) temperature (T) of healthy seedlings (HS) and infected seedlings (IS) over 24 weeks.
Agronomy 11 02279 g007
Table 1. Mean and p-value of monthly analysis.
ParameterConditionMeanp-Value
MCHS30.740.0010 *
IS29.96
ECHS142.340.0195 *
IS122.55
THS30.820.2884
IS30.28
* Significant at 0.05.
Table 2. Mean and p-value of weekly analysis.
ParameterConditionMeanp-Value
MCHS30.72<0.0001 *
IS29.93
ECHS148.180.0004 *
IS125.99
THS30.660.0338 *
IS30.15
* Significant at 0.05.
Publisher’s Note: MDPI stays neutral with regard to jurisdictional claims in published maps and institutional affiliations.

