Article

Effects of Multifunctional Margins Implementation on Biodiversity in Annual Crops

by
Manuel Moreno-García
1,*,
Miguel Ángel Repullo-Ruibérriz de Torres
1,
Rosa Carbonell-Bojollo
1,
Javier López-Tirado
2,
Luis Óscar Aguado-Martín
3,
Antonio Rodríguez-Lizana
4 and
Rafaela Ordóñez-Fernández
1
1
Area of Agriculture and Environment, IFAPA, Centre Alameda del Obispo, Avd. Menéndez Pidal s/n, 14080 Córdoba, Spain
2
Department of Botany, Ecology and Plant Physiology, Campus of Rabanales, Celestino Mutis Building (C4), 14071 Córdoba, Spain
3
Andrena Iniciativas y Estudios, Calle Gabilondo, 16, 47007 Valladolid, Spain
4
Department of Aerospace Engineering and Fluid Mechanics, Area of Agroforestry Engineering, University of Seville, Ctra. de Utrera, km. 1, 41013 Seville, Spain
*
Author to whom correspondence should be addressed.
Agronomy 2021, 11(11), 2171; https://doi.org/10.3390/agronomy11112171
Submission received: 1 September 2021 / Revised: 17 October 2021 / Accepted: 26 October 2021 / Published: 28 October 2021

Abstract

:
The most suitable land for agricultural use has been gradually occupied by crops around the world. Large, uninterrupted croplands have been created, while disproportionate amounts of fertilizers, insecticides, fungicides and herbicides are applied on them. As a result, agricultural activity has a negative impact on biodiversity the ecological intensification of cultivated lands has become necessary. Multifunctional Margins (MFM), the establishment of native flora margins adjacent to croplands, provide a semi-natural habitat for food and wildlife refuge. Three different species mixtures sown in MFM were studied in this paper. The large capacity of six species used in MFM (Borago officinalis, Glebionis coronaria, Coriandrum sativum, Sinapis alba, Trifolium resupinatum and Vicia sativa) was determined. Reductions of up to 65% in the appearance of weeds and increases of 36% in pollinator biodiversity in sown MFM with respect to the MFM of spontaneous flora were observed. The biodiversity of the epigeal fauna increased by 15% in the MFM of spontaneous flora and by 32% in sown MFM, with respect to annual crops.

1. Introduction

Humans have transformed the natural environment from the Neolithic to the present day. The changes have had an impact on the primeval biodiversity of large areas of the planet [1,2]. Because human beings have transformed these areas into croplands to feed their growing population, the earth has lost much of its natural vegetation [3]. In fact, intensive agriculture is considered to be the most important source of pressure on the planet’s biodiversity [4]. This process not only causes deforestation, but is also a source of erosion and impoverishment of soils [5].
Therefore, agricultural activity has a direct impact on biodiversity, reducing the habitat of numerous species [3]. This circumstance, together with other human practices, creates a fragmentation of territory and consequently a degradation of the environment [6]. In the specific case of biodiversity in cropping areas, this degradation affects both the edaphic profile of croplands [5] and the ecosystems and habitats of which they are a part (steppes, wetlands, meadows, etc.) [7]. This degradation process of the environment is associated with practices such as the elimination of weed flora, the application of herbicides and pesticides, intensive tillage, the burning of stubble, the implantation of monocultures, etc., a fact that has been verified especially in recent decades [8]. Large, uninterrupted croplands have been created, while disproportionate amounts of fertilizers, insecticides, fungicides and herbicides are applied [9]. As a result, it has become necessary to increase the use of inputs, to counteract the loss of ecosystem services provided by biodiversity [10], reducing economic sustainability for the farmer.
The necessary search for the sustainability of the rural world requires a step from agricultural intensification to ecological intensification [11]. This means reducing the use of agricultural inputs and increasing biodiversity in the fields, helping to make farms sustainable [12,13]. Ecological intensification requires that agriculture revert to nature, with which it has formed a symbiotic relationship over the course of human history, and which had declined in recent decades. In addition, it will have a positive impact on the ecosystems’ properties, including crop areas such as steppes, wetlands and meadows [14].
Ecological intensification in cultivated land promotes the use of tools that increase biodiversity. One ecological intensification measure consists of the establishment of native flora margins, called Multifunctional Margins (MFM), adjacent to cultivation lands [15]. Their main function is to create vegetation strips between cultivated plots in order to counteract the transformative power of human beings [16]. MFM provide semi-natural habitats for feeding, shelter, pollinators and nesting for small animals and birds [17], in addition to facilitating the connection between natural areas, creating authentic ecological corridors [18]. Furthermore, MFM represent buffers that help prevent soil erosion and the transfer of agricultural pollutants from cultivated areas to natural areas, particularly aquatic habitats [19].
MFM can be established can be by allowing adventitious vegetation to grow, or by using sown species, in the attempt to increase scarce seed banks in growing areas. Often, only seeds that have survived years of tillage and herbicide treatments remain in the soil [20] and they tend to pose a high risk of infestation to crops [21]. The implantation of seeded MFM establishes a competition for resources with unwanted adventitious species, limiting their presence and benefiting the crop [15].
The mixtures of species that are sown in MFM must have three qualities: they must not compete with the crop; they must be easily implanted; they must and possess heterogeneous characteristics, such as different flower colors, flower types, etc. [22]. They are usually implanted when seeking an increase in pollinator biodiversity, which is why species rich in nectar and pollen are used [23]. Therefore, it is important to carry out sowing of heterogeneous mixtures made up of species from different families, especially Brassicaceae, Fabaceae, Boraginaceae, Apiaceae and Asteraceae [22,24].
A complex food web, with abundant elements and interrelations among them, endows croplands with a multitude of properties related to nutrient recycling and fertility [25]. One of the groups most used to assess the health of a food web in MFM are arthropods [26,27,28,29,30] because of their function as decomposers of organic matter, pollination and pest control [31]. These benefits for the ecosystem structure have a positive impact on both invertebrates and vertebrates.
Pollination is another vitally important ecosystem service, especially in entomophilous crops [32]. This process is mainly carried out by insects, generally Hymenoptera Coleoptera, Diptera and Lepidoptera [24]. Recently, significant decreases in pollinator populations have been reported, while cropland surfaces that need these pollinators are increasing [33]. Furthermore, farmers usually possess little knowledge about the control and management of pollination [34].
In order to provide more information about MFM, different objectives were pursued in the present study: (I) to detect the species with the easiest implantation in MFM and (II) the potential reduction of weeds in MFM. Additionally, two ecosystem functions of MFM were studied: the maintenance of the soil trophic chain (III) [25] and the contribution to pollination (IV) [35].

2. Materials and Methods
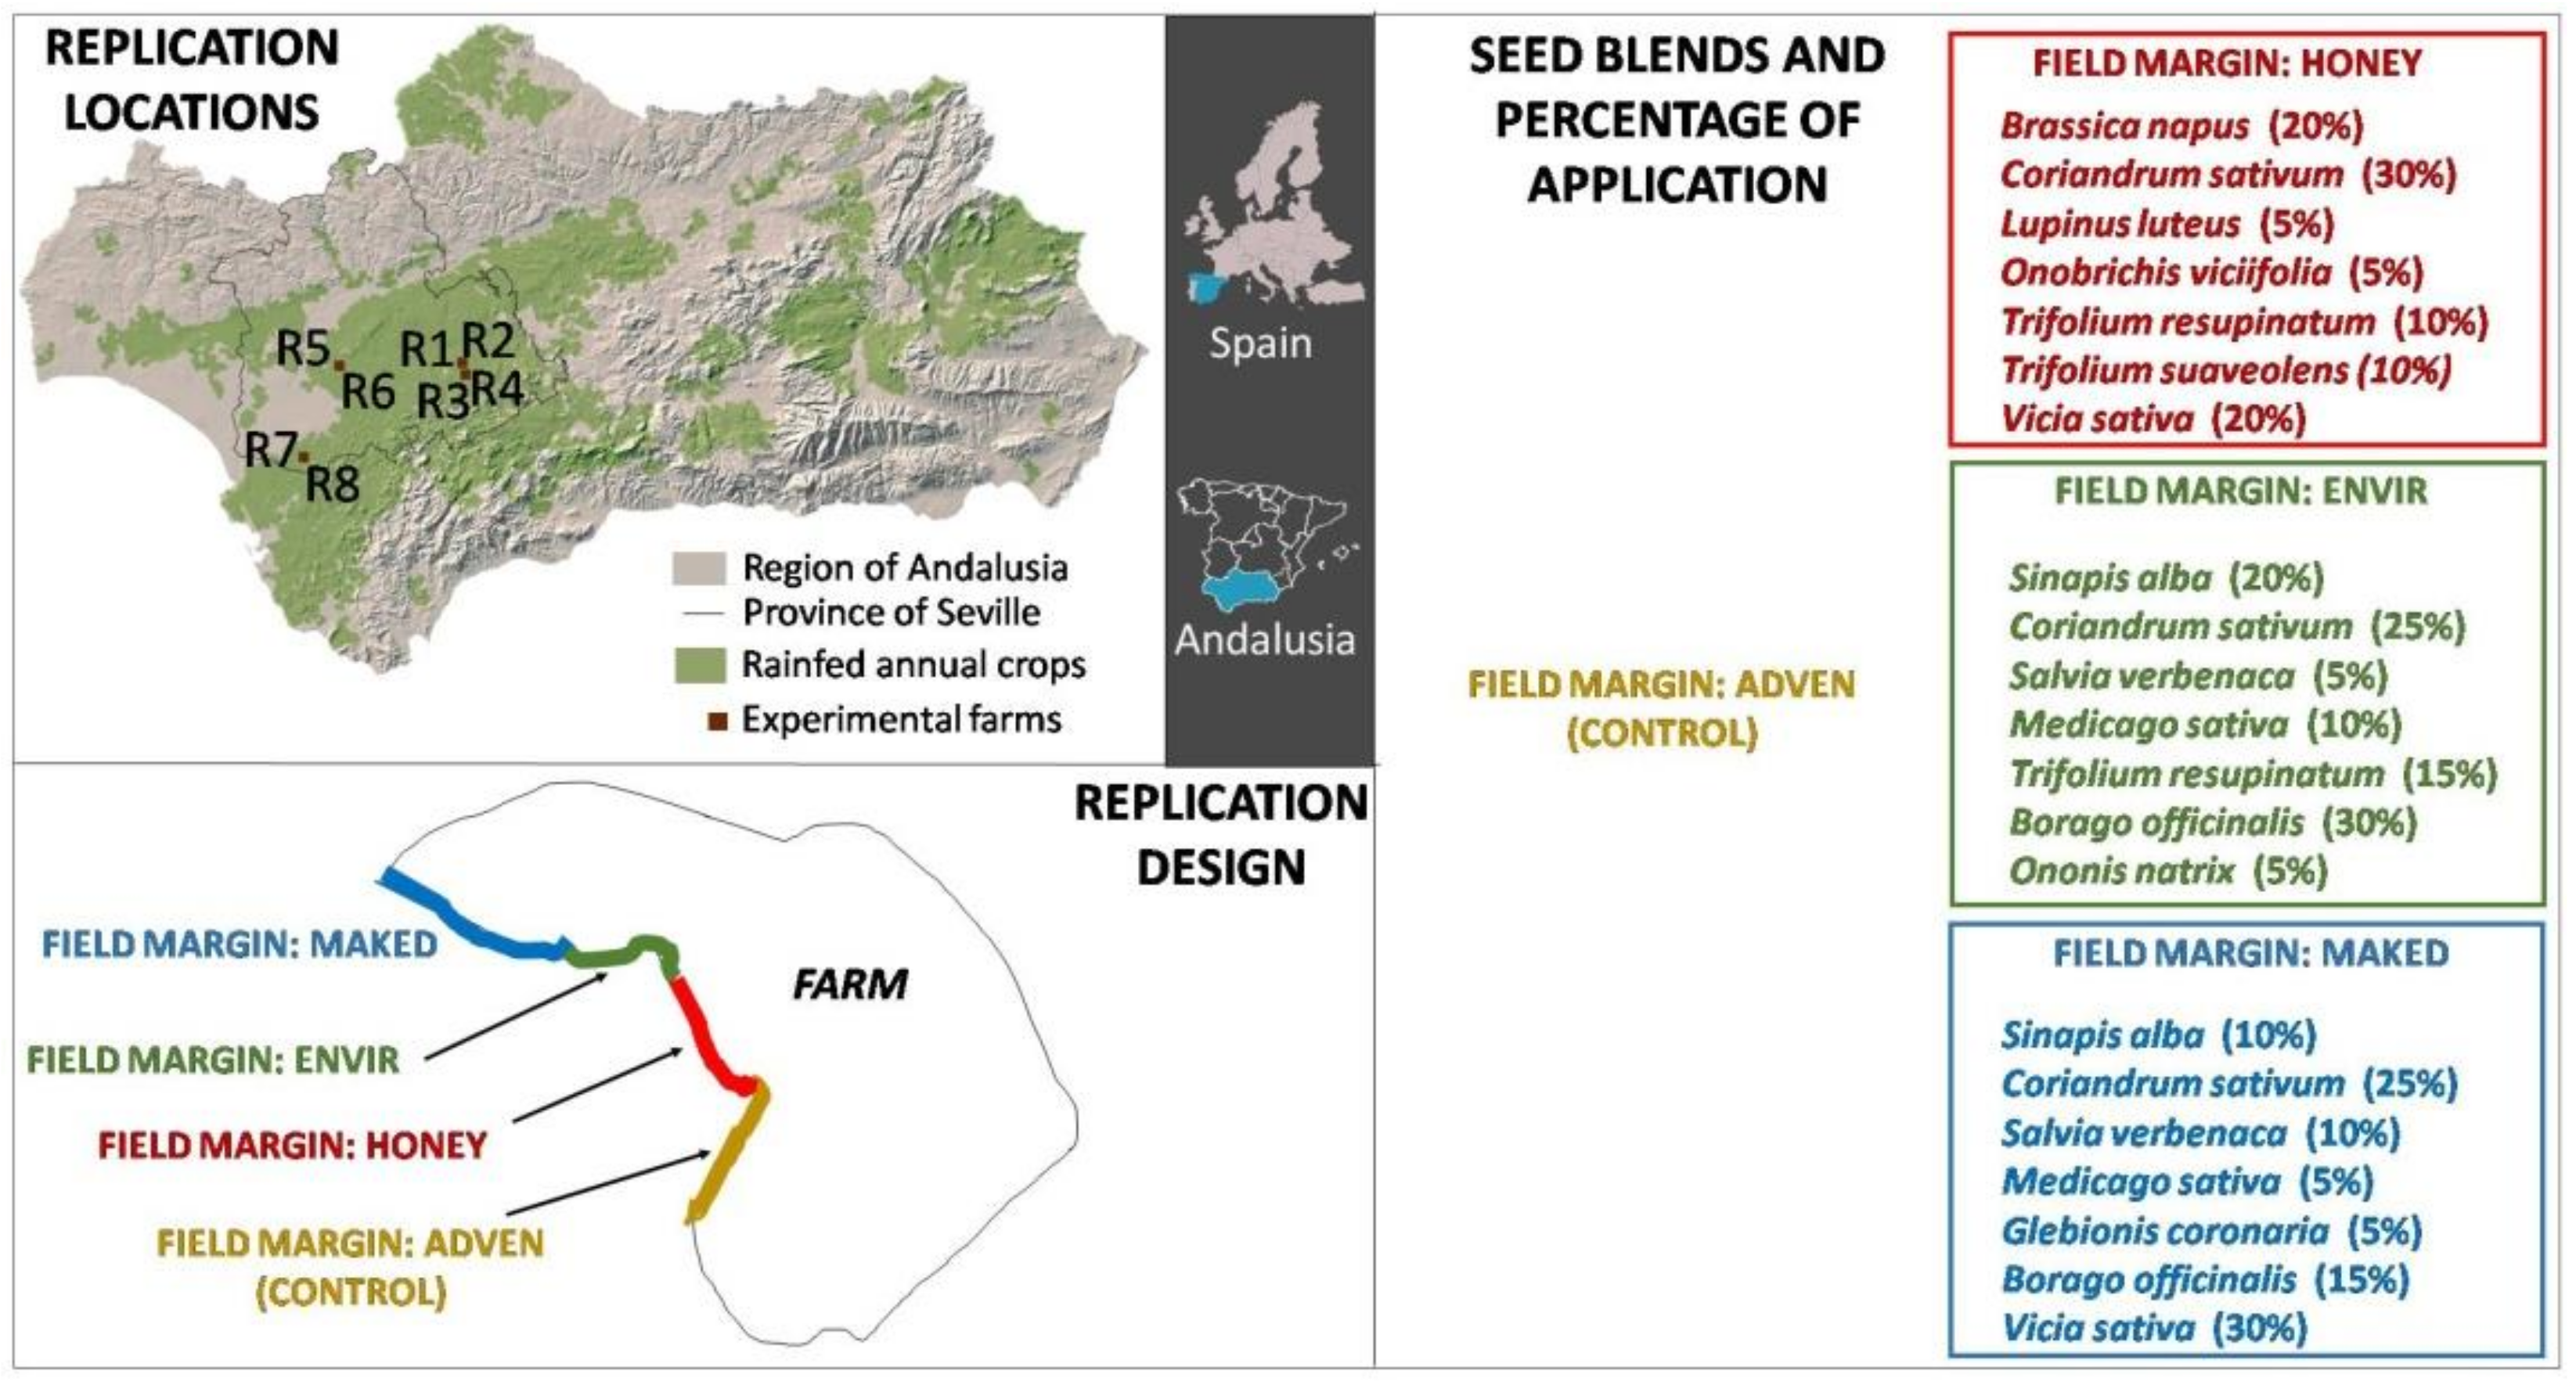
2.1. Study Area

During the 2018–2019 growing season, a study was carried out in eight locations (replicates) in the Seville countryside, in the region of Andalusia (Southern Spain) (Figure 1). The Sevillian countryside is characterized by the predominance of clay and loamy materials. It features a very soft relief, in which wide, flat areas and undulating hills are mixed. The altitude ranges from 0 to 400 m above sea level, although in most of the territory, it does not exceed 200 m. The farms are located in the countryside, with a Mediterranean climate. However, the two most eastern farms are located in the continental climate zone, while the two farms on the west feature a greater oceanic influence.
On the farms, different crops of the cereal-sunflower-legume, a typical sequence in the area, were implanted. Lantejuela (LA; R1 and R2) was sown with wheat (Triticum aestivum L.), Arenosos (AR; R3 and R4) with pea (Pisum sativum L.) and both Cortijo Maestre (CM; R5 and R6) and Barros (BA; R7 and R8) with sunflower (Helianthus annuus L.). On each experimental farm, in 2018, three types of MFM were sown with different compositions of herbaceous species, at a sowing rate of 20 kg ha−1. In addition, a control margin was monitored, in which species of spontaneous flora were allowed to grow.
An implantation evaluation of MFM revealed that vegetal species contain more potential if used in margins. In order to discover the most effective MFM mixture for a single location in Andalusia, a distribution model at regional scale for six species was designed, with better implantation results.

2.2. Experimental Design

The experiment included eight replications of the experimental model (Figure 1). Within each replication, four plots 50 m in length and 6 m wide were designed, in which the four types of MFM were randomly implanted. Three types of MFM were seeded (HONEY, ENVIR and MAKED) and in another (ADVEN), the spontaneous flora was allowed to grow, serving as a control.
The composition of seeds that was used for the MFM implementation aims at collecting different variants currently existing in national and regional legislation, in order to be able to determine their suitability under real growing conditions. Specifically, for the HONEY margin, seed mixtures that are compatible with the definition of Melliferous Fallows (a list of species rich in pollen and nectar admitted at the national level under Annex VIII of Royal Decree 1075/2014, 19 December) were used. In the ENVIR margin, the species collected in Operation 10.1.4 (Sustainable systems of herbaceous rainfed crops), included in the Rural Development Program of Andalusia 2014–2020, were used. A MAKED mixture was created especially for the experiment. In all cases, species from different families were combined (mainly Fabaceae, Brassicaceae, Boraginaceae, Asteraceae and Apiaceae), which offered a good degree of germination and development in dry environments, as well as a significant capacity to attract the main families of pollinating insects [23]. They also were conducted to produce staggered flowering, and to cover a relatively long period (approximately March to June). Likewise, it was ensured that the composition of the mixtures complied with the qualities set forth in [22]: non-competitors with the crop, easy to implant, possessing heterogeneous characteristics. In addition, cheap seed mixtures were sought.

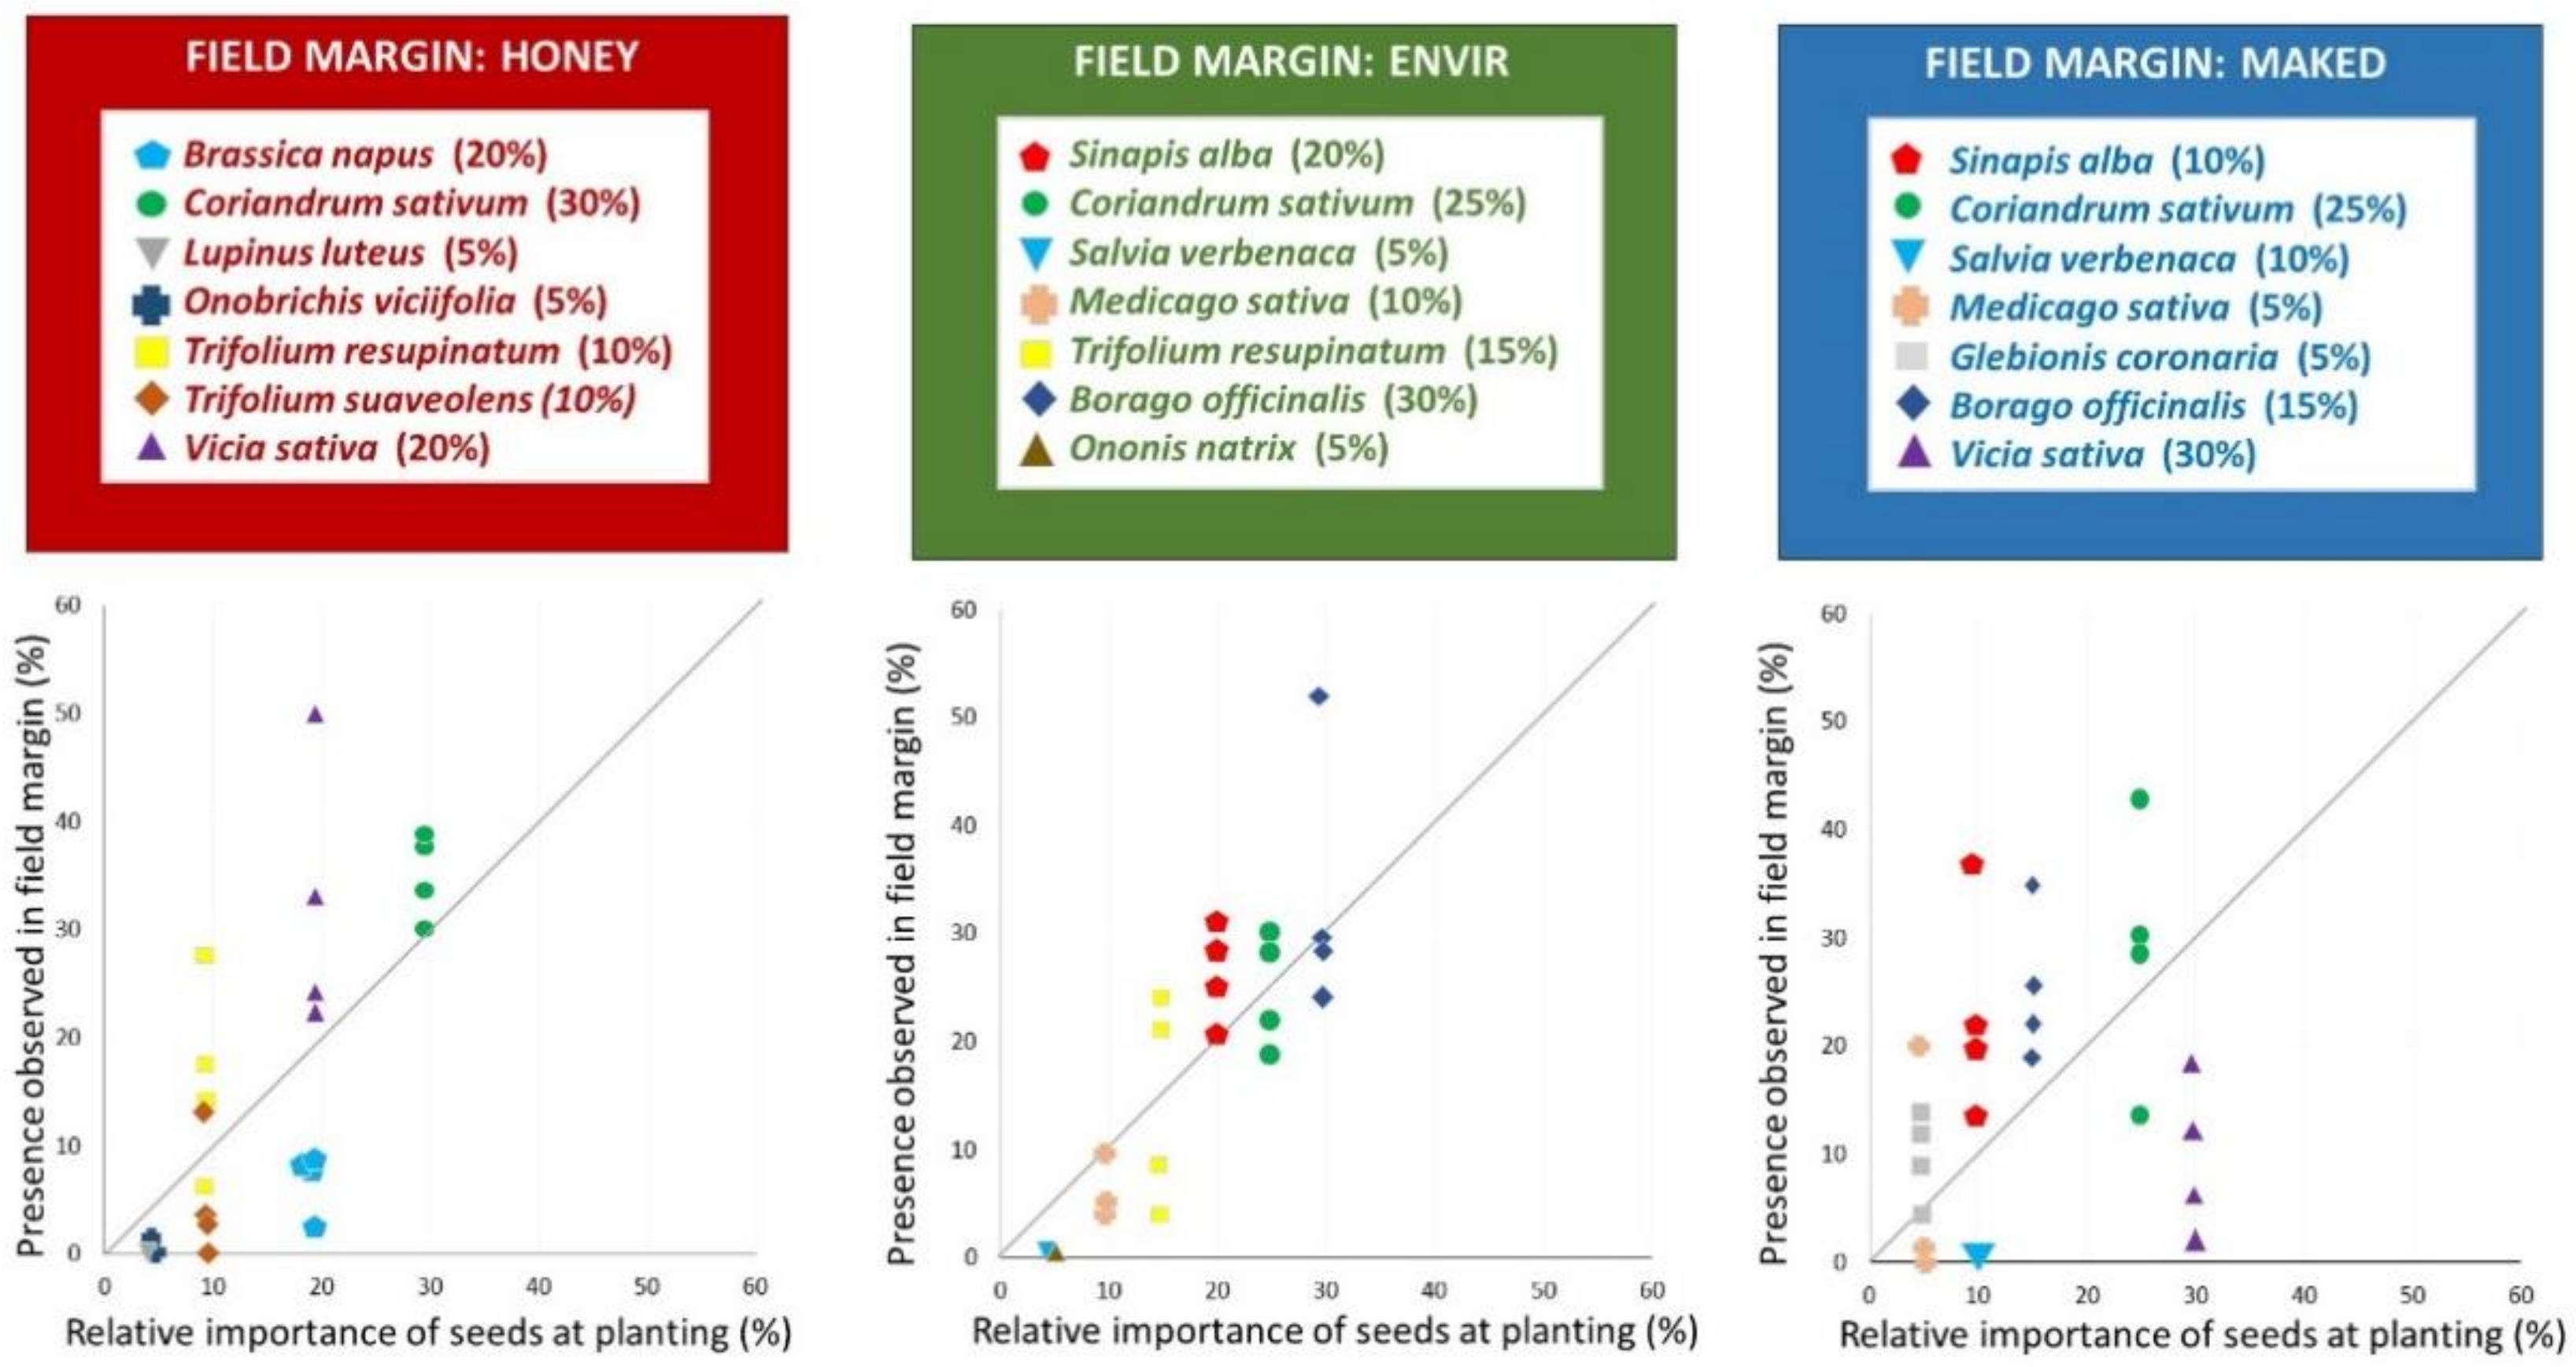
2.3. Implantation of Species According to the Sowing Percentages

At the beginning of May 2019, the species that were part of different sown MFM were already fully developed and in bloom. At this point, the conducted sampling allowed us to know the percentage of different sown species. The sampling consisted of throwing a 25 × 25 cm metal frame randomly, 20 times, into each plot.
At each launch, the species within the frame were identified. Subsequently, the average appearance percentage was calculated for each of the species sown in that plot. In this way, it was possible to compare the percentage of appearances with respect to the percentage of sowing, which allowed us to know which species are the best adapted to use in an MFM mixture.

2.4. Weeds Reduction

The information collected in Section 2.3 on monitoring the sown species implantation in May 2019 made it possible to determine which type of margin minimizes the growth of unwanted flora, commonly called weeds. During the launches of the 25 × 25 cm metal frame, the flora that spontaneously appeared within the MFM limits was also recorded.
At this point, the degree of MFM colonization by species that may pose a risk to the crop was studied, counting the number of appearances that occurred in each launch. The sum of all these appearances per plot allowed the measurement of the degree of infestation of each type of margin by unwanted flora species. In this way, it was possible to know what type of margin was less susceptible to this type of plant.

2.5. Soil Fauna Biodiversity

The monitoring of the arthropod fauna made it possible to make comparisons between the states of the existing biodiversity in the sown margins, the control margin and the crops. The biodiversity was compared in various types of studied MFM. The main taxonomic orders of arthropods and their relative richness in each type of MFM were studied.
Continuous action pitfall traps, also known as pit-fall, were used to capture arthropods. Each pit-fall consists of a 5.1 cm diameter and 7.8 cm deep container buried at ground level, which contained 50% water and 50% alcohol to facilitate the conservation of the samples. For the field sampling, in the center of each plot, a sampling unit made up of five pit-falls was installed; the units were placed in a straight line and one meter apart. Within 72 h of placement, they were removed. The samples were filtered on a 2 mm light sieve, in order to select only macroarthropods for the study [36]. Once filtered, the different captured morphospecies were counted, as well as the number of individuals belonging to each of these morphospecies.
Using the number of captured morphospecies and the number of individuals belonging to each morphospecies, the number of effective species [37,38] for each sampling unit was calculated. The number of effective species corresponds to the exponential Shannon index [39], which is widely used in ecology studies [40]. The concept of effective species can be defined, according to its creators, as the number of equally-common species required to produce a particular value on the Shannon Index.
The samplings were taken three times throughout the 2018–2019 growing season. The average obtained during the three samplings revealed the effective number of species corresponding to each plot. In addition, the information collected during the three soil arthropod sampling seasons made it possible to know which were the orders with the highest relative richness in morphospecies for each type of MFM.
During the sampling in May, the soil arthropod biodiversity was also sampled within the crop at a 25 m distance from the MFM. Thus, it was possible to compare the effect of the implementation of MFM with the crop. Only this date was selected because in spring, the crop and the MFM are in full vegetative development. Therefore, the results obtained allow a better comparison than they would if taken during the rest of the year, when the management of the crop might have affected the samples.

2.6. Pollinator Biodiversity

During the month of May 2019, a sampling of arthropods that inhabited the MFM plants was carried out. An entomological net was applied on the upper part of the plants of each plot in two zigzag passes in order to collect the arthropods. Afterwards, in the laboratory, morphospecies and individuals were counted. Likewise, the taxonomic orders richest in individuals and morphospecies were determined. A set of orders with pollinating species was also assessed. With these data, the effective number of pollinating species and soil arthropods was calculated and the level of pollinator biodiversity in each MFM was estimated. The review of the captures performed in the MFM and the direct observation of the specimens during the sampling seasons allowed us to determine the presence of pollinators in the MFM located on the four studied farms. In addition, in the studied MFM, information on the presence of species of interest for conservation was collected, either because they are included in the Intentional Union for Conservation Nature (IUCN) red list, or because they are endemic Iberian or regional species.

2.7. Overall Analysis

As a final result, an overall assessment of the three seeded MFM (HONEY, ENVIR and MAKED) was carried out together with the control margin (ADVEN). The assessment considered the results obtained in the previous sections with respect to:
-
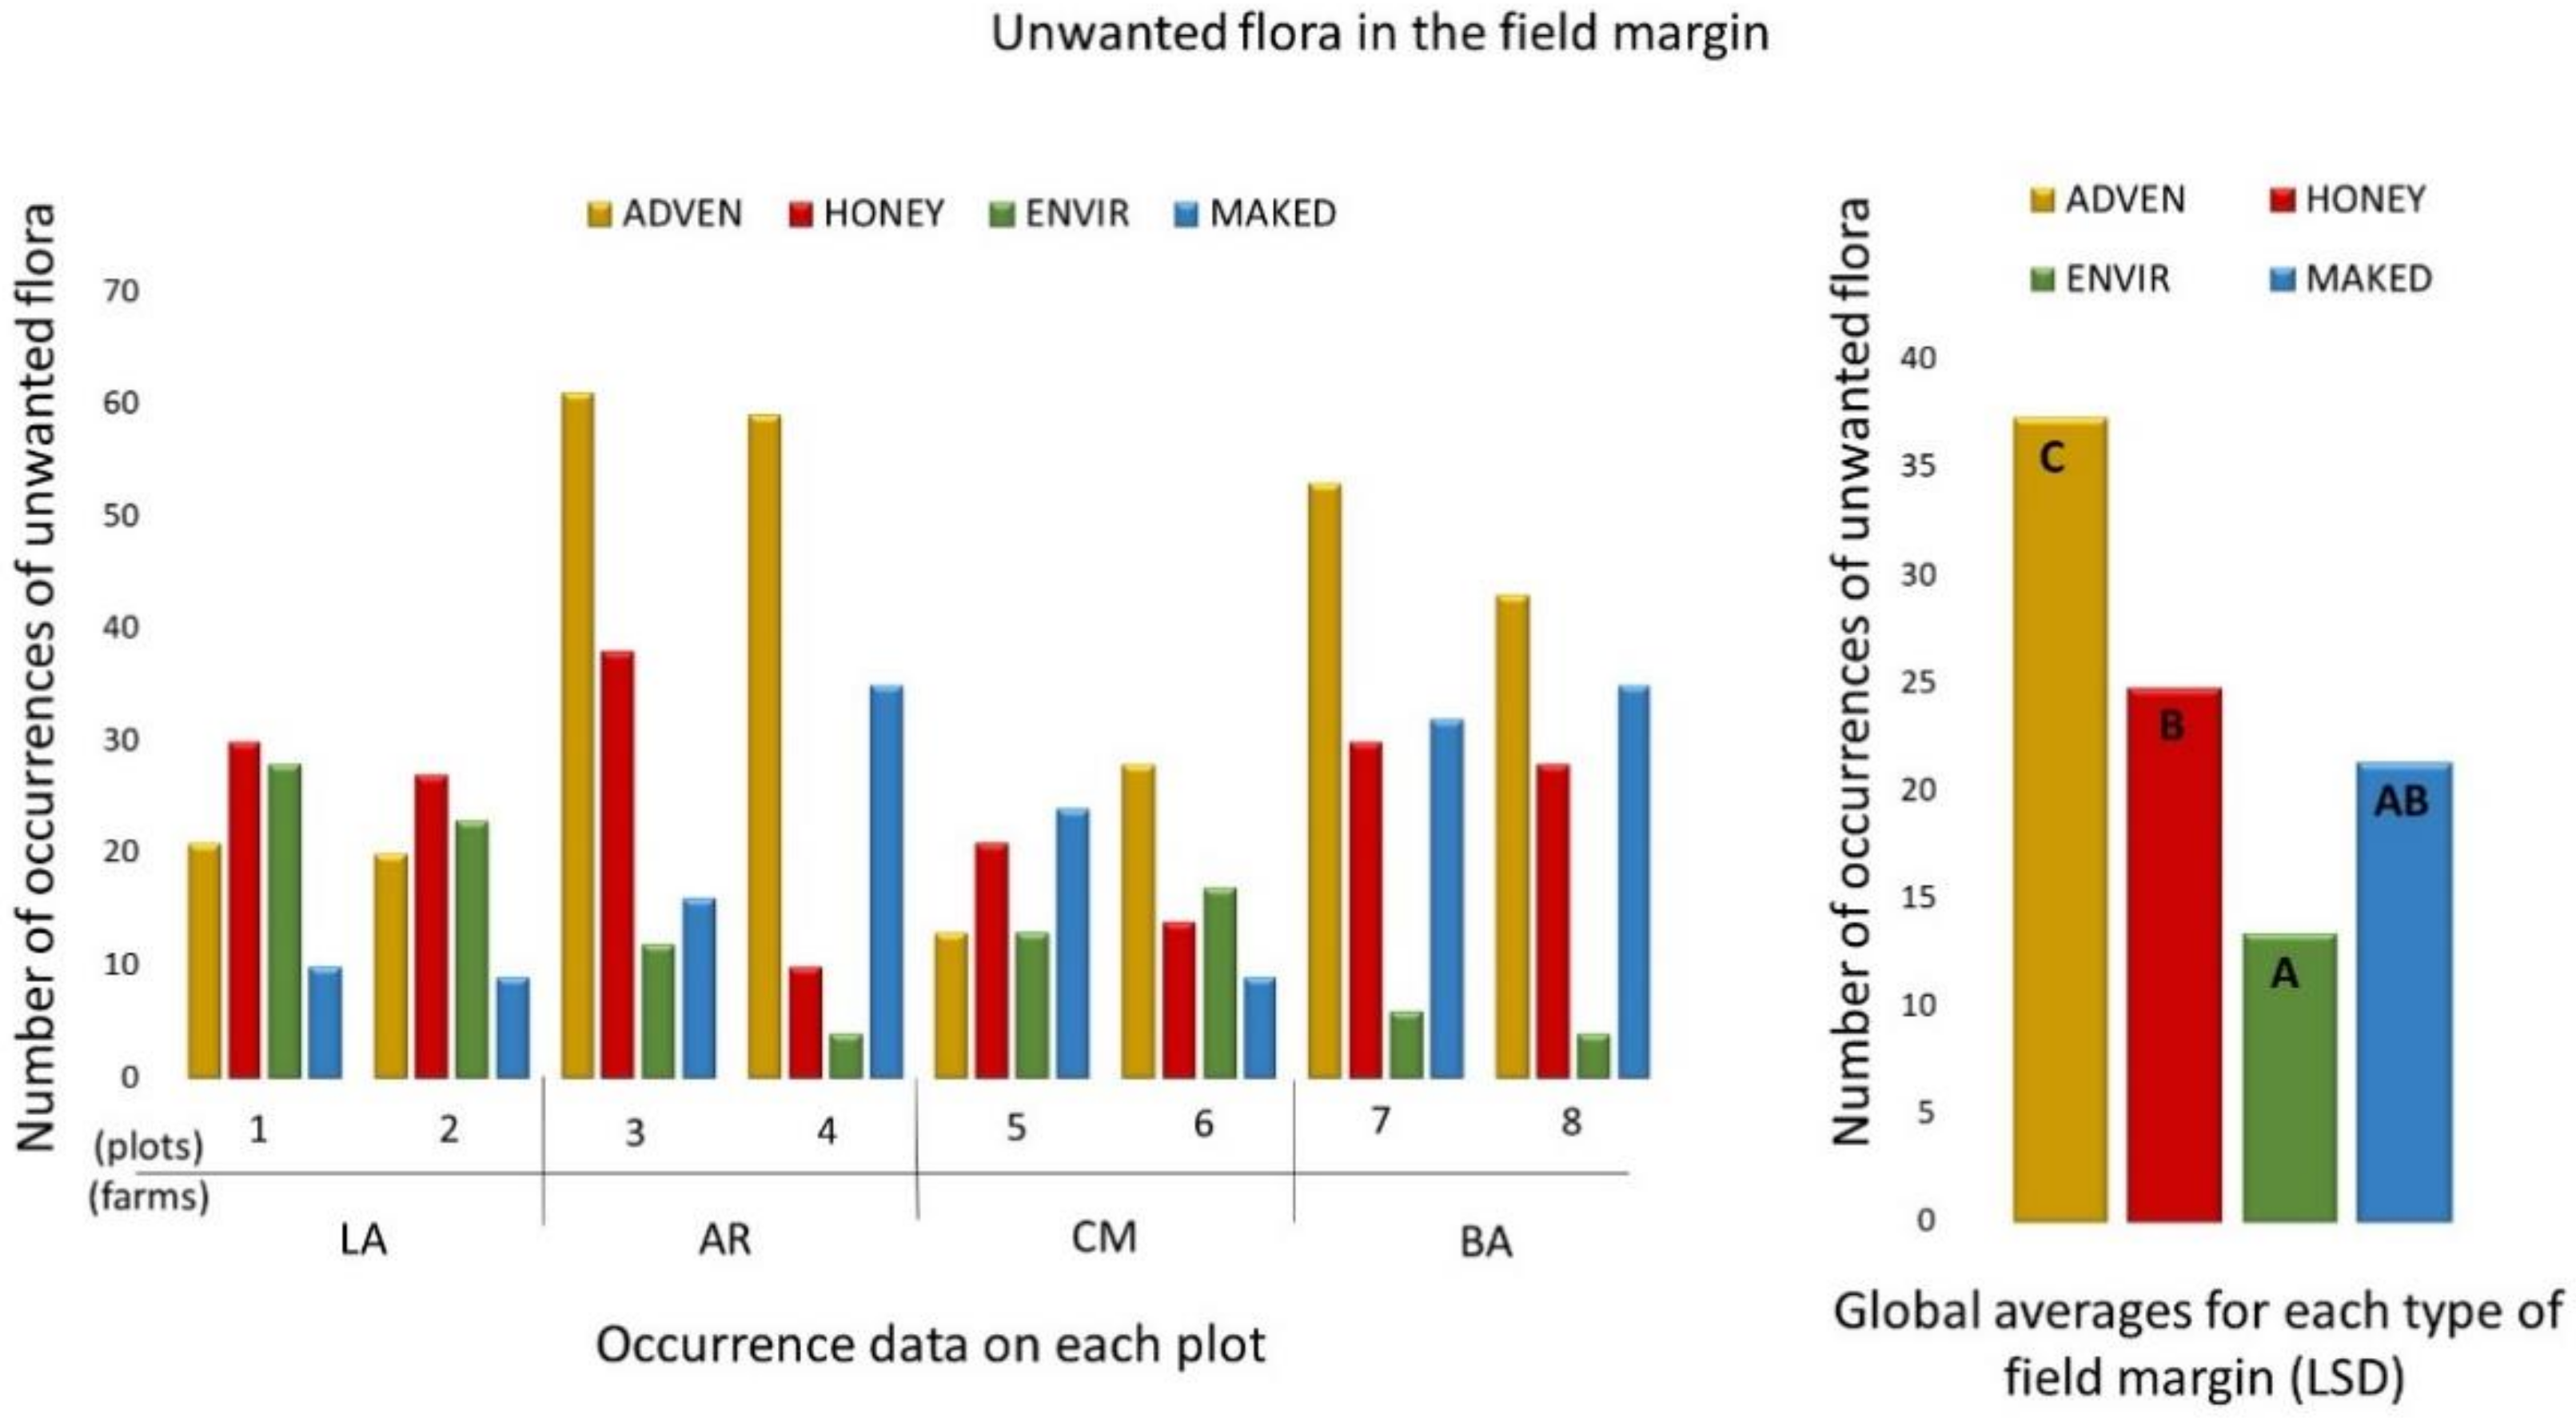
Reduction in unwanted flora.
-
Biodiversity of soil arthropod fauna.
-
Pollinator biodiversity.
In order to simplify the comparison between the types of MFM and the variables, an analysis of variance (ANOVA) was performed with a completely randomized design. The subsequent comparison of means was carried out by the Fisher’s least significant differences (LSD) test at a 5% significance level. The plots per type of MFM were considered replicates and the four experimental farms were taken into account. The analytical software Statistix 9.0 was used for the ANOVA.

3. Results

3.1. Implantation of Species According to the Sowing Percentages

Figure 2 presents the percentage of sown flora appearance in the three sown MFM (HONEY, ENVIR and MAKED) per experimental farm, in comparison with the used sowing percentages. The species located above diagonal line (1:1 ratio) demonstrated a better development than expected, while those below it, did not reach the expected levels of expansion.
The sampling showed the good implantation of Coriandrum sativum L., Vicia sativa L. and Trifolium resupinatum L. in the HONEY margin. In ENVIR, the species with the best implantation were Borago officinalis L. and Sinapis alba L., while C. sativum and T. resupinatum demonstrated good implantation on only two farms. Finally, in MAKED, the species that demonstrated a higher percentage than expected were C. sativum, B. officinalis, S. alba and Glebionis coronaria L., while V. sativa did not reach the percentage associated with its sowing (30%). After analyzing the four margins, a list of species that presented the best data was established (Table 1). By contrast, the appearance of some sown species was very scarce and sometimes null in different MFM. This was the case of Lupinus luteus L., Onobrychis viciifolia Scop., Salvia verbenaca L. and Ononis natrix L. Some species, although they appeared regularly, demonstrated a lower percentage than expected according to the importance of the seed percentage in the planting mixes. Among these last species, Trifolium suaveolens Willd., Brassica napus L. and Medicago sativa L. were observed.

3.2. Weed Reduction

The results of the spontaneous flora that could invade crops are presented in Figure 3. It can be seen that if the margin is left without any type of treatment, it becomes a pasture of adventitious flora, in which species that have survived years of tillage and herbicides are highly likely to thrive and abound, posing a very high risk to crops. When implanting seeded MFM, the seeded species compete with the spontaneous species, reducing their presence. The species that were detected in the margin and considered weeds after analyzing their biology are listed in Table 2.
Within the studied MFM, were obtained the best results in ENVIR because the appearance of unwanted flora there was lower than in MAKED and HONEY (in this case, significantly). Therefore, the application of ENVIR managed to compete effectively with the unwanted herbaceous species. Analyzing every farm, ENVIR demonstrated the best results on each of them, except on the LA farm, where it was clearly surpassed by MAKED. The reduction in the appearance of weeds with respect to the spontaneous MFM flora was 35% in HONEY, 65% in ENVIR and 40% in MAKED.

3.3. Soil Fauna Biodiversity

The average amount of morphospecies per plot that was observed in each of the three samplings is presented in Table 3. An average number of morphospecies appearances throughout the sampling year is also provided. This value indicates the low presence of morphospecies in ADVEN, while the highest values were obtained in MAKED. In the case of HONEY and ENVIR, intermediate values were obtained. In general, morphospecies belonging to the order Coleoptera accounted for 28% of the captures in the four types of studied margins. The order Hymenoptera varied between 18–23%, Diptera varied between 19–20% and Araneae 15–18%. While the rest of the orders did not exceed 17% on the whole.
In terms of the effective species number, the results were similar to those observed regarding the number of captured morphospecies. The average value of effective species in the different samples of soil arthropods was higher in the MAKED margin than in the others, while in the ADVEN margin it was lower than in the others. In the HONEY and ENVIR margins, the number of effective species was intermediate, compared to the previous two. Therefore, if the effect on biodiversity when implanting seeded MFM is analyzed, a clear improvement can be seen when comparing it to the creation of an MFM with adventitious flora next to the crop (ADVEN) (Figure 4).
This effect was even greater when compared with the values of effective species obtained in the joined crops. In summary, the biodiversity of epidaphic fauna increased in the MFM of spontaneous flora by 15 with respect to the crop, reaching average values of 32% in the case of the seeded MFM.

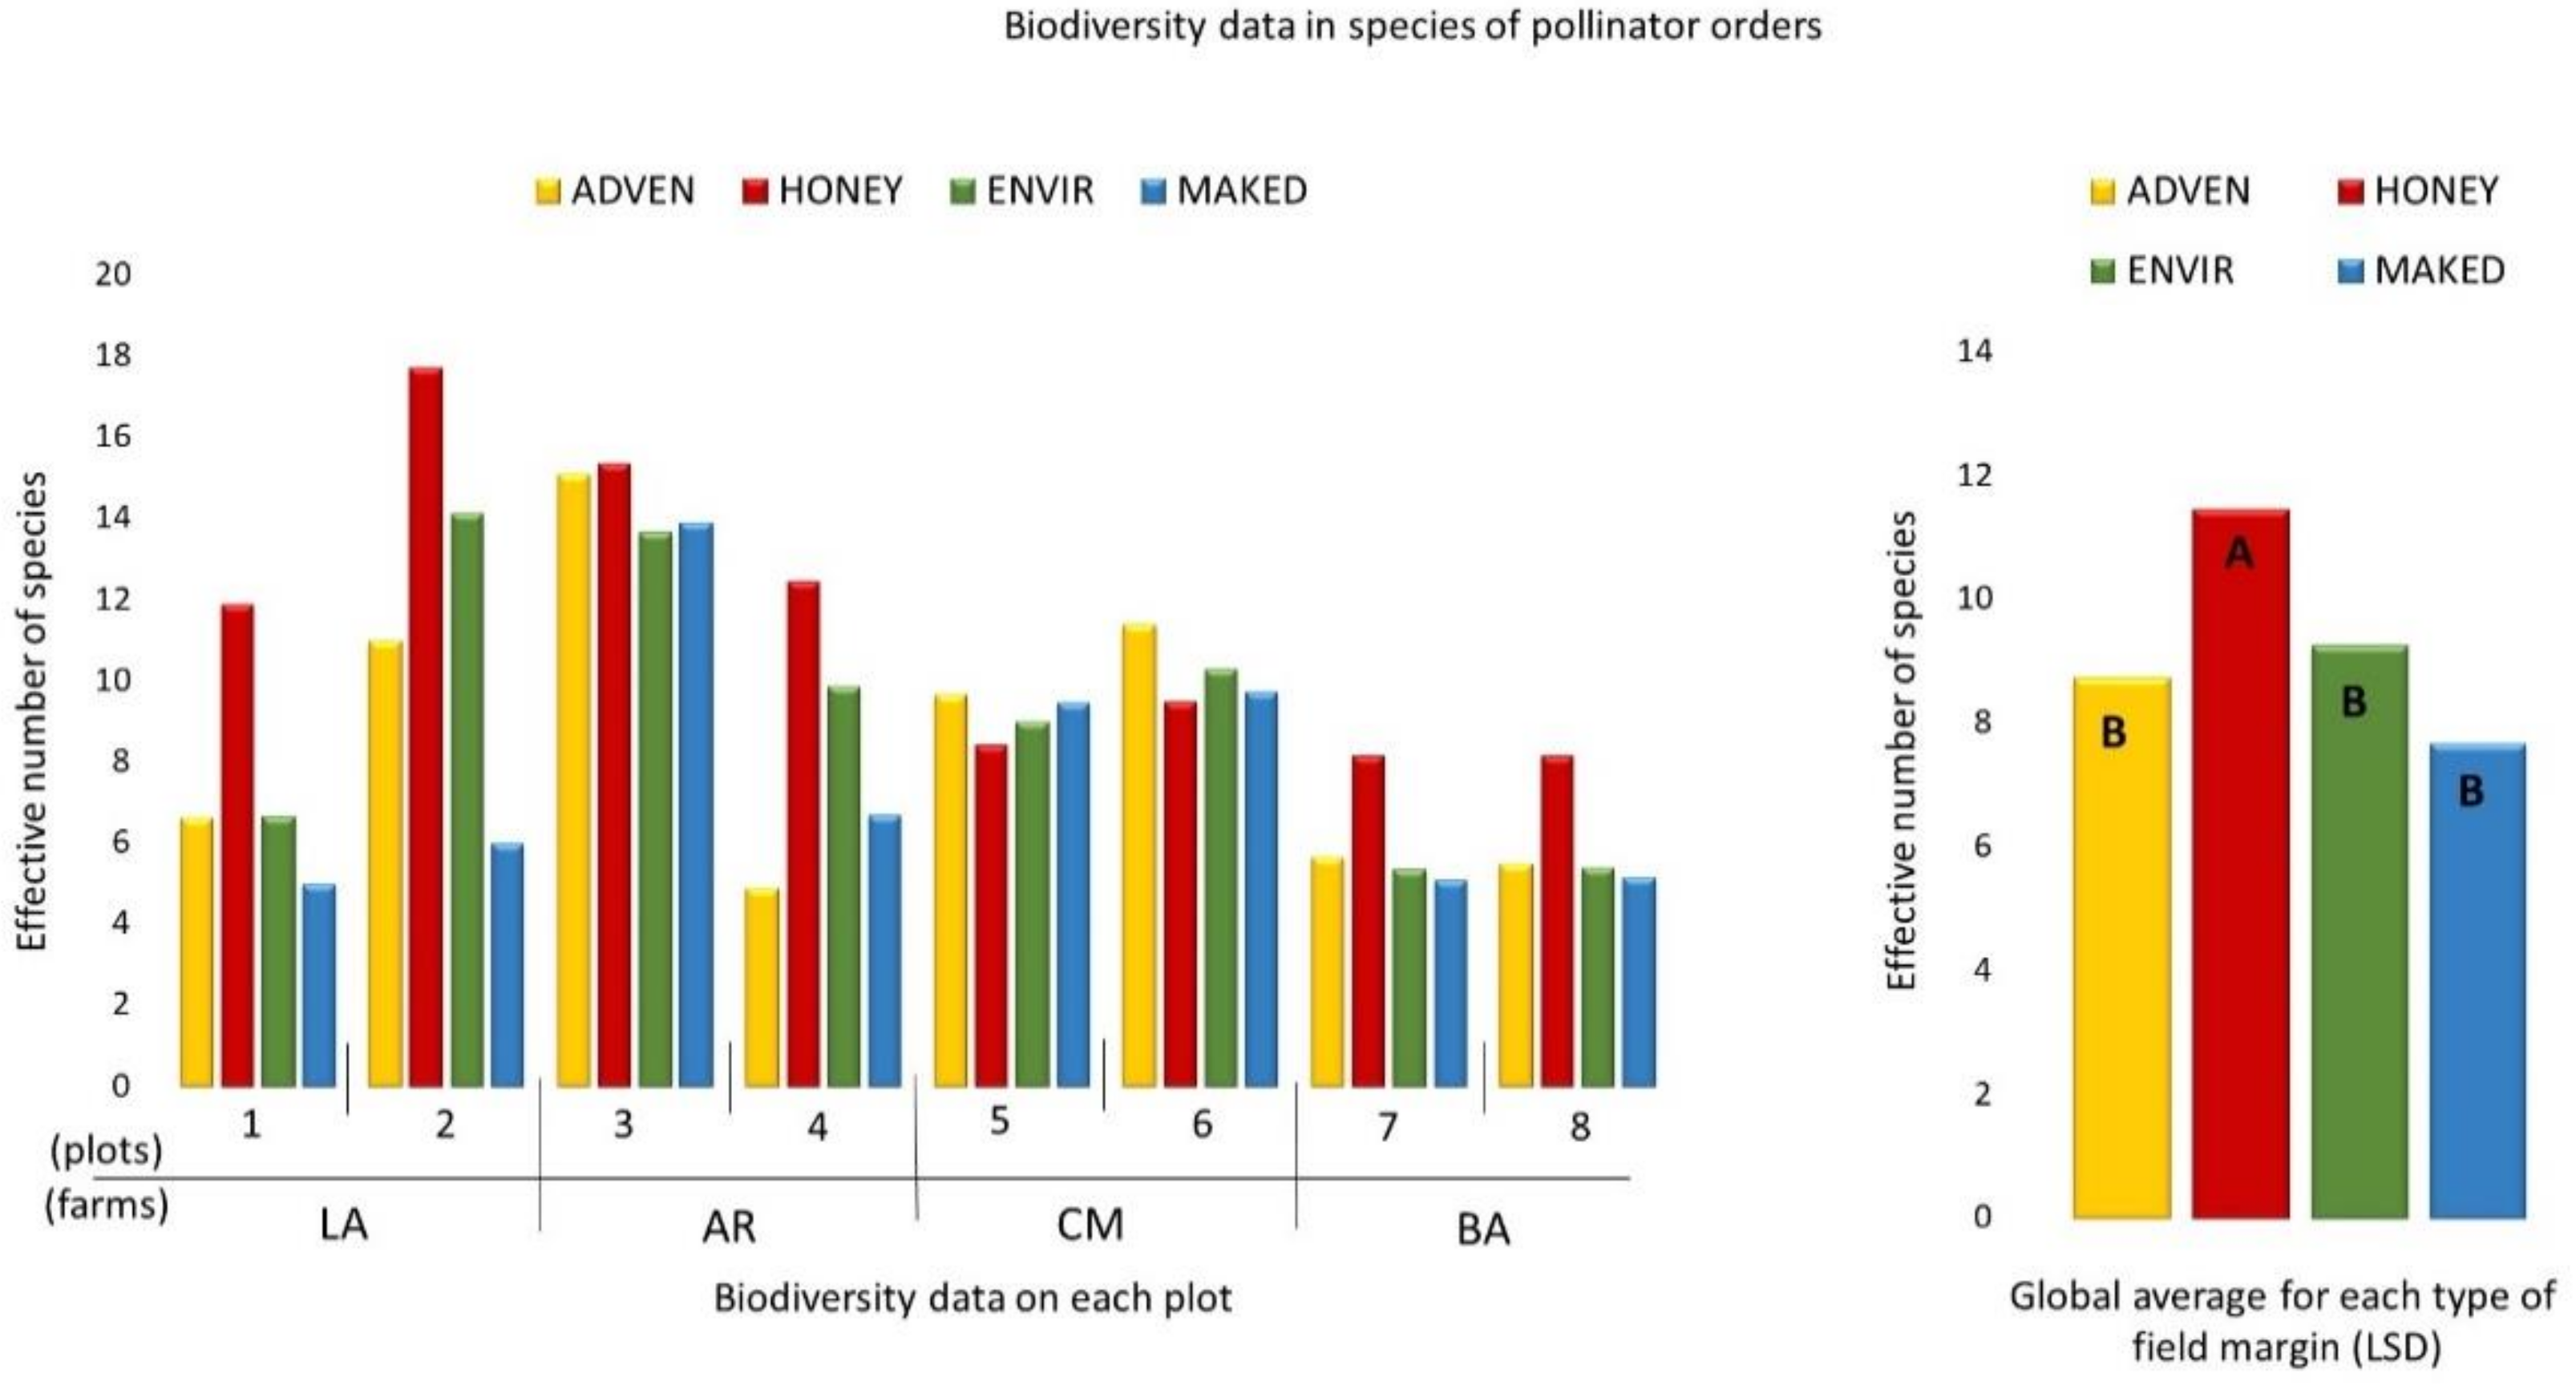
3.4. Pollinator Biodiversity

The results of the study of arthropods living in the MFM flora helped to quantify the number of orders present in each type of margin (Figure 5). Overall, it was observed that among the orders with pollinating species (Hymenoptera, Diptera, Coleoptera and Lepidoptera), the first three displayed the highest abundance with respect to the total of captured arthropods. Specifically, the first three orders accounted for at least 70% of the captured individuals. The total of different orders of arthropods captured on the plants at the margin flora reached 14.
Figure 5 presents the results related to the number of effective species in MFM. The pollinator biodiversity results for HONEY were significantly greater than the rest. This superiority of HONEY margins was seen on all the farms except for CM, which was the only farm where this type of margin did not represent the greatest pollinator biodiversity. The results for HONEY are especially significant with respect to the rest of margins. In particular, the improvement in pollinator biodiversity in HONEY was 36% with respect to that observed in the spontaneous flora margin.
Within this sampling, a large number of pollinating species were found (Table 4). The largest number were wasps and bees included in the order of Hymenoptera, although the species of Diptera (flies, hoverflies and horseflies), Coleoptera (beetles) and Lepidoptera (butterflies) were also abundant.
Finally, during this sampling and associated with the margins, threatened species were found, either because they are considered to be endangered species or because they are endemic to a reduced area of distribution. These species are listed in Table 5.

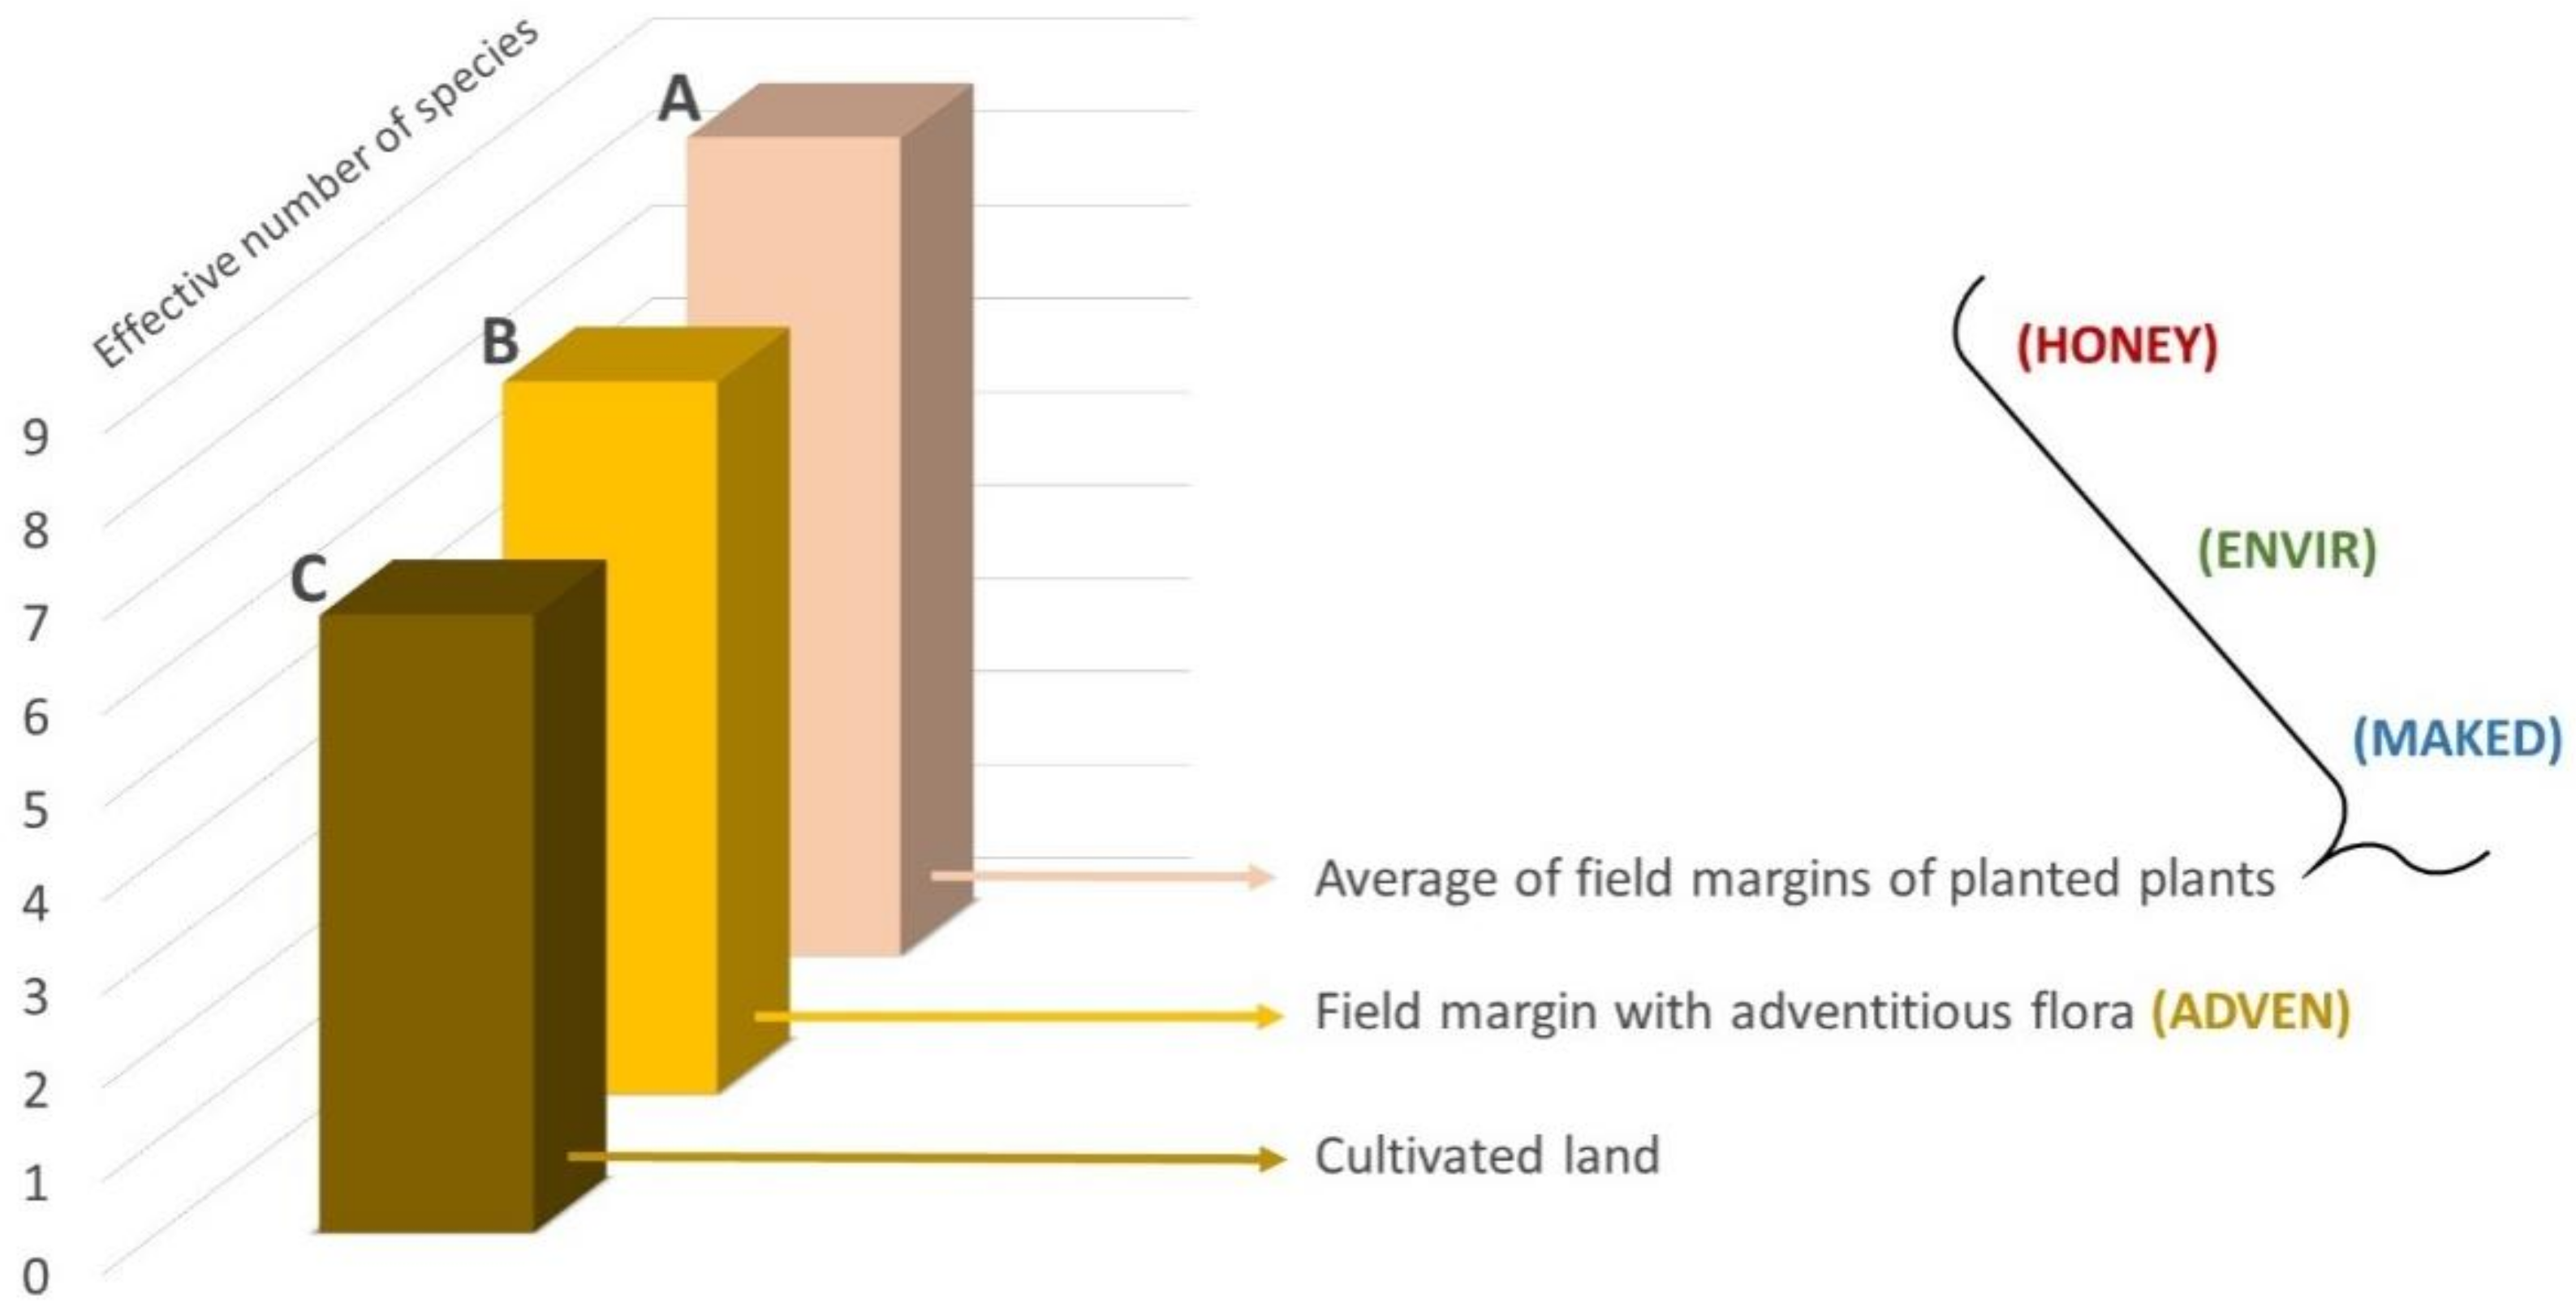
3.5. Overall Analysis

The results obtained in the three seeded MFM (HONEY, ENVIR and MAKED) and the control margin (ADVEN), were grouped for an overall assessment (Table 6). Table 6 presents the relative importance of each MFM regarding soil arthropod biodiversity, pollinator biodiversity and the reduction in unwanted flora.
Better effects were obtained in the seeded MFM than in the margin constituted by adventitious flora (ADVEN). Among the MFM, the MAKED margin qualitatively presented the best data. Next, the most favorable results were obtained by ENVIR, although these were not substantially inferior to those of MAKED. Finally, HONEY demonstrated lower global characteristics than ENVIR, although it demonstrated the best results regarding pollinator biodiversity.

4. Discussion

4.1. Implantation of Species According to the Planting Percentages

The results collected in Table 1 are similar to those obtained in [23], in which species such as B. officinalis, C. sativum and V. sativa also demonstrated significant implantation success. On the other hand, O. viciifolia, S. verbenaca and M. sativa displayed little germination success. In our case, we believe that these species did not demonstrate an adequate response to a high sowing delay. In the case of [23], the sowing date of the species is unknown. Therefore, the results may have been due to climatic or soil factors. In [35], a good implantation of S. verbenaca was observed despite also being sown in winter; moreover, the authors demonstrated that B. officinalis and C. sativum have a good predisposition to use in this type of practice, which was also observed in [23]. In [22], both species were sown at a low sowing density, obtaining good implantation results. In any case, the species with the best implantation results are thought to be weeds and cosmopolitans [41,42]. It must be highlighted that the present study was developed in cropland soils with high agricultural potential; therefore, the potential growth of this type of species is high.

4.2. Weed Reduction

The observed results demonstrate that the presence of implanted flora prevents the growth of spontaneous flora, which can pose a very high risk to crops (Figure 3). These results match those presented in [15], in which this reduction was attributed not only to the reduction in space and light available for the growth of unwanted flora, but also to the increase in natural enemies (parasitoids, predators, etc.) for these unwanted species by the farmer, since these natural enemies find shelter and food in the species sown on the margin.
Regarding the reduction in the appearance of weeds, ENVIR produced the best result due to the abundant coverage of S. alba, B. officinalis and C. sativum, which created dense herbaceous formations in which the growth of other species was hampered. The case of S. alba, a species with an earlier phenology, is noteworthy because it colonized part of the margins in an almost monospecific way. Therefore, for future work in this regard, it would be advisable to reduce the percentage of S. alba seed if the appearance of other species is to be improved. In the same way, if this species is not reduced, it will lead to a probable economic cost in the form of the seeds of other species, whose development would be threatened by S. alba.
Data from the LA farm reflect a higher presence of unwanted weeds in HONEY and ENVIR compared to the ADVEN margin. This result was due to the fact that on this farm, there was a significant growth in the ADVEN plots of Calendula arvensis L. and, even though it had not been sown, it was not considered as a weed, because it is not invasive for crops and it is also of great importance for pollinators. In fact, a species from the same group (Calendula officinalis L.) was planted in other MFM studies [22,23,35] achieving good implantation results.

4.3. Soil Fauna Biodiversity

The amount of collected soil arthropod morphospecies (Table 3) was lower in ADVEN than in the rest of the MFM (HONEY, ENVIR and MAKED), with data similar to the studies carried out by [26,28], in which studies of soil arthropods were performed in sown and spontaneous margins. The division of morphospecies into different taxonomic orders produced very homogeneous results, characterized by a great abundance of coleopterans. Curiously, on the four farms, coleopterans accounted for 28% of the morphospecies found. Ref. [26] also observed that the Coleoptera order benefited from the implementation of MFM. Furthermore, in [28] it is further specified that the Carabids group had the best representation. In the present study, the captures by pit-falls were also dominated by Carabids.
The study of soil arthropod biodiversity demonstrated that MAKED was the MFM with the best results, especially in comparison with the study of species of spontaneous ADVEN flora. In this last margin, the results observed on the LA farm on the increase produced in the autumn sampling with respect to that observed in winter and spring are noteworthy. On the other hand, the rest of the farms demonstrated their highest values in spring. It is also noteworthy that the LA margins displayed lower biodiversity values in soil arthropods than the rest of the farms. These results could have been influenced by the significant flooding in autumn 2018 on this farm, which happened before the planting of the MFM and which could have affected the arthropod populations in the soil.
The study of soil arthropods allowed the detection of increases in biodiversity when using MFM (Figure 4). An increase in biodiversity on nearby crops was noticed, coinciding with what was observed by different authors who studied the biodiversity of soil arthropods when introducing this type of ecological infrastructure [27,29,30]. Better results for soil arthropod biodiversity were also observed in planted margins (HONEY, ENVIR and MAKED) compared to the adventitious flora margins (ADVEN). Again, these data were in agreement with those of other studies [26,28].

4.4. Pollinator Biodiversity

The abundance of individuals and pollinating species compared to the total of captured arthropods matched the results obtained by [43,44], in studies that reflected how much this type of insect is attracted to MFM. The distribution of orders was similar in the different MFM, as well as the results obtained in [45] about the different types of MFM with which they worked. In the present study, there were slight differences, with a predominance of Diptera in ADVEN and MAKED and of Hymenoptera in HONEY and ENVIR. Therefore, the higher pollinator character of Hymenoptera [24] made the implantation of HONEY and ENVIR slightly more interesting for increase in the presence of pollinators.
The study of effective species within orders with pollinator characteristics in each type of margin demonstrated that HONEY is the MFM with the best pollinator biodiversity (Figure 5). It is noteworthy that the species included in HONEY belong to the list published by the Ministry of Agriculture, Fisheries and Food (Spanish Government) of species rich in pollen and nectar acknowledged at the national level by virtue of Annex VIII of Royal Decree 1075/2014, December 19. Therefore, HONEY has a clear basis for attracting pollinating insects. In fact, within this MFM, there are species that have been used successfully to attract pollinators in other studies, especially C. sativum [22,23,35].
The abundant biodiversity of pollinating fauna (Table 4) and/or threatened fauna (Table 5) that was detected during the study of the MFM reinforces the argument of [18] on the capacity of these margins to act as ecological corridors, as well as the importance, stated by [43,44], of being a valuable tool for the environmental management of agricultural land. This justifies the introduction of MFM in the eco-schemes that will govern future agri-environmental aid in Europe.

4.5. Overall Analysis

A qualitative summary was produced using the compendium of studied parameters (Table 6). The MAKED margin, designed expressly for this study, obtained better overall results than those that followed the species indicated by national (HONEY) and regional (ENVIR) regulations. However, the three types of seeded MFM demonstrated better qualities than the margin with spontaneous flora (ADVEN). Therefore, the implementation of MFM is advisable, since its benefits for biodiversity are much higher than the cost of the establishment of the species.
Regarding margin types, HONEY is the most recommendable for increasing pollinator populations. The use of the ENVIR margin is recommended if the main objective is to reduce the risk of infestation on the joined crops. Lastly, MAKED, in addition to obtaining the best overall data, is the most suitable for achieving a greater biodiversity of soil arthropods.

5. Conclusions

Regarding the MFM implantation, the existence of six herbaceous species that offer great qualities for sowing in MFM in the Andalusia region was confirmed: B. officinalis, G. coronaria, C. sativum, S. alba, T. resupinatum and V. sativa. The sown MFM and those with spontaneous flora significantly contributed to the increase in biodiversity of agricultural soils. After comparing all the MFM regarding the increase in pollinator populations, soil arthropod biodiversity and reduction in infestation risk on nearby crops, better results were obtained in the margins with seeded flora than in those with spontaneous flora. In particular, with regard to the reduction in weeds, values of up to 65% reduced presence were reached in the sown MFM compared with the MFM of spontaneous flora. Regarding the biodiversity of the epiedaphic fauna, the presence of a spontaneous flora MFM meant increases of 15% in the biodiversity observed in the crops. In the sown MFM, the average increase in biodiversity across the crop was 32%. Finally, in the sown MFM, observed increases in pollinator biodiversity of up to 36% with respect to the spontaneous flora MFM were observed.
The monitoring of different aspects of MFM implementation and its implication in improving biodiversity, as well as the ecosystem services that this biodiversity generated, made it possible to demonstrate the important qualities that MFM provide, which make them one of the eco-schemes that will govern future agri-environmental aid in Europe.

Author Contributions

Conceptualization M.M.-G.; methodology, M.M.-G., J.L.-T., A.R.-L., M.Á.R.-R.d.T., L.Ó.A.-M. and R.C.-B.; investigation, M.M.-G., J.L.-T., A.R.-L., M.Á.R.-R.d.T., L.Ó.A.-M. and R.C.-B.; writing—original draft preparation, M.M.-G. and R.O.-F.; writing—review and editing, M.M.-G., R.C.-B. and R.O.-F. All authors have read and agreed to the published version of the manuscript.

Funding

To the Research and Technological Innovation project PP.AVA.AVA2019.007 financed at 80% by Program Andalusia Operational 2014–2020 of the Fund European Regional Development (FEDER).

Institutional Review Board Statement

Ethical review and approval were waived for this study, due to a small number of arthropods have been caught without prejudice to their local populations. In most cases the specimens have been returned to the environment. Especially those belonging to protected or endemic species.

Informed Consent Statement

Not applicable.

Data Availability Statement

Not applicable.

Acknowledgments

To the field and laboratory staff of the Soil Physics and Chemistry team at the IFAPA center, Alameda del Obispo, for their collaboration in the assays. And to the colleagues of the project “Gestión de márgenes multifuncionales en secano para un mejor balance de carbono y biodiversidad”: AEAC.SV, Syngenta and ASAJA.

Conflicts of Interest

The authors declare no conflict of interest.

References

  1. Foley, J.A.; DeFries, R.; Asner, G.; Barford, C.; Bonan, G.; Carpenter, S.R.; Chapin, F.S.; Coe, M.; Daily, G.C.; Gibbs, H.K.; et al. Global Consequences of Land Use. Science 2005, 309, 570–574. [Google Scholar] [CrossRef] [PubMed] [Green Version]
  2. Ramankutty, N.; Mehrabi, Z.; Waha, K.; Jarvis, L.; Kremen, C.; Herrero, M.; Rieseberg, L. Trends in Global Agricultural Land Use: Implications for Environmental Health and Food Security. Annu. Rev. Plant Biol. 2018, 69, 789–815. [Google Scholar] [CrossRef] [PubMed] [Green Version]
  3. Foley, J.A.; Ramankutty, N.; Brauman, K.A.; Cassidy, E.S.; Gerber, J.S.; Johnston, M.; Mueller, N.D.; O’Connell, C.; Ray, D.K.; West, P.C.; et al. Solutions for a cultivated planet. Nature 2011, 478, 337–342. [Google Scholar] [CrossRef] [PubMed] [Green Version]
  4. Tscharntke, T.; Klein, A.M.; Kruess, A.; Steffan-Dewenter, I.; Thies, C. Landscape perspectives on agricultural intensification and biodiversity–ecosystem service management. Ecol. Lett. 2005, 8, 857–874. [Google Scholar] [CrossRef]
  5. Hobbs, P.R.; Sayre, K.; Gupta, R. The role of conservation agriculture in sustainable agriculture. Philos. Trans. R. Soc. Lond. B Biol. Sci. 2008, 363, 543–555. [Google Scholar] [CrossRef] [PubMed]
  6. Haddad, N.M.; Brudvig, L.A.; Clobert, J.; Davies, K.F.; Gonzalez, A.; Holt, R.D.; Lovejoy, T.E.; Sexton, J.O.; Austin, M.P.; Collins, C.D.; et al. Habitat fragmentation and its lasting impact on Earth’s ecosystems. Sci. Adv. 2015, 1, e1500052. [Google Scholar] [CrossRef] [Green Version]
  7. Newbold, T.; Adams, G.L.; Robles, G.A.; Boakes, E.H.; Ferreira, G.B.; Chapman, A.S.A.; Etard, A.; Gibb, R.; Millard, J.; Outhwaite, C.L.; et al. Climate and land-use change homogenise terrestrial biodiversity, with consequences for ecosystem functioning and human well-being. Emerg. Top. Life Sci. 2019, 3, 207–219. [Google Scholar] [CrossRef] [PubMed]
  8. Stoate, C.; Baldi, A.; Beja, P.; Boatman, N.; Herzon, I.; van Doorn, A.; de Snoo, G.; Rakosy, L.; Ramwell, C. Ecological impacts of early 21st century agricultural change in Europe—A review. J. Environ. Manag. 2009, 91, 22–46. [Google Scholar] [CrossRef] [PubMed]
  9. Reidsma, P.; Tekelenburg, T.; Berg, M.V.D.; Alkemade, R. Impacts of land-use change on biodiversity: An assessment of agricultural biodiversity in the European Union. Agric. Ecosyst. Environ. 2006, 114, 86–102. [Google Scholar] [CrossRef]
  10. Dale, V.H.; Polasky, S. Measures of the effects of agricultural practices on ecosystem services. Ecol. Econ. 2007, 64, 286–296. [Google Scholar] [CrossRef]
  11. Bommarco, R.; Kleijn, D.; Potts, S.G. Ecological intensification: Harnessing ecosystem services for food security. Trends Ecol. Evol. 2013, 28, 230–238. [Google Scholar] [CrossRef]
  12. Nabhan, G.P.; Buchmann, S.L. Services provided by pollinators. In Nature’s Services: Societal Dependence on Natural Ecosystems; Daily, G., Ed.; Island Press: Washington, DC, USA, 1997; pp. 133–150. [Google Scholar]
  13. Tittonell, P. Ecological intensification of agriculture—Sustainable by nature. Curr. Opin. Environ. Sustain. 2014, 8, 53–61. [Google Scholar] [CrossRef]
  14. Tscharntke, T.; Bommarco, R.; Clough, Y.; Crist, T.O.; Kleijn, D.; Rand, T.A.; Tylianakis, J.; van Nouhuys, S.; Vidal, S. Conservation biological control and enemy diversity on a landscape scale. Biol. Control. 2007, 43, 294–309. [Google Scholar] [CrossRef]
  15. Gaba, S.; Lescourret, F.; Boudsocq, S.; Enjalbert, J.; Hinsinger, P.; Journet, E.-P.; Navas, M.-L.; Wery, J.; Louarn, G.; Malézieux, E.; et al. Multiple cropping systems as drivers for providing multiple ecosystem services: From concepts to design. Agron. Sustain. Dev. 2015, 35, 607–623. [Google Scholar] [CrossRef] [Green Version]
  16. Gaba, S.; Gabriel, E.; Chadœuf, J.; Bonneu, F.; Bretagnolle, V. Herbicides do not ensure for higher wheat yield, but eliminate rare plant species. Sci. Rep. 2016, 6, 30112. [Google Scholar] [CrossRef]
  17. Hackett, M.; Lawrence, A. Multifunctional Roel of Field Margins in Arable Farming. In Report for European Crop Protection Association by Cambridge Environmental Assessment 2014; ADAS UK Ltd.: Malton, UK, 2014. [Google Scholar]
  18. Haaland, C.; Naisbit, R.; Bersier, L.-F. Sown wildflower strips for insect conservation: A review. Insect Conserv. Divers. 2010, 4, 60–80. [Google Scholar] [CrossRef]
  19. Reichenberger, S.; Bach, M.; Skitschak, A.; Frede, H.-G. Mitigation strategies to reduce pesticide inputs into ground- and surface water and their effectiveness; A review. Sci. Total. Environ. 2007, 384, 1–35. [Google Scholar] [CrossRef]
  20. Neve, P.; Vila-Aiub, M.; Roux, F. Evolutionary-thinking in agricultural weed management. New Phytol. 2009, 184, 783–793. [Google Scholar] [CrossRef] [Green Version]
  21. Oerke, E.C. Crop losses to pests: Centenary review. J. Agric. Sci. 2006, 144, 31–43. [Google Scholar] [CrossRef]
  22. Azpiazu, C.; Medina, P.; Adán, Á.; Sánchez-Ramos, I.; del Estal, P.; Fereres, A.; Viñuela, E. The Role of Annual Flowering Plant Strips on a Melon Crop in Central Spain. Influence on Pollinators and Crop. Insects 2020, 11, 66. [Google Scholar] [CrossRef] [Green Version]
  23. Viñuela, E.; Adanl, A.; Rodriguez, J.; Hernando, S.; Doradoz, J. Provision of ecological infrastructures to increase pollinators and other beneficial organisms in rainfed crops in Central Spain. IOBC/Wprs Bull. 2012, 75, 229–233. [Google Scholar]
  24. Aguado Martín, L.O.; Ferreres Castiel, A.; Viñuela Sandoval, E. Guía de Campo de Los Polinizadores de España; Mundiprensa: Madrid, Spain, 2015; 369p. [Google Scholar]
  25. Haines-Young, R.; Potschin, M. The links between biodiversity, ecosystem services and human well-being. In Ecosystemecology: A New Synthesis; Raffaelli, D., Frid, D., Eds.; Cambridge University Press: Cambridge, UK, 2010. [Google Scholar]
  26. Pfiffner, L.; Luka, H.; Jeanneret, P.; Schupbach, B. Effects of ecological compensation areas on the carabid fauna. Agrarforschung 2000, 7, 212–217. [Google Scholar]
  27. Franin, K.; Barić, B.; Kuštera, G. The role of ecological infrastructure on beneficial arthropods in vineyards. Span. J. Agric. Res. 2016, 14, 0303. [Google Scholar] [CrossRef] [Green Version]
  28. Aviron, S.; Herzog, F.; Klaus, I.; Luka, H.; Pfiffner, L.; Schupbach, B.; Jeanneret, P. Effects of Swiss agri-environmental measures on arthropod biodiversity in arable landscapes. Asp. Appl. Biol. 2007, 81, 101–109. [Google Scholar]
  29. Pérez-Bote, J.L.; Romero, A.J. Epigeic soil arthropod abundance under different agricultural land uses. Span. J. Agric. Res. 2012, 10, 55–61. [Google Scholar] [CrossRef] [Green Version]
  30. Molina, G.A.; Poggio, S.L.; Ghersa, C.M. Epigeal arthropod communities in intensively farmed landscapes: Effects of land use mosaics, neighbourhood heterogeneity, and field position. Agric. Ecosyst. Environ. 2014, 192, 135–143. [Google Scholar] [CrossRef]
  31. Stout, J.; Finn, J.A. Recognizing the value of insects in providing ecosystem services. Ecol. Entomol. 2015, 40, 1–2. [Google Scholar] [CrossRef] [Green Version]
  32. Klein, A.-M.; Vaissière, B.E.; Cane, J.H.; Steffan-Dewenter, I.; Cunningham, S.A.; Kremen, C.; Tscharntke, T. Importance of pollinators in changing landscapes for world crops. Proc. R. Soc. B Biol. Sci. 2007, 274, 303–313. [Google Scholar] [CrossRef] [Green Version]
  33. Bartomeus, I.; Bosch, J. Pérdida de polinizadores: Evidencias, causas y consecuencias. Ecosistemas 2018, 27, 1–2. [Google Scholar] [CrossRef] [Green Version]
  34. Garibaldi, L.A.; Carvalheiro, L.G.; Vaissière, B.E.; Gemmill-Herren, B.; Hipólito, J.; Freitas, B.M.; Ngo, H.T.; Azzu, N.; Sáez, A.; Åström, J.; et al. Mutually beneficial pollinator diversity and crop yield outcomes in small and large farms. Science 2016, 351, 388–391. [Google Scholar] [CrossRef] [PubMed] [Green Version]
  35. Sánchez, J.A.; Carrasco, A.; La-Spina, M.; Ibáñez, H.; Canomanuel, G.; Ortiz-Sánchez, F.J.; Lacasa, A. Edges of natural vegetation to increase the diversity of wild bees in agricultural field margins. IOBC-WPRS Bull. 2014, 100, 117–121. [Google Scholar]
  36. Swift, M.J.; Heal, O.W.; Anderson, J.M. Decomposition in Terrestrial Ecosystems; Blackwell Scientific Publications: Oxford, UK, 1979. [Google Scholar]
  37. Jost, L. Entropy and diversity. Oikos 2006, 113, 363–375. [Google Scholar] [CrossRef]
  38. Jost, L.; González-Oreja, J. Midiendo la diversidad biológica: Más allá del índice de Shannon. Acta Zoológica Lilloana 2012, 56, 3–14. [Google Scholar]
  39. Shannon, C.E.; Weaver, W. The Mathematical Theory of Communication; University of Illinois Press: Urbana, IL, USA, 1949. [Google Scholar]
  40. Aguilera, G.; Roslin, T.; Miller, K.; Tamburini, G.; Birkhofer, K.; Caballero-Lopez, B.; Lindström, S.A.; Öckinger, E.; Rundlöf, M.; Rusch, A.; et al. Crop diversity benefits carabid and pollinator communities in landscapes with semi-natural habitats. J. Appl. Ecol. 2020, 57, 2170–2179. [Google Scholar] [CrossRef]
  41. Valdés, B.; Talavera, S.; Fernández-Galiano, E. Flora Vascular de Andalucía Occidental; Ketreseditora: Barcelona, Spain, 1987. [Google Scholar]
  42. Cabezudo, B.; Cueto, M.; Salazar, C.; Morales Torres, C. Flora Vascular de Andalucía Oriental; Blanca, G., Ed.; Junta de Andalucía, Consejería de Medio Ambiente: Sevilla, Spain, 2009. [Google Scholar]
  43. Pywell, R.; Warman, E.; Hulmes, L.; Hulmes, S.; Nuttall, P.; Sparks, T.; Critchley, C.; Sherwood, A. Effectiveness of new agri-environment schemes in providing foraging resources for bumblebees in intensively farmed landscapes. Biol. Conserv. 2006, 129, 192–206. [Google Scholar] [CrossRef]
  44. Carvell, C.; Meek, W.R.; Pywell, R.F.; Goulson, D.; Nowakowski, M. Comparing the efficacy of agri-environment schemes to enhance bumble bee abundance and diversity on arable field margins. J. Appl. Ecol. 2006, 44, 29–40. [Google Scholar] [CrossRef]
  45. Thomas, C.; Marshall, E. Arthropod abundance and diversity in differently vegetated margins of arable fields. Agric. Ecosyst. Environ. 1999, 72, 131–144. [Google Scholar] [CrossRef]
Figure 1. Geographical locations of the eight replicates studied. Scheme of each replication and seed blends and percentage of application in each MFM mixture.
Agronomy 11 02171 g001
Figure 2. Sowing and appearance percentages in sown MFM. Diagonal line is 1:1 ratio.
Agronomy 11 02171 g002
Figure 3. Abundance of unwanted species in the MFM, on each farm and at a general scale. Different letters (A, B, C) show significant differences in the analysis of variance obtained in the different margins through the LSD test (p ≤ 0.05).
Agronomy 11 02171 g003
Figure 4. Relationship between the existing biodiversity in sown MFM, in MFM of spontaneous flora and in attached crops, on a general scale. Different letters (A, B, C) show significant differences in the analysis of variance obtained through the LSD test (p ≤ 0.05).
Agronomy 11 02171 g004
Figure 5. Biodiversity of the arthropods captured on the flora of the margins, on each farm and on a general scale. Different letters (A, B, C) show significant differences in the analysis of variance obtained in the different margins through the LSD test (p ≤ 0.05).
Agronomy 11 02171 g005
Table 1. Main characteristics of the species with the best implantation in the studied margins.
SpeciesFamilyFlower Color
Borago officinalisBoraginaceaeBlue
Glebionis coronariumAsteraceaeWhite-yellow
Coriandrum sativumApiaceaeWhite
Sinapis albaBrassicaceaeYellow
Trifolium resupinatumFabaceaePink
Vicia sativaFabaceaePurple
Table 2. Spontaneous flora species found on the margins.
SpeciesFamily
Bromus diandrusPoaceae
Bromus rubensPoaceae
Centaurea dilutaAsteraceae
Chenopodium albumChenopodiaceae
Convolvulus arvensisConvolvulaceae
Conyza sp.Asteraceae
Helminthotheca echioidesAsteraceae
Lactuca serriolaAsteraceae
Lavatera creticaMalvaceae
Lolium rigidumPoaceae
Malva hispanicaMalvaceae
Papaver rhoeasPapaveraceae
Phalaris paradoxaPoaceae
Ridolfia segetumApiaceae
Scolymus hispanicusAsteraceae
Silybum marianumAsteraceae
Sonchus oleraceusAsteraceae
Table 3. Number of different morphospecies appearing in each type of margin on the studied farms at the three sampling dates and on average.
MFMFebruary 2019May 2019October 2019Average
ADVEN711109
HONEY6151311
ENVIR7131211
MAKED8161212
Table 4. Pollinating species numbers appeared in the implanted margins.
FamilyOrderNumber of Species
HalictidaeHymenoptera6
SphecidaeHymenoptera1
ApidaeHymenoptera12
AndrenidaeHymenoptera11
VespidaeHymenoptera2
MegachilidaeHymenoptera3
CrabronidaeHymenoptera3
ScoliidaeHymenoptera2
ColletidaeHymenoptera2
IchneumonidaeHymenoptera2
BombyliidaeDiptera6
MuscidaeDiptera1
SyrphidaeDiptera6
TachinidaeDiptera1
CalliphoridaeDiptera2
TabanidaeDiptera1
CetoniidaeColeoptera5
CantharidaeColeoptera1
CerambycidaeColeoptera3
MeloidaeColeoptera1
MalachidaeColeoptera2
MelyridaeColeoptera1
PieridaeLepidoptera5
HesperidaeLepidoptera1
NymphalidaeLepidoptera6
SphyngidaeLepidoptera1
LycaenidaeLepidoptera5
Table 5. Threatened arthropod species found in the study. IUCN: International Union for Conservation Nature.
Number of SpeciesDegree of Threat
Hymenoptera
1Iberian endemism and included in the IUCN Red List
18Included in the IUCN Red List
2Iberian Endemism
Lepidoptera
1Iberian Endemism
Coleoptera
2Iberian Endemism
1Andalusian Endemism, included in the National Catalog on Threatened Species
Table 6. Qualitative Summary of the most important aspects of the MFM. Different letters (A, B, C) show significant differences in the analysis of variance obtained through the LSD test (p ≤ 0.05).
Monitored
Appearance
ADVENHONEYENVIRMAKEDFp
Reduction in unwanted floraCBAAB10.950.0009
Biodiversity of soil arthropod faunaCBCBA15.560.0018
Pollinator biodiversityBABB8.460.0027
Publisher’s Note: MDPI stays neutral with regard to jurisdictional claims in published maps and institutional affiliations.

