Article

Estimating Organ Contribution to Grain Filling and Potential for Source Upregulation in Wheat Cultivars with a Contrasting Source–Sink Balance

by
Carolina Rivera-Amado
1,2,*,
Gemma Molero
1,
Eliseo Trujillo-Negrellos
2,
Matthew Reynolds
1 and
John Foulkes
2
1
CIMMYT International Maize and Wheat Improvement Center (CIMMYT), Carretera Mexico-Veracruz Km.45, El Batan, 56237 Texcoco, Mexico
2
Division of Plant and Crop Sciences, School of Biosciences, University of Nottingham, Leicestershire LE12 5RD, UK
*
Author to whom correspondence should be addressed.
Agronomy 2020, 10(10), 1527; https://doi.org/10.3390/agronomy10101527
Submission received: 24 August 2020 / Revised: 26 September 2020 / Accepted: 30 September 2020 / Published: 8 October 2020
(This article belongs to the Special Issue Photosynthetic Performance and Water-Use-Efficiency in Grasses)

Abstract

:
Grain filling may be limited by the joint source and sink capacity in modern wheat cultivars, indicating a need to research the co-limitation of yield by both photosynthesis and the number and potential size of grains. The extent to which the post-anthesis source may be limiting final grain size can be estimated by partial degraining of spikes, while defoliation and shading treatments can be useful to estimate if any excess photosynthetic capacity exists. In the current study, degraining was applied to a set of 26 elite spring wheat cultivars from the International Maize and Wheat Improvement Center (CIMMYT)’s core germplasm (CIMCOG) panel, while lamina defoliation and shading through stem-and-leaf-sheath covering treatments were applied to a subset of the same cultivars. Responses to source treatments in grain weight, pre-anthesis reserve contribution to grain weight, dry-matter translocation efficiency, and flag-leaf and spike photosynthetic rate were measured and compared to an unmanipulated control treatment. Grain weight responses to degraining among cultivars ranged from no response to increases of 28%, suggesting a range of responses from sink limitation, to probable source and sink co-limitation of grain growth. Grain weight’s response to degraining increased linearly with the years of cultivar release from 1966 to 2009, indicating that the current highest yield potential CIMMYT spring wheats have a co-limitation of grain growth by source and sink. This may have been due to an increase in grain sink strength with years of cultivar release with no commensurate increase in post-anthesis source capacity. The relatively low decreases in grain weight with defoliation compared to decreases in light interception by defoliation indicated that sink limitation was still likely predominating in the cultivars with co-limitation. The stem-and-leaf-sheath covering treatment decreased grain weight by nearly 10%, indicating that stem-and-leafsheath photosynthesis plays a key role in grain growth during grain filling. In addition, pre-anthesis reserve contribution to grain weight was increased by ca. 50% in response to lamina defoliation. Our results showed that increasing the post-anthesis source capacity, through increases in stem-and-leaf-sheath photosynthetic rate during grain filling and pre-anthesis reserve contribution to grain weight, is an important objective in enhancing yield potential in wheat through maintaining a source–sink balance.

1. Introduction

Historically, increases in yield potential have been mainly related to increases in grain m−2 rather than to greater individual grain weight, implying that grain yield in wheat is sink-limited during grain filling [1]. Aisawi et al. [2] reported that grain yield in spring CIMMYT germplasm was associated with grain weight rather than grain m−2; in this case, it appeared that yield potential was still associated with increasing grain sink strength but with potential grain weight rather than grain m−2. Borrás et al. [3] reviewed 18 experiments imposing source manipulation treatments in wheat, including shading, grain removal or spike trimming, defoliation and chemical leaf desiccation, concluding that grains of wheat appeared to grow mostly at saturated assimilate availability, so yield was generally sink-limited in all favorable growing conditions explored in their analysis. Experiments where sink capacity was boosted—in one case by a light treatment [4] and in another study in response to the 7Ag.7DL chromosome translocation [5]—indicated that while source limits grain set pre-anthesis, sink limits realization of photosynthetic capacity post-anthesis. Degraining experiments carried out in wheat by Gaju et al. [6] also indicated sink rather than source limitation during grain filling. Consistent with sink limitation of grain growth, Ahmadi et al. [7] showed that post-anthesis defoliation did not affect grain yield or individual grain weight in one high yielding winter bread wheat cultivar. On the other hand, the strength of post-anthesis sink limitation had been reduced by wheat breeding under Mediterranean conditions, causing modern lines to be limited by both the source capacity and sink capacity, commonly known as a grain growth co-limitation [8]. In this respect, several studies have also shown evidence for co-limitation of grain growth by source and sink during grain filling in modern wheat varieties [2,8,9,10].
There is evidence that yield progress in CIMMYT spring wheat has occurred through enhanced potential grain weight under optimal conditions, as mentioned above [2,11]. These findings indicate that breeders may now need to pay more attention to enhancing photosynthetic capacity pre and post-anthesis, and that simultaneous increases of source size (e.g., pre-anthesis stored carbohydrate reserves and post-anthesis photosynthetic capacity) as well a sink size (grain number per m2 and potential grain weight) are a crucial task in breeding for higher yield potential in modern wheat cultivars. The extent to which the post-anthesis source may be limiting the grain yield of wheat cultivars can be estimated from source–sink manipulation experiments [2,6,12,13]. Co-limitation of grain growth can occur when grain growth is limited by grain sink size in the earlier stage of grain fill and by photosynthetic capacity in the latter stage, and co-limitation is estimated to occur when the grain weight response to de-graining is in the range of ca. 10–30% [8]. Therefore, to achieve full expression of yield potential, it will be necessary to optimize source–sink dynamics by ensuring that expression of grain set matches the photosynthetic potential of current and future genotypes. This will contribute to the identification of lines with a favorable source–sink balance that can be used in physiological strategic crosses aiming to increase yield potential [14]. The source–sink balance is defined as the difference between the potential amount of assimilate available for grain filling and the capacity of the grains to store it [15].
A better understanding of plant organ contribution to post-anthesis photosynthetic capacity is crucial in overcoming source limitation during late grain filling, especially when considering strategies to modify dry matter partitioning among plant organs [16]. The key organs to consider are the leaf lamina, stem, leaf sheath and spike. The contribution of spike photosynthesis in wheat ranges from 10 to almost 80% of the assimilates deposited in grains, depending on cultivar and growing conditions [17,18,19,20,21] with an average of 40% of spike photosynthesis contribution in elite cultivars evaluated under yield potential conditions [22]. In the case of wheat stem-and-leaf-sheath photosynthesis, its contribution to grain filling remains unclear. Simkin et al. [23] recently reviewed existing literature for stem photosynthesis in deciduous green-stemmed species, e.g., the total branch photosynthesis is higher in the summer because of an absence of leaves, outcompeting leaf photosynthesis on an annual basis in Mediterranean shrub Calicotome villosa [24], and considerable photosynthesis was found in the inflated stems of the desert ephemeral Erigonum inflatum, despite the fact that they contained half of the chlorophyll and nitrogen found in leaves [25]—processes that seem particularly relevant under drought stress. The authors suggest that stem photosynthesis may represent a potential novel trait to support enhanced photosynthetic carbon gain. In wheat, Araus and Tapia [26] reported that patterns shown by the rate of net CO2 assimilation were basically similar in flag-leaf blades and leaf sheath irrespective of differences in their absolute values based on relative area and light interception (flag-leaf blade net CO2 uptake was four times greater than in the flag leaf sheath at 2 days after anthesis). Furthermore, they concluded that the role of the leaf sheath in storing and later transporting assimilates to the developing grains seemed to be more important than its photosynthetic function after the onset of senescence occurs. Qin et al. [27] showed that in the bread wheat cultivar Shirane, the peduncle (stem) had a higher photosynthetic rate per unit area than the flag leaf and suggested the leaf sheath attached to the flag leaf would reach similar levels of photosynthesis as the flag leaf.
It is also important to assess any potential capacity of the spike or leaf for upregulation of photosynthesis in relation to increases in grain sink strength. Several studies showed that improved sink strength brings about increases in photosynthesis and radiation-use efficiency during the period of grain filling (e.g., [4,8,28]). Changes in grain sink strength may also affect pre-anthesis dry matter translocation. Serrago et al. [28] showed increased utilization of pre-anthesis reserves in shading treatments during grain filling (decreasing incident radiation by 75% and only on leaves). Therefore, interpretation of grain growth responses to source–sink manipulation treatments which reduce source size must take into account potential compensations of remaining photosynthetic tissues [29], such as the spike or the leaf sheath, and enhanced pre-anthesis dry matter translocation.
In this study, we applied a degraining treatment to a set of 26 spring wheat CIMMYT elite cultivars in three years (2011, 2012 and 2013), and two subsets of cultivars were selected for more detailed source manipulation treatments (defoliation and leaf-sheath covering) in 2013 and 2014. Responses to treatments of grain weight, grains per spike, contribution of pre-anthesis stem reserves to grain weight, and flag-leaf and spike photosynthesis rate were measured and compared to an unmanipulated control treatment. Changes in light interception, green area and coefficient of extinction due to defoliation in the source manipulation treatments were estimated. The objectives were to quantify variation in: (i) grain weight responses to degraining and source sink balance (source, sink or co-limitation), (ii) photosynthetic contributions of leaf laminae and stem + leaf sheath to grain weight, and (iii) potential upregulation of photosynthesis and pre-anthesis reserve contribution and translocation efficiency to grain in response to changes in source availability in CIMMYT elite spring wheat cultivars.

2. Materials and Methods

2.1. Experimental Site and Design

Four field experiments were conducted at the CIMMYT research station (Campo Experimental Norman E. Borlaug; CENEB) in 2010–2011, 2011–2012, 2012–2013 and 2012–2014 (referred to as 2011, 2012, 2013 and 2014, respectively) in the Yaqui Valley near Ciudad Obregon, Sonora (27° N, 110° W; 38 m.a.s.l.), NW Mexico under fully irrigated conditions. The soil type is a coarse sandy clay; mixed montmorillonitic typic caliciorthid, low in organic matter and slightly alkaline (pH 7.7) [30]. Twenty-six spring wheat cultivars were grown in 2011, 2012 and 2013 using a randomized complete block design (RCBD) with two replications in 2011 and three replications in 2012 and 2013. From the initial set of 26 cultivars, a subset of four cultivars was grown in 2014 using an RCBD with three replications. Each plot consisted of two 0.8 m wide raised beds, with two rows per bed (24 cm gap between rows). Plot length was 4 m in 2011, 8.5 m in 2012 and 2013 and 5 m in 2014. The experiments were sown on 6 December 2010, 8 December 2011, 23 November 2012 and 22 November 2013, respectively for 2011, 2012, 2013 and 2014 experiments. The seed rate was on average 110 kg ha−1 in each experimental year (equivalent to ca. 275 seeds m−2) where the previous crop was wheat followed by summer fallow. The plots were irrigated five to six times during the crop cycle at intervals of 3 to 4 weeks in every year. Crop emergence dates were 15 December in 2010, 17 December in 2011, 2 December in 2012 and 1 December in 2013. The first application of nitrogen (N) (50 kg N ha−1) as urea was during land preparation, followed by 50 kg ha−1 of phosphorous (P) as triple super phosphate at sowing. The second application of nitrogen (150 kg N ha−1) as urea was at the time of first irrigation. In all years, Buctril (Bayer AG; a.i. 3, 5-dibromo-4-hydroxybenzonitrile) and Starane (Dow AgroSciences LLC; a.i. fluoroxypyr) were applied as herbicides for broad and narrow leaved weeds, respectively, as required. Folicur (Bayer AG; a.i. tebuconazole) was applied as fungicide three times per season. Muralla (Bayer AG; a.i. imacloprid + betacyfluthrin) was applied as insecticide as required. The 26 spring wheat cultivars were selected from the CIMMYT breeding program, comprising part of the CIMMYT Mexico Core Germplasm (CIMCOG) panel (Supplementary Table S1). Cultivar names are abbreviated in graphs, tables and text as indicated in Supplementary Table S1. The CIMCOG cultivars are mainly modern high yield CIMMYT releases and advanced lines together with a small number of historic releases which have been widely distributed and grown worldwide. Climatic data (mean, maximum and minimum daily air temperature and monthly accumulated solar radiation and precipitation) were collected in all seasons from a weather station located 1–2 km from the field experiments (Supplementary Table S2). Mean air temperature during December (growth stage 10 to 29, [31]) was 0.28 °C cooler in 2013 compared to 2014, and during January to March (growth stage 31 to 75), it was 2 °C cooler in 2013 than in 2014. During late grain filling, mean air temperature was slightly warmer in 2014 (+1.9 °C). Accumulated rainfall during the whole crop cycle was negligible and similar in both years. Solar radiation was very similar across months in both years except for April that had slightly higher mean solar radiation per day in 2013 (24.9 MJ m−2) than in 2014 (20 MJ m−2) (Supplementary Table S2).

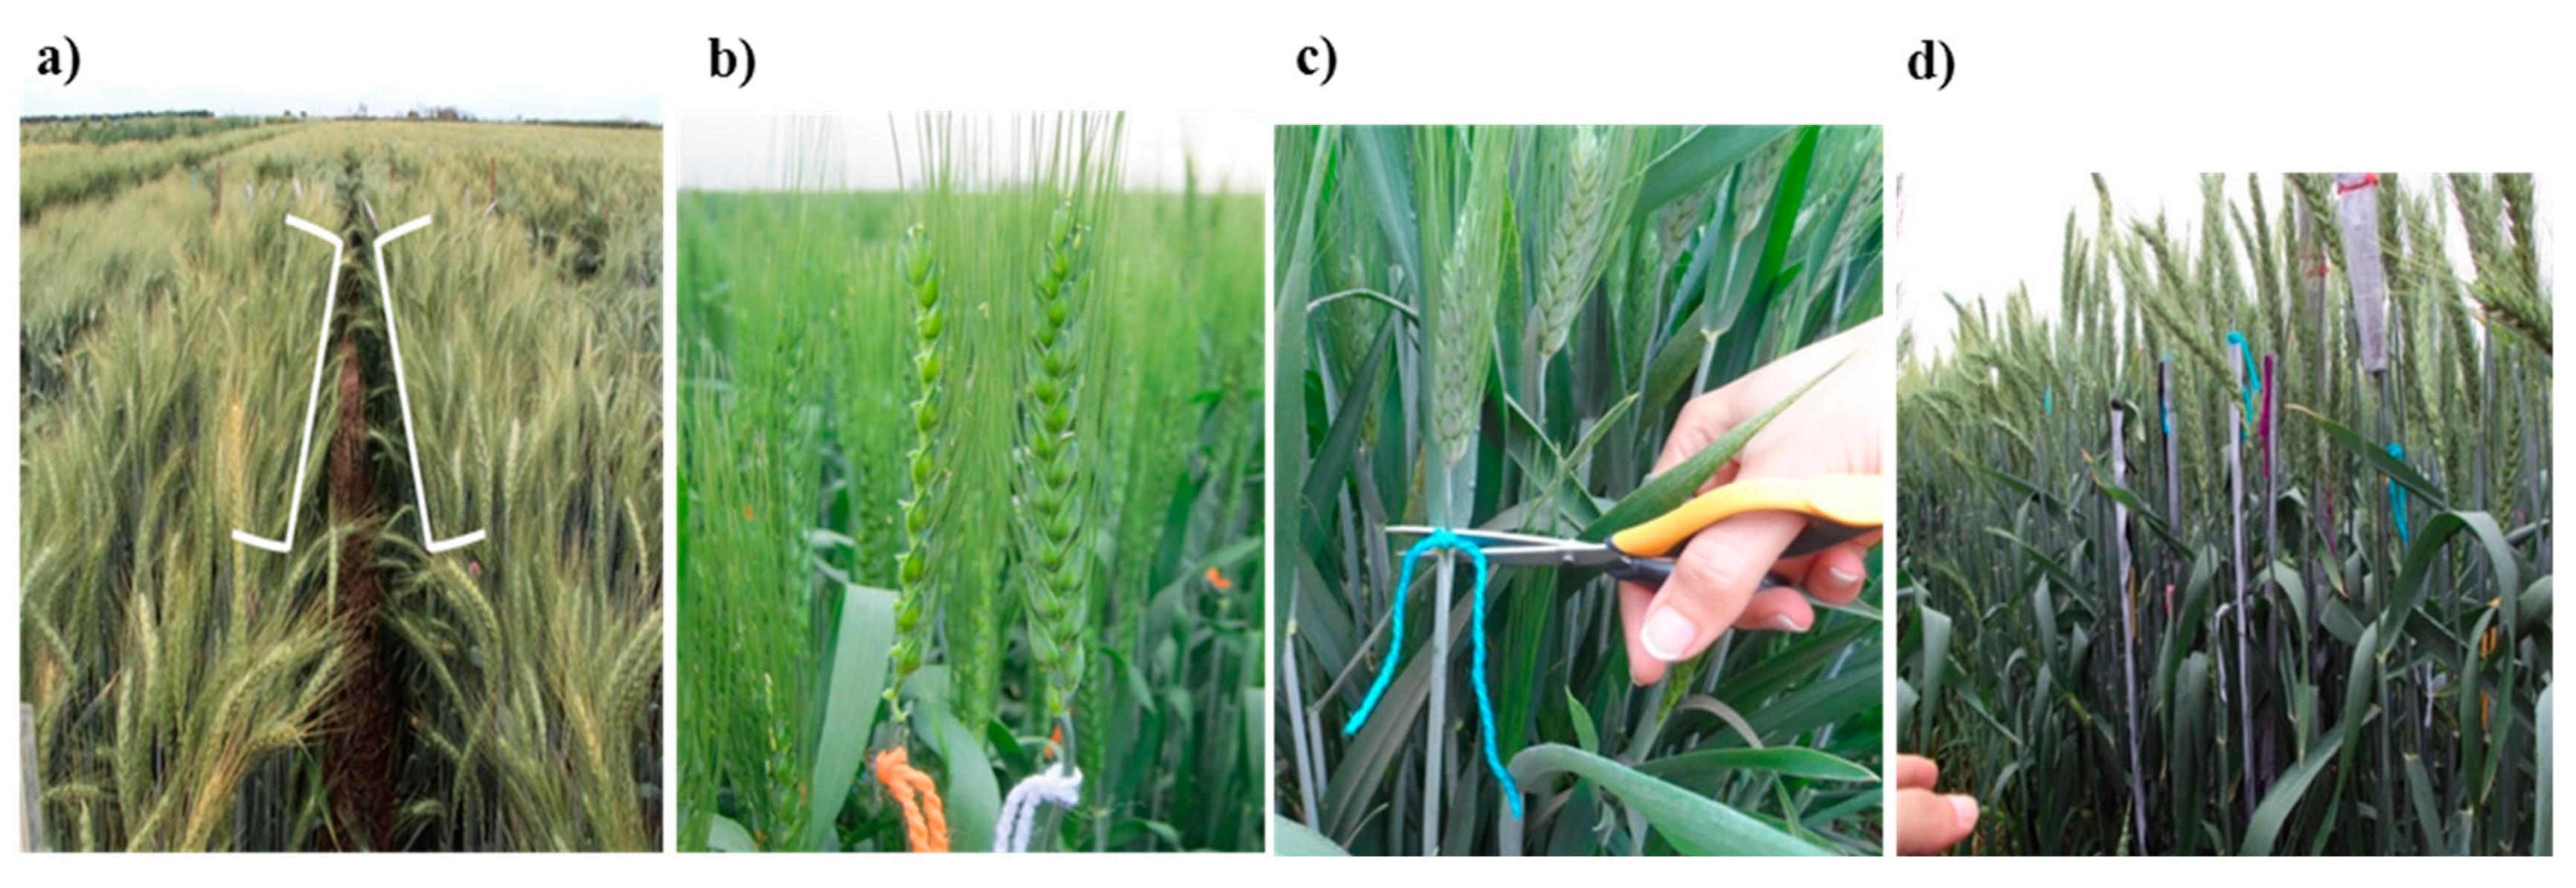
2.2. Source Sink Manipulation Treatments

All source–sink manipulation treatments were applied in 10 spike bearing shoots per plot, harvesting an extra 10 unmanipulated spike bearing shoots per plot as controls in the same plot area. Treatments were applied in the north edge of the plots (Figure 1a) across 2 m plot length at anthesis +10 days (GS65+10d) to allow maximum expression of grain weight potential, given that the cellularization of the endosperm is complete from 4 to 14 days after anthesis and the total number of cells in the endosperm is closely associated with grain weight [32]. To modify the grain sink size, a degraining treatment was applied by removing vertically half of the spikelets (all spikelets down one side of the spike, terminal spikelet not removed; Figure 1b). The degraining treatment was applied in all 26 CIMCOG cultivars in 2011, 2012 and 2013.
To manipulate the source, the following treatments were applied: defoliation (DEF)—consisted of removing the top three leaves (flag leaf, leaf 2 and leaf 3) at the ligule level using a pair of scissors; stem-and-leaf-sheath covering(StemCOV)—pieces of light fabric (black inside, white outside) were attached to shade the exposed stem and leaf sheaths from the spike collar to the base of the stem, leaving all the leaves uncovered in their natural position; stem-and-leaf-sheath covering + defoliation (StemCOVDEF)—consisted of a combination of defoliation (top three leaves) and stem-and-leaf-sheath covering treatments as described above.
Source manipulations took place on a subset comprised of 9 cultivars selected from the initial set of 26 CIMCOG cultivars, based on contrasting dry-matter (DM) partitioning to spikes and stems at anthesis. A second selection from subset 1 was chosen in 2014 (4 cultivars, subset 2) and was selected based on contrasting grain weight response to source manipulation treatments observed in 2013. DEF was applied to subset 1 in 2013 and to subset 2 in 2014. StemCOV and StemCOVDEF were applied to a selection of 3 and 2 cultivars, respectively, in 2013 and to subset 2 in 2014 (Supplementary Table S3). Cross-year analysis (2013 and 2014) of grain weight, grains per spike and contribution and translocation efficiency of pre-anthesis reserves for CTRL and DEF was only conducted for subset 2.
Direct spike and flag-leaf photosynthetic rate measurements (as net CO2 uptake) were taken during grain filling at 20 days after anthesis (GS65+20d) in 2013 and at 15 and 25 days after anthesis (GS65+15d and GS65+25d, respectively) in 2014, using a LI-6400XT portable gas-exchange photosynthesis system (LICOR, Lincoln, NE, USA). The change in stage for photosynthesis measurements across years was made with the aim to capture a wider range of potential responses to manipulation treatments in photosynthesis. Dark respiration of flag leaves and spikes was measured immediately after the photosynthetic measurements. Flag-leaf and spike photosynthetic assimilation rates were also calculated on a per area basis and per organ, the latter by recording the area of leaves and spikes just after the field photosynthesis measurement, using a leaf area meter (LI3050A/4; LICOR, Lincoln, NE, USA). Photosynthetic rate measurements of the flag leaf were carried out under light-saturated conditions (1500 μmol photon m−2 s−1 of photosynthetic photon flux density, PPFD), at a constant temperature of 30 °C and [CO2] of 400 µmol. The measured gas-exchange parameters were light-saturated net CO2 assimilation rate, transpiration and stomatal conductance. Spike photosynthetic rate was estimated using a hand-made chamber connected to the LI-6400XT, placing the spikes inside the chamber and passing air at a rate of 1 L min−1 through the chamber. Molar fractions of CO2 assimilated by the spike and humidity were measured with the infra-red gas analyzer (IRGA) of the LI-6400XT as described by Molero and Reynolds [22]. To ensure steady-state conditions inside the chamber, the system was left to stabilize for 2–5 min. An external light source composed of LED lights was placed around the chamber during the measurement, achieving a saturating PPFD of approximately 1200 μmol m−2 s−1 inside the chamber. For dark respiration of the spikes, the PPFD inside the chamber was maintained at 0 μmol m−2 s−1 by covering it with a two-sided blanket (black side on the inside and white on the outside, to avoid overheating). Due to measuring cultivars on different days according to their phenology and weather variations, it was not possible to measure the two stages evenly for all cultivars, treatments and organs in 2014; therefore, factorial analyses of variance are presented when possible.

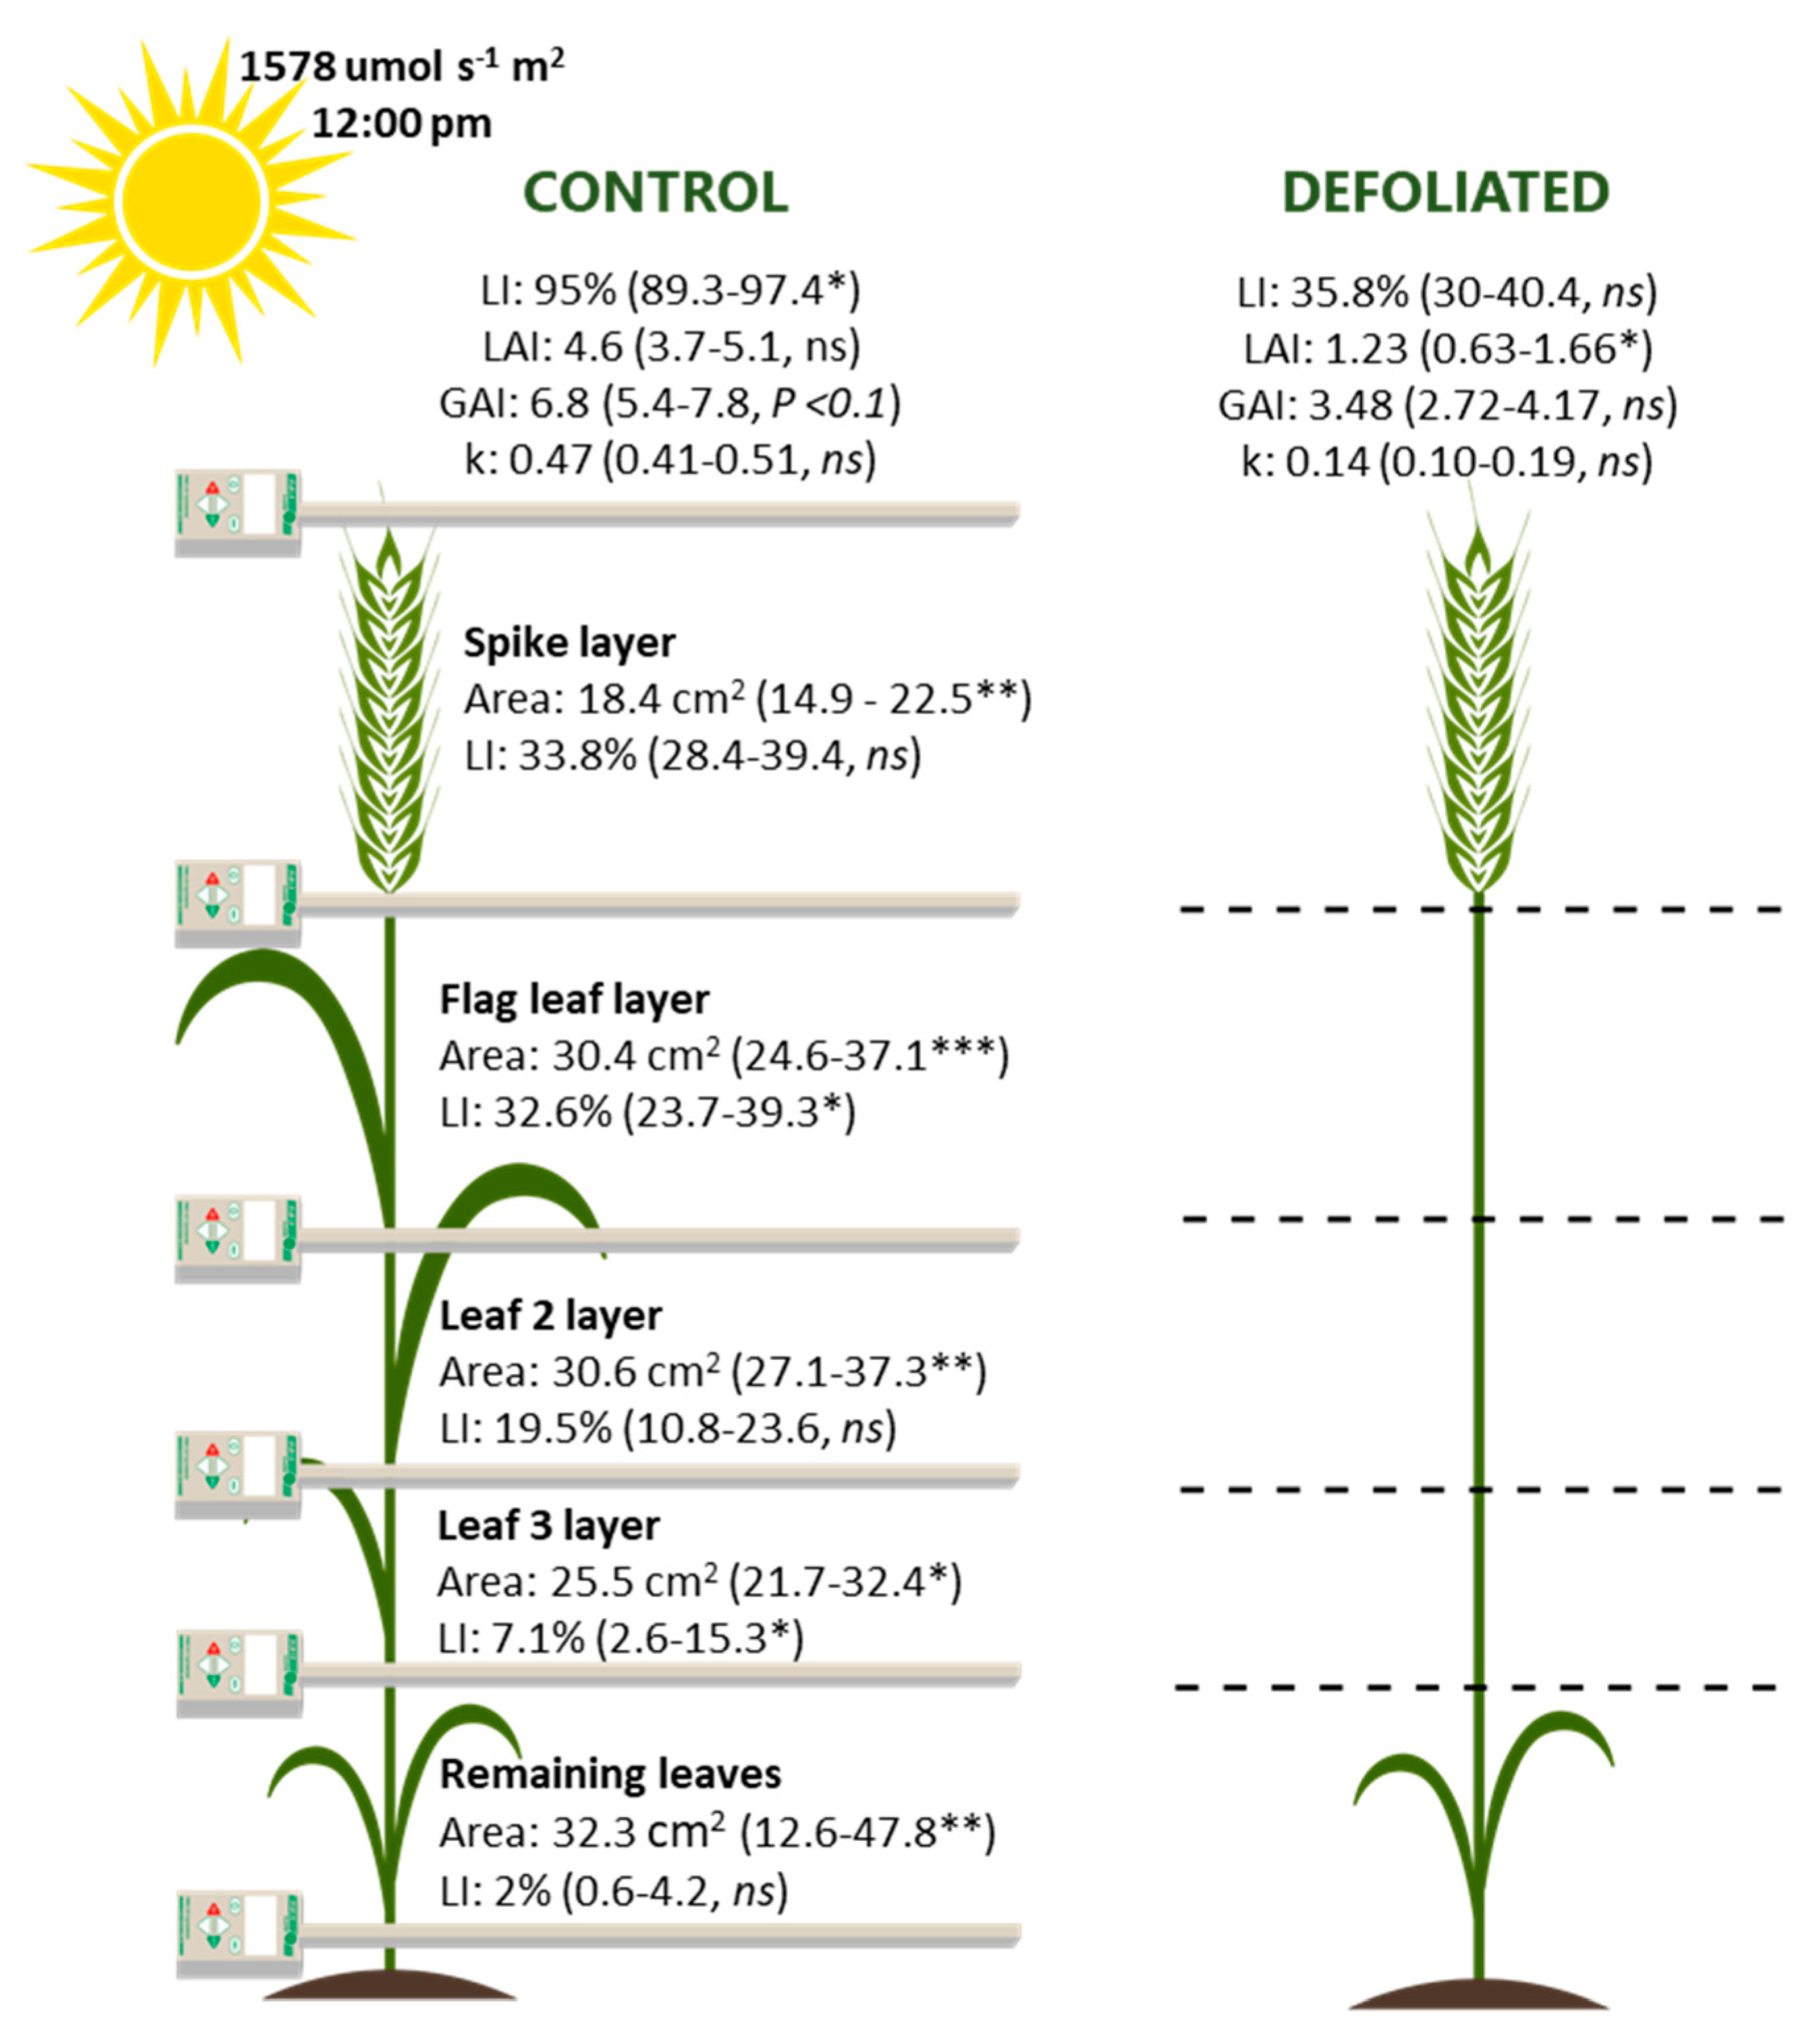
2.3. Crop Measurements

Dates of initiation of onset of anthesis (GS65) and physiological maturity (GS87) (50% of the peduncle with a yellow coloration) were recorded for each plot [31] every year when 50% of the shoots in the plot reached the stage. In all years, plant material was sampled at anthesis +7 days (GS65+7d) in each plot (samples taken on actual date of reaching the stage) in an area of 0.8 m2 (four 50 cm length rows; 1.6 m total width) by cutting at ground level. A sub-sample consisting of 100 shoots was taken and the weight recorded before and after oven drying at 75 °C for 48 h to constant weight. Before oven drying, infertile shoots (those without an emerged spike) were counted in the sub-sample; the remaining shoots were classified as fertile. From that subsample, shoot number per m2 was calculated as suggested by Pask et al. [33]. From the remaining sample, ten randomly selected fertile shoots were separated into: (i) leaf lamina (ii) leaf sheath, (iii) stem and (iv) spike to measure green area (cm2) with a leaf area meter (LI3050A/4; LICOR, Lincoln, NE), in order to calculate and green area index green (GAI) as follows [33]:
G A I = G r e e n   a r e a #   s h o o t   s a m p l e d   ×   #   T i l l e r s   m 2 #   s h o o t s   s a m p l e d 10000
The fraction of radiation intercepted at GS65+7d was measured in 2013 and 2014 (subset 1 and 2, respectively) using a ceptometer AccuPAR model LP-80 (Decagon Devices, Inc. 2365 NE Hopkins Ct. Pullman, WA 99163, USA). Three transversal readings per plot were taken at different plot locations within the plot avoiding 50 cm near the plot edges. Ceptometer readings were taken between 11:00 and 14:00 h. Photosynthetically active radiation (PAR) was measured above the canopy, below the spike, below the flag leaf (at ligule), below the second leaf, below the third leaf and at ground level. Readings of the reflected PAR were taken by inverting the ceptometer approximately 10 cm above the crop. Total fractional interception (f) of PAR (400–700 nm) was calculated by using Equation (2).
f = 1 T r a n s m i t e d   P A R + R e f l e c t e d   P A R I n c i d e n t   P A R
Fractional interception at different strata (spike, leaf 2, leaf 3, and remaining leaves) was calculated as follows: f spike = (Incident PAR − Reflected PAR) − Transmitted PAR below spike; f flag leaf = Transmitted PAR below spike − Transmitted PAR below flag leaf; f leaf 2 = Transmitted PAR below flag leaf − Transmitted PAR below leaf 2; f leaf 3 = Transmitted PAR below leaf 2 − Transmitted PAR below leaf 3 and f remaining leaves = Transmitted PAR below leaf 3 − Transmitted PAR at ground level. A modified version of Beer’s law was used to determine the extinction coefficient, K, using Equation (3).
K = ln ( I Io ) / GAI
where Io is incident radiation, I is the amount of radiation transmitted at ground level, and GAI is the ratio of crop green area to ground surface area. K and GAI were estimated for DEF treatment using the same equations with no consideration of the area of the top three leaves areas.
At physiological maturity (GS87), manipulated and control shoots were sampled from the experimental plots in the field by cutting at ground level. The shoots were separated into the following components: (i) spikes, (ii) true stem and (iii) leaf sheath. The spikes were threshed, and the grains per spike were counted. These components (bulked for the 10 shoots) were oven dried for 48 h at 75 °C in order to determine their DM. Grain responses to the manipulation treatments were calculated as DM losses or gains in relation to the control. As an estimate of C remobilization to the grains, stem DM translocation (DMT) was calculated as the difference between stem DM (true stem + leaf sheath) at seven days after anthesis (GS65+7d) and physiological maturity (GS87) [29]. DM translocation efficiency (DMTe, %) and the percentage contribution of stem pre-anthesis reserves to grain yield (CPA, %) were calculated as in Álvaro et al. [9]:
D M T e   = D M T D M G S 65 + 7 × 100
C P A = D M T G W s p i k e × 100
where DMGS65+7 is the DM per shoot at seven days after anthesis, and GWspike is the total grain weight per spike at harvest.
For the 26 cultivars in each year, the grain source–sink balance was calculated as the ratio of green canopy area at GS65+7d (measured in the unmanipulated crop) to grain sink size. Grain sink size was calculated as follows: grain m−2 × PGW g (potential gran weight, estimated as grain weight in the degrained treatment) [15].
Before harvesting, a random sample of 100 fertile shoots was taken at physiological maturity (GS87), cutting shoots at ground level. The plant material was oven dried for 48 h at 75 °C to constant weight and weighed. Then, it was threshed and its grain was collected and weighed. From this lot, 200 grains were randomly counted and weighed. Grain yield was measured in each plot by machine-harvesting an average plot area of 4–5 m2, adjusted to moisture content (ca. 10%). Using these data, harvest index (proportion of above-ground DM as grain), above-ground biomass and yield components at harvest were calculated as indicated by Pask et al. [33].

2.4. Statistical Analysis

Adjusted trait means were calculated for cultivars, individual years and combined years as estimations from a general linear model procedure performed in META-R 6.0 [34]. Cultivars, years, replications and interactions were set as random effects. To investigate the effects of manipulation treatments and cultivar x treatment interactions, manipulation treatments were set as random effects. Treatment means were compared from standard errors of the difference of the means using appropriate degrees of freedom when ANOVA indicated significant differences using the GenStat 18th edition statistical package for windows (https://www.vsni.co.uk/software/genstat; VSN international, Hemel Hempstead, UK). Linear regression analysis was carried out to three year cultivar means for selected traits.

3. Results

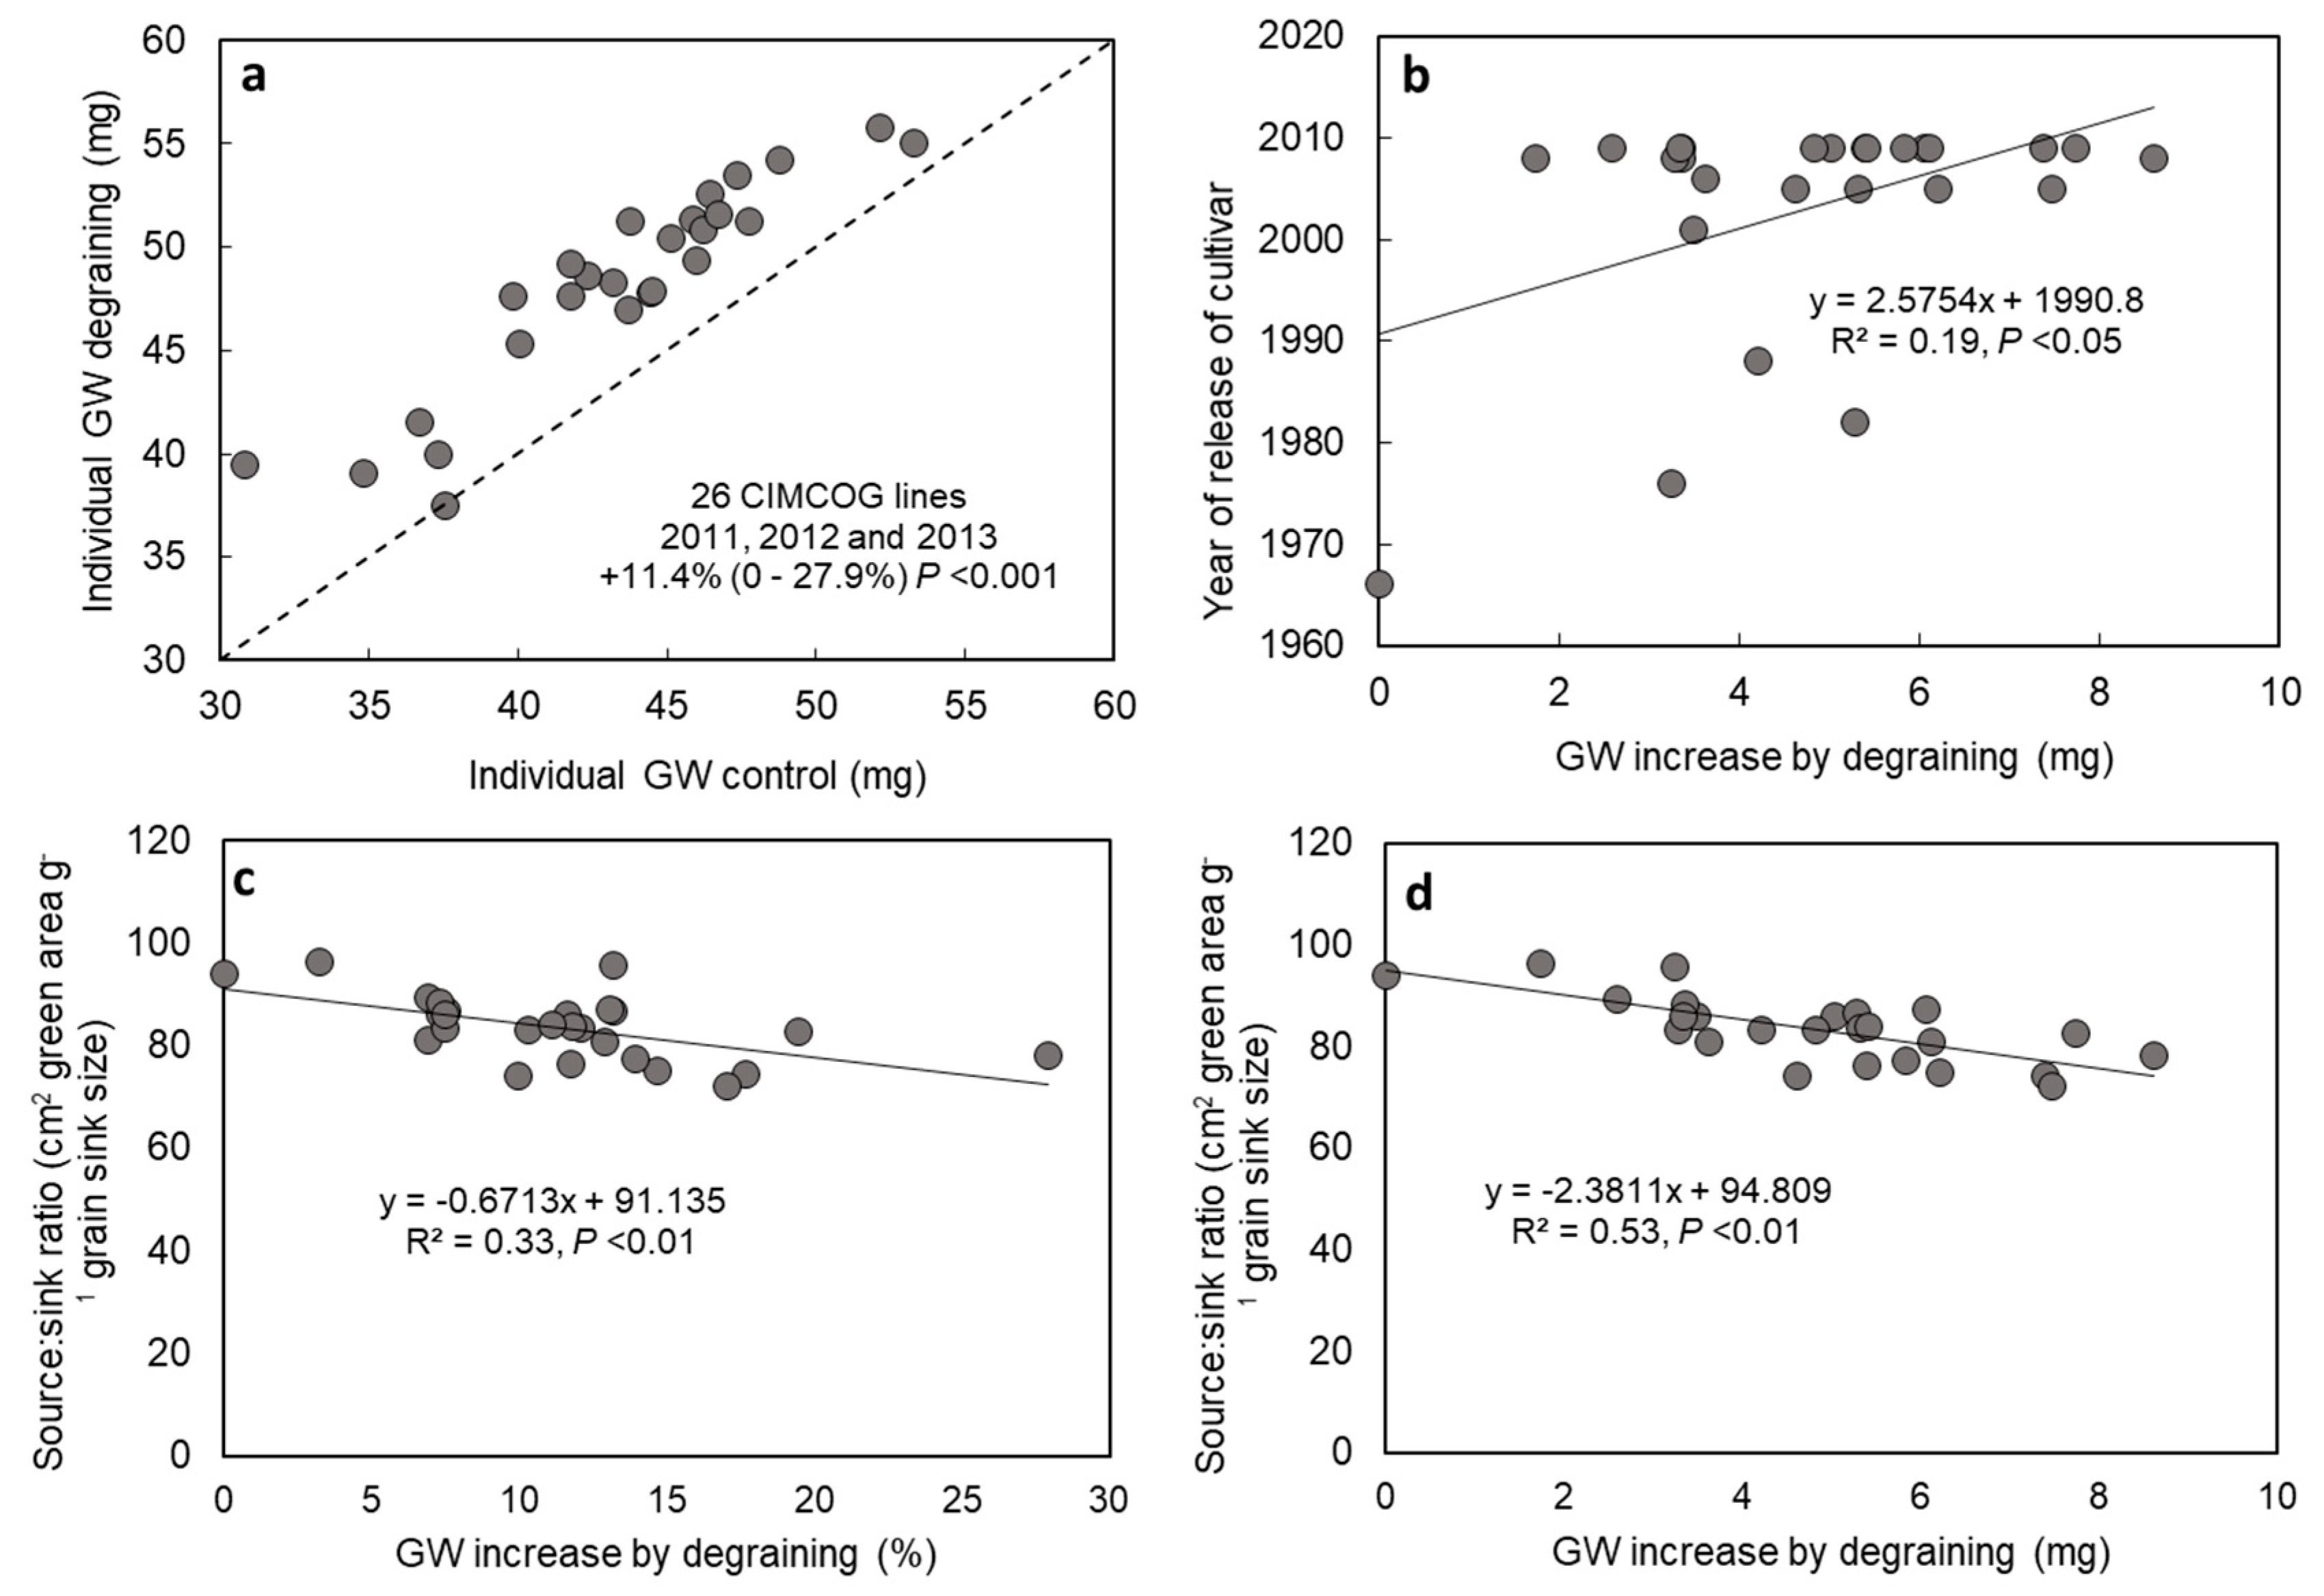
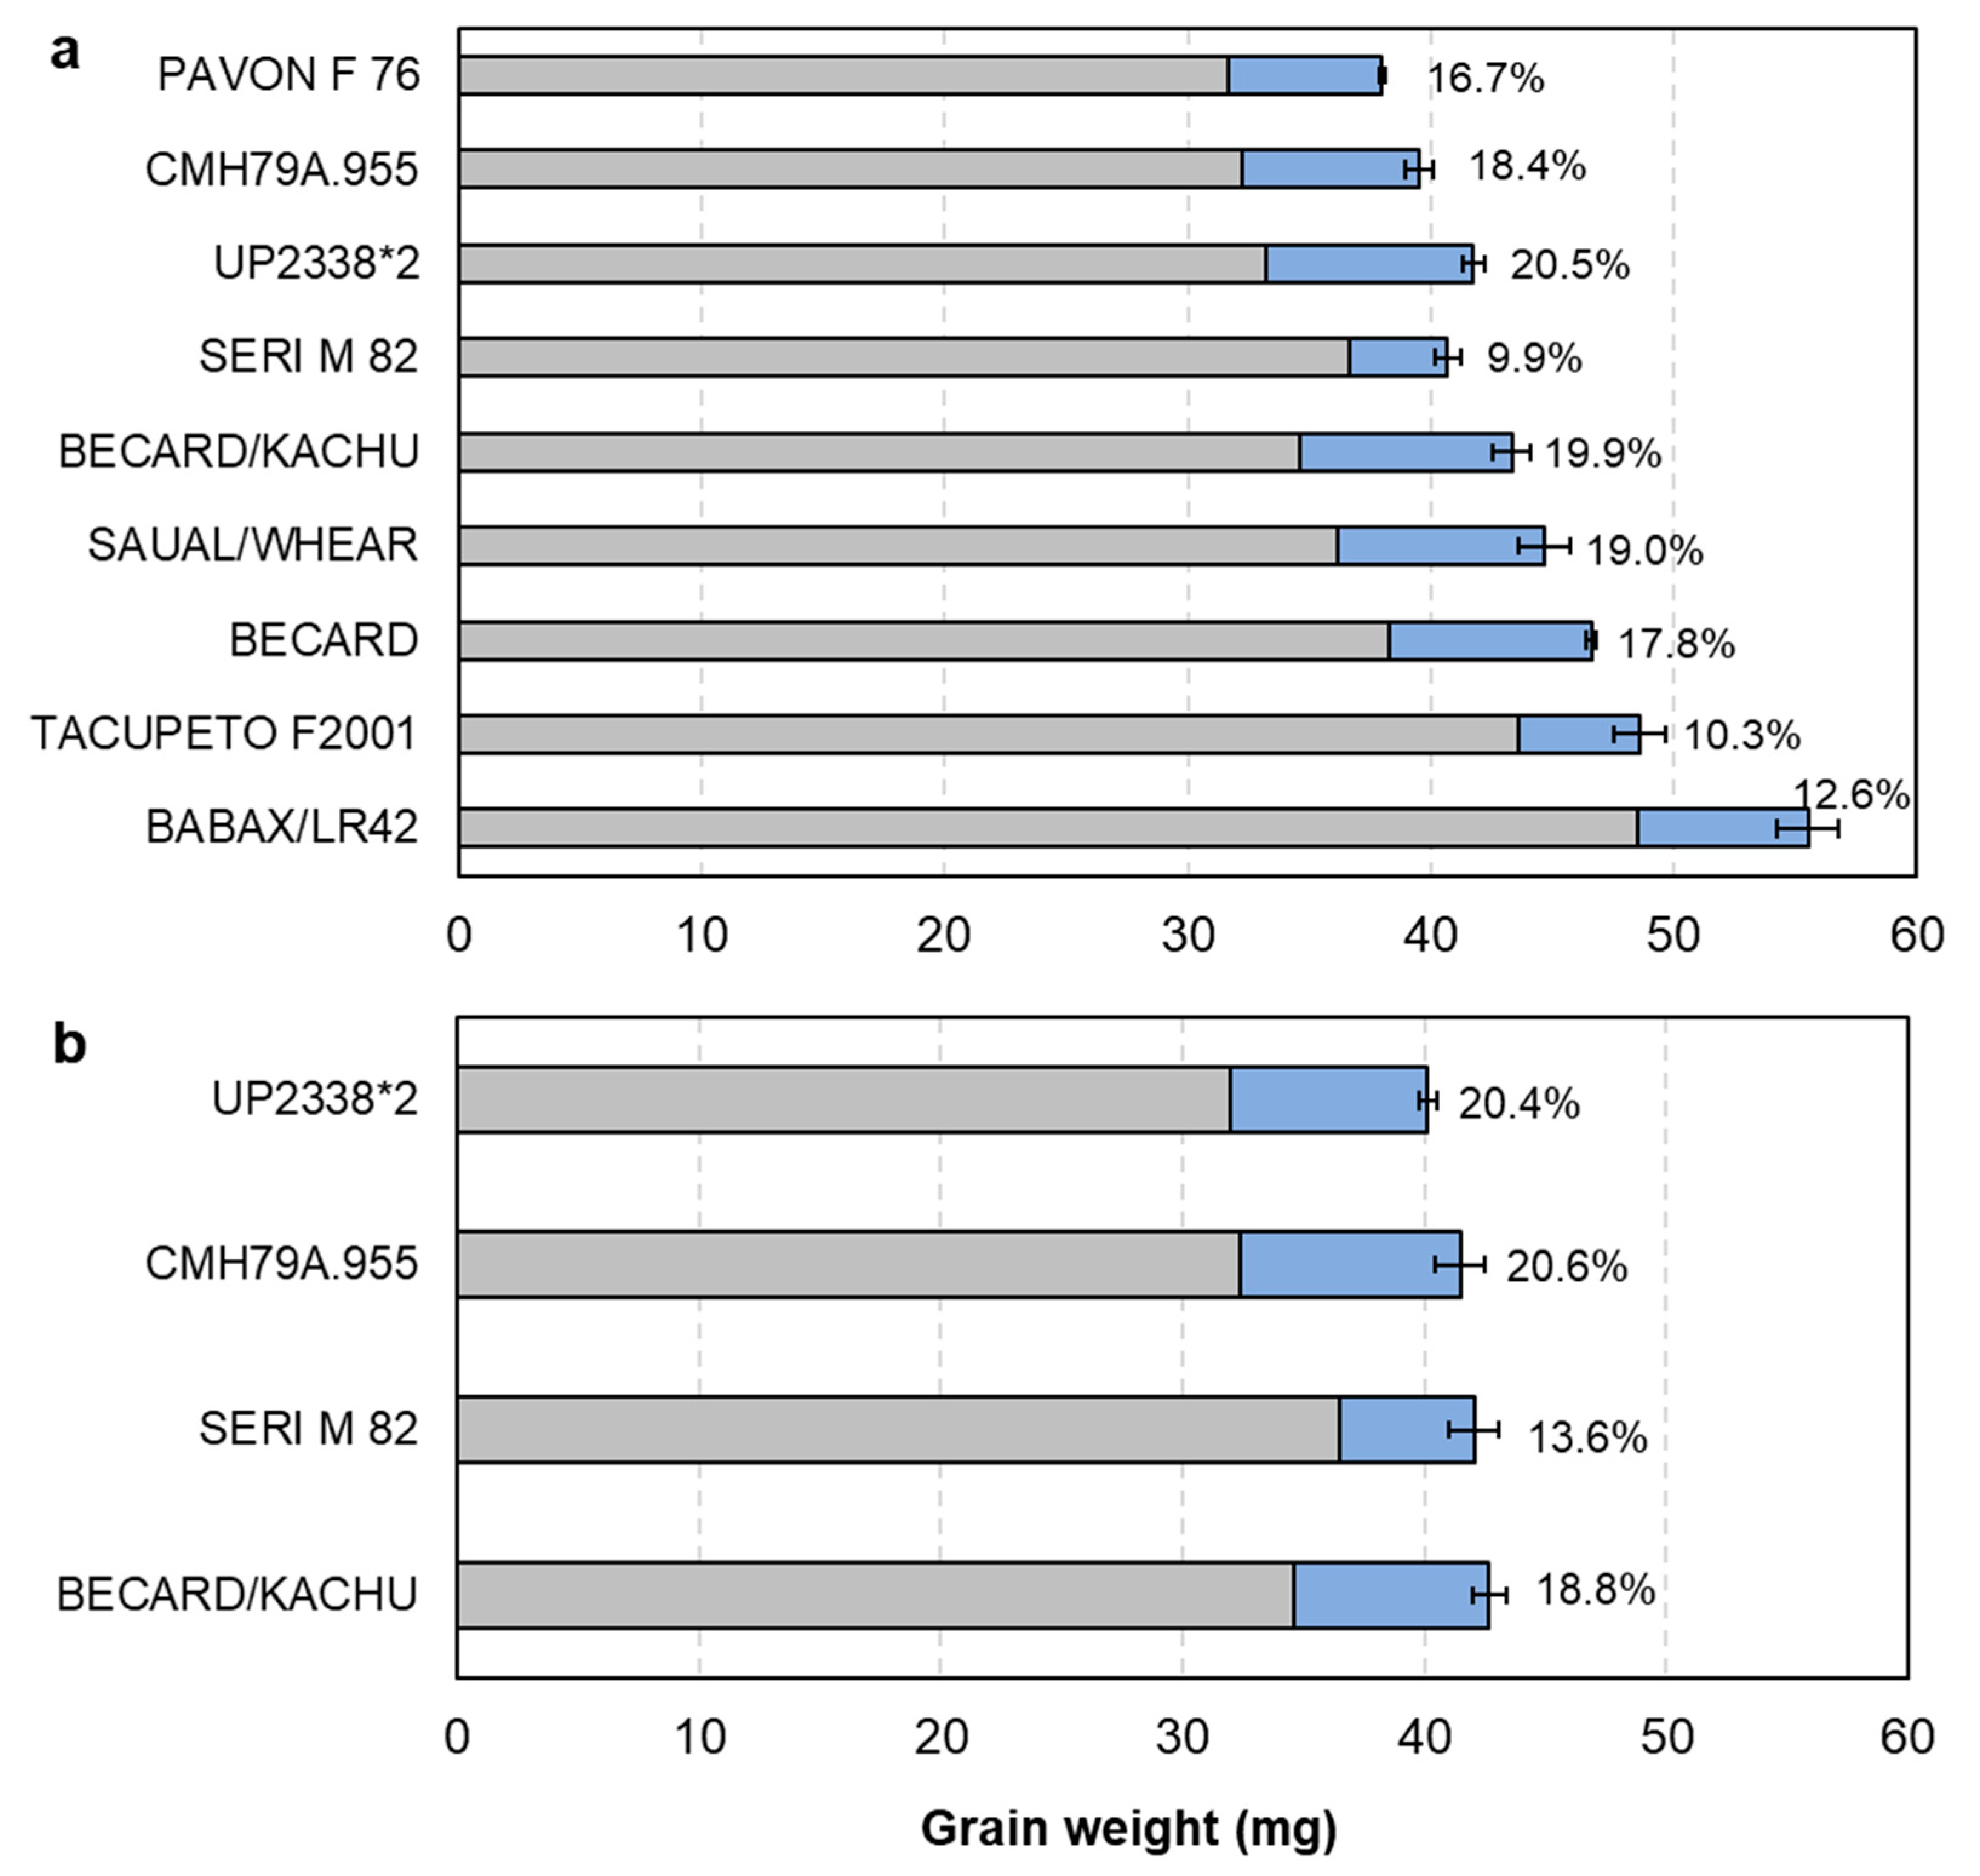
3.1. Source–Sink Balance in Spring Wheat CIMMYT Elite Cultivars (De-Graining Treatments)

Cultivar effects were observed for all yield and yield components across three years (2011, 2012 and 2013) (Table 1; p < 0.001) and also for the cross-year analysis based on two years data (2011 and 2012; 2012 and 2013) for the 26 CIMCOG cultivars (analysis not shown). Means, ranges and statistical analyses for subsets 1 and 2 are presented in supplementary Table S4. There were eight historic cultivars within the CIMCOG panel (Supplementary Table S1). Regressions of harvest traits on year of release (Supplementary Figure S1a) among the eight historic CIMMYT cultivars evaluated in this study showed that genetic gains in grain yield under yield potential conditions were associated with increases in final aboveground biomass and thousand grain weight rather than increases in grain m−2.
Grain weight responses to the degraining treatment applied at GS65+10d are shown in Figure 2a. Grain weight responses from 0 to 10% indicate grain growth is sink limited during grain filling, and from 10–30% would indicate co-limitation by source and sink [8]. Averaging over the three years and the 26 cultivars, grain weight increased in response to degraining by 5.6 mg (11.4%) (p < 0.001). Grain weight response to degraining ranged amongst the 26 cultivars from 0.0 mg (0%) to 8.6 mg (27.9%) (p < 0.001; Figure 2a). There was a trend for grain weight response to degraining (increase by degraining relative to control) to be positively associated with year of release (R2 = 0.19, p < 0.05; Figure 2b).
Overall, a negative linear association was found amongst the 26 cultivars between the percentage of grain weight response to degraining and the source–sink balance (R2 = 0.33, p < 0.001; Figure 2c). There was also a negative association between the absolute grain weight response to degraining (as increase in grain weight by degraining relative to control, mg) and the source–sink balance (R2 = 0.53, p < 0.001; Figure 2d). Thus, higher grain weight response to degraining (indicating more source limitation of grain growth) was associated with a lower source–sink balance (indicating lower source in relation to sink size). There was also a negative association between thousand grain weight and the percentage response to degraining (R2 = 0.21, p < 0.05, Supplementary Figure S2a) and a positive one between grain m−2 and the percentage response to degraining (R2 = 0.36, p < 0.01, Supplementary Figure S2b).

3.2. Organ Contribution to Grain Growth and Post-Anthesis Photosynthetic Capacity

Reductions in light interception (%), leaf area index, green area index and the coefficient of extinction (k) due to defoliation (top-three leaves, DEF) were estimated based on subset 1 (9 cultivars) in 2013 (Figure 3). We estimated that light interception was reduced from 95.0% in control shoots (CTRL) to 35.8% in DEF shoots (measured at midday), leaf area index from 4.6 in CTRL to 1.2 in DEF, green area index from 6.8 (CTRL) to 3.5 (DEF), and k from 0.47 (CTRL) to 0.14 (DEF) at anthesis +7 days (GS65+7). Although spike area (18.4 cm2, p < 0.01) was lower than flag-leaf area (30.4 cm2, p < 0.001) per shoot, stratified measurements of light interception in the unmanipulated crop showed that the spike and the flag-leaf strata accounted for an approximately equal amount of light interception (33.8%, p = 0.505 and 32.6%, p < 0.05, respectively). The remaining leaf strata (leaf 2, leaf 3 and remaining leaves) had similar areas but accounted for less light interception than the flag leaf due to greater depth in the canopy (Figure 3). Overall, green area per shoot was reduced from 137.2 cm2 to 50.7 cm2 averaging across subset 1 cultivars due to defoliation of the top three leaves.
Absolute grain weight reductions (mg) and responses (%) due to defoliation are summarized in Figure 4 for subset 1 (9 cultivars, 2013, Figure 4a) and subset 2 (four cultivars, 2013 and 2014 combined data, Figure 4b). Grain weight was significantly different between treatments (CTRL and DEF) (p < 0.001 for both subsets) with no year effect (p = 0.086) and no significant treatment by cultivar interactions. The average grain weight response to DEF (% reduction relative to control) was 16.1% across subset 1 (p < 0.001) in 2013 and 18.4% across subset 2 (p < 0.05) from combined analysis of 2013 and 2014. The historic CIMMYT cultivar SERI M82 tended to have the lowest grain weight response to DEF across subset 1 and 2 (9.9% and 13.6%, respectively). The biggest grain weight response to DEF was observed in cultivar UP2338*2 in subset 1 (20.5%) and CMH79A.955 in subset 2 (20.6%), very close to UP2338*2 in subset 2 which showed a 20.4% reduction in grain weight by DEF. Grain weight response ranges were narrower in subset 2. There were significant cultivar effects for grain weight response to DEF in subset 1 (9 cultivars, 2013, p < 0.001) and in subset 2 (four cultivars, 2013 and 2014, p < 0.05).
Grain weight responses to StemCOV were similar across the two years (9.6% reduction), ranging from 8.7 to 10.8% in 2013 for 3 cultivars and from 7.9 to 10.8% in 2014 for subset 2 (Figure 5). There were no significant cultivar differences for grain weight response to StemCOV and StemCOVDEF in both years. Cultivars that showed the highest grain weight reduction in DEF were not necessarily the cultivars showing the highest grain weight reduction in StemCOV. The most severe treatment, StemCOVDEF, showed average grain weight reduction of 31.4% in 2013 for 2 cultivars and 35.7% in 2014 for subset 2. The cultivar with the highest grain weight reduction by StemCOVDEF was BECARD/KACHU in both years, 34.0% in 2013 and 41.1% in 2014.
There was no significant treatment effect for grains per spike for either subset 1 in 2013 or subset 2 in 2014 (Table 2). Treatments were in all cases significantly different for grain weight, except for CTRL-StemCOV in 2013 for two cultivars (p = 0.057). There were no significant cultivar by treatment interactions, except for CTRL-DEF in grain weight for the individual analysis in 2013 for subset 1 (p < 0.01) and subset 2 (p < 0.01) (Table 2).

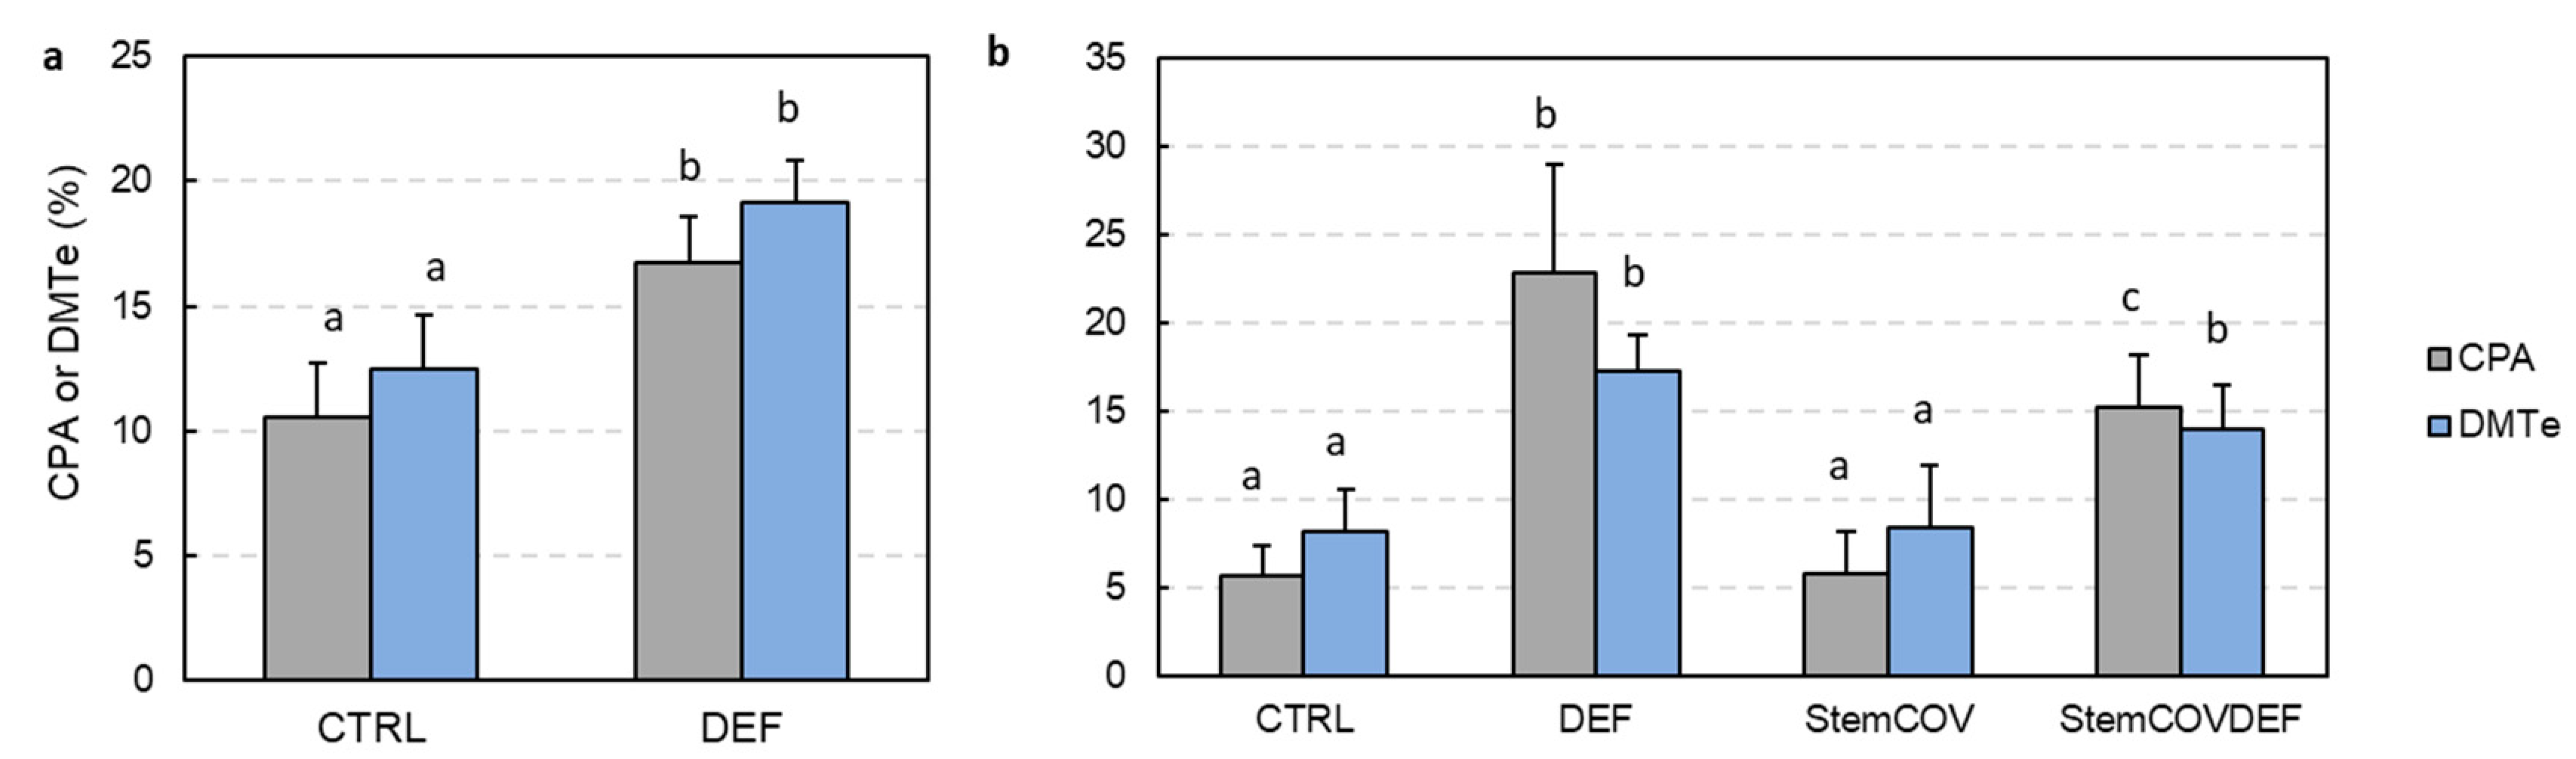
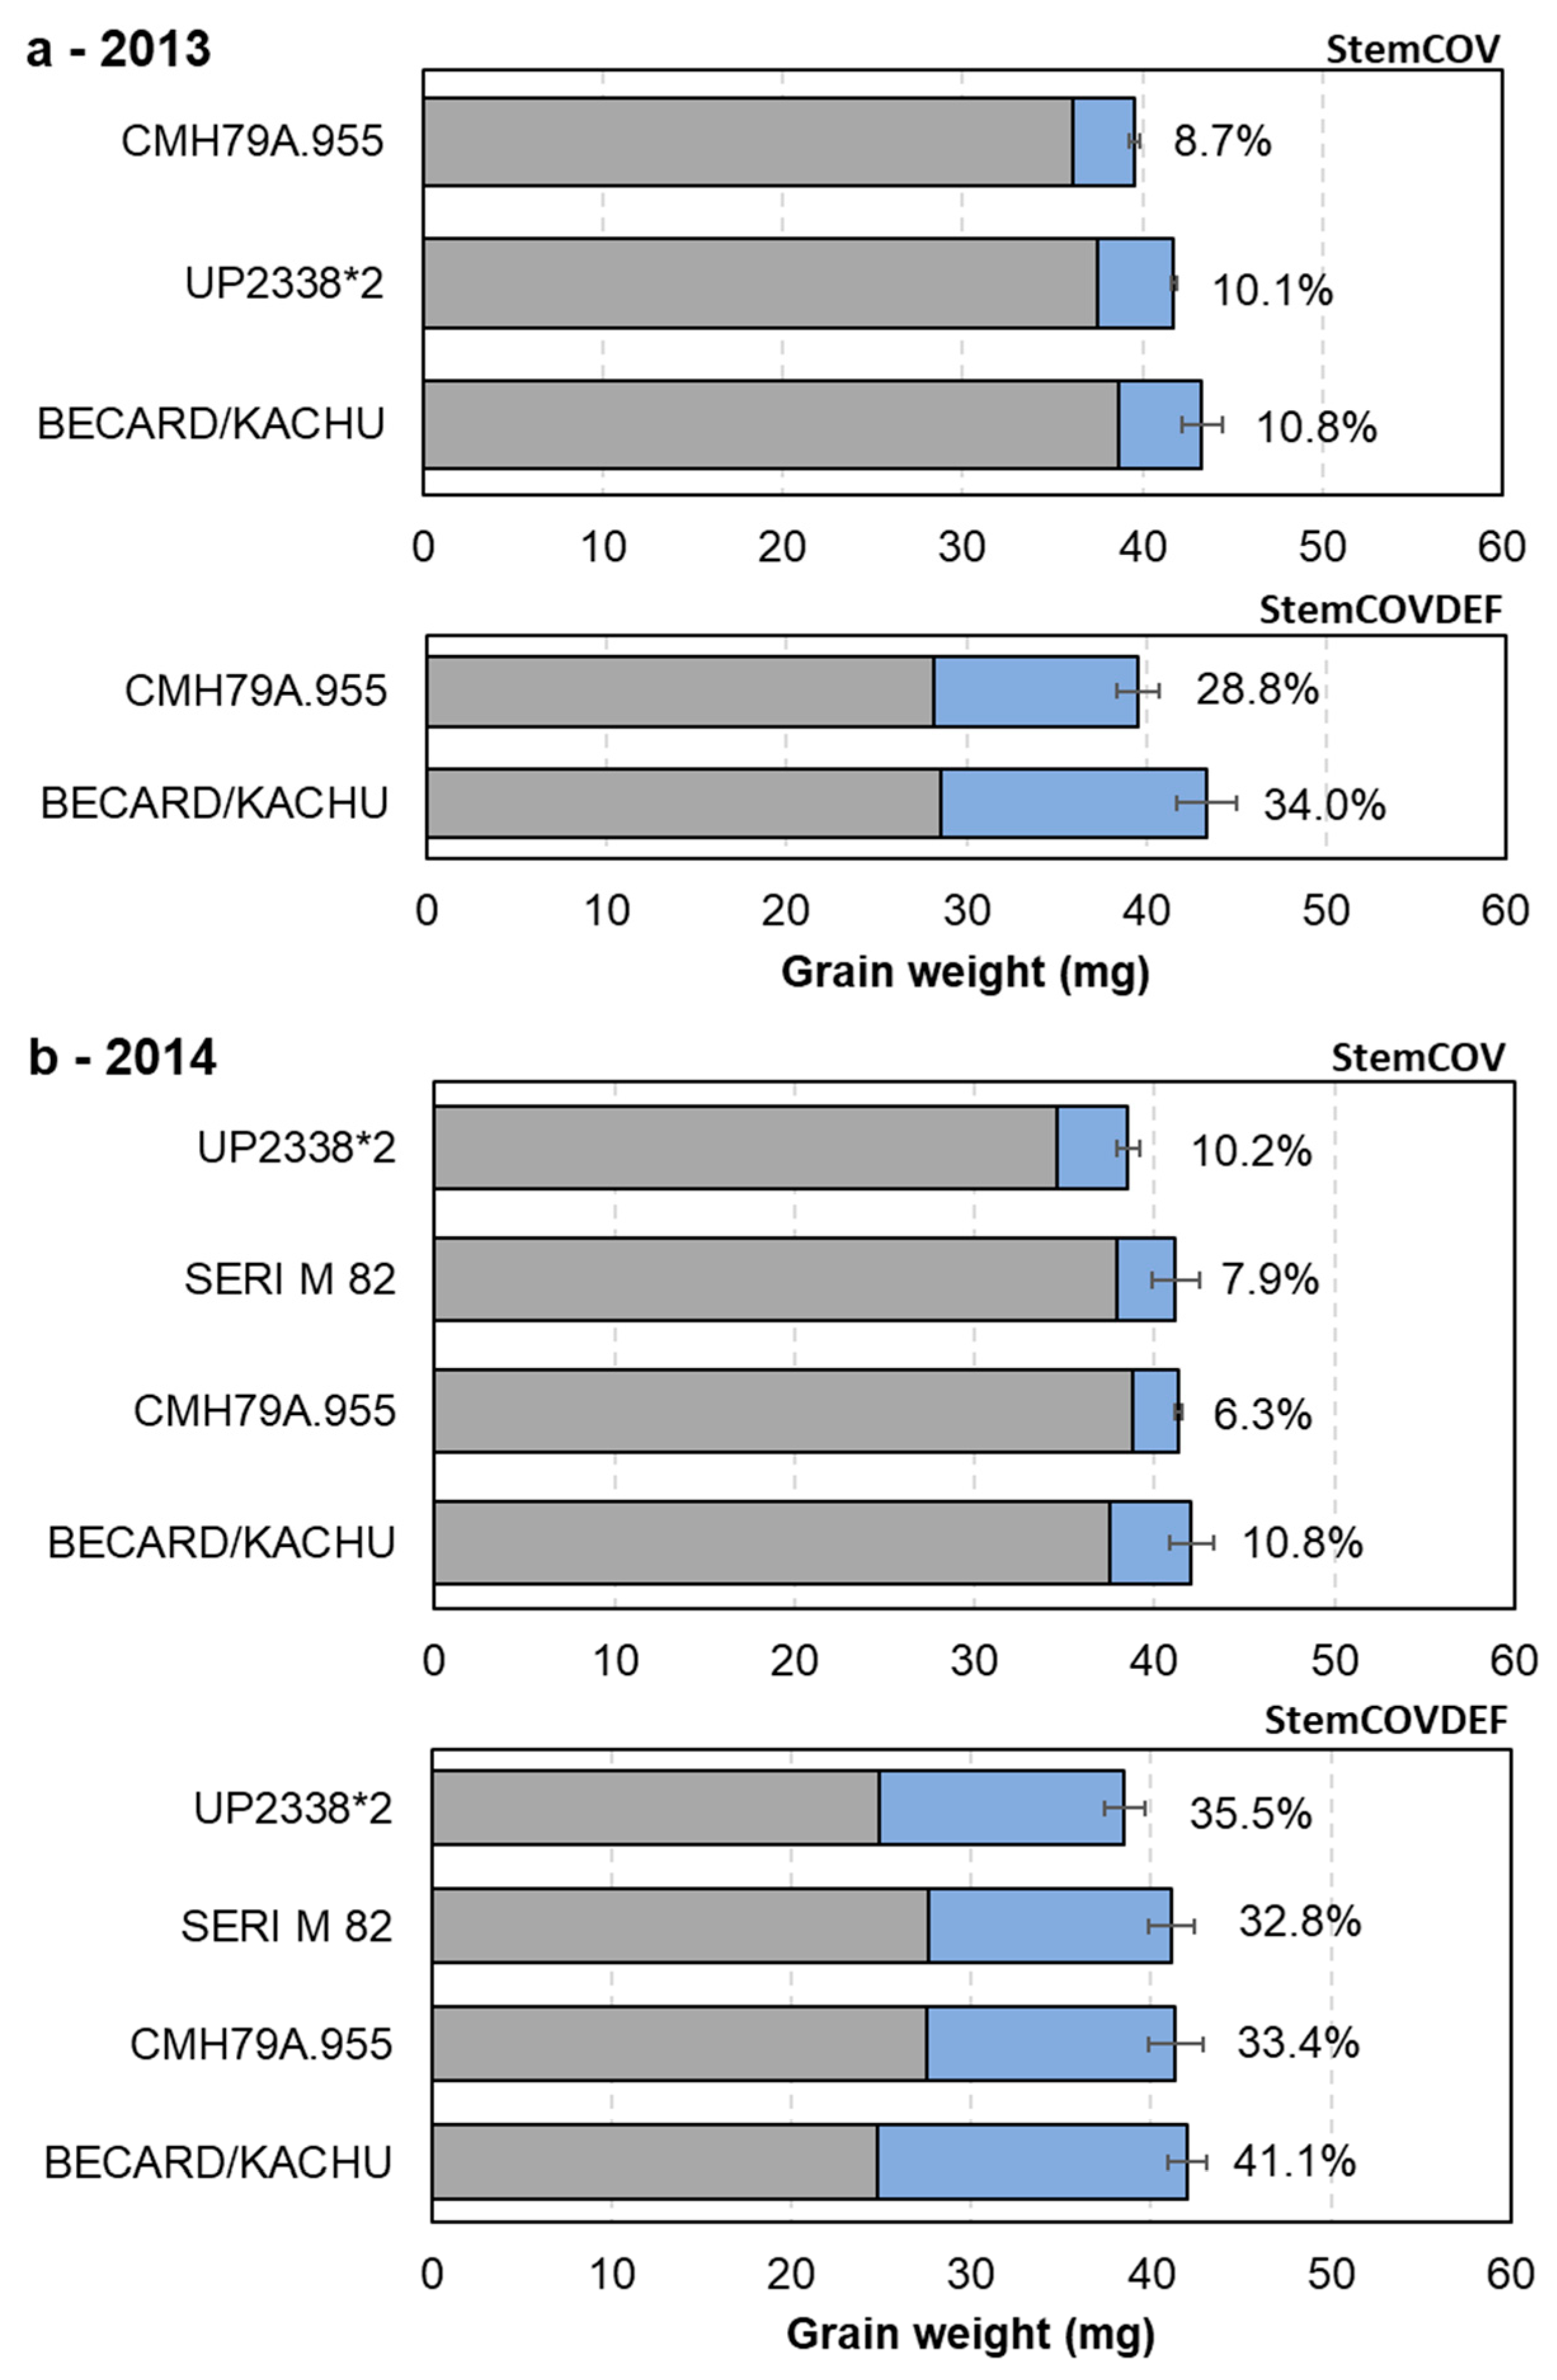
3.3. Upregulation of Photosynthesis and Stem Pre-Anthesis Reserve Remobilization

Measurements of spike and flag-leaf photosynthetic rates were taken at anthesis +20 days (GS65+20d) in 2013 (Table 3) and at 15 and 25 days after anthesis (GS65+15d and GS65+20d, respectively) in 2014 (Table 4). In 2014, spike and flag-leaf absolute photosynthetic rate readings were significantly higher at GS65+15d than at GS65+25d averaging over cultivars. There were no significant differences between CTRL and StemCOV in flag-leaf photosynthetic rates (μmol CO2 m−2 s−1) in both years, although there was a small trend for flag-leaf photosynthetic rate in StemCOV to be upregulated by 8.6% (more than CTRL) for cultivar CMH79A.955 in 2013 (p = 0.477, GS65+20) (Table 3) and cultivar BECARD/KACHU by 17.9% (p = 0.836, GS65+25) in 2014 (Table 4). However, flag-leaf photosynthetic rate (μmol CO2 m−2 s−1) was higher in CTRL than in the rest of the treatments in 2014 (Table 4).
There was no significant cultivar variation for flag-leaf photosynthetic rate in 2013 or 2014. Spike photosynthetic rate did show significant cultivar differences when measured at GS65+15d (p < 0.01 when expressed as μmol CO2 m−2 s−1 and p < 0.001 when expressed as µmol CO2 Organ−1 s−1) and when measured at GS65+25d only when expressed as µmol CO2 Organ−1 s−1 (p < 0.05) in 2014 (Table 4). There were no significant differences among treatments or cultivar x treatment interactions for flag-leaf or spike photosynthetic rates in both years (Table 3 and Table 4).
There were significant differences among treatments (CTRL and DEF) for contribution of pre-anthesis reserves to grain weight (p < 0.05, 59% higher in DEF than CTRL) and among cultivars (p < 0.01), with no year effect nor significant interactions for subset 2 (four CIMCOG cultivars) for the combined analysis of 2013 and 2014 (Figure 6a). DM translocation efficiency to grain weight showed similar trends for the combined analysis of 2013 and 2014 for the CTRL and DEF treatments (p < 0.01 for cultivar, p < 0.01 for treatment) but a significant effect of year (p < 0.01) and was 54% higher in DEF than CTRL. In 2014, comparing all treatments (Figure 6b), the contribution of pre-anthesis reserves to grain weight differed among treatments (p < 0.05) and among cultivars (p < 0.01) with no year effect nor significant interactions for subset 2. The contribution of pre-anthesis reserves to grain weight in DEF and StemCOVDEF was significantly higher than in CTRL, while there was no difference between StemCOV and CTRL. The same trends were observed for DM translocation efficiency to grain weight in 2014.

4. Discussion

4.1. Evidence for Changes in Source–Sink Balance with Plant Breeding

Manipulations in assimilate availability (source sink treatments) can provide indirect evidence on whether yield may be either limited by its source strength, the sink capacity or co-limited by both [3]. Grain growth responses to degraining (where assimilate supply per grain is effectively increased by 100%) of ca. 0–10% are indicative of sink limitation of grain growth, whereas those of ca. 10–30% are indicative of co-limitation of grain growth by sink during the earlier phase of grain filling and by source during the latter phase of grain filling [8]. In this study, the 26 cultivars tested showed contrasting grain weight responses to degraining ranging from 0–28%, indicating a range of responses from sink limitation to source–sink co-limitation of grain growth. Aisawi et al. [2] reported positive grain weight responses from 1 to 13% to a degraining treatment at GS65+14d for 12 CIMMYT spring wheat cultivars released from 1966 to 2009 in NW Mexico. Our results, where the degraining treatment was applied at GS65+10d, showed that grain weight response to degraining increased linearly with year of release from 1966 to 2009, indicating that the extent of sink limitation decreased with plant breeding and that the CIMMYT spring wheats with the current highest yield potential have a co-limitation of grain growth by both source and sink. Therefore, breeders may need to select for traits to enhance post-anthesis source size alongside increasing grain sink size through grain m−2 and potential grain weight.
Calculation of source–sink balance relating canopy green area at GS65+7d to grain sink size further supported the contention that grain yield of modern CIMMYT spring wheat cultivars may be co-limited by source and sink. Overall, the source–sink balance was negatively associated with the grain weight response to degraining amongst the 26 CIMCOG cultivars; therefore, cultivars with higher grain weight response to degraining (more source limitation of grain growth) as expected had a lower source–sink balance (Figure 2c). Grain weight responses to degraining indicated co-limitation of grain growth for 17 cultivars and sink limitation (<10% increase with degraining) for nine cultivars. Our results indicate that the amount of post-anthesis source for modern elite spring wheat cultivars was limiting grain growth in the latter phase of grain filling.

4.2. Contribution of Leaf Laminae and Stem Photosynthesis to Grain Growth during Grain Filling

Even with the removal of most of the photosynthetically active laminae during grain filling (ca. 60% reduction in light interception), the extent of grain weight reduction was moderate (ca. 17%) in the present study. This finding supports previous estimates where flag-leaf photosynthesis contributed an average of 5 to 10% of final grain yield under irrigated conditions [18,21,35,36,37,38] and where the top three leaves contributed approximately 15 to 20% of assimilates partitioned to grains [39,40]. Reductions in grain weight by defoliation differed significantly among the cultivars, ranging from 9.9 to 20.5% in 2013 among nine CIMCOG cultivars and from 13.6 to 20.6% among four CIMCOG cultivars in 2013 and 2014 combined. The relatively small reduction in grain weight in defoliated shoots could be partly linked to increased percentage contribution of pre-anthesis reserves to grain weight and DM translocation efficiency in defoliated shoots. It is also possible that the reduction of light interception was overestimated to a certain extent in the present study since this was calculated based on ceptometer readings taken around midday and not on measurements integrated across the day. Leaf-sheath shading (including the exposed stem peduncle) did significantly reduce grain weight compared to control shoots, indicating that these organs contributed an average of 9.6% to grain weight (for all cultivars evaluated in 2013 and 2014), with no differences between cultivars in grain weight response to the treatment. Our results showed the contribution of the leaf sheath (whole) to grain weight can be comparable to the contribution of the flag leaf under irrigated conditions [35]. Qin et al. [27] suggested that peduncle photosynthesis per unit area can be higher than in the flag leaf. Leaf-sheath photosynthesis may be especially relevant during the second half of grain filling when the temperature is typically higher and leaf blades have started to senesce [26]. Higher levels of flag-leaf lamina and sheath photosynthesis have been correlated with maximum accumulation of non-structural carbohydrates in both organs [26]. The upper part of the peduncle is exposed to a high irradiance environment at the top of the canopy and contains chlorophyll and has an autotrophic carbohydrate metabolism [41]. Thus, part of grain weight reductions as a consequence of shaded stem + leaf sheaths was likely related to decreases in peduncle photosynthesis, which has been shown to contribute to overall photosynthesis during grain filling [42]. Wang et al. [43] suggested that photosynthesis in the exposed peduncle and flag leaf sheath contribute about 9–12% of grain dry mass, depending on the wheat cultivar. More severe reductions in assimilate availability during post-anthesis (grain filling) by combining defoliation (top three leaves) and stem-and-leaf-sheath covering showed higher grain weight reductions in 2014, with an average contribution of these organs of 33.7% in all cultivars evaluated in 2013 and 2014. There was no correlation among cultivars between the leaf area removed (an indicator of amount of N removed) and grain weight responses to defoliation, indicating that differences in laminae area removed are not likely to explain the genetic variation in grain weight responses.

4.3. Upregulation of Stem Pre-Anthesis Reserves and Photosynthesis

During the grain filling period, assimilate supply can be provided by three different sources: (i) remobilization of stem reserves [44], (ii) post-anthesis leaf and stem photosynthesis [45] and (iii) post-anthesis spike photosynthesis [20]. The respective contributions of organ photosynthesis and remobilization to grain yield showed variation according to the source–sink treatments applied, as reflected by the responses of grain weight and percentage contribution of pre-anthesis reserves to grain weight. However, even with the treatments greatly reducing light interception by photosynthetic organs (ca. 60% by defoliation), no compensation through increases in photosynthesis rates of the flag leaf or spike were observed. Thus is in agreement with Serrago et al. [28], where canopy shading treatments were imposed, but in contrast with other studies, where upregulation of photosynthesis was observed [35,46]. It was predicted that defoliation or stem-and-leaf-sheath shading may enhance the photosynthetic capacity of other green organs (such as spikes) according to relative increases in grain sink strength. Such upregulations of photosynthesis can help avoid the restriction of grain filling, meaning that, often, no source limitation occurs [47]. However, in our study, as in that of Serrago et al. [28], where the entire canopy was shaded below the spike, no consistent compensation of spike or flag-leaf photosynthesis was observed for the different source manipulation treatments applied. Thus, even though a certain extent of co-limitation by sink and source was confirmed in the cultivars by grain weight reduction, no increases in leaf or spike photosynthesis occurred in the present study, only an increase in dry-matter translocation from pre-anthesis assimilates. Although the newer cultivar BECARD/K (released in 2009) had an apparent higher upregulation of flag-leaf photosynthesis than the older cultivar SERI M82 (released in 1982) at GS65+25d in StemCOV in 2014, differences among treatments were not significant (p = 0.836). Maydup et al. [29] showed that spike photosynthesis and the contribution of pre-anthesis reserves to grain weight were increased in modern cultivars (10 bread wheat cultivars released from 1920 to 2008), and more in defoliated than in intact plants.
Leaf lamina defoliation may have caused an increase in the photosynthesis of the intact leaf sheath and stem structures, but leaf-sheath and stem photosynthetic rate was not evaluated in the present study. However, even considering any potential increase in leaf-sheath and stem photosynthesis, this was not enough to compensate losses in leaf-lamina photosynthesis, as mentioned above [9]. The present results highlight the importance of maintaining source strength during grain filling, especially since our results show that modern CIMMYT spring wheat cultivars may be co-limited by source and sink. Previous studies have determined that carbohydrates stored in the stem prior to anthesis may contribute between 5–20% to grain weight [10,44,48,49,50,51]. A larger contribution of pre-anthesis reserves to grain weight has been reported under post-anthesis stress conditions such as drought [38,52,53]). Water-soluble carbohydrate concentrations remaining in stems and leaf sheaths at physiological maturity were very low, averaging 1.76% of dry weight for stems and 1.04% for leaf sheaths in control shoots from subset 4 in 2014 (data not shown). In contrast, Serrago et al. [28] observed that there were still non-structural reserves available for remobilization in stems at physiological maturity. In the present study, we observed an increase in DM translocation efficiency and contribution of pre-anthesis reserves to grain weight in DEF and StemCOVDEF treatments compared to CTRL, being higher in DEF than in StemCOVDEF. The reason behind a lower compensation from DM translocation in the more severe source reduction is not clear. The mobilization of stored carbohydrates requires fructan hydrolysis, which is catalyzed by fructan exohydrolase enzymes [54], and it can be speculated that the severe stress in StemCOVDEF may have induced a plant signaling response which reduced the activity of these enzymes. The gene expression patterns of stem enzymes responsible for fructan remobilization in wheat genotypes growing under stress and well-irrigated conditions are presently little understood, and further studies are required to understand their regulation to enhance stem carbohydrate remobilization in wheat. With the defoliation treatments imposed, between 7 to 10% more contributions of pre-anthesis assimilates to grain growth were observed, but they were not enough to compensate for the reduction in the current photosynthesis and grain weight losses that occurred, indicating a source limitation in manipulated shoots, as previously reported for durum wheat [9]. A reduction in current photosynthesis during grain filling could trigger an upregulation response in reserve mobilization from the stem. This can be quantified by the efficiency of DM translocation efficiency, which, for example, has been shown to be increased in recent cultivars of durum wheat [9]. In the present study, cultivar BECARD/5/KAUZ//ALTAR 84 (released in 2009) showed a higher DMTe (25.8%) than the older cultivar SERI M82 (released in 1982) (7.8%) in both years; however, a study with a wider range of year of release must be conducted to confirm whether or not modern spring wheat cultivars have a higher efficiency in remobilizing pre-anthesis stem reserves to the grain. Chen et al. [55] showed that remobilization of pre-anthesis reserves to grains was increased in modern commonly grown Chinese winter wheat cultivars and that this increase was related to increases in grain yield and harvest index. Several previous studies imposing source–sink manipulation treatments which effectively increased grain sink strength also reported an increase in remobilization of pre-anthesis reserves [12,38,56]. In contrast, Álvaro et al. [9] observed no effect on upregulation of pre-anthesis reserve remobilization in response to defoliation [9]. This discrepancy may be attributable to differences in environment and genotypes in the different experiments. Savin and Slafer [57] showed that the contribution of pre-anthesis assimilates to grain growth was smaller (22%) in shaded shoots (50% of incident light during grain filling) than in unshaded control shoots, which they attributed to a reduced sink demand caused by decreases in grain m−2 due to shading.

5. Conclusions

The grain weight responses to degraining indicated source–sink balance decreased with later year of release, suggesting evidence for co-limitation of grain growth by source and sink in modern CIMMYT spring wheat cultivars. This may have been due to an increase in potential grain weight and hence grain sink size with year of release with no commensurate increases in post-anthesis source capacity [2]. The proportionally lower grain weight responses in relation to the radiation interception reductions caused by the source manipulation treatments indicated the capacity of the source to fill the grains to be in excess of the demands of the growing grains, and that co-limitation of the cultivars (where it was indicated according to degraining responses) is still likely predominantly determined by sink limitation. The wide range of grain weight responses to the leaf-lamina defoliation treatment highlighted the importance of leaf lamina as a source organ during grain filling. In addition, the grain weight reduction in the StemCOV treatment indicated stem and leaf-sheath photosynthesis contributed to yield by nearly 10%. The stem and leaf sheath can play a key role to overcome potential co-limitation of grain yield by source limitation during grain filling in future wheat breeding for yield potential in the CIMMYT spring wheat program; however, the exact mechanisms require further investigation. Grain growth co-limitation could also be addressed by increasing grain m−2 (sink strength) during the pre-anthesis phase, as suggested by Reynolds et al. [4], who showed improvements in post-anthesis crop growth and radiation-use efficiency in response to increased sink demand by increased radiation interception during the booting stage. The capacity for upregulating flag-leaf and spike photosynthesis in response to increased grain sink strength was not detected at 15, 20 and 25 days after anthesis. In contrast, the contribution of pre-anthesis reserves to grain weight and the efficiency of stem DM translocation were increased by ca. 50% in response to leaf-lamina defoliation. It is suggested that increasing the post-anthesis photosynthetic capacity of the crop—through increases in pre-anthesis DM contribution and translocation efficiency and stem + leaf-sheath photosynthetic rate—is an important objective in enhancing yield potential in wheat.

Supplementary Materials

The following are available online at https://www.mdpi.com/2073-4395/10/10/1527/s1, Figure S1: Year of release regressions on (a) Grain yield, (b) Thousand grain weight, (c) Final biomass and (d) Grain number per m-2 for the 26 CIMCOG elite spring wheat cultivars, Figure S2: Grain weight (GW) response to degraining (% GW reduction respect to control shoots) vs a) thousand grain weight (TGW, mg) and b) grain number m-2 among the 26 CIMCOG cultivars, means of 2011, 2012 and 2013, Table S1: Entry number, year of release (YoR) and cultivar name for the 26 cultivars in the CIMCOG panel sown in 2011, 2012 and 2013 at Cd. Obregon. NW Mexico, Table S2: Climate data 2011, 2012, 2013 and 2014, Table S3: Subset 1 of cultivars and relation between cultivars, years and source manipulation treatments applied: defoliation treatment (DEF); stem-and-leaf-sheath covering treatment (StemCOV); stem-and-leaf-sheath covering + defoliation (StemCOVDEF) and Table S4: Key harvest traits for subset 1 (9 cultivars) in 2013 and subset 2 (4 cultivars) in 2013 and 2014.

Author Contributions

Conceptualization, G.M., M.R. and J.F.; Data curation, C.R.-A. and E.T.-N.; Formal analysis, C.R.-A.; Funding acquisition, M.R. and J.F.; Investigation, C.R.-A., G.M. and E.T.-N.; Methodology, J.F.; Supervision, G.M. and J.F.; Writing—original draft, C.R.-A., G.M. and J.F.; Writing—review & editing, G.M., M.R. and J.F. All authors have read and agreed to the published version of the manuscript.

Funding

This research was funded by the National Council of Science and Technology (CONACYT) grant, the University of Nottingham and the Sustainable Modernization of Traditional Agriculture (MasAgro) initiative from the Secretariat of Agriculture and Rural Development (SADER, Government of Mexico).

Acknowledgments

This work was supported by the Sustainable Modernization of Traditional Agriculture (MasAgro) initiative from the Secretariat of Agriculture and Rural Development (SADER, Government of Mexico) and the International Wheat Yield Partnership (IWYP). We also acknowledge CONACYT, Mexico government and The University of Nottingham, UK, for funding the PhD Studentships of Carolina Rivera-Amado and Eliseo Trujillo-Negrellos. Authors would also like to thank the CIMMYT Wheat Physiology team for technical assistance with measurements and trial management.

Conflicts of Interest

The authors declare no conflict of interest.

Abbreviations

CIMCOG (CIMMYT’s core germplasm panel), DEF (leaf-lamina defoliation), StemCOV (shading through stem-and-leaf-sheath covering), StemCOVDEF (stem-and-leaf-sheath covering + defoliation), DM (dry matter).

References

  1. Slafer, G.A.; Savin, R. Source—sink relationships and grain mass at different positions within the spike in wheat. Field Crop. Res. 1994, 37, 39–49. [Google Scholar] [CrossRef]
  2. Aisawi, K.A.B.; Reynolds, M.P.; Singh, R.P.; Foulkes, M.J. The Physiological Basis of the Genetic Progress in Yield Potential of CIMMYT Spring Wheat Cultivars from 1966 to 2009. Crop Sci. 2015, 55, 1749. [Google Scholar] [CrossRef]
  3. Borrás, L.; Slafer, G.A.; Otegui, M.E. Seed dry weight response to source–sink manipulations in wheat, maize and soybean: A quantitative reappraisal. Field Crop. Res. 2004, 86, 131–146. [Google Scholar] [CrossRef]
  4. Reynolds, M.P.; Pellegrineschi, A.; Skovmand, B. Sink-limitation to yield and biomass: A summary of some investigations in spring wheat. Ann. Appl. Biol. 2005, 146, 39–49. [Google Scholar] [CrossRef]
  5. Reynolds, M.P.; Calderini, D.F.; Condon, A.G.; Rajaram, S. Physiological basis of yield gains in wheat associated with the LR19 translocation from Agropyron elongatum. Euphytica 2001, 119, 139–144. [Google Scholar] [CrossRef]
  6. Gaju, O.; Reynolds, M.P.; Sparkes, D.L.; Mayes, S.; Ribas-Vargas, G.; Crossa, J.; Foulkes, M.J. Relationships between physiological traits, grain number and yield potential in a wheat DH population of large spike phenotype. Field Crop. Res. 2014, 164, 126–135. [Google Scholar] [CrossRef]
  7. Ahmadi, A.; Joudi, M.; Janmohammadi, M. Late defoliation and wheat yield: Little evidence of post-anthesis source limitation. Field Crop. Res. 2009, 113, 90–93. [Google Scholar] [CrossRef]
  8. Acreche, M.M.; Slafer, G.A. Grain weight, radiation interception and use efficiency as affected by sink-strength in Mediterranean wheats released from 1940 to 2005. Field Crop. Res. 2009, 110, 98–105. [Google Scholar] [CrossRef]
  9. Álvaro, F.; Royo, C.; García del Moral, L.F.; Villegas, D. Grain Filling and Dry Matter Translocation Responses to Source–Sink Modifications in a Historical Series of Durum Wheat. Crop Sci. 2008, 48, 1523. [Google Scholar] [CrossRef] [Green Version]
  10. Shearman, V.J.; Sylvester-Bradley, R.; Scott, R.K.; Foulkes, M.J. Physiological processes associated with wheat yield progress in the UK. Crop Sci. 2005, 45, 175–185. [Google Scholar] [CrossRef]
  11. Lopes, M.S.; Reynolds, M.P.; Manes, Y.; Singh, R.P.; Crossa, J.; Braun, H.J. Genetic Yield Gains and Changes in Associated Traits of CIMMYT Spring Bread Wheat in a “Historic” Set Representing 30 Years of Breeding. Crop Sci. 2012, 52, 1123. [Google Scholar] [CrossRef]
  12. Bonnett, G.D.; Incoll, L.D. Effects on the Stem of Winter Barley of Manipulating the Source and Sink during Grain-filling: II. Changes in the composition of water soluble carbohydrate of internodes. J. Exp. Bot. 1993, 44, 83–91. [Google Scholar] [CrossRef]
  13. Calderini, D.F.; Reynolds, M.P. Changes in grain weight as a consequence of de-graining treatments at pre- and post-anthesis in synthetic hexaploid lines of wheat (Triticum durum x T. tauschii). Funct. Plant Biol. 2000, 27, 183–191. [Google Scholar] [CrossRef]
  14. Reynolds, M.; Langridge, P. Physiological breeding. Curr. Opin. Plant Biol. 2016, 31, 162–171. [Google Scholar] [CrossRef] [PubMed] [Green Version]
  15. Bingham, I.J.; Blake, J.; Foulkes, M.J.; Spink, J. Is barley yield in the UK sink limited? Field Crop. Res. 2007, 101, 198–211. [Google Scholar] [CrossRef]
  16. Rivera-Amado, C.; Trujillo-Negrellos, E.; Molero, G.; Reynolds, M.P.; Sylvester-Bradley, R.; Foulkes, M.J. Optimizing dry-matter partitioning for increased spike growth, grain number and harvest index in spring wheat. Field Crop. Res. 2019. [Google Scholar] [CrossRef]
  17. Araus, J.L.; Brown, H.R.; Febrero, A.; Bort, J.; Serret, M.D. Ear photosynthesis, carbon isotope discrimination and the contribution of respiratory CO2 to differences in grain mass in durum wheat. Plant Cell Environ. 1993, 16, 383–392. [Google Scholar] [CrossRef]
  18. Evans, L.T.; Rawson, H.M. Photosynthesis and Respiration by the Flag Leaf and Components of the Ear During Grain Development In Wheat. Aust. J. Biol. Sci. 1970, 23, 245–254. [Google Scholar] [CrossRef]
  19. Kriedemann, P. The photosynthetic activity of the wheat ear. Ann. Bot. 1966, 30, 349–363. [Google Scholar] [CrossRef]
  20. Maydup, M.L.; Antonietta, M.; Guiamet, J.J.; Graciano, C.; López, J.R.; Tambussi, E.A. The contribution of ear photosynthesis to grain filling in bread wheat (Triticum aestivum L.). Field Crop. Res. 2010, 119, 48–58. [Google Scholar] [CrossRef]
  21. Sanchez-Bragado, R.; Molero, G.; Reynolds, M.P.; Araus, J.L. Relative contribution of shoot and ear photosynthesis to grain filling in wheat under good agronomical conditions assessed by differential organ 13C. J. Exp. Bot. 2014, 65, 5401–5413. [Google Scholar] [CrossRef] [PubMed] [Green Version]
  22. Molero, G.; Reynolds, M.P. Spike photosynthesis measured at high throughput indicates genetic variation independent of flag leaf photosynthesis. Field Crop. Res. 2020, 255, 107866. [Google Scholar] [CrossRef]
  23. Simkin, A.J.; Faralli, M.; Ramamoorthy, S.; Lawson, T. Photosynthesis in non-foliar tissues: Implications for yield. Plant J. 2020, 101, 1001–1015. [Google Scholar] [CrossRef] [PubMed]
  24. Yiotis, C.; Psaras, G.K.; Manetas, Y. Seasonal photosynthetic changes in the green-stemmed Mediterranean shrub Calicotome villosa: A comparison with leaves. Photosynthetica 2008, 46. [Google Scholar] [CrossRef]
  25. Osmond, C.B.; Smith, S.D.; Gui-Ying, B.; Sharkey, T.D. Stem photosynthesis in a desert ephemeral, Eriogonum inflatum. Oecologia 1987, 72, 542–549. [Google Scholar] [CrossRef]
  26. Araus, J.L.; Tapia, L. Photosynthetic Gas Exchange Characteristics of Wheat Flag Leaf Blades and Sheaths during Grain Filling: The Case of a Spring Crop Grown under Mediterranean Climate Conditions. PLANT Physiol. 1987, 85, 667–673. [Google Scholar] [CrossRef] [Green Version]
  27. Qin, F.; Du, F.; Xu, R.; Xu, Q.; Tian, C.; Li, F.; Wang, F. Photosynthesis in the different parts of a wheat plant. J. Food Agric. Environ. 2009, 7, 339–404. [Google Scholar]
  28. Serrago, R.A.; Alzueta, I.; Savin, R.; Slafer, G.A. Understanding grain yield responses to source–sink ratios during grain filling in wheat and barley under contrasting environments. Field Crop. Res. 2013, 150, 42–51. [Google Scholar] [CrossRef] [Green Version]
  29. Maydup, M.L.; Antonietta, M.; Guiamet, J.J.; Tambussi, E.A. The contribution of green parts of the ear to grain filling in old and modern cultivars of bread wheat (Triticum aestivum L.): Evidence for genetic gains over the past century. Field Crop. Res. 2012, 134, 208–215. [Google Scholar] [CrossRef]
  30. Sayre, K.D.; Rajaram, S.; Fischer, R.A. Yield Potential Progress in Short Bread Wheats in Northwest Mexico. Crop Sci. 1997, 37, 36–42. [Google Scholar] [CrossRef]
  31. Zadoks, J.C.; Chang, T.T.; Konzak, C.F. A decimal code for the growth stages of cereals. Weed Res. 1974, 14, 415–421. [Google Scholar] [CrossRef]
  32. Foulkes, M.J.; Slafer, G.A.; Davies, W.J.; Berry, P.M.; Sylvester-Bradley, R.; Martre, P.; Calderini, D.F.; Griffiths, S.; Reynolds, M.P. Raising yield potential of wheat. III. Optimizing partitioning to grain while maintaining lodging resistance. J. Exp. Bot. 2011. [Google Scholar] [CrossRef] [PubMed] [Green Version]
  33. Pask, A.J.D.; Pietragalla, J.; Mullan, D.M.; Reynolds, M.P. Physiological Breeding II: A Field Guide to Wheat Phenotyping; CIMMYT: Mexico City, Mexico, 2012. [Google Scholar]
  34. Alvarado, G.; Rodríguez, F.M.; Pacheco, A.; Burgueño, J.; Crossa, J.; Vargas, M.; Pérez-Rodríguez, P.; Lopez-Cruz, M.A. META-R: A software to analyze data from multi-environment plant breeding trials. Crop J. 2020. [Google Scholar] [CrossRef]
  35. Aggarwal, P.K.; Fischer, R.A.; Liboon, S.P. Source–sink relations and effects of post-anthesis canopy defoliation in wheat at low latitudes. J. Agric. Sci. 1990, 114, 93–99. [Google Scholar] [CrossRef]
  36. Carr, D.J.; Wardlaw, I.F. Supply of photosynthetic assimilates to grain from flag leaf and ear of wheat. Aust. J. Biol. Sci. 1965, 18, 711. [Google Scholar]
  37. Evans, L.T.; Wardlaw, I.F.; Fischer, R.A. Wheat. In Crop Physiology: Some Case Histories; Evans, L.T., Ed.; Cambridge University Press: Cambridge, UK, 1975; pp. 101–149. [Google Scholar]
  38. Merah, O.; Monneveux, P. Contribution of Different Organs to Grain Filling in Durum Wheat under Mediterranean Conditions I. Contribution of Post-Anthesis Photosynthesis and Remobilization. J. Agron. Crop Sci. 2015, 201, 344–352. [Google Scholar] [CrossRef] [Green Version]
  39. Thorne, G.N. Distribution between parts of the main shoot and the tillers of photosynthate produced before and after anthesis in the top three leaves of main shoots of Hobbit and Maris Huntsman winter wheat. Ann. Appl. Biol. 1982, 101, 553–559. [Google Scholar] [CrossRef]
  40. Kruk, B.C.; Calderini, D.F.; Slafer, G.A. Grain weight in wheat cultivars released from 1920 to 1990 as affected by post-anthesis defoliation. J. Agric. Sci. 1997, 128, 273–281. [Google Scholar] [CrossRef]
  41. Gebbing, T. The enclosed and exposed part of the peduncle of wheat (Triticum aestivum)—Spatial separation of fructan storage. New Phytol. 2003, 159, 245–252. [Google Scholar] [CrossRef]
  42. Kong, L.; Wang, F.; Feng, B.; Li, S.; Si, J.; Zhang, B. The structural and photosynthetic characteristics of the exposed peduncle of wheat (Triticum aestivum L.): An important photosynthate source for grain-filling. BMC Plant Biol. 2010, 10, 141. [Google Scholar] [CrossRef] [Green Version]
  43. Wang, Z.; Wei, A.L.; Zheng, D.M. Photosynthetic Characteristics of Non-Leaf Organs of Winter Wheat Cultivars Differing in Ear Type and their Relationship with Grain Mass Per Ear. Photosynthetica 2001, 39, 239–244. [Google Scholar] [CrossRef]
  44. Schnyder, H. The role of carbohydrate storage and redistribution in the source—Sink relations of wheat and barley during grain filling—A review. New Phytol. 1993, 123, 233–245. [Google Scholar] [CrossRef]
  45. Parry, M.A.J.; Reynolds, M.; Salvucci, M.E.; Raines, C.; Andralojc, P.J.; Zhu, X.-G.; Price, G.D.; Condon, A.G.; Furbank, R.T. Raising yield potential of wheat. II. Increasing photosynthetic capacity and efficiency. J. Exp. Bot. 2011, 62, 453–467. [Google Scholar] [CrossRef] [PubMed]
  46. Zhu, G.X.; Midmore, D.J.; Radford, B.J.; Yule, D.F. Effect of timing of defoliation on wheat (Triticum aestivum) in central Queensland. Field Crop. Res. 2004, 88, 211–226. [Google Scholar] [CrossRef]
  47. Cruz-Aguado, J.A.; Reyes, F.; Rodes, R.; Perez, I.; Dorado, M. Effect of Source-to-sink Ratio on Partitioning of Dry Matter and14C-photoassimilates in Wheat during Grain Filling. Ann. Bot. 1999, 83, 655–665. [Google Scholar] [CrossRef] [Green Version]
  48. Bidinger, F.; Musgrave, R.B.; Fischer, R.A. Contribution of stored pre-anthesis assimilate to grain yield in wheat and barley. Nature 1977, 270, 431–433. [Google Scholar] [CrossRef] [Green Version]
  49. Foulkes, M.J.; Scott, R.K.; Sylvester-Bradley, R. The ability of wheat cultivars to withstand drought in UK conditions: Formation of grain yield. J. Agric. Sci. 2002, 138, 153–169. [Google Scholar] [CrossRef]
  50. Gebbing, T.; Schnyder, H.; Kuhbauch, W. The utilization of pre-anthesis reserves in grain filling of wheat. Assessment by steady-state 13CO2/12CO2 labelling. Plant Cell Environ. 1999, 22, 851–858. [Google Scholar] [CrossRef]
  51. Wardlaw, I.F.; Porter, H.K. The Redistribution of Stem Sugars in Wheat during Grain Development. Aust. J. Biol. Sci. 1967, 20, 309–318. [Google Scholar] [CrossRef] [Green Version]
  52. Gallagher, J.N.; Biscoe, P.V.; Hunter, B. Effects of drought on grain growth. Nature 1976, 264, 541–542. [Google Scholar] [CrossRef]
  53. Gebbing, T.; Schnyder, H. Pre-Anthesis Reserve Utilization for Protein and Carbohydrate Synthesis in Grains of Wheat. Plant Physiol. 1999, 121, 871–878. [Google Scholar] [CrossRef] [Green Version]
  54. Yáñez, A.; Tapia, G.; Guerra, F.; del Pozo, A. Stem carbohydrate dynamics and expression of genes involved in fructan accumulation and remobilization during grain growth in wheat (Triticum aestivum L.) genotypes with contrasting tolerance to water stress. PLoS ONE 2017, 12, e0177667. [Google Scholar] [CrossRef] [PubMed] [Green Version]
  55. Chen, W.; Sun, Y.; Zhang, S.; Palta, J.A.; Deng, X. The Proportion of Superior Grains and the Sink Strength are the Main Yield Contributors in Modern Winter Wheat Varieties Grown in the Loess Plateau of China. Agronomy 2019, 9, 612. [Google Scholar] [CrossRef] [Green Version]
  56. Beed, F.D.; Paveley, N.D.; Sylvester-Bradley, R. Predictability of wheat growth and yield in light-limited conditions. J. Agric. Sci. 2007, 145, 63. [Google Scholar] [CrossRef]
  57. Savin, R.; Slafer, G.A. Shading effects on the yield of an Argentinian wheat cultivar. J. Agric. Sci. 1991, 116, 1–7. [Google Scholar] [CrossRef] [Green Version]
Figure 1. Source and sink manipulation treatments: (a) plot area designated for manipulation treatments; (b) de-grained and control spike; (c) defoliation (DEF) and (d) stem and leaf sheath covered with textile (StemCOV); all treatments applied at anthesis +10 days (GS65+10d).
Agronomy 10 01527 g001
Figure 2. (a) Grain weight (GW) in control shoots versus GW in degrained shoots; (b) GW increase by degraining relative to the control (mg) versus the year of release of cultivars; (c) source–sink ratio (cm2 green area g−1 grain sink size) versus (c) GW increase by degraining relative to control (%) and (d) versus GW increase by degraining relative to control (mg). The dashed line in (a) represents the 1:1 ratio. All data are means of 2011, 2012 and 2013 for the 26 CIMCOG cultivars.
Agronomy 10 01527 g002
Figure 3. Overall and strata light interception (LI), leaf area index (LAI), green area index (GAI) and coefficient of extinction (k); and green area and LI per organ/strata (cm2) in control shoots and estimation of overall LI, LAI, GAI and k in defoliated shoots measured at anthesis +7 days (GS65+7). Means and ranges in 2013 for subset 1 (9 CIMCOG cultivars). * p < 0.05, ** p < 0.01, *** p < 0.001 and not significant (ns).
Agronomy 10 01527 g003
Figure 4. Grain weight in defoliated shoots (DEF, grey bars) and difference between CTRL and DEF (blue bars) in (a) subset 1 (9 cultivars) in 2013 (p < 0.01 for cultivar and p < 0.001 for defoliation treatment) and (b) subset 2 (4 cultivars) combined data from 2013 and 2014 (p < 0.01 for cultivar, p < 0.001 for defoliation treatment and p = 0.086 for year, all interactions were non-significant). Cultivars are sorted ascendingly by grain weight in CTRL. Percentages indicate the grain weight decrease in DEF relative to CTRL (p < 0.001 for (a) and p < 0.05 for (b)). Error bars correspond to S.E. for the difference between grain weight in CTRL and DEF.
Agronomy 10 01527 g004
Figure 5. Grain weight in manipulated shoots (grey bars) and difference between control and manipulated shoots (blue bars) in (a) 2013 for a selection of three (StemCOV, p < 0.001 for cultivar and treatment) and two cultivars (StemCOVDEF, p < 0.001 for cultivar and p = 0.057 for treatment) and (b) 2014 for subset 2 (StemCOV and StemCOVDEF, p < 0.01 for cultivar and p < 0.001 for treatment). Error bars correspond to S.E. for the difference between grain weight in CTRL and manipulated shoots.
Agronomy 10 01527 g005
Figure 6. (a) Contribution of pre-anthesis reserves to grain weight (CPA, %) (p < 0.001 for cultivar; p < 0.05 for treatments; p = 0.197 for year and all non-significant interactions, expect for year × treatment p < 0.05) and DM translocation efficiency (DMTe, %) (p < 0.01 for cultivar; p < 0.01 for treatments; p < 0.01 for year and all non-significant interactions, expect for year × cultivar p < 0.01) for subset 2 (four CIMCOG cultivars) combining years 2013 and 2014 for CTRL and DEF and (b) CPA (p < 0.01 for cultivar, p < 0.01 for treatment and p = 0.237 for cultivar × treatment interaction) and DMTe (p < 0.01 for cultivar, p < 0.05 for treatment and p = 0.991 for cultivar × treatment interaction) for subset 2 (four CIMCOG cultivars) in 2014 for CTRL, DEF, StemCOV and StemCOVDEF. Error bars correspond to S.E. for treatments.
Agronomy 10 01527 g006
Table 1. Adjusted means and ranges for yield, yield components, plant height and phenology for the 26 cultivars of the International Maize and Wheat Improvement Center (CIMMYT)’s core germplasm (CIMCOG) from cross-year analysis of 2011, 2012 and 2013.
YieldTGWHIBiomassGM2SM2GPSDTADTMPH
g m−2gIdxg m−2# m−2# m−2#DAEDAEcm
Heritability0.740.980.840.740.930.910.860.900.900.95
Min66429.90.44125813,103240447712380
Max71050.60.50151722,7803957096133116
Grand Mean67042.40.47141115,8643045388128105
SED gen (125)17.91.010.00838.954412.92.480.6401.051.77
CV (%)5.44.83.35.66.98.49.41.51.63.4
Gen sig.<0.001<0.001<0.001<0.001<0.001<0.001<0.001<0.001<0.001<0.001
Env sig.<0.050.452<0.0010.1020.8631.000.0910.421<0.050.054
GenxEnv sig.<0.010.4080.089<0.05<0.01<0.010.066<0.001<0.050.054
TGW: thousand grain weight, HI: harvest index, biomass: final above-ground biomass, GM2: grain number per m2, SM2: spike number per m2, GPS: grains per spike, DTA: days to anthesis (DAE: days after emergence), DTM: days to maturity and PH: plant height, CV: coefficient of variation and SED: standard error difference, Gen: genotype and Env: environment. Degrees of freedom for the genotype are in parenthesis.
Table 2. Analysis of variance for grain weight (GW), grains per spike (GPS), DM translocation efficiency (DMTe) and contribution of pre-anthesis reserves to grain weight (CPA, %) in control and manipulated shoots for individual seasons.
GPSGWDMTeCPA
#mg%%
2013
Subset 1 (9 cultivars)
P-value GenCTRL−DEF<0.001<0.001<0.001<0.001
P-value TreatCTRL−DEF0.620<0.0010.9650.844
P-value GxTCTRL−DEF0.995<0.010.1500.439
SED Gen (df)CTRL−DEF1.57 (34)0.640 (34)3.79 (26)3.47 (24)
Subset 2 (4 cultivars)
P-value GenCTRL−DEF<0.001<0.001<0.01<0.001
P-value TreatCTRL−DEF0.975<0.0010.2020.344
P-value GxTCTRL−DEF0.928<0.010.1480.297
SED Gen (df)CTRL−DEF1.58 (14)0.571 (14)4.1 (11)3.91 (11)
3 cultivars
P-value GenCTRL−StemCOV<0.001<0.001<0.01<0.01
P-value TreatCTRL−StemCOV0.804<0.0010.7770.643
P-value GxTCTRL−StemCOV0.2540.4250.9680.849
SED Gen (df)CTRL−StemCOV2.62 (10)0.480 (9)5.62 (10)5.19 (9)
2 cultivars
P-value GenCTRL−StemCOVDEF<0.001<0.001<0.01<0.01
P-value TreatCTRL−StemCOVDEF0.3360.0570.5890.561
P-value GxTCTRL−StemCOVDEF0.7710.1110.9360.421
SED Gen (df)CTRL−StemCOVDEF2.6 (6)0.895 (6)4.03 (6)7.05 (6)
2014
Subset 2 (4 cultivars)
P-value GenALL TREATS<0.001<0.01<0.01<0.01
P-value TreatALL TREATS0.097<0.001<0.05<0.001
P-value GxT ALL TREATS0.6090.3600.9910.237
SED Gen (df)ALL TREATS1.34 (26)0.866 (28)3.55 (30)4.41 (28)
CTRL: control, DEF: defoliation, StemCOV: stem-and-leaf-sheath covering, StemCOVDEF: stem-and-leaf-sheath covering + defoliation, Gen: genotype and Treat: treatment. In 2013, the comparative analysis for CTRL and StemCOV was conducted using three cultivars where this treatment was applied, and for CTRL and StemCOVDEF, using the selection of two cultivars where this treatment was applied. Degrees of freedom for the genotype are in parenthesis.
Table 3. Flag-leaf and spike photosynthetic rates per area (gross; µmol CO2 m−2 s−1) and per organ (µmol CO2 organ−1 s−1) at 20 days after anthesis (GS65+20d) in CTRL (control), DEF (defoliation), StemCOV (stem-and-leaf-sheath covering treatment) and StemCOVDEF (stem-and-leaf-sheath covering + defoliation) for a selection of two CIMCOG cultivars under field conditions in 2013.
Gross PhotosynthesisOrgan Photosynthesis
Units(µmol CO2 m−2 s−1)(µmol CO2 Organ−1 s−1)
GS65+20dGS65+20d
LeafSpikeLeafSpike
BECARD/K
CTRL28.114.550.0750.040
DEF14.450.041
StemCOV27.916.110.0750.046
StemCOVDEF10.750.031
Mean28.013.960.0750.039
CMH79A.955
CTRL22.414.620.0930.068
DEF7.590.033
StemCOV25.511.430.1200.054
StemCOVDEF9.270.043
Mean24.010.70.1070.049
Overall mean26.012.30.0910.044
CTRL25.314.60.0840.054
DEF11.00.037
StemCOV26.713.80.0980.050
StemCOVDEF10.00.037
P-value Gen (Df)0.279 (2)0.962 (2)0.702 (1)0.038 (2)
P-value Treat (Df)0.477 (3)0.106 (10)0.353 (1)0.711 (9)
P-value GxT (Df)0.595 (8)0.097 (17)0.589 (7)0.711 (9)
Table 4. Flag-leaf and spike photosynthetic rate per area (gross; µmol CO2 m−2 s−1) and per organ (µmol CO2 organ−1 s−1) at 15 days after anthesis (GS65+15d) and 25 days after anthesis (GS65+25d) in CTRL (control), DEF (defoliation), StemCOV (stem-and-leaf-sheath covering treatment) and StemCOVDEF (stem-and-leaf-sheath covering + defoliation) for subset two (four CIMCOG cultivars) under field conditions in 2014.
Gross PhotosynthesisOrgan Photosynthesis
Units(µmol CO2 m−2 s−1)(µmol CO2 Organ−1 s−1)
GS65+15dGS65+25dGS65+15dGS65+25d
LeafSpikeLeafSpikeLeafSpikeLeafSpike
BECARD/K
CTRL27.315.720.710.20.0970.0490.0730.029
DEF16.112.20.0500.034
StemCOV29.115.524.412.20.1040.0480.0900.039
StemCOVDEF12.610.50.0500.033
Mean28.215.022.511.30.1010.0490.0810.034
SERI M82
CTRL28.29.628.111.00.1170.0310.1120.039
DEF9.111.40.0290.042
StemCOV26.414.623.89.10.1100.0480.0950.033
StemCOVDEF10.311.20.0330.040
Mean27.310.926.010.70.11370.0350.1040.039
UP2338*2
CTRL22.411.50.070.034
DEF9.60.027
StemCOV21.710.80.0740.031
StemCOVDEF12.40.032
Mean 22.111.1 0.0720.031
Overall mean 27.7412.9423.511.010.1070.0420.0860.035
P-value Gen (Df)0.56 (6)<0.01 (13)0.289 (10)0.76 (22)0.138 (6)<0.001 (14)0.062 (10)<0.05 (22)
P-value Treat (Df)0.969 (1)0.134 (3)0.836 (1)0.901 (3)1 (1)0.263 (3)0.912 (1)0.983 (3)
P-value GxT (Df)0.268 (6)0.159 (13)0.330 (10)0.287 (22)0.371 (6)0.121 (14)0.404 (10)0.194 (22)

