1. Introduction
For decades, normal cementitious materials have proven to be a suitable material in infrastructure constructions and have been successfully implemented in numerous projects around the world. However, the deteriorating condition of the infrastructure in North America and elsewhere due to inherently brittle failure resulting from tensile and impact loading in such cementitious materials has motivated authorities and researchers to seek new technology for enhancement of concrete material properties. Therefore, polymeric fibers were employed as a reinforcing material in cementitious materials in order to enhance the resistance and toughness in tension and shear. Four thousand years ago, fiber reinforcement in construction materials started to be used in the Far East regions when horsehair or hays were mixed into the mud for bricks for housing construction. Modern fiber reinforced cementitious materials have been studied since 1960s [
1].
In the last decade, a new type of composite called Engineered Cementitious Composite (ECC) has been developed. ECC is a special type of high performance fiber-reinforced cementitious composite featuring high ductility and damage tolerance under mechanical loading, including tensile and shear loadings [
2,
3,
4]. By employing micromechanics-based material optimization, tensile strain capacity in excess of 3% under uniaxial tensile loading can be attained with only 2% polyvinyl alcohol (PVA) fiber content by volume [
2,
5,
6]. Unlike most vinyl polymers, PVA is not prepared by polymerization of the corresponding monomer. The monomer, vinyl alcohol, is unstable with respect to acetaldehyde. PVA instead is prepared by first polymerizing vinyl acetate, and the resulting polyvinylacetate is converted to the PVA.
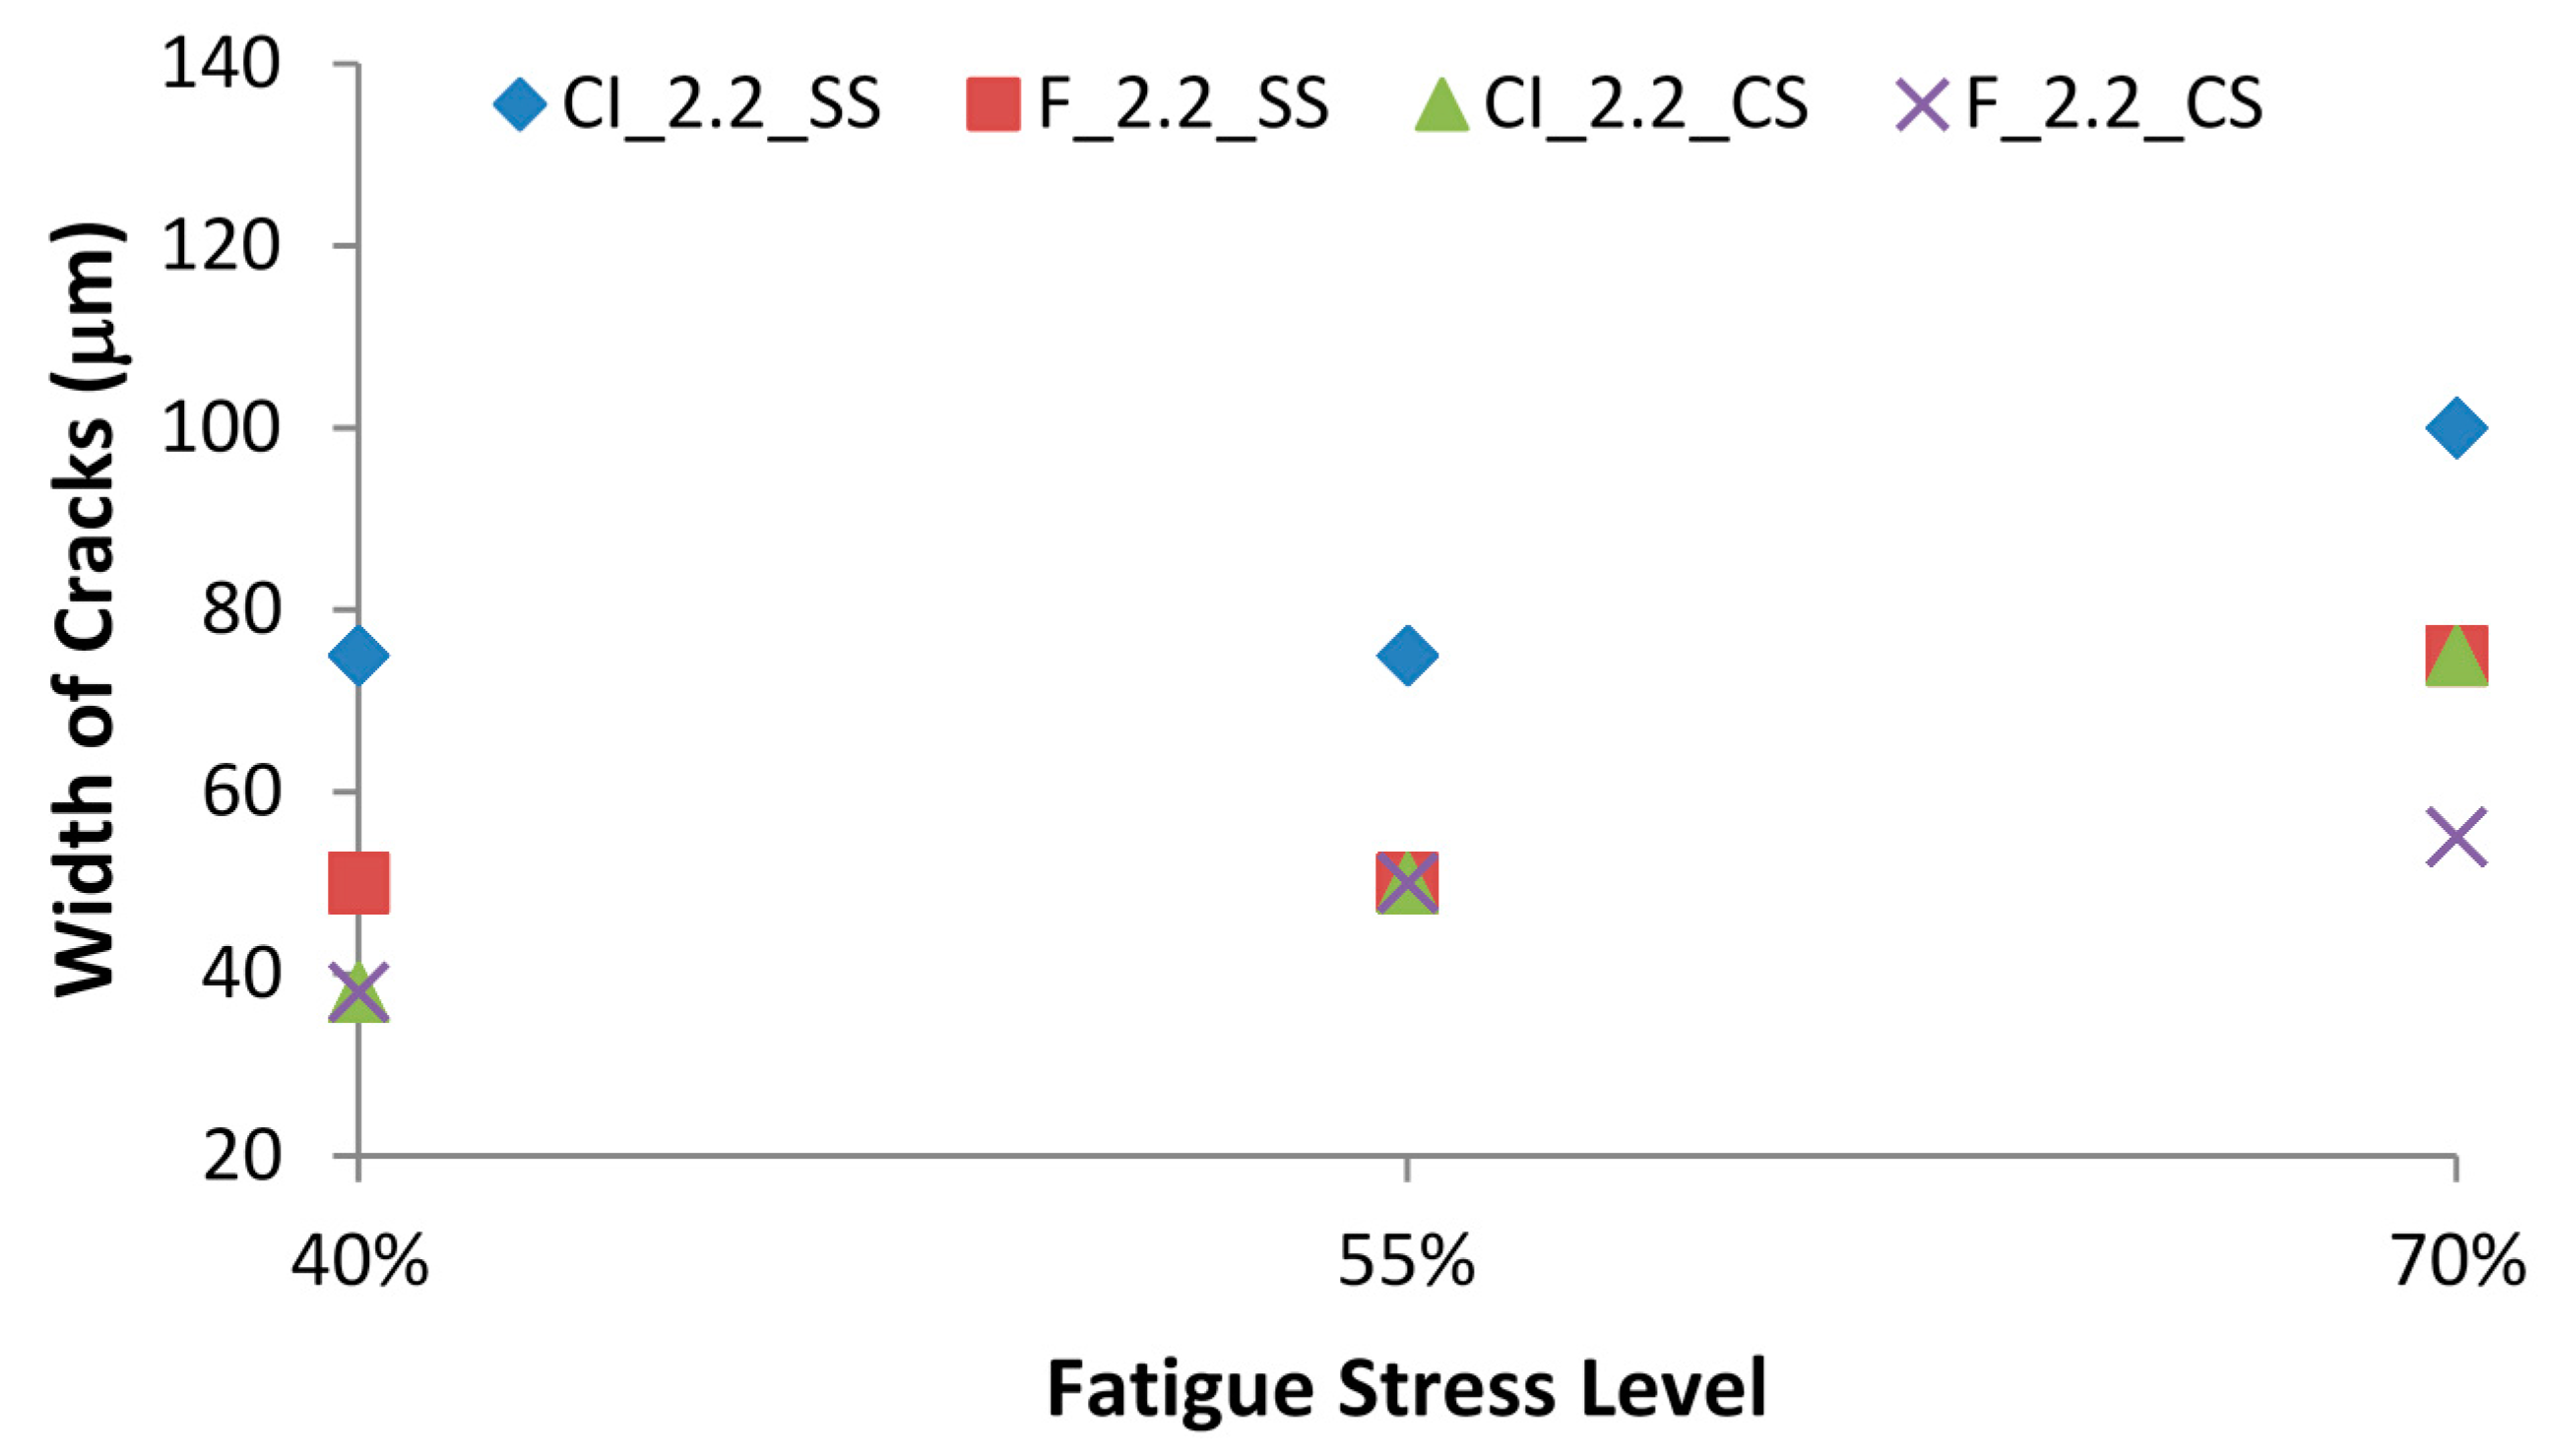
The characteristic ECC strain hardening after matrix first cracking is accompanied by sequential development of multiple micro-cracking and the tensile strain capacity is 300–500 times greater than that of normal concrete. The formation of multiple micro cracking is necessary to achieve high composite tensile ductility. Even at ultimate load, the crack width remains on the order of 50 to 80 micrometer. This tight crack width is self-controlled and, whether the composite is used in combination with conventional reinforcement or not, it is a material characteristic independent of rebar reinforcement ratio.
In contrast, normal concrete and fiber reinforced concrete (FRC) rely on steel reinforcement for crack width control. By suppressing cracks in the presence of large imposed structural deformations, ECC can offer structural durability improvements in addition to water-tightness and other serviceability enhancements. These properties, together with a relative ease of production including self-consolidation casting [
7,
8] and shotcreting [
9], make ECCs suitable for various civil engineering applications. Currently, self-consolidating ECC is emerging in full scale structural applications [
10]. The ingredients and mix proportions of ECC are optimized through micromechanics based material design theory to satisfy strength and energy criteria to attain high composite tensile ductility [
2,
3,
4,
11]. The type, size and amount of fiber, matrix ingredients and interface characteristics are tailored for multiple cracking and controlled crack width in ECCs.
Aggregates typically occupy an important volume fraction in conventional concrete, and therefore have important effects on different aspects of material properties. In addition to their role as economic filler, aggregates help to control dimensional stability of cement-based materials, which may be considered to consist of a framework of cement paste with relatively large shrinkage movements restrained by aggregates. However, the presence of coarse aggregates in a paste tends to increase the tortuosity of the fracture path, and lead to a tough matrix which delays crack initiation and prevents steady-state flat-crack propagation in ECC, resulting in loss of tensile ductility. Moreover, the introduction of aggregates with a particle size larger than the average fiber spacing leads to balling and greater interaction of fibers between the large aggregate particles, and the effect becomes more pronounced as the maximum size of aggregate particles increase. Therefore, an increase in aggregate size makes it more difficult to achieve a uniform dispersion of fibers. The greater the size of aggregates, the more clumping and interaction of fibers would occur. Therefore, the size of the aggregates is expected to have a significant influence on the properties of composite. Hence, in spite of positive effects of aggregates on dimensional stability and economy of fiber reinforced cement composites, there are limits on aggregate size beyond which problems with fiber dispersability, fresh mix workability and matrix toughness may start to damage the composite material performance characteristics [
12].
Therefore, instead of coarse aggregate, standard ECC incorporates fine aggregate (generally silica sand) with an aggregate to binder ratio (A/B) of 0.36 by mass to maintain adequate stiffness and volume stability [
13]. The binder system is defined as the total amount of cementitious material,
i.e., cement and SCMs, generally fly ash (FA), in ECC. The silica sand has a maximum grain size of 250 μm and a mean size of 110 μm. Another purpose of using fine silica sand is to obtain the optimum gradation of particles to produce good workability [
14].
Due to environmental and economic reasons, there is a growing trend to use industrial wastes or by-products as supplementary materials or admixtures in the production of cementitious composite. Among the various supplementary materials, fly ash (FA) and slag (SL) are the most commonly available SCMs. Because of several potential benefits, fly ash and slag have increasingly found use in high performance concrete in the last few decades [
15].
In the past few decades, substitution of SCMs, such as FA and SL, has been of great interest and gradually applied to practical applications of ECC [
16,
17,
18,
19,
20]. FA is a by-product of the coal power plant, whereas SL is a by-product in the manufacture of pig iron. Both of these waste materials from industrial processes are usually available in large quantities and at a fraction of the price of cement. The absence of coarse aggregate in ECC results in a higher cement content. Partial replacement using FA or SL reduces the environmental burden. Further, it has been found that incorporating high amount of FA, especially class F fly ash, can reduce the matrix toughness and improve the robustness of ECC in terms of tensile ductility. Additionally, un-hydrated FA particles with small particle size and smooth spherical shape serve as filler particles resulting in higher compactness of the fiber/matrix interface transition zone that leads to a higher frictional bonding. This aids in reducing the steady-state crack width beneficial for long-term durability of the structure [
18,
19,
21,
22]. The leaking expansion joints are a major source of deterioration of multi-span bridges in Canada. Expansion joints can be replaced by flexible link slabs made with ECC forming a joint-free multi-span bridge and hence, solving the problem of premature deterioration [
23,
24]. Research studies showed significant enhancement of ductility and crack width control in ECC link slabs confirming that the use of ECC can be effective in extending the service life of bridge deck systems.
Since the increase in aggregate size leads to an increase in the matrix toughness while the use of SCMs leads to reduce the matrix toughness, locally available aggregate could successfully be used in conjunction with high volume SCMs in the production of ECC. Very limited information is currently available in the published literature revealing the influence of aggregate size on the performance (ductility and mechanical behavior) of ECC [
12]. Accordingly, one of the current research goals is to design a new class of ECCs with a matrix incorporating locally available aggregates that can show similar mechanical properties compared to standard ECC mixtures containing silica sand.
The main objective of the current research is to explore the development of greener ECCs and analyze the mechanical properties such as flexural strengths and fatigue loading performance of ECCs. Flexure fatigue performance of ECC is very important for its construction applications, for example, link slabs applications in bridge decks.
The present study contributes the existing knowledge of ECC by incorporating locally available crushed sand instead of silica sand and by employing different cement replacement rates up to 70%. It is well known that commercially available silica sand is relatively expensive and difficult to obtain when compared with commonly available sands, such as crushed sand. This paper describes the results of an experimental investigation studying the effects of silica sand (as a control material), local crushed sand and different SCM/C ratio on the flexural properties and fatigue performance as well as crack development characteristics of ECC mixtures. Overall, the recommendations of this paper will be beneficial to engineers, designers and local industries engaged in manufacturing and using cost-effective and greener ECC mixtures for construction applications.
2. Experimental Investigations
Two phases of tests were carried on prismatic prism (beam) samples made of two groups of twelve ECC mixtures designed and selected for this study.
Phase I: This phase consisted of two parts. The first part was static flexural strength test conducted at 28, and 56 days for both ECC groups. The second part was general fatigue flexural test conducted at 28 days for 50,000 cycles at 4 Hz cyclic loading rate and 55% fatigue flexural stress level. At the end of the fatigue flexural tests, static flexural tests were applied on the fatigued ECC specimens to calculate the fatigue residual energy. The best ECC mixtures identified from this phase were included in the second phase (Phase II)—slag mixtures were omitted at the end of this phase because of their inferior multiple cracking behavior.
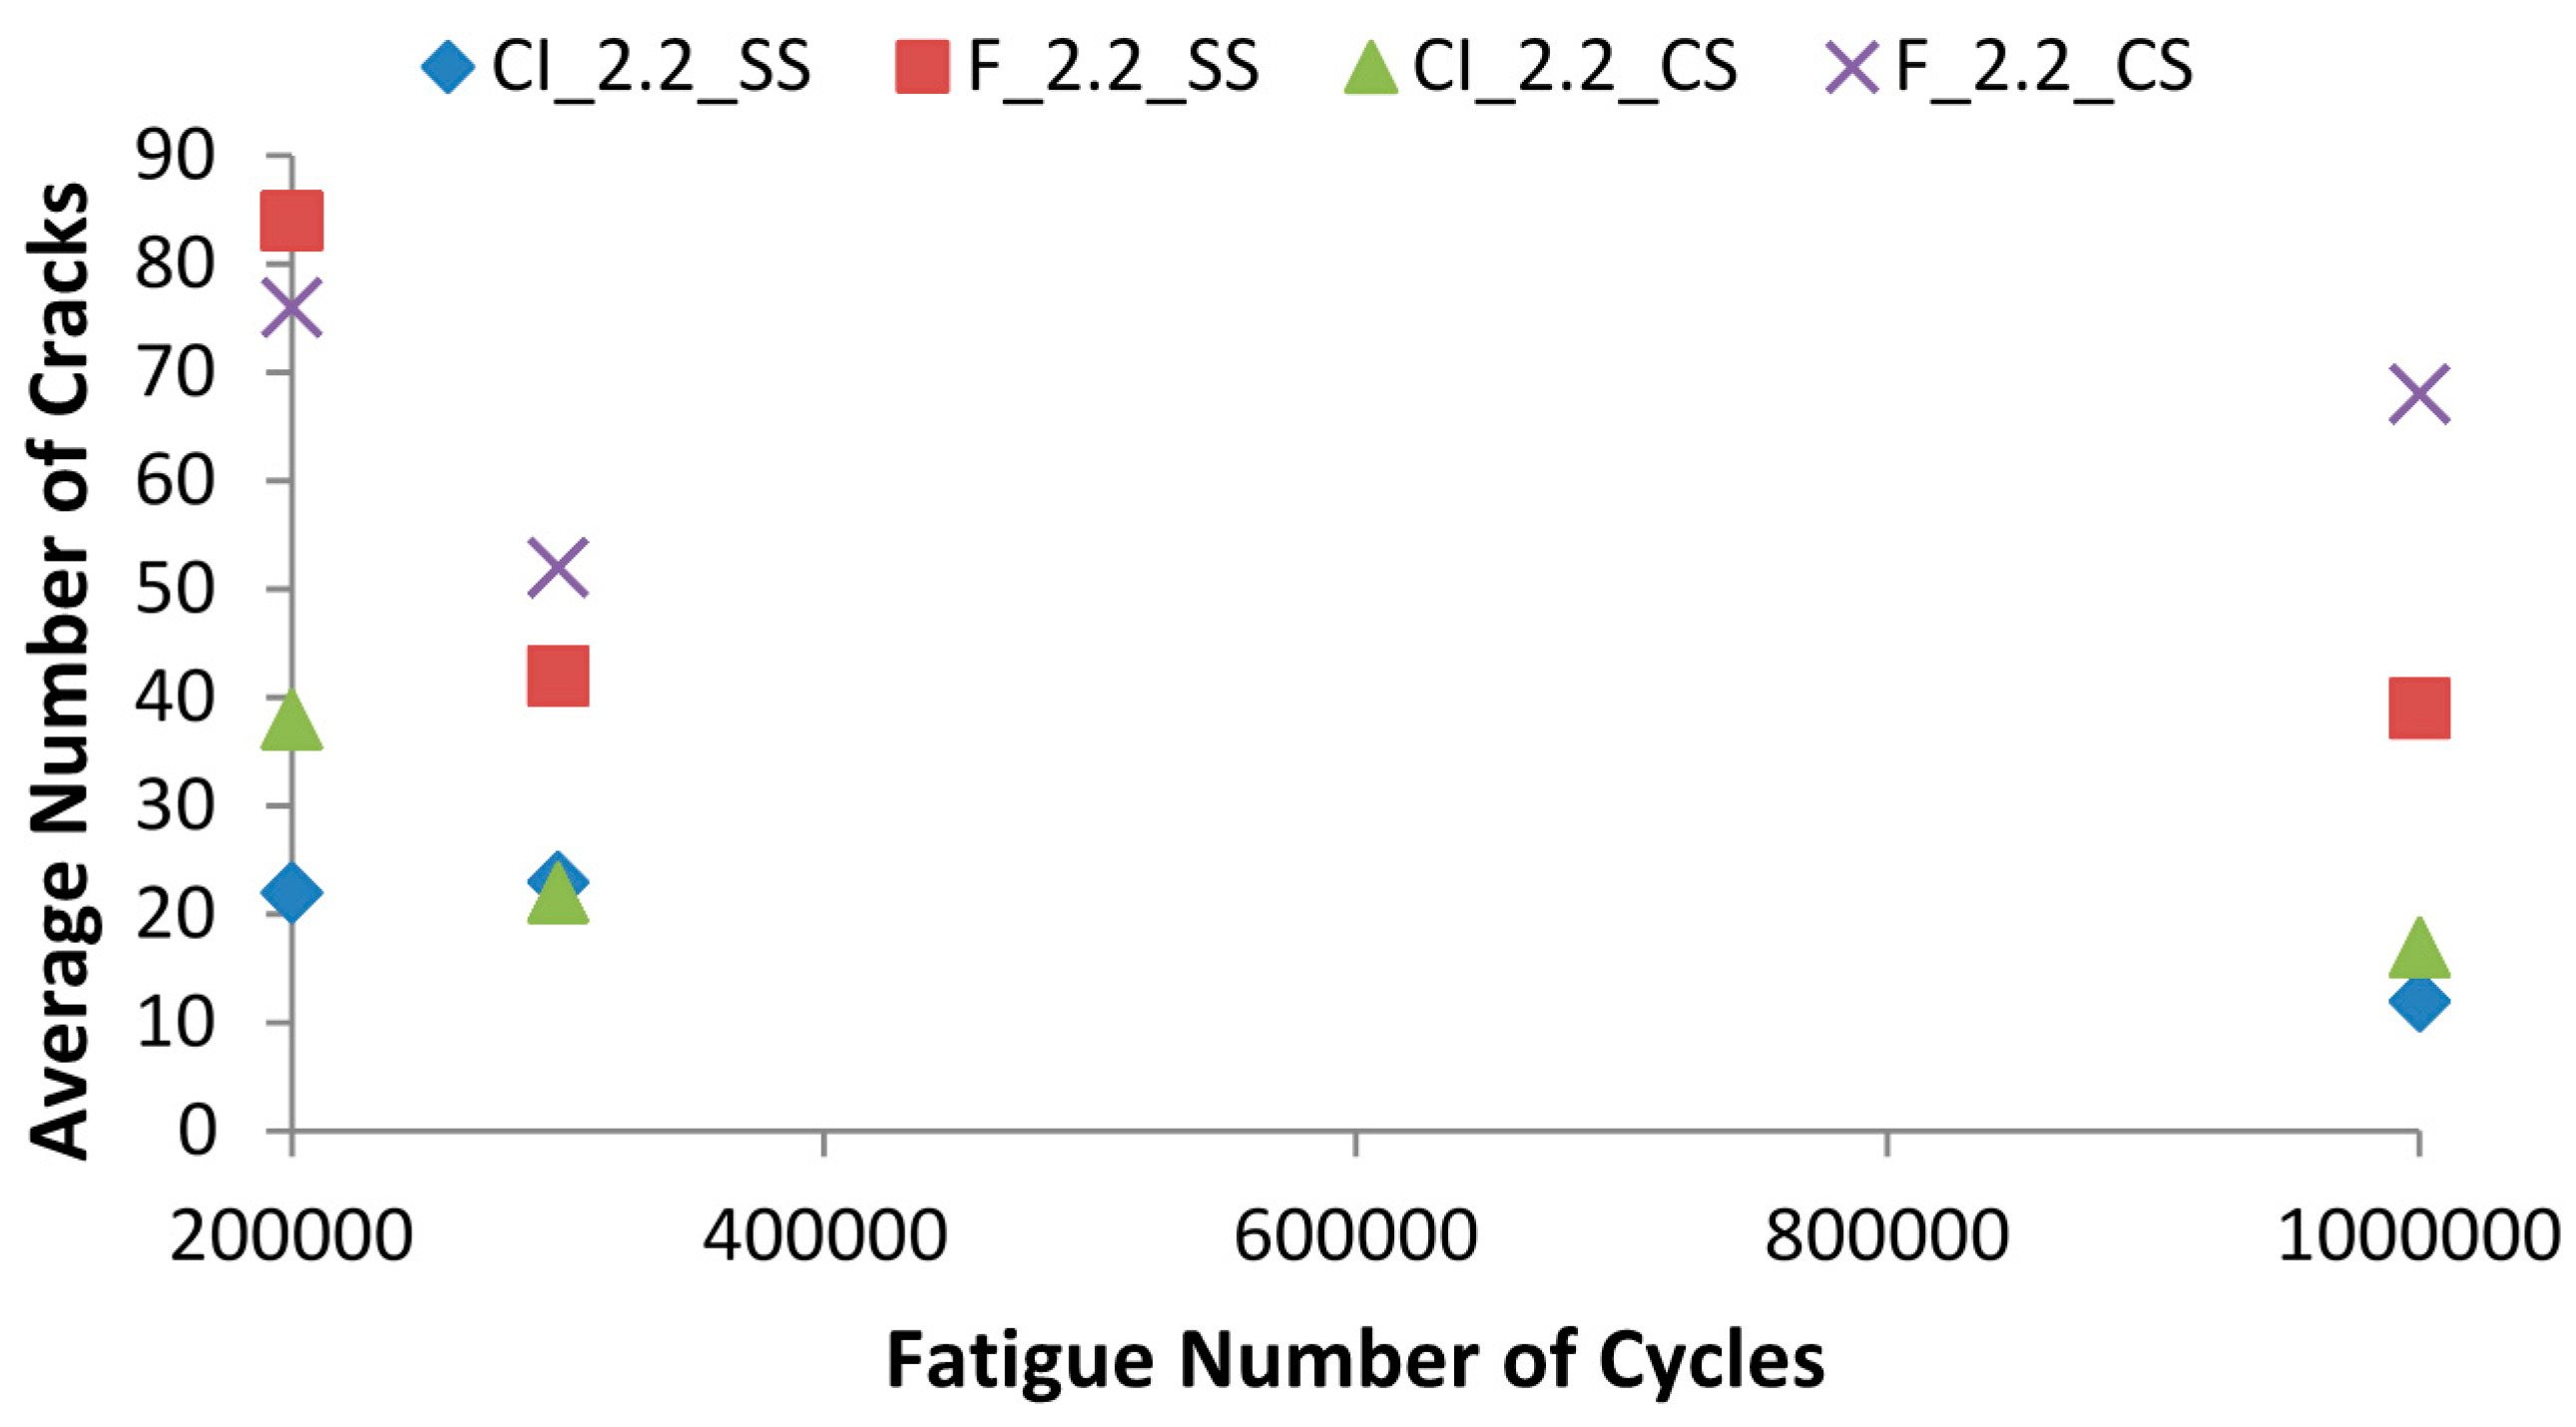
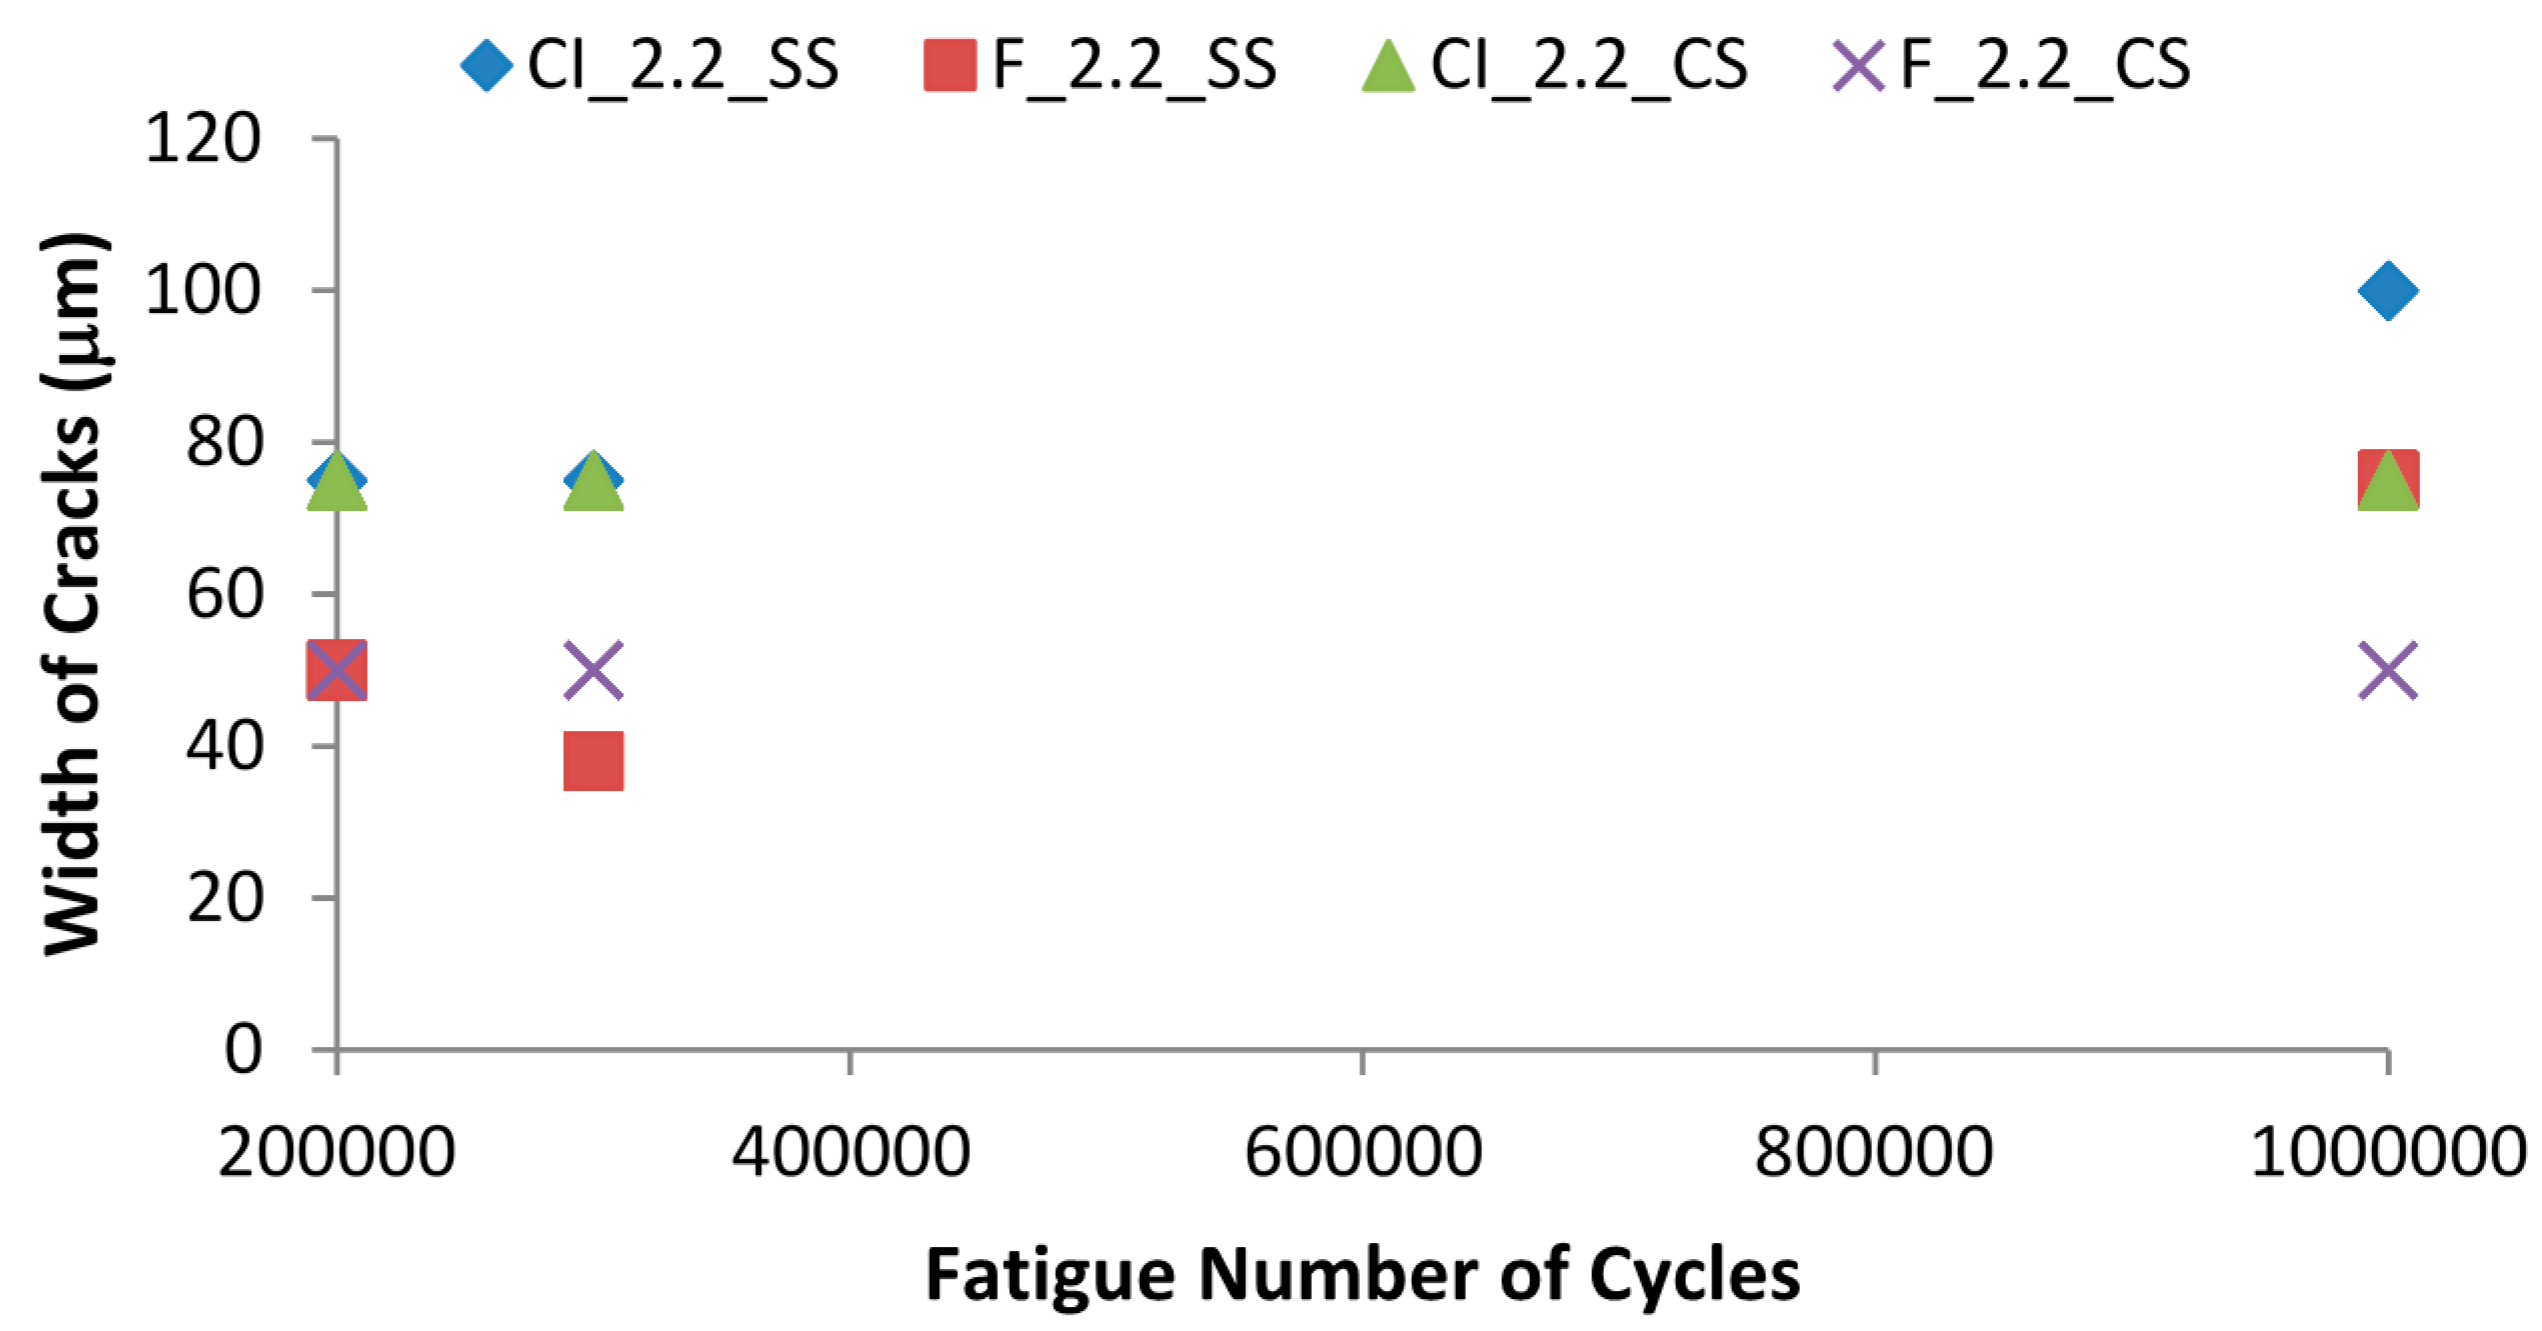
Phase II: In this phase, special fatigue flexure tests were conducted by using two different approaches. The first approach was applying different fatigue flexural stress levels namely 40%, 55% and 70% of the average maximum stress for 50,000 cycles at 4 Hz cyclic loading rate and the second approach was applying different fatigue cycles namely 200,000, 300,000 and 1,000,000 cycles at 4 Hz cyclic loading rate and 55% fatigue stress level.
2.1. Materials and ECC Mixture Proportions
The material used in the production of standard ECC mixtures were Portland cement (C) Type I general use (GU); two different classes of fly ash (FA): Class-F, and Class-CI with calcium content 5.57%, and 14.30% respectively; Blast furnace slag (SL) with calcium content of 40.80%; silica sand (SS) with a maximum grain size of 0.40 mm; polyvinyl alcohol (PVA) fibers; water; and a polycarboxylic-ether type high-range water-reducing admixture (HRWRA). The chemical composition and physical properties of Portland cement, class-F; class-CI fly ash and slag are presented in
Table 1. The commercially available silica sand is relatively expensive and difficult to obtain when compared with commonly available sands [
12]. For this purpose, locally available crushed lime stone sand with maximum grain size of 1.18 mm was used in the production of nonstandard ECC mixtures. The grain size distributions of silica sand and crushed sand are given in
Table 2. The PVA fibers with a diameter of 39 μm and a length of 8 mm are purposely manufactured with a tensile strength (1620 MPa), elastic modulus (42.8 GPa), and maximum elongation (6.0%) matching those needed for strain-hardening performance. Additionally, the surface of the PVA fibers was coated with a proprietary oiling agent 1.2% by mass to tailor the interfacial properties between fiber and matrix for strain-hardening performance [
25].
Table 1.
Chemical properties of Portland cement, fly ashes and slag.
Table 1.
Chemical properties of Portland cement, fly ashes and slag.
| Chemical Composition (%) | Cement (C) | Fly Ash (F) | Fly Ash (CI) | Slag (SL) |
|---|
| Calcium Oxide CaO | 61.40 | 5.57 | 14.30 | 40.8 |
| Silicon Dioxide SiO2 | 19.60 | 59.5 | 41.57 | 35.4 |
| Aluminium Oxide Al2O3 | 4.90 | 22.2 | 26.12 | 13.00 |
| Ferric Oxide Fe2O3 | 3.10 | 3.90 | 8.44 | 0.50 |
| Magnesium Oxide MgO | 3.00 | – | 3.40 | 8.00 |
| Sulfur Trioxide SO3 | 3.60 | 0.19 | 1.55 | 0.10 |
| Alkalis as Na2O | – | 2.75 | 0.71 | 0.20 |
| Loss on ignition LOI | 2.30 | 0.21 | 1.49 | – |
| Sum (SiO2 + Al2O3 + Fe2O3) | 27.60 | 85.6 | 76.13 | 48.9 |
| Physical properties | – | Fly Ash (F) | Fly Ash (CI) | Slag (SL) |
| Residue 45 μm (%) | 3.00 | 9.60 | 17.50 | 1.00 |
| Density (g/cm3) | 3.15 | 2.18 | 2.43 | 2.11 |
| Blaine fineness (m2/kg) | 410 | 306 | – | 430 |
| Air Content (%) | 7.79 | – | – | – |
| Initial Setting time (min) | 113 | – | – | – |
| Compressive Strength (MPa) 1 day | 19.41 | – | – | – |
| Compressive Strength (MPa) 3 day | 30.35 | – | – | – |
| Compressive Strength (MPa) 28 day | 41.47 | – | – | – |
Table 2.
Sieve analysis of silica sand and crushed sand.
Table 2.
Sieve analysis of silica sand and crushed sand.
| U.S. Sieve # | Opening (mm) | % Retained crushed sand | % Retained silica sand |
|---|
| 16 | 1.18 | 0.00 | – |
| 20 | 0.841 | 6.0 | – |
| 30 | 0.60 | 17.50 | – |
| 40 | 0.42 | – | 0.00 |
| 50 | 0.30 | 60.0 | 2.20 |
| 70 | 0.21 | – | 14.70 |
| 100 | 0.15 | 90.25 | 47.50 |
| 140 | 0.105 | – | 28.80 |
| 200 | 0.074 | 98.75 | 6.40 |
| 270 | 0.053 | – | 0.40 |
In order to investigate the influence of aggregate type and size, and different supplementary cementing materials on the mechanical properties of ECC, two main groups of 12 ECC mixtures have been designed and selected. The first group was composed of 6 ECC mixtures which were produced using silica sand. The second group was composed of the same first group ECC mixtures but was produced using local crushed sand. The supplementary cementing materials (SCMs) used in both groups were Class-CI, Class-F fly ash and Slag. These SCMs were used as Portland cement replacement at ratios of 1.2 and 2.2 (55% and 70% by mass), respectively. Mixture proportions and designations for both groups of ECC mixtures are given in
Table 3.
Table 3.
Engineered cementitious composites (ECC) Mixture proportions.
Table 3.
Engineered cementitious composites (ECC) Mixture proportions.
| First Group-Silica Sand |
| Mixture ID | Ingredients Per 1 Part of Cement by Mass | FA/C or SL/C | W/B |
| Water | Cement | FA | Slag | Sand | PVA kg/m3 | HRWRA kg/m3 |
| CI_1.2_SS | 0.60 | 1 | 1.2 | – | 0.80 | 26 | 5.4 | 1.2 | 0.27 |
| CI_2.2_SS | 0.85 | 1 | 2.2 | – | 1.15 | 26 | 4.2 | 2.2 | 0.27 |
| F_1.2_SS | 0.60 | 1 | 1.2 | – | 0.80 | 26 | 5.4 | 1.2 | 0.27 |
| F_2.2_SS | 0.85 | 1 | 2.2 | – | 1.15 | 26 | 4.2 | 2.2 | 0.27 |
| SL_1.2_SS | 0.67 | 1 | – | 1.2 | 0.80 | 26 | 4.50 | 1.2 | 0.30 |
| SL_2.2_SS | 0.96 | 1 | – | 2.2 | 1.15 | 26 | 3.80 | 2.2 | 0.30 |
| Second Group-Crushed Sand |
| Mixture ID | Ingredients Per 1 Part of Cement by Mass | FA/C or SL/C | W/B |
| Water | Cement | FA | Slag | Sand | PVA | HRWRA |
| CI_1.2_CS | 0.60 | 1 | 1.2 | – | 0.80 | 26 | 5.4 | 1.2 | 0.27 |
| CI_2.2_CS | 0.85 | 1 | 2.2 | – | 1.15 | 26 | 4.2 | 2.2 | 0.27 |
| F_1.2_CS | 0.60 | 1 | 1.2 | – | 0.80 | 26 | 5.4 | 1.2 | 0.27 |
| F_2.2_CS | 0.85 | 1 | 2.2 | – | 1.15 | 26 | 4.2 | 2.2 | 0.27 |
| SL_1.2_CS | 0.67 | 1 | – | 1.2 | 0.80 | 26 | 4.50 | 1.2 | 0.30 |
| SL_2.2_CS | 0.96 | 1 | – | 2.2 | 1.15 | 26 | 3.80 | 2.2 | 0.30 |
The water/binder (W/B) ratio was kept in the range of 0.27 for both class CI and F fly ash and 0.30 for slag. The variable parameters in these mixtures were the aggregate type and size, and SCMs cement replacement rate (SCM/C of 1.2 and 2.2). In both groups, the amount of aggregate and SCMs to binder were held constant.
As shown in
Table 3, the ECC mixtures are labeled such that the ingredients are identifiable from their Mix IDs. The first letter in the mixture designations indicates the SCM type (CI, class-CI fly ash; F, class-F fly ash; SL, slag). The numbers after the letter indicate the SCM (CI, F or SL)—cement ratio and last letters represent aggregate type (SS or CS).
2.2. Specimen Preparation
Hobart type mixer with 20-liter capacity was used in preparing all ECC mixtures. All materials of ECC mixtures were weighed separately before starting mixing. All dry materials except PVA fiber such as cement, SCMs (FA or SL), and silica or crushed sands were thrown into the mixer for the dry mix. After 30 s dry mix, 90% of water was added into the mixer for another 2 min. Then the remaining 10% of water and HRWRA were added within the next 1 min. The final step of mixing procedure was to add the PVA fiber into the mixer and the mix was stirred for another 3 min. It should be noted that HRWRA content was not kept constant which means slight adjustment in the amount of HRWRA in each mixture was performed to achieve better fiber dispersion and workability based on past experience.
In the fresh state, workability of ECC mixtures was determined by slump flow test according to ASTM C 1611 [
26]. Cube specimens measuring 50 mm × 50 mm × 50 mm were cast to determine compressive strength at the age of 28 days. Although the scope of the paper is limited to the behavior of ECC under flexural loading, the results of slump flow and compressive strength tests are summarized in
Table 4. Slump flow values of ECC mixtures ranged between 415 and 540 mm. All ECC mixtures were found flowable and showed no bleeding. The 28 day compressive strength varied from 45 to 69 MPa. ECC mixtures with class CI fly ash exhibited slightly higher compressive strength than Class F while those with Slag showed higher compressive strength than those with fly ash CI or F—the higher compressive strength was attributed to the higher content of CaO. The compressive strength decreases with the increase of fly ash content while decreased with the replacement of silica sand by crushed sand.
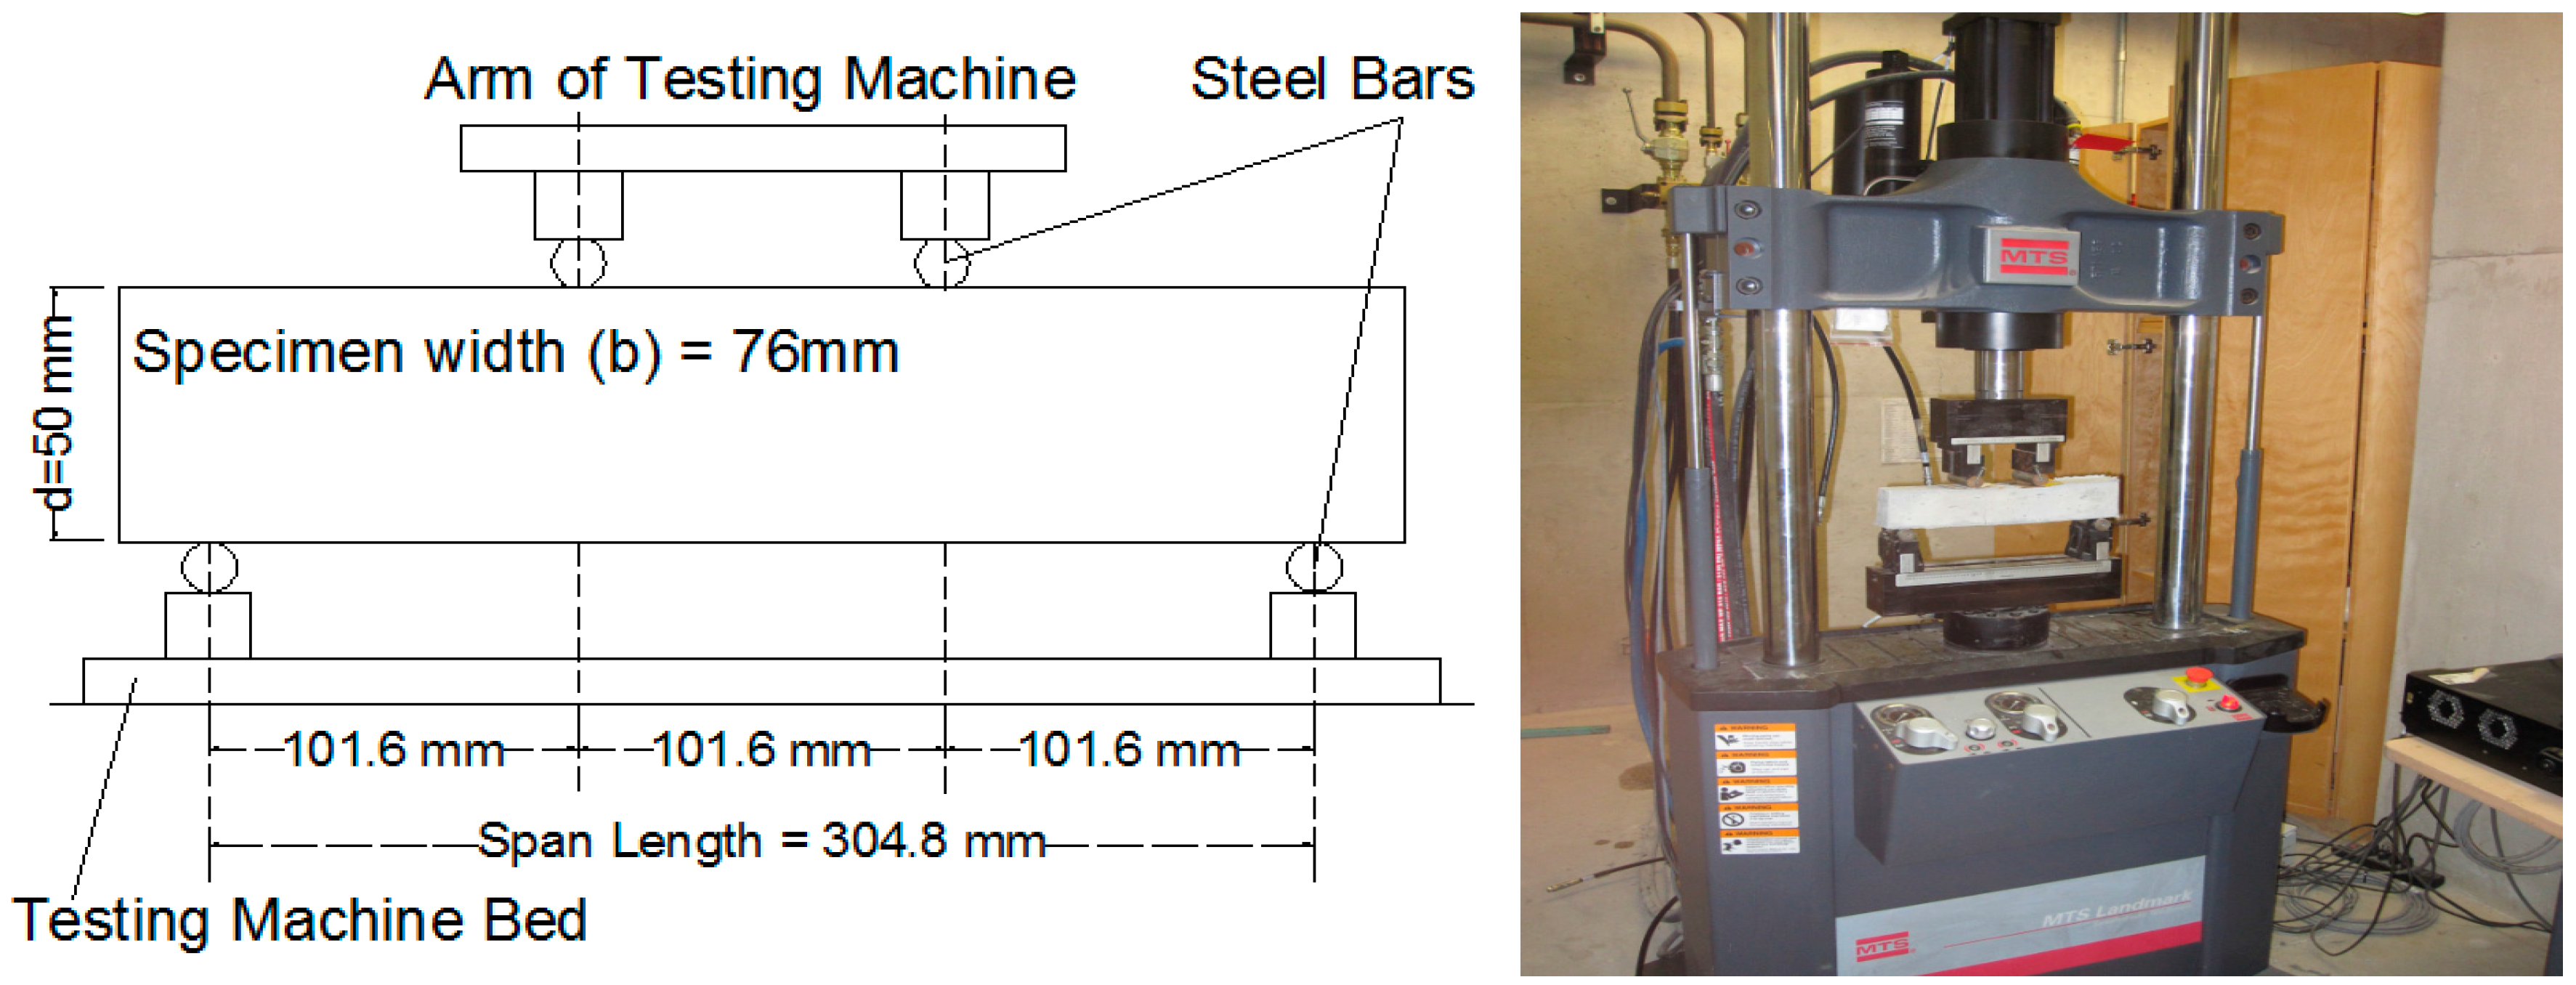
355 mm × 50 mm × 76 mm prism (beam) specimens were prepared for the four-point bending test. The total number of all prismatic specimens prepared for this study was 168 beams. All specimens were demolded after 24 h and moisture cured in plastic bags at 95% ± 5% relative humidity (RH), 23 ± 2 °C. The specimens were kept in the curing room until the day of testing.
2.3. Test Procedures
Three prismatic samples of 355 mm × 50 mm × 76 mm were prepared to measure the flexural strength of ECC (Modulus of rupture), for ages 28 and 56 days by performing four-point bending test under displacement control condition at a loading rate of 0.005 mm/s on a closed-loop servo-controlled loading system. The span length of flexural loading was 304.8 mm with a 101.6 mm center span length. During the flexural tests, the load and the mid-span deflection were recorded on a computerized data recording system. The schematic of the test setup with a photo is presented in
Figure 1. Flexural strength of the specimens was calculated in accordance with ASTM C 78 [
27].
Table 4.
Average flexural strength and ultimate deflection results at ages 28 and 56 days.
Table 4.
Average flexural strength and ultimate deflection results at ages 28 and 56 days.
| Mix No. | Mix Designation | Slump Flow (mm) | 28-Day Compressive Strength (MPa) | Flexural Properties |
|---|
| 28 Days | 56 Days |
|---|
| Strength (MPa) | Deflection (mm) | Strength (MPa) | Deflection (mm) |
|---|
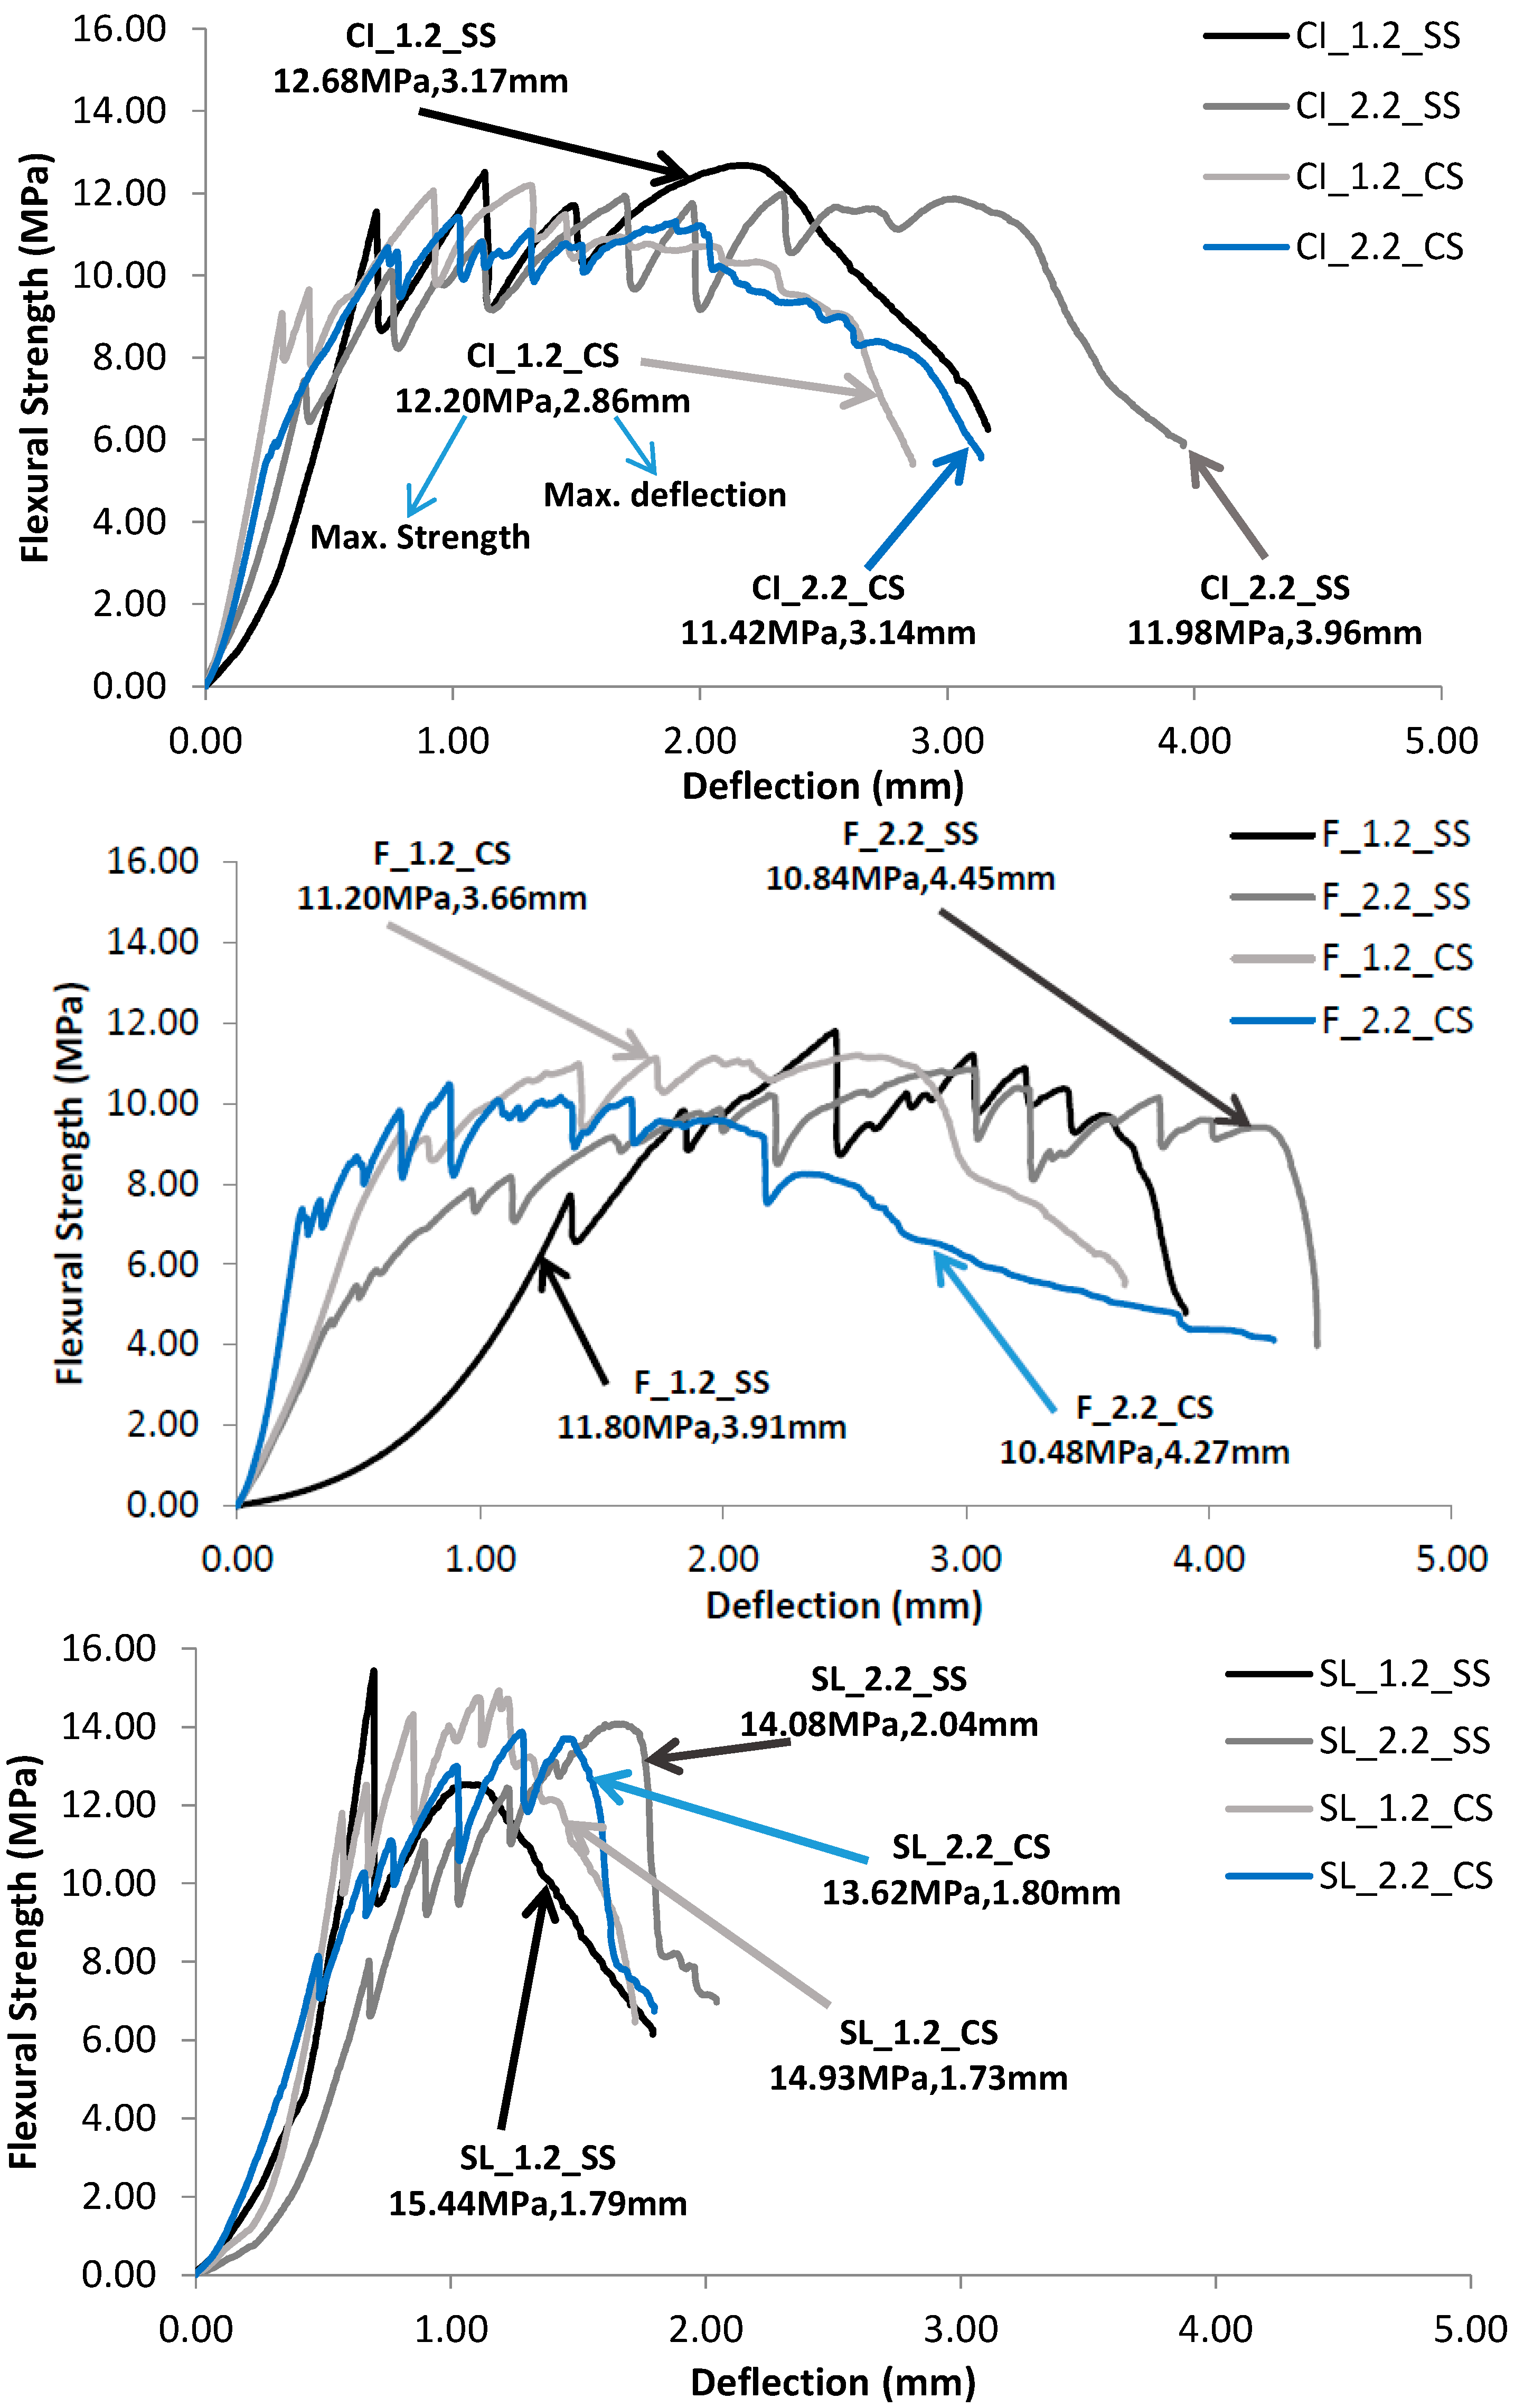
| 1 | CI_1.2_SS | 540 | 62 (±2) | 12.68 (±0.5) | 3.17 (±0.2) | 13.83 (±0.5) | 2.67 (±0.15) |
| 2 | CI_2.2_SS | 530 | 53 (±2) | 11.98 (±0.5) | 3.96 (±0.2) | 13.27 (±0.5) | 3.56 (±0.15) |
| 3 | F_1.2_SS | 535 | 61 (±2) | 11.80 (±0.5) | 3.91 (±0.2) | 12.38 (±0.5) | 3.75 (±0.15) |
| 4 | F_2.2_SS | 530 | 52 (±2) | 10.84 (±0.5) | 4.45 (±0.2) | 12.25 (±0.5) | 3.98 (±0.15) |
| 5 | SL_1.2_SS | 550 | 69 (±2) | 15.44 (±0.5) | 1.79 (±0.2) | 15.81 (±0.5) | 1.74 (±0.15) |
| 6 | SL_2.2_SS | 485 | 67 (±2) | 14.08 (±0.5) | 2.04 (±0.2) | 14.38 (±0.5) | 1.86 (±0.15) |
| 7 | CI_1.2_CS | 520 | 60 (±2) | 12.20 (±0.5) | 2.86 (±0.2) | 12.92 (±0.5) | 2.41 (±0.15) |
| 8 | CI_2.2_CS | 500 | 47 (±2) | 11.42 (±0.5) | 3.14 (±0.2) | 12.64 (±0.5) | 2.56 (±0.15) |
| 9 | F_1.2_CS | 490 | 59 (±2) | 11.20 (±0.5) | 3.66 (±0.2) | 12.12 (±0.5) | 3.26 (±0.15) |
| 10 | F_2.2_CS | 515 | 45 (±2) | 10.48 (±0.5) | 4.27 (±0.2) | 11.68 (±0.5) | 4.02 (±0.15) |
| 11 | SL_1.2_CS | 420 | 69 (±2) | 14.93 (±0.5) | 1.73 (±0.2) | 15.24 (±0.5) | 1.61 (±0.15) |
| 12 | SL_2.2_CS | 415 | 67 (±2) | 13.62 (±0.5) | 1.80 (±0.2) | 13.87 (±0.5) | 1.64 (±0.15) |
Figure 1.
Four point bending test setup.
Figure 1.
Four point bending test setup.
Two approaches were adopted for investigating the ECC performance under fatigue flexural test: the first was applying different fatigue stress levels and the second was applying different fatigue cyclic loading. Accordingly, four prismatic samples of 355 mm × 50 mm × 76 mm were prepared for the age of 28 days. The four-point bending test was conducted under both static and fatigue loading. Two out of four samples were prepared for static loading tests as control specimens which were carried out under displacement control conditions, while the other two samples were prepared for fatigue loading tests which were performed under load control conditions. Specimens were simply supported on a span of 304.8 mm and subjected to two-point loads at one-third of the span as shown in
Figure 1.
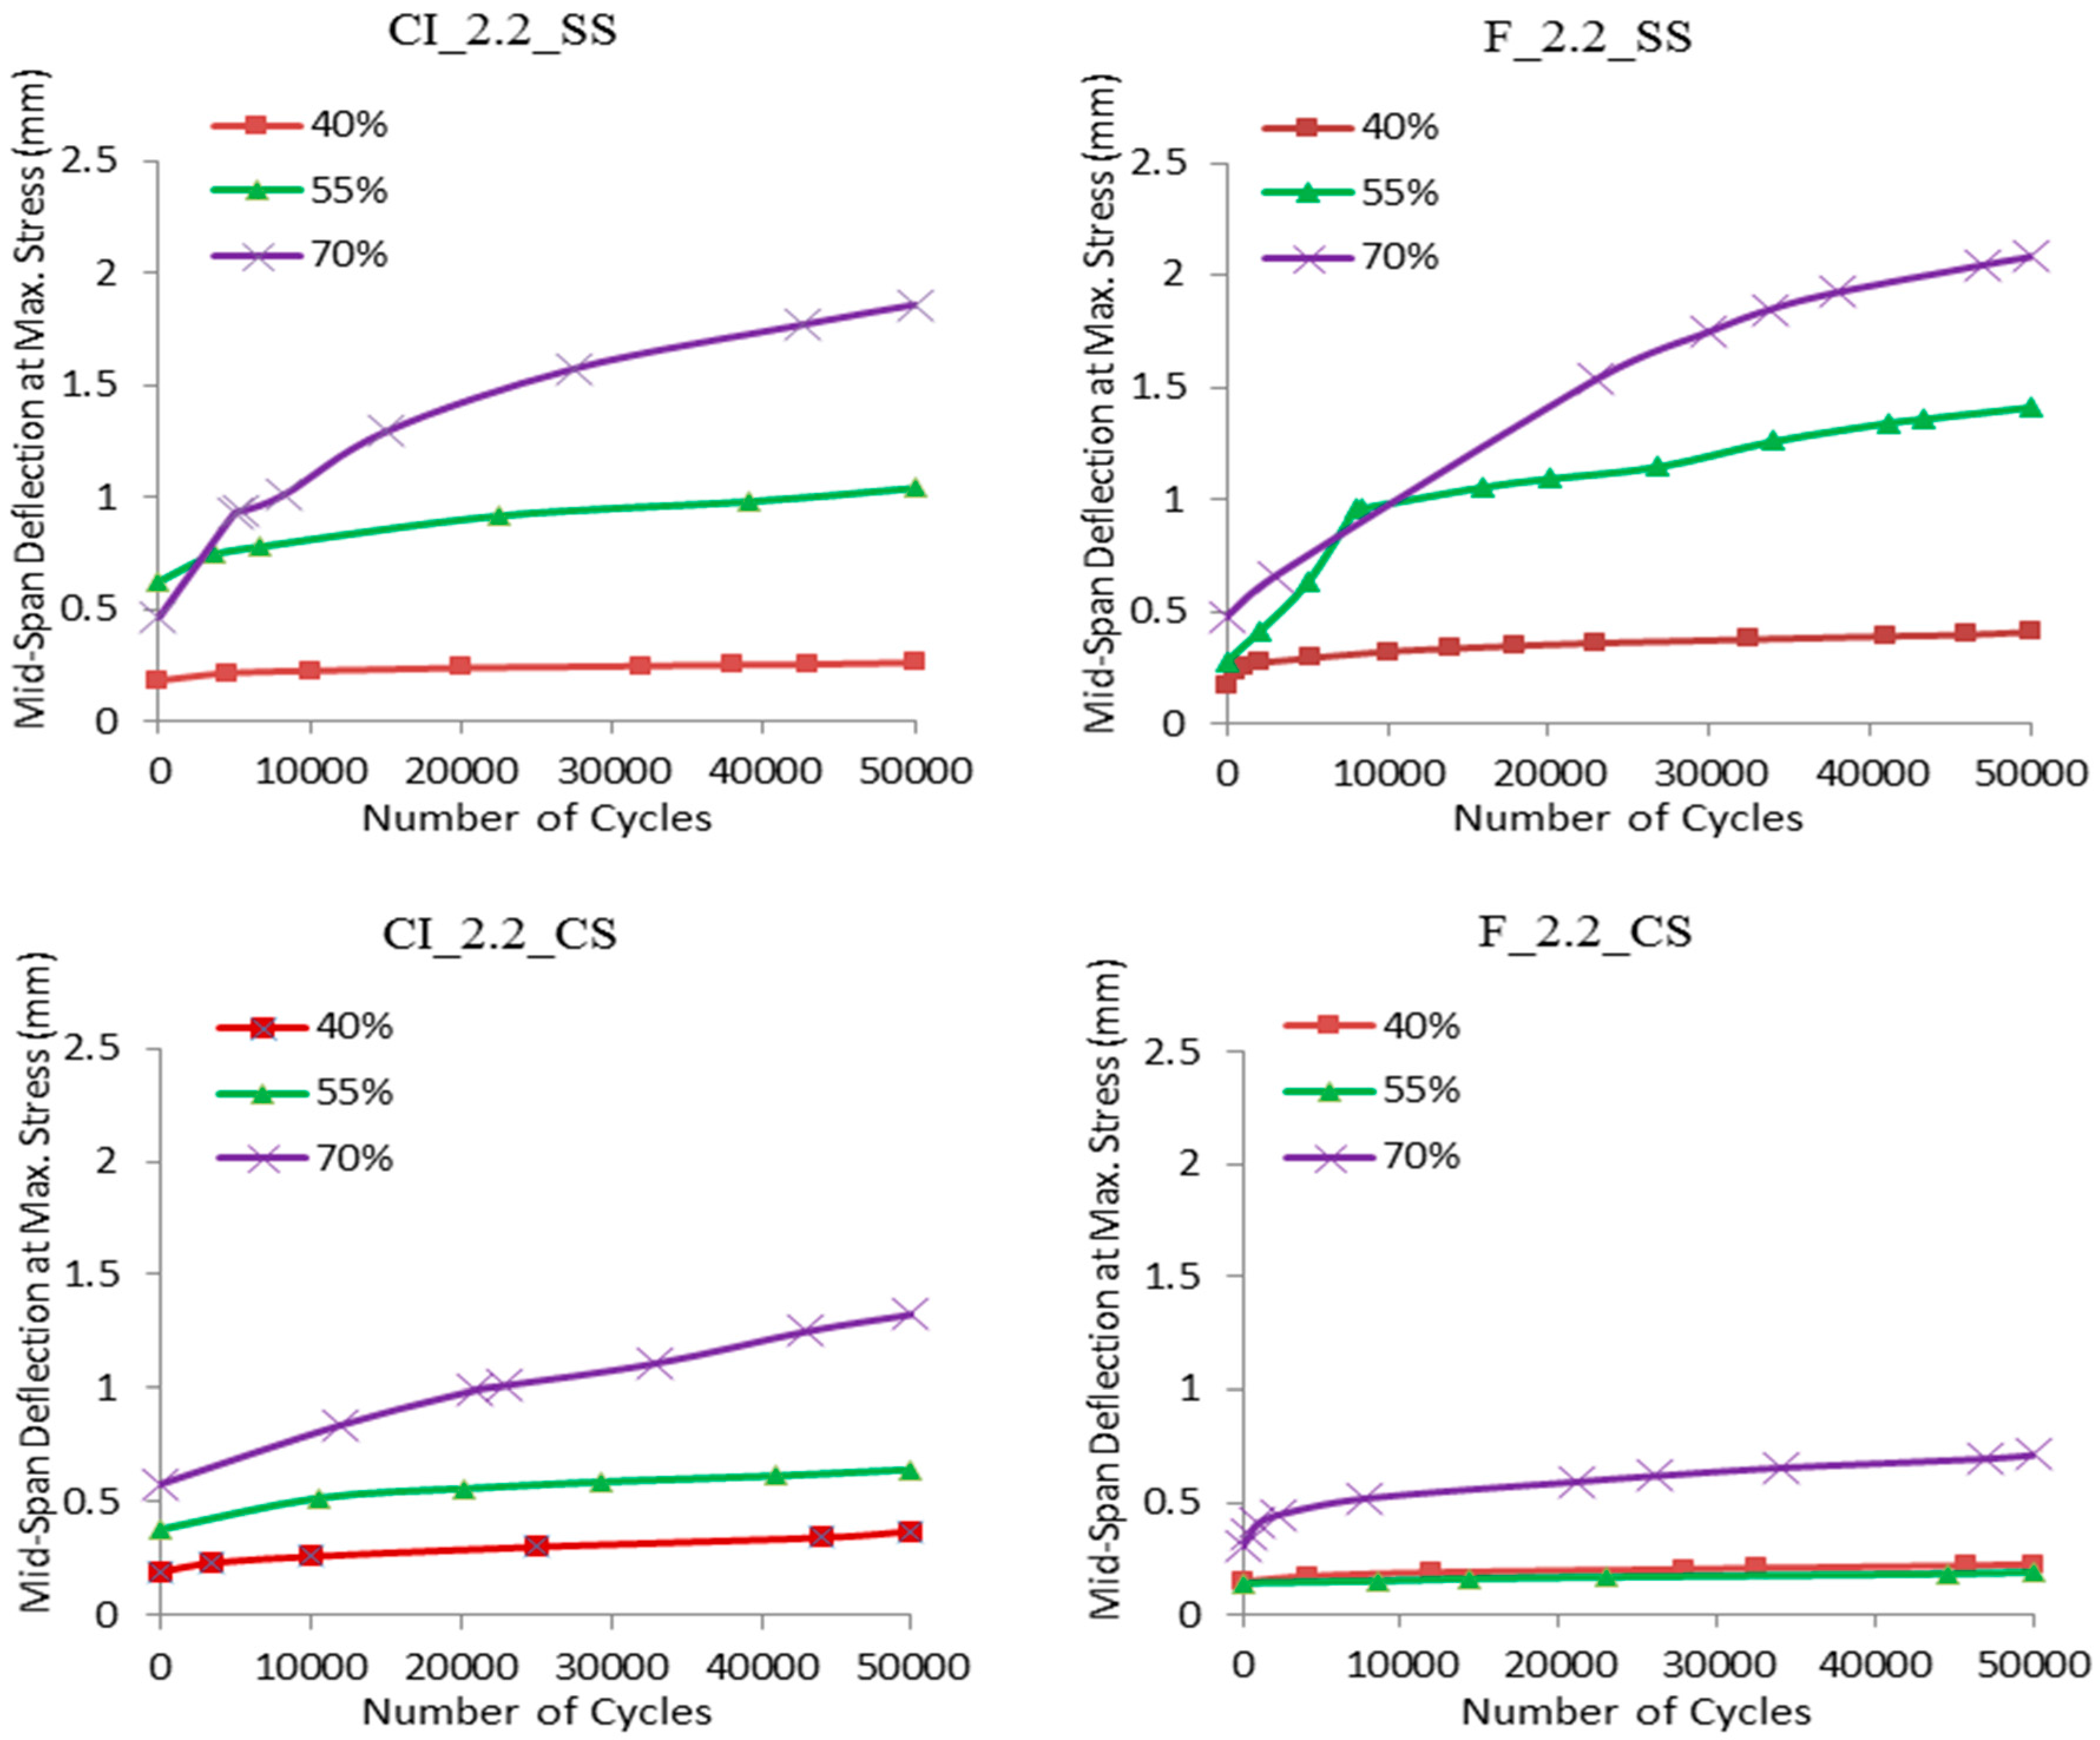
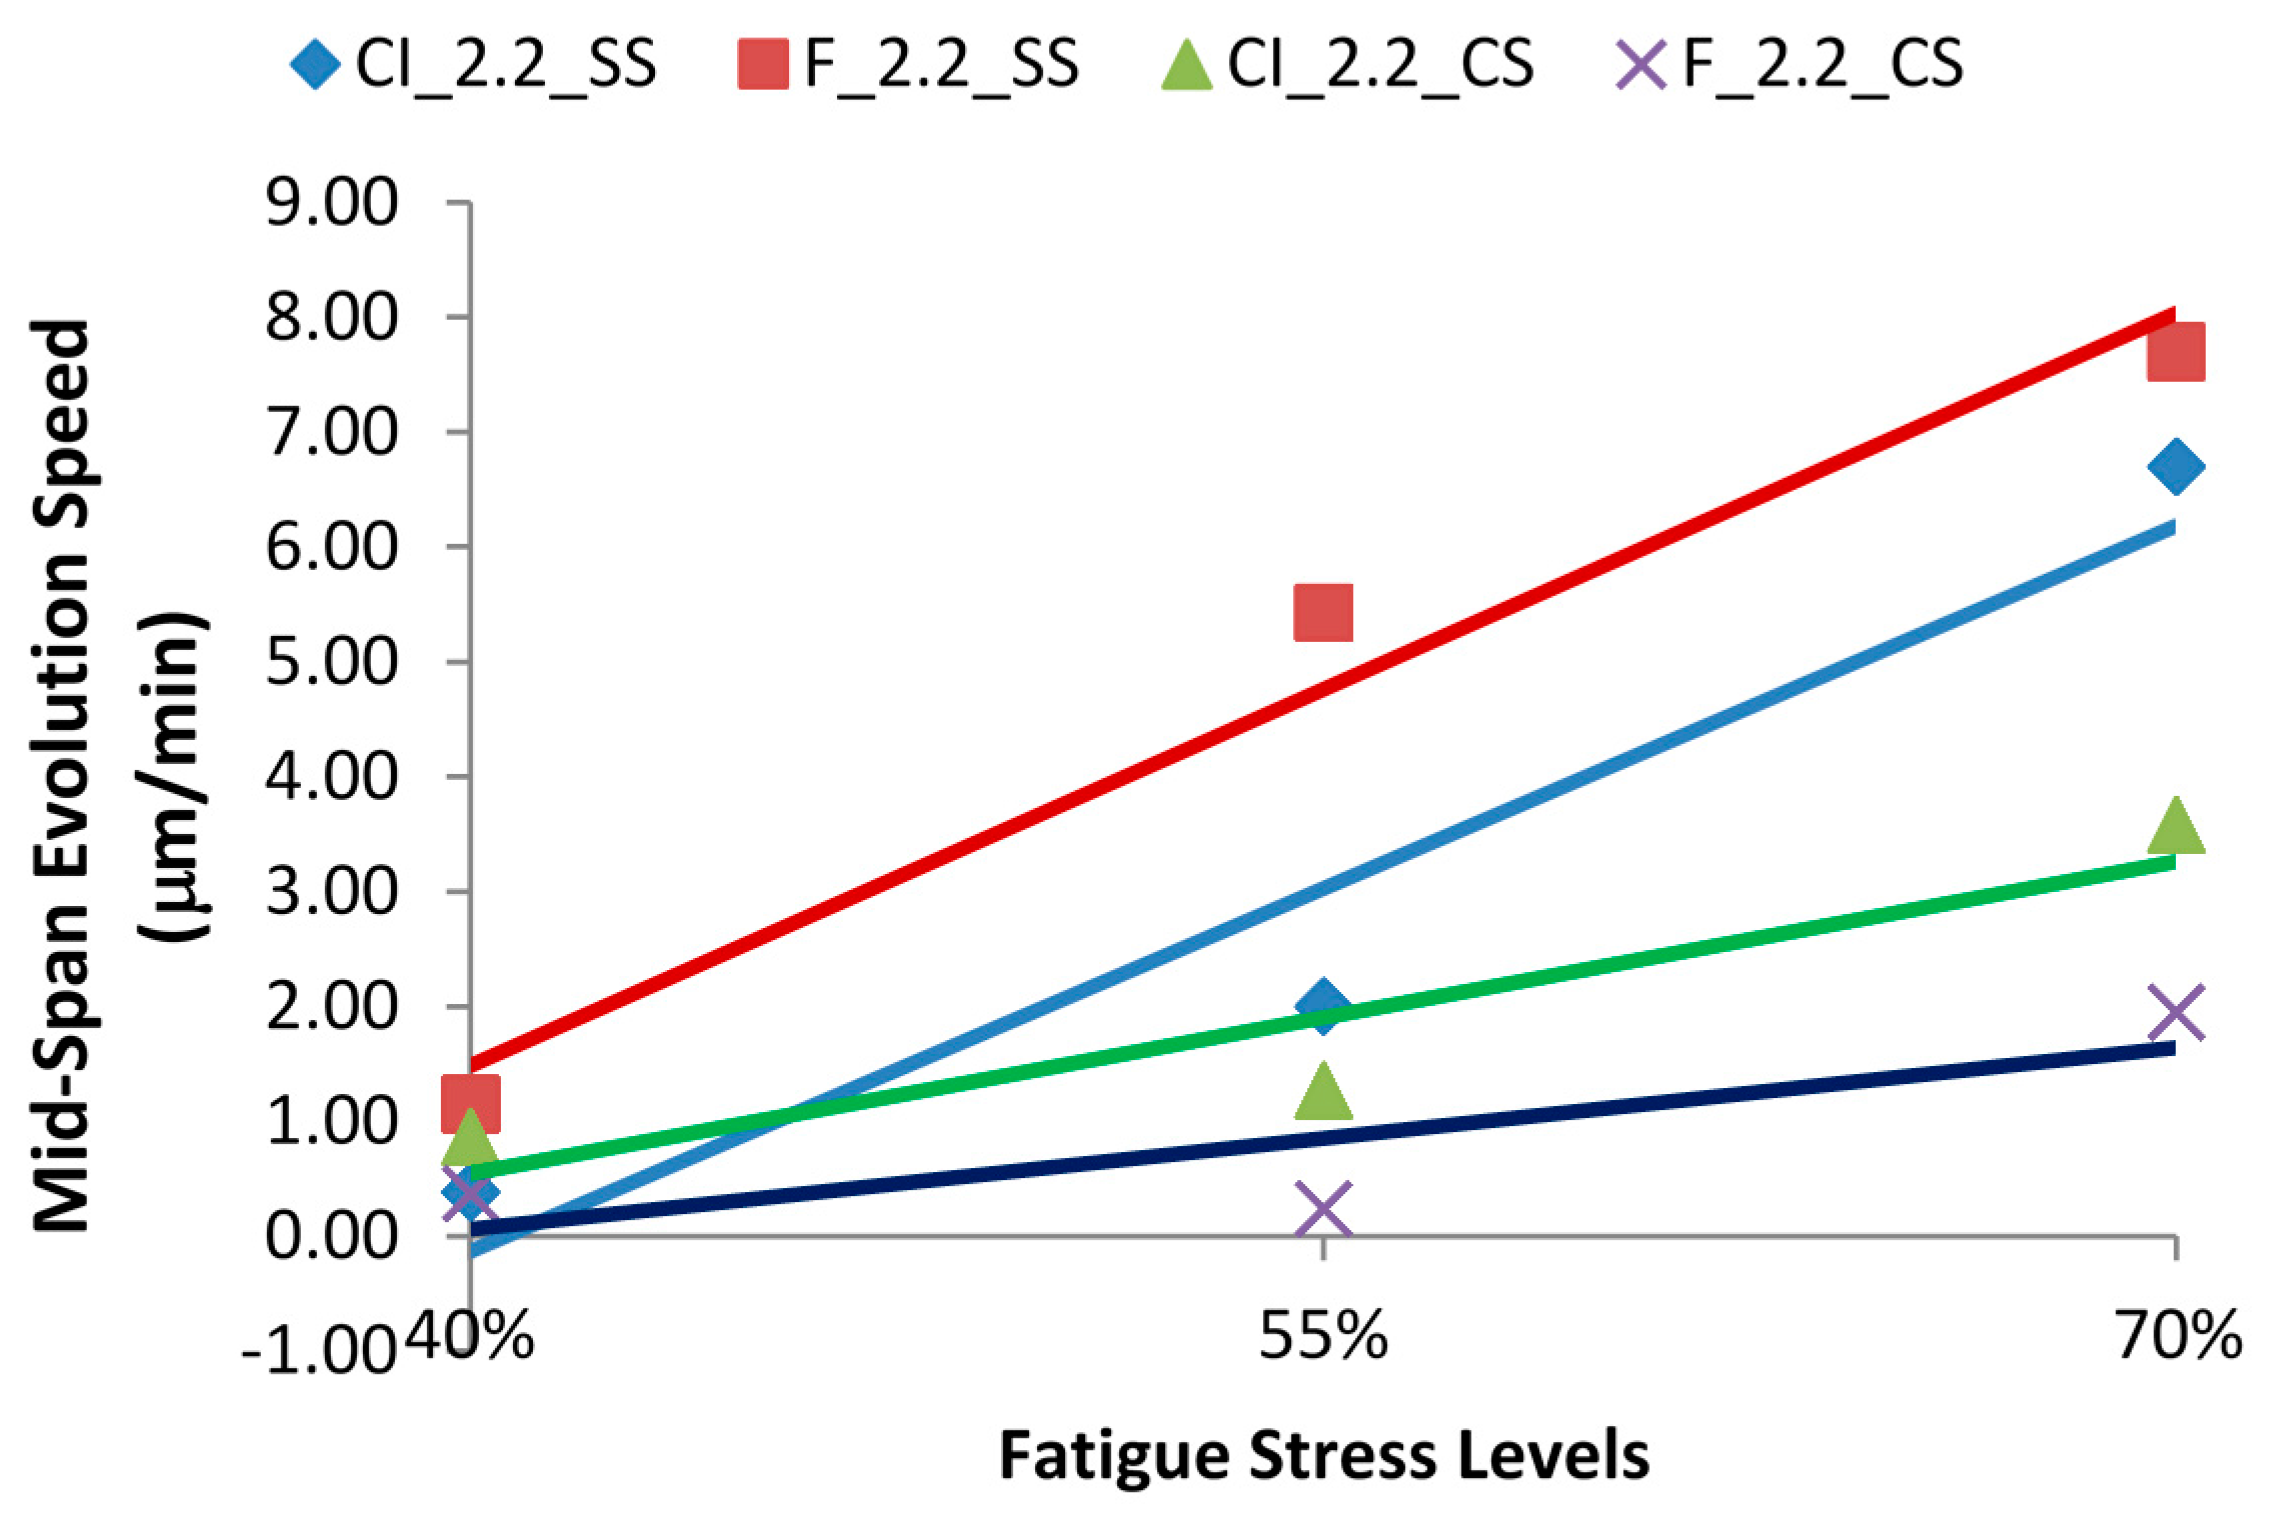
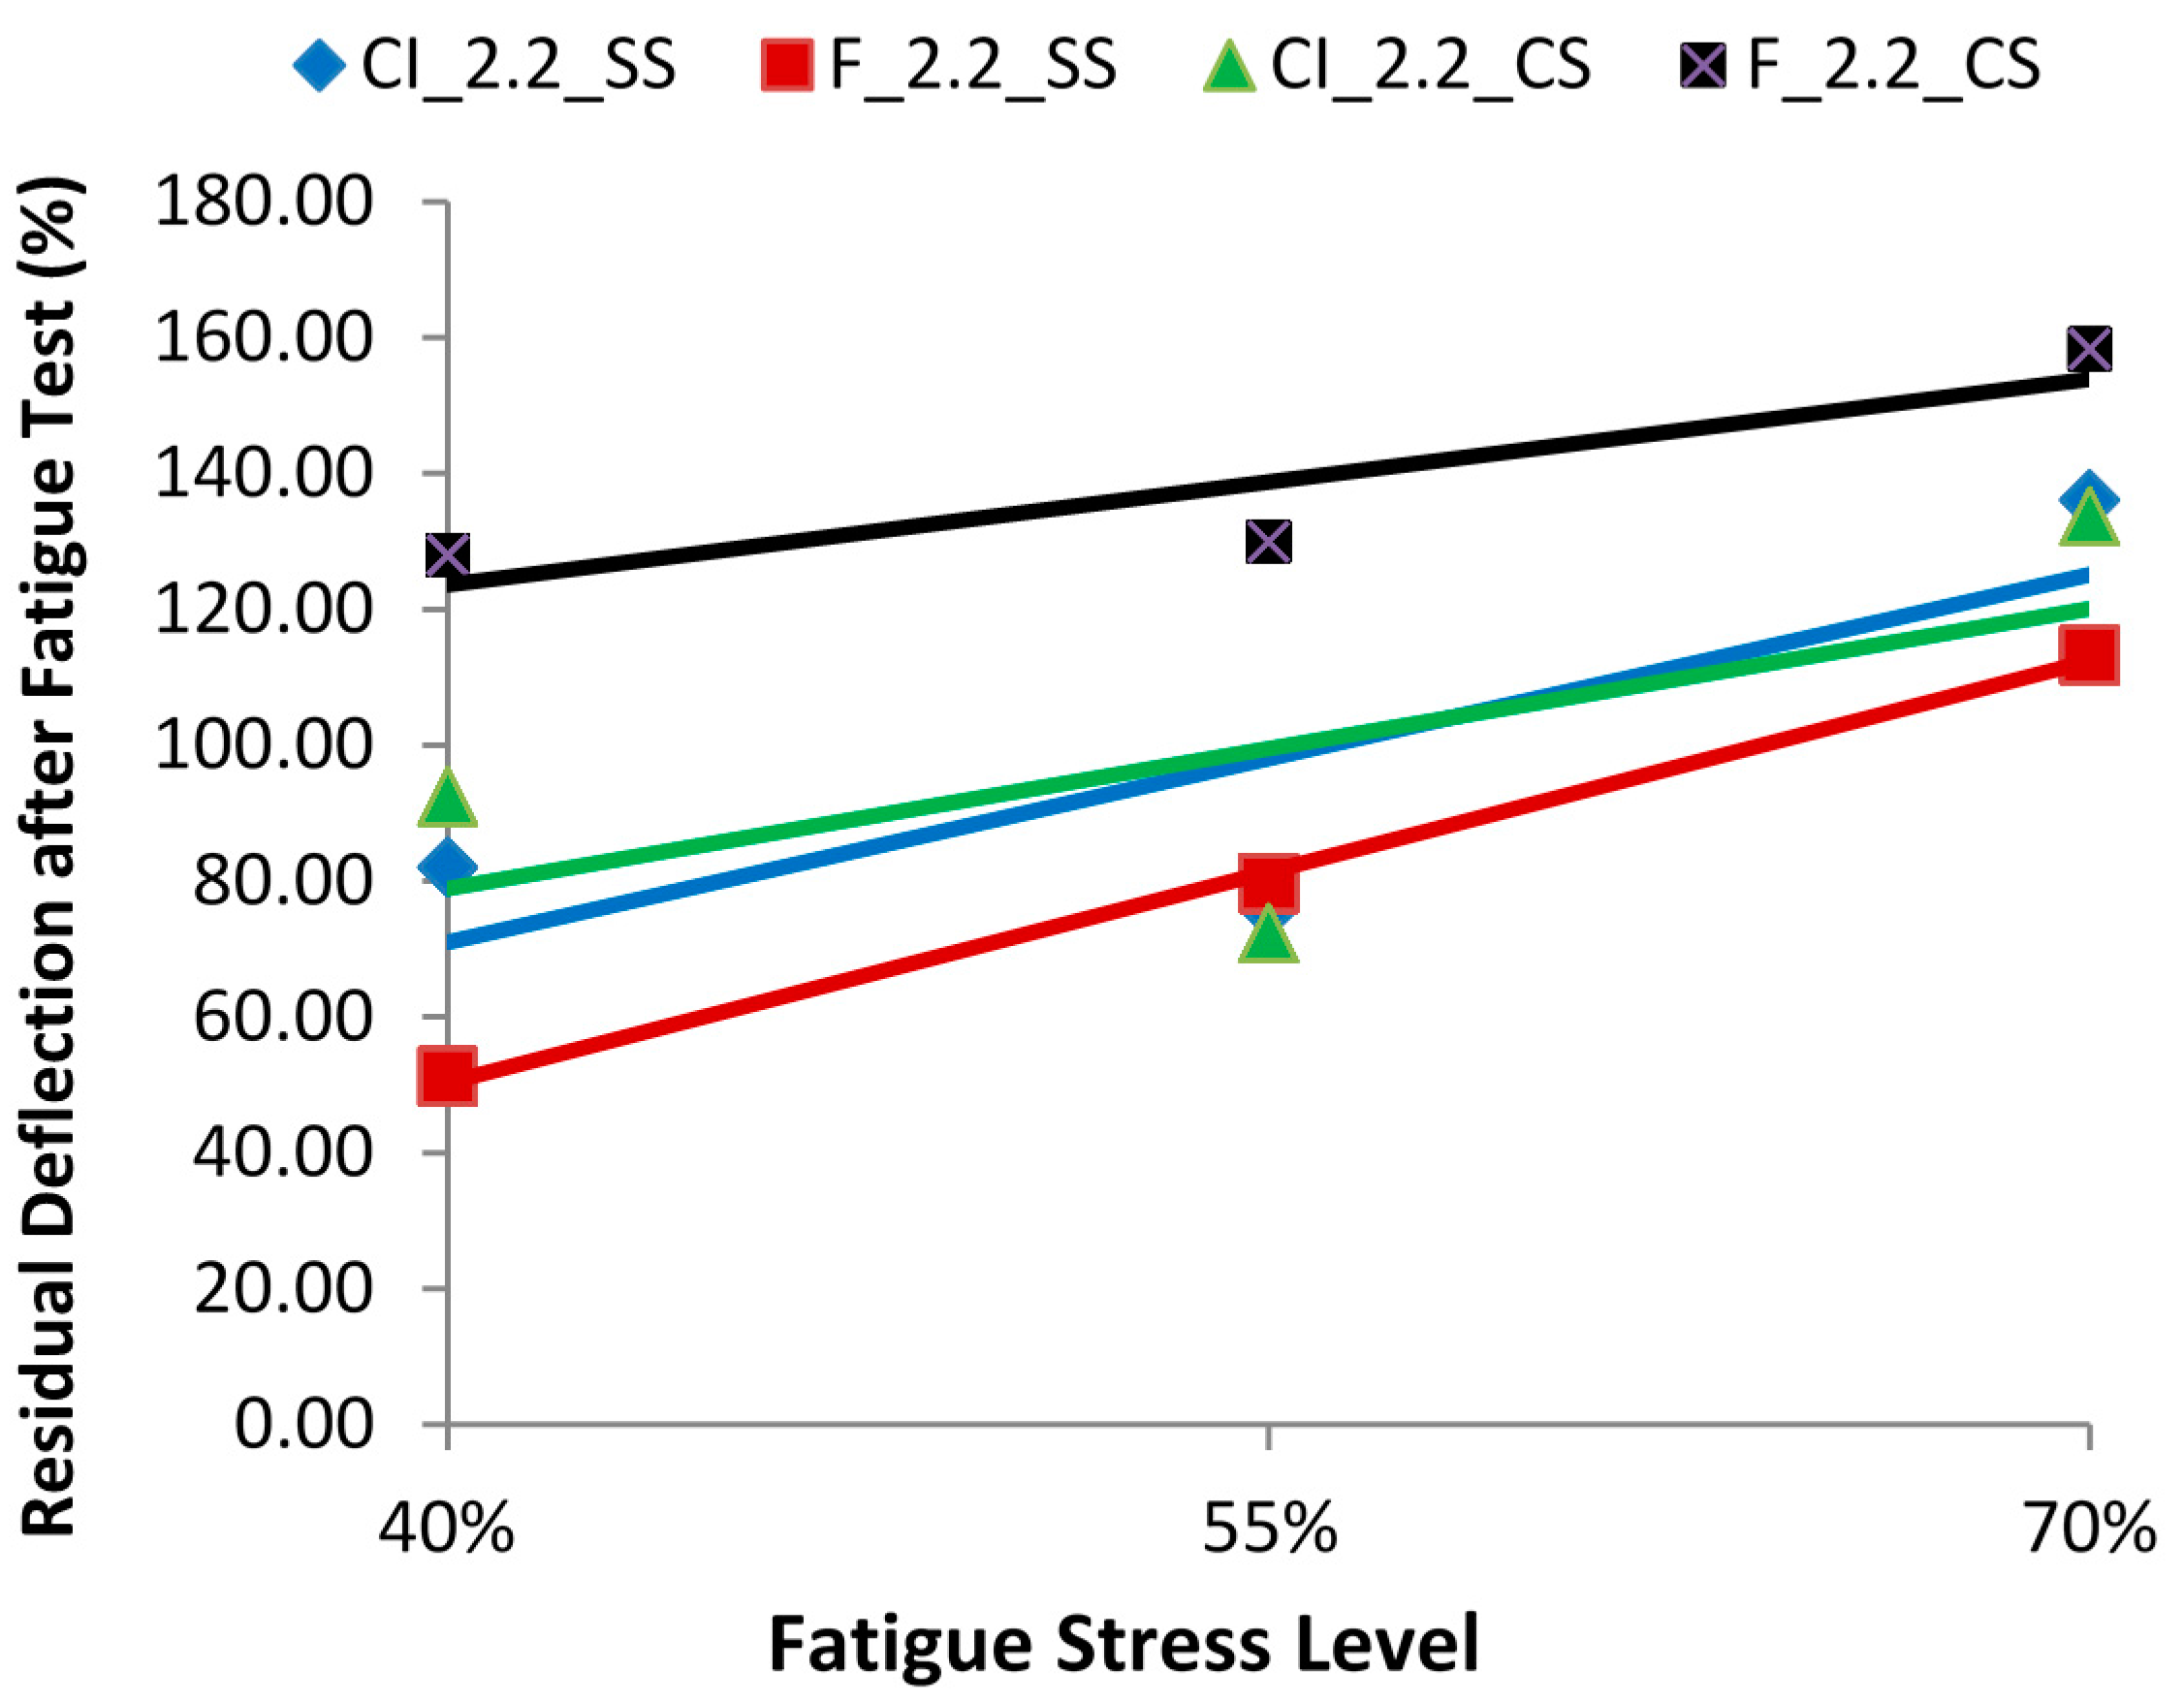
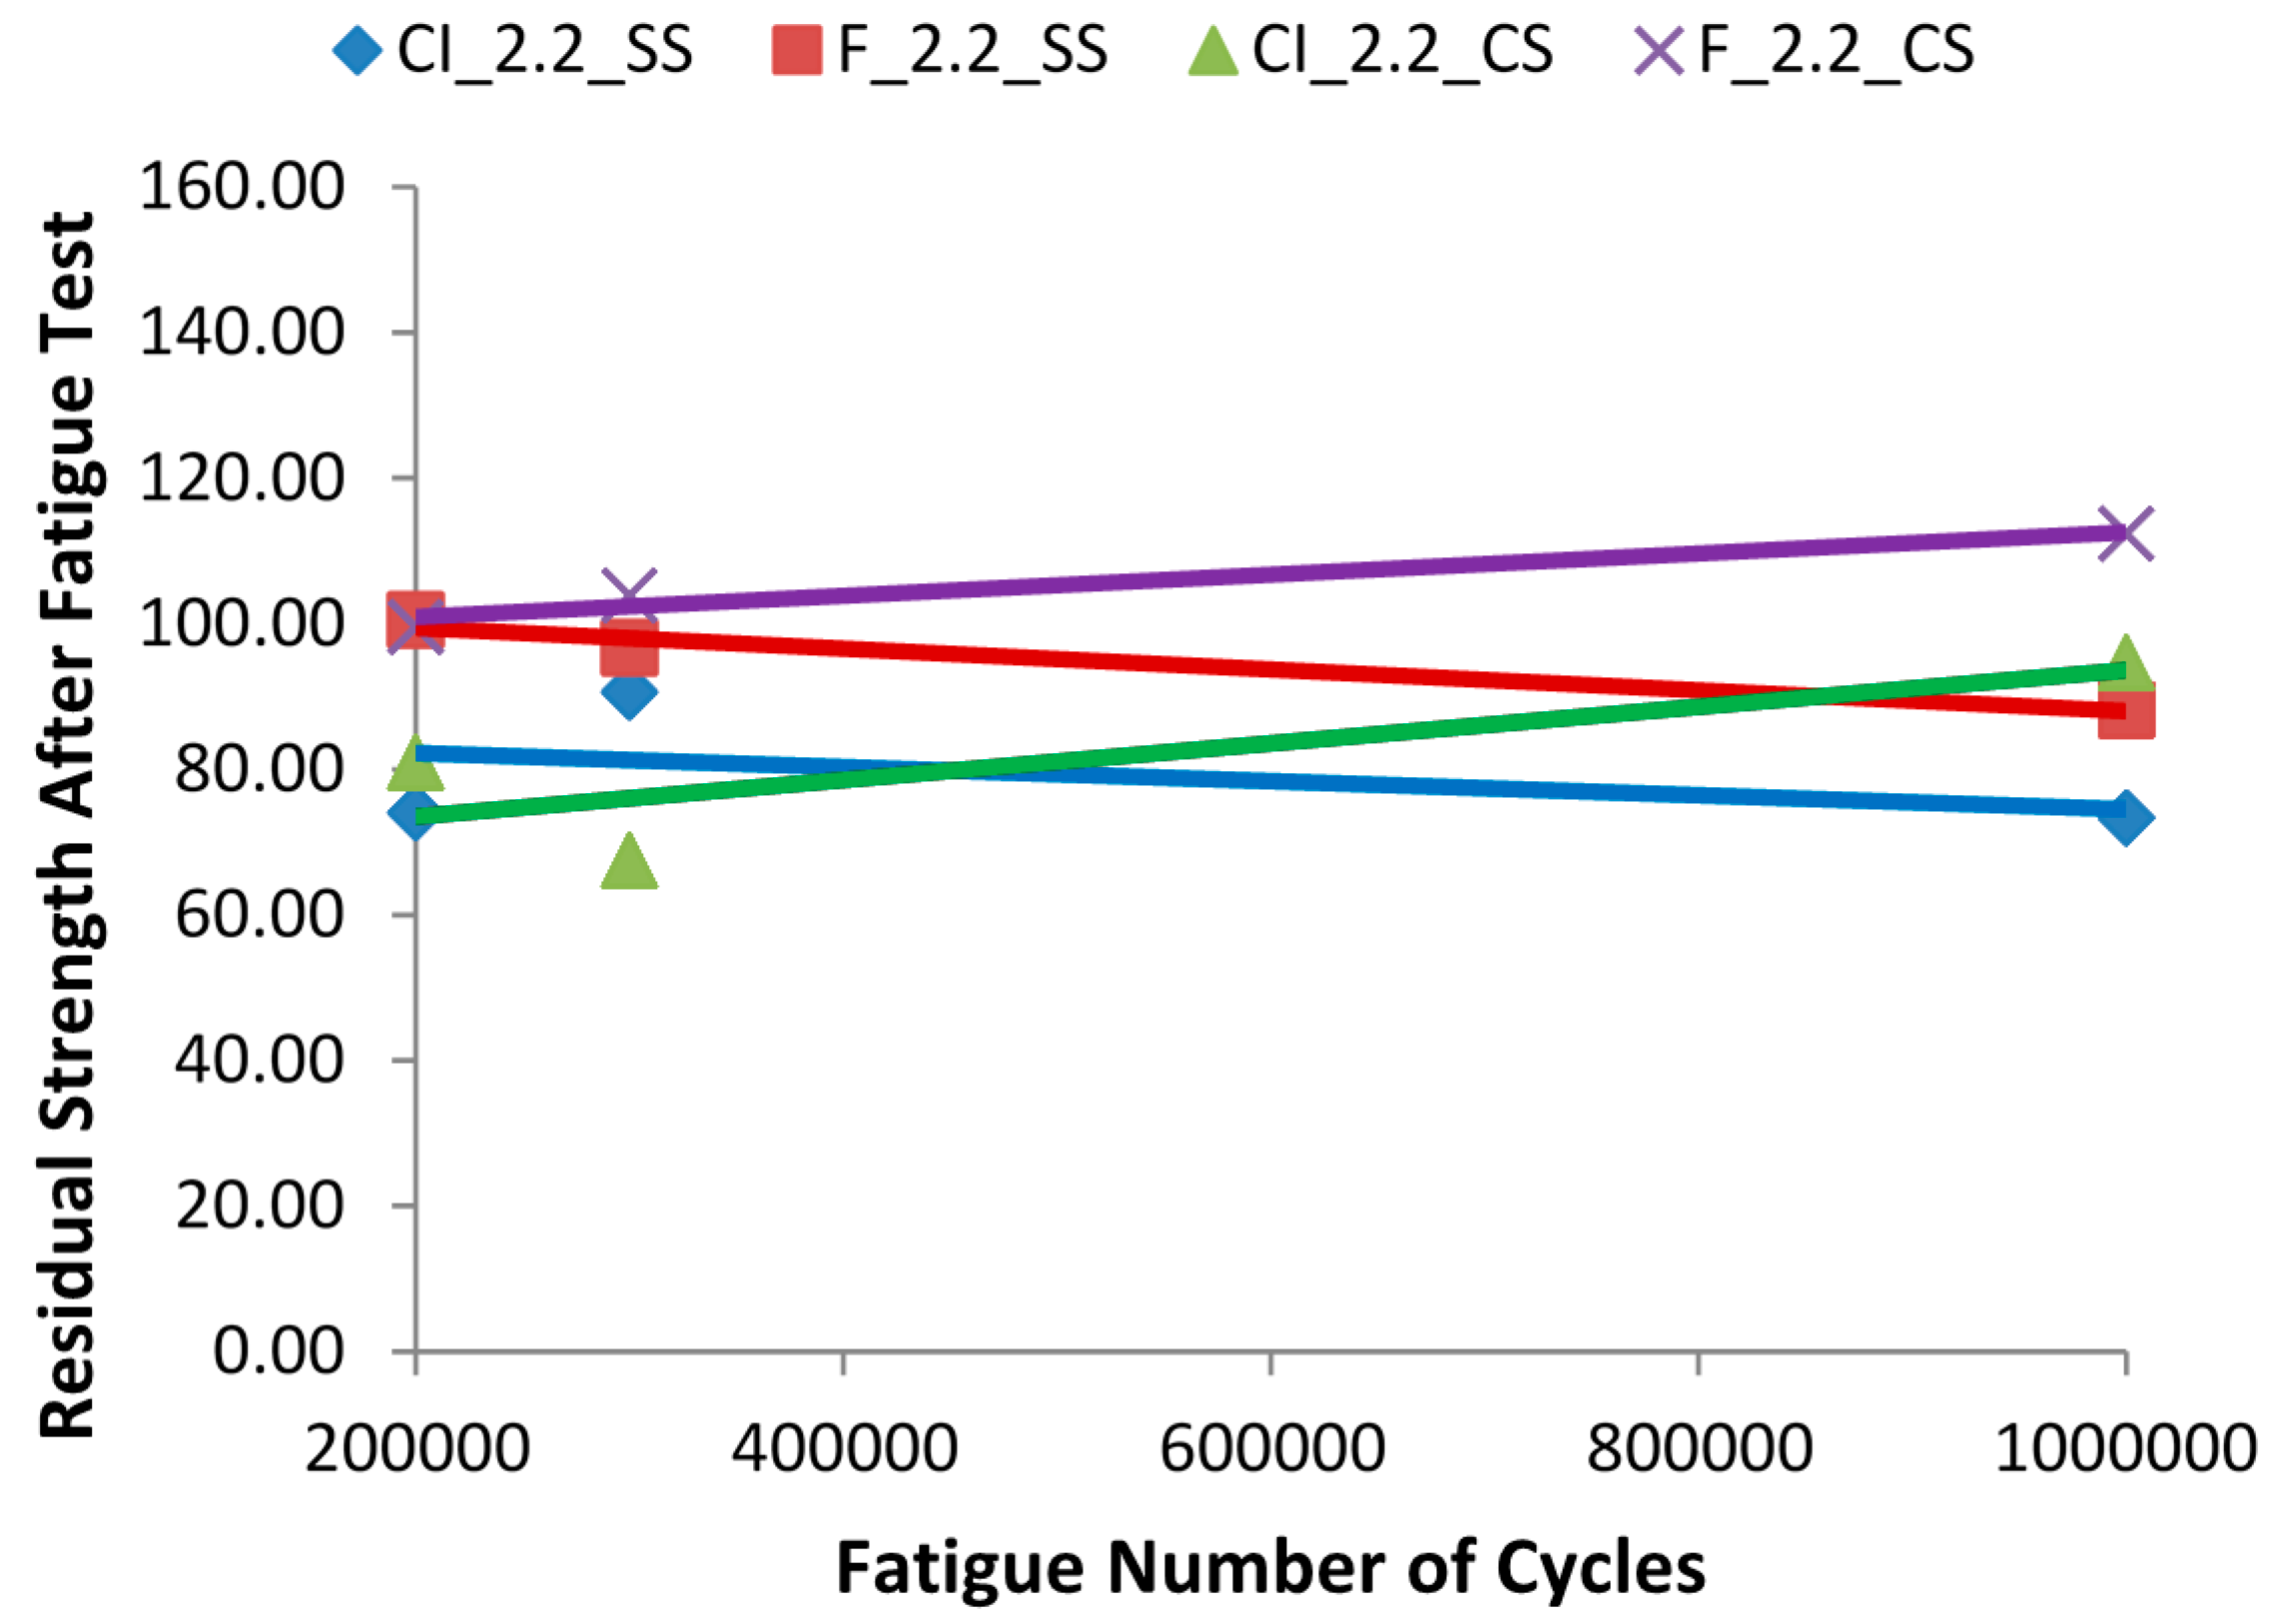
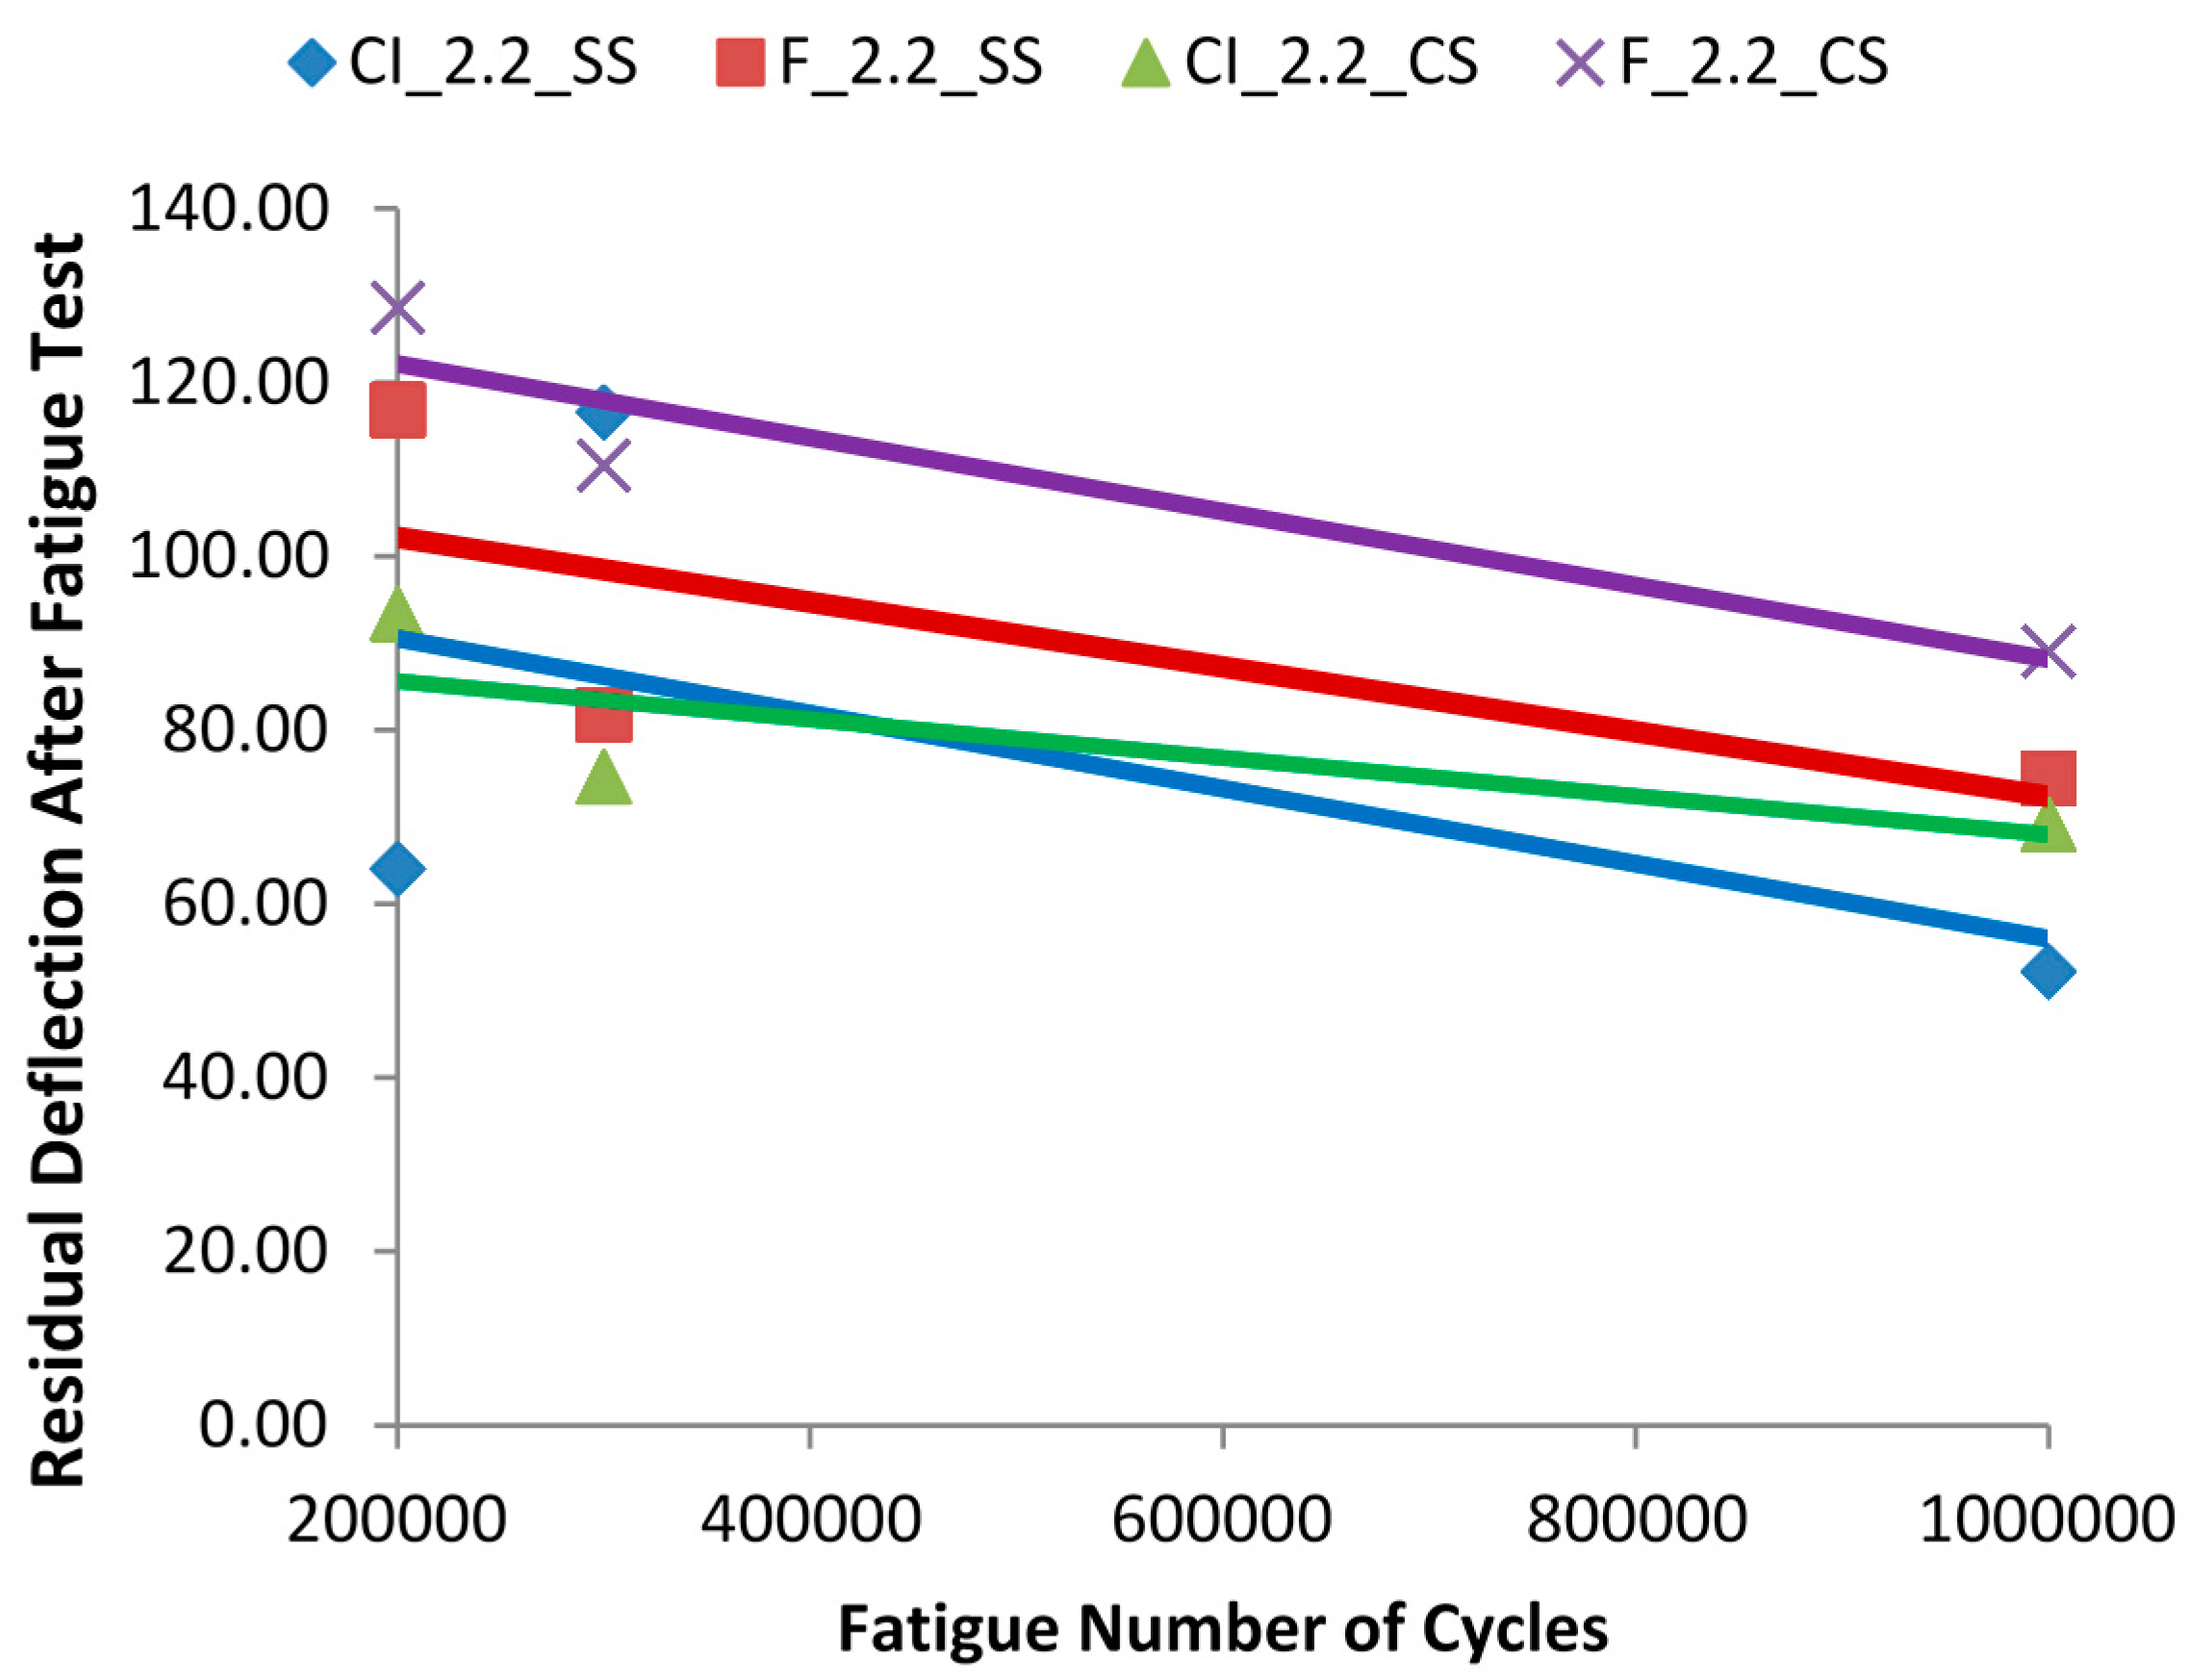
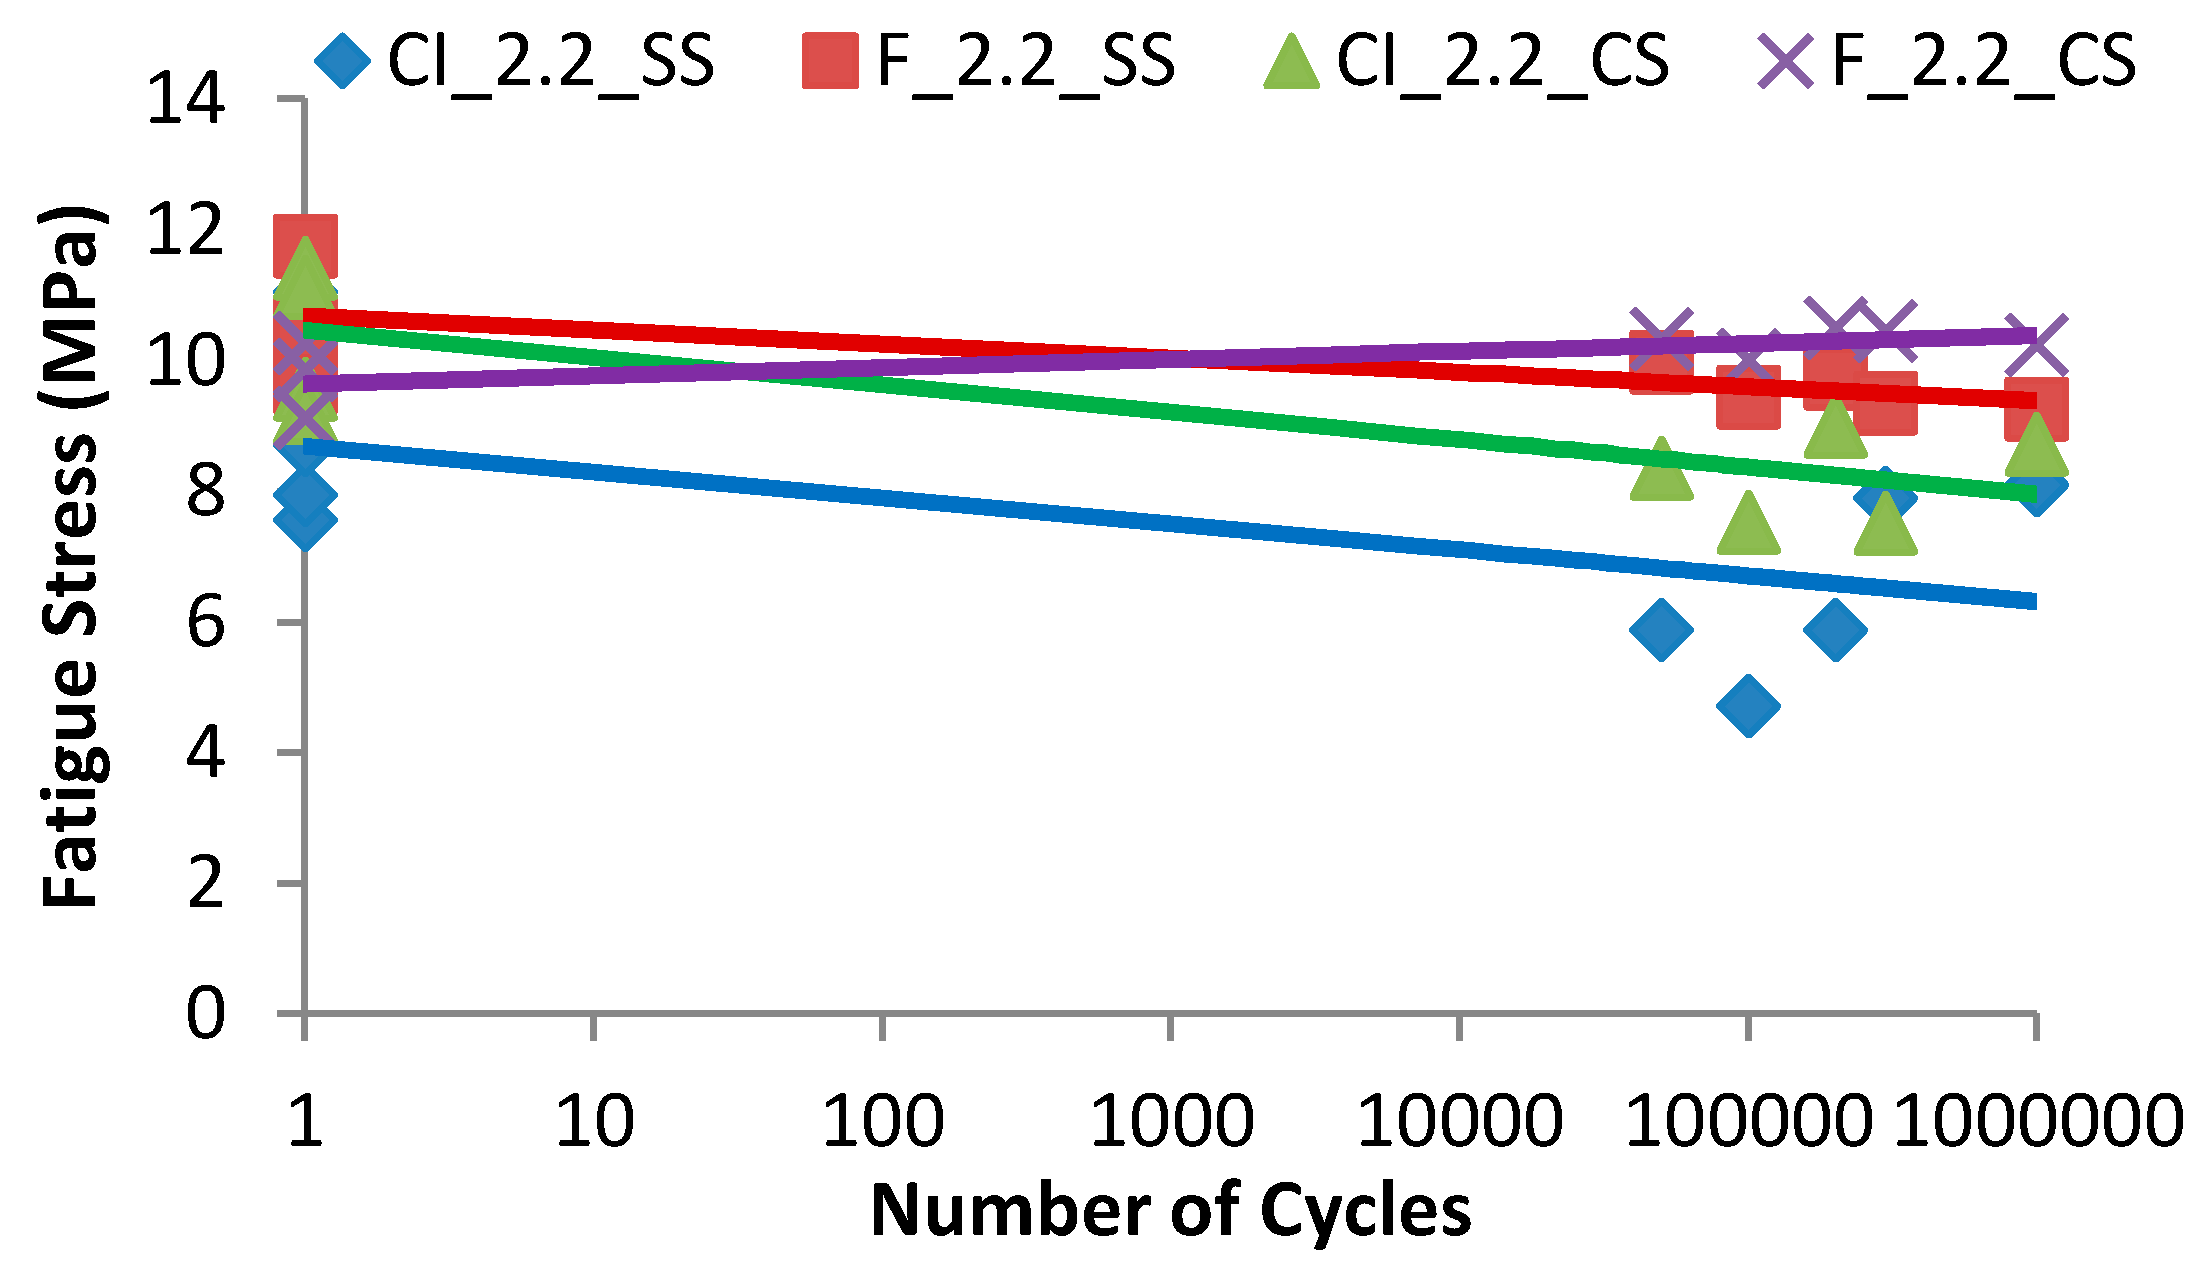
In the first approach, static flexural tests were conducted before fatigue flexural tests at the constant rate of 0.005 mm/s. The static flexural strengths were determined by averaging the flexural strength results of ECC control specimens. Based on their static flexural averages, the different maximum fatigue stress levels were determined as 40%, 55% and 70% and the tests were conducted at 50,000 cycles and 4 Hz cyclic loading rate. In the second approach, 55% of fatigue stress level value was fixed and tests were conducted at different fatigue cycles namely 200,000 cycles, 300,000 cycles and 1,000,000 cycles at the same 4 Hz cyclic loading rate as well.
Fatigue flexural tests were performed under load control conditions. The ratio between minimum and maximum flexural stress was set equal to 0.30 for all specimens in order to avoid any impact and slip of specimens during testing. At the first cycle of each specimen, load was gradually applied to the maximum stress level at 0.50 kN/min static loading rate in order to avoid any sudden collapse in the specimen. The cyclic fatigue loading was then applied. The fatigue testing technique mentioned above was adopted in accordance with Suthiwarapirak
et al. [
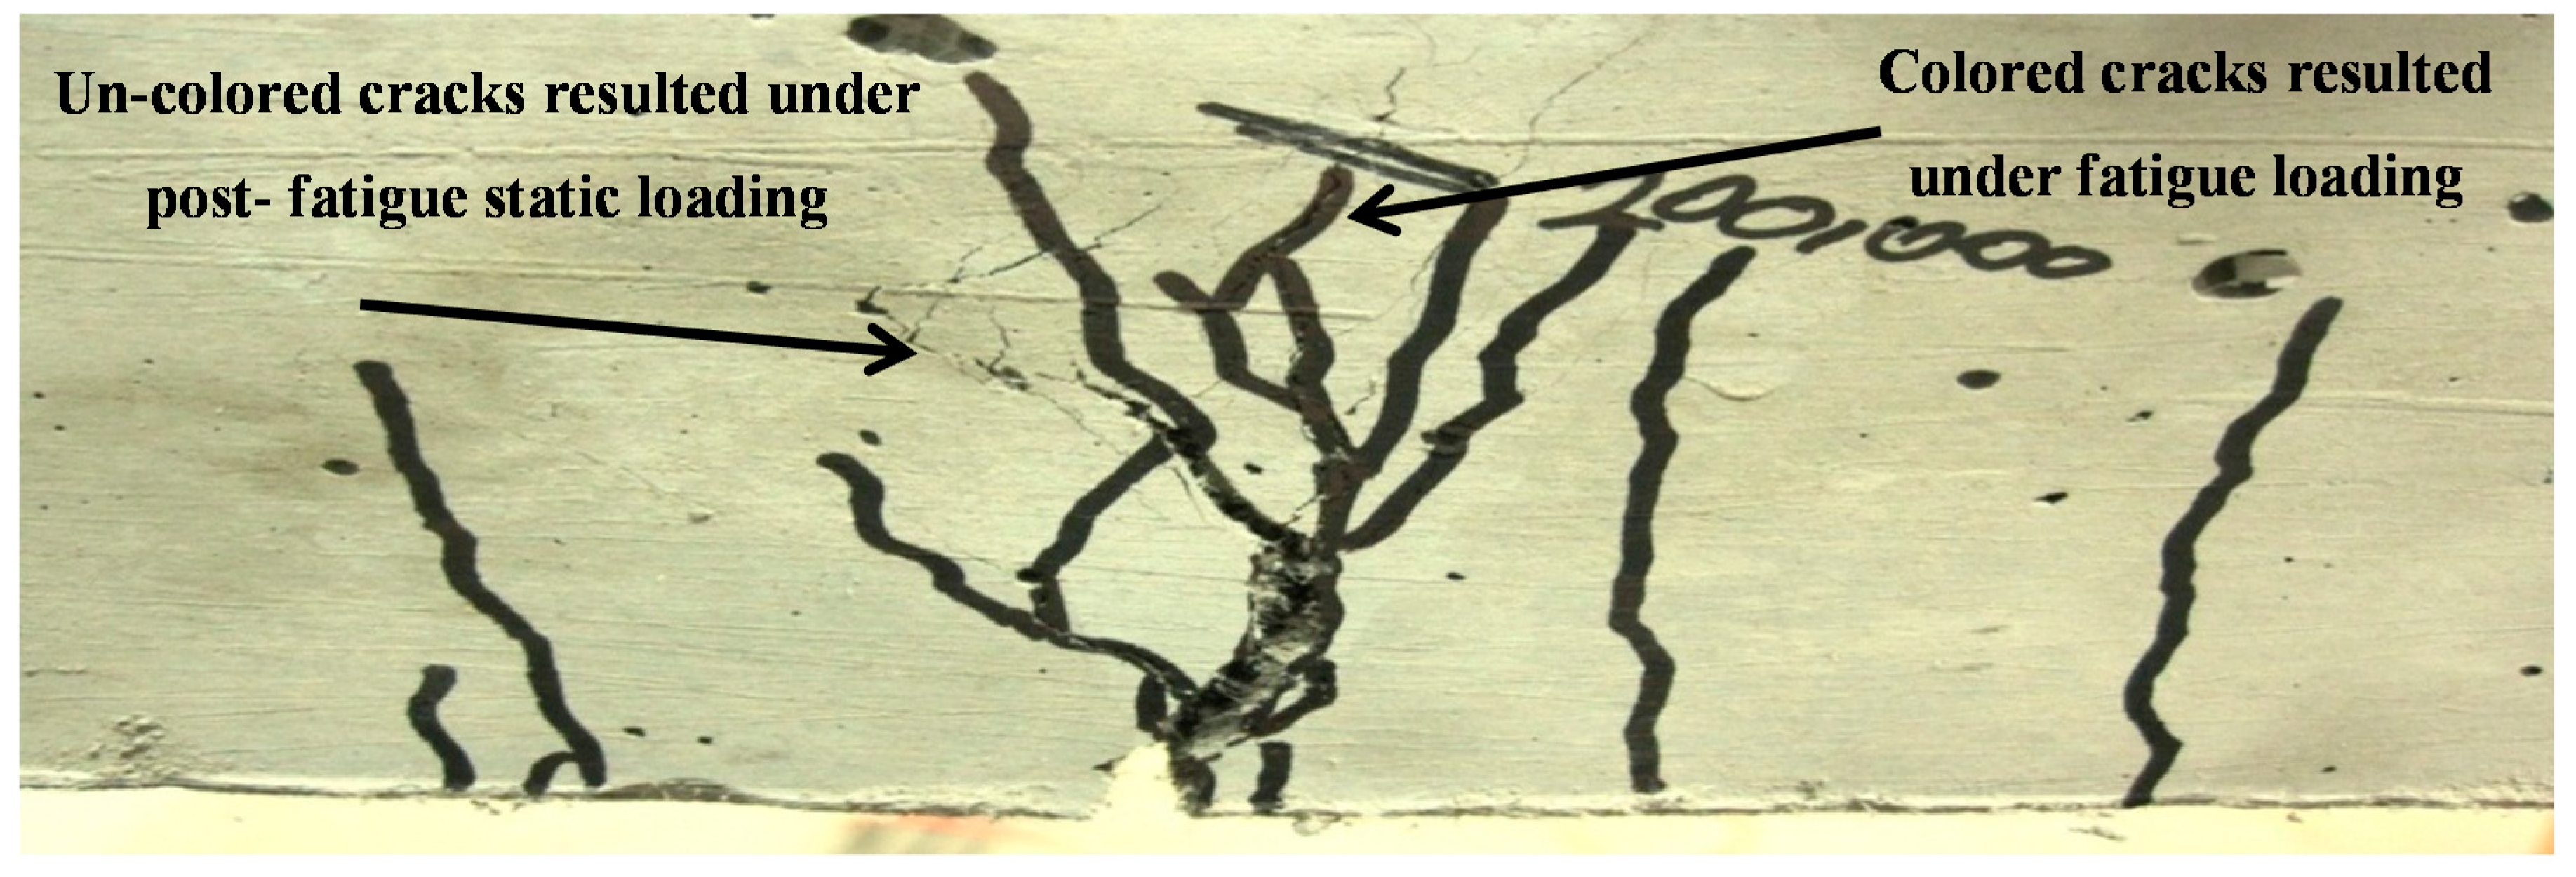
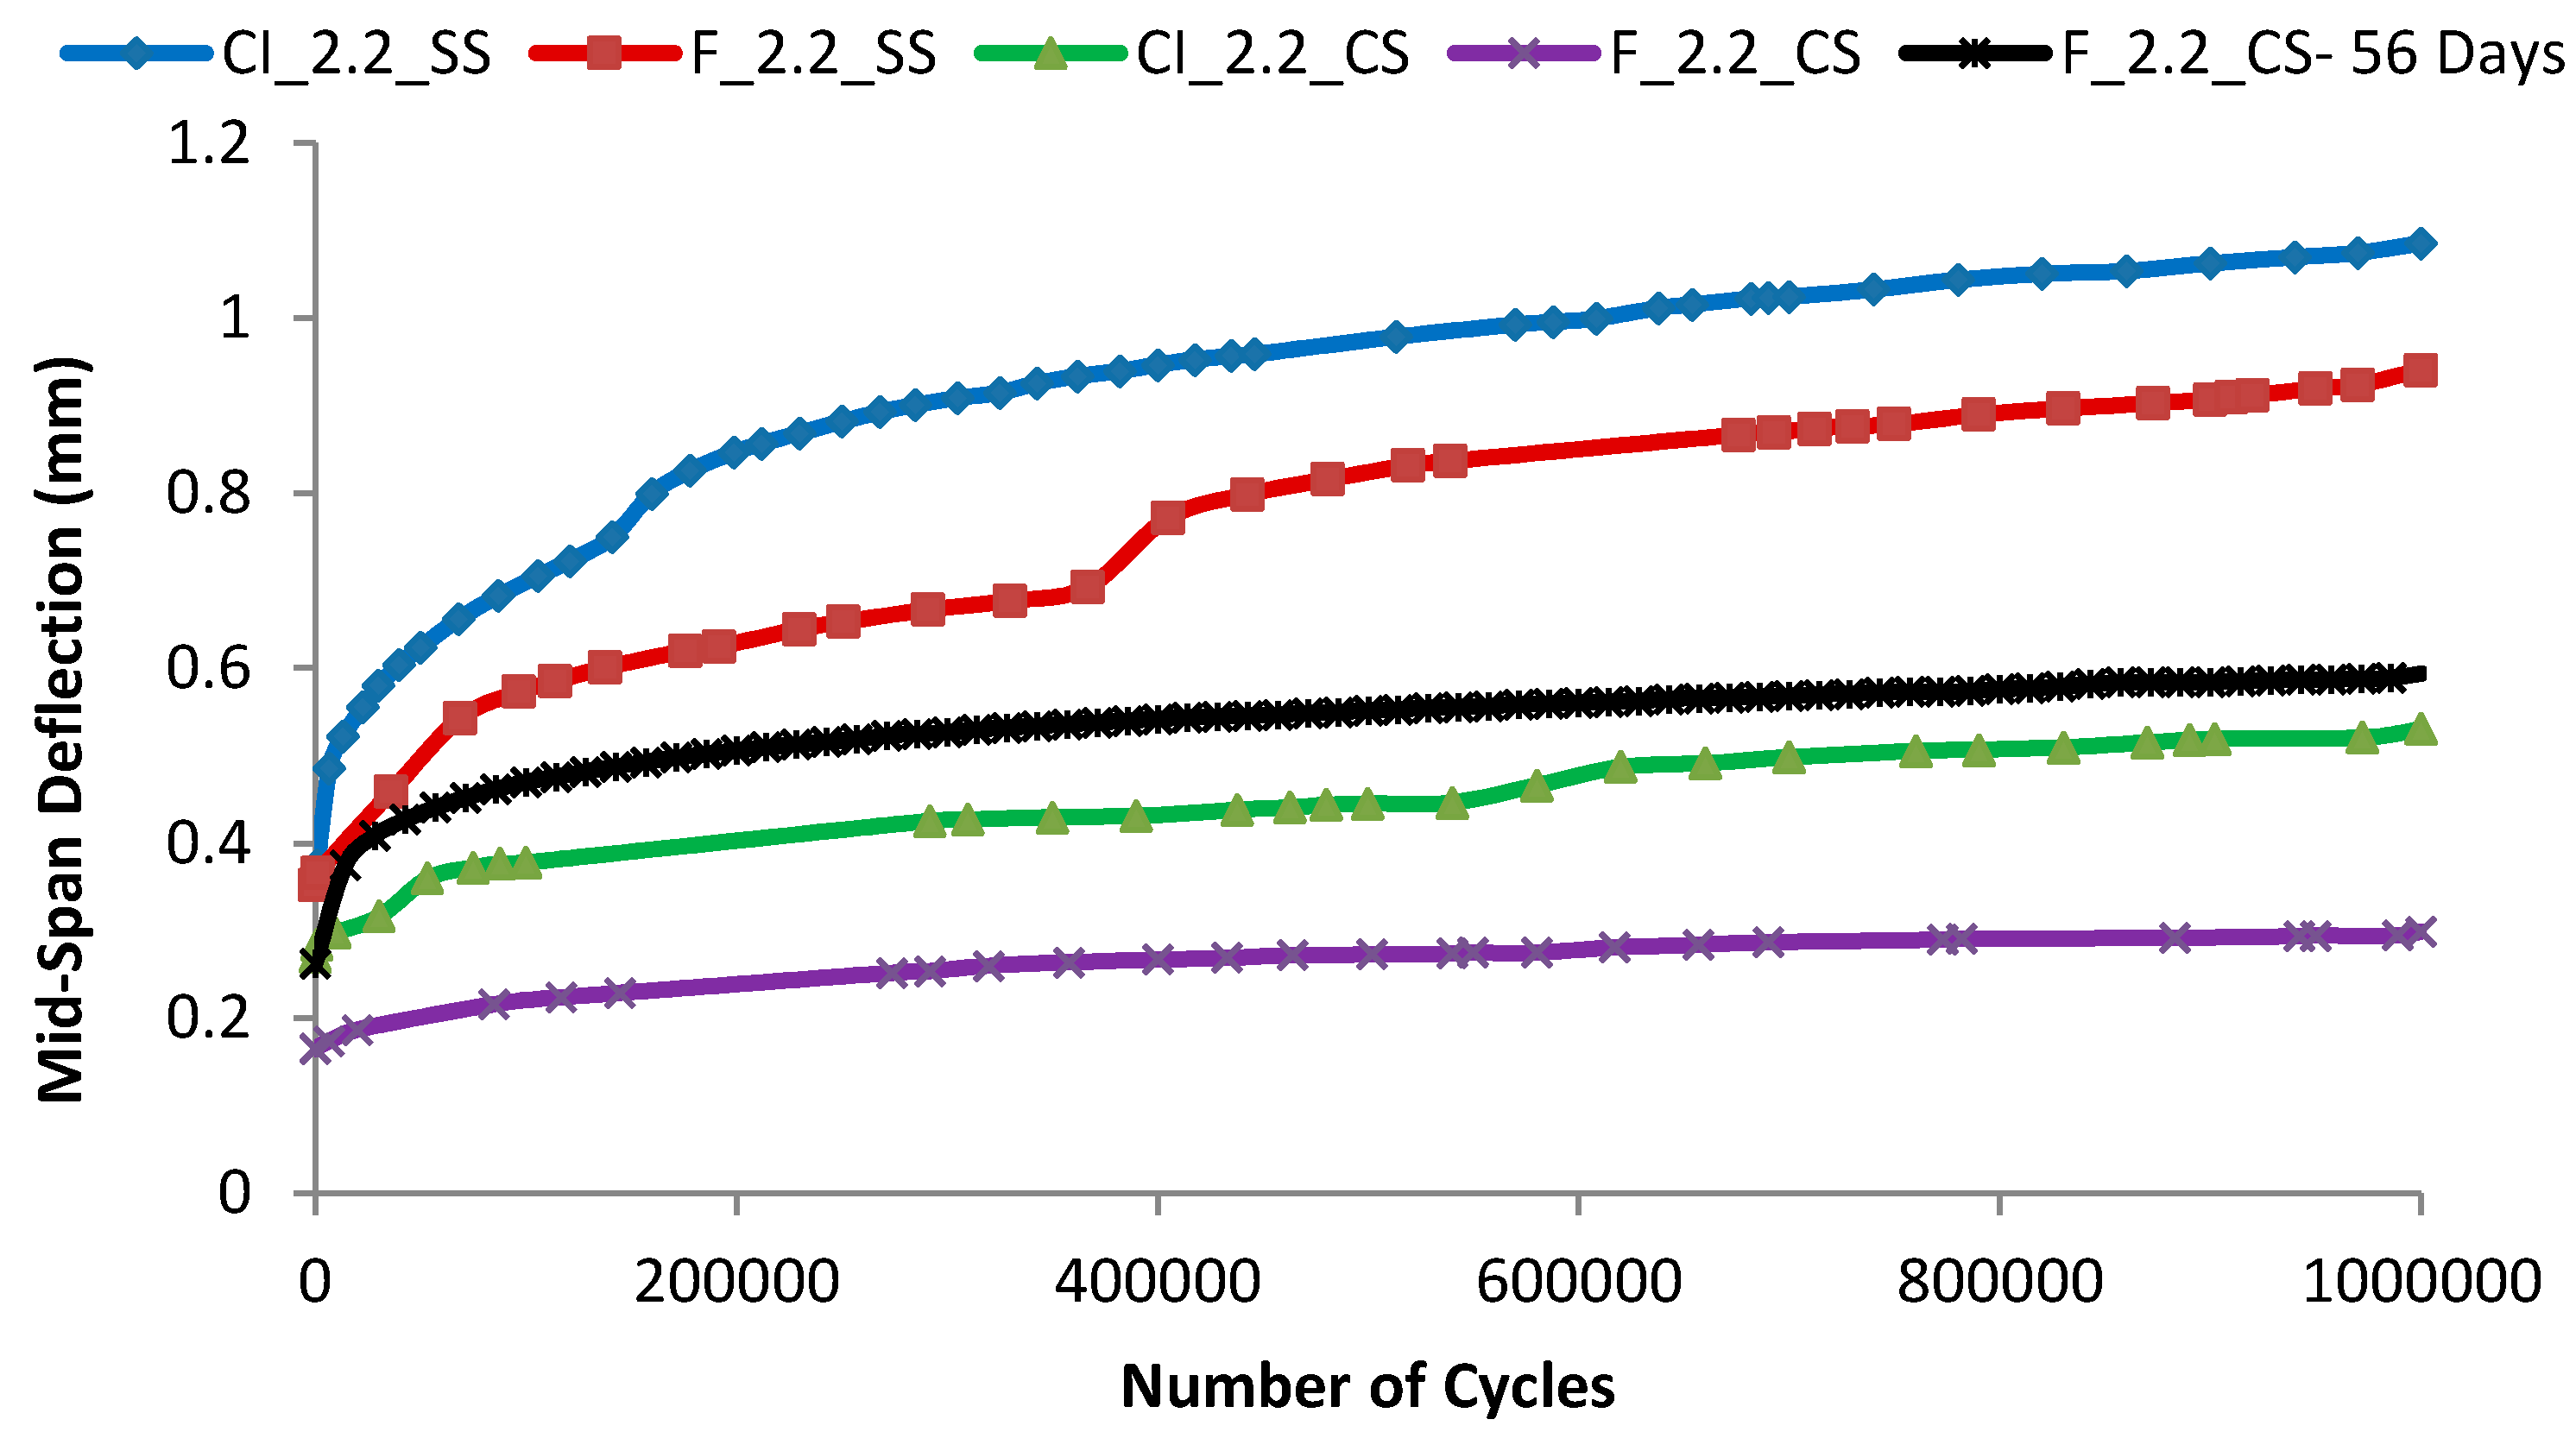
28]. During the fatigue flexural tests, the mid-span deflection evolutions were recorded on data sheet and at the end of the fatigue flexural tests; static flexural tests were conducted on the fatigued ECC specimens to calculate the fatigue residual values for both strength and mid-span deflection.
4. Analysis of General Fatigue Flexure Performance (Phase I)
The first part of the Phase I aimed at investigating the flexural strength characteristics of the two ECC groups by applying static flexural testing at 28 and 56 days. The second part involved fatigue flexural tests which performed under load control conditions at 28 days where specimens were subjected to 4 Hz sinusoidal cyclic loading rate for 50,000 cycles at the fixed fatigue stress level of 55% of the averaged flexural strength of ECC control specimens. At the end of the fatigue flexural tests, static flexural tests were applied on the fatigued ECC specimens to calculate the fatigue residual energy.
Table 5 shows the test results (for 12 ECC mixtures) of both static flexural testing without fatigue flexural loading and after fatigue flexural loading tests. By using these results, the percentage of fatigue residual energy of the fatigued ECC specimens for both residual stress and deflection could be calculated.
Table 5.
Fatigue flexural test results (phase I).
Table 5.
Fatigue flexural test results (phase I).
| Mix ID. | Mix Designation | SCM/C (%) | Static Flexural Testing | Static Flexural after Fatigue Testing | Residual Energy (%) |
|---|
| Stress (MPa) | Deflection (mm) | Stress (MPa) | Deflection (mm) | Residual Stress (%) | Residual Deflection (%) |
|---|
| 1 | CI_1.2_SS | 55% | 12.68 | 3.17 | 11.77 | 3.92 | 92.82 | 123.66 |
| 3 | F_1.2_SS | 11.80 | 3.91 | 11.16 | 5.29 | 94.58 | 135.29 |
| 7 | CI_1.2_CS | 12.20 | 2.86 | 10.72 | 3.32 | 87.87 | 116.08 |
| 9 | F_1.2_CS | 11.20 | 3.66 | 10.75 | 4.81 | 95.98 | 131.42 |
| 2 | CI_2.2_SS | 70% | 11.98 | 3.96 | 7.91 | 2.41 | 66.03 | 60.86 |
| 4 | F_2.2_SS | 10.84 | 4.45 | 7.04 | 3.09 | 64.94 | 69.44 |
| 8 | CI_2.2_CS | 11.42 | 3.14 | 8.13 | 2.58 | 71.19 | 82.13 |
| 10 | F_2.2_CS | 10.48 | 4.27 | 11.88 | 5.55 | 113.39 | 129.98 |
| 5 | SL_1.2_SS | 55% | 15.44 | 1.79 | 8.91 | 0.94 | 57.73 | 52.57 |
| 11 | SL_1.2_CS | 14.93 | 1.73 | 11.12 | 1.17 | 74.45 | 67.80 |
| 6 | SL_2.2_SS | 70% | 14.08 | 2.04 | 6.33 | 0.82 | 44.98 | 40.10 |
| 12 | SL_2.2_CS | 13.62 | 1.80 | 9.35 | 0.96 | 67.44 | 53.11 |
As seen from
Table 5, FA–ECC mixtures with 55% cement replacement (FA/C = 1.2) showed superior performance relative to higher volume fly ash mixtures with 70% cement replacement (FA/C = 2.2) with respect to both fatigue flexural strength and deflection. The fatigue flexural strength remains equal or slightly lower than static flexural strength.
It was reported that conventional plain concrete with class-C fly ash mixture having 15% cement replacement showed superior performance relative to high-volume fly ash mixture with 50% cement replacement with respect to compressive strength and flexural fatigue strength [
29]. Moreover, Tse
et al. [
30] indicated that concrete with equivalent or higher compressive and fatigue strength could be obtained with cement replacement of 25% by weight of low-calcium fly ash (class-F) or 50% by weight of high-calcium fly ash (class-C). The reason of ordinary performance of FA–ECC mixtures with 70% cement replacement relative to 55% cement replacement in both fatigue flexural strength and deflection can be attributed to the fixation of fatigue stress level at 55%. In addition, Suthiwarapirak
et al. [
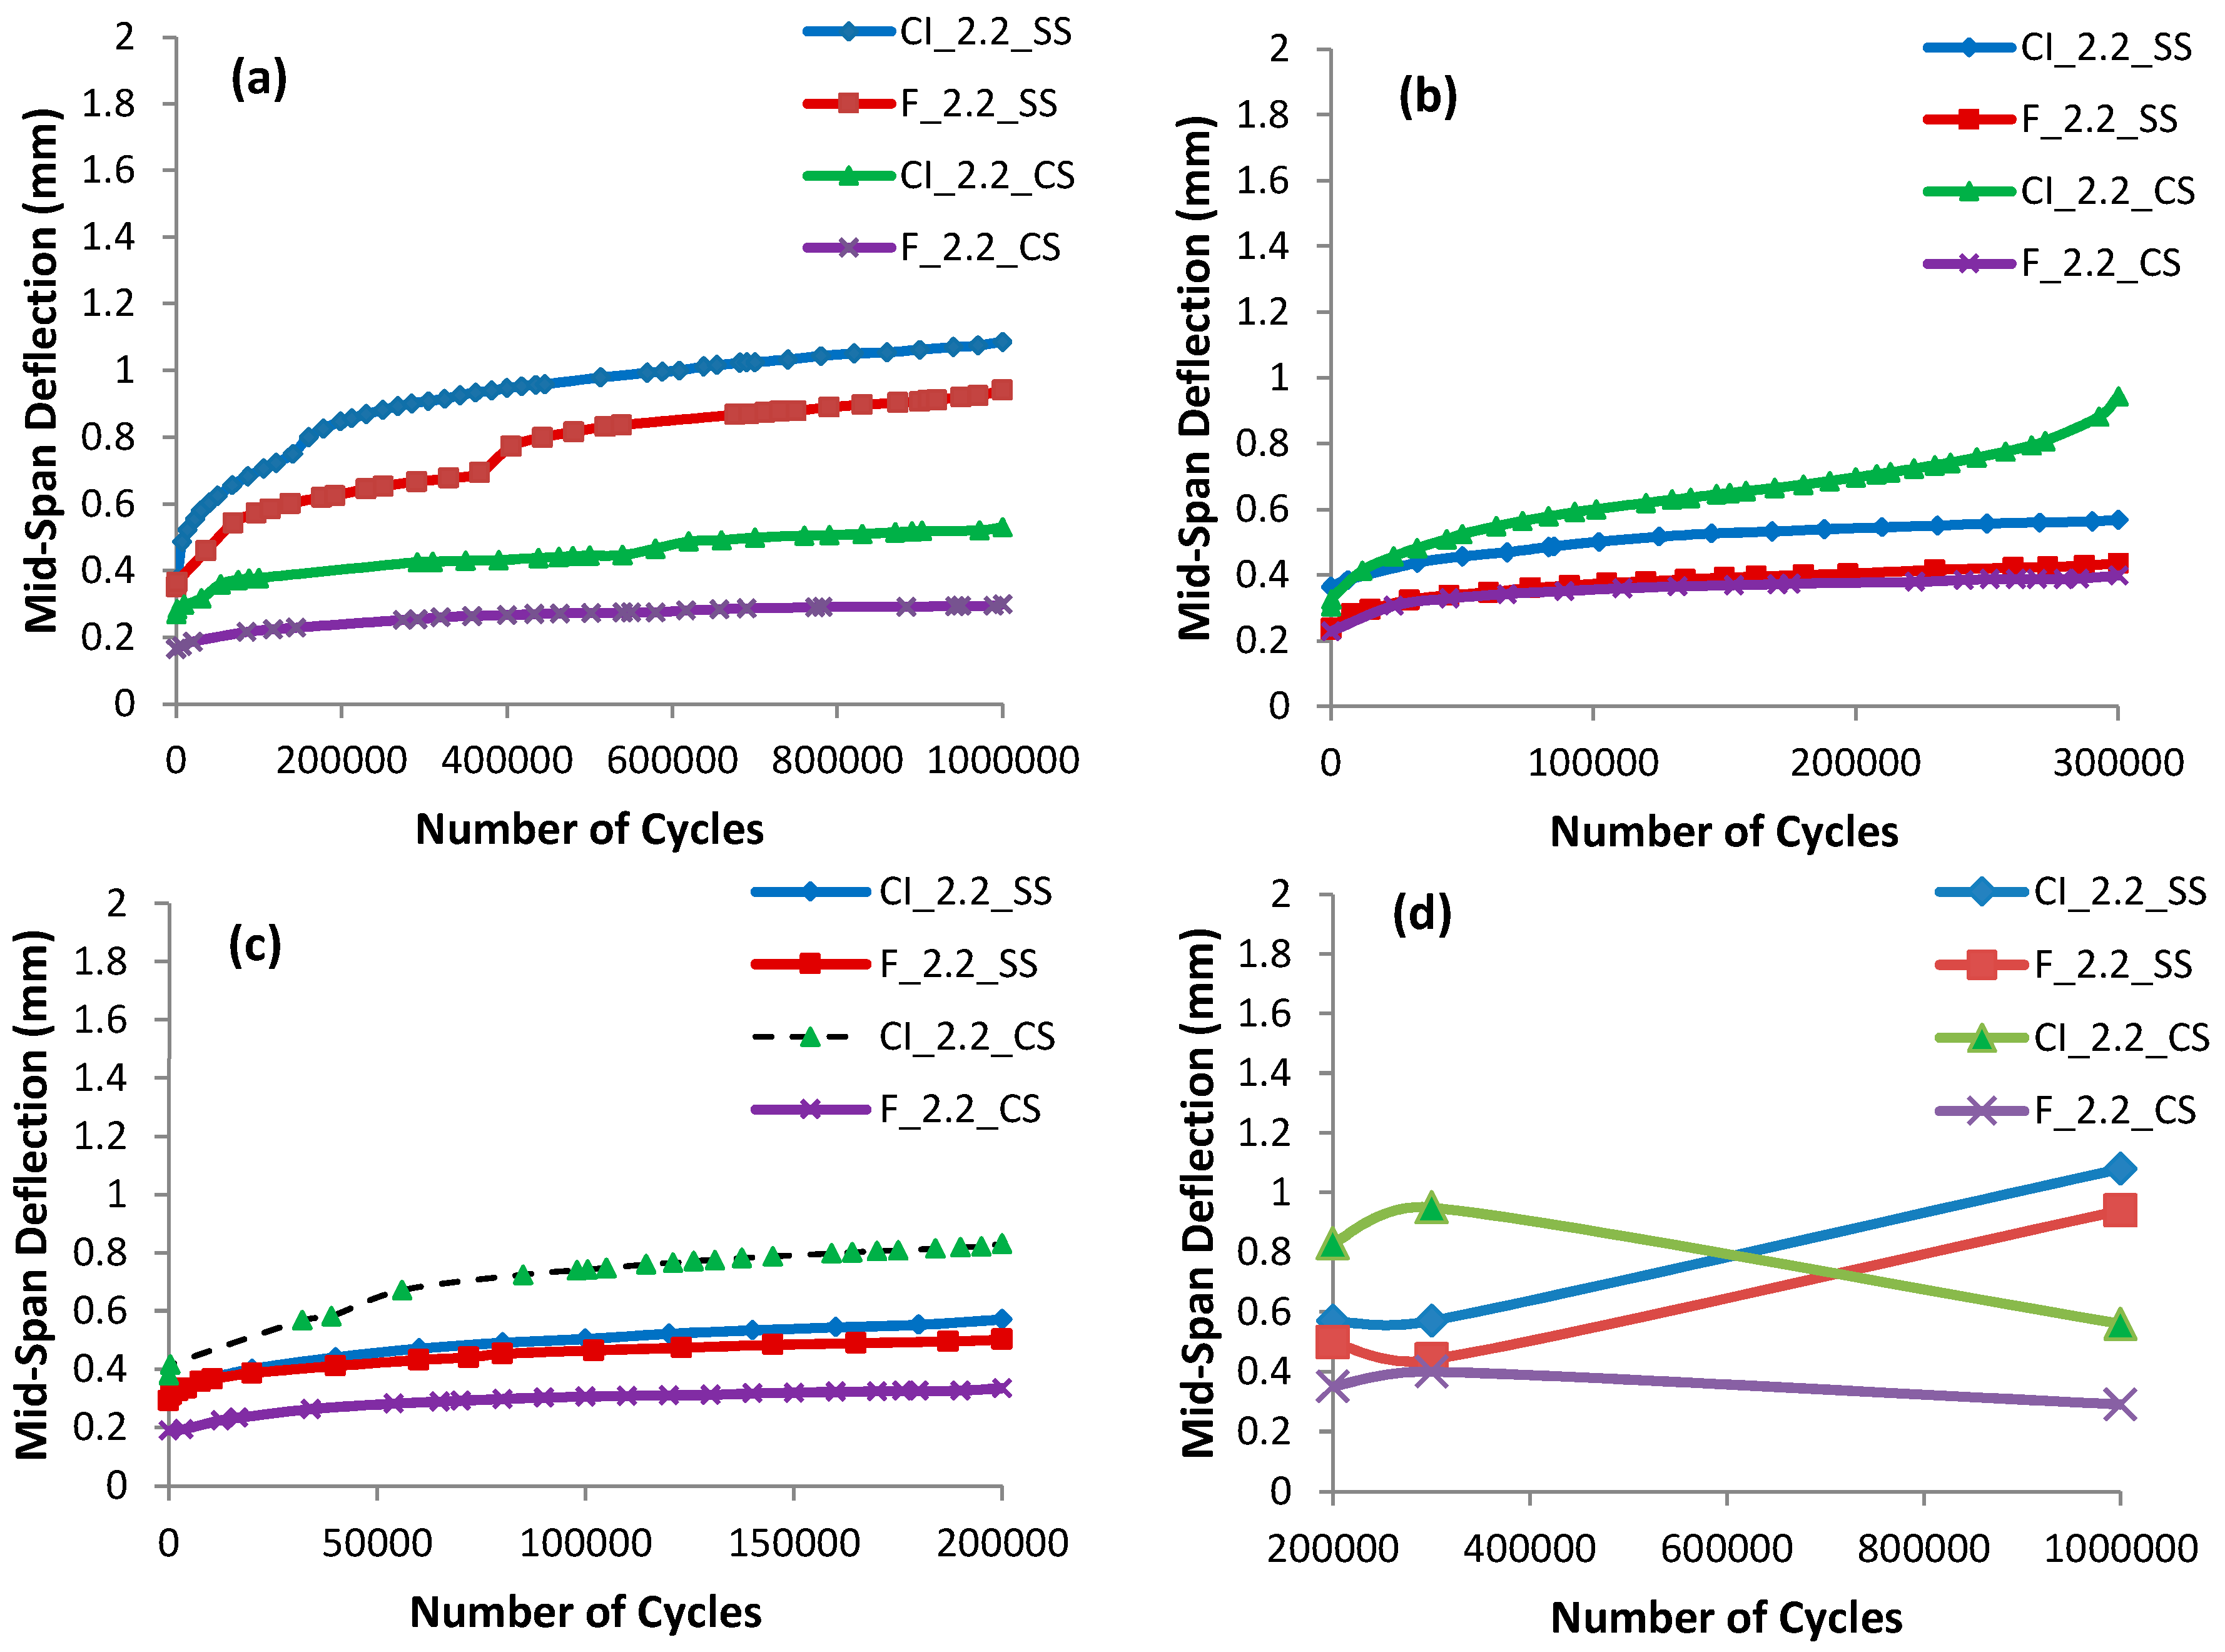
28] indicated that the evolution of mid-span deflection depends on the fatigue stress level. Namely, the mid-span deflection increased to more than twice as much under high fatigue stress levels
S = 0.8–0.9 compared to that under low stress levels
S = 0.5–0.6. However, as shown in the
Table 5, fly ash concrete mixtures with cement replacement 55% and 70% showed almost the same results when flexural fatigue strength was expressed as percentage of the flexural static strength.
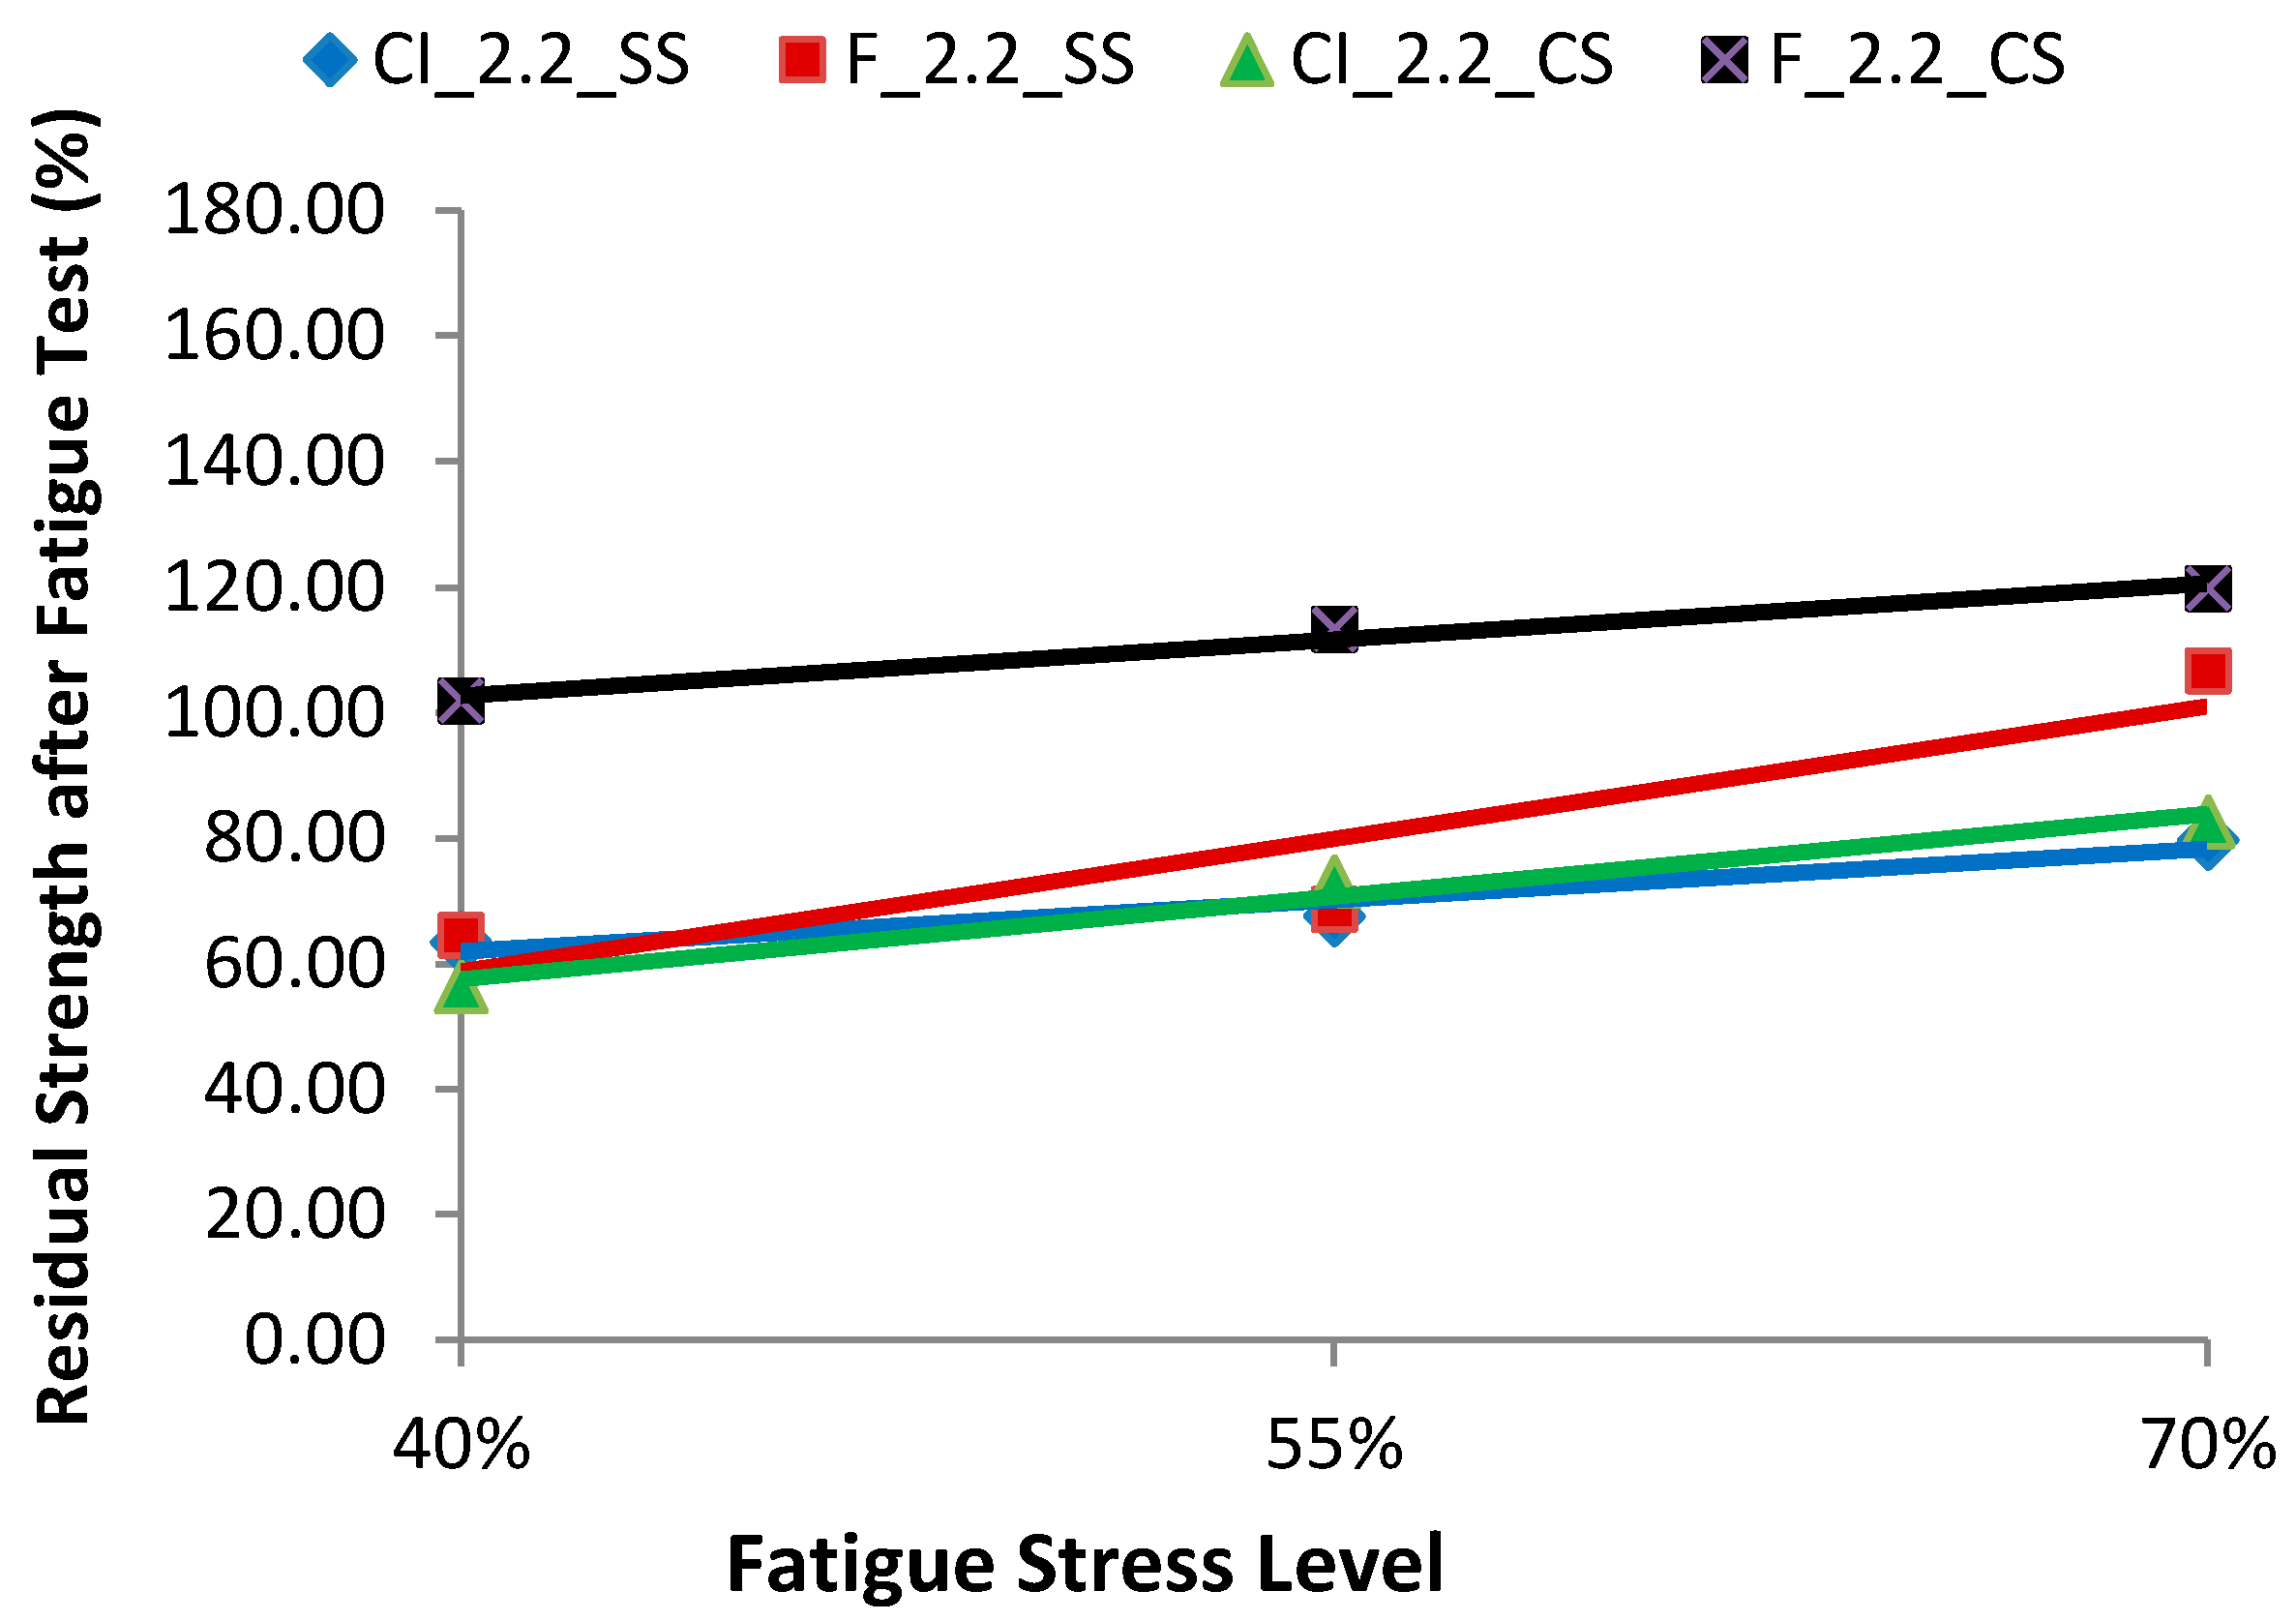
Fatigue test results showed that F_2.2_CS ECC mixture with crushed sand had a remarkable performance with respect to both fatigue flexural strength and deflection capacity. The performance of F_2.2_CS ECC mixture was almost equal to that of all other FA–ECC mixtures with 55% cement replacement in term residual deflection. The higher residual strength and deflection capacity F_2.2_CS ECC mixture compared to other ECC mixtures (as illustrated in
Table 5) may be attributed to high water demand of class F fly ash (causing higher degree of hydration) leading to denser matrix and increased friction among crushed sand particles and PVA fivers.
Slag–ECC mixtures with 55% and 70% cement replacement exhibited inferior performance with respect to both flexural fatigue strength and deflection. It was found out that the compressive fatigue limit ratios at two million cycles in water were 41% for the concrete with blast furnace slag, 44% for the silica fume concrete, and 31% for the plain cement concrete at 50% probability of survival fatigue life [
31]. Higher chemical bond strength between slag particles and fibers compared with FA–ECC results in significant lower deflection capacity and inferior performance in residual fatigue flexural strength and deflection capacity of slag–ECC mixtures. Although slag–ECC mixtures exhibit lower deformation capacity compared with FA–ECC, their flexural deflection capacity is around or more than 2 mm at 28 days of age. The 2 mm deflection capacity remains almost 150 times higher than that in normal concrete and conventional fiber reinforced concrete.
The 70% cement replacement group rather than 55% was chosen for investigation in Phase II due to number of reasons. In general, fly ash has been used to replace cement in ECC mixture because of the absence of coarse aggregate in ECC results in higher cement content. Partial replacement using FA reduces the environmental burden. Further, it has been found that the addition of FA at high volumes improves the fresh and durability properties, reduces the drying shrinkage and matrix toughness, and improves the robustness of ECC in terms of tensile ductility [
18,
19]. Additionally, un-hydrated FA particles with a small particle size (<45 μm) and smooth spherical shape serve as filler particles resulting in higher compactness of the fiber/matrix interface transition zone that leads to a higher frictional bond, which aids in reducing the steady-state crack width beneficial for the long-term durability of the structure [
18,
19].
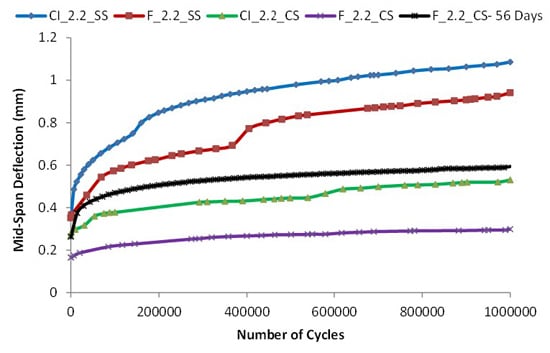
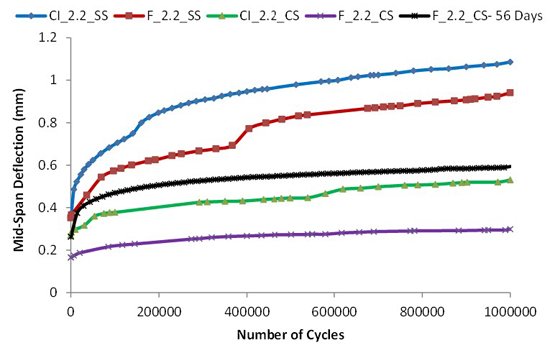
Accordingly, fly ash-to-cement ratio (FA/C) of 2.2 was chosen in phase II to satisfy the above requirements. The ECC mixtures selected to be involved in the second phase were CI_2.2_SS, F_2.2_SS, CI_2.2_CS and F_2.2_CS.


