2.1. Characterization of the Prepared Greywater Samples
Characteristics of synthetic greywater samples L1–L3 and H1–H3 with respect to the compositional differences in organic matter contents, anion contents and microbiological consortium are presented in
Table 1. All of the parameters were experimentally determined according to the procedures outlined in the methodology section. Based on UV-vis and fluorescence measurements, DOC-normalized specific parameters were also presented. Specific UV absorbance, SUVA
254 (m
−1·mg
−1·L), is defined as UV
254/DOC in which UV
254 denotes UV absorbance at λ = 254 nm and specific fluorescence intensity, SFI
syn, is defined as FI
syn/DOC of which FI
syn denotes fluorescence intensity at λ
max = 470 nm.
It should be emphasized that although molecular size profiles displayed similar distributions irrespective of initial DOC contents, the composition of the organic matrix would be different due to applied pre-oxidation step prior to the preparation of the samples H1–H3. It could be assumed that HA molecular size <3 kDa could resemble surfactant contribution although all of the humic sub-fractions could display surfactant properties due to possible micelle formation capabilities [
23].
SUVA
254 values were in the range of 6.26–8.50 m
−1·mg
−1·L. As a specific UV-VIS parameter, SUVA
254 > 4 indicates the presence of mainly hydrophobic and aromatic moieties, whereas for SUVA
254 ratios in the range of 2–4, humic matrix are normally dominated with a mixture of hydrophobic and hydrophilic fractions. SUVA
254 < 2 significantly represents hydrophilic properties [
24]. Correspondingly, SUVA
254 values expressed high aromatic and hydrophobic OM fractions for all of the greywater samples. Furthermore, the variations attained in FI
syn values expressed the presence of diverse fluorophores in greywater samples. SFI
syn displayed a range of 5.62–8.98. Contrary to the highest SUVA
254 of L2, the lowest SFI
syn was attained in H3 greywater sample.
Anion contents displayed almost ten-fold difference between two groups of greywater samples, as expected and verified by analyses (
Table 1). Anion contents of greywaters, either real samples or synthetically-prepared samples, have been measured and presented in the literature. Greywater from 32 houses with 192 time-proportional samples were characterized in terms of chemical parameters by Hernández-Leal and colleagues [
3]. It was concluded that anions of greywater samples were found to be in the following ranges of: 36–96.7 mg·L
−1 for Cl
−, 0.01–7.95 mg·L
−1 for NO
3−, 0.03–6.98 mg·L
−1 for PO
43−, and 0.10–21.10 mg·L
−1 for SO
42−, indicating that working anion concentrations of this study could be regarded as the representative of anion content of greywaters.
Moreover, TC and FC contents were different from each other and FS contents could be considered as similar. L3 greywater sample contained TC: 5.4 × 10⁴ CFU/100 mL, FC: 3.1 × 10⁴ CFU/100 mL, and FS: 1.6 × 10⁴ CFU/100 mL whereas H3 greywater sample contained TC: 7.2x10⁴ CFU/100 mL, FC: 5.4 × 10⁴ CFU/100 mL, and almost similar FS: 1.8 × 10⁴ CFU/100 mL.
2.2. Degradation of Organic Matter:UV254 and DOC Removal
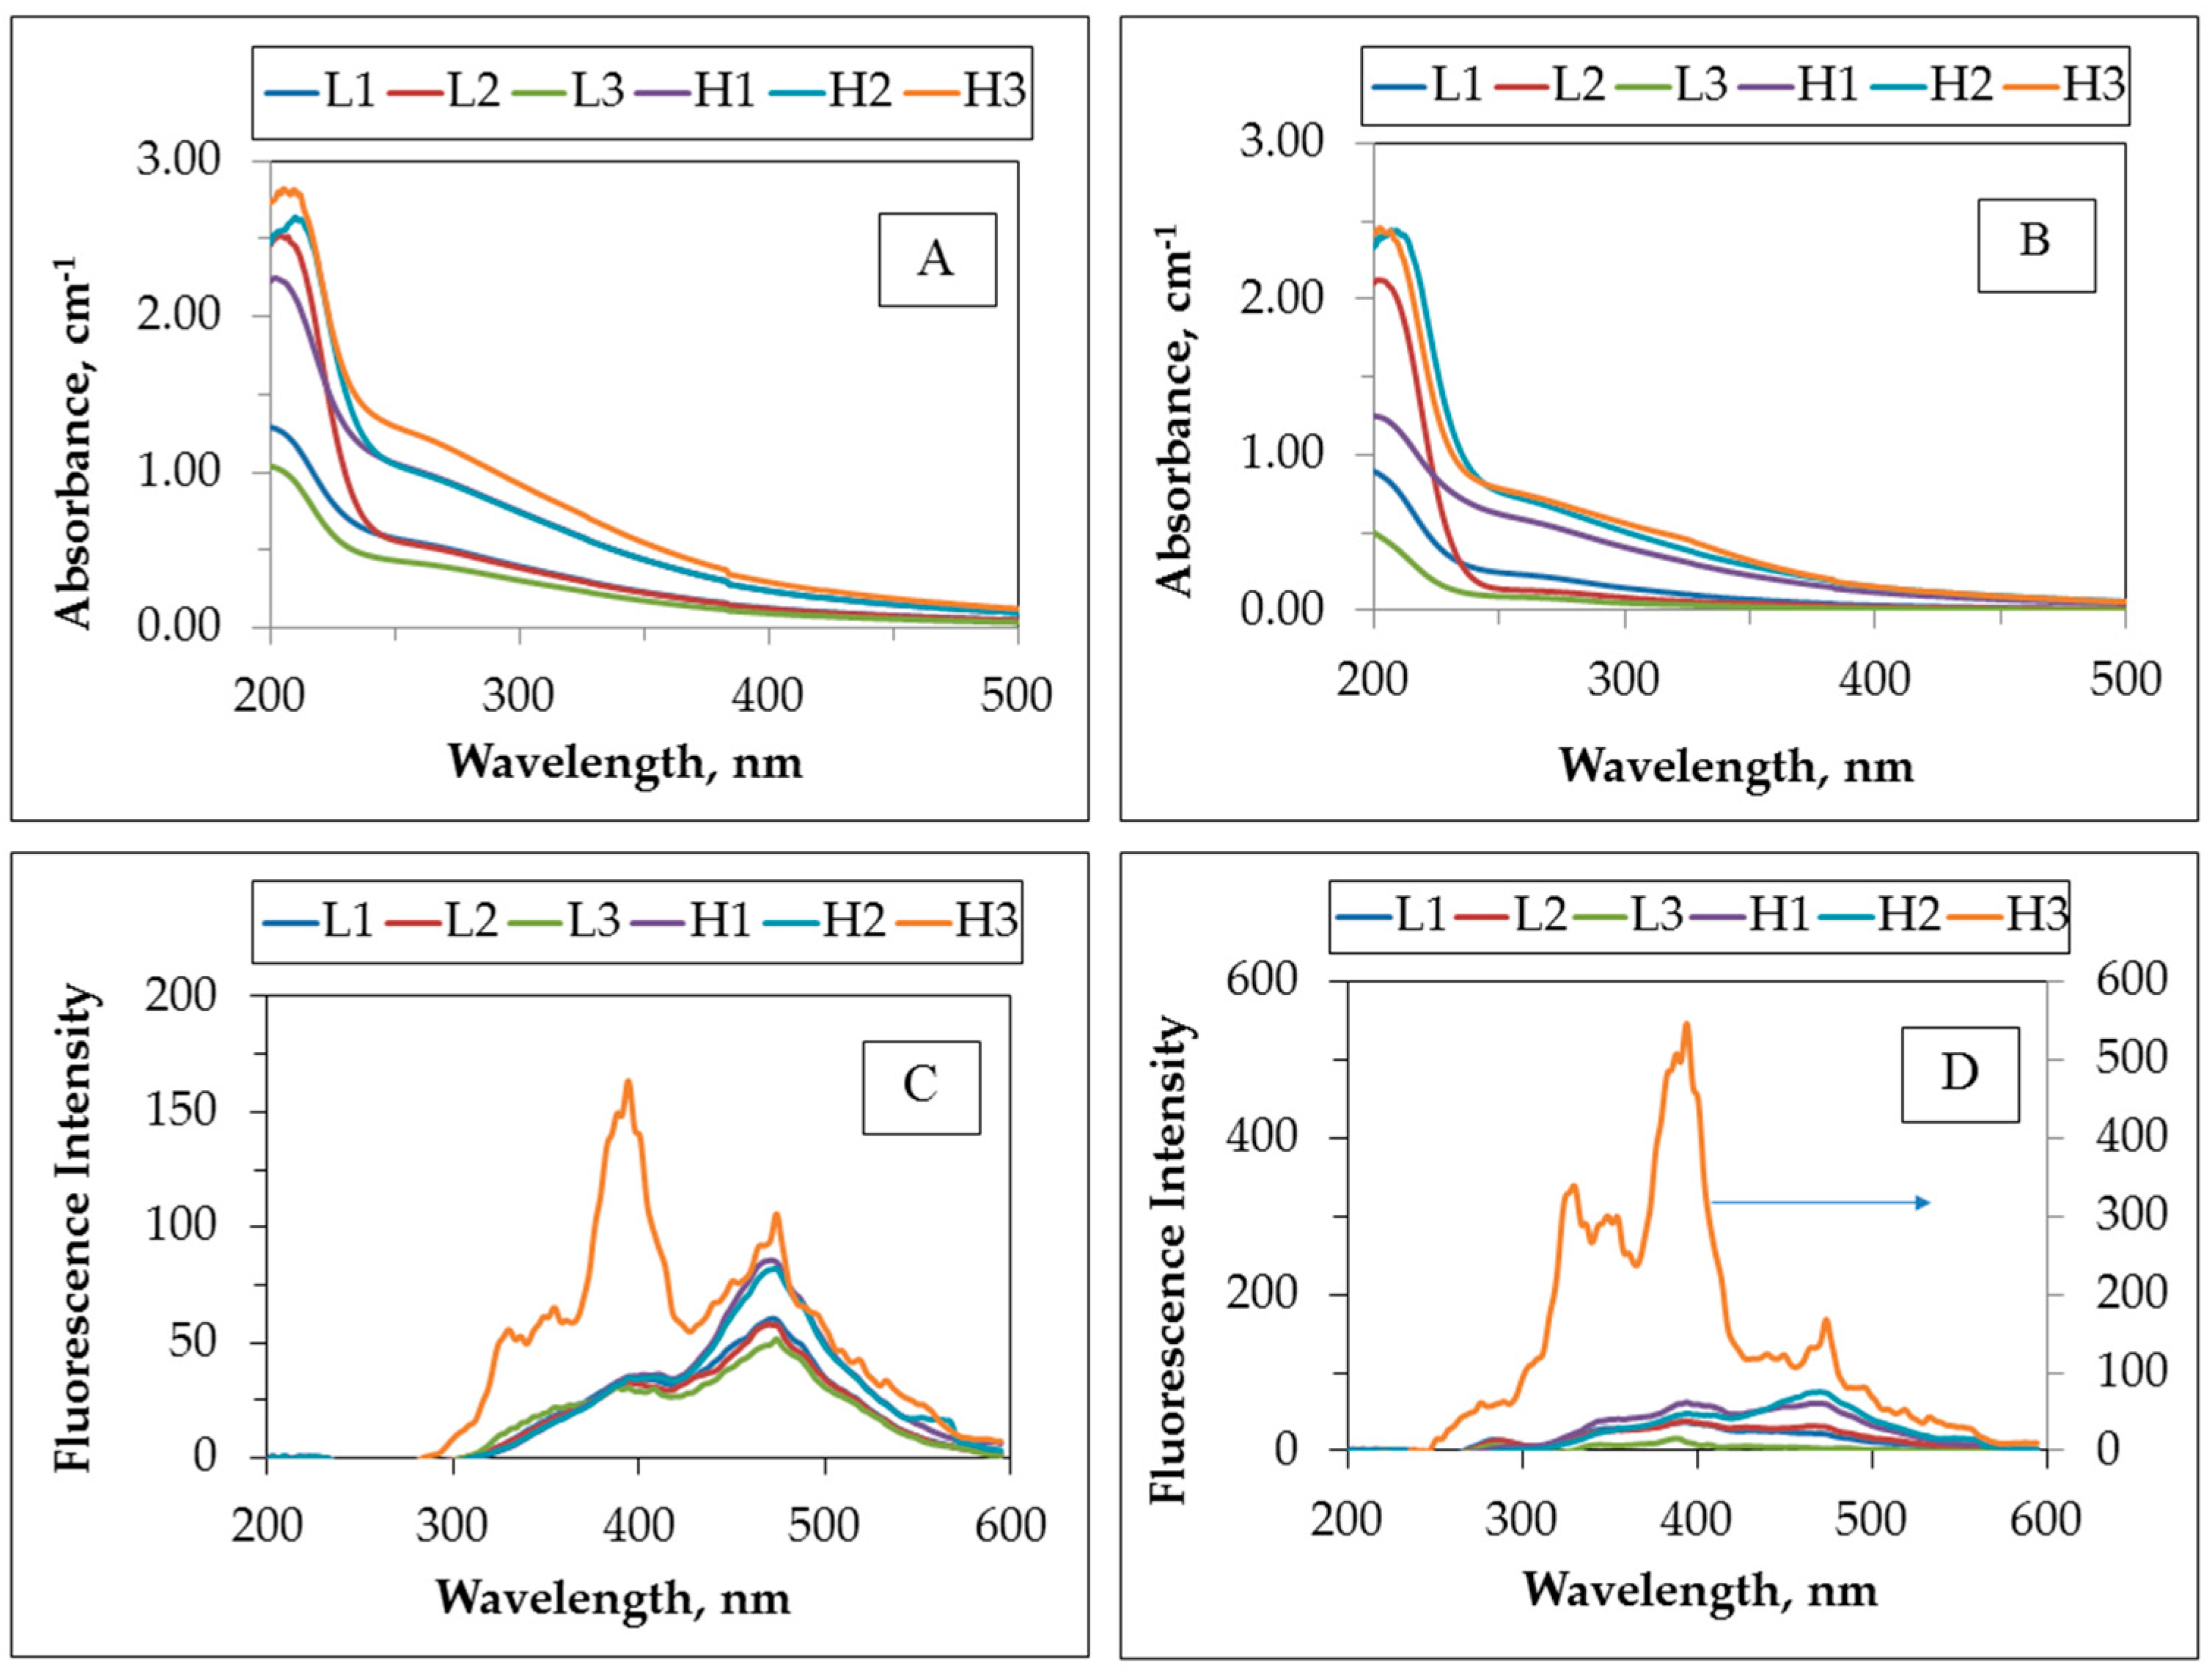
Photocatalytic treatment of greywater samples was followed by irradiation time-dependent UV-vis spectroscopic measurements to express the significance of the UV
254 parameter. As a representative example, UV-vis spectroscopic profiles of all of the grey water samples prior to photocatalytic treatment and following photocatalytic treatment of 60 min were presented (
Figure 1A,B).
It could be visualized that UV-vis absorbance of all greywater samples followed a similar logarithmic decay profile of humic substances. Light absorption in the UV-vis region is a typical property of humic substances and several absorption wavelengths has been proposed for their spectroscopic characterization. Amongst them, UV absorbance at 254 nm was interchangeably measured with total organic carbon as a surrogate parameter to represent organic matter of humic substances [
24,
25]. Therefore, UV
254 could be regarded as an effective parameter for the removal of UV-absorbing centers that were mostly aromatic in character. Moreover,
Figure 1C,D showed the synchronous scan spectra of untreated greywater samples and photocatalytically-treated greywater samples, respectively. From a general perspective, all of the spectra displayed similar trends to the spectra attained for humic acids as expected [
25]. Fluorescence intensities of the samples also illustrated a similar fashion, with the exception of H3, most probably due to the compositional variations leading to the formation of new fluorophoric groups at λ
emis = 400 nm (
Figure 1C). Upon photocatalytic treatment, FI
syn decreased at λ
emis = 475 nm, however, H3 expressed the formation of new fluorophoric groups at around λ
emis = 330 nm that could be attributed to the release of organics through bacterial destruction.
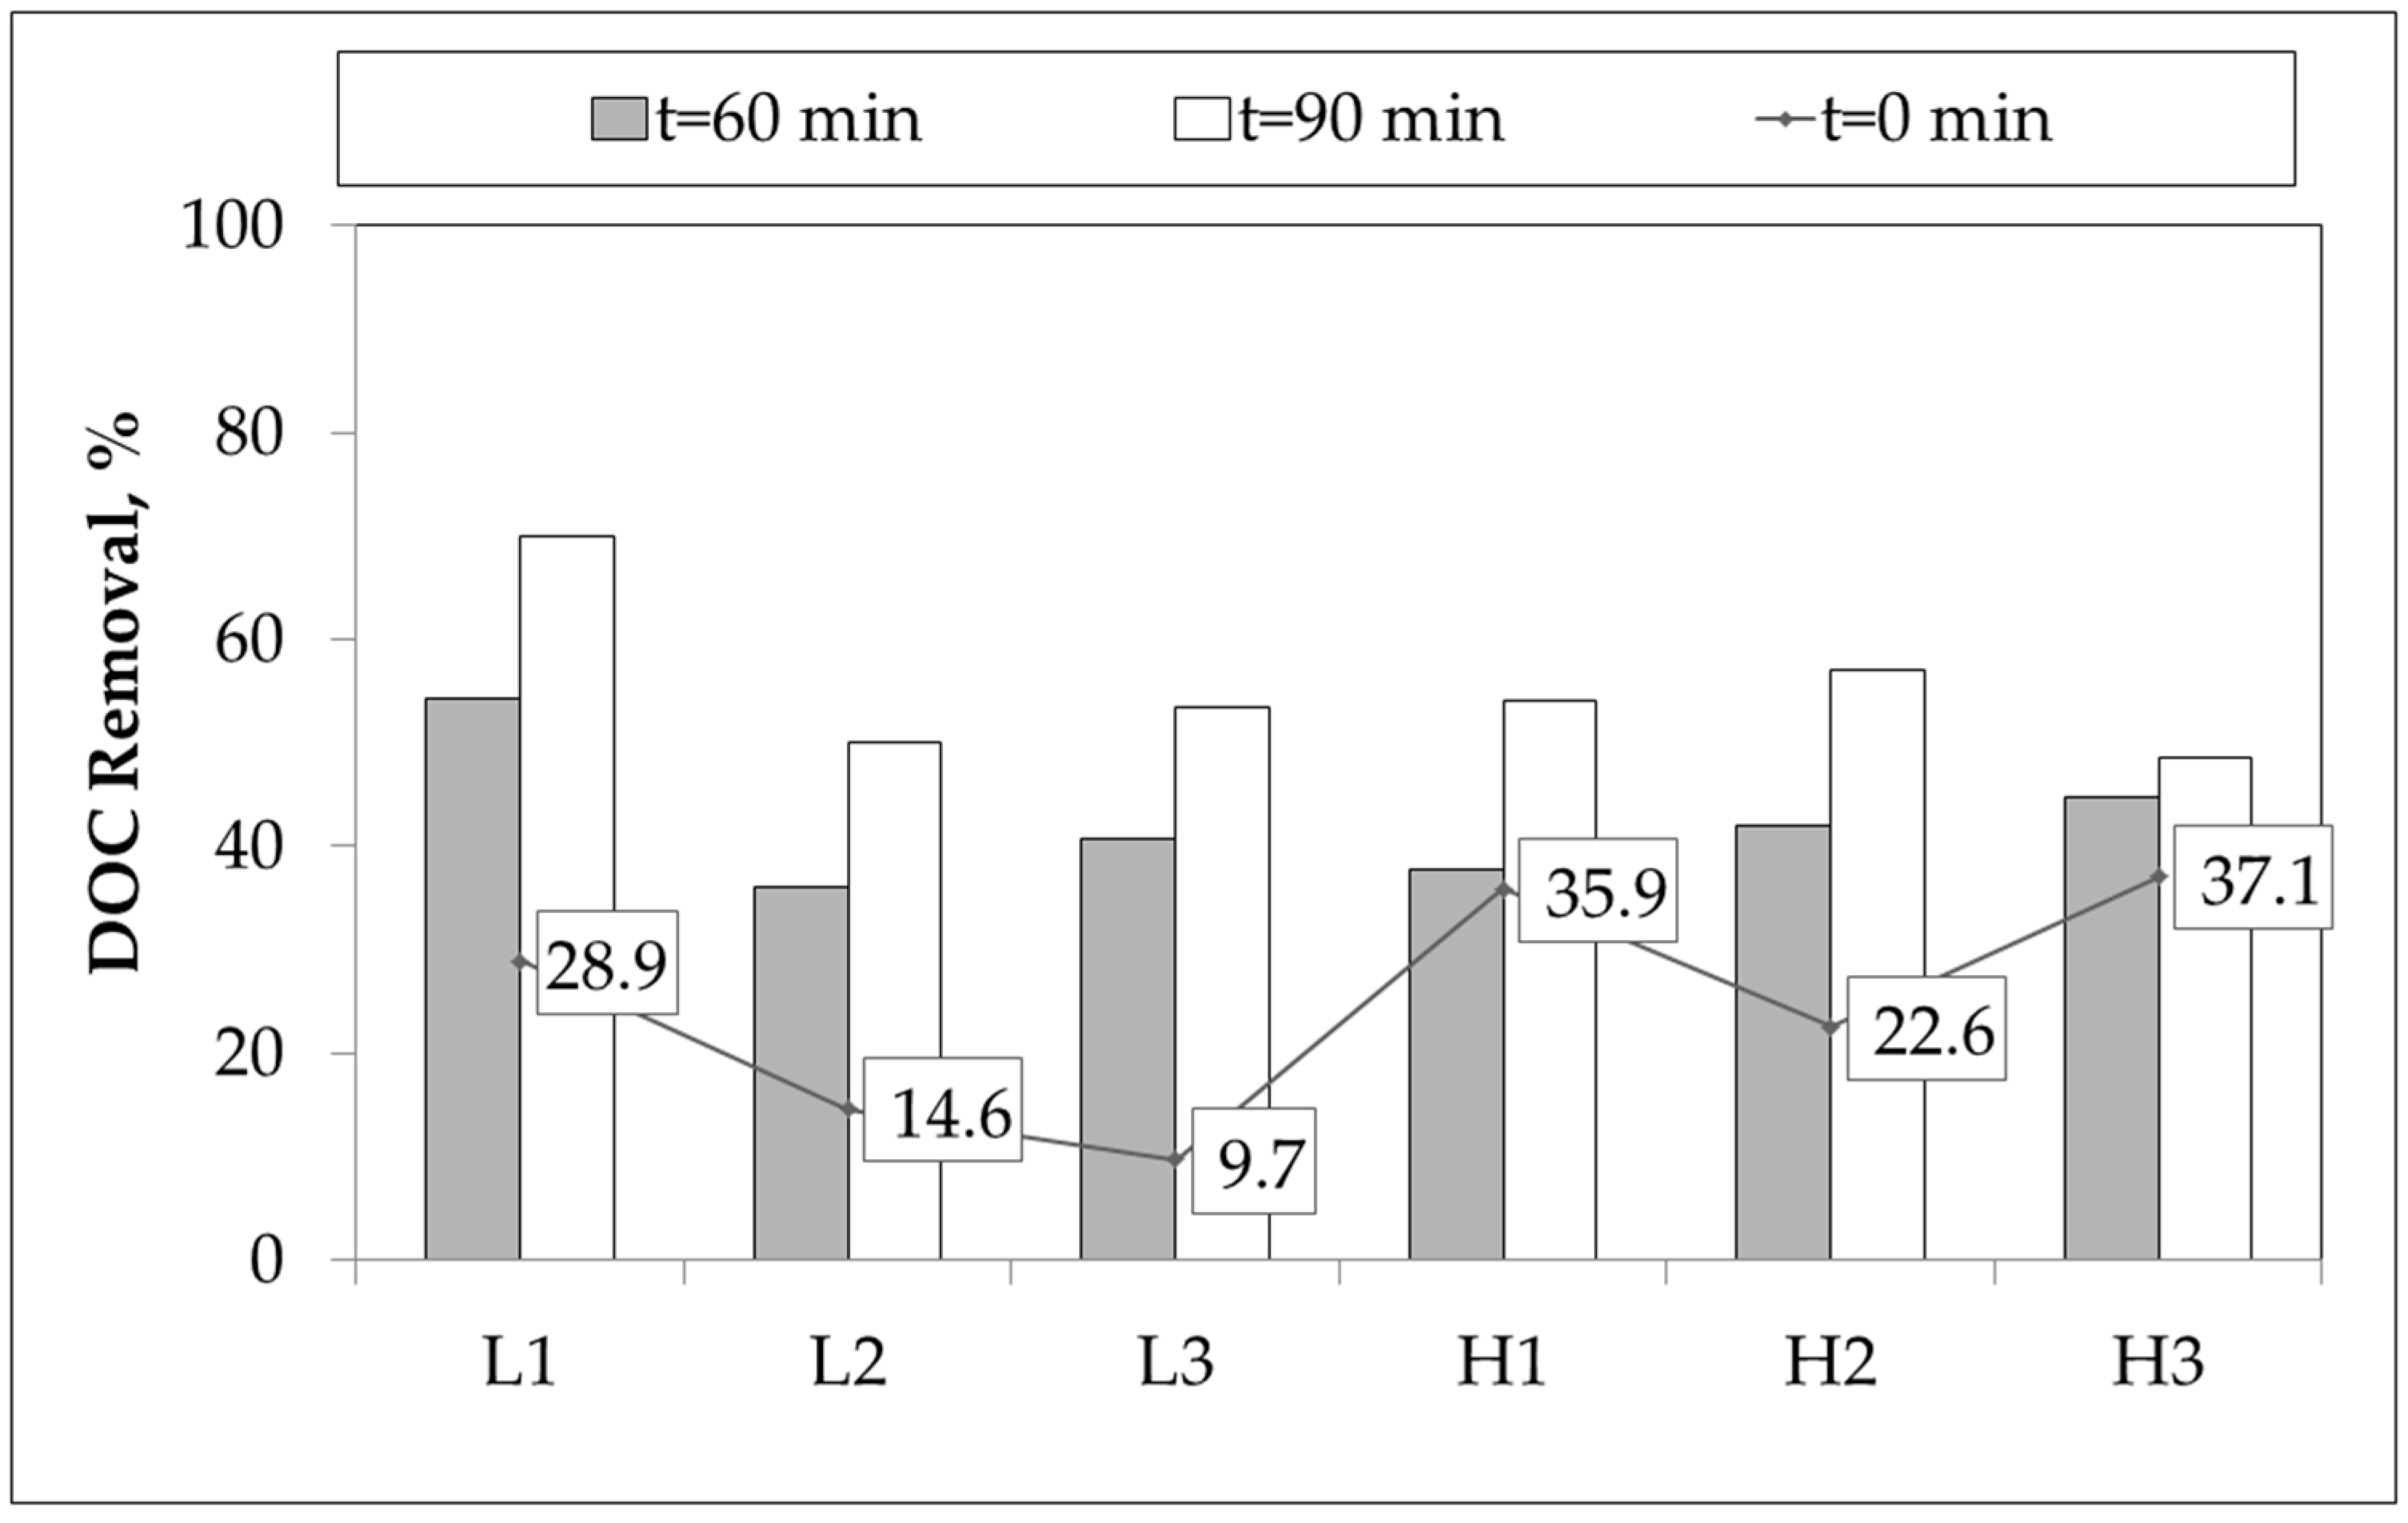
Percent DOC removals under dark adsorptive conditions designated as
t = 0 and removals following photocatalytic irradiation conditions at
t = 60 min and
t = 90 min were presented in
Figure 2.
Regarding the definition of
t = 0 condition at which the initial adsorption of the substrate was measured, the removals presented in
Figure 2 simply indicated the surface of the photocatalyst was occupied by either OM or bacteria, or both, representing binary interactions. Low OM load greywater samples displayed a decreasing initial adsorptive removal trend (
t = 0) with respect to the presence of anion contents (L1 vs. L2) and bacterial content (L1 and L2 vs. L3) (
Figure 2). Contrary to these findings, in high OM load greywater samples variations in adsorptive DOC removals as 35.9%, 22.6%, and 37.1% for H1–H3 were observed, respectively. The presence of anions exerted an inhibitory effect via electrostatic attraction to the positively charged TiO
2 surface in competition with the deprotonated centers of the OM. However, in the presence of bacterial consortium, adsorptive removal of OM could be enhanced by bacteria-OM interactions that could be successively removed by 0.45 μm filters prior to analysis. It should also be indicated that OM of H1–H3 samples were composed of oxidized humic fractions that could be considered as more hydrophilic in comparison to the L1–L3 samples. Moreover, upon 90 min of irradiation period, almost all of the greywater samples expressed DOC removal of 53% ± 4%. Due to the presence of low load OM as well as low anion content, the L1 greywater sample exhibited considerably higher DOC removal (70%), as expected. The removal trends displayed in
Figure 2 could successfully be described by kinetics of photocatalytic oxidation as presented in
Section 2.4.
It could be inferred from
Figure 2 that photocatalytic oxidation of low load greywater samples with lower OM content would give more effective results in terms of DOC removals displaying similarities with the study carried out by Sanchez and co-workers [
21]. Considering the performance of the photocatalytic oxidation process, UV
254 could be used as a surrogate parameter instead of DOC [
24]. However, UV
254 and DOC removal efficiencies of the greywater samples in 60 min were considerably different from each other (up to 80% removal of UV
254 and less than 60% removal of DOC content). This could be attributed to adsorption and/or photocatalytic oxidation of the organic matter content of greywater samples having different UV absorptivity at λ = 254 nm [
26]. Transformation of some of the organic fractions from unsaturated structure to saturated structure by photocatalytic oxidation process could be another possibility of different removal efficiencies of UV
254 and DOC parameters [
27].
Referring to the specific UV-vis parameter i.e., SUVA254, following photocatalytic irradiation of 60 min, the rest of L3 was composed of mostly hydrophilic OM, while L1 and L2 greywater samples were still composed of a mixture of hydrophobic and hydrophilic constituents (SUVA254 as 3.26 and 3.28, respectively). On the other hand, high-load greywater samples contained higher molecular size fractions with hydrophobic and aromatic moieties even after photocatalytic irradiation period of 60 min. Corresponding SUVA254 values were 7.46, 9.94, and 10.5 for H1–H3, respectively.
Following photocatalytic treatment, SFIsyn changes indicated the formation of new fluorophoric groups in H1–H3 greywater samples being significantly more pronounced in comparison to L1–L3 greywater samples. SFIsyn values were 7.64, 7.28 and 0.49 for L1–L3, respectively. Moreover, for high-OM load greywater samples SFIsyn were 7.45, 10.1 and 18.6 for H1–H3, respectively. SFIsync was defined as DOC normalized synchronous fluorescence intensity at 470 nm (FIsync). Although FIsync values of H1 and H2 were decreased from 85.61 to 60.38 and from 81.55 to 75.08, the simultaneous decrease of DOC values from 13 to 8.1 for H1 and from 12.9 to 7.5 ended up with higher SFIsync values.
It should be indicated that L3 and H3 samples also contained bacterial consortium subjected to photocatalysis upon which through cell destruction and following lysis, intracellular OM release should be expected. Therefore, contribution of the organic matrix formed through bacterial degradation would certainly affect the removal mechanism both UV254 and DOC.
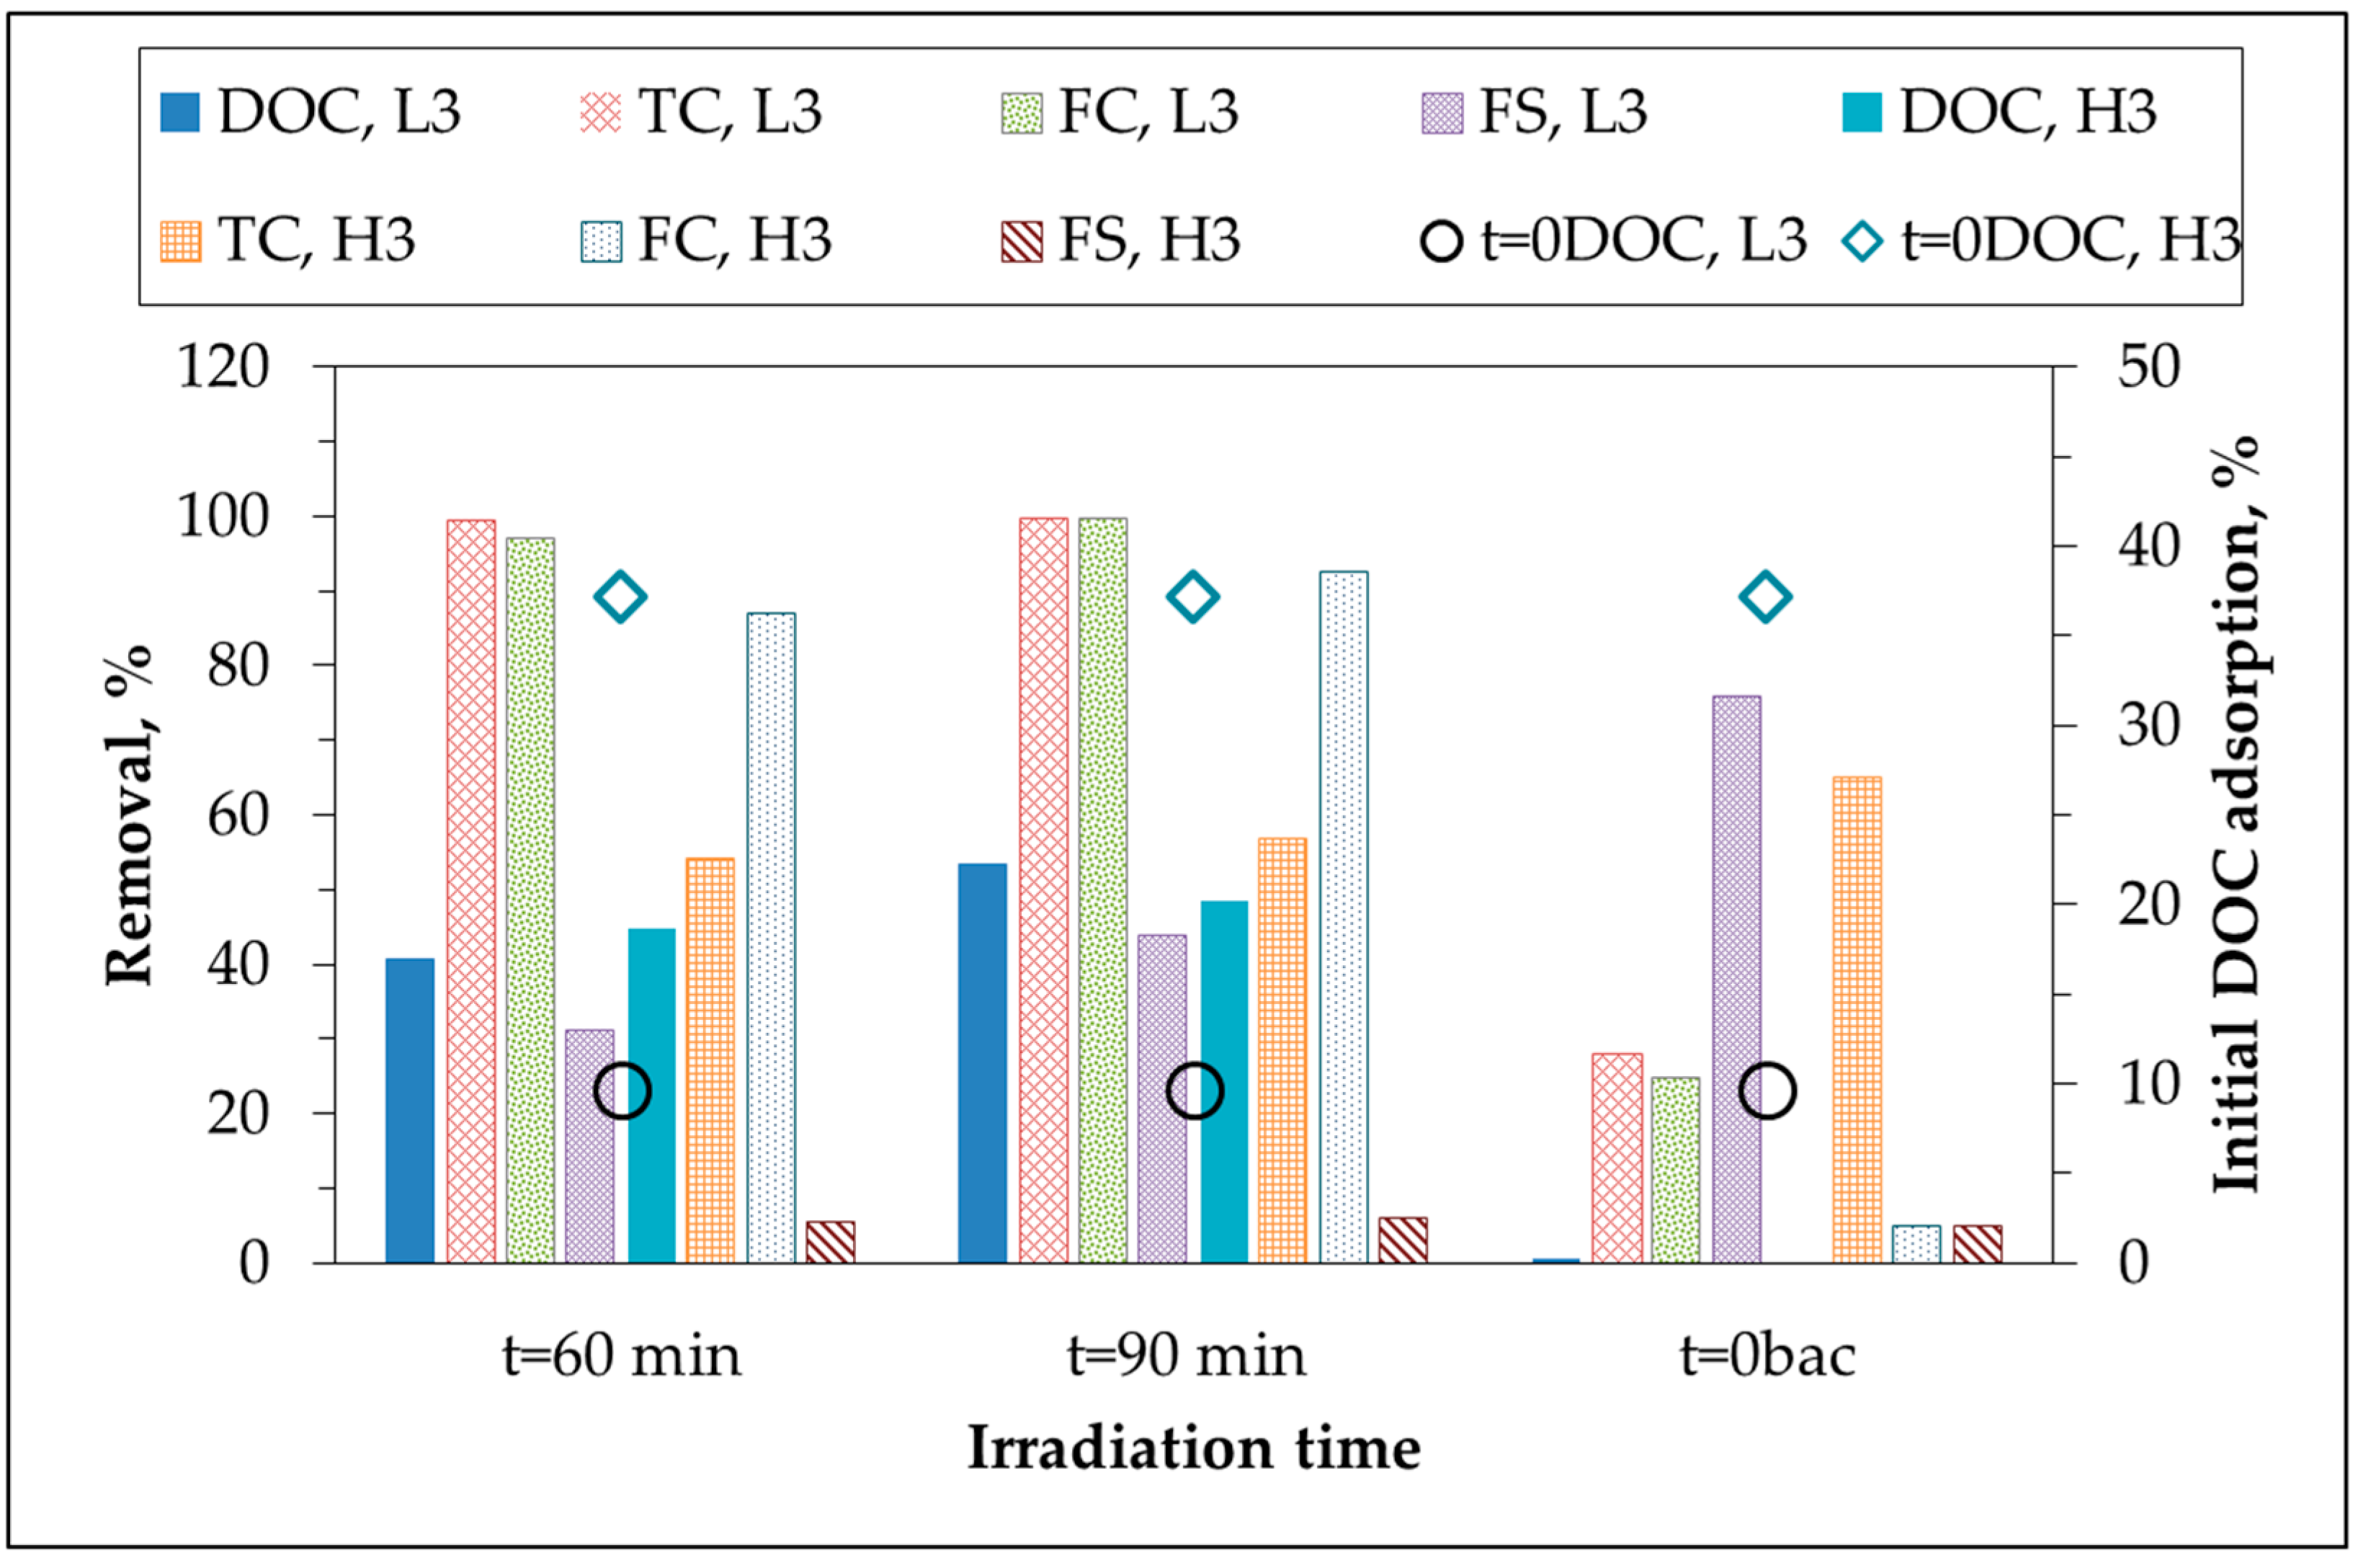
2.3. Bacterial Inactivation
Bacterial inactivation via photocatalytic oxidation of greywater samples (L3 and H3) were presented in
Figure 3. Although removal efficiencies after irradiation periods of 60 min and 90 min were given for simplicity purposes, kinetic evaluation were assessed by using whole range of irradiation periods. Following photocatalytic irradiation period of 90 min, almost complete destruction of TC and FC bacteria and 44% removal of FS bacteria were achieved for L3, whereas for the same photocatalytic irradiation period, H3 revealed removal efficiencies of 57%, 93%, and 6% for TC, FC, and FS, respectively.
Initial adsorption mechanism is defined as the condition at which attachment of bacteria to the oxide surface upon an instantaneous introduction of TiO
2 and is one of the crucial steps prior to photocatalysis. Moreover, considering the larger size of bacteria in comparison to OM and anions, TiO
2 particles could possibly be adsorbed onto bacteria [
28]. TiO
2 primary particle size was reported as 30 nm and dispersed particle size would be 200–215 nm in comparison to bacteria being greater than 0.45 μm [
29]. As a consequence due to the low initial adsorption of TC bacteria (~25% for both L3 and H3), photocatalytic inactivation profiles of TC could be related to the Eley-Rideal mechanism rather than the surface-oriented Langmuir-Hinshelwood mechanism [
30,
31,
32]. On the other hand, FC inactivation profiles could be correlated to higher adsorptive removals (76% for L3 and 65% for H3). Initial adsorption of FS (5%) did not display any significant effect on the inactivation rate of H3 in 90 min of irradiation period contrary to the results attained for L3. Bacterial inactivation efficiencies of low-load greywater samples were found to be considerably higher than results revealed for high-load greywater samples which could be attributed to OM composition of high-load greywater samples constituting of high molecular weight organics.
2.4. Kinetic Considerations
Photocatalytic irradiation time-dependent degradation profiles revealed a basic logarithmic declining trend for both of the UV
254 and DOC parameters; thus, data were modeled by a pseudo first-order kinetic equation using the specified UV-vis parameter as well as DOC (
Table 3). Pseudo first-order reaction rate (R) for the photocatalytic oxidation of low-load greywater with low anion content and bacteria (L3) was the most effective in terms of the removal of UV
254 parameter (
R = 1.33 m
−1·min
−1). Although similar conditions existed for L3 and H3, with the exception of OM content, degradation rate of L3 was two times higher than that of H3. In a similar trend, photocatalytic degradation rate constants of L2 and H2 were noticeably different from each other. On the other hand, although their OM contents were different from each other (6.72 and 13.0 mg·L
−1 respectively), UV
254 photocatalytic degradation rates of L1 and H1 expressed closer results indicating that the presence of specific anion concentration in the low range did not exert any significant effect in comparison to the effect of OM composition and content. Considering the dependence of kinetics and mechanism of oxidative degradation on the solution matrix, pseudo first-order degradation rates of UV
254 could be ordered as L3 > L2 > H1 > H2 > L1 > H3.
The effect of solution matrix complexity on the pseudo-first order kinetic model parameters were observed and discussed by monitoring differences among different greywater samples in terms of removal of OM content expressed by DOC. DOC removal rates could be presented by the decreasing order of H2 > H1 > L3 > L1 > H3 > L2. In the presence of high load preoxidized OM, H1, and H2 greywater samples revealed comparatively higher DOC degradation rates. Although L3 sample contained bacteria, the presence of low-load OM and low-load of anions resulted in comparatively similar DOC removal rate. On the other hand, L1 and L2 samples exhibited lower DOC removal rates that could be explained by the composition of OM. Moreover, H3 sample expressed similar rate to L1 and L2 due to the presence of preoxidized OM, as well as bacteria.
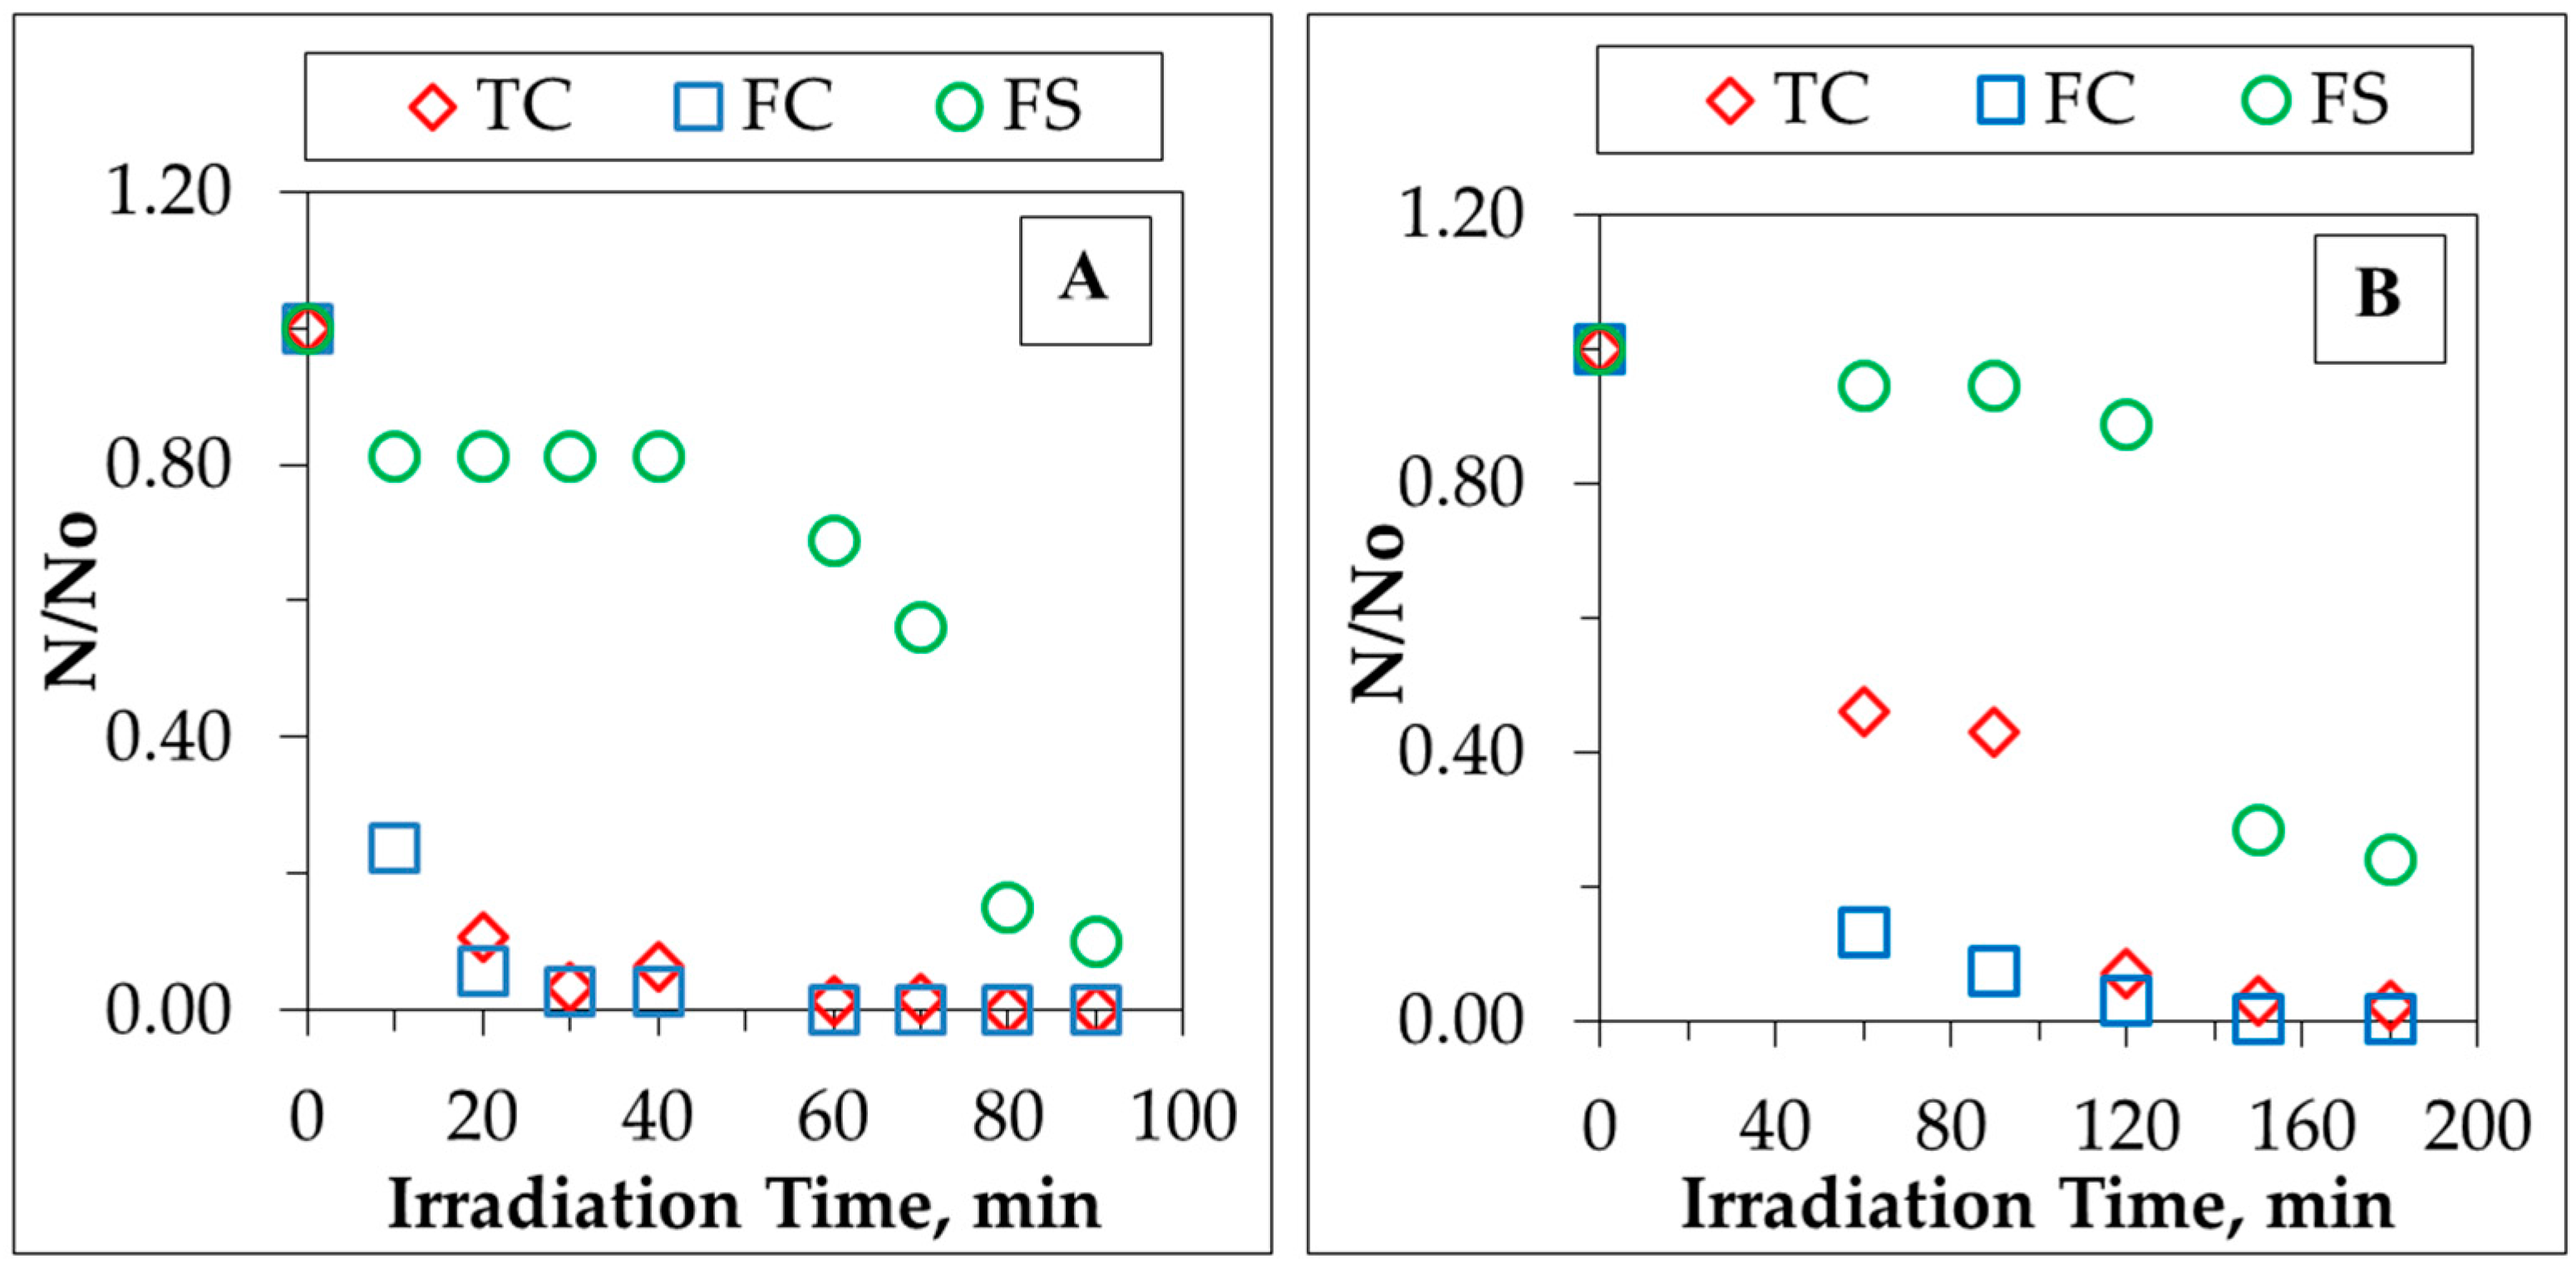
Kinetic modeling of bacterial inactivation profiles of L3 and H3 greywater samples are presented in
Figure 4A,B. Rapid inactivation of TC and FC bacteria in L3 were achieved even after a photocatalytic irradiation time of 20 min, reaching almost complete removal in 30 min of irradiation. However, in the case of H3, a comparatively slower inactivation rate was achieved for both TC and FC, indicating complete removal following a 120 min irradiation period. Contrary to these findings, the FS inactivation profile of L3 greywater sample displayed an induction period of 40 min during which only 20% FS was removed that could be attributed to a prevailing initial adsorption-desorption phase [
31,
33]. This phase was followed by rapid removal of 90% in 90 min. On the other hand, for the H3 greywater sample, this induction period was observed for 120 min followed by rapid inactivation phase reaching to almost 90% in 150 min. Pseudo first-order modeling of photocatalytic inactivation of bacteria in greywater samples was also assessed in
Table 4.
The observed differences could mainly be attributed to several reasons, such as (i) impact of organic carbon composition of greywater samples; (ii) differences in cell wall complexity and thickness between Gram positive (FS) and Gram negative bacteria such as coliforms (TC and FC); and (iii) the presence of common anions in solution matrix. Since the hydroxyl radical attack occurs on the cell wall of bacteria, attention should be paid to differences in cell wall complexity and thickness, which may be the reason of different photocatalytic inactivation profiles [
34,
35,
36]. FS were known to be a sub-group of Gram-positive bacteria which have considerably thicker cell walls consisting of many complex layers of lipopolysaccharides and lipoproteins. On the other hand, referring to the sub-groups of Gram-negative bacteria, TC and FC bacteria have comparatively thinner cell walls composed of fewer layers of lipopolysaccharides and lipoproteins that could be less resistant to the photocatalytic oxidation process.
Acting as hydroxyl radical scavengers, common anions present in solution matrix could come up with a significant competitive reaction mechanism during photocatalytic degradation. In accordance with the previous findings presented in literature, the presence of common anions was expected to influence the photocatalytic degradation of organic matter, either due to direct effects via mechanistic pathway or indirect effects via alterations in the structure [
37,
38]. The induced outcome could be observed as inhibiting or enhancing factors [
39]. Influence of sulfate and chloride ions on photocatalytic mineralization of humic acids have been studied by Bekbolet and co-workers revealing that the presence of both anions caused a significant reduction on degradation rate of humic acid [
40].
Through the course of the photocatalytic treatment, prevailing interactions could be related to (i) pH dependent surface charge development and consecutive adsorptive interactions between components (TiO
2-bacteria, TiO
2-OM and TiO
2-anions); (ii) interactions between solution matrix components: anion-bacteria, anion-OM, and bacteria-OM; (iii) light absorption leading to the formation of reactive oxygen species (ROS); and (iv) simultaneously occurring oxidation reactions between the reactive partners [
31,
41,
42,
43]. Based on these interactions, the reaction mechanism could be presented in the simplified form as (OM
ads: organic matter adsorbed, OM
ox: organic matter oxidized, (Bacteria)
ads/free: bacteria either adsorbed or free in solution, and DOC
f: final dissolved organic carbon):
Primary reaction:
TiO2 + hv (λ < 388 nm) → TiO2 (hVB+ + eCB−) → ROS {•OH/•HO2/O2•−}
Organic matter content;
•OH + OMads → •OM + H2O → via radical reactions → OMox →→→ CO2 + H2O
Bacterial consortium;
(Bacteria)ads/free + •OH →→ Inactivation/cell decomposition/DOCf... →→→ Oxidized species...
It should also be stated that the presence of varying amounts of organic fractions, as well as anions, could possibly interfere with the pH-dependent electrostatic interactions prevailing between the negatively charged bacterial species and partially negatively charged OM moieties due to the deprotonation of the carboxylic groups (pKa~3–5), anions, and the negatively/positively charged TiO
2 surface (pH
zpc = 6.3) [
44,
45]. Under neutral pH conditions, the surface of bacteria acquires a negative charge.
Inhibitory factors considered in the overall rate of the photocatalytic oxidation process could be attributed to the hydroxyl radical scavenging potential of the anions in the solution matrix as follows:
The observed scavenging effect was more pronounced overwhelming the slight enhancement that could be expected due to the formation of SO
4•
−/H
2PO
4• radicals. Moreover, competitive oxidation reactions could also proceed between the anions and photogenerated h
+ on the surface of TiO
2 [
41].
Despite the above presented effects due to the presence of anions, greywater samples could be successfully treated via photocatalysis achieving degradation of OM as well as inactivation of bacteria simultaneously.


