Article

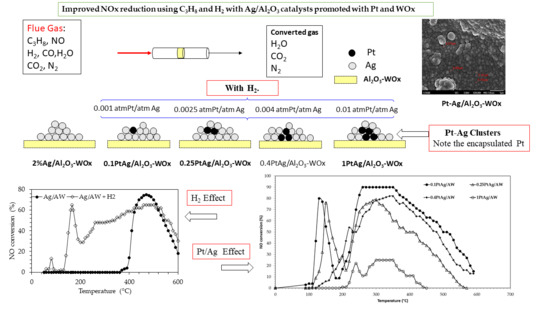
Improved NOx Reduction Using C3H8 and H2 with Ag/Al2O3 Catalysts Promoted with Pt and WOx

by
Naomi N. González Hernández
1,
José Luis Contreras
1,*,
Marcos Pinto
1,
Beatriz Zeifert
2,
Jorge L. Flores Moreno
1,
Gustavo A. Fuentes
3,
María E. Hernández-Terán
3,
Tamara Vázquez
2,
José Salmones
2 and
José M. Jurado
1
1
Energy Department, CBI, Universidad Autónoma Metropolitana-Azcapotzalco. Av. Sn. Pablo 180, Col. Reynosa, México City C.P.02200, Mexico
2
Instituto Politécnico Nacional, ESIQIE. U.P. López Mateos Zacatenco, Mexico City C.P. 07738, Mexico
3
Universidad Autónoma Metropolitana-Iztapalapa, CBI-IPH, Mexico City C.P. 09340, Mexico
*
Author to whom correspondence should be addressed.
Catalysts 2020, 10(10), 1212; https://doi.org/10.3390/catal10101212
Submission received: 29 June 2020 / Revised: 10 October 2020 / Accepted: 14 October 2020 / Published: 19 October 2020
(This article belongs to the Special Issue Advanced Strategies for Catalyst Design)

Abstract

:
The addition of Pt (0.1 wt%Pt) to the 2 wt%Ag/Al2O3-WOx catalyst improved the C3H8– Selective Catalytic Reduction (SCR) of NO assisted by H2 and widened the range of the operation window. During H2–C3H8–SCR of NO, the bimetallic Pt–Ag catalyst showed two maxima in conversion: 80% (at 130 °C) and 91% (between 260 and 350 °C). This PtAg bimetallic catalyst showed that it could combine the catalytic properties of Pt at low temperature, with the properties of Ag/Al2O3 at high temperature. These PtAg catalysts were composed of Ag+, Agnδ+ clusters, and PtAg nanoparticles. The catalysts were characterized by Temperature Programmed Reduction (TPR), Ultraviolet Visible Spectroscopy (UV-Vis), Scanning Electron Microscopy (SEM)/ Energy Dispersed X-ray Spectroscopy (EDS), x-ray Diffraction (XRD) and N2 physisorption. The PtAg bimetallic catalysts were able to chemisorb H2. The dispersion of Pt in the bimetallic catalysts was the largest for the catalyst with the lowest Pt/Ag atomic ratio. Through SEM, mainly spherical clusters smaller than 10 nm were observed in the PtAg catalyst. There were about 32% of particles with size equal or below 10 nm. The PtAg bimetallic catalysts produced NO2 in the intermediate temperature range as well as some N2O. The yield to N2O was proportional to the Pt/Ag atomic ratio and reached 8.5% N2O. WOx stabilizes Al2O3 at temperatures ≥650 °C, and also stabilizes Pt when it is reduced in H2 at high temperature (800 °C).

Graphical Abstract

1. Introduction

The conversion of nitrogen oxide emissions (NOx) from diesel machines can be carried out through selective catalytic reduction (SCR) using reductants such as hydrocarbons, alcohols, NH3, H2, and supported metal catalysts [1,2]. The exhaust atmosphere is oxidizing, which hinders the use of three-way technology. Hydrocarbons, present in small amounts in emissions, can be used as a reducing agent to react competitively with O2 or NOx, producing N2, CO2, and H2O and traces of N2O.
Among the NOx reduction technologies today, urea-based SCR is used in new heavy trucks and some types of cars that run with diesel-type engines. The requirement to add a urea solution into the gas emissions is inconvenient for bus operators and for passenger cars. The possibility of using hydrocarbons to carry out the SCR of NOx (HC–SCR) or alcohols to decrease the contaminants continuously is still attractive [3]. For the SCR of NO using hydrocarbons (HC), catalysts based on Pt, Cu, Ir, Rh, and Ag have been studied [1,2]. The latter metal supported on γ-Al2O3 is very interesting because, during SCR using C3H6 or C8H18, the main product is N2 and not N2O [2]. It has also been shown to have good stability in the presence of water vapor [4,5] and some tolerance to SO2 [6].
Hydrocarbons have been studied as reducers, but alcohols such as methanol, ethanol, and butanol have also been considered [7,8,9,10]. The SCR of NO from Ag/Al2O3 catalysts in the presence of O2 depends on the concentration and structure of Ag moieties on the surface (i.e., Ag+ cations and Agn (n = 8) nanoclusters). Ag0 nanoparticles have been reported to catalyze the total oxidation of hydrocarbons or alcohols to CO2 and H2O [8]. In studies using reductants such as C3H6 and impregnation of Ag precursor in Al2O3, it has been found that there is an optimum concentration in Al2O3 between 1 and 3 wt% [3,11]. Studies on the nature and role of active Ag species during NOx reduction in the presence of C3H6 and water have been done, and proposals for reaction mechanisms in the presence of hydrocarbons using spectroscopic techniques have been made [12,13,14,15,16,17,18,19,20,21,22,23,24].
There are some drawbacks of the Ag/Al2O3 catalyst. The main one is that it is active in a narrow range of high temperatures and has low activity below 400 °C in the case of SCR with light hydrocarbons [7,8]. This is an issue because the exhaust gases of lean-burn diesel engines have low temperatures during standard driving conditions.
This problem can be addressed because the operating temperature range has been expanded with the addition of H2 [24,25,26,27,28,29,30], which results in the presence of two NO reduction zones: one at low-temperature (80–180 °C) and the other at high temperature (180 to 480 °C). In the search for other reducers, research has also been done using H2 and NH3 together [31,32] and on the coaddition of NH3 and ethanol [33], obtaining good reduction results at low temperatures, although there may be NH3 emissions.
The study of the effect of the hydrocarbon’s molecular weight has been carried out using propene and octane [3]. There is one work about the use of gasoline and ethanol as reducing agents [34]. The results showed the presence of NH3, and both NO and ethanol began to react at low temperatures (200–300 °C) on Ag/Al2O3. Studies with other metals such as In/Ag/Al2O3–TiO2 using CO showed an improvement in yield to N2 when In was added to Ag [35].
The combined effect of CO and C3H8 was analyzed, and the temperature window was expanded, but a 5 wt%Ag/Al2O3 catalyst was required [36]. In this case, the addition of noble metals such as Pt to Ag is useful in obtaining high conversions of NO at low temperatures by using octane as a reduction agent [37]. The catalyst composition showing the highest activity for NOx reduction was a 2 wt%Ag/Al2O3 doped with 500 ppm Pt. This catalyst showed great capacity for adsorption and partial oxidation of the hydrocarbon, where the Pt has a predominant role.
There have been studies of intermediate storage of NO (passive NOx trap) at low temperatures and regeneration of the adsorbed compound (NO) at high temperatures when the Ag/Al2O3 catalyst was active to reduce NOx. A Pt/Ba/Al2O3 catalyst proposed by Tamm et al. [38] in the presence of H2 demonstrated the importance of this to increase the amount of NO stored on the catalyst between 100 and 200 °C. Other noble metals such as the addition of Pd to the Ag/Al2O3 catalyst [39] showed that the catalytic activity of the catalyst promoted with Pd was higher than the activity of the Ag single metal catalyst in the oxidation of CO and hydrocarbon as well as in reducing NOx.
In another work [40], the Pd–Ag/Al2O3 catalyst showed higher activity than the Ag/Al2O3 catalyst at temperatures of 300 to 450 °C. It was found that Pd catalyzed the formation of enolic species, which were converted from C3H6. The superficial enolic species were quite reactive toward NO3− and NO2 to form superficial species of –NCO. In the case of the addition of Rh to Ag, theoretical studies have been done that mention the higher capacity of Rh than Ag for NO reduction reactions [41]. Another study of NO reduction where C3H6, Pt, Rh, and Ag/Al2O3 were investigated showed that Ag was the most active at higher temperatures, while Pt and Rh were at lower temperatures (200–250 °C) [42].
As has been observed, the SCR of NOx with hydrocarbons (HC–SCR–NOx) has been of great interest until now, because in the presence of an oxidizing atmosphere, as diesel engines work, it is possible to reduce NOx to N2 [24,40]. In the case of Pt catalysts supported in WO3/ZrO2 and the presence of H2 without Ag for the reduction of NO [43], the authors found high activity at temperatures below 200 °C and high selectivity to N2 (90%). Additionally, the catalyst showed outstanding hydrothermal stability as well as SO2 resistance. Along these same lines, the exceptional stability of WOx has been studied in Al2O3 and Pt/Al2O3 [44,45]. It was adopted for the present study, especially to preserve the thermal stability of Pt species’, Ag0, Ag+ cations, and Agn nanoclusters.
As previously mentioned, the present study contributes to improving the Ag/Al2O3 catalyst by adding minimal amounts of Pt and WOx in the presence of H2 and C3H8, which allows for improvement in the SCR of NO. The PtAg/Al2O3-WOx catalysts were prepared in powder form with the optimal amount of WOx that allows for a high metallic dispersion of Pt and Ag to be obtained, since it is resistant to deactivation by sintering, stabilizing the porous structure of Al2O3. The study combined H2 and C3H8 reducers and the presence of small amounts of Pt, which allows for a higher conversion of NO at low temperatures.

2. Results and Discussion

Seven Ag and Pt catalysts supported on γ-alumina (with or without WOx) were prepared by the incipient wetness impregnation method with AgNO3 and H2PtCl6 aqueous solutions. The preparation method is reported in greater detail in the Materials and Methods section. The characterization section is presented first and the catalytic evaluation section later.

2.1. Characterization

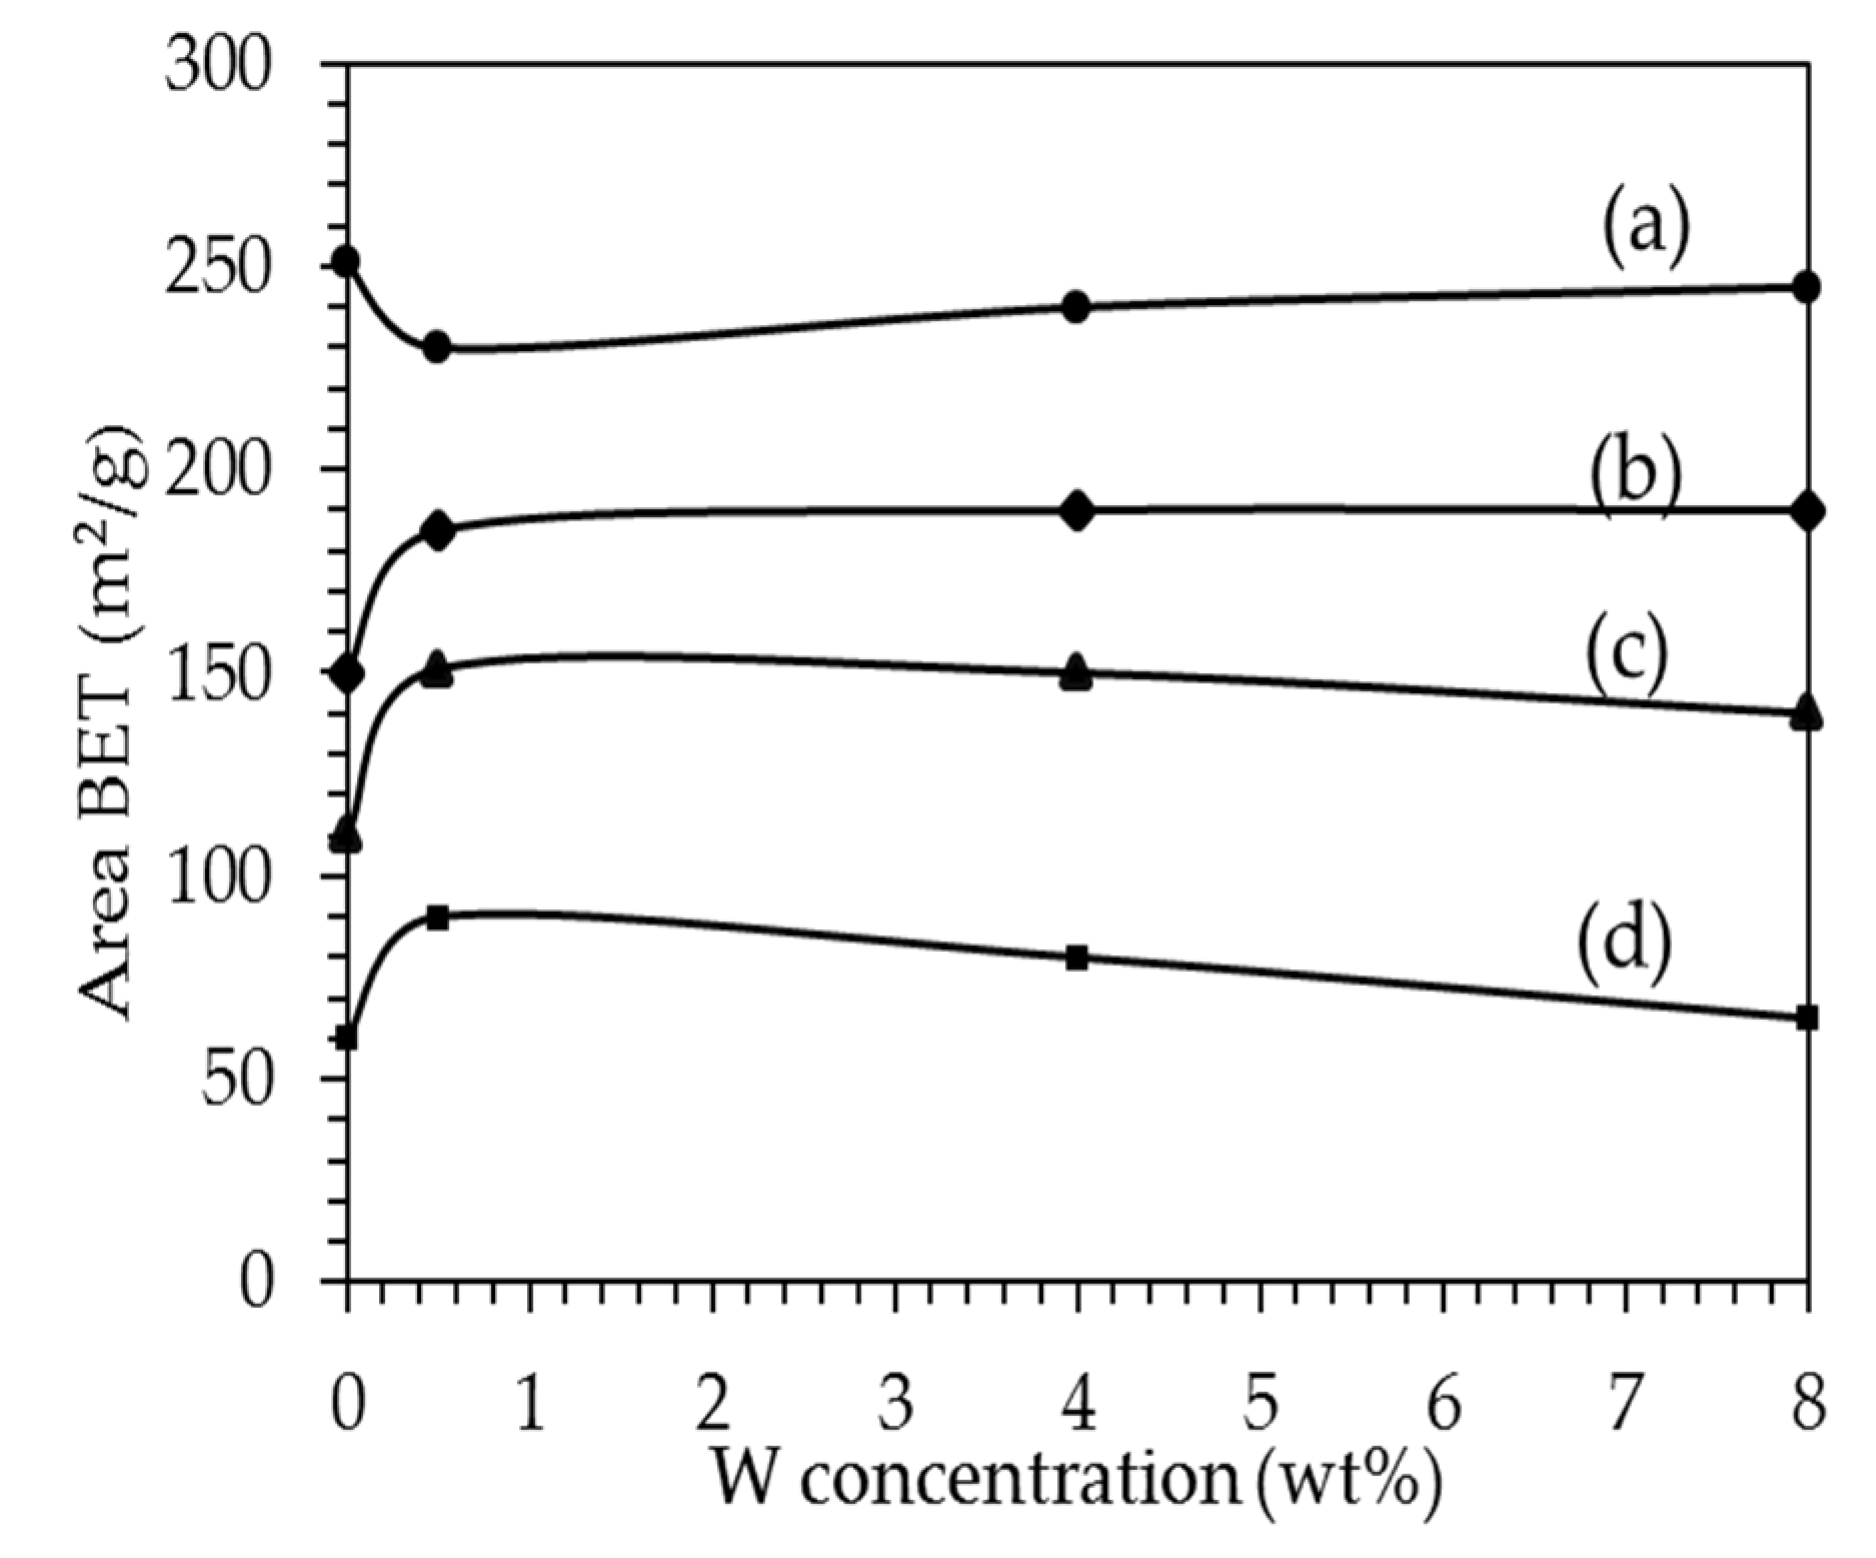
2.1.1. Textural Properties

The synthesized γ-Al2O3 (A) presented type IV isotherms, according to the International Union of Pure and Applied Chemistry (IUPAC), the Brunauer Emmett and Teller (BET) area was higher than some commercial alumina with an average unimodal pore diameter of 54 Å (Table 1). The impregnation of Pt as well as Ag and WOx did not significantly modify the area and the other properties.

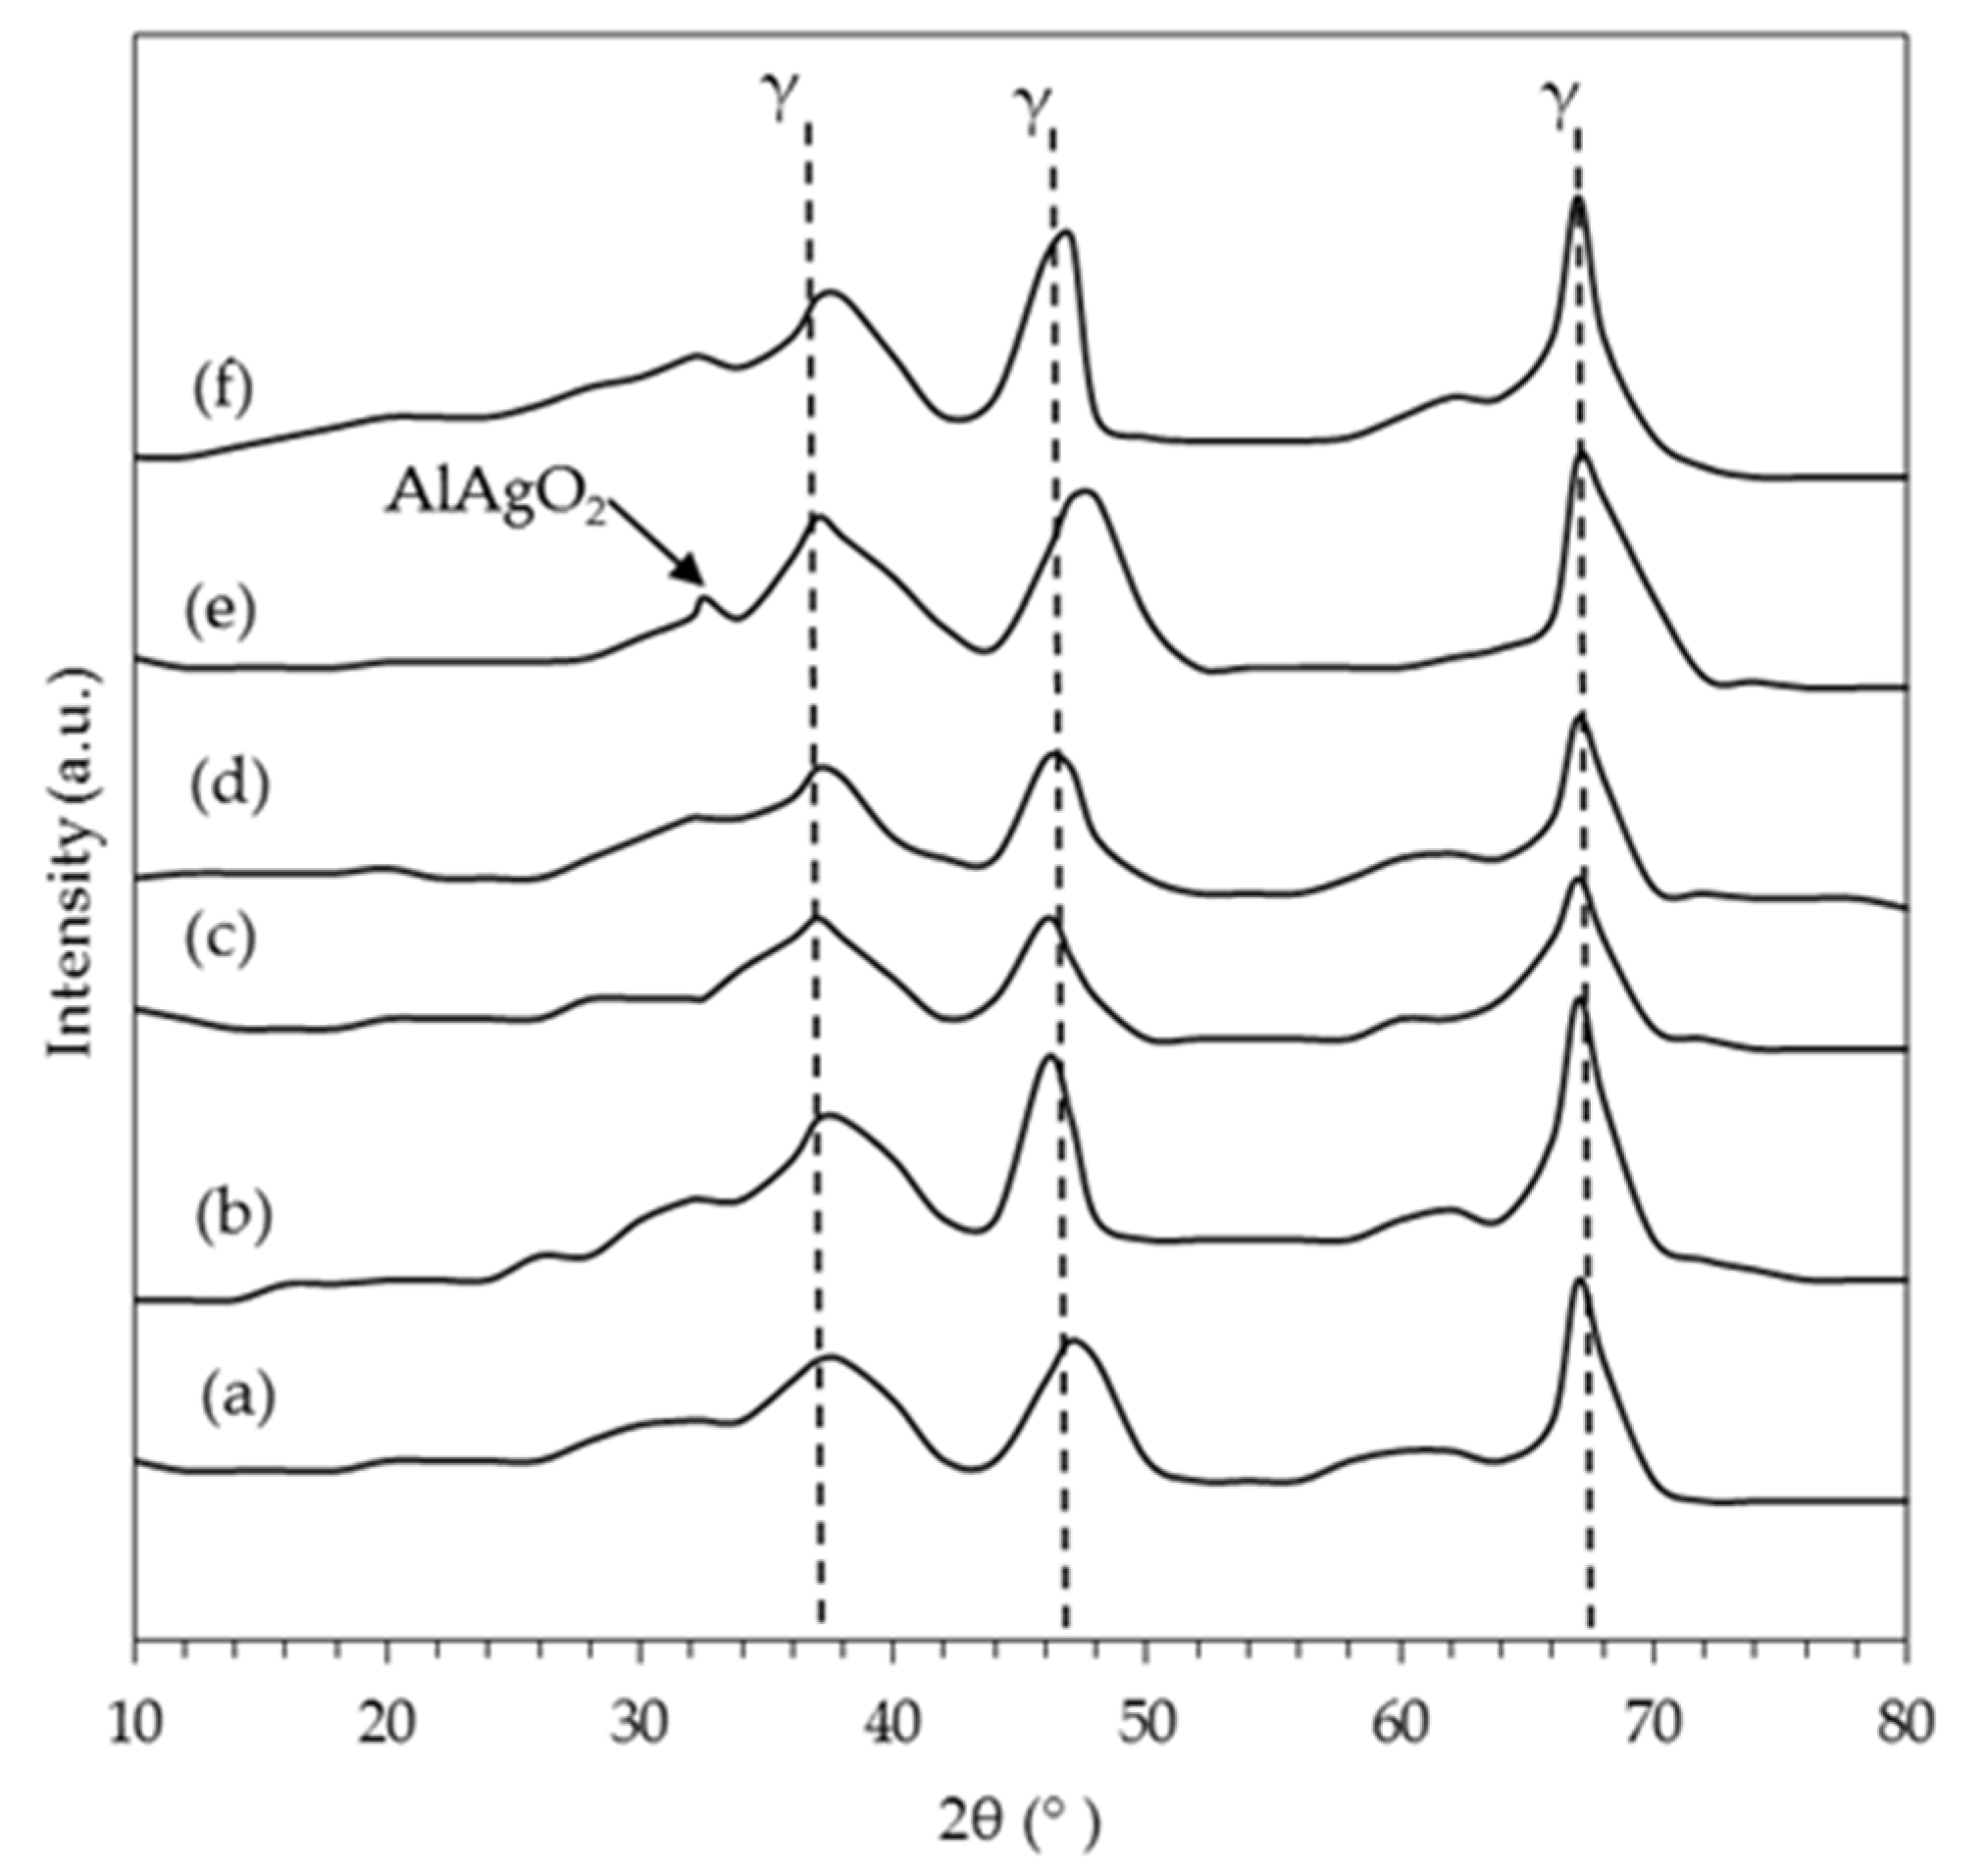
2.1.2. X-Ray Diffraction (XRD)

The powder x-ray diffraction pattern of all samples showed typical reflections of the g-alumina phase (Figure 1a), with peaks at 2θ = 37°, 46°, and 67°. The presence of another phase was not observed, and the materials were amorphous [46]. According to Aguado et al. [47], these three main peaks correspond to the reflections (311), (400), and (440).
Figure 1a–d,f show similar diffractograms of the samples calcined at 500 °C and reduced to 450 °C and no Pt or Ag signals were observed due to their low concentration. However, it was reported that a catalyst of 5 wt%Ag/Al2O3 showed reflections of metallic Ag [48].
Sample 0.4PtAg/AW (Figure 1e) showed a reflection at 2θ = 38.7°, probably attributed to AlAg2O, however, the other reflections of this compound (2θ = 50.5° and 66.8°) were not noted or revealed the presence of supported Ag2O particles with a size greater than 5 nm. The broad peaks of these samples showed a stable amorphous and meta structure. The metallic compound Ag2O has been reported in other studies [49] using Ag concentrations higher than 5 wt%.

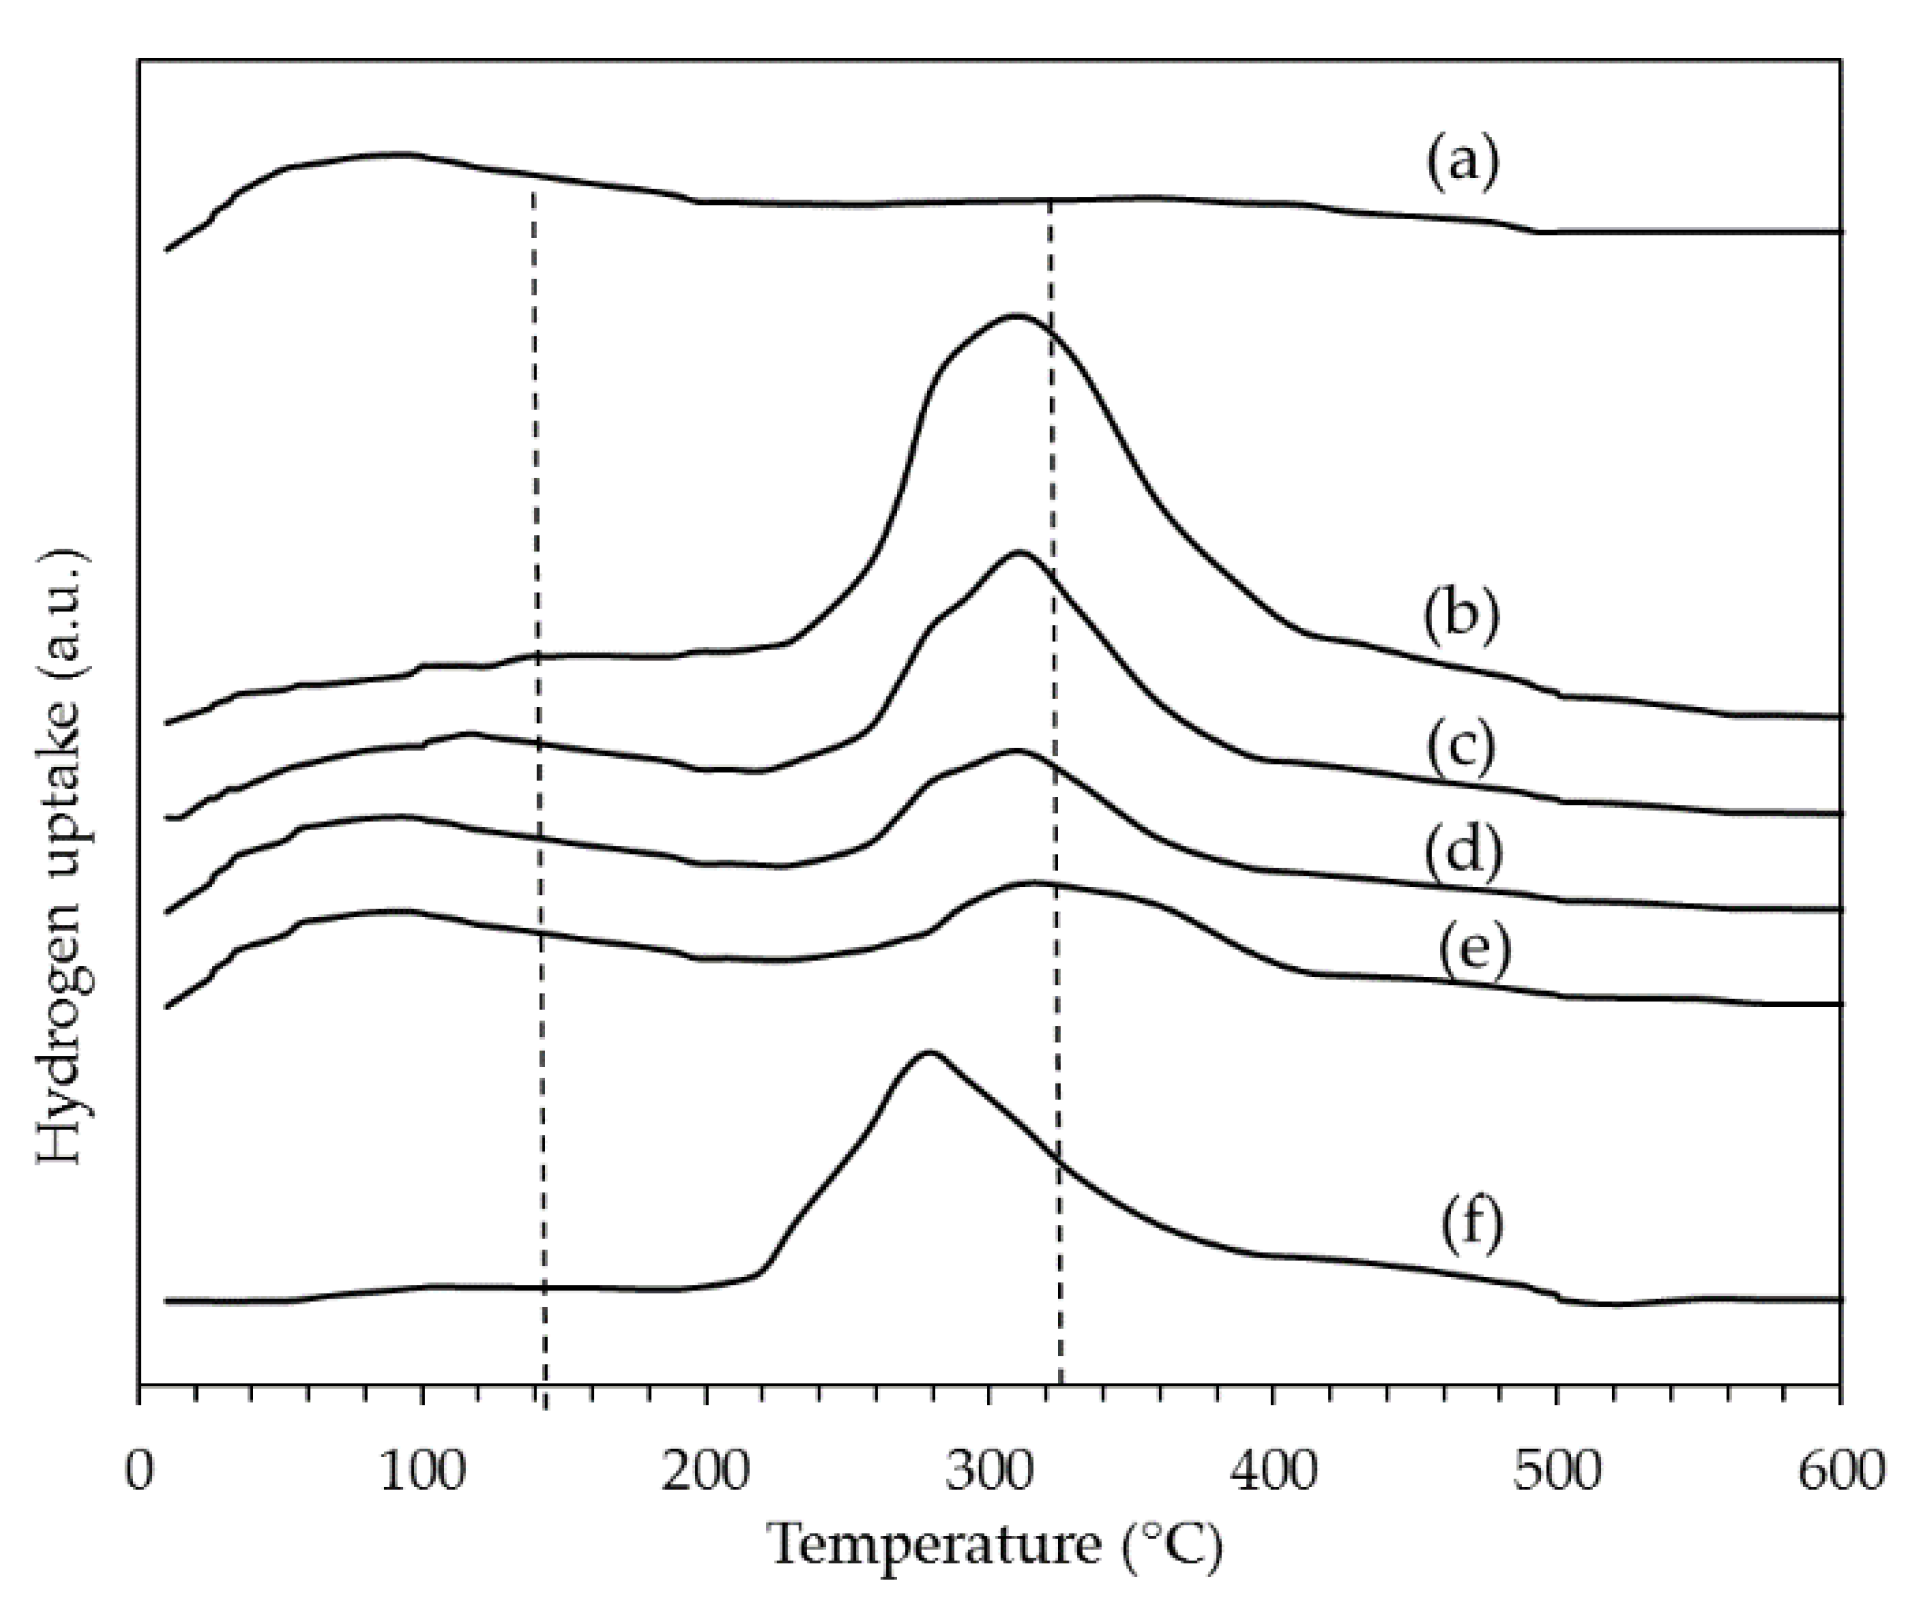
2.1.3. Temperature Programmed Reduction (TPR)

In the case of 2Ag/AW silver catalyst reduction (Figure 2a), two peaks located at 100 °C and 340 °C was observed, corresponding to the reduction of AgO and Ag2O clusters. This result has already been reported using a 2 wt%Ag/Al2O3 catalyst by Bethke and Kung [11] and Maria E. Hernández-Terán [50]. In this last peak, the inflection point or maximum was not observed. These small reduction peaks could be caused by part of the Ag compound already decomposed to metallic silver during calcination [50,51].
In the case of the 0.4Pt/AW catalyst (Figure 2f), the Pt reduction peak could be observed due to the Pt-oxychloride complexes (PtOxCly) located at 280 °C [52]. The H2 consumption for the reduction of (PtOxCly) corresponds to the reduction from Pt+4 to Pt0. It is known that the temperature of the reduction peak depends on the precursor of Pt [52]. If a chlorine-free Pt precursor such as Pt(NH3)4(NO3)2 is used, the temperature is close to 70 °C (reduction of PtO2), whereas if H2PtCl6 is used, the temperature is 290 °C.
In the case of the catalyst with the highest concentration of Pt (1PtAg/AW), two peaks located at 100 °C and 315 °C were observed (Figure 2b). Again, the first corresponded to the reduction of AgO, while the second corresponded to the co-reduction of the two metals’ oxides, as has been reported in the literature [50,53]. The maximum peak temperature of this catalyst was 35 °C higher than the peak of the 0.4Pt/AW catalyst (Figure 2f).
This kind of peak has been mentioned in the literature; for example, the Pt–Ag/SiO2 catalyst has been reported as an alloy when Ag is impregnated on the Pt/SiO2 catalyst [54]. It has been found that in such alloys, the Pt and Ag can be secreted by high-temperature oxidation.
The catalysts with lower Pt concentrations (Figure 2c–e) also showed two peaks at temperatures of 100 °C and 305 °C. This last peak was again found at 35 °C higher than the maximum of the 0.4Pt/AW catalyst peak (Figure 2f). The ratio of μmoles of H2 consumed per g of catalyst (gc) for the Pt peaks is shown in Table 1. It was observed that the bimetallic catalysts of PtAg consumed H2 as a function of the concentration of Pt.
In the case of the reduction peak at 100 °C (reduction of AgO), for the 2Ag/AW catalyst (Figure 2a), it was 68 μmol H2/gc. This value was almost constant for the other values of the reduction of AgO of the bimetallic catalysts since the Ag content was constant (2 wt%Ag), and only in the 1PtAg/AW catalyst did it decrease slightly (Figure 2b).
The ratio of moles of H2 consumed per g of catalyst (gc) for Pt is shown in Table 1. The bimetallic catalysts of PtAg consumed H2 as a function of the concentration of Pt, as reported in the literature [53]. In general, reducing the Pt oxides was completed, while in the case of Ag oxides, it was not completed. Only a part of Ag oxides seemed to be susceptible to reduction, because another part was already in a metallic state after calcination, as has been reported in the literature [50,54].

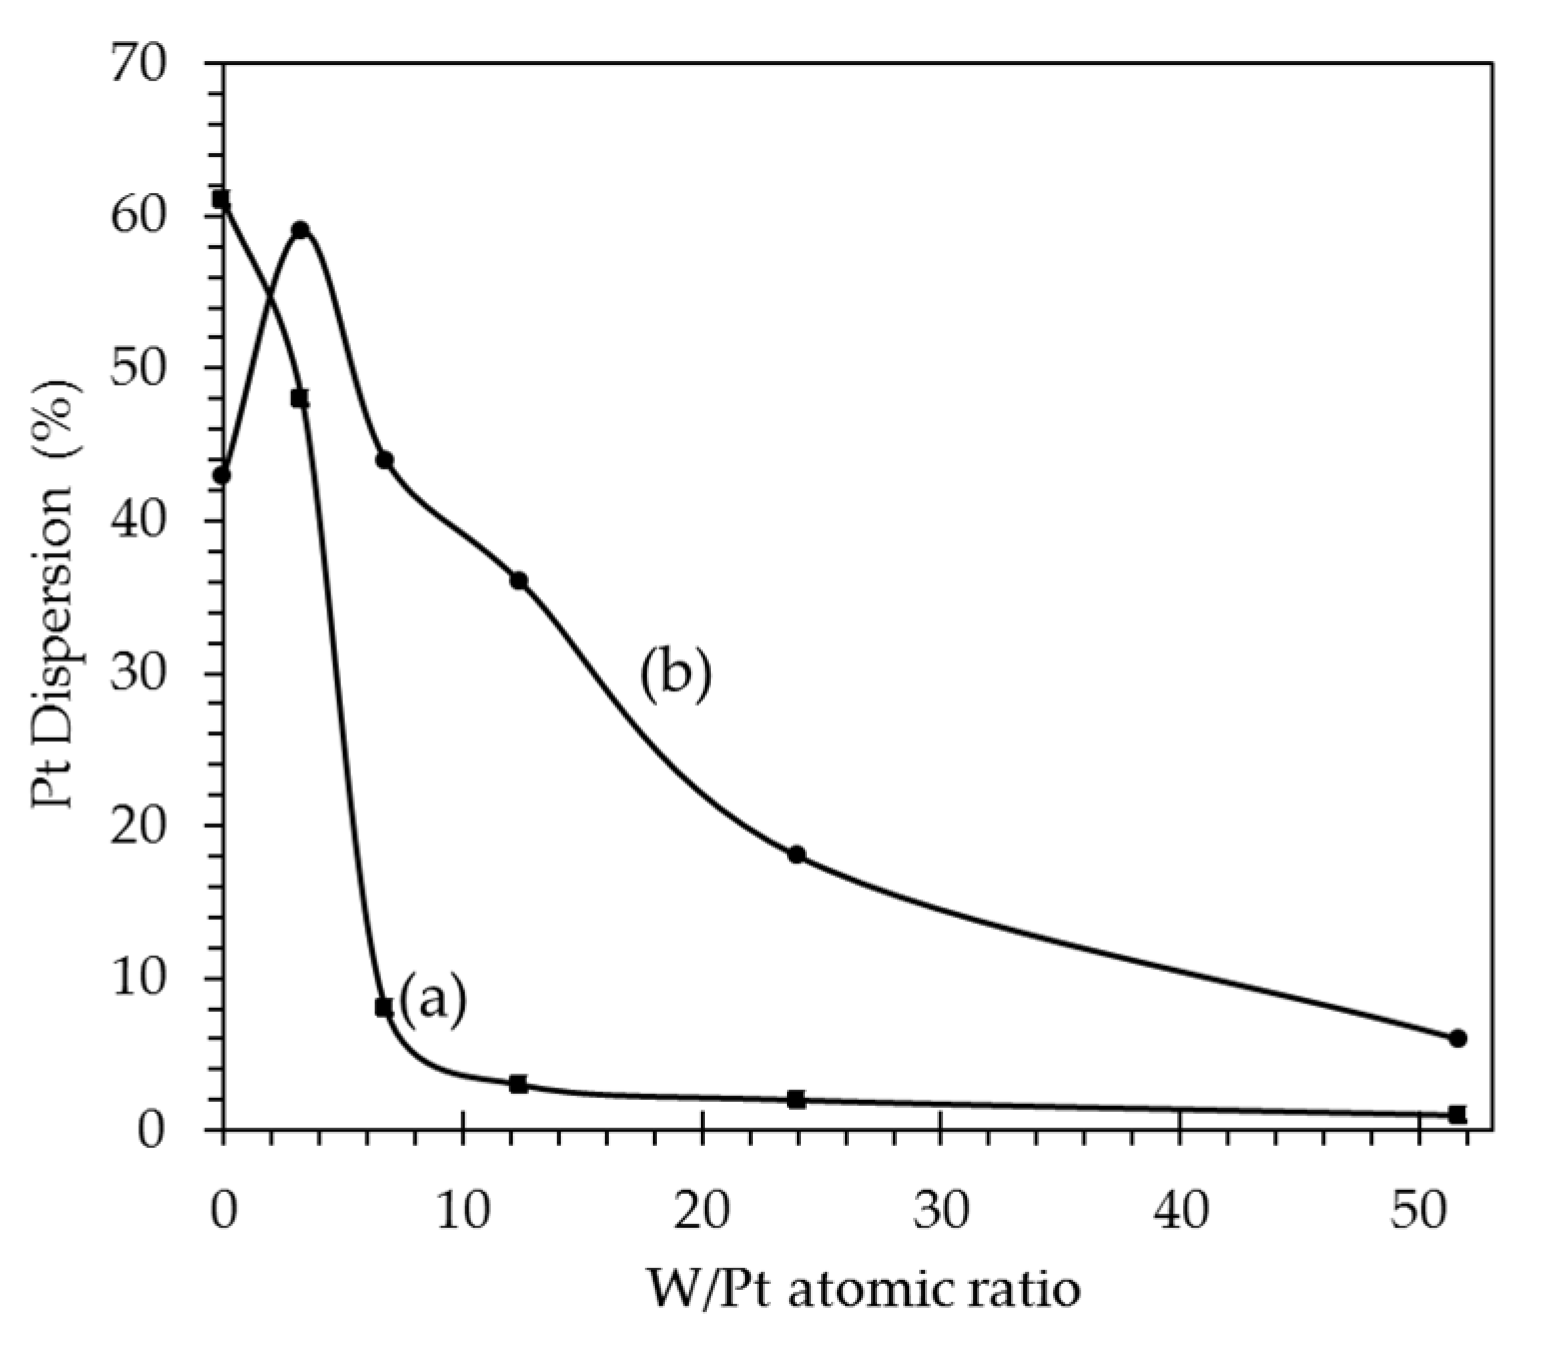
2.1.4. H2 Chemisorption

The chemisorption of H2 was carried out mainly at the Pt sites. H2 chemisorption of part of the Ag was not observed; even in the case of bimetallic catalysts, it is evident that the consumption of H2 is proportional to the concentration of Pt (Table 1). For the Pt dispersion calculation, the stoichiometry H/Pt was 1, as reported in the literature [55], the dilution state that Ag exerts on Pt atoms is evident, as reported in the literature [53].
In the case of the catalyst with a high Pt content (1PtAg/AW), a large part of the Pt was reduced to metal; however, only a fraction of it remained on the surface of the bimetallic PtAg particles, so it showed a low dispersion (21%). On the contrary, in the case of the catalyst with a low Pt content (0.1PtAg/AW) with a dispersion of 60%, there was a better ratio of surface Pt atoms to Pt atoms in the bulk of the bimetallic. For the 0.25PtAg/AW and 0.4Pt/AW catalysts, there were intermediate Pt dispersions (46 and 38%) that could explain the NO conversion profiles in terms of the activation of C3H8 and H2.
Some authors have mentioned the presence of a “Pt–Ag alloy” [54]. However, this assertion is doubtful because they did not check if there was a solid solution of Pt and Ag, which is why in our case, we only speak of a bimetallic PtAg system that could have Ag particles decorated with Pt, (or bimetallic core-shell structures), since in all our catalysts, the Ag was always higher in concentration.
On the other hand, there have been studies where the Ag chemisorbs O2, and it has been used to determine its dispersion [56]. The authors validated the stoichiometry of chemisorption of O2 (O2/Ag = 2) by comparing the average particle size using the bright-field TEM, high angle annular dark-field (HAADF), and O2 chemisorption techniques. The active Ag dispersion values they found were: 57.6% (for 1.28 wt%Ag), 51% (for 1.91 wt%Ag), 44.8% (for 2.88 wt%Ag), and 51.2% (for the 6 wt%Ag). The particle sizes were 2.63 nm, 2.62 nm, 3 nm, and 2.63 nm, respectively, at the percentages of Ag, as above-mentioned.

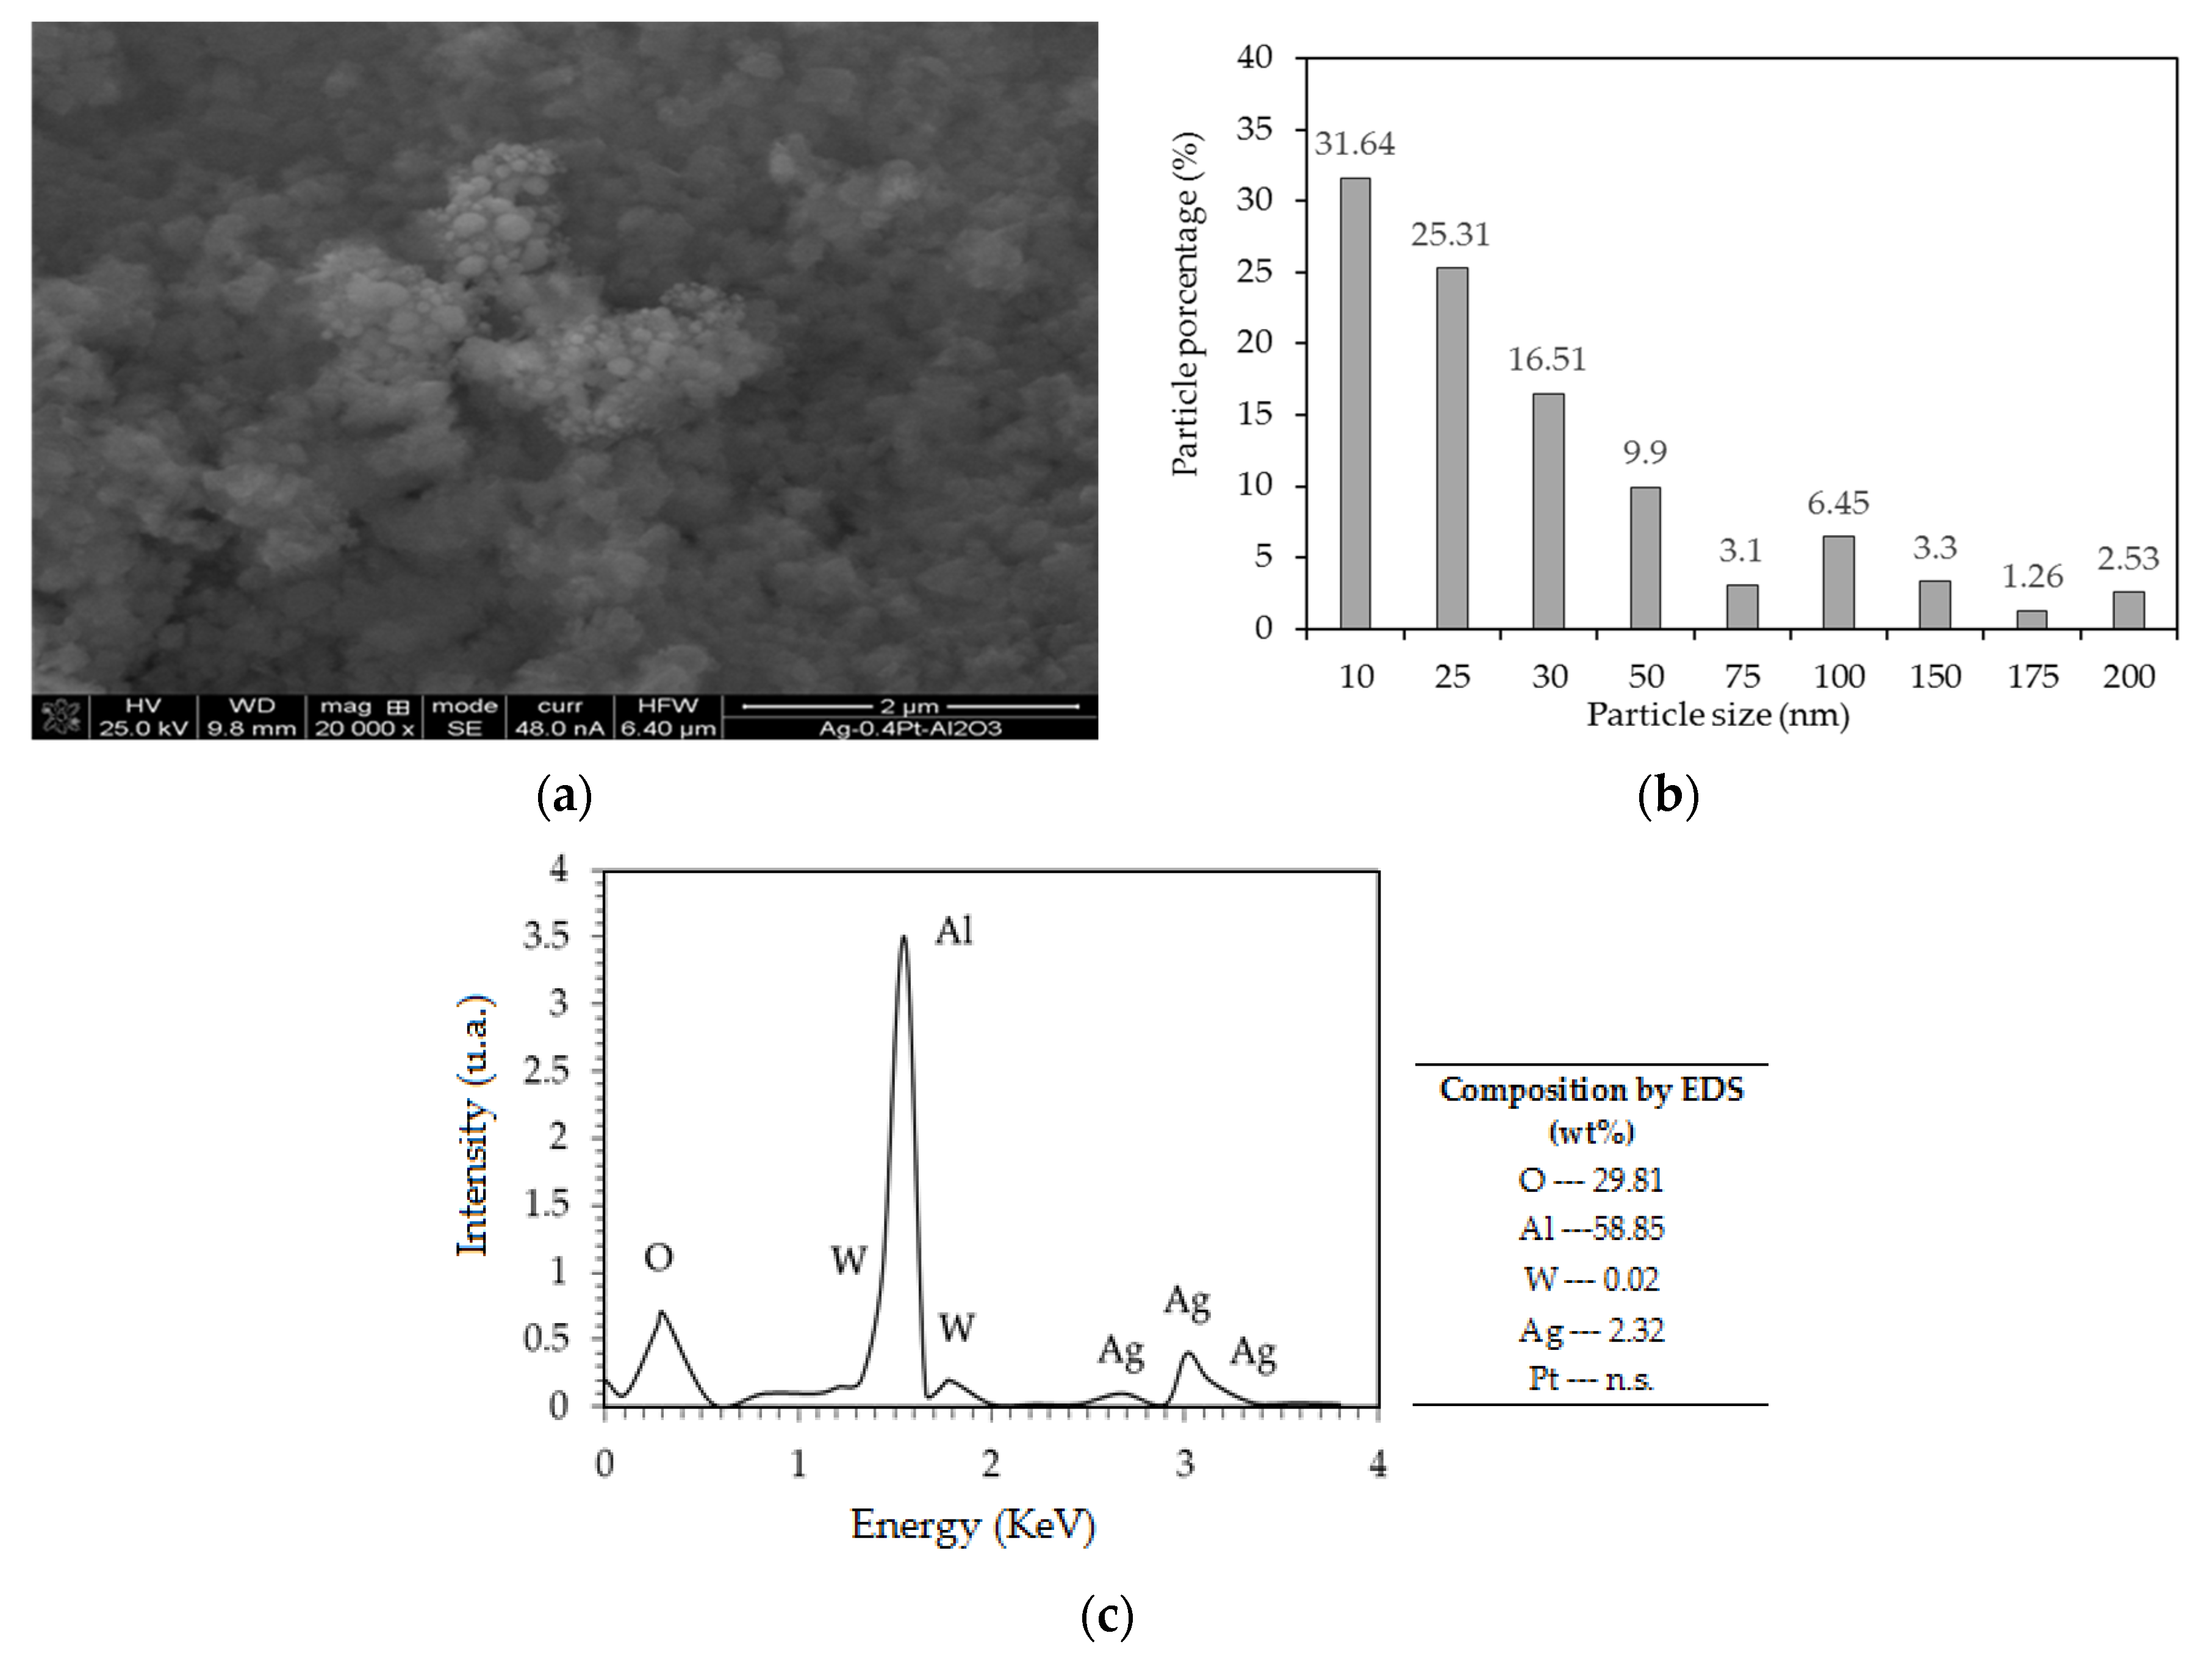
2.1.5. SEM of the Catalysts

The calcined 0.4PtAg/AW catalyst showed spherical particles (Figure 3a) that could be related to the presence of Ag2O [48]. The distribution of particle diameters indicates the predominance (31.64%) of particles of 10 nm, followed by those of 25 and 30 nm (total 42%) (Figure 3b). Finally, those of 50 nm represented 9.9%, and the particles of larger sizes decreased. These results approximate the results reported by Richter et al. [48]. The presence of nanoparticles of different sizes that can vary depending on the type of support has been mentioned. The diameters they found were between 2 to 40 nm with a load of 5 wt%Ag, but predominantly between 5 and 10 nm.
The EDS analysis of the observed area is shown in Figure 3c, where we can observe the presence of Ag and W in amounts approximately at the nominal ones. Richter et al. [48] also identified Ag2O by convergent beam diffraction, where Ag2O was indexed, and the primary signal was attributed to it when they were analyzed by temperature-programmed reduction (TPR). The authors found that HAADF was more suitable because the contours of the Ag particles were better distinguished. We also found this problem (Figure 3a) because the particles of Ag showed a dark silhouette that could be confused with part of the alumina support.
Due to the TPR studies, the presence of AgO and Ag2O is possible, however it was not possible to confirm them by other more advanced techniques. Arve et al. [56] found that both Ag metal and Ag2O phases were present in their catalysts, and did not find AgO and cubic Ag2O. The authors concluded that in small particles, Ag2O is the predominant phase, while metallic Ag is more likely in large particles.

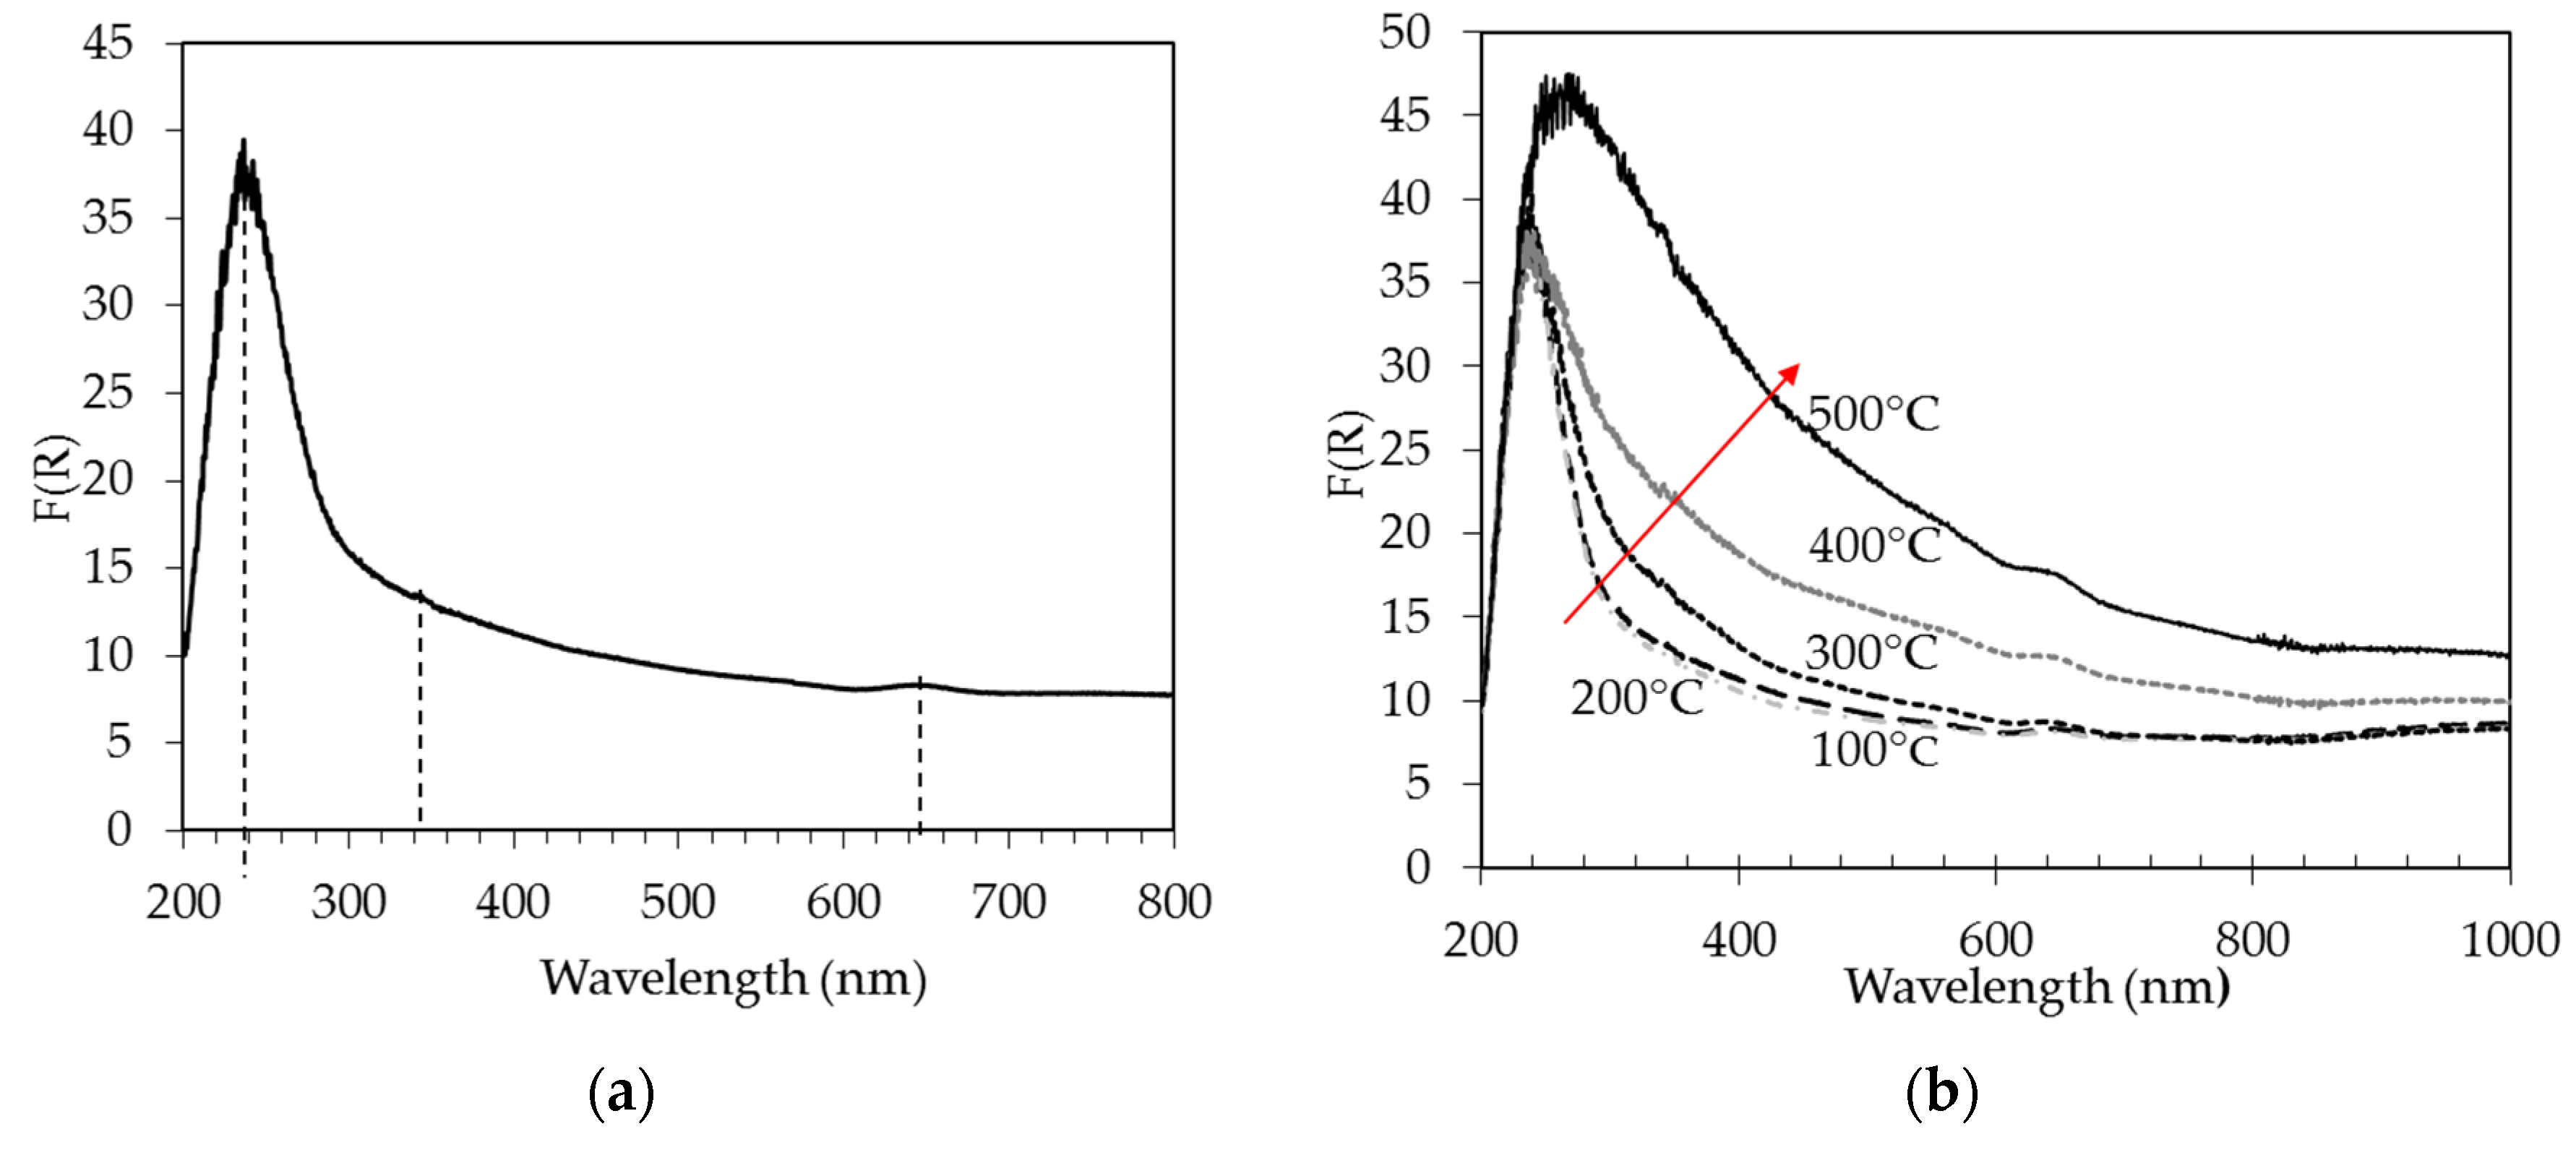
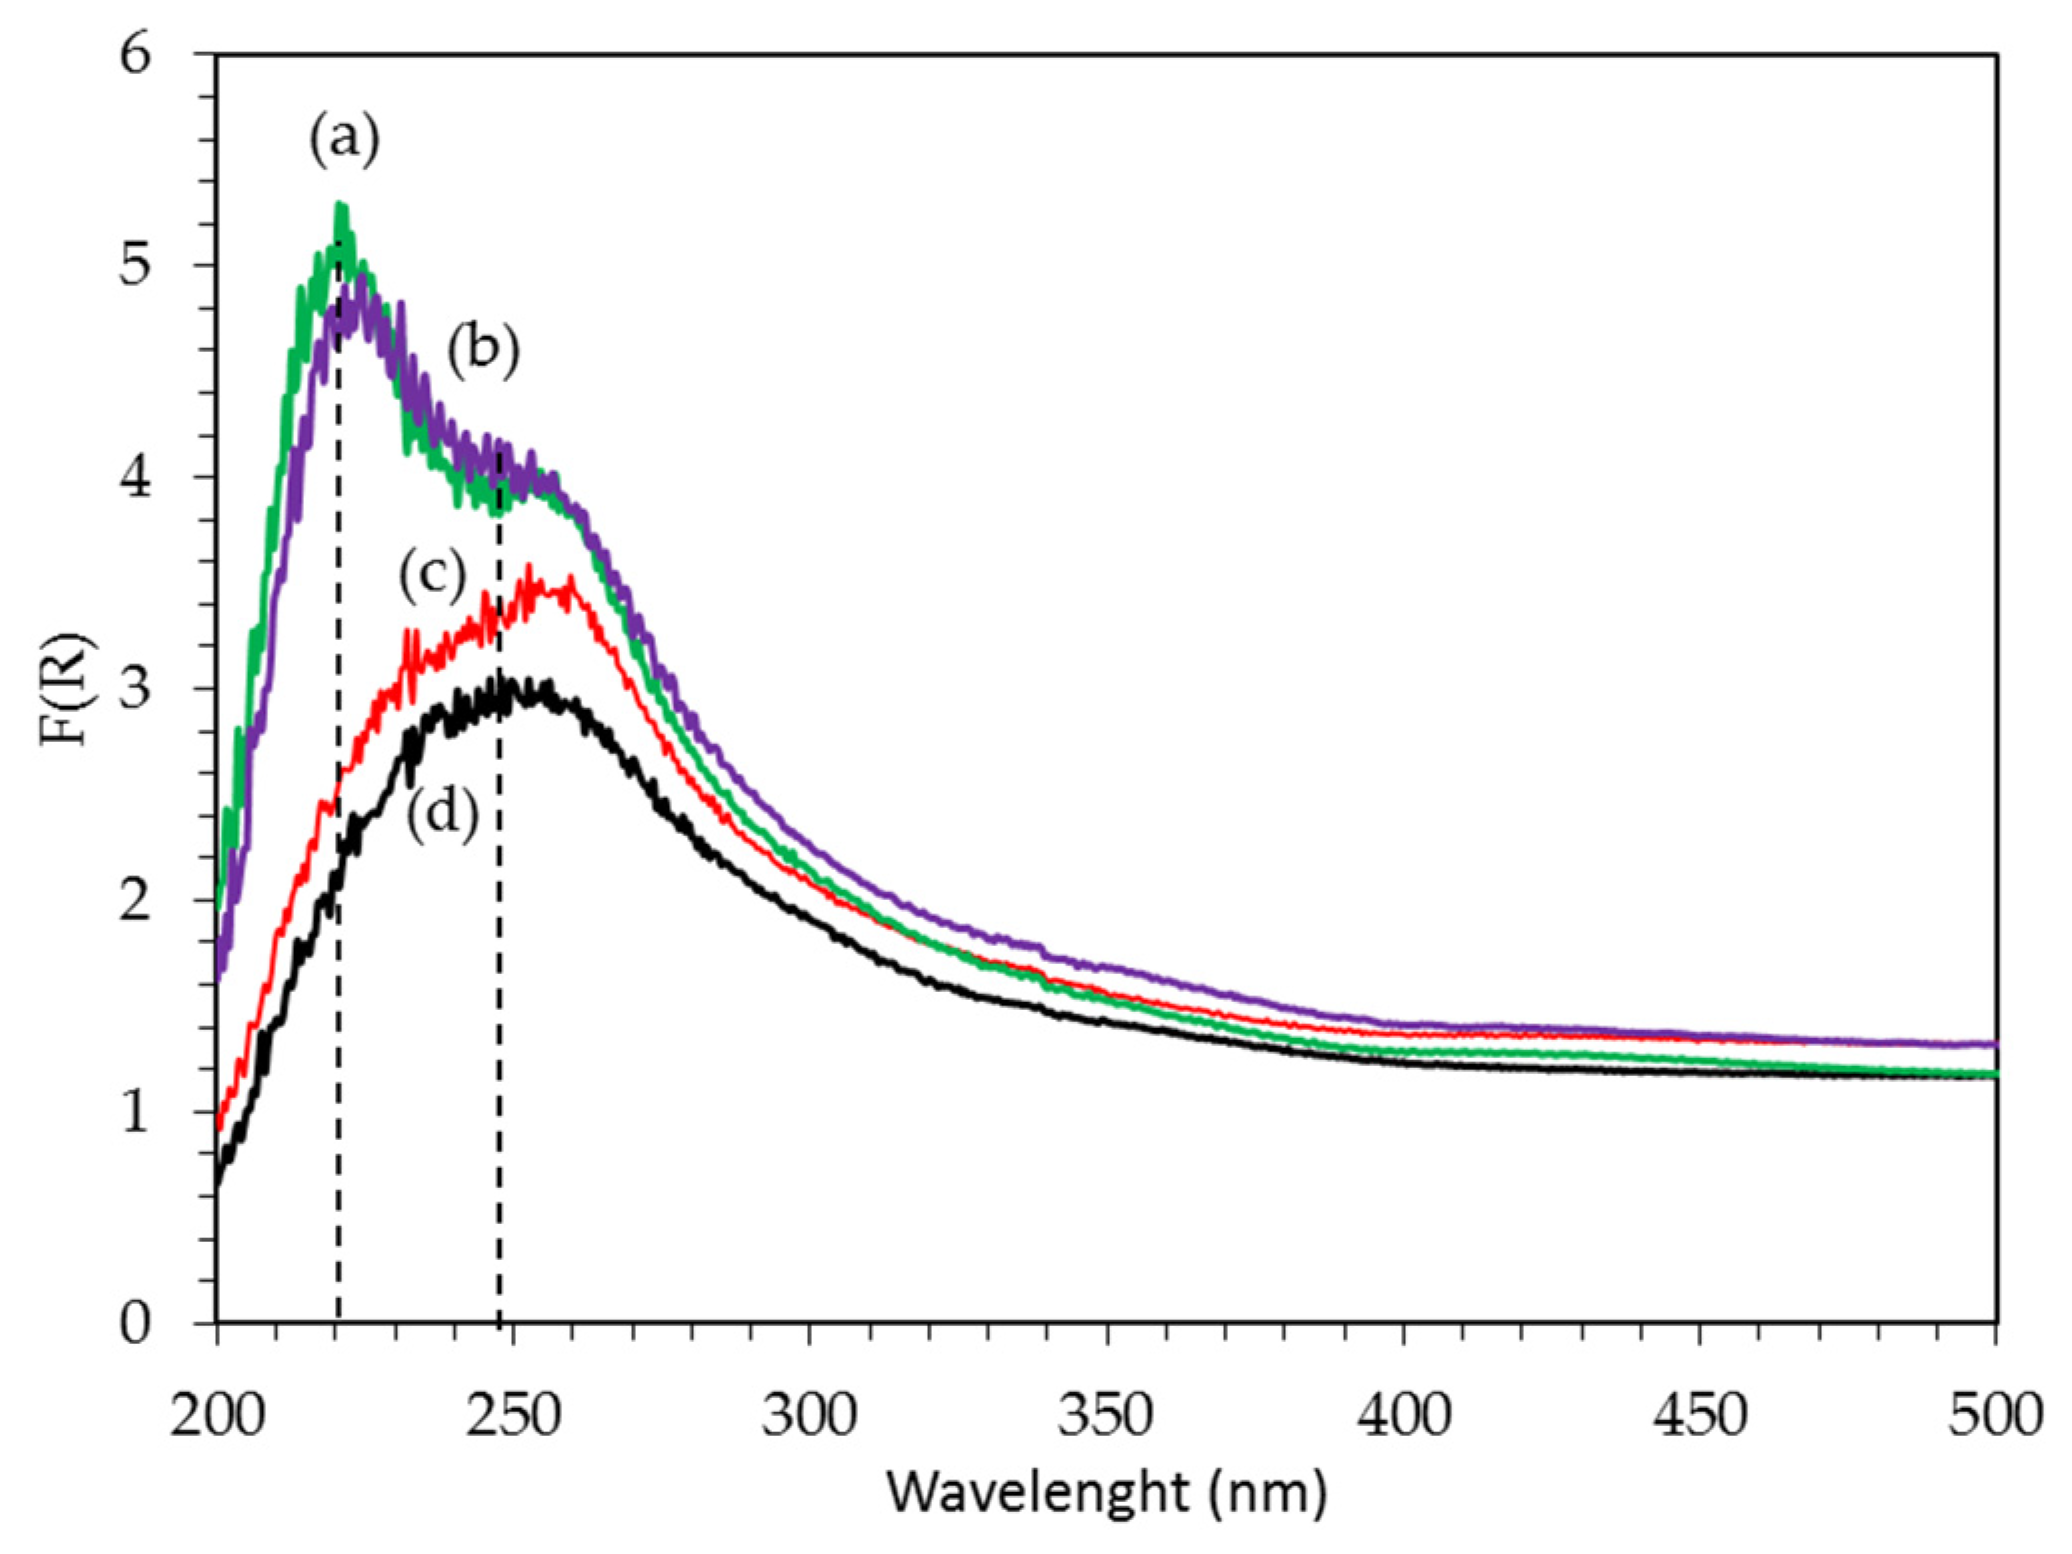
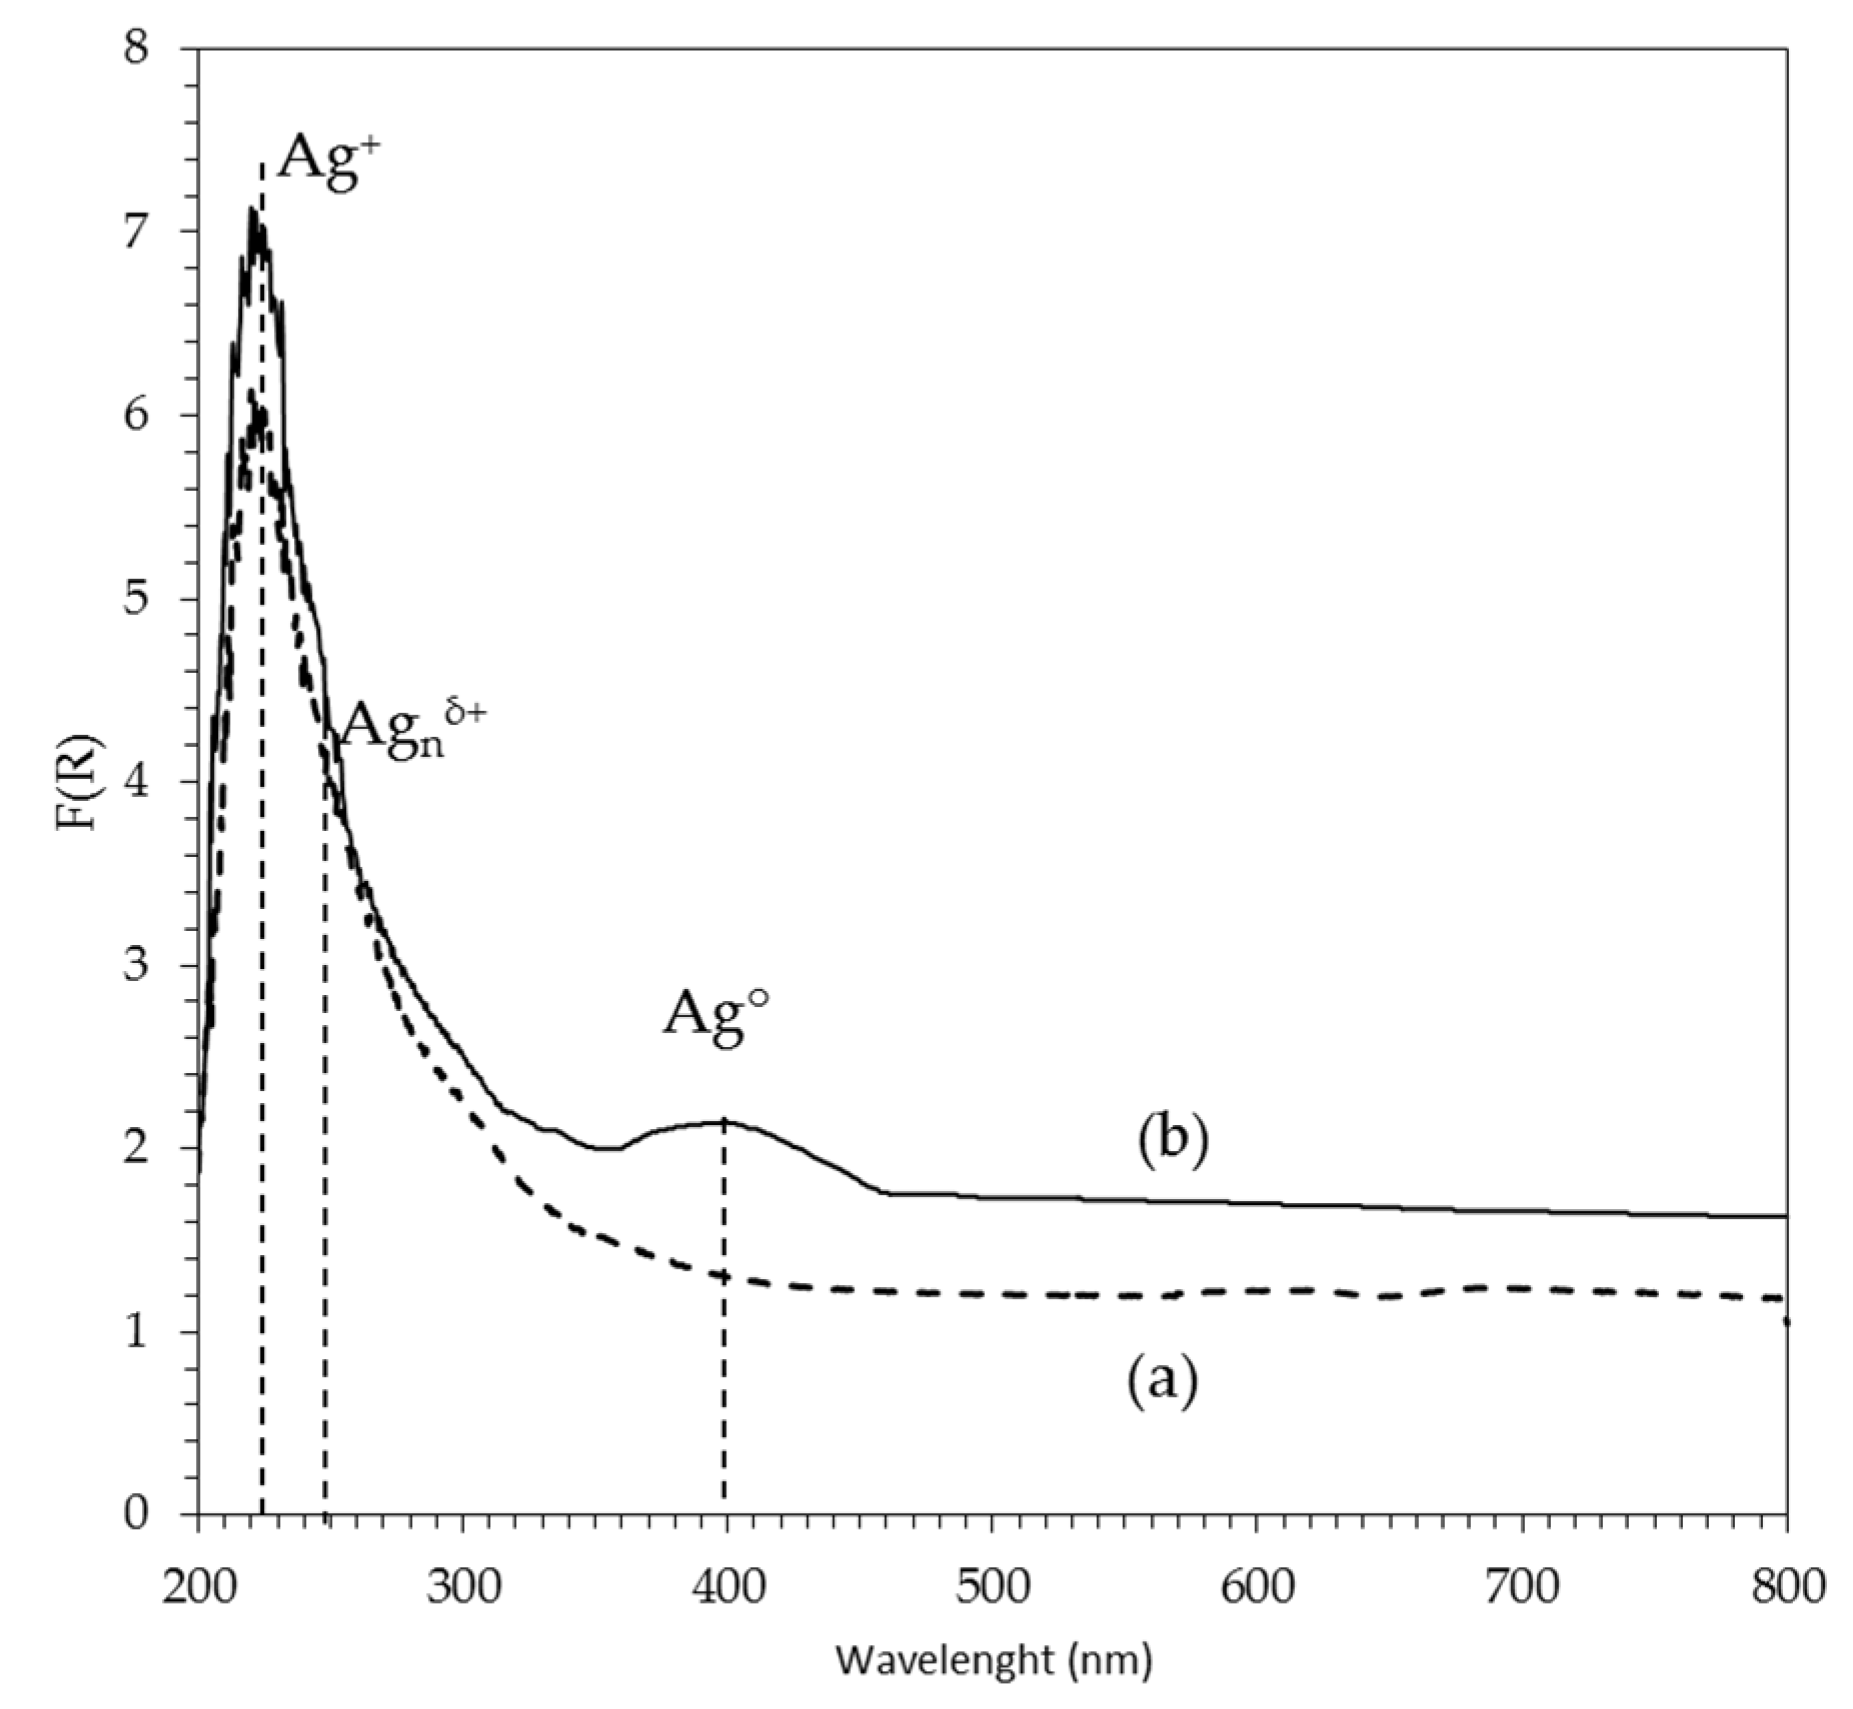
2.1.6. UV–Vis Spectroscopy

2Ag/AW catalyst

The existence of different Ag oxidation states was demonstrated by ex situ UV–Vis analysis when the 2Ag/AW catalyst was calcined at 500 °C (Figure 4a). In this case, ionic Ag (Ag+) species were observed showing absorption peaks in the range between 200 and 230 nm [17,49]. The spectrum of the 2Ag/AW sample with a band at 220–235 nm was attributed to the 4d10 to 4d9 5s1 electronic transitions due to highly dispersed Ag+ ions [16,57]. A similar band was observed for the Ag/Al2O3 and Ag+/H-ZSM-5 catalysts [9,12,30].
The absorption in the range of 240–288 nm is commonly ascribed to silver nanoclusters Agnδ+ (n < 8) with a variety of cluster sizes and different oxidation states. After H2 reduction, an absorption band at 340 and 423 nm (Figure 4b) was assigned to larger silver nanoclusters (n > 8) and metallic Ag nanoparticles [16].

0.4Pt/AW Catalyst

The spectrum of the 0.4Pt/AW catalyst calcined at 500 °C showed a band with a maximum at 215–240 nm (Figure 5a). This band was very close to the band found by Lietz et al. [58] at 217 nm for a Pt catalyst prepared by impregnation with H2PtCl6 in Al2O3. The authors attributed this signal to a charge transfer band due to the presence of a compound of the type [PtCl5OH]2−, which compares well with the literature data for octahedral Pt4+.
We found two bands located at 360 nm and 640 nm (Figure 5a). These bands were close with the bands reported by Lietz et al. [58] for a Pt/Al2O3 catalyst calcined at 500 °C. Their bands were located at 340, 450, and 550 nm, which were associated with the [PtOxCly]s complexes. We did not find the band located at 450 nm.
The UV–Vis spectra of the 0.4Pt/AW catalyst during the “in situ” reduction with H2 (Figure 5b) showed that with increasing reduction temperature, an increase in the values of the function F(R) corresponding to the band at 320 nm were related to the formation of metallic Pt [58]. During this “in situ” reduction with H2 from 100 °C to 500 °C of the 0.4Pt/AW catalyst, an increase in the F(R) function was observed with respect to the F(R) function of the same calcined catalyst shown in Figure 5a, over a whole spectrum wavelength range from 250 to 1000 nm.
This increase in absorbance due to the reduction of Pt oxychlorocomplexes to metallic particles is responsible for the color change to dark gray of the catalysts. This is related to the so-called color centers [59] and to the appearance of a spectroscopic signal of greater intensity that is due to a greater electronic conduction on the surface of the solid that is associated with the formation of Pt crystallites formed during this reduction process.

PtAg/AW Catalysts

For calcined PtAg/AW catalysts, a band at 220 nm corresponding to Ag+ was observed (Figure 6), as previously reported (Figure 4). This band could also represent the Pt band located at a wavelength of 215–240 nm, which can be attributed to [PtCl5OH] 2- related to octahedral Pt+4, as mentioned above. This band was noticeable in the two catalysts with high Pt concentration; 1PtAg/AW and 0.4PtAg/AW (Figure 6a,b), however it did not appear in the two catalysts with low Pt concentration; 0.25PtAg/AW and 0.1PtAg/AW (Figure 6c,d).
The broadband with a maximum at 255 nm could correspond to the signal of the Ag metal clusters, (Agnδ+), as already mentioned [30]. In this band, the spectroscopic contribution of the signal due to Ag appeared to be higher than the small-signal at 360 nm, as shown by the 0.4Pt/AW catalyst (Figure 5).

2.2. Catalytic Activity

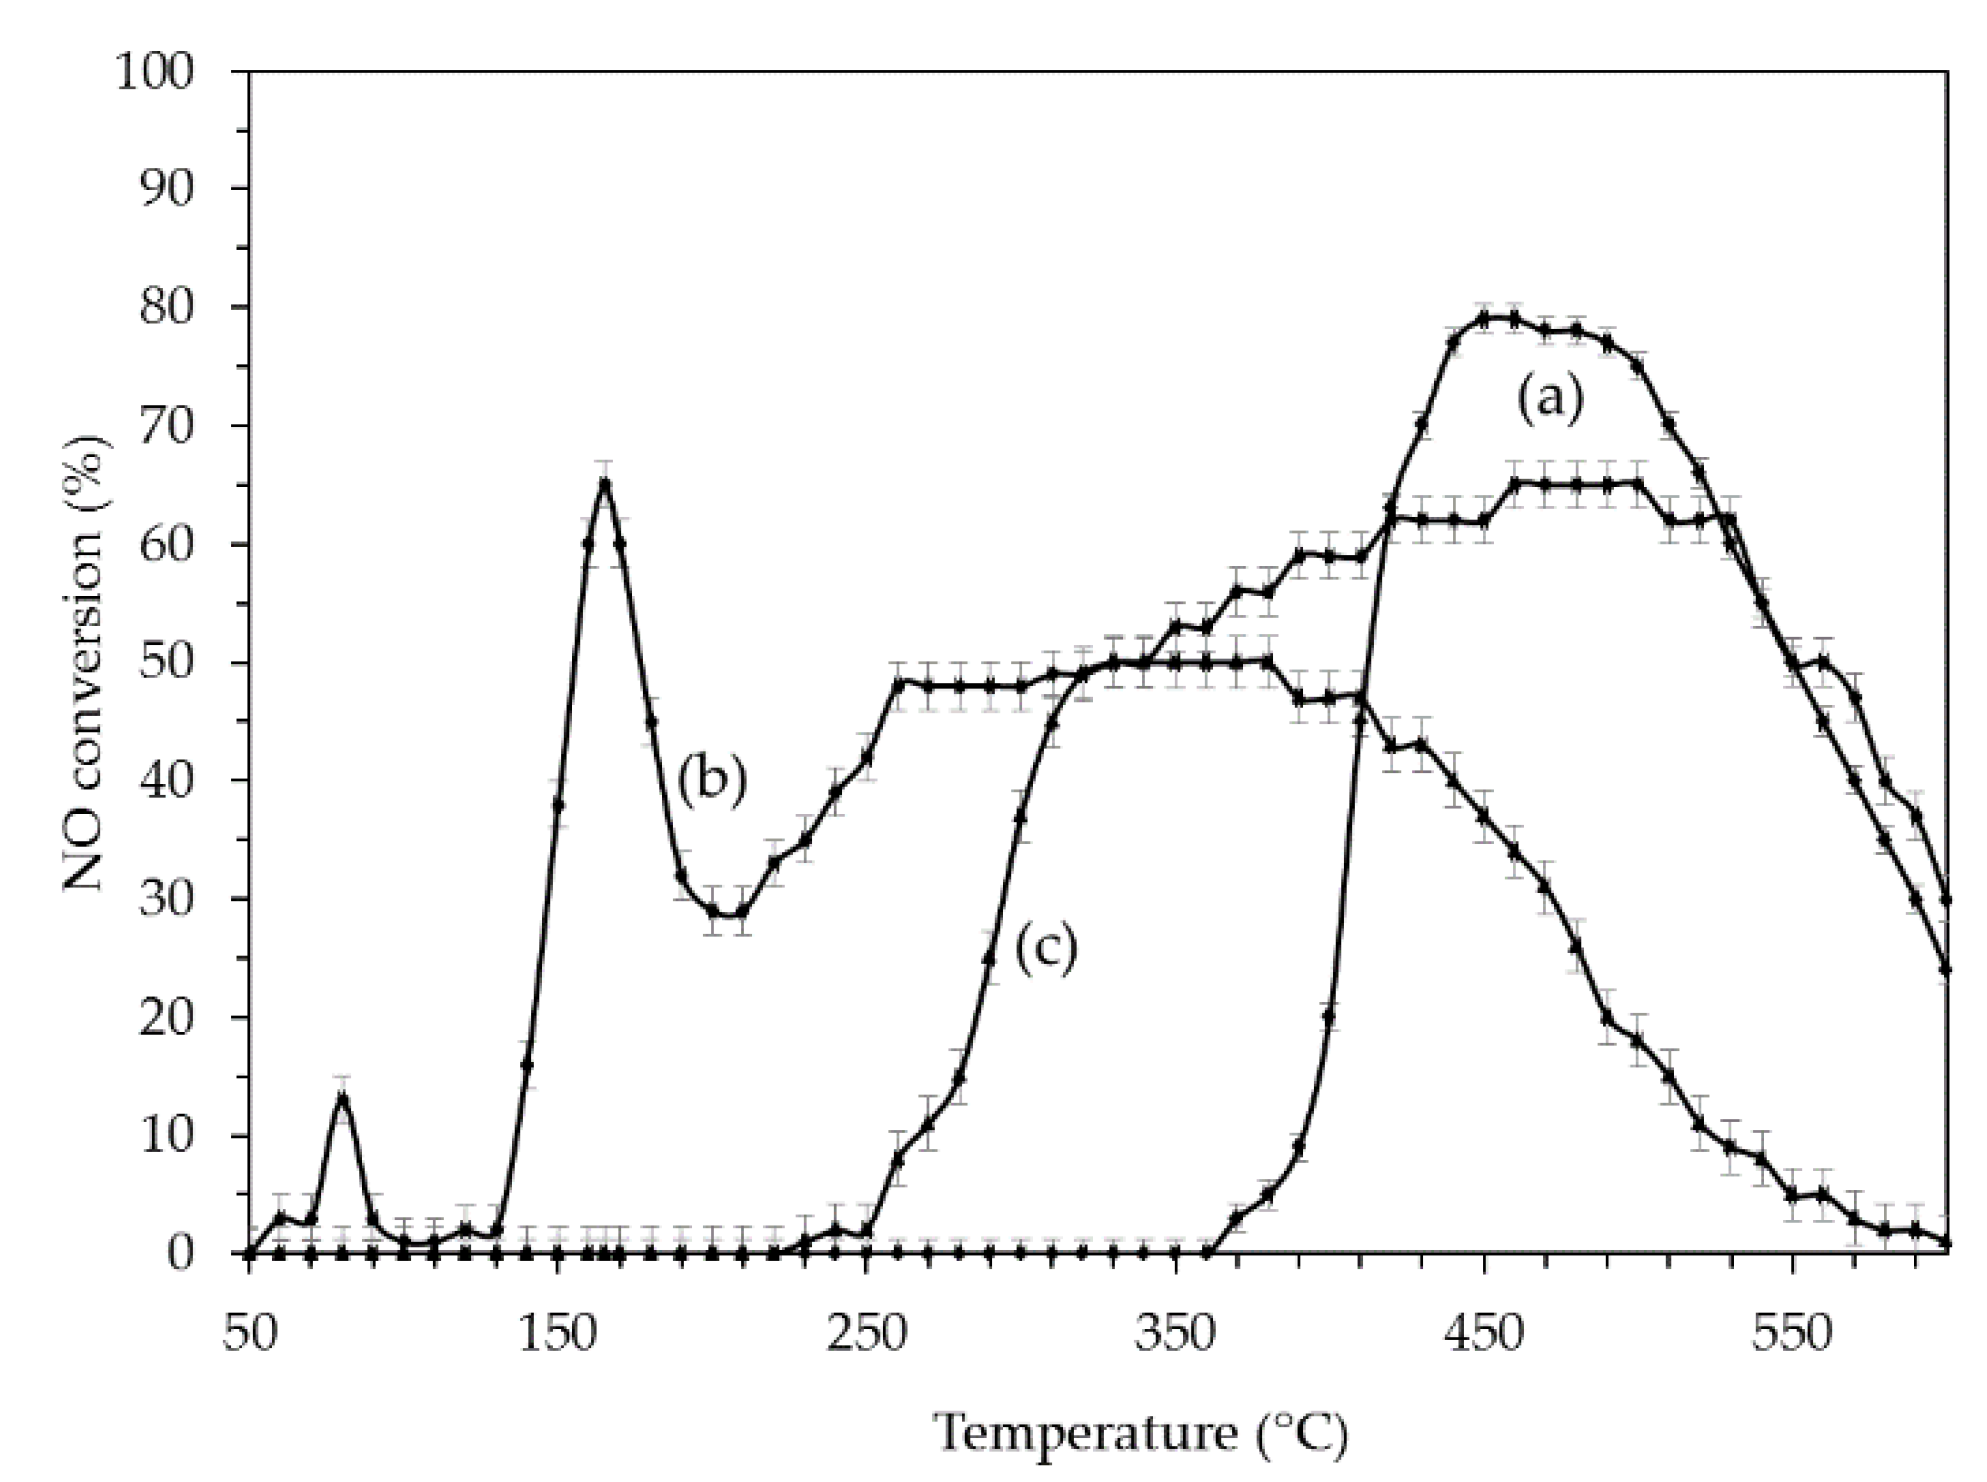
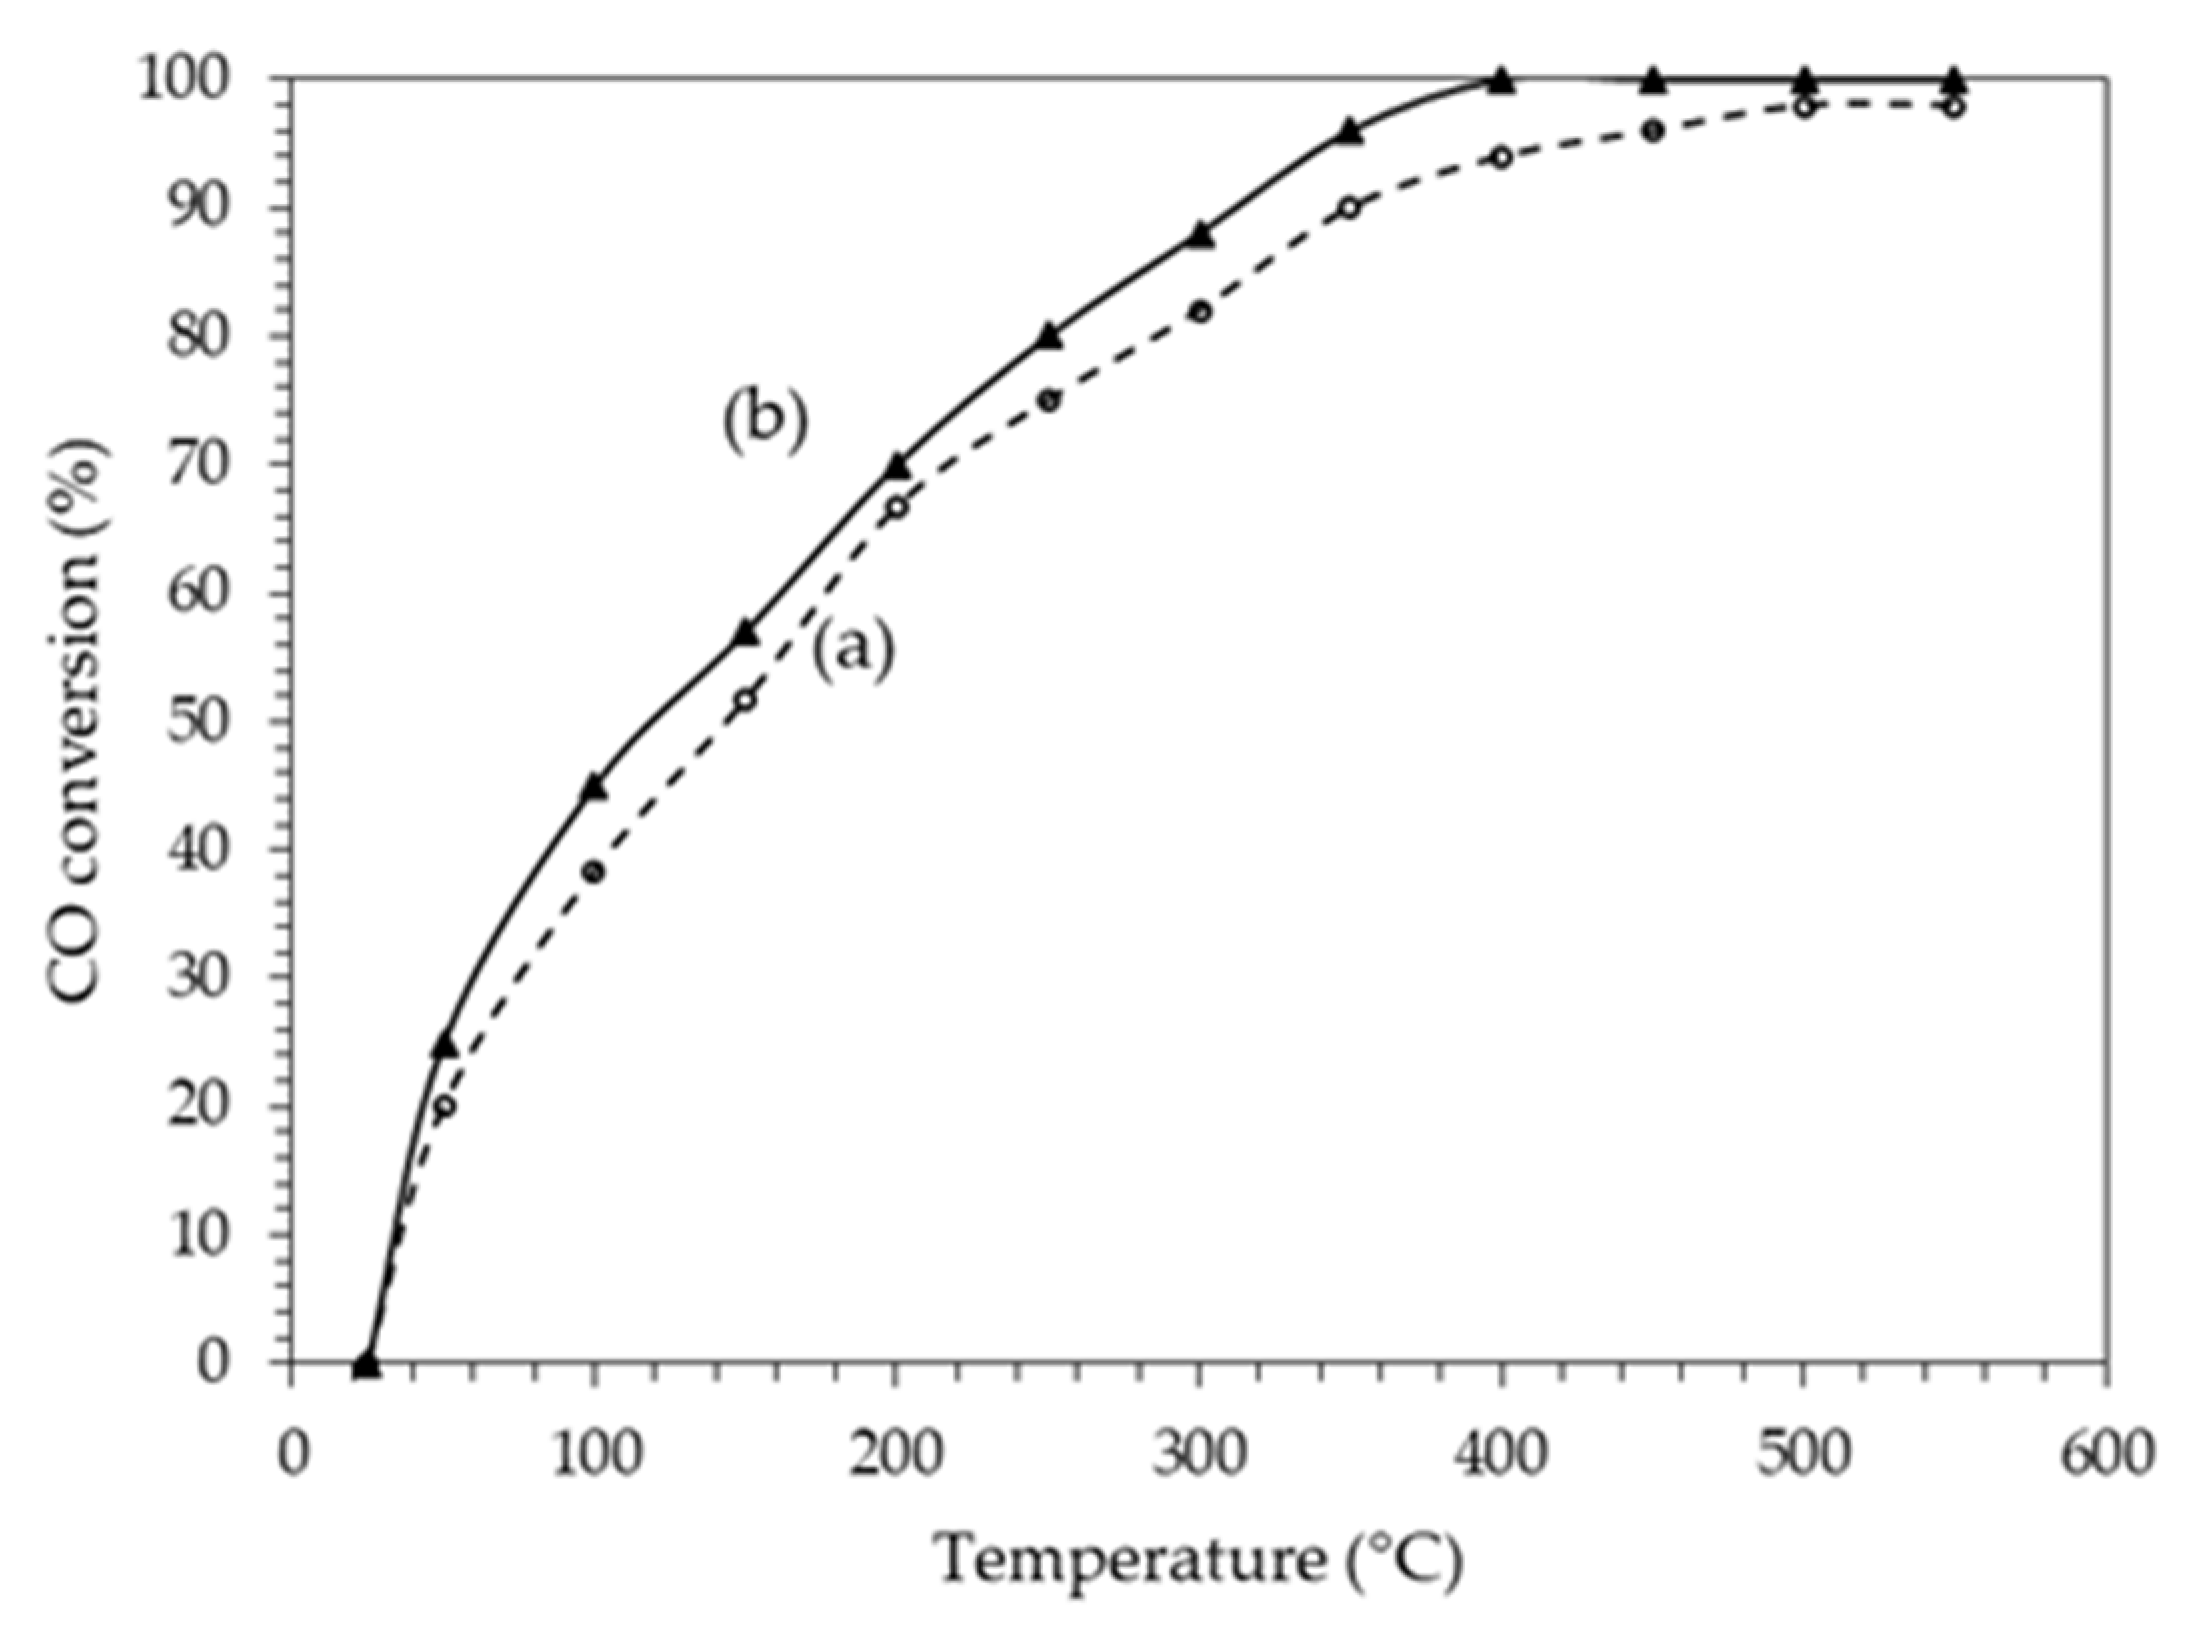
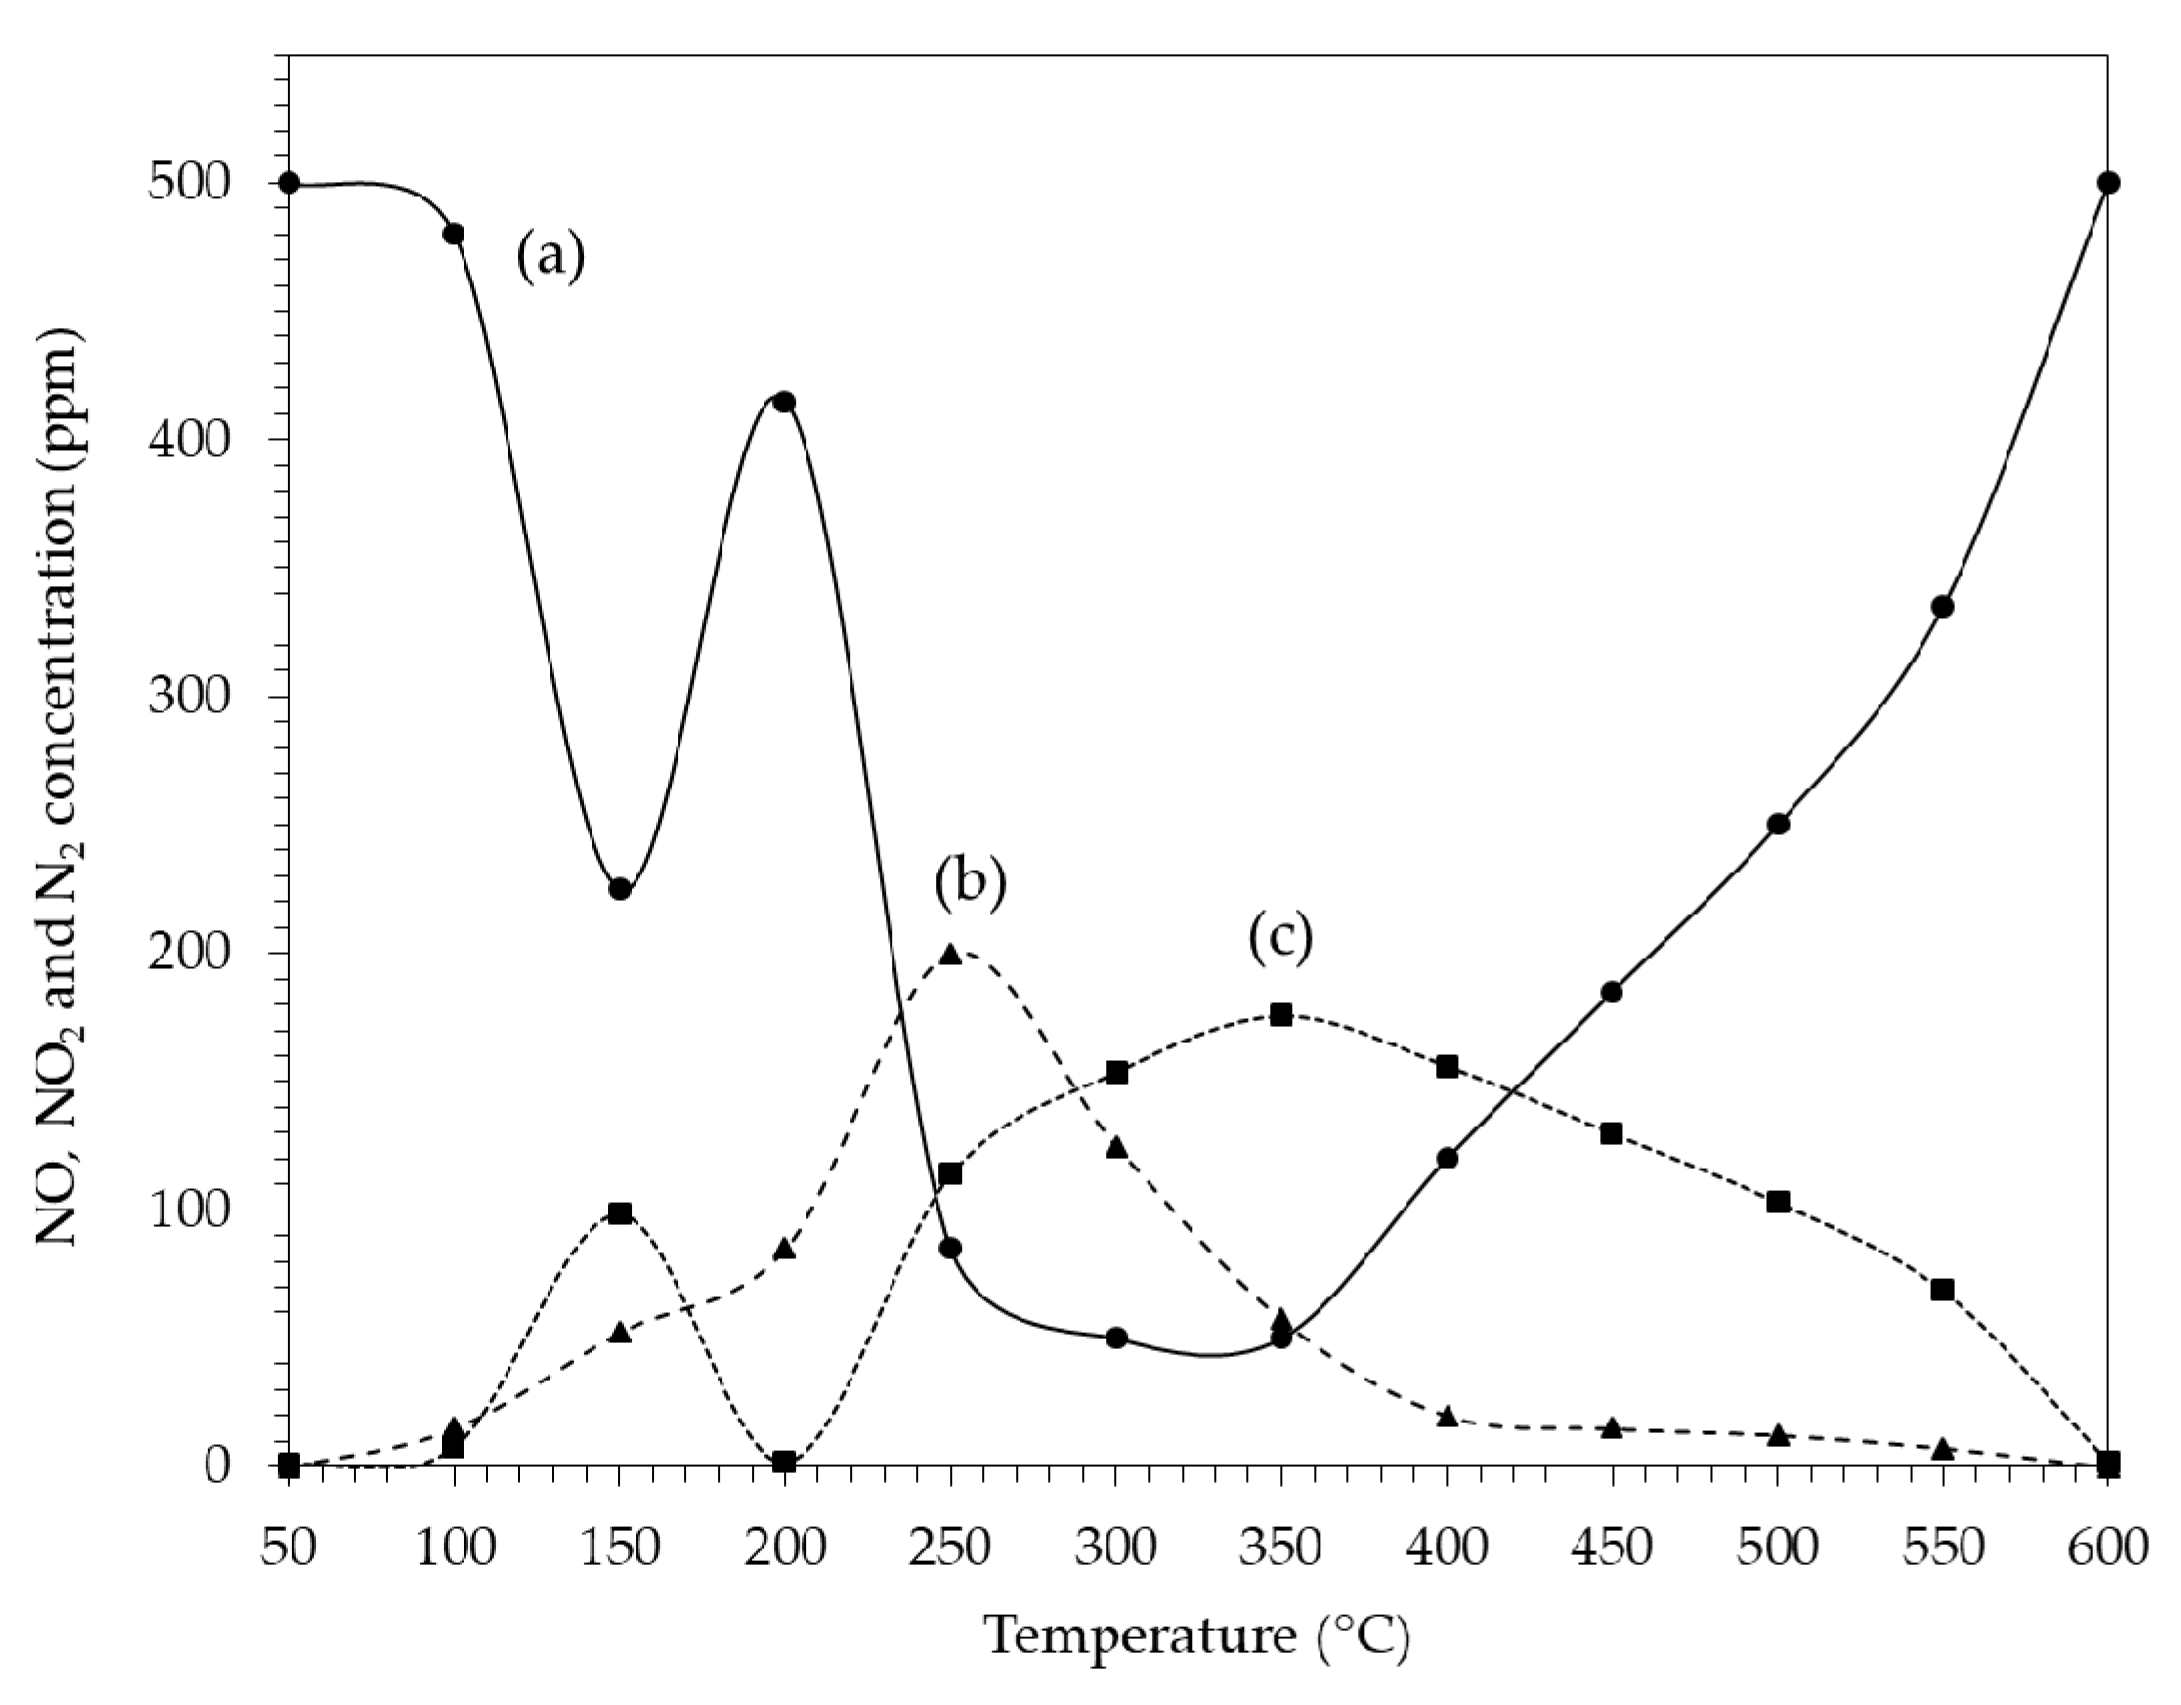
2.2.1. SCR of NO on Pt and Ag Catalysts

In Figure 7a, the conversion of the 2Ag/AW catalyst started at 370 °C and reached 80% at around 450 °C, followed by a sharp decrease. This reaction temperature window has been previously reported [3,20,30] to be narrow and dependent on the Al2O3 preparation method [3].
The impregnation method is better than the sol-gel method when the Ag concentration is 2 wt%; if the Ag concentration increases to 5 or 8 wt%, the lyophilized sol-gel method is better. In other words, the method of preparation and the concentration of Ag could provide better catalysts. However, it has been mentioned that the optimal amount of Ag is defined between 1 to 3 wt% [9,10,11,15,16].
The drawbacks of the Ag/Al2O3 catalyst behavior when using hydrocarbons as a reducing agent are that the operating temperature window to reduce NO is narrow as well as its low activity below 400 °C. These characteristics do not favor the reduction of NOx emitted by the diesel engines since the temperatures of these emissions are low. Fortunately, when small amounts of H2 are added to the emissions using the Ag/Al2O3 catalyst, advantages are obtained both in conversion and in the operating window [26].
We could verify this effect when we added small amounts of H2 to our 2Ag/AW catalyst in the flue gas stream (Figure 7b). It was observed that the temperature window in which the catalyst showed activity widened from 130 °C to 500 °C. Additionally, a range of activity appeared at low temperatures (130–200 °C) with medium conversions. The interval from 200 to 470 °C showed better conversions (63%), in agreement with the literature [25,26,27,28,30,50].
The reaction interval of 130–200 °C has been the subject of debate on the participation of H2 and the nature of the active species capable of favoring the reaction at low temperatures [27,30]. Studies using Diffuse Reflectance Infrared Fourier Transform Spectroscopy (DRIFTS) of NO and temperature-programmed desorption found two groups of surface NOx species: a less thermally stable group of low temperature (LT) species and a more thermally stable group of high-temperature species (HT). The existence of LT species was attributable to the decomposition of the superficial NOx species formed in the active sites where there is elimination by the addition of H2 or thermal decomposition related to higher oxidation of NO and NOx [27].
The 0.4Pt/AW catalyst in the presence of H2 (Figure 7c) showed a maximum conversion close to 50% at a temperature of 300 °C, starting at 250 °C, and this result coincided with that reported by Lanza et al. [42]. These authors investigated Pt and Rh and found high conversions at low temperature (200–250 °C), showing high selectivity to NO2. On the other hand, when they investigated Ag, a higher temperature was required but with high selectivity to N2. In this study, it was found that the presence of H2 triggered the conversion of NO.
In the case of the SCR of NO on the catalyst with the addition of H2 (2Ag/AW + H2), specifically with 660 ppm H2, a decrease in the light-off temperature down to 150 °C was observed (Figure 7b). This remarkable decrease (from 400 to 150 °C) was similar to that reported by Satokawa et al. [60], and we observed two reaction zones. In the low temperature range (100–180 °C), H2 allows the reactants (or reaction intermediates) to be activated, significantly reducing the activation energy (Ea) of the entire global reaction [48].
According to some authors [48], H2 contributes to reducing oxidized silver species such as Ag2O to Ag0 on which the nitrate adducts, as above-mentioned, will be adsorbed. The same authors suggest that nano-sized Ag2O clusters can be reversibly reduced and reoxidized in the presence of H2. These authors also found that the presence of H2O did not change the Ea. They also found that more adducts or nitrate species were found adsorbed in the presence of H2, and attributed this to a dissociative activation of O2 in the gas phase on the Ag0 particles.
Based on the studies by Azis et al. [27] using DRIFTS and TPD, it appears that there is a formation of stable superficial NOx species that are related to the promoter effect of H2 on the Ag/Al2O3 catalyst.

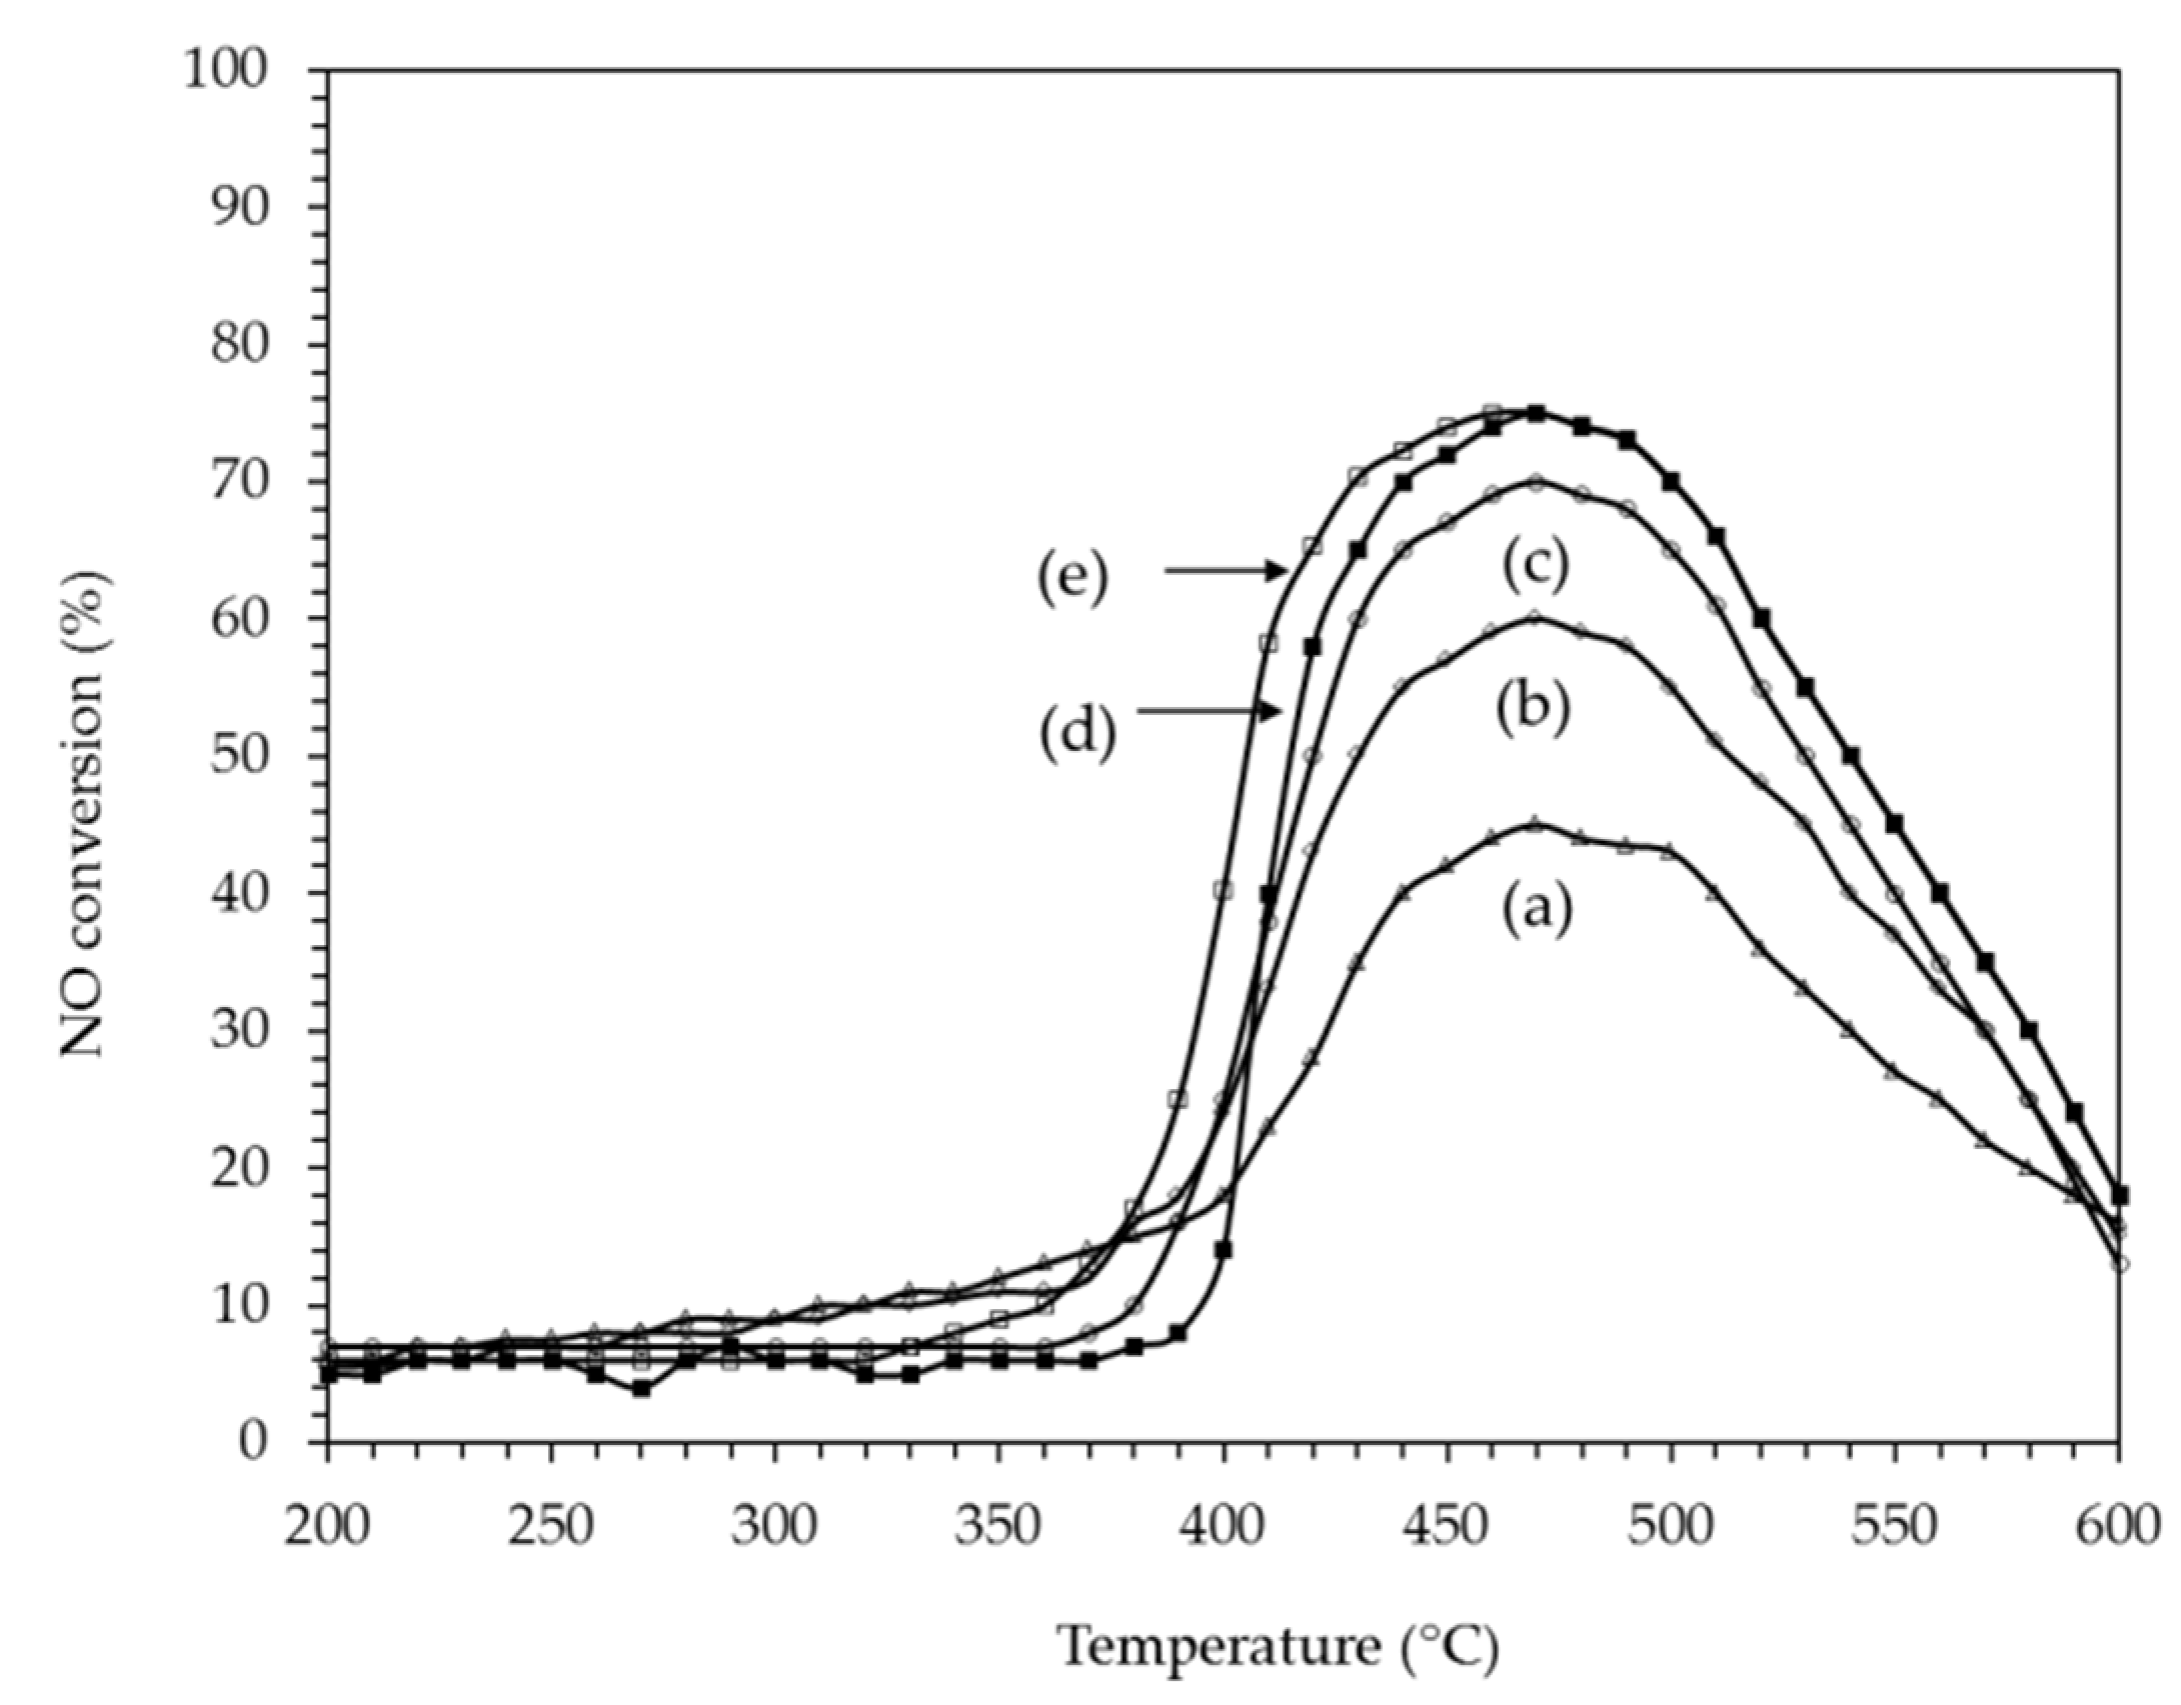
2.2.2. SCR of NO with C3H8 on PtAg Catalysts

The SCR of NO with C3H8 on the catalyst 2Ag/AW (Figure 8d) in the absence of H2 showed a volcano-like profile that has already been reported [2], where the starting temperature (light-off) was 400 °C with a maximum at 470 °C. The possible presence of monodentate nitrate species at high temperatures is feasible [27]. In contrast, the other bidentate and bridged species that are less stable thermally may not be present.
In general, the addition of Pt to the Ag/AW catalyst did not contribute significantly to the NO conversion at temperatures below 360 °C. In the case of the 1PtAg/AW catalyst (Figure 8a), it only showed a 9% conversion at less than 300 °C. Despite the high Pt content, the NO conversion at 470 °C was the lowest (45%). This behavior indicates that the bimetallic PtAg particles at a Pt/Ag atomic ratio of 0.27 do not provide the best active sites for NO reduction reactions. On the other hand, the Pt dispersion for this catalyst (21%) was the lowest (Table 1). The dilution effect of Pt by Ag seemed evident.
As the Pt concentration decreased in the 0.4PtAg/AW catalyst (Figure 8b) and 0.25PtAg/AW catalyst (Figure 8c), the NO conversion increased to 470 °C, approaching the catalyst conversion of Ag without Pt (Figure 8d). Only when the Pt concentration was less than the 0.1PtAg/AW catalyst (Figure 8e) for a Pt/Ag atomic ratio of 0.027 was the NO conversion slightly higher (75.3%) at 470 °C.
This behavior was similar to that found by Wang et al. [61] for the Pd–Ag bimetallic system. The authors found a 0.01 wt%Pd-5 wt%Ag/Al2O3 catalyst with higher activity than the 5 wt%Ag/Al2O3 catalyst. The authors attributed this increase in NO conversion to the presence of enolic species of the type [H2C = CH – O – M], which comes from the partial oxidation of C3H6 and are highly reactive with NOx adsorbed forming –NCO and –CN. The authors proposed a new reaction mechanism different to that proposed by Burch et al. [2], which helps us explain our results.
It was observed in our catalysts that the 1PtAg/AW catalyst with a high Pt content did not show a high conversion of NO, nor a high dispersion of Pt (Table 1), which suggests that a large part of the total Pt was diluted or covered by Ag atoms, despite showing high H2 consumption values by TPR in Figure 2. It is probable that the addition of Pt (and Pd) to the Ag particles can produce changes of an electronic and superficial type that favor the formation of enolic structures, as demonstrated by Wang et al. [61].

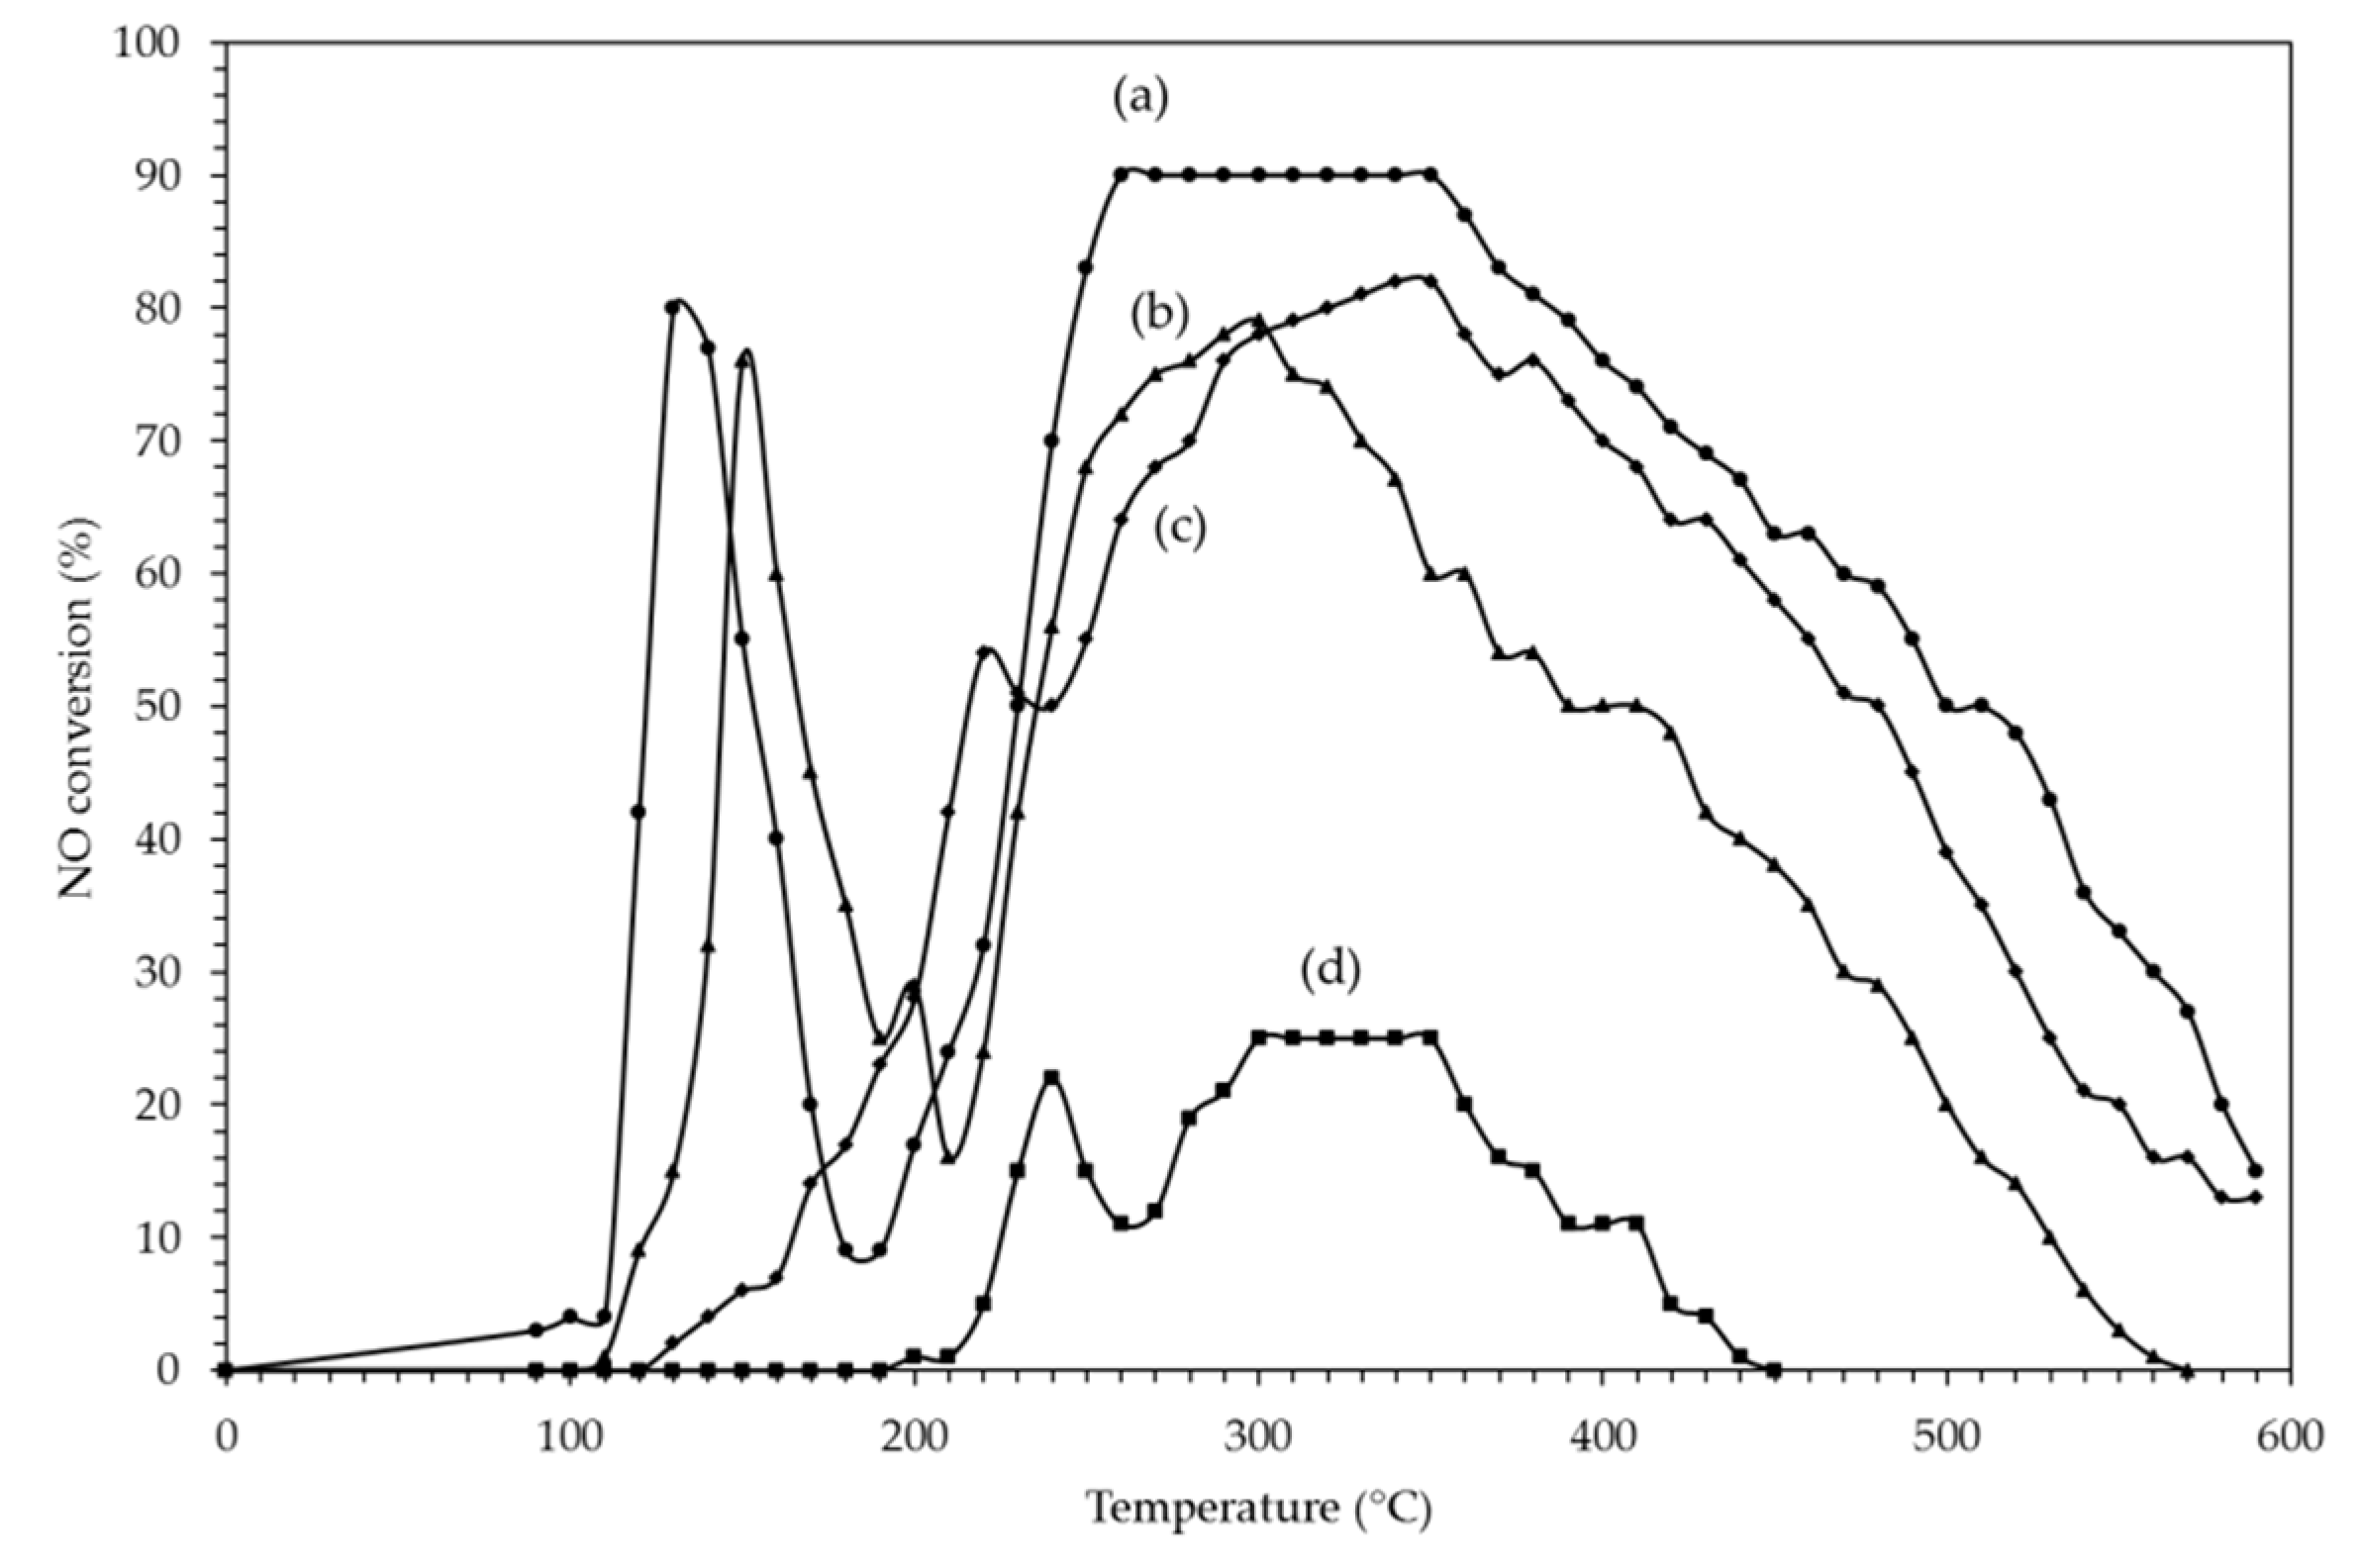
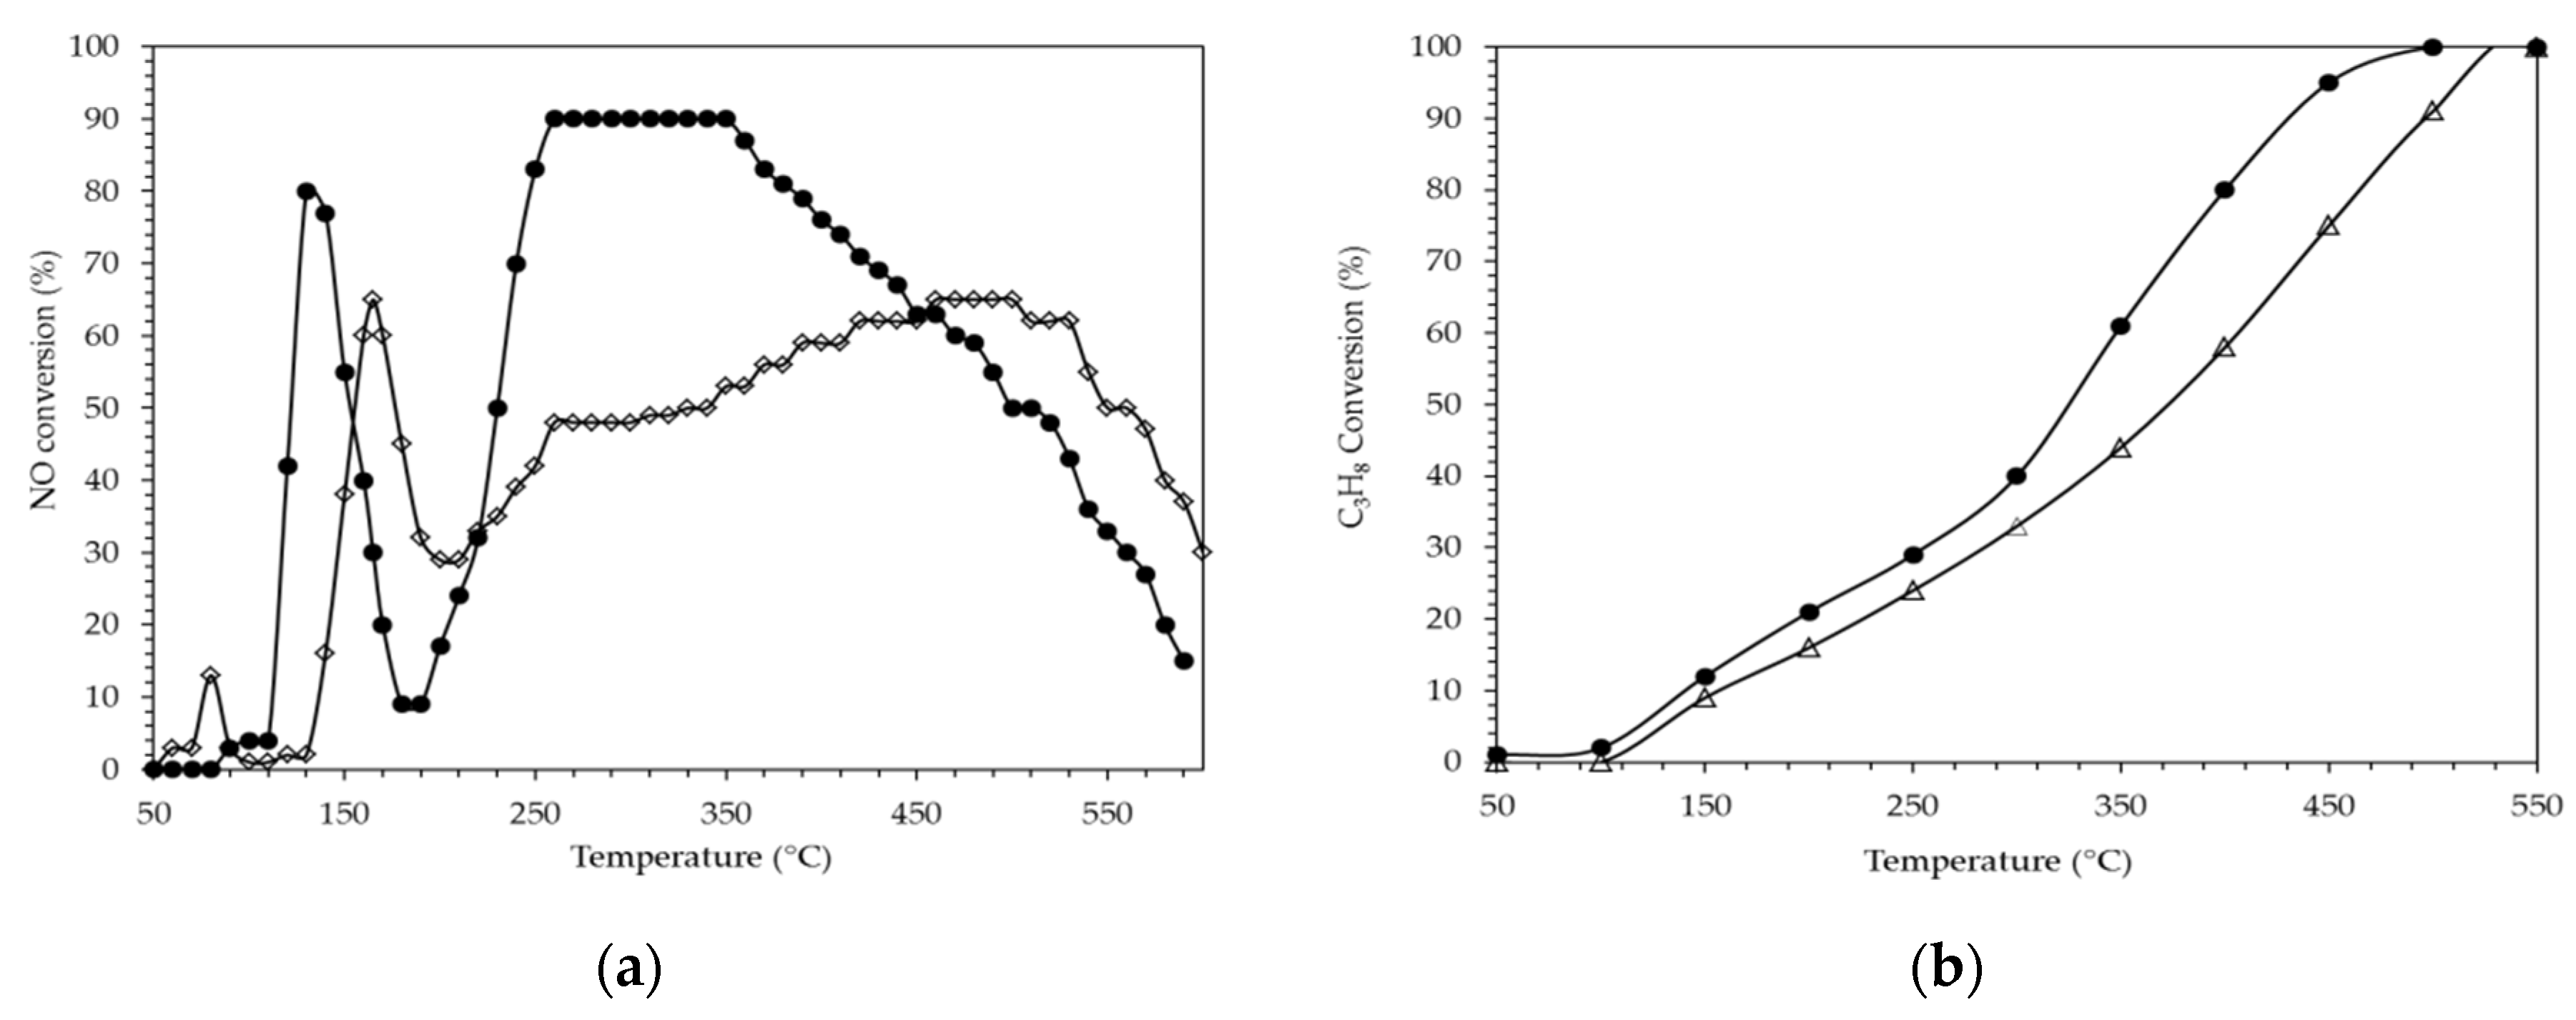
2.2.3. H2 Assisted SCR of NO on PtAg Catalysts

The conversion values of NO versus the reaction temperature in the bimetallic PtAg catalysts were dependent on the Pt concentration (Figure 9). The 0.1PtAg/AW catalyst (Figure 9a) with the lowest concentration of Pt showed two high conversion regions (110–180 °C and 180–500 °C), having a maximum conversion of 80% (at 120 °C) and 90% (at 250 °C). The conversion-temperature profile was similar to that shown by the 2Ag/AW catalyst in the presence of H2 (Figure 7b).
The addition of Pt to the 2Ag/AW catalyst showed better conversions and a full temperature window and was also more active at low temperatures (between 100 to 180 °C). These advantages have also been reported in the literature by Gunnarsson et al. [37]. These authors used lower Pt concentrations and reported as optimal a catalyst with 2 wt%Ag plus 500 ppm Pt, which showed the highest activity at low temperature.
The authors attributed this behavior to an ability to adsorb hydrocarbons and partially oxidize them on the surface of bimetallic Pt-Ag particles. The presence of Pt could produce a lower barrier for dissociative hydrocarbon adsorption as well as a change in oxidation potential, which in turn, could be attributed to the Pt doping.
The NO conversions of the catalyst 0.25PtAg/AW (Figure 9b) were 78% (at 150 °C) and 78% (at 300 °C), while when we increased the Pt load in the 0.4PtAg/AW catalyst (Figure 9c), there was perhaps a drop in the NO conversion to 54% (at 220 °C) and 80% (at 330 °C). Finally, when we increased the Pt concentration to 1% with the 1PtAg/AW catalyst (Figure 9d), we observed a low conversion of 22% (at 240 °C) and 25% (at 300 °C).
Additionally, in the low temperature region (100–180 °C), the catalyst with 0.1PtAg/AW showed a maximum conversion of 82% versus the 64% conversion of the 2Ag/AW catalyst (a difference of 18%) (Figure 10a). In the high temperature region (250 to 360 °C), the Pt catalyst showed a maximum conversion of 90% compared to a maximum conversion of 65% without Pt. With these results, it was demonstrated that the addition of Pt in low concentrations improved the activity of the 2Ag/AW catalyst.
During the combustion of C3H8 in the presence of Ag or (AgPt), we observed the effect of Pt in the presence of Ag clusters (Figure 10b). The C3H8 conversion for the 0.1PtAg/AW catalyst was found to be higher than the conversion of the catalyst containing only Ag (2Ag/AW). This experimental fact was also reported by Gunnarsson et al. [37]. The presence of Pt in the Ag/Al2O3 catalyst modified the C3H8 conversion, (Figure 10b) presenting two regions, with a turning point of the C3H8 conversion at 300 °C, which was related to the NOx reduction activity where two conversion regions were also observed.
The main factor that allows for the increase in NOx reduction at low temperatures is related to the increase in C3H8 chemisorption due to the presence of small amounts of Pt on the Ag particles and its corresponding oxidation from NO to NO2.
That is, the Pt–Ag catalyst appears to be able to convert more of the C3H8 species available on its surface. This phenomenon could be related to a modification of the metallic Ag particles, in terms of both the surface structure and the bulk of their crystal lattice.
Thus, for example, Bordley and El Sayed, [62] prepared Pt–Ag catalysts for electrochemical reactions where the formation of Pt–Ag nano-boxes was reported. They found that the bimetallic particles showed an expanded atomic mesh compared to the Pt atomic mesh. This resulted in the Pt–Ag particles with the least amount of Pt showing improved catalytic activity in the O2 reduction reaction due to a higher binding energy of Pt, which in turn favored an advantageous change in the decrease in the adsorption energy of the intermediates containing oxygen on the surface of these alloyed particles.
According to Gunnarsson et al. [37] the addition of Pt to its Ag/Al2O3 catalysts produced a greater adsorption of hydrocarbon and with this, an increase in the reduction of NOx at low temperatures. The initial step in the activation of hydrocarbons (such as C3H8) is known to be the chemisorption and dissociation of a hydrogen atom on the surface of Pt [57].
The dissociation energy of different molecules (or hydrocarbons) present on the surfaces of Ag and Pt is always lower for Pt [49].
During the reaction experiments, the conversion of CO increased from low temperatures to about 375 °C (Figure 11). It was observed that the 0.1PtAg/AW catalyst showed slightly higher conversion than the 2Ag/AW catalyst. These results are similar to those obtained by Shang et al. [36] in terms of CO conversion versus temperature. The authors showed a steep 95% conversion at 200 °C for a 5% Ag/Al2O3 catalyst. The combustion of both the CO fed to the reactor, and the CO from the combustion of C3H8 in our case, was carried out in the temperature range from 150 °C to less than 400 °C. Additionally, our results of CO coincided with the study by Gunnarsson et al. [37], in which they found a very low concentration of CO (<5 ppm) at temperatures of 350 °C at the outlet of their reactor for their PtAg/Al2O3 catalyst.
The emissions of the nitrogen compounds as a function of the reaction temperature for the 0.1PtAg/AW catalyst are shown in Figure 12. It can be observed that NO2 formed in the interval between 150 to 400 °C (with a volcano-like profile), as has been reported by other authors in the case of Ag/Al2O3 catalysts [3,30,50] or also PtAg/Al2O3 [37]. In the latter case, the authors reported the presence of NO2 between 250 to 350 °C.
Between 200 and 350 °C, the NO2 that did not react for the formation of nitrates was being desorbed, as has been reported in the literature [26]. The oxidation of NO with O2 to NO2 is lower than the overall conversion that occurs in the presence of hydrocarbon and NO to N2 [62].
Based on the mass balance of nitrogen compounds at the inlet and outlet of the micro reactor, and Equation (1) proposed by Richter et al. [48], the concentration of N2 at the outlet of the reactor (Figure 12) can be calculated as follows:
[N2] = ½ [[NO]o − [NO] − [NO2] − 2[N2O]]
where [N2] is the calculated concentration of N2 (mol/L); [NO]o is the initial concentration of NO (mol/L); [NO] is the present concentration of NO (mol/L); [NO2] is the present concentration of NO2 (mol/L); and [N2O] is the present concentration of N2O (mol/L).
The decrease in NO2 at 250 °C is related to the partial oxidation of C3H8, as can be seen in Figure 10b. The formation of N2 showed a maximum at 350 °C and then decreased as a result of the parallel and series reactions that were being carried out.
These bimetallic catalysts produced N2O at several temperatures. The results of the formation of N2O in our study are shown in Table 2, and expressed in YN2O yield, which is defined as YN2O = 2×[N2O]/[NO]o × 100. These yields (YN2O) are reported for two temperatures: 200 °C and 400 °C.
The results at 200 °C showed that the 2Ag/AW catalyst produced a 7% yield to N2O while the 0.1PtAg/AW catalyst showed a 8.5% yield at the same temperature. For the 0.25Pt/AW catalyst, the N2O yield was 9%, which was very similar to that observed for the 0.1PtAg/AW catalyst. In the case of 0.4PtAg/AW and 1PtAg/AW catalysts, the yields were 12.5 and 14%, respectively.
We observed that the formation of N2O was greater at 200 °C than at 400 °C, as has been found by Shaieb et al. [25]. It was also observed that the formation of the Pt–Ag bimetallic was so strong, probably in the form of the Pt–Ag alloy [54], that Ag decreased the selectivity of Pt to produce N2O, as observed by Gunnarsson et al. [37] when studying catalysts of 2%Ag–0.05%Pt/Al2O3 in this reaction.
In the case of the 2%Ag/Al2O3 catalyst (without Pt), other authors such as Meunier et al. [14] reported an 8% yield of N2O at 450 °C; Richter et al. [48] reported a 2.25% N2O yield at 267 °C; and Shaieb et al. [25] reported a 6% N2O at 200 °C. Hernandez and Fuentes [30] reported 1% N2O, Kannisto et al. [3] reported 1.6% at 250 °C, and finally Iglesias-Juez et al. [18] reported 12.5%.

2.2.4. Effect of H2O on H2–C3H8–SCR of NO

The effect of water in this reaction was studied with the catalyst 2 wt%Ag/γ-Al2O3 [50] by adding 6%vol. H2O. It was found that the addition of H2O decreased the NO conversion (9% on average) at 150 °C compared to the NO conversion without H2O, but increased it (8.4% on average) in the temperature range of 200 to 360 °C. The opposite happened with the C3H8 conversion. In this case, the addition of H2O improved the conversion (6% on average) compared with the C3H8 conversion without H2O in the range of 250 to 450 °C.
The presence of water vapor could decrease the concentration of carbonaceous deposits that block adsorption sites on the catalyst surface [2], which could largely explain the increase in C3H8 conversion. The authors studied the SCR of NO with 10 vol.%H2O on an In2O3/Ga2O3/Al2O3 catalyst. The authors mentioned that the presence of water vapor partially inhibited the non-selective combustion of C3H8 with O2. As a result, more hydrocarbons could be available for the SCR reaction resulting in increased activity and selectivity for this reaction.
This behavior has already been reported when small hydrocarbons such as C3H8 react. It has been mentioned that one possible reason is the lower enthalpy of adsorption of the short alkanes compared to the large chain alkanes.

3. Materials and Methods

3.1. Preparation of Catalysts

The synthesis of Al2O3 (A) was carried out by the precipitation of a 0.44 mg/mL solution of Al(NO3)3·9H2O (Fermont, Mexico) to which a solution of NH4OH at 30 vol.% was added dropwise (JT Baker, USA) under stirring, until a boehmite suspension with a pH of 9–10 was obtained, which was left to stand for 12 h. The solid was filtered, dried at 110 °C for 24 h, and then calcined at 500 °C for 6 h.
The catalyst containing 0.4 wt%Pt/Al2O3 (0.4Pt/A) was prepared by the incipient wetness impregnation method using 52.8 mL of an H2PtCl6 solution (Aldrich, USA) with a concentration of 0.38 mgPt/mL on 5 g of Al2O3. The impregnation started with a pH of 2.5 at 60 °C for 2 h, then dried at 110 °C for 12 h, and finally calcined at 500 °C for 6 h.
The synthesis of the Al2O3 support promoted with WOx(AW) was carried out with the same procedure as the Al2O3 (A) synthesis by adding the required amount of (NH4)12W12O40·5H2O (Aldrich, USA) to obtain a nominal content of 0.5 wt%W during precipitation.
The 0.4 wt%Pt/Al2O3–WOx (0.4Pt/AW) catalyst was prepared using the same H2PtCl6 incipient wetness impregnation method used in the 0.4Pt/Al2O3 catalyst.
The 2 wt%Ag/Al2O3–WOx (2Ag/AW) catalyst was also obtained by impregnation by the incipient wetness method using 25 mL of a AgNO3 solution (Aldrich, USA) containing 4 mgAg/mL on 5 g of Al2O3–WOx (AW) at 60 °C for 2 h. The solid was dried at 110 °C for 12 h and finally calcined in air at 500 °C for 6 h.
The Pt–Ag/Al2O3–WOx (PtAg/AW) bimetallic catalysts were prepared with the same incipient wetness impregnation method used for the preparation of 0.4Pt/AW and 2Ag/AW monometallic catalysts; however, they were impregnated sequentially, starting with the impregnation of Pt and then the Ag to achieve strong contact between the two metals [53]. During the impregnation, 13.15, 32.89, 52.8, and 131.56 mL of H2PtCl6 solution in 5 g of Al2O3-WOx (pH = 2.5) were used to obtain solids with a Pt content of 0.1, 0.25, 0.4, and 1 wt% Pt, respectively. The solids were dried at 110 °C for 12 h and calcined at 500 °C for 6 h. Subsequently, 5 g of the calcined solids were impregnated with 25 mL of a solution of AgNO3 (4 mgAg/mL) (Aldrich, USA) to obtain a concentration of 2 wt%Ag. This solution was soaked at 60 °C for 2 h, dried at 110 °C for 12 h, and calcined at 500 °C for 6 h. All catalysts were reduced in H2 flow (30 cm3/min) at 500 °C for 2 h.

3.2. Catalyst Characterization

The catalysts were characterized by adsorption-desorption of N2. The measurement of the isotherms was carried out on ASAP-2460 Version 2.01 (Micromeritics, Norcross, GA, USA) equipment. The samples received pretreatment in a vacuum (1 × 10⁻⁴ Torr) at 300 °C for 14 h; after that, physisorption with N2 was performed at −196 °C (77 K). The BET and BJH methods were used to determine the specific area, diameter, and pore volume.
The crystalline phases were obtained in a Bruker diffractometer (D8FOCUS) (Bruker, Karlsruhe, Germany) operated at 35 kV and 25 mA using Cu Kα radiation (λ = 0.154 nm) at a goniometer speed of 2°/min with a sweep of 10° ≤ 2θ ≤ 100°. A special detector called “Lynx Eyes” was used. The identification of the different crystalline phases was compared with the data from the corresponding JCPDS diffraction cards.
Temperature programmed reduction (TPR) profiles of the calcined Pt/Al2O3 samples were obtained under H2 flow (10 vol.%H2/Ar) by using a commercial thermodesorption apparatus (multipulse RIG model, from ISRI) equipped with a thermal conductivity detector (TCD). Samples of 30 mg and a gas flow rate of 25 cm3/min were used in the experiments. The TPR profiles were registered by heating the sample from 25 to 600 °C at a rate of 10 °C/min, and a TCD monitored the rate of H2 consumption. The amount of H2 consumed was obtained by the deconvolution and integration of the TPR peaks using the Peak Fit program. The calibration was done by measuring the change in weight due to a reduction in H2 of 2 mg of CuO using an electrobalance Cahn-RG. The TPR signal of CuO was made and correlated with the stoichiometric H2 consumption.
Chemisorption measurements of H2 were performed using a conventional volumetric glass apparatus (base pressure 1 × 10⁻⁵ Torr). The amount of chemisorbed H2 was determined from adsorption isotherms measured at room temperature (25 °C). In a typical experiment, the catalysts (0.5 g) were reduced in H2 at 500 °C for 1 h, then evacuated at the same temperature for 2 h and cooled down under vacuum to 25 °C. After that, the first adsorption isotherm was measured. The catalyst was then evacuated to 1 × 10⁻⁵ Torr for 30 min at 25 °C to remove the physisorbed species and back-sorption isotherm. The linear parts of the isotherms were extrapolated to zero pressure. The subtraction of the two isotherms gave the amount of H2 strongly chemisorbed on metal particles. These values were then used to calculate the Pt dispersion (H/Pt ratio). In preliminary experiments, it was found that chemisorptions of hydrogen on the Al2O3 support were negligible at 25 °C. The uncertainty of the reported uptakes was ±0.45 μmol H2/gcat.
The materials’ microstructure images were taken by scanning electron microscopy (SEM) with field emission and high resolution in a Joel microscope (model JFM-6701-F) (JEOL Ltd., Tokyo, Japan) using secondary electrons. The qualitative and quantitative chemical analyses and their corresponding images were obtained by attaching an x-ray energy dispersion spectroscopy (EDS) probe to the microscope.
Ex situ UV–Visible spectra of the powder samples calcined at 500 °C were obtained with a UV–Vis spectrophotometer (GBC model Cintra 20) (GBC Scientific Equipment, Braeside, Australia) with a wavelength of 200 to 800 nm under ambient conditions.
In situ UV–Visible spectra of the powder 0.4Pt/AW catalyst calcined at 500 °C were collected using an Agilent Cary 5000 spectrometer (Agilent Technologies Inc., Santa Clara, CA, USA) equipped with a Harrick Praying Mantis. During the experiment, 50 mg of the sample was packed in the sample holder. The spectra were recorded in the range of 200–1000 nm with a resolution of 0.1 nm each 100 °C from 25 to 500 °C in a gas mixture of 5 vol.%H2/N2, with a flow of 0.5 cm3/s.

3.3. Catalytic Evaluation

The catalytic activity for C3H8–SCR was carried out in a quartz microreactor with a diameter of 10 mm, which was operated under kinetic conditions where the phenomena of mass transfer by internal and external diffusion were minimized, for which the value of the Weisz and Prater criterion was calculated [63,64,65] (Supplementary Material SI.2).
The effect of the reducing agent, H2, was investigated at a gas hourly space velocity (GHSV) of 128,000 h−1. The flow used was 400 cm3/min and a sample of 150 mg was placed (100 US mesh, 0.148 mm). Prior to each test, the samples were pretreated in a flow of 20 cm3/min with a mixture containing 13.2 vol.% H2 with N2 at 500 °C for 2 h.
The temperature of reaction increased from 50 to 600 °C at 5 °C/min. The feed mixture to the microreactor was: 500 ppm of NO, 625 ppm of C3H8, 200 ppm of CO, 660 ppm of H2, 2 vol.%O2, and N2 (balance). The pure gases were chromatographic grade O2, H2, and N2 (99.90% Infra S.A.) and a prepared mixture of NO, CO, and propane (Praxair, USA). The concentration of the gases in the feed to the microreactor varied according to the reaction experiment (C3H8–SCR or H2–C3H8–SCR). The gas flows were controlled by mass flow controllers (AALBORG, Repeatability: ±0.25% of full scale) and the inlet and outlet gas composition was analyzed as described below.
The C3H8 was analyzed in a gas chromatograph (Gow-Mac, 550, GOW-MAC Instrument Company, Bethlehem, PA, USA) with a flame ionization detector and six feet packed column using a stationary phase, tri-cresyl phosphate in bentonite-34. The analysis of NO and NO2 was performed by chemiluminescence with a Rosemount Analytical analyzer (Model 951A NO/NOx Analyzer, Rosemount Analytical Inc., Anaheim, CA, USA). The N2O was analyzed in another gas chromatograph (Gow-Mac, 580) with a thermal conductivity detector using He as the carrier gas (52 cm3/min) with a 10 feet packed column of Porapak Q at a temperature of 50 °C (note that this column can also analyze air, NO, NO2, N2O, CO2 and H2O). Bridge current: 150 mA, Response time: 0.5 s, noise: 10 μVmax. (within operating parameters), drift: 40 μV/hour max. The repeatability of the experiments carried out was 0.71, which means that it represents a moderate repeatability in the measurement of experiments according to David G.C. [66], and the absolute error of ±5 ppm N2O. The average retention times were: 0.62 min (Air), 0.75 min (NO), 1.1 min (NO2), 2.1 min (CO2), 2.75 min (N2O), and 8.25 min (H2O). The analysis of CO and H2 was made in a Gow-Mac, 580 gas chromatograph with a TCD detector using He as the carrier gas and a 13× molecular sieve packed column (1/8 in × 8 ft).
The experiments of the combustion of C3H8 (see Supplementary Material SI.1 and Appendix A) were made in a flow microreactor connected in-line to a gas chromatograph (Gow-Mac, 550) with a flame ionization detector and six feet packed column using a stationary phase, tri-cresyl phosphate in bentonite-34. The propane composition was 999 ppm in dry air (Linde). The total pressure within the reaction system remained constant at 590 Torr and the gas flow used in all of the experiments was 300 cm3/min. The amounts of catalyst evaluated were 20 mg. The samples were evaluated by scanning temperatures from room temperature to 500 °C at a fixed time of 90 min. The deactivation tests were carried out at the same final temperature and for 180 min, keeping all other variables constant.
The equations to calculate the conversion of NO(X) and the yield to a product (Yi) are as follows:
X = ([NO]o − [NO])/[NO]o) × 100
YN2O = 2 × [N2O]/[NO]o × 100

4. Conclusions

The addition of 0.1 wt%Pt to the 2 wt%Ag/Al2O3–WOx catalyst improved the C3H8–SCR of NO assisted by H2 and widened the range of conversions with respect to the reaction temperature.
Bimetallic PtAg particles were formed, having a strong contact between the metals, and had the capacity of adsorbing H2. Pt dispersion was more significant in the particles with a lower concentration of Pt, and the Ag monometallic catalyst did not show H2 chemisorption.
After reduction with H2, Ag and PtAg particles were obtained in all the bimetallic catalysts. It appears that the bimetallic PtAg particles have adsorption properties that explain the differences with the Ag/Al2O3 catalysts.
Utilizing ex situ UV–Vis spectroscopy, species such as Ag+ and Agnδ+ were found as well as Ag0 nanoparticles after SCR of NO with C3H8 and H2 in a wide temperature range. By SEM, mainly spherical clusters of small particles of less than 10 nm were found in the calcined Pt catalyst, which was probably related to the presence of Ag2O. The distribution of particle diameters indicated the predominance (31.64%) of particles of 10 nm or less.
The C3H8–SCR of NO from the PtAg/Al2O3 bimetallic catalysts promoted with WOx was considerably improved by adding H2 to the combustion gases due to the formation of Ag clusters, (or PtAg clusters), enolic species, and the decrease in nitrate self-poisoning, which is a stage before the formation of N-containing species.
The addition of 0.5 wt%W to the Al2O3 and the Pt/Al2O3-WOx catalysts stabilized them in the propane combustion reaction.

Supplementary Materials

The following are available online at https://www.mdpi.com/2073-4344/10/10/1212/s1, Figure S1: C3H8 combustion in air over the (●) 0.4Pt/A; (□) 0.4Pt/AW catalysts reduced to 500 and 800°C. (a) Effect of reduction temperature on catalyst 0.4Pt/A without W; (b) Effect of reduction temperature on catalyst 0.4Pt/AW with W; (c) Effect of WOx during catalyst deactivation 0.4Pt/A without W and 0.4Pt/AW with W reduced to 500°C and (d) Effect of WOx during deactivation of 0.4Pt/A catalysts without W and 0.4Pt/AW with W reduced to 800°C. Evaluation conditions: 300cm3/min of air mixture flow plus 999 ppm of C3H8, catalyst weight: 20 mg, Table S1: Microreactor operating conditions to evaluate the SCR of NO at 250°C (average temperature).

Author Contributions

Conceptualization, J.L.C., G.A.F., N.N.G.H., M.E.H.-T., and M.P.; Methodology, J.L.C., N.N.G.H., and M.P.; Investigation, G.A.F., N.N.G.H., and M.P.; Resources, J.L.C., B.Z., J.L.F.M., T.V., and J.M.J.; Data curation, J.L.C.; Writing-preparing the initial draft, N.N.G.H.; Critical writing-review and editing, J.L.C., J.S., and B.Z.; Visualization, N.N.G.H.; Supervision, J.L.C.; Project administration, J.L.C.; Procurement of funds, J.L.C. All authors have read and agreed to the published version of the manuscript.

Funding

This research received no external funding.

Acknowledgments

Naomi N. González Hernández thanks CONACYT for the postgraduate scholarship awarded through program 001379. We thank the Catalysis Laboratory, UAM-A, and the Chemical Industry Process Laboratory, UAM-A., J.L. Contreras appreciates the support of the company Synthesis and Industrial Applications, S.A.

Conflicts of Interest

The authors declare no conflict of interest.

Appendix A. Stabilization of Al2O3 and Pt/Al2O3 Catalysts

The addition of tungsten oxides (WOx) to the Al2O3 support means that at low concentrations of W (0.5 wt%W), it is possible to thermally stabilize the Al2O3 structure at high temperatures (600 to 900 °C), as can be seen in Figure A1. The BET area of the Al2O3 samples calcined at 650, 800, and 950 °C was higher when more than 0.5 wt% of W was added. In other words, W acts as a structural promoter of Al2O3, allowing the Ag/Al2O3 catalyst to more extensively withstand the inevitable thermal sintering at high temperatures during reactions.
Figure A1. BET area against W concentration (in wt%W) named Al2O3–WOx, when the calcination temperature increased: (a) 500 °C; (b) 650 °C; (c) 800 °C; (d) 950 °C for 6 h.
Catalysts 10 01212 g0a1
On the other hand, we studied the effect of the W/Pt ratio on the Pt’s dispersion for catalysts supported in Al2O3 [44,45] when they were subjected to reduction in H2 at 500 °C and 800 °C (Figure A2). It was observed that the catalyst reduced to 800 °C without W (ratio W/Pt = 0) showed a dispersion of 42%, while the catalyst with a W/Pt ratio of 3.28 showed a dispersion of 60%.
However, as Figure A2 shows, as the W/Pt ratio increases, the dispersion of Pt decreases, and it can be observed that this trend is more pronounced in samples reduced to 500 °C than in samples reduced to 800 °C. This behavior suggests that the presence of WOx in the presence of PtOxCly could inhibit the formation of metallic Pt because a higher reduction temperature (800 °C) would be required to obtain a better dispersion of Pt.
Figure A2. Dispersion of Pt in Pt/AW catalysts increasing the W/Pt atomic ratio when the reduction temperature in H2 increased from (a) 500 to (b) 800 °C (for 4 h).
Catalysts 10 01212 g0a2

References

  1. Twigg, M.V. Progress and future challenges in controlling automotive exhaust gas emissions. Appl. Catal. B Environ. 2007, 70, 2–15. [Google Scholar] [CrossRef]
  2. Burch, R.; Breen, J.P.; Meunier, F.C. A review of the selective reduction of NOx with hydrocarbons under lean-burn conditions with non-zeolitic oxide and platinum group metal catalysts. Appl. Catal. B Environ. 2002, 39, 283–303. [Google Scholar] [CrossRef]
  3. Kannisto, H.; Ingelsten, H.H.; Skoglundh, M. Ag–Al2O3 catalysts for lean NOx reduction—Influence of preparation method and reductant. J. Mol. Catal. A Chem. 2009, 302, 86–96. [Google Scholar] [CrossRef]
  4. Nakatsuji, T.; Yasukawa, R.; Tabata, K.; Ueda, K.; Niwa, M. Catalytic reduction system of NOx in exhaust gases from diesel engines with secondary fuel injection. Appl. Catal. B Environ. 1998, 17, 333–345. [Google Scholar] [CrossRef]
  5. Miyadera, T.; Yoshida, K. Alumina-supported catalysts for the selective reduction of nitric oxide by propene. Chem. Lett. 1993, 9, 1483–1486. [Google Scholar] [CrossRef]
  6. Satokawa, S.; Yamaseki, K.; Uchida, H. Influence of low concentration of SO2 for selective reduction of NO by C3H8 in lean-exhaust conditions on the activity of Ag/Al2O3 catalyst. Appl. Catal. B Environ. 2001, 34, 299–306. [Google Scholar] [CrossRef]
  7. Kyriienko, P.; Popovych, N.; Soloviev, S.; Orlyk, S.; Dzwigaj, S. Remarkable activity of Ag/Al2O3/cordierite catalysts in SCR of NO with ethanol and butanol. Appl. Catal. B Environ. 2013, 140–141, 691–699. [Google Scholar] [CrossRef]
  8. Popovych, N.O.; Soloviev, S.O.; Orlyk, S.M. Selective reduction of nitrogen oxides (NOx) with oxygenates and hydrocarbons over bifunctional, silver–alumina catalysts: A review. Theor. Exp. Chem. 2016, 52, 133–151. [Google Scholar] [CrossRef]
  9. Männikkö, M.; Wang, X.; Skoglundh, M.; Härelind, H. Characterization of the active species in the silver/alumina system for lean NOx reduction with methanol. Catal. Today 2016, 267, 76–81. [Google Scholar] [CrossRef]
  10. Deng, H.; Yu, Y.; He, H. Adsorption states of typical intermediates on Ag/Al2O3 catalyst employed in the selective catalytic reduction of NOx by ethanol. Chin. J. Catal. 2015, 36, 1312–1320. [Google Scholar] [CrossRef]
  11. Bethke, K.A.; Kung, H.H. Supported Ag catalysts for the lean reduction of NO with C3H6. J. Catal. 1997, 172, 93–102. [Google Scholar] [CrossRef]
  12. Hoost, T.E.; Kudla, R.J.; Collins, K.M.; Chattha, M.S. Characterization of Ag/γ-Al2O3 catalysts and their lean-NOx properties. Appl. Catal. B Environ. 1997, 13, 59–67. [Google Scholar] [CrossRef]
  13. Kung, M.C.; Kung, H.H. Lean NOx catalysis over alumina-supported catalysts. Top. Catal. 2000, 10, 21–26. [Google Scholar] [CrossRef]
  14. Meunier, F.C.; Breen, J.P.; Zuzaniuk, V.; Olsson, M.; Ross, J.R.H. Mechanistic aspects of the selective reduction of NO by propene over alumina and silver-alumina catalysts. J. Catal. 1999, 187, 493–505. [Google Scholar] [CrossRef]
  15. Martínez-Arias, A.; Fernández-García, M.; Iglesias-Juez, A.; Anderson, J.A.; Conesa, J.C.; Soria, J. Study of the lean NOx reduction with C3H6 in the presence of water over silver/alumina catalysts prepared from inverse microemulsions. Appl. Catal. B Environ. 2000, 28, 29–41. [Google Scholar] [CrossRef]
  16. Shimizu, K.I.; Shibata, J.; Yoshida, H.; Satsuma, A.; Hattori, T. Silver-alumina catalysts for selective reduction of NO by higher hydrocarbons: Structure of active sites and reaction mechanism. Appl. Catal. B Environ. 2001, 30, 151–162. [Google Scholar] [CrossRef]
  17. Bogdanchikova, N.; Meunier, F.C.; Avalos-Borja, M.; Breen, J.P.; Pestryakov, A. On the nature of the silver phases of Ag/Al2O3 catalysts for reactions involving nitric oxide. Appl. Catal. B Environ. 2002, 36, 287–297. [Google Scholar] [CrossRef]
  18. Iglesias-Juez, A.; Hungría, A.B.; Martínez-Arias, A.; Fuerte, A.; Fernández-García, M.; Anderson, J.A. Nature and catalytic role of active silver species in the lean NOx reduction with C3H6 in the presence of water. J. Catal. 2003, 217, 310–323. [Google Scholar] [CrossRef]
  19. Arve, K.; Capek, L.; Klingstedt, F.; Eränen, K.; Lindfors, L.E.; Murzin, D.Y. Preparation and characterization of Ag/alumina catalysts for the removal of NOx emissions under oxygen rich conditions. Top. Catal. 2004, 30, 91–95. [Google Scholar] [CrossRef]
  20. Mrabet, D.; Manh-Hiep, V.; Kaliaguine, S.; Trong-On, D. A new route to the shape-controlled synthesis of nano-sized γ-alumina and Ag/γ-alumina for selective catalytic reduction of NO in the presence of propene. J. Colloid Interface Sci. 2017, 485, 144–151. [Google Scholar] [CrossRef]
  21. Keshavaraja, A.; She, X.; Flytzani-Stephanopoulos, M. Selective catalytic reduction of NO with methane over Ag-alumina catalysts. Appl. Catal. B Environ. 2000, 27, L1–L9. [Google Scholar] [CrossRef]
  22. Shimizu, K.; Satsuma, A.; Hattori, T. Catalytic performance of Ag–Al2O3 catalyst for the selective catalytic reduction of NO by higher hydrocarbons. Appl. Catal. B Environ. 2000, 25, 239–247. [Google Scholar] [CrossRef]
  23. She, X.; Flytzani-Stephanopoulos, M. The role of Ag–O–Al species in silver–alumina catalysts for the selective catalytic reduction of NOx with methane. J. Catal. 2006, 237, 79–93. [Google Scholar] [CrossRef]
  24. Luo, Y.; Hao, J.; Hou, Z.; Fu, L.; Li, R.; Ning, P.; Zheng, X. Influence of preparation methods on selective catalytic reduction of nitric oxides by propene over silver–alumina catalyst. Catal. Today 2004, 93–95, 797–803. [Google Scholar] [CrossRef]
  25. Chaieb, T.; Delannoy, L.; Costentin, G.; Louis, C.; Casale, S.; Chantry, R.L.; Li, Z.Y.; Thomas, C. Insights into the influence of the Ag loading on Al2O3 in the H2-assisted C3H6-SCR of NOx. Appl. Catal. B Environ. 2014, 156–157, 192–201. [Google Scholar] [CrossRef]
  26. Tamm, S.; Vallim, N.; Skoglundh, M.; Olsson, L. The influence of hydrogen on the stability of nitrates during H2-assisted SCR over Ag/Al2O3 catalysts—A DRIFT study. J. Catal. 2013, 307, 153–161. [Google Scholar] [CrossRef]
  27. Azis, M.M.; Härelind, H.; Creaser, D. On the role of H2 to modify surface NOx species, over Ag–Al2O3 as lean NOx reduction catalyst: TPD and DRIFTS studies. Catal. Sci. Technol. 2015, 5, 296–309. [Google Scholar] [CrossRef] [Green Version]
  28. Azis, M.M.; Härelind, H.; Creaser, D. Kinetic modeling of H2-assisted C3H6 selective catalytic reduction of NO over silver alumina catalyst. Chem. Eng. J. 2015, 278, 394–406. [Google Scholar] [CrossRef] [Green Version]
  29. Singh, P.; Yadav, D.; Thakur, P.; Pandey, J.; Prasad, R. Studies on H2-Assisted Liquefied Petroleum Gas Reduction of NO over Ag/Al2O3 Catalyst. Bull. Chem. React. Eng. Catal. 2018, 13, 227–235. [Google Scholar]
  30. Hernández-Terán, M.E.; Fuentes, G.A. Enhancement by H2 of C3H8-SCR of NOx using Ag/γ-Al2O3. Fuel 2014, 138, 91–97. [Google Scholar] [CrossRef]
  31. Ström, L.; Carlsson, P.-A.; Skoglundh, M.; Härelind, H. Surface Species and Metal Oxidation State during H2-Assisted NH3-SCR of NOx over Alumina-Supported Silver and Indium. Catalysts 2018, 8, 38. [Google Scholar] [CrossRef] [Green Version]
  32. Xu, G.; Ma, J.; Wang, L.; Lv, Z.; Wang, S.; Yu, Y.; He, H. Mechanism of the H2 Effect on NH3-Selective Catalytic Reduction over Ag/Al2O3: Kinetic and Diffuse Reflectance Infrared Fourier Transform Spectroscopy Studies. ACS Catal. 2019, 9, 10489–10498. [Google Scholar] [CrossRef]
  33. Barreau, M.; Tarot, M.-L.; Duprez, D.; Courtois, X.; Can, F. Remarkable enhancement of the selective catalytic reduction of NO at low temperature by collaborative effect of ethanol and NH3 over silver supported catalyst. Appl. Catal. B Environ. 2018, 220, 19–30. [Google Scholar] [CrossRef]
  34. Pihl, J.A.; Toops, T.J.; Fisher, G.B.; West, B.H. Selective catalytic reduction of nitric oxide with ethanol/gasoline blends over a silver/alumina catalyst. Catal. Today 2014, 231, 46–55. [Google Scholar] [CrossRef]
  35. Wu, S.; Li, X.; Fang, X.; Sun, Y.; Sun, J.; Zhou, M.; Zang, S. NO reduction by CO over TiO2-γ-Al2O3 supported In/Ag catalyst under lean burn conditions. Chin. J. Catal. 2016, 37, 2018–2024. [Google Scholar] [CrossRef]
  36. Shang, Z.; Cao, J.; Wang, L.; Guo, Y.; Lu, G.; Guo, Y. The study of C3H8-SCR on Ag/Al2O3 catalysts with the presence of CO. Catal. Today 2017, 281, 605–660. [Google Scholar] [CrossRef]
  37. Gunnarsson, F.; Kannisto, H.; Skoglundh, M.; Härelind, H. Improved low-temperature activity of silver–alumina for lean NOx reduction—Effects of Ag loading and low-level Pt doping. Appl. Catal. B Environ. 2014, 152–153, 218–225. [Google Scholar] [CrossRef]
  38. Tamm, S.; Andonova, S.; Olsson, L. The Effect of Hydrogen on the Storage of NOx over Silver, Platinum and Barium Containing NSR Catalysts. Catal. Lett. 2014, 144, 1101–1112. [Google Scholar] [CrossRef]
  39. Bonet, F.; Grugeon, S.; Herrera Urbina, R.H.; Tekaia-Elhsissen, K.; Tarascon, J.-M. In situ deposition of silver and palladium nanoparticles prepared by the polyol process and their performance as catalytic converters of automobile exhaust gases. Solid State Sci. 2002, 4, 665–670. [Google Scholar] [CrossRef]
  40. He, H.; Wang, J.; Feng, Q.; Yu, Y.; Yoshida, K. Novel Pd, promoted Ag/Al2O3 catalyst for the selective reduction of NOx. Appl. Catal. B Environ. 2003, 46, 365–370. [Google Scholar] [CrossRef]
  41. Inderwildi, O.R.; Jenkins, S.J.; King, D.A. When adding an unreactive metal enhances catalytic activity: NOx decomposition over silver–rhodium bimetallic surfaces. Surf. Sci. 2007, 601, L103–L108. [Google Scholar] [CrossRef]
  42. Lanza, R.; Eriksson, E.; Pettersson, L.J. NOx selective catalytic reduction over supported metallic catalysts. Catal. Today 2009, 147S, S279–S284. [Google Scholar] [CrossRef]
  43. Schott, F.J.P.; Balle, P.; Adler, J.; Kureti, S. Reduction of NOx by H2 on Pt/WO3/ZrO2 catalysts in oxygen-rich exhaust. Appl. Catal. B Environ. 2009, 87, 18–29. [Google Scholar] [CrossRef]
  44. Contreras, J.L.; Fuentes, G.A.; García, L.A.; Salmones, J.; Zeifert, B. WOx effect on the catalytic properties of Pt particles on Al2O3. J. Alloy Compd. 2009, 483, 450–452. [Google Scholar] [CrossRef]
  45. Contreras, J.L.; Fuentes, G.A.; Zeifert, B.; García, L.A.; Salmones, J. Stabilization of Supported Platinum Nanoparticles on γ-Alumina Catalysts by Addition of Tungsten. J. Alloy Compd. 2009, 483, 371–373. [Google Scholar] [CrossRef]
  46. Muñoz, H.P.; Delmás, R.D. Alumina synthesis from AlCl3 acid solution and XRD characterization. J. Per. Quim. Ing. Química 2001, 4, 68–71. [Google Scholar]
  47. Aguado, J.; Escola, J.M.; Castro, M.C. Influence of the thermal treatment upon the textural properties of sol–gel mesoporous γ-alumina synthesized with cationic surfactants. Microporous Mesoporous Mater. 2010, 128, 48–55. [Google Scholar] [CrossRef]
  48. Richter, M.; Bentrup, U.; Eckelt, R.; Schneider, M.; Pohl, M.M.; Fricke, R. The effect of hydrogen on the selective catalytic reduction of NO in excess oxygen over Ag/Al2O3. Appl. Catal. B Environ. 2004, 51, 261–274. [Google Scholar] [CrossRef]
  49. Vojvodic, A.; Calle-Vallejo, F.; Guo, W.; Wang, S.; Toftelund, A.; Studt, F.; Martínez, J.I.; Shen, J.; Man, J.; Rossmeisl, I.C.; et al. On the behavior of Brønsted-Evans-Polanyi relations for transition metal oxides. J. Chem. Phys. 2011, 134, 244–509. [Google Scholar] [CrossRef] [Green Version]
  50. Hernández-Terán, M.E. Development of Ag/γ-Al2O3 and Ag/η-Al2O3 Catalytic Systems for H2-Assisted NO C3H8-SCR under Oxidizing Operation for Emission Control Systems for Diesel Engines or Stationary Sources. Ph.D. Thesis, Universidad Autónoma Metropolitana-Iztapalapa, Ciudad de México, Mexico, 2020. [Google Scholar]
  51. Zhang, Q.; Li, J.; Liu, X.; Zhu, Q. Synergetic effect of Pd and Ag dispersed on Al2O3 in the selective hydrogenation of acetylene. Appl. Catal. A General 2000, 197, 221–228. [Google Scholar] [CrossRef]
  52. Lieske, H.; Lietz, G.; Spindler, H.; Volter, J. Reactions of Platinum in Oxygen- and Hydrogen-Treated Pt/A1203 Catalysts. Temperature-Programmed Reduction, Adsorption, and Redispersion of Platinum. J. Catal. 1983, 81, 8–16. [Google Scholar]
  53. Gauthard, F.; Epron, F.; Barbier, J. Palladium and platinum-based catalysts in the catalytic reduction of nitrate in water: Effect of cooper, silver or gold addition. J. Catal. 2003, 220, 182–191. [Google Scholar] [CrossRef]
  54. De Jong, K.P.; Bongenaar-Schlenter, B.E.; Meima, G.R.; Verkerk, R.C.; Lammers, M.J.J.; Geus, J.W. Investigations on silica-supported platinum-silver alloy particles by infrared spectra of adsorbed CO and N2. J. Catal. 1983, 81, 67–76. [Google Scholar] [CrossRef]
  55. Prasad, J.; Murthy, K.R.; Menon, P.G. The stoichiometry of hydrogen-oxygen titrations on supported platinum catalysts. J. Catal. 1978, 52, 515–520. [Google Scholar] [CrossRef]
  56. Arve, K.; Svennerberg, K.; Klingstedt, F.; Eranen, K.; Wallenberg, L.R.; Bovin, J.O.; Capek, L.; Murzin, D.Y. Structure-Activity Relationship in HC-SCR of NOx by TEM, O2-Chemisorption, and EDXS Study of Ag/Al2O3. J. Phys. Chem. B 2006, 110, 420–427. [Google Scholar] [CrossRef]
  57. Bligaard, T.; Nørskov, J.K.; Dahl, S.; Matthiesen, J.; Christensen, C.H.; Sehested, J. The Brønsted–Evans–Polanyi relation and the volcano curve in heterogeneous catalysis. J. Catal. 2004, 224, 206–217. [Google Scholar] [CrossRef]
  58. Lietz, G.; Lieske, H.; Spindler, H.; Hanke, W.; Völter, J. Reactions of Platinum in Oxygen- and Hydrogen-Treated Pt/γ-Al2O3 catalysts, II. Ultraviolet-Visible Studies, Sintering of Platinum, and Soluble Platinum. J. Catal. 1983, 81, 17–25. [Google Scholar] [CrossRef]
  59. Barton, D.G.; Soled, S.L.; Meitzner, G.D.; Fuentes, G.A.; Iglesia, E. Structural and Catalytic Characterization of Solid Acids Based on Zirconia Modified by Tungsten Oxide. J. Catal. 1999, 181, 57–72. [Google Scholar] [CrossRef] [Green Version]
  60. Satokawa, S. Enhancing the NO/C3H8/O2 Reaction by Using H2 over Ag/Al2O3 Catalysts under Lean-Exhaust Conditions. Chem. Lett. 2000, 29, 294–295. [Google Scholar] [CrossRef]
  61. Wang, J.; He, H.; Feng, Q.; Yu, Y.; Yoshida, K. Selective catalytic reduction of NOx with C3H6 over Ag/Al2O3 catalyst with a small quantity of noble metal. Catal. Today 2004, 93–95, 783–789. [Google Scholar] [CrossRef]
  62. Bordley, J.A.; El-Sayed, M.A. Enhanced Electrocatalytic Activity toward the Oxygen Reduction Reaction through Alloy Formation: Platinum-Silver Alloy Nano cages. J. Phys. Chem. 2016, 120, 14643–14651. [Google Scholar] [CrossRef]
  63. Fogler, S.H. Elements of Chemical Reaction Engineering, 3rd ed.; Prentice Hall Inc.: Upper Saddle River, NJ, USA, 1999; pp. 738–758. [Google Scholar]
  64. Smith, J.F. Chemical Engineering Kinetics, 3rd ed.; McGraw-Hill Inc.: New York, NY, USA, 1986; pp. 524–534. [Google Scholar]
  65. Hirshfelder, J.O.; Curtis, C.F.; Bird, R.B. Molecular Theory of Gases and Liquids, 1st ed.; Wiley: Hoboken, NJ, USA, 1964; ISBN 0-471-40065-3. [Google Scholar]
  66. David, G.C. Some comments on the repeatability of measurements. Ringing Migr. 1994, 15, 84–90. [Google Scholar]
Figure 1. X-ray diffraction (XRD) patterns of the catalysts: (a) 0.4Pt/AW; (b) 2Ag/AW; (c) 0.1PtAg/AW; (d) 0.25PtAg/AW; (e) 0.4PtAg/AW; (f) 1PtAg/AW.
Catalysts 10 01212 g001
Figure 2. TPR of the catalysts: (a) 2Ag/AW; (b) 1PtAg/AW; (c) 0.4PtAg/AW; (d) 0.25PtAg/AW; (e) 0.1PtAg/AW; (f) 0.4Pt/AW catalyst.
Catalysts 10 01212 g002
Figure 3. Morphological and chemical composition of the catalyst 0.4PtAg/AW calcined at 500 °C. (a) SEM micrograph; (b) The distribution of particle diameters; (c) EDS analysis of the spherical cumulus zone where Pt cannot be analyzed due to its low concentration.
Catalysts 10 01212 g003
Figure 4. Ex situ UV–Vis spectra of the catalysts: (a) Calcined 2Ag/AW; (b) 2Ag/AW after H2 reduction in a flow of H2 (30 cm3/min) at 500 °C for 2 h (spectrum taken immediately after reduction in H2).
Catalysts 10 01212 g004
Figure 5. In situ UV–Vis spectrum of: (a) 0.4Pt/AW catalyst calcined at 500 °C; (b) 0.4Pt/AW catalyst during the reduction process with 5 vol.% H2/N2, 0.5 cm3/s.
Catalysts 10 01212 g005
Figure 6. Ex situ UV–Vis spectra of the PtAg/AW catalysts calcined at 500 °C when the Pt concentration changed from 0.1 to 1 wt% on Al2O3–WOx catalysts. (a) 1PtAg/AW; (b) 0.4PtAg/AW; (c) 0.25PtAg/AW; and (d) 0.1PtAg/AW.
Catalysts 10 01212 g006
Figure 7. C3H8–SCR–NOx from (a) 2Ag/AW catalyst in the absence of H2; (b) 2Ag/AW catalyst in the presence of H2; (c) 0.4Pt/AW catalyst in the presence of H2. Inlet gas composition: 500 ppm NO, 625 ppm C3H8, 200 ppm CO, 660 ppm H2, 2 vol.% O2, N2 balance; GHSV = 128,000 h−1.
Catalysts 10 01212 g007
Figure 8. C3H8–SCR–NOx from (a) 1PtAg/AW catalyst; (b) 0.4PtAg/AW catalyst; (c) 0.25PtAg/AW catalyst; (d) 2Ag/AW catalyst; (e) 0.1PtAg/AW catalyst. Inlet gas composition: 500 ppm NO, 625 ppm C3H8, 200 ppm CO, 2vol.% O2, N2 balance; GHSV = 128,000 h−1.
Catalysts 10 01212 g008
Figure 9. Bimetallic catalyst of PtAg for the C3H8–SCR–NO: (a) 0.1PtAg/AW; (b) 0.25PtAg/AW; (c) 0.4PtAg/AW; (d) 1PtAg/AW in the presence of H2. Inlet gas composition: 500 ppm NO, 625 ppm C3H8, 200 ppm CO, 660 ppm H2, 2 wt% O2, N2 balance; GHSV = 128,000 h−1.
Catalysts 10 01212 g009
Figure 10. NO and C3H8 conversion in the reaction C3H8–SCR–NO. (a) NO conversion with (●) 0.1PtAg/AW and (◊) 2Ag/AW; (b) C3H8 Conversion with (●) 0.1PtAg/AW and (Δ) 2Ag/AW catalysts. Inlet gas composition: 500 ppm NO, 625 ppm C3H8, 200 ppm CO, 660 ppm H2, 2 vol.% O2, N2 balance; GHSV = 128,000 h−1.
Catalysts 10 01212 g010
Figure 11. CO conversion of catalysts: (a) 2Ag/AW and (b) 0.1PtAg/AW. Inlet gas composition: 500 ppm NO, 625 ppm C3H8, 200 ppm CO, 660 ppm H2, 2 vol.% O2, N2 balance; GHSV = 128,000 h−1.
Catalysts 10 01212 g011
Figure 12. Composition of (a) NO; (b) NO2 and (c) N2 (calculated) in the microreactor as a function of temperature during the C3H8–SCR–NO with the catalyst 0.1PtAg/AW in the presence of H2. Inlet gas composition: 500 ppm NO, 625 ppm C3H8, 200 ppm CO, 660 ppm H2, 2vol.% O2, N2 balance; GHSV = 128,000 h−1.
Catalysts 10 01212 g012
Table 1. Composition of Pt, Ag, and PtAg/Al2O3 catalysts with 2 wt% Ag and 0.5 wt% W (WOx) prepared in powder. BET area, texture, Pt/Ag atomic ratio, H2 consumption by TPR, and Pt dispersion.
Catalyst NamePt
(%)
Ag
(%)
Pt/Ag Atomic RatioBET Area
(m2/g)
Pore Vol.
(cm3/g)
Pore Diam.
(Å)
H2 Consumption (μmol/gc)Pt Dispersion
(%)
A0002670.365400
0.4Pt/A0.40-2560.365545.161
2Ag/AW02-2640.3856670
0.4Pt/AW0.40-2300.39684357
0.1PtAg/AW0.120.0272260.37662.560
0.25PtAg/AW0.2520.0692180.36672646
0.4PtAg/AW0.420.1102250.37664138
1PtAg/AW120.2702280.376511221
Table 2. N2O yield (%) of the PtAg/AW catalysts in C3H8–SCR of NO with H2.
CatalystPt/W
Atomic Ratio
YN2O(%) at T(°C)
200400
Ag/Al2O3075
0.1PtAg/AW0.0278.56.5
0.25PtAg/AW0.06996.5
0.4PtAg/AW0.11127
1PtAg/AW0.27146
Publisher’s Note: MDPI stays neutral with regard to jurisdictional claims in published maps and institutional affiliations.

