Removal of Nonylphenol Polyethylene Glycol (NPEG) with Au-TiO2 Catalysts: Kinetic and Initial Transformation Path

 ,
,  , , , , and
Abstract
:1. Introduction
2. Results and Discussion
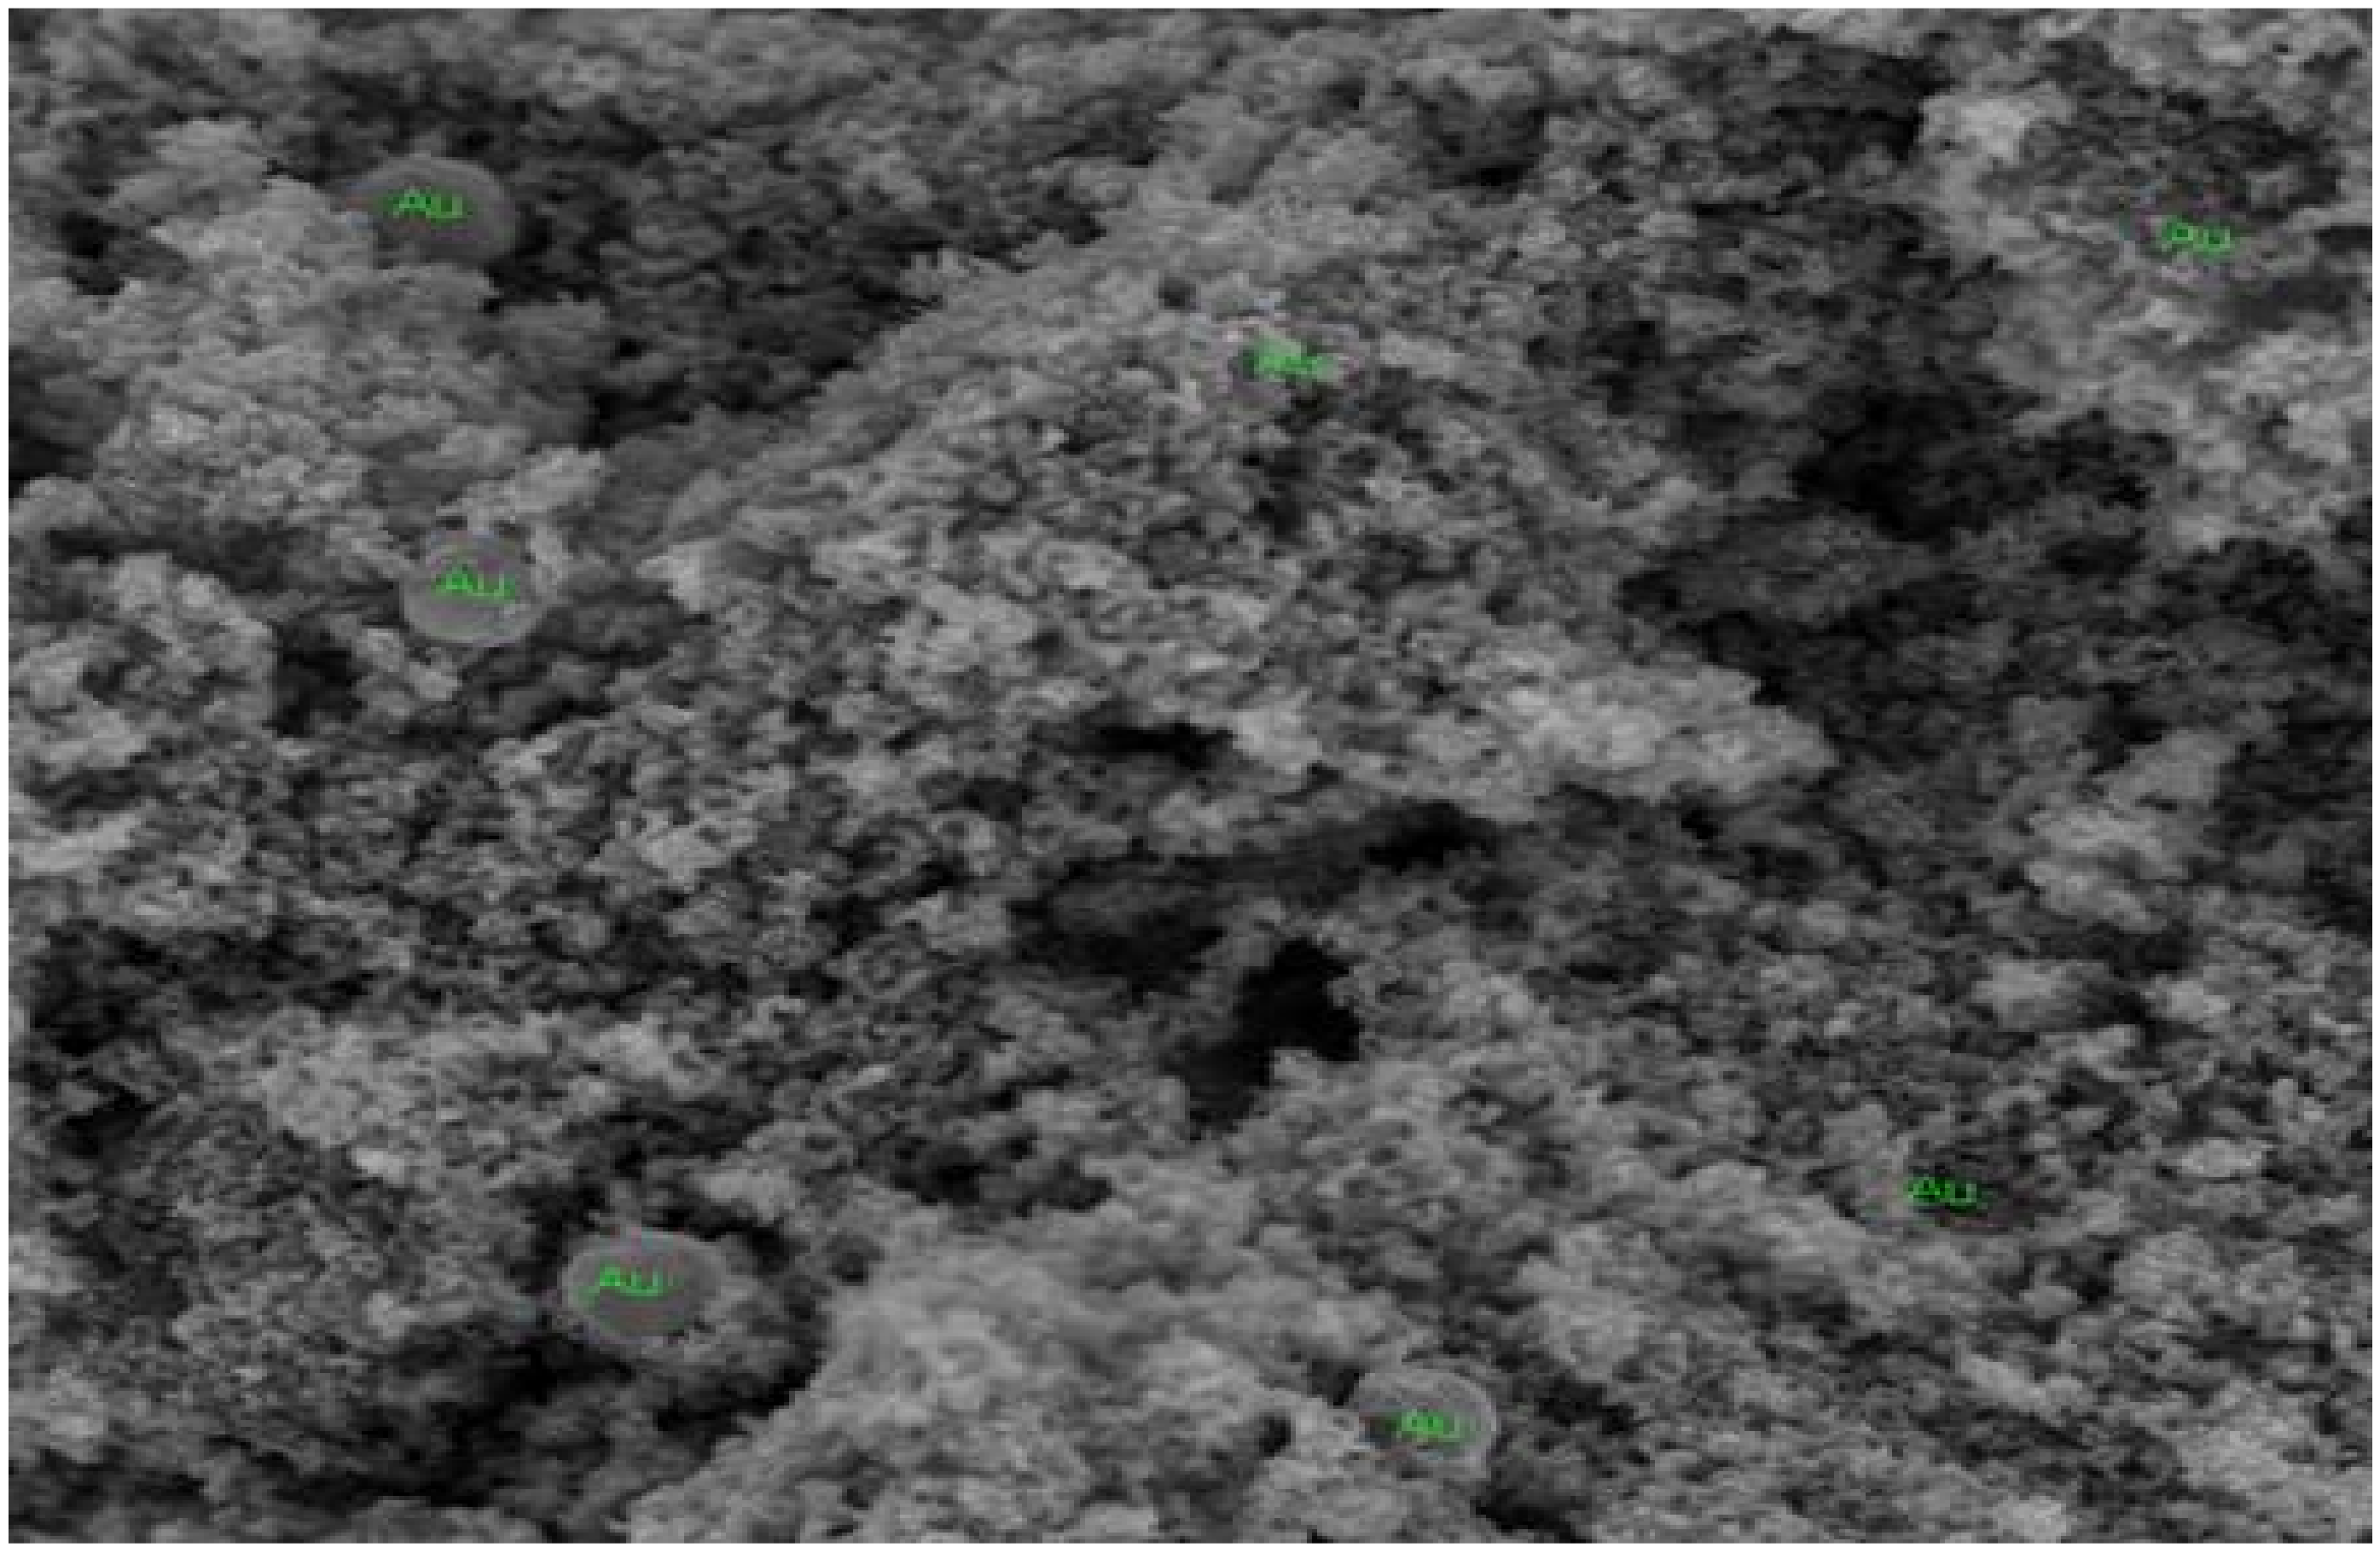
2.1. SEM and EDS
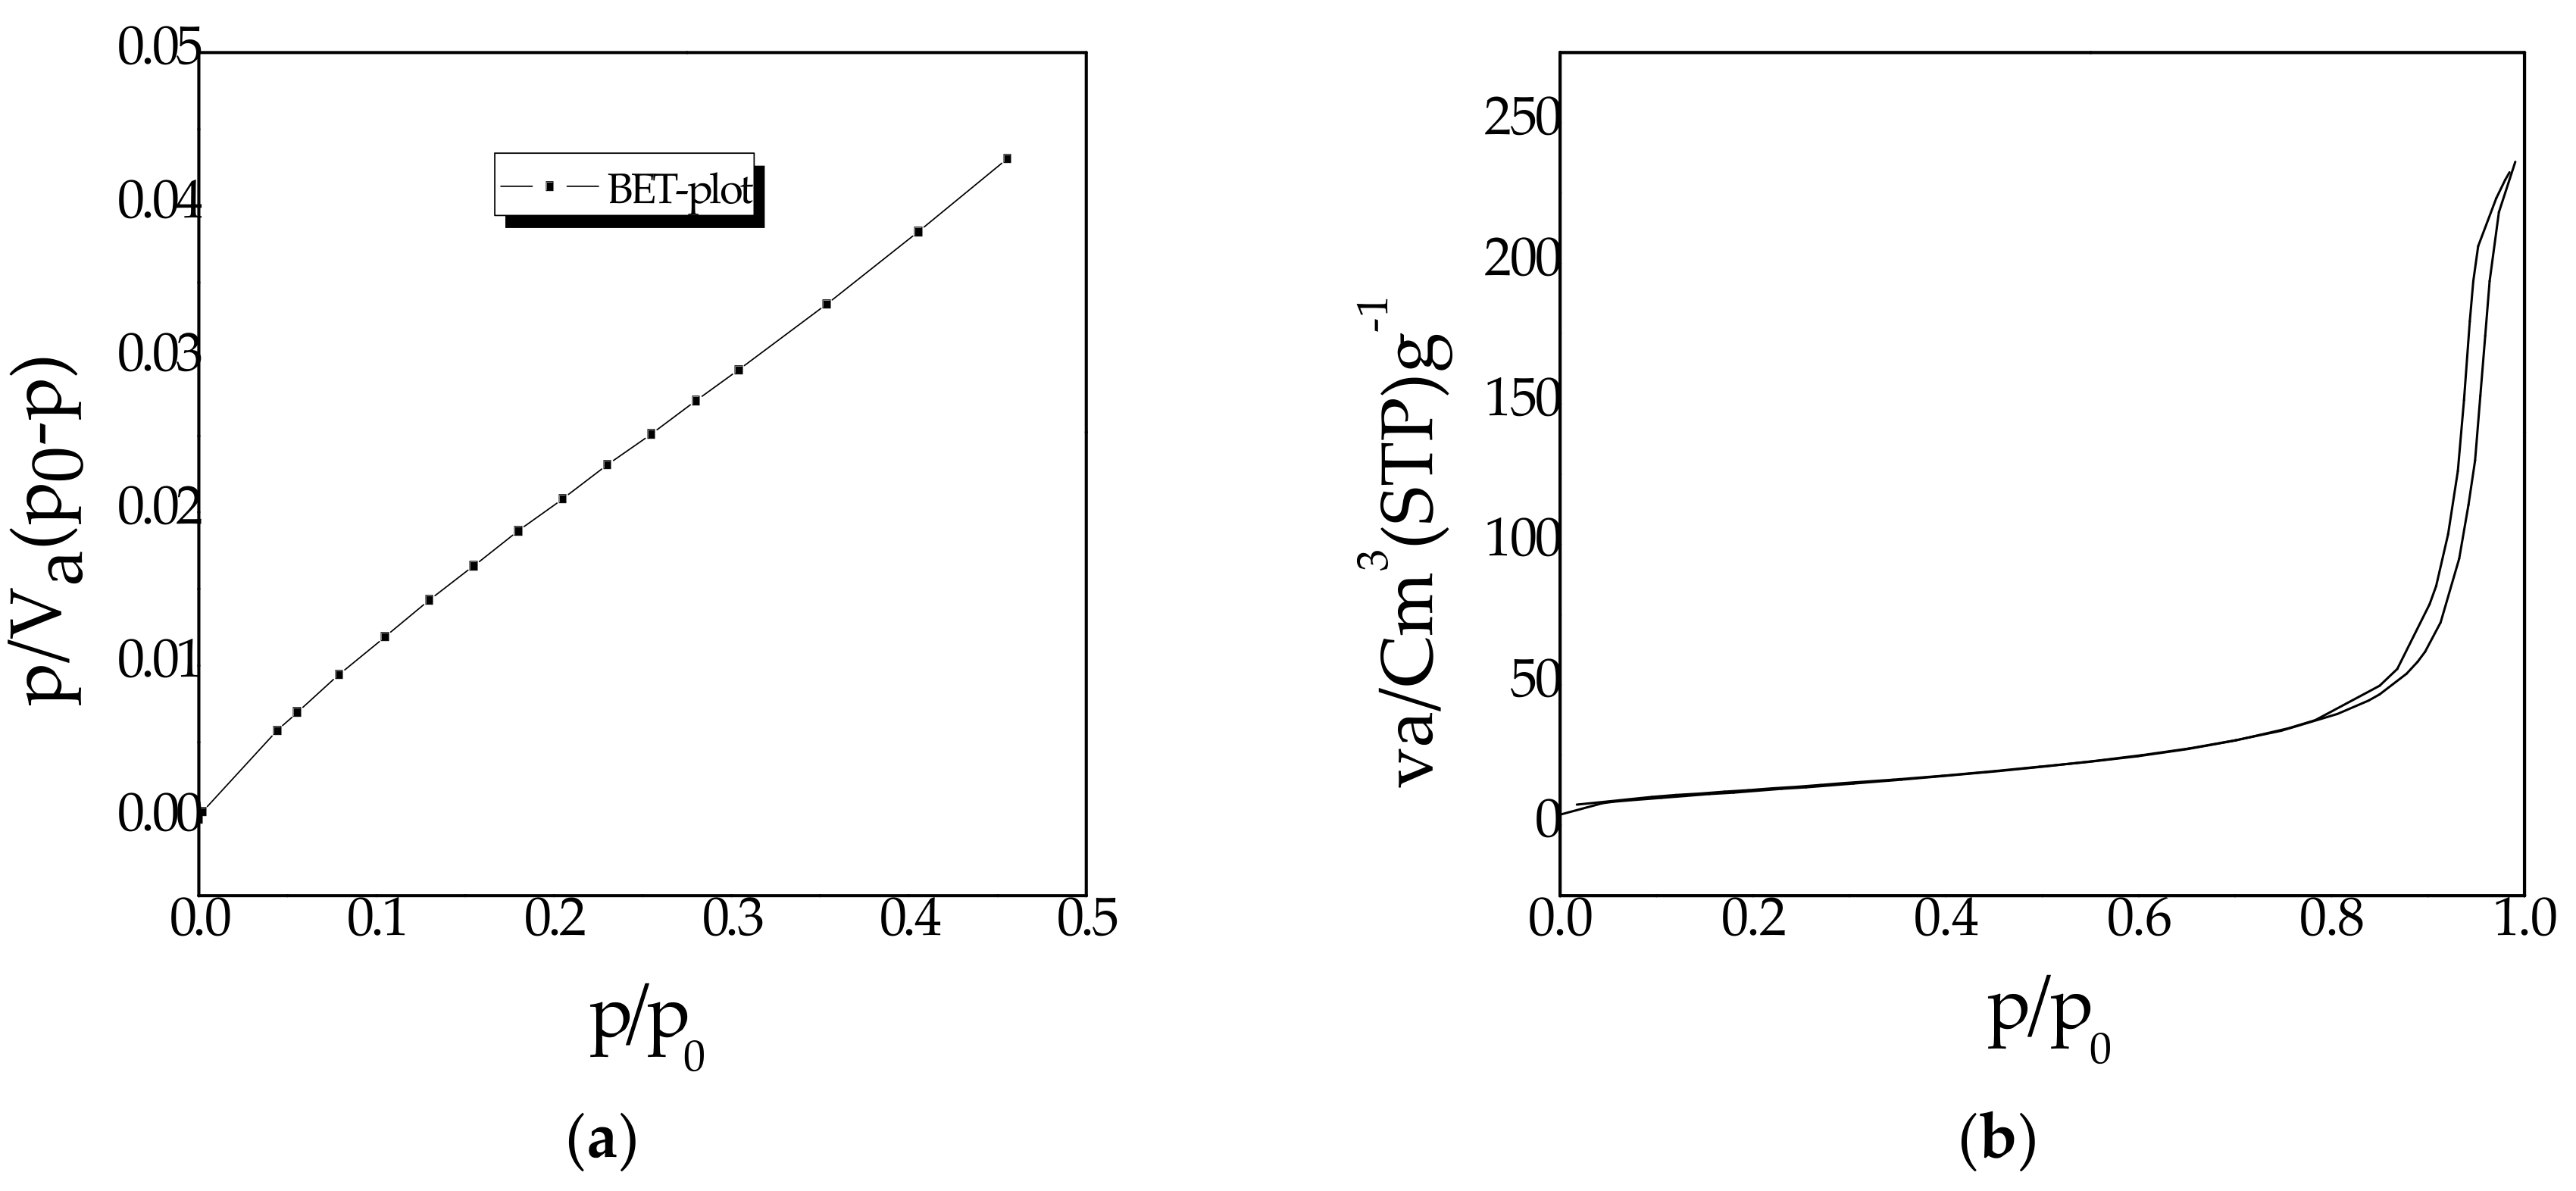
2.2. Surface Area
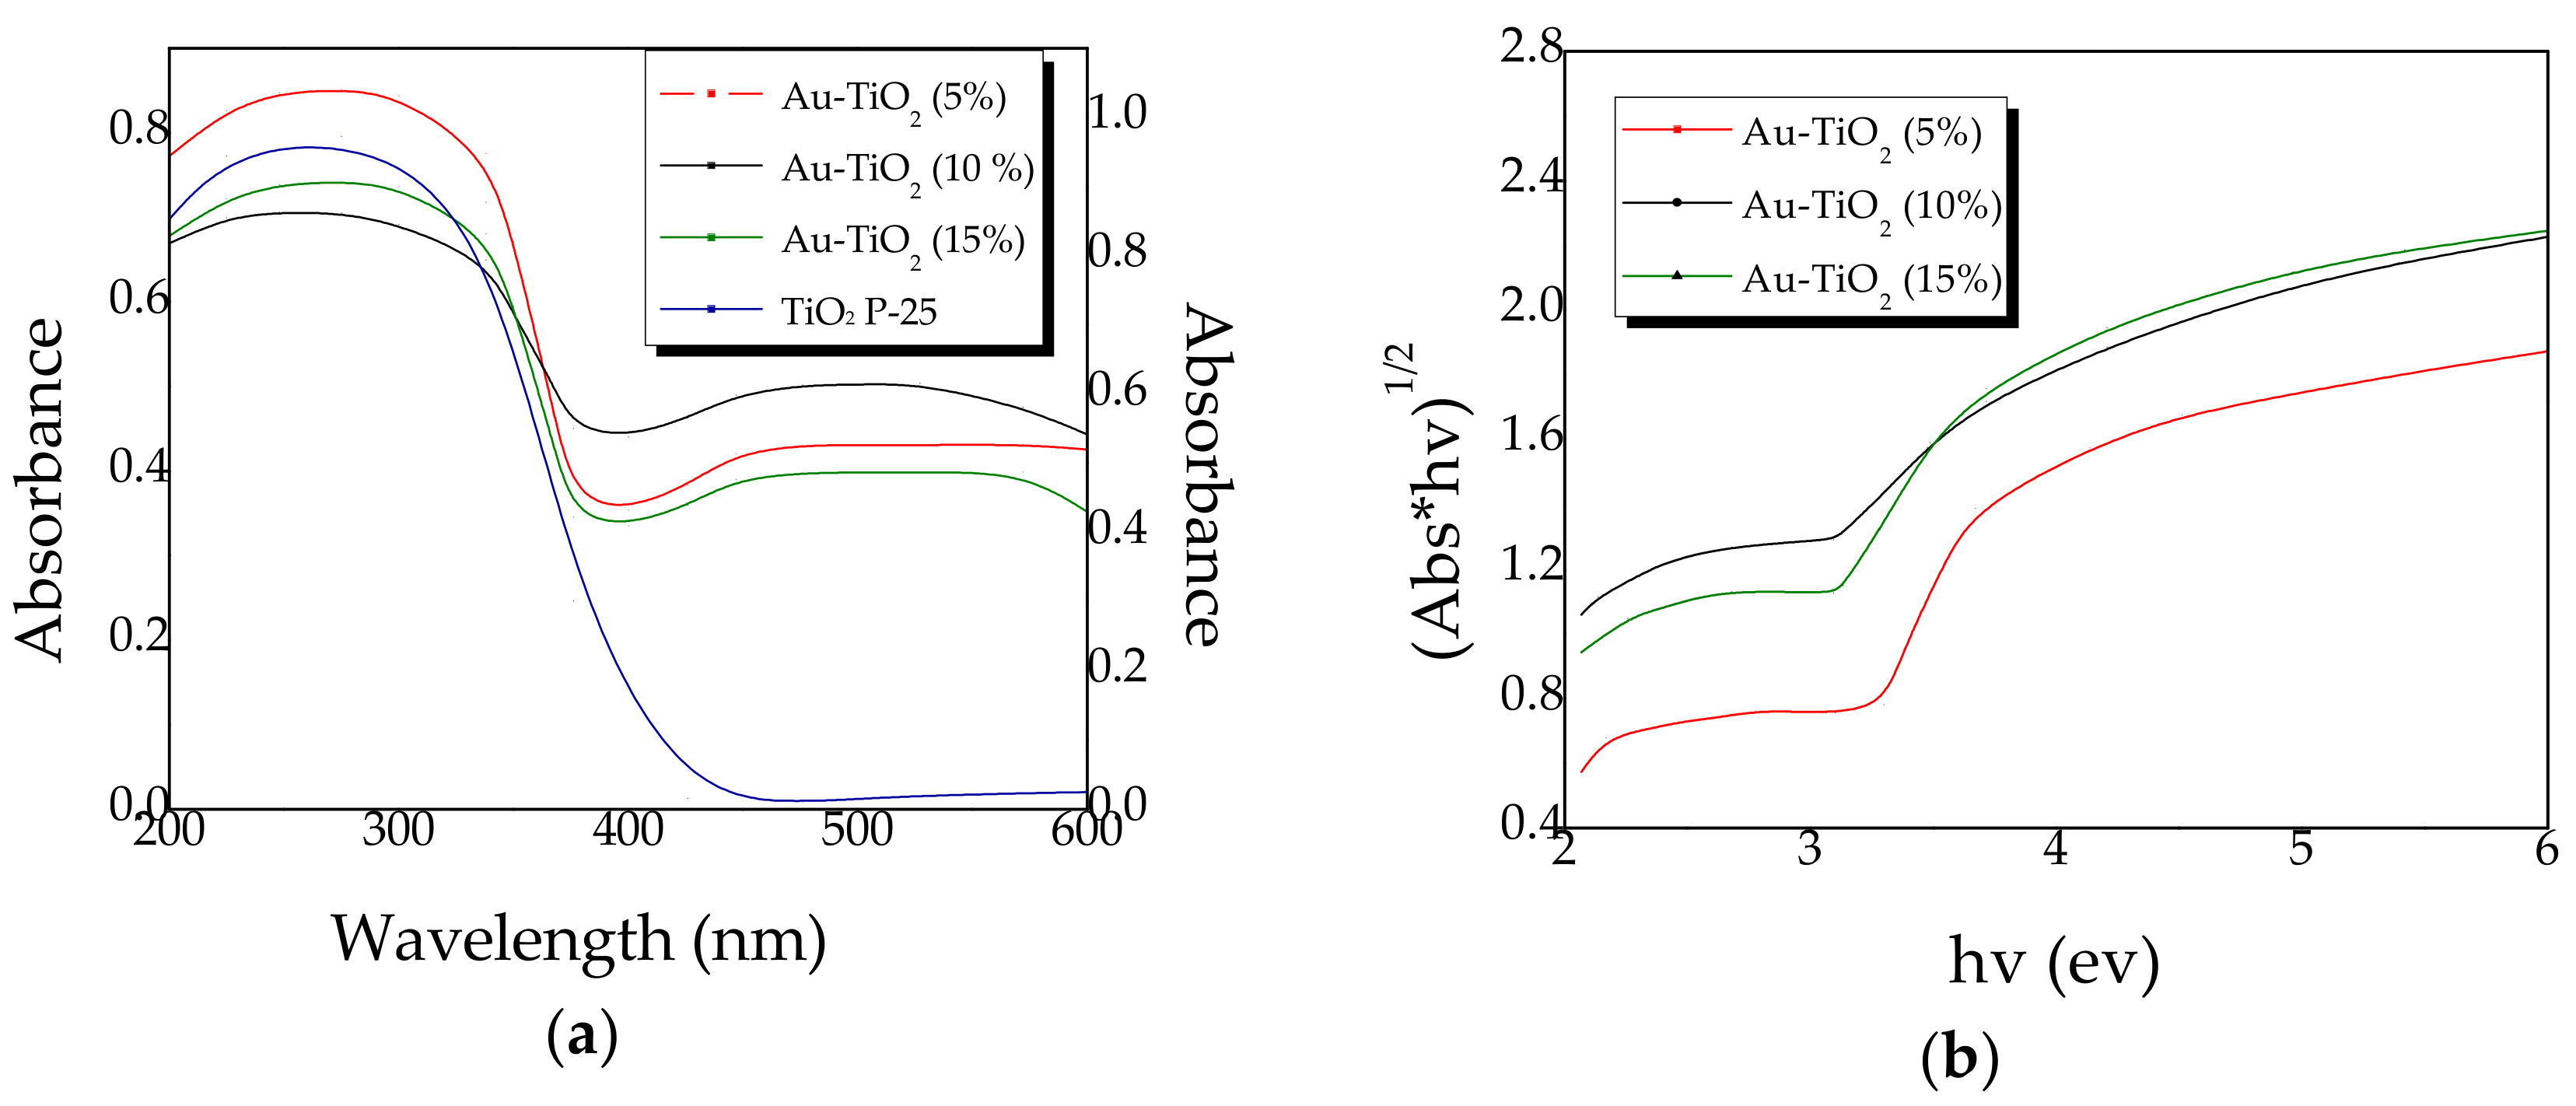
2.3. Diffuse Reflectance
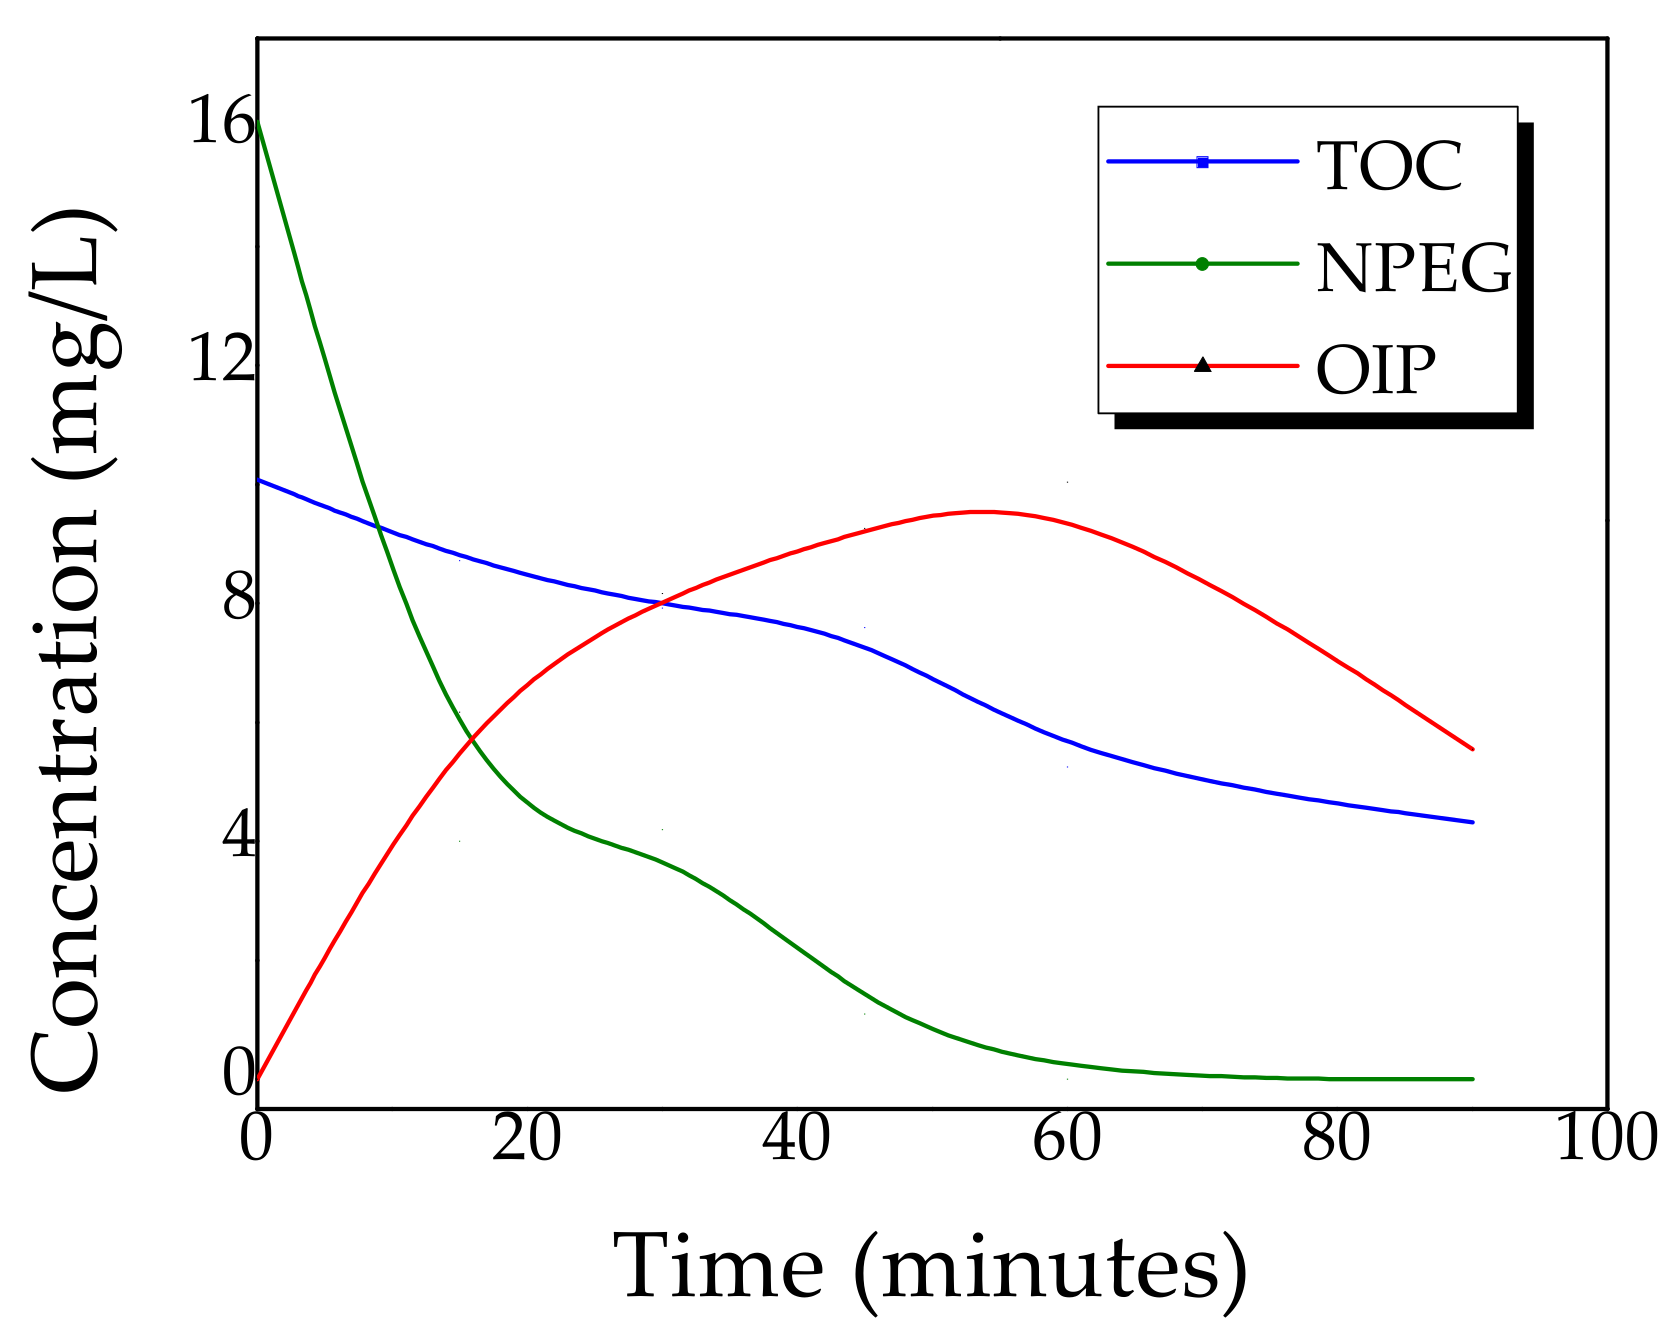
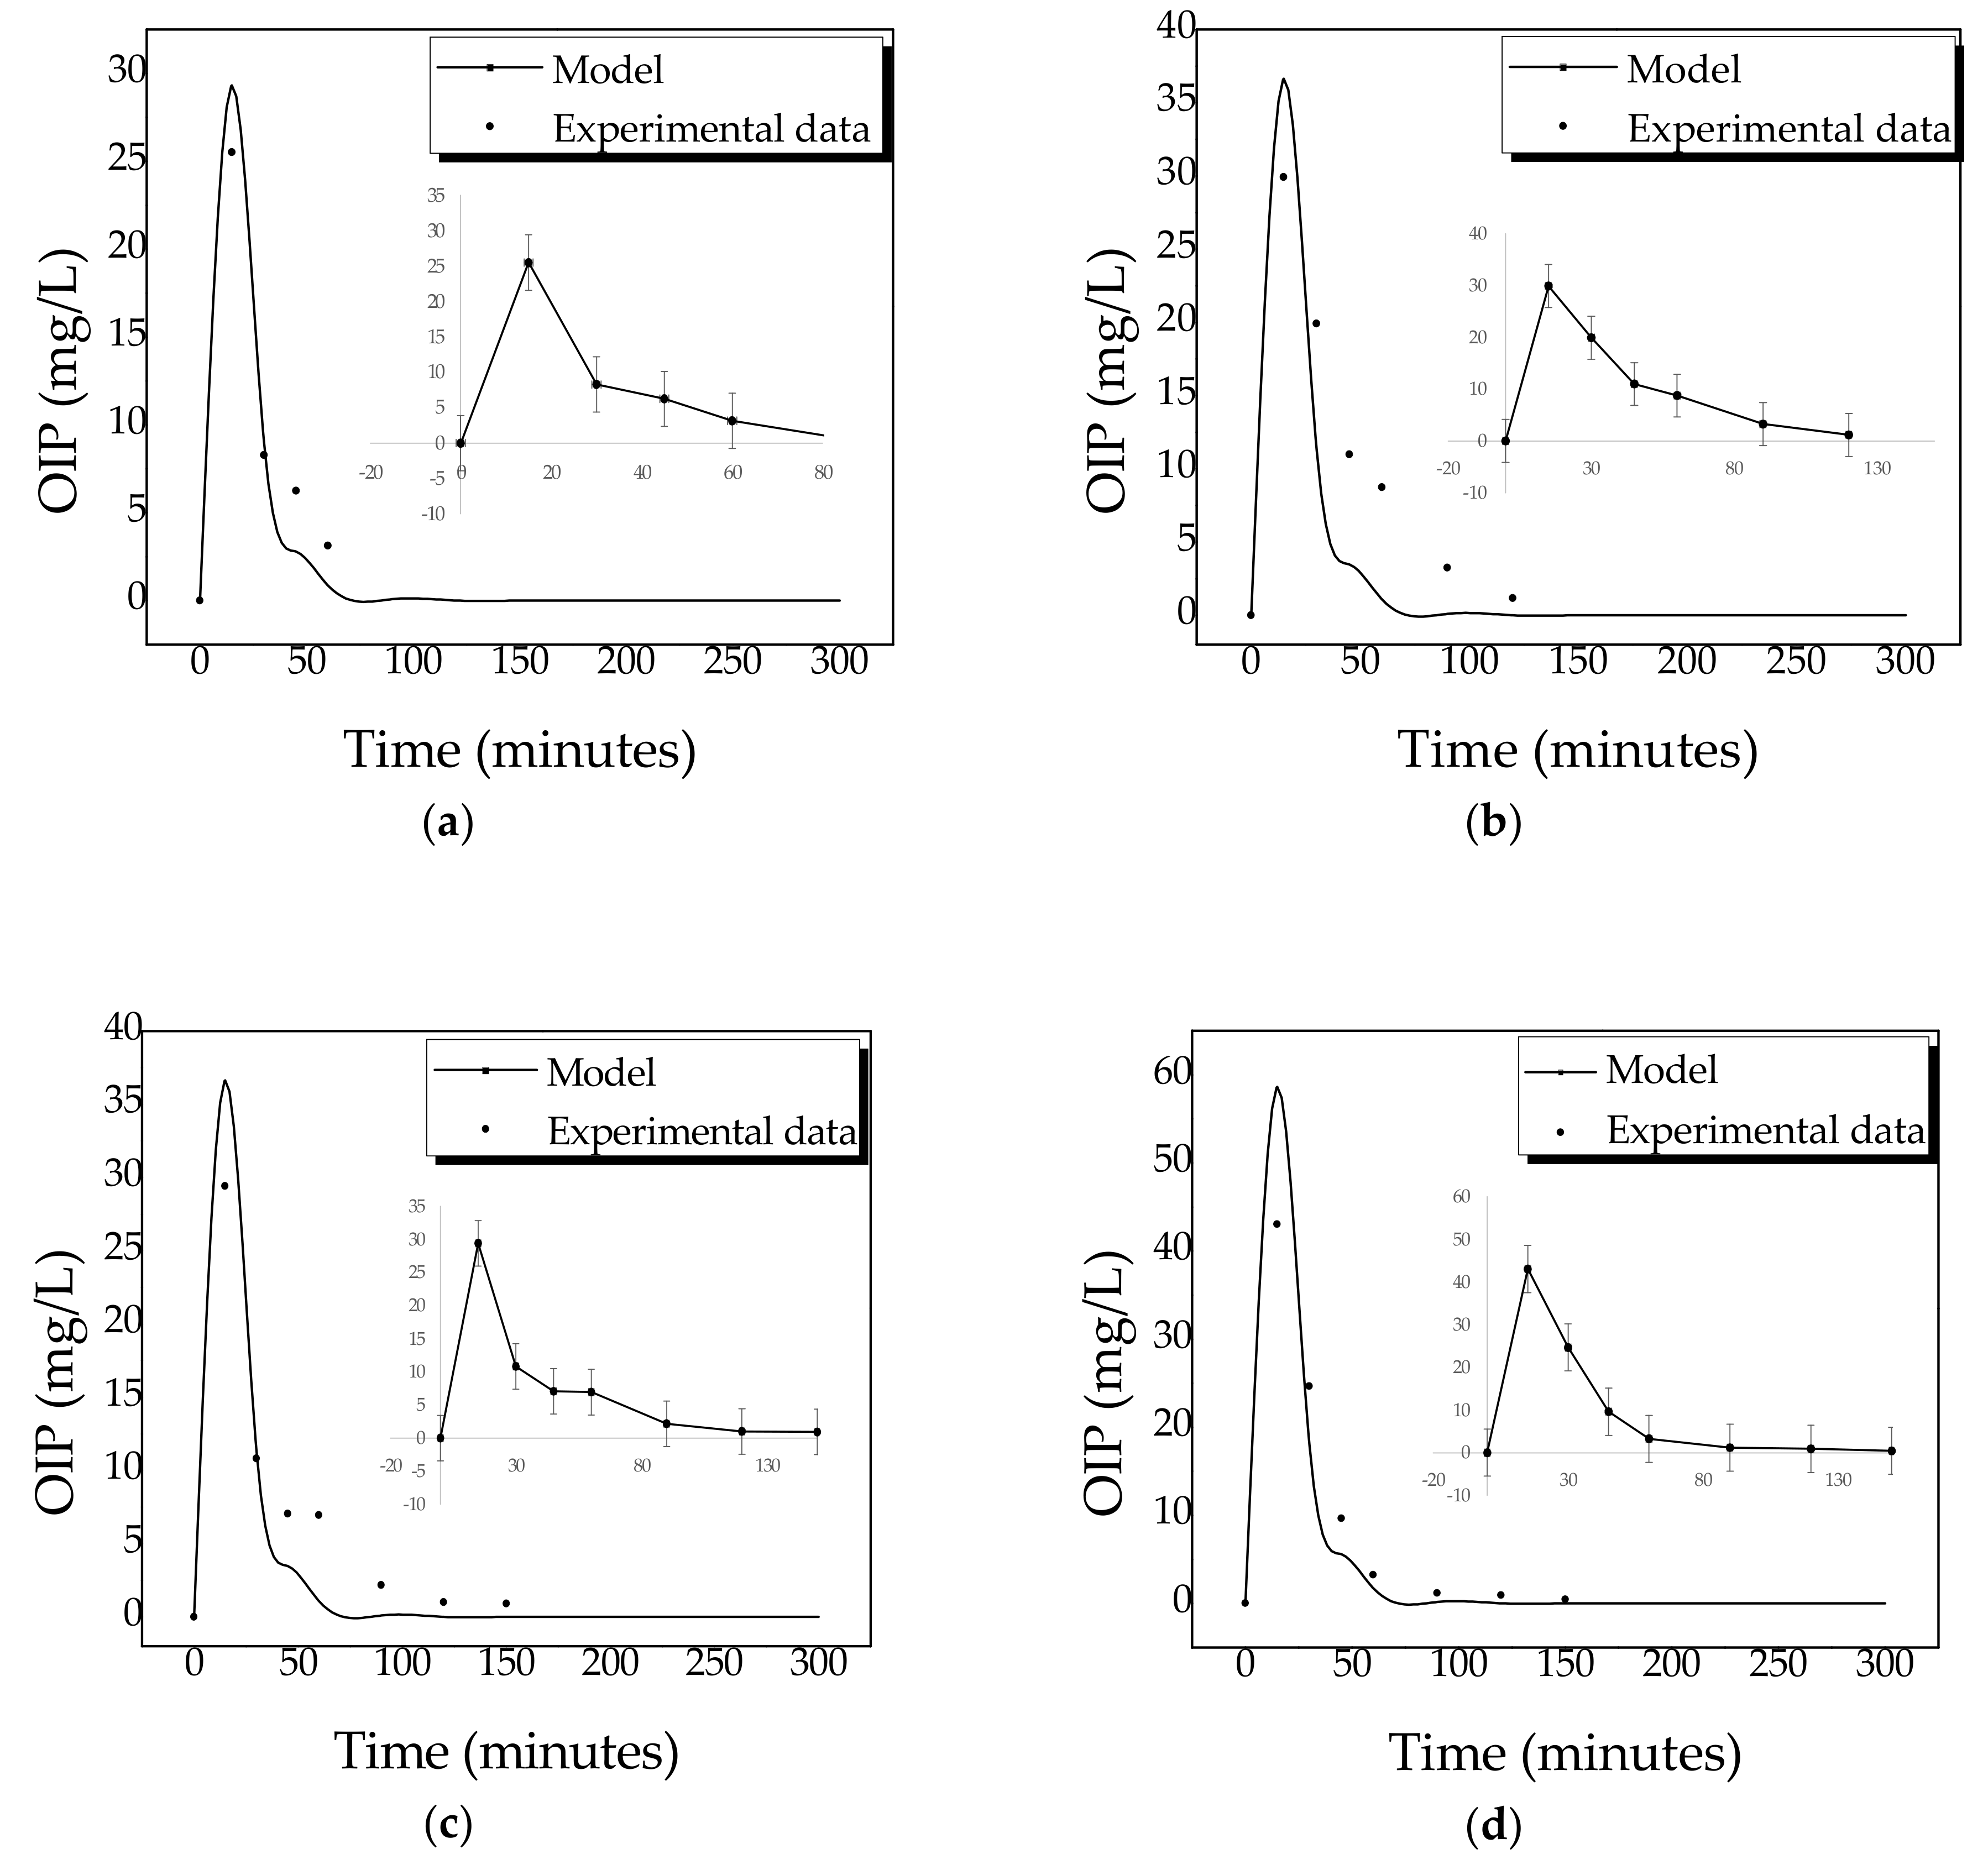
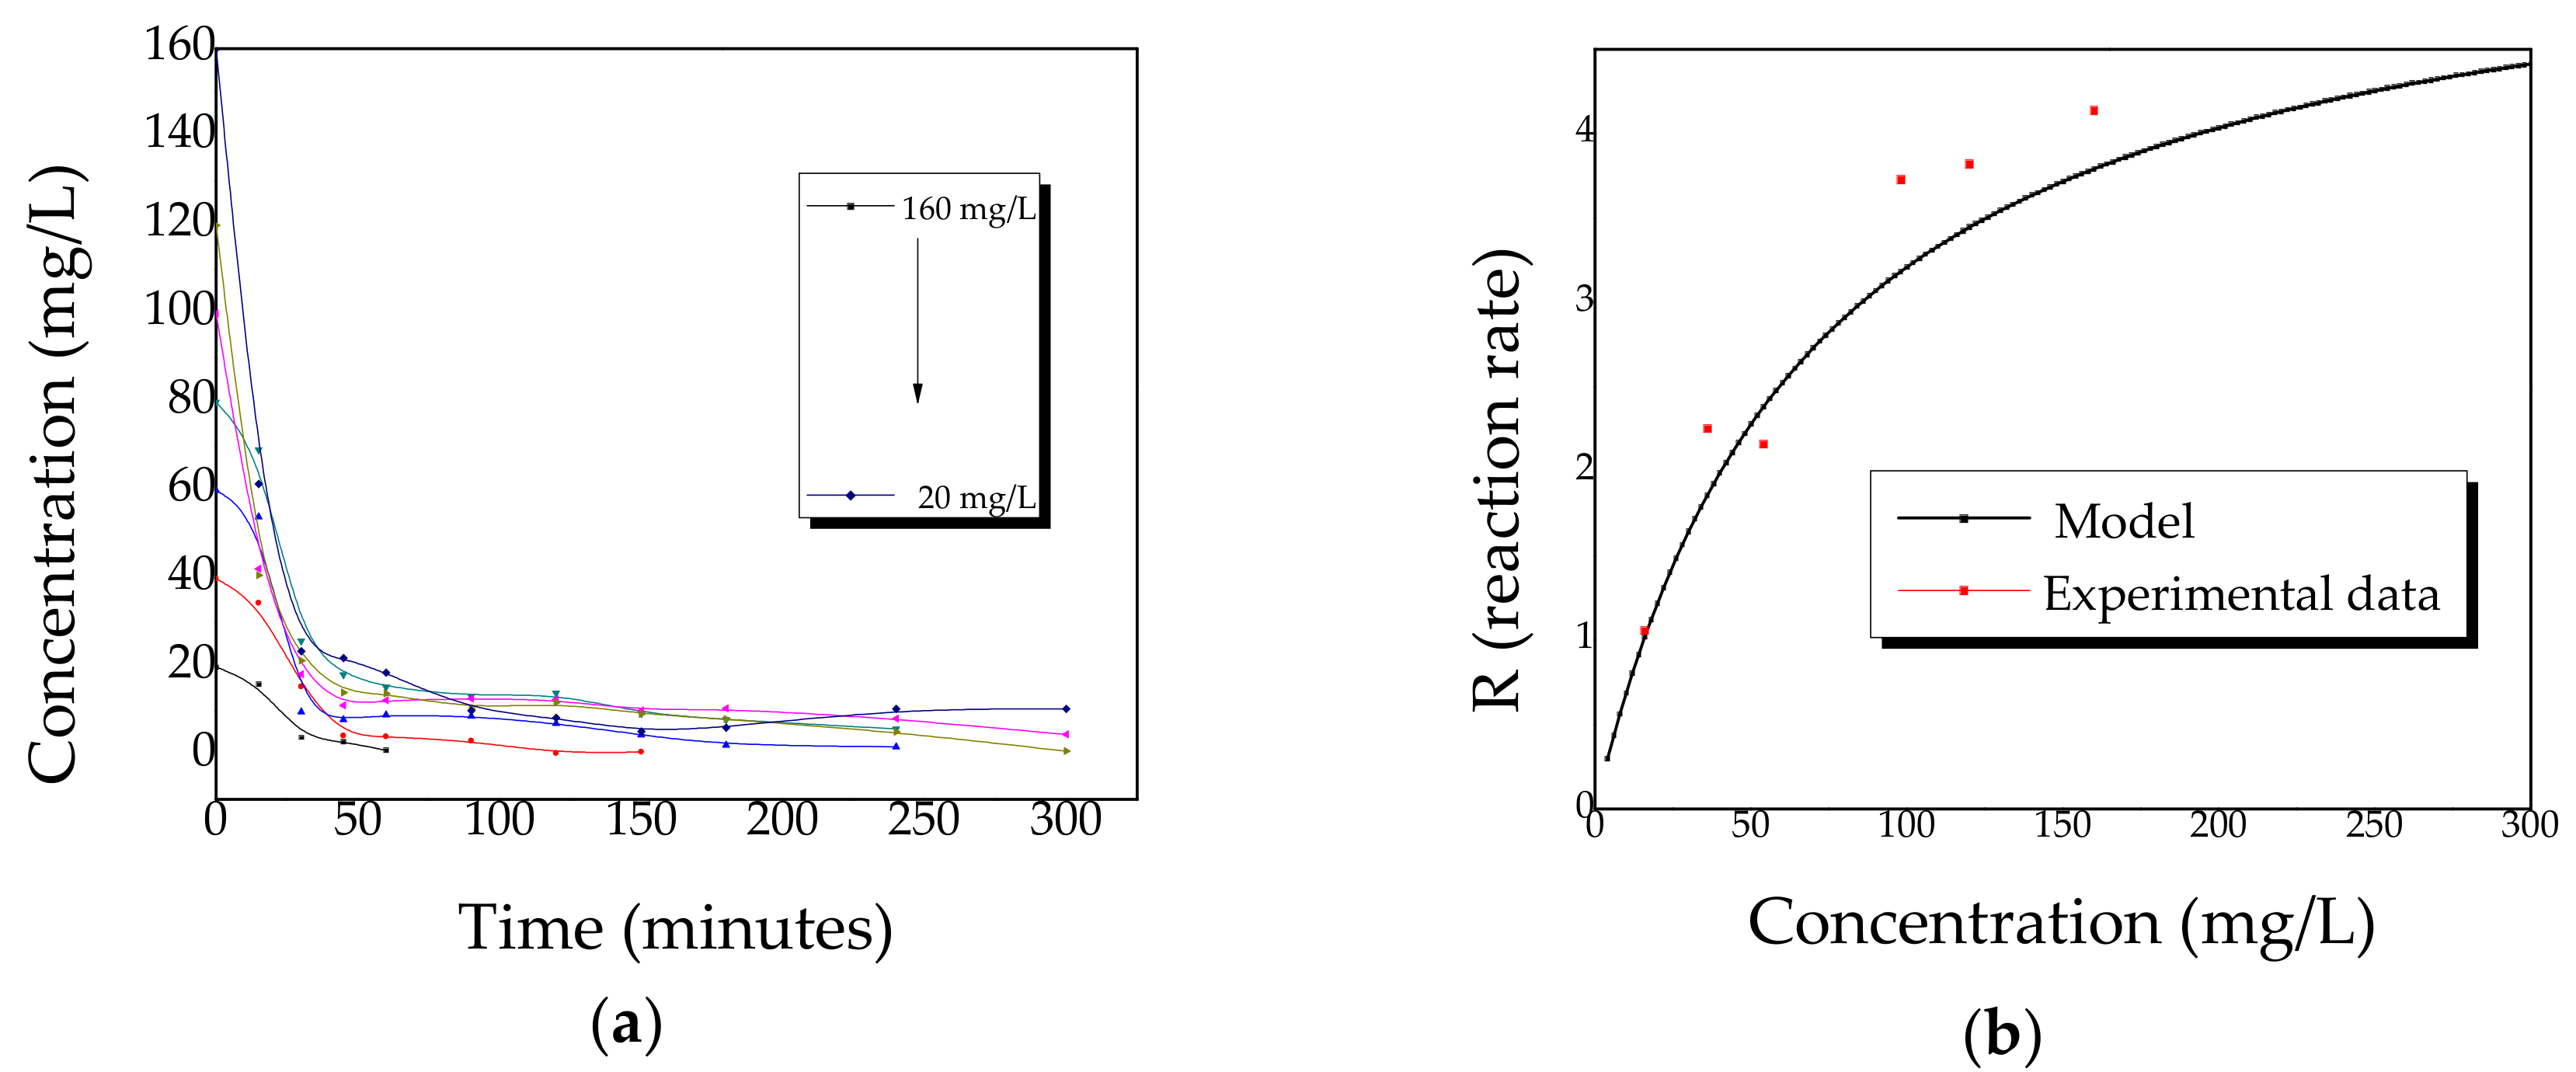
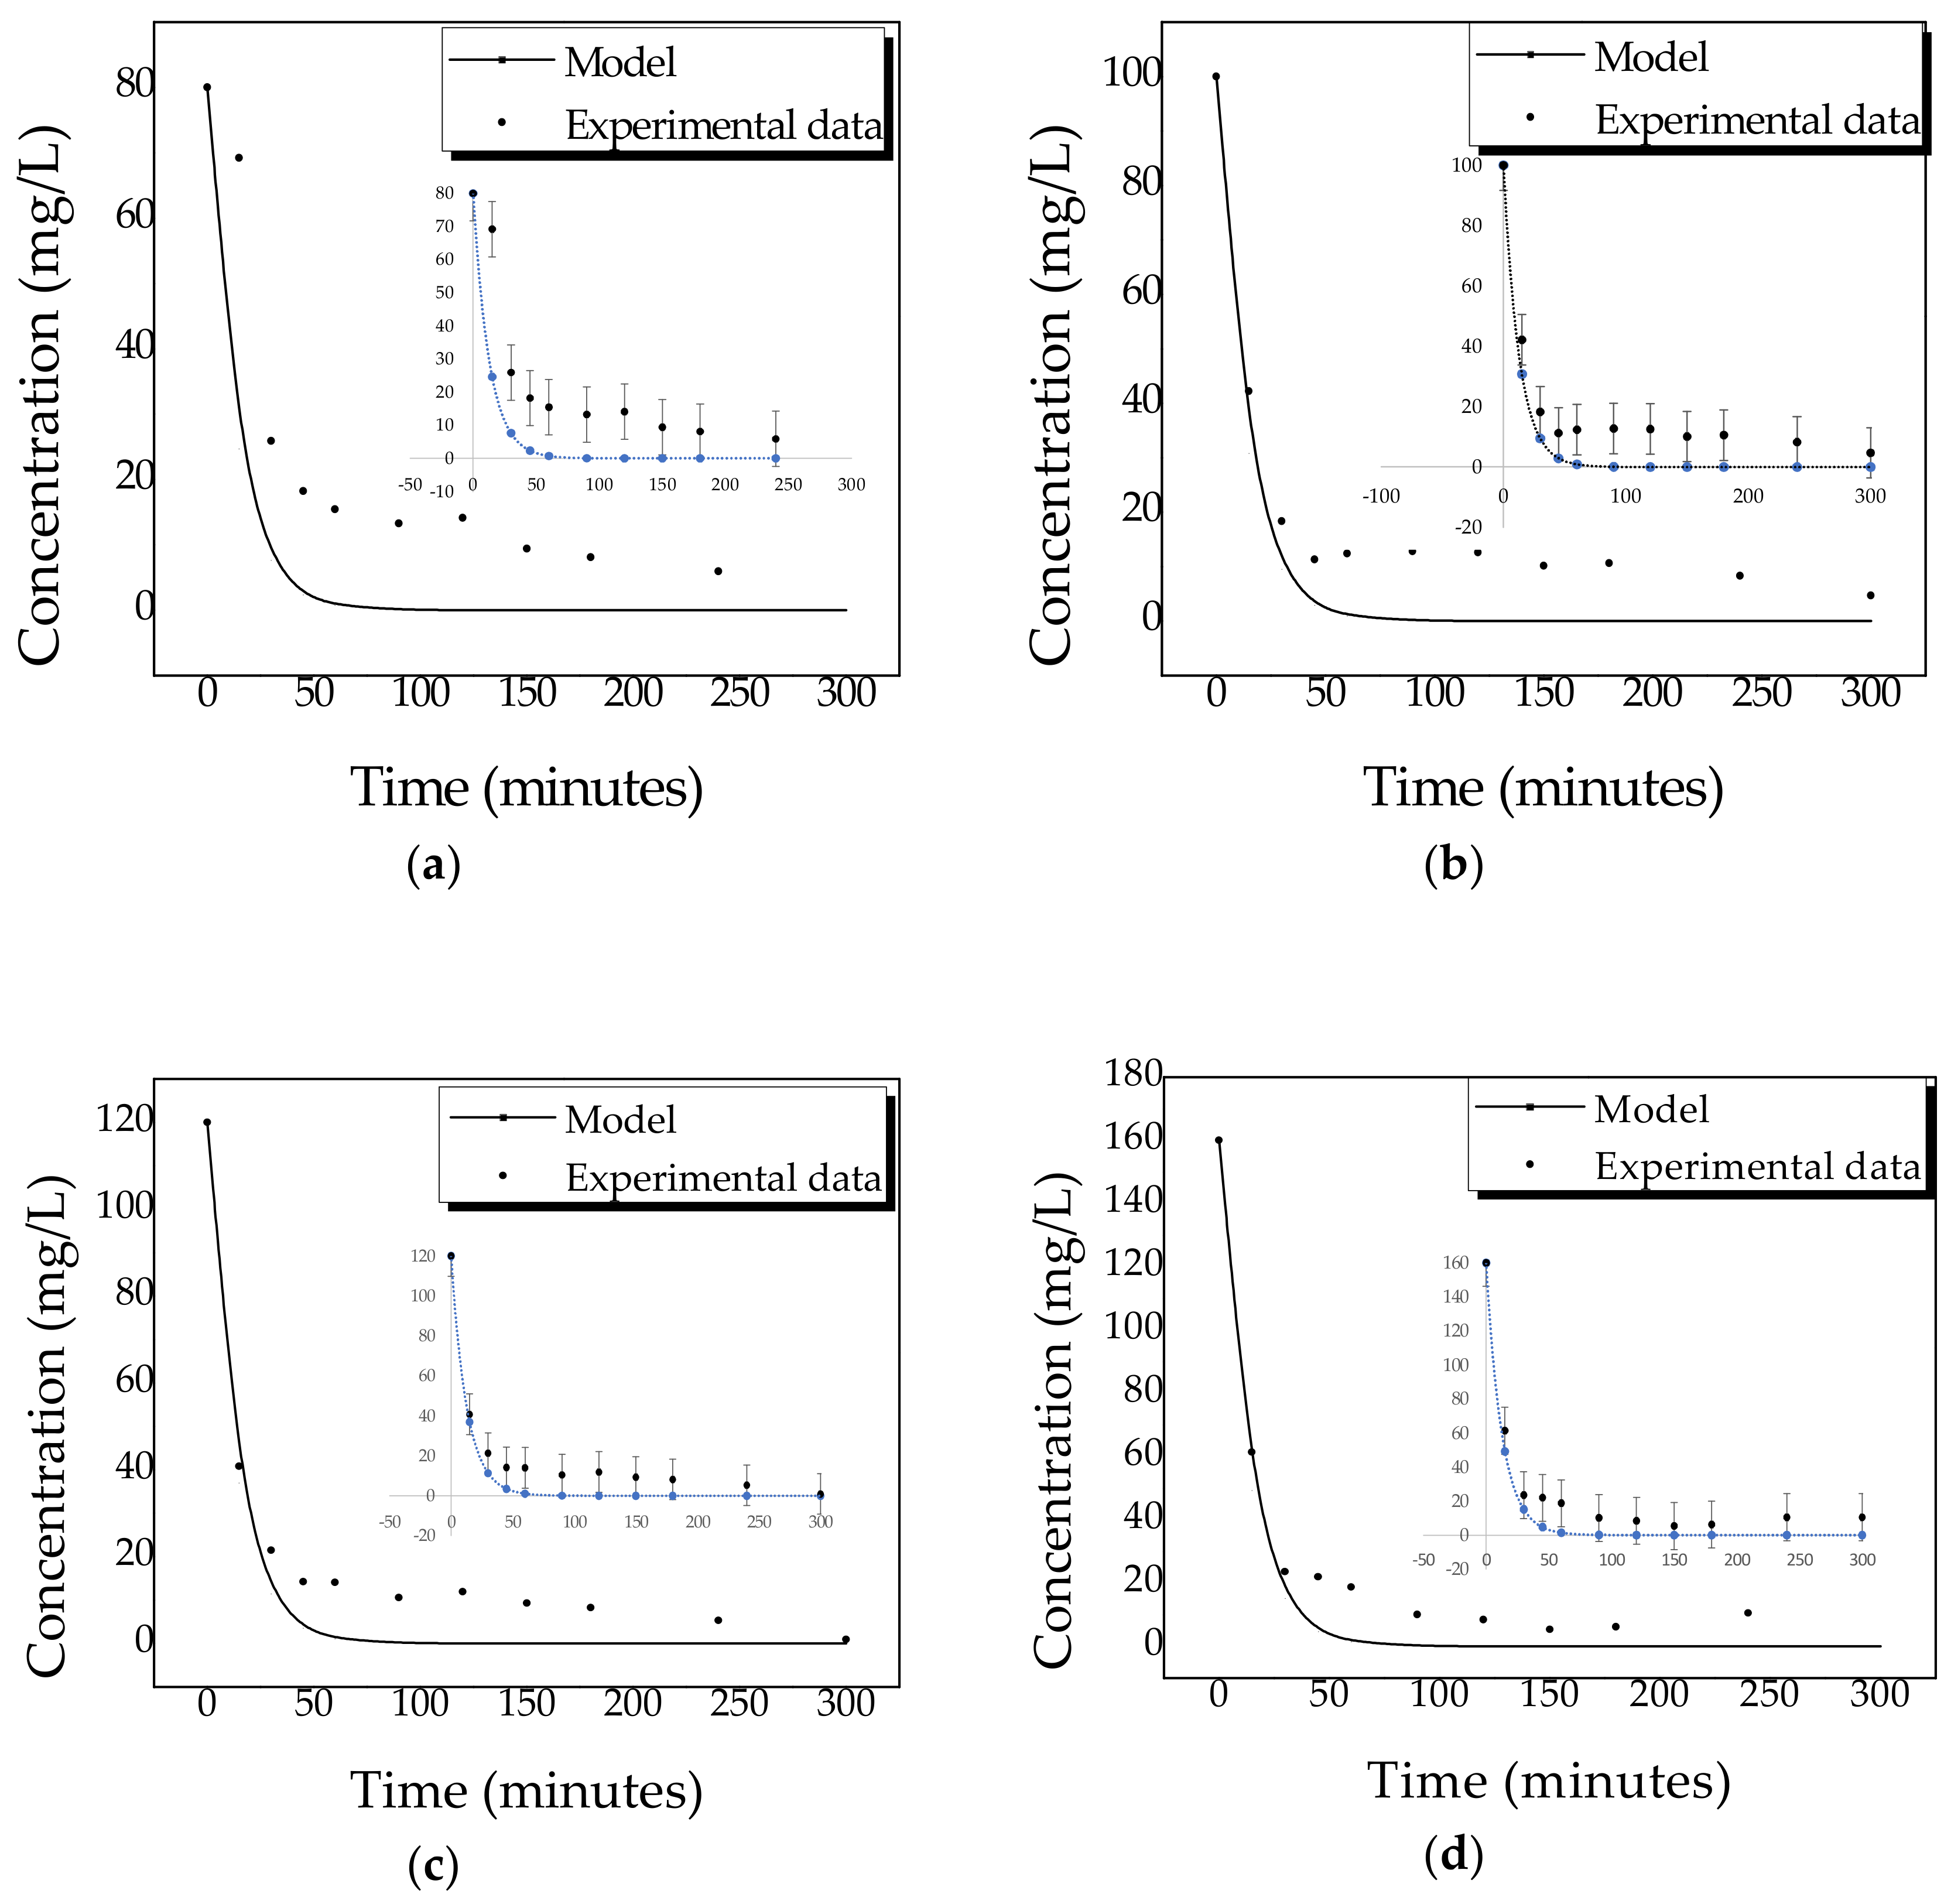
2.4. Kinetics of Photocatalytic Degradation
3. Materials and Methods
4. Conclusions
Author Contributions
Funding
Acknowledgments
Conflicts of Interest
References
- Ebele, A.J.; Mohamed, A.; Elwafa, A.; Stuart, H. Pharmaceuticals, and personal care products (PPCPs) in the freshwater aquatic Environment. Emerg. Contam. 2017, 3, 1–16. [Google Scholar] [CrossRef]
- Diao, P.; Chen, Q.; Wang, R.; Sun, D.; Cai, Z.; Wu, H.; Duan, S. Phenolic endocrine-disrupting compounds in the Pearl River Estuary: Occurrence, bioaccumulation and Risk assessment. Sci. Total Environ. 2019, 584, 1100–1107. [Google Scholar] [CrossRef] [PubMed]
- Huang, B.; Li, X.; Sun, W.; Ren, D.; Li, X.; Liu, Y.; Li, Q.; Pan, X. Occurrence, removal, and fate of progestogens, androgens, estrogens, and phenols in six sewage treatment plants around Dianchi Lake in China. Environ. Sci. Pollut. Res. Int. 2014, 21, 12898–12908. [Google Scholar] [CrossRef] [PubMed]
- Cheng, J.R.; Wang, K.; Yu, J.; Yu, Z.; Zhang, Z. Distribution, and fate modeling of 4-nonylphenol, 4-t-octylphenol, and bisphenol A in the Yong River of China. Chemosphere 2018, 195, 594–605. [Google Scholar] [CrossRef] [PubMed]
- Ying, G.G.; Willians, B.; Kookana, R. Environmental fate of alkylphenols and alkylphenolethoxylates—A review. Environ. Int. 2002, 28, 215–226. [Google Scholar] [CrossRef]
- Priac, A.; Morin-Crini, N.; Druart, C.; Gavoille, S.; Bradu, C.; Lagarrigue, C.; Giangiacomo, G.; Winterton, P.; Crini, G. Alkylphenol and alkylphenol polyethoxylates in water and wastewater: A review of options for their elimination. Arab. J. Chem. 2017, 10, S3749–S3773. [Google Scholar] [CrossRef]
- Chung, J.; Lam, S.M.; Mohamed, A.R.; Lee, K.T. Degrading Endocrine Disrupting Chemicals from Wastewater by TiO2 Photocatalysis: A Review. Int. J. Photoenergy 2012, 2012, 185159. [Google Scholar]
- Philippe, K.K.; Timmers, R.; Grieken, R.V.; Marugan, J. Photocatalytic Disinfection and Removal of Emerging Pollutants from Effluents of Biological Wastewater Treatments, Using a Newly Developed Large-Scale Solar Simulator. Ind. Eng. Chem. Res. 2016, 55, 2952–2958. [Google Scholar] [CrossRef]
- Montalvo, C.; Aguilar, C.A.; Alcocer, R.; Ramírez, M.A.; Córdova, V.A. Semi-Pilot Photocatalytic Rotating Reactor (RFR) with Supported TiO2/Ag Catalysts for Water Treatment. Molecules. 2018, 23, 1–11. [Google Scholar]
- Syrek, K.; Grudzien, J.; Sennik, A.; Brudzisz, A.; Sulka, D. Anodic titanium oxide layers modified with gold, silver, and Cooper Nanoparticles. J. Nanomater. 2019, 2019, 9208734. [Google Scholar] [CrossRef]
- Aguilar, C.A.; Montalvo, C.; Zermeño, B.B.; Cerón, R.M.; Cerón, J.G.; Anguebes, F.; Ramirez, M.A. Photocatalytic degradation of acetaminophen, tergitol and nonylphenol with catalysts TiO2/Ag under UV and Vis light. Int. J. Environ. Sci. Technol. 2018, 16, 843–852. [Google Scholar] [CrossRef]
- Romero, E.; Gutierrez, M.; Mugica, V.; González, L.; Torres, M.; Tzompantzi, F.J.; Tzompantzi, C. Synthesis and characterization of gold nanoparticles on titanium dioxide for the catalytic degradation of 2, 4 dichlorophenoxyaxetic acid. J. Appl. Res. Technol. 2018, 16, 346–356. [Google Scholar]
- Ayati, A.; Ahmadpour, A.; Bamoharram, F.; Tanhaei, B.; Manttari, M.; Sillanpaa, M. Review on catalytic applications of Au/TiO2 nanoparticles in the removal of water pollutant. Chemosphere 2014, 107, 163–174. [Google Scholar] [CrossRef]
- Mondal, S.; Reyes, M.E.; Pal, U. Plasmon induced enhanced photocatalytic activity of gold loaded hydroxyapatite nanoparticles for methylene blue degradation under visible light. RSC Adv. 2017, 7, 8633–8645. [Google Scholar] [CrossRef] [Green Version]
- Sobhana, L.; Sarakha, M.; Prevot, V.; Fardim, O. Layered doublé hidroxides decotared with Au-Pd nanoparticles to photodegradate Orange II from water. Appl. Clay Sci. 2016, 134, 120–127. [Google Scholar] [CrossRef]
- Oros, S.; Pedraza, J.A.; Guzmán, C.; Quintana, M.; Moctezuma, E.; Del angel, G.; Gómez, R.; Pérez, E. Effect of Gold Particle Size and Deposition Method on the Photodegradation of 4-Chlorophenol by Au/TiO2. Top. Catal. 2011, 54, 519–526. [Google Scholar] [CrossRef]
- Dozzi, M.V.; Prati, L.; Canton, P.; Selli, E. Effects of gold nanoparticles deposition on the photocatalytic activity of titanium dioxide under visible light. Phys. Chem. Chem. Phys. 2009, 11, 71–80. [Google Scholar] [CrossRef]
- Kamat, P. Photophysical, Photochemical and Photocatalytic Aspects of Metal Nanoparticles. J. Phys. Chem. B. 2002, 106, 7729–7744. [Google Scholar] [CrossRef]
- Jacob, M.; Levanon, H.; Kamat, P.V. Charge distribution between UV-irradiated TiO2 and gold nanoparticles: Determination of shift in the Fermi level. Nanoletters 2003, 3, 353–358. [Google Scholar] [CrossRef]
- Subramanian, V.; Wolf, E.E.; Kamat, P.V. Catalysis with TiO2/gold nanocomposites. Effect of metal particle size on the Fermi level equilibration. J. Am. Chem. Soc. 2004, 126, 4943–4950. [Google Scholar] [CrossRef]
- Loddo, V.; Bellardita, M.; Camera-Roda, G.; Parrino, F.; Palmisano, L. Heterogeneous Photocatalysis: A Promising Advanced Oxidation Process. In Current Trends and Future Developments on (Bio-) Membranes; Elsevier: Palermo, Italy, 2018. [Google Scholar] [CrossRef]
- Aguilar, C.; Abatal, M.; Montalvo, C.; Anguebes, F.; Ramírez, M.A.; Cantú, D. Removal of an Ethoxylated Alkylphenol by Adsorption on Zeolites and Photocatalysis with TiO2/Ag. Processes 2019, 7, 1–15. [Google Scholar]
- Salomon, K.Y.; Huberson, N.G.; Sylvain, A.K. Nonylphenol and Its Ethoxylates in Water Environment. J. Geogr. Environ. Earth Sci. 2019, 23, 1–14. [Google Scholar] [CrossRef]
- Chen, L.; Zhou, H.Y.; Deng, Q.Y. Photolysis of nonylphenol ethoxylates: The determination of the degradation kinetics and the intermediate products. Chemosphere 2007, 68, 354–359. [Google Scholar] [CrossRef] [PubMed]
- Behpour, M.; Ghoreishi, S.M.; Razavi, S. Photocatalytic activity of TiO2/Ag nanoparticle on degradation of water pollutions. Dig. J. Nanomater. Biostruct. 2010, 5, 467–475. [Google Scholar]
- Haugen, A.B.; Kumakiri, I.; Simon, C. TiO2, TiO2/Ag and TiO2/Au photocatalysts prepared by spray pyrolysis. J. Eur. Ceram. Soc. 2011, 31, 291–298. [Google Scholar] [CrossRef]
- Tian, B.; Zhang, J.; Tong, T.; Chen, F. Preparation of Au/TiO2 catalysts from Au(I)–thiosulfate complex and study of their photocatalytic activity for the degradation of methyl orange. Appl. Catal. B Environ. 2008, 79, 394–401. [Google Scholar] [CrossRef]


| Catalyst | Elements in Wt (%) | ||
|---|---|---|---|
| O2 | Ti | Au | |
| Au-TiO2 (5%) | 43.52 | 53.86 | 2.62 |
| Au-TiO2 (10%) | 44.77 | 49.83 | 5.40 |
| Au-TiO2 (15%) | 43.85 | 43.40 | 12.75 |
| Catalyst | Eg (ev) |
|---|---|
| Au-TiO2 at 5% | 2.9 |
| Au-TiO2 at 10% | 2.9 |
| Au-TiO2 at 15% | 2.9 |
| TiO2 P-25 | 3.1 |
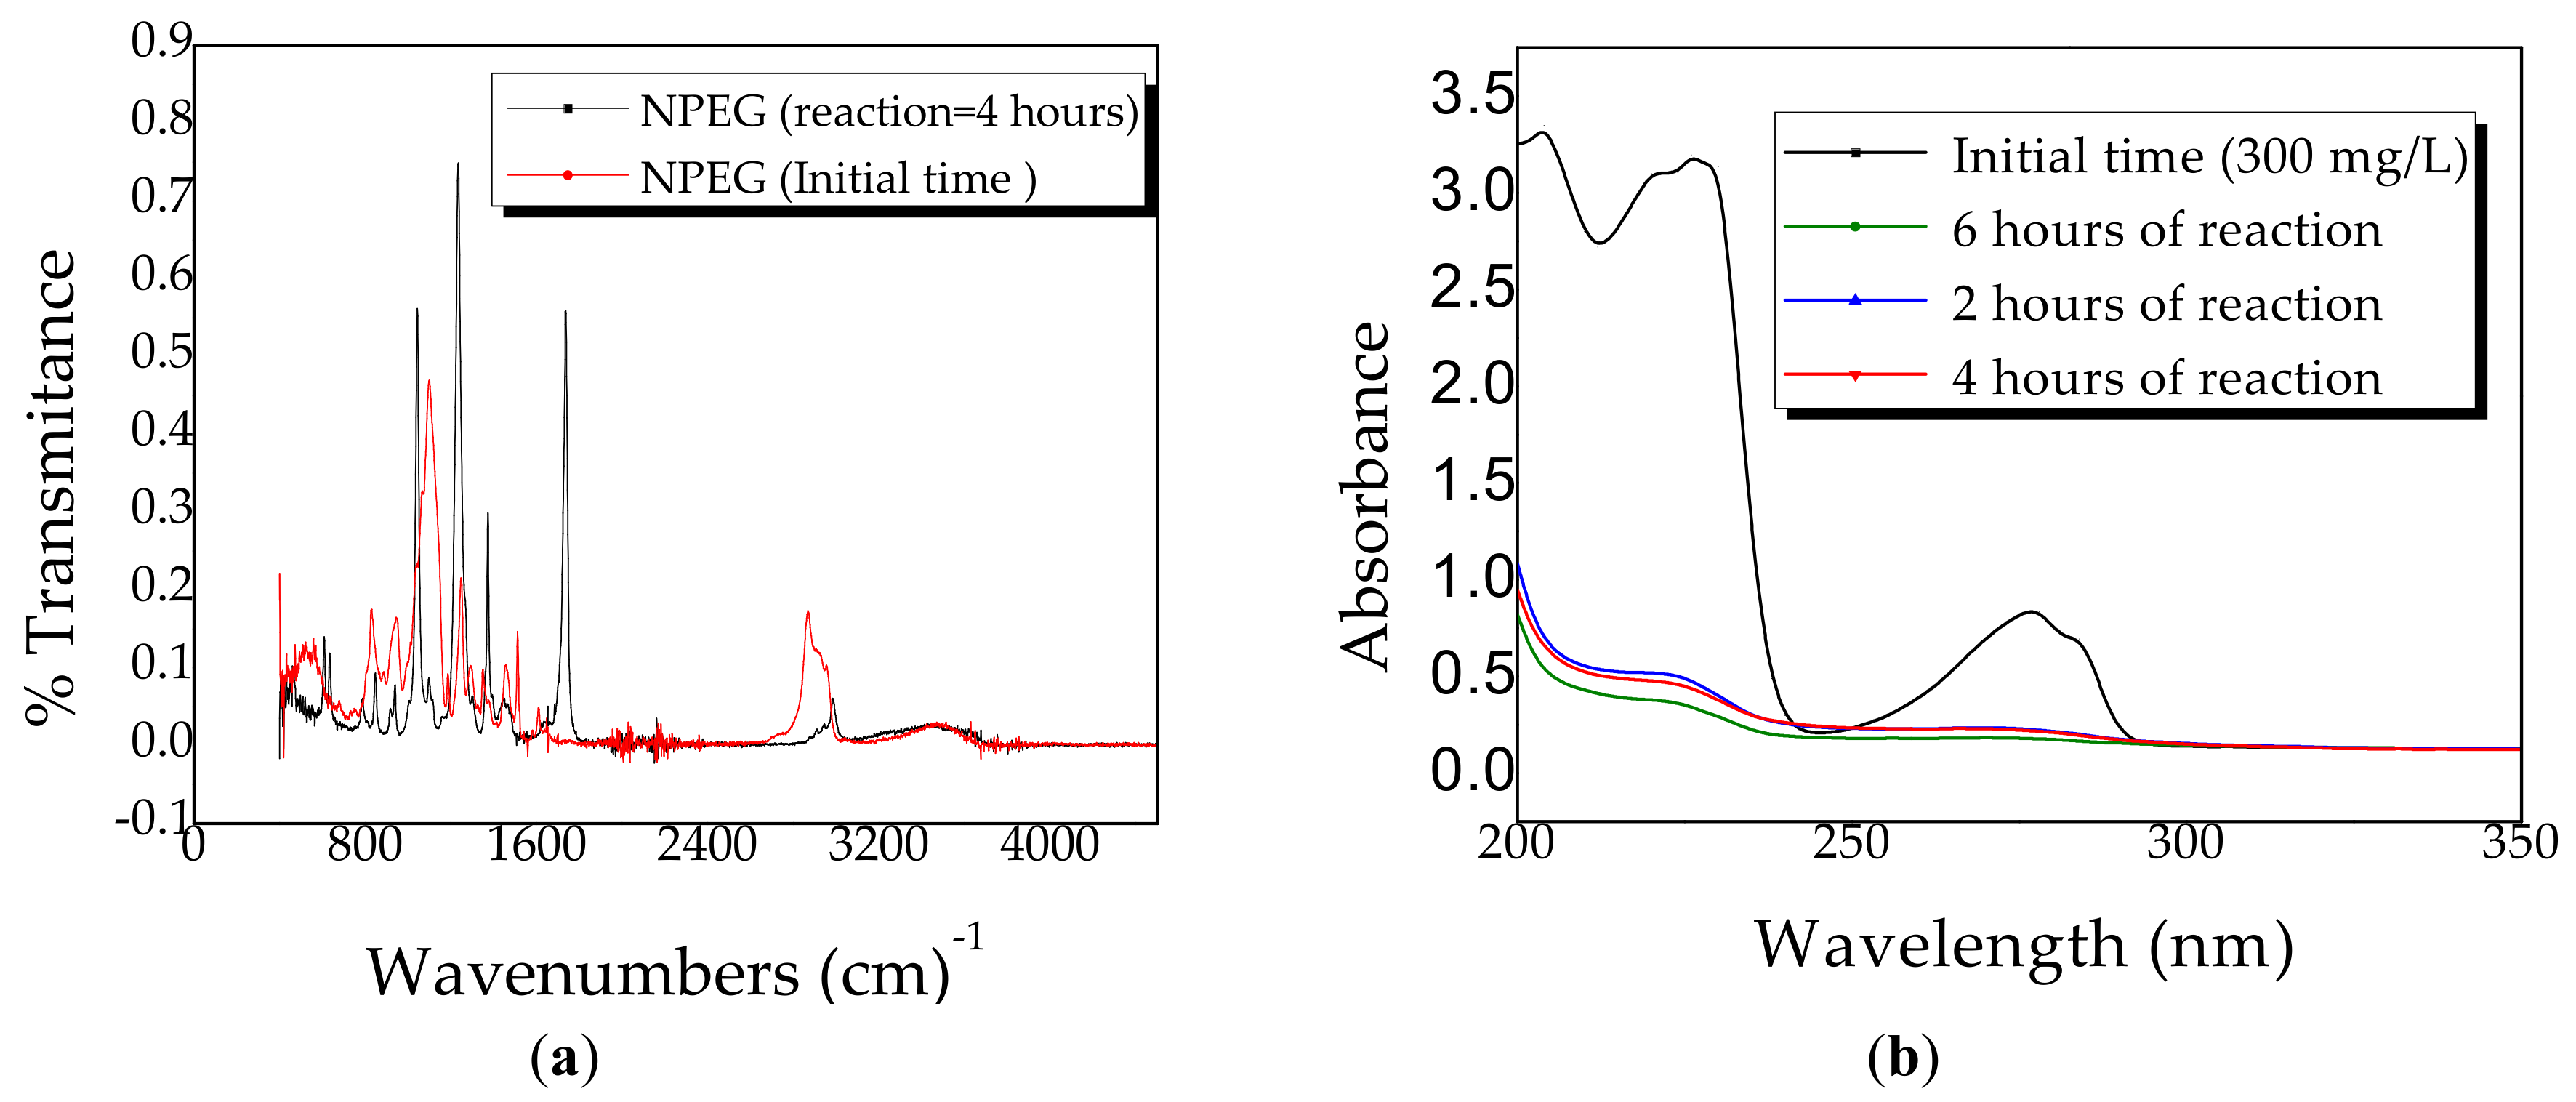
| Wavenumber (cm−1) | Functional Group |
|---|---|
| 835 | Aromatic for disubstituted |
| 11,021,189 | R-OH |
| 1250 | C-O-R |
| 1350 | R-OH |
| 1450–2000 | Aromatic ring |
| 2875–2961 | C-H |
| 3200–3650 | R-OH |
Publisher’s Note: MDPI stays neutral with regard to jurisdictional claims in published maps and institutional affiliations. |
© 2020 by the authors. Licensee MDPI, Basel, Switzerland. This article is an open access article distributed under the terms and conditions of the Creative Commons Attribution (CC BY) license (http://creativecommons.org/licenses/by/4.0/).
Share and Cite
Aguilar, C.; Garcia, M.; Montalvo, C.; Anguebes, F.; Moctezuma, E.; Abatal, M.; Figueroa, S. Removal of Nonylphenol Polyethylene Glycol (NPEG) with Au-TiO2 Catalysts: Kinetic and Initial Transformation Path. Catalysts 2020, 10, 1205. https://doi.org/10.3390/catal10101205
Aguilar C, Garcia M, Montalvo C, Anguebes F, Moctezuma E, Abatal M, Figueroa S. Removal of Nonylphenol Polyethylene Glycol (NPEG) with Au-TiO2 Catalysts: Kinetic and Initial Transformation Path. Catalysts. 2020; 10(10):1205. https://doi.org/10.3390/catal10101205
Chicago/Turabian StyleAguilar, Claudia, Mayra Garcia, Carlos Montalvo, Francisco Anguebes, Edgar Moctezuma, Mohamed Abatal, and Sandra Figueroa. 2020. "Removal of Nonylphenol Polyethylene Glycol (NPEG) with Au-TiO2 Catalysts: Kinetic and Initial Transformation Path" Catalysts 10, no. 10: 1205. https://doi.org/10.3390/catal10101205