Perceptions of Farm Size Heterogeneity and Demand for Group Index Insurance


1
Department of Economics, California Polytechnic University, Pomona, CA 91768, USA
2
International Research Institute for Climate and Society, Columbia University, Palisades, NY 10964, USA
3
Department of Earth and Environment, Boston University, Boston, MA 02215, USA
*
Author to whom correspondence should be addressed.
Games 2020, 11(1), 15; https://doi.org/10.3390/g11010015
Submission received: 19 December 2019
/
Revised: 3 March 2020
/
Accepted: 5 March 2020
/
Published: 11 March 2020
Abstract
:Weather insurance is a financial instrument proposed to increase coverage of unprotected weather shocks in developing countries. Structuring sales as group-based products has been argued as a strategy to increase the attractiveness of index insurance, raising the question as to what impacts farmer demand for group insurance choices. We test if farmers prefer to purchase real-world insurance products as groups, and if groups of more similar individuals are more likely to demand group over individual index insurance for the upcoming season. We exogenously assign farmers into groups of similar versus dissimilar perceived farm size. We find that farmers, when offered, prefer group over individual insurance contracts, and that groups of farmers who perceive each other to be more similar in farm size are more likely to purchase in a group, but purchase less insurance on average.
JEL Classification:
D91; O12; D71; Q1401. Introduction
Farmers in the developing world face severe weather shocks, which are difficult to insure without formal insurance markets. This is particularly true when farmers face common or covariate shocks, such as drought. Informal risk sharing, where farmers make indirect transfers, can help insure idiosyncratic shocks, but is rarely sufficient to insure farmers against aggregate (covariate) shocks. This is because, if all members of a network experience a covariate shock, then they will all require support precisely at a time that fellow farmers cannot provide it. Traditional crop insurance can cover covariate risks, but is costly to verify and is subject to moral hazard. Weather-based index insurance, which pays out when rainfall falls below a threshold, reduces transaction costs as each farmer’s loss does not need to be verified. In this way, index insurance is typically more accurate to administer and cost effective at indemnification of covariate shocks.
There is considerable literature studying the impacts and issues in providing index insurance. In addition to its immediate goal of shielding farmers from drought, index insurance also helps farmers escape poverty traps, and, therefore, is a useful financial instrument for economic development. Cai et al. [1] show that uptake of index insurance increases borrowing and crop production. Similarly, Cole et al. [2] and Karlan et al. [3] both find that offering index insurance causes more farmers to shift production toward higher-return and higher-risk cash crops. However, even with positive impacts, the demand for index insurance has been variable. The literature points to both market and non-market features that can affect uptake. First, as with any financial instrument, the structuring and framing of index insurance contracts are important. Norton et al. [4] find stronger demand for lower premium contracts with a higher frequency of payouts and Cai [5] shows that offering multiple contract options increases demand, particularly for lower premium options.
The presence of basis risk is also an important factor in the demand for index insurance [6,7,8]. Basis risk occurs when index measurements do not reflect farmers’ actual losses. This can occur because the loss was the result of something other than rainfall (e.g., pest infestation), or because the aggregate satellite measurements do not reflect the heterogeneity in weather patterns that farmers experience. That is because satellites can only produce an average measure of drought, and, therefore, mask weather nuances experienced by any one particular farmer. In terms of non-market factors, trust in the delivery of payouts is also very important. Karlan et al. [3] show that, even without relaxing credit constraints, increasing trust in the delivery of payouts increases insurance uptake. Trust has been shown to improve in two ways: if farmers had previously received payouts, or if someone in their network has experienced a payout [3,9,10,11]. Experience with payouts educates farmers on how insurance works, demonstrates that providers of insurance are reliable, and also helps farmers update their beliefs on the probability of a payout. In the same vein, financial education can also increase uptake if it teaches farmers about the method and frequency of payment [12,13], or if explicit information on the expected value of a contract is offered [9].
More recently, group insurance has been proposed as a method for delivering index insurance to a greater number of farmers, relying on informal networks or associations (e.g., farmer groups) to reduce transaction costs [14]. de Janvry et al. [15] show, in a theoretical model, that another potential benefit of group insurance is that it can reduce the likelihood of farmers free riding on each other’s insurance purchases, which is welfare enhancing. Janssens and Kramer [16] show both theoretically and empirically that offering group insurance health contracts does, indeed, reduce the likelihood of free riding on peers to repay their loans in Tanzania. An additional benefit of group index insurance is that it may help mitigate the effects of basis risk. Dercon et al. [14] show theoretically that if informal risk sharing can insure against idiosyncratic risk, including basis risk, then this could crowd in the demand for group index insurance. Boucher and Delpierre [17] also show that if index insurance is offered to groups as opposed to individuals then formal insurance contracts can act as a complement to informal risk sharing. Conversely, if offered only at the individual level, formal insurance contracts have been shown to crowd out informal risk sharing [18].
We explore the demand for group insurance by dairy farmers from associations in the Northwest of the Dominican Republic, by using a lab-in-the-field experiment offering real-world index insurance for the upcoming agricultural season. To our knowledge, this is the first study to explore the determinants of the demand for a real-world group index insurance product. Farmer associations are a natural setting for this study because members are interested in insuring against agricultural shocks, but they may not be friends or immediate family members such that they could turn to one another for loans. In our data, only 10–20% of the connections in farmer associations were classified as friends or family. Moreover, only 25% listed friends and family as someone they would turn to if their farming failed, while 62% were more likely to turn to their farmer association or a bank.1
Two strands of literature provide suggestions as to what dimensions of group insurance could influence its demand. First, the literature on crop insurance shows that a primary factor influencing farmers’ demand is their farm size (as opposed to their risk preferences). Farrin et al. [21] show that larger farmers are more likely to purchase insurance, and Sherrick et al. [22] show that larger farmers with more yield risk and leverage are more likely to purchase insurance. Second, the peer effects literature suggests that individuals with similar wealth profiles would be more likely to risk share (i.e., enter into group contracts), particularly in a setting where individuals are otherwise fairly homogeneous, such as the dairy farmers we investigate. Attanasio and Rios-Rull [23] show that informal risk sharing occurs among friends and family, and friend networks tend to be homophilous networks in terms of socioeconomic characteristics [24]. De Weerdt [25] shows that wealth, measured as livestock and land holdings, is a strong predictor for risk sharing in rural Tanzania along with kinship, geographical proximity, the number of common friends, clan membership, and religious affiliation. The author finds that rich households choose each other as network partners, but poor households avoid each other as network partners. Fafchamps and Lund [26] show that individuals who share risk in the Philippines exhibit similar income rankings regardless of what role each has played—lender or borrower. Johnson and Smirnov [27] show that individuals are more likely to cooperate in groups the more homophilous their group wealth. Both the insurance and social network literatures suggest that farm size could be an important determinant of group insurance. We, therefore, vary the perceived similarity of farm size across insurance groups—positing that more similar farmers are more likely to enter group contracts together.
In a between-subjects experiment, we randomize whether farmers participate in sessions where they are offered only individual insurance contracts versus sessions in which they are offered group insurance contracts (with the option of opting out of the group to purchase an individual contract). This allows us to study the effect on demand when group insurance is an option versus when it is not an option. Next, in the group sessions, we randomize individuals into groups of either perceived similar farm size (homophilous groups) or perceived dissimilar farm size (heterogeneous groups) to identify if group similarity affects the demand for group insurance. Perception of farm size is captured using a confidential survey regarding other farmers’ farm size. We choose to group farmers based on this measure rather than true farm size, because in reality most farmers do not know the precise details about every farmer in their farmer association, but rather act based on their beliefs and perceptions of those individuals. Because farmers are not obligated to purchase with their randomly assigned group, we can observe whether farmers who are more similar are more likely to enter group contracts, and how much insurance they collectively purchase.
First, we find that 64% of farmers in the group sessions, who are offered both the individual and group insurance options, have a preference to purchase insurance in a group (and this is statistically different from 50% using a non-parametric signrank test). Next, we find that farmers are weakly more likely to enter into group contracts the more similar they perceive other farmers’ farm size to be. A 5% increase in the similarity of group farm size results in a 3% increase in the probability of purchasing group insurance. However, conditional on entering into a group contract, groups of farmers with more dissimilar farm size purchase more insurance. Although we cannot identify the exact mechanism by which perceptions of others’ farm size matters, we do find that groups with lower perceived similarity (high distance) in farm size tend to believe that their fellow group members have fewer cows (than in the low distance groups) and fewer cows than themselves. Thus, it may be that farmers in these high distance groups feel that they are more vulnerable to extreme weather events if their fellow group members have smaller farms.
The remainder of the paper proceeds as follows. Section 2 provides details on the background of dairy farmers in the Dominican Republic. Section 3 describes the satellite-based index insurance design. Section 4 reviews the experimental design, game protocol, and the implementation strategy. Section 5 presents the results of the study. Section 6 provides robustness checks and Section 7 concludes.
2. Dairy Farmers in the Dominican Republic
For many farmers in the Dominican Republic (DR), climate change means more extreme and frequent ”bad” years. According to the Intergovernmental Panel on Climate Change (IPCC), the Caribbean will experience higher average temperatures and a decrease in precipitation under some climate scenarios, potentially leaving agricultural producers increasingly vulnerable [28]. The Northwest Region of the Dominican Republic has uniquely dry conditions, as opposed to other regions of the country, with two distinct yearly dry seasons.2 The experimental site is comprised of upland as well as coastal municipalities in the Northwest Region including Monte Cristi, Valverde, Dajabon, and Santiago Rodriguez. Studying this region is important because it is vulnerable to drought and because a significant percentage of the milk production for local consumption in the Dominican Republic happens in these four municipalities. There are about 9000 dairy producers in the Northwest Region, out of the 59,000 countrywide. During severe drought, such as in 2011, milk production can decrease by up to 60–70% from normal levels, reaching as low as 3–4 L per day per cow as opposed to 10 L during the most productive times of the year.
The average cattle farm in the region has a size of 34 acres (not irrigated), with about 20 cows producing 10 L per day during the rainy season and about 6 L of milk during the dry season. Each cow’s monthly production has a high variance across seasons with an average profit of 243 DOP (5.60 USD) in the dry season and 3290 DOP (76 USD) in the rainy season.3 A substantial percentage of cattle farmers in this region are organized into farmer associations. Associations serve as milk procurement centers, as well as platforms for discussion where farmers are able to examine as a community the best risk management strategies available during challenging circumstances. The participating associations are structured under one federation, FEDEGANO, the Federation of Dairy Farmers of the Northwest. FEDEGANO plays an administrative role, arranging contract opportunities for the associations with dairy processing companies, such as Parmalat Dominicana, Nestle, and the local entity, Pasteurizadora Rica, and promoting the implementation of climate risk management strategies with its members. FEDEGANO facilitated this study’s setup, by using already established connections within the federation to reach out to associations of dairy farmers who were willing to participate in the study.
3. Dry-Run Satellite Vegetation Index Product
The satellite-based index insurance used in this study is determined by a vegetation index, or a measurement of the landscape’s response to the arrival of (or lack of) rainfall necessary for vegetation to grow. For our research test, we did not design an index, rather we utilized the index insurance product developed by the USAID Dominican Republic’s Climate Resiliency and Index Insurance Program (referred to as USAID DR CRII hereafter.) The program’s index insurance used the normalized difference vegetation index (NDVI), a Moderate Resolution Imaging Spectroradiometer (MODIS) VI product.4 The NDVI index provides an indication of vegetative health (greenness) at any given time in a given area, and, as a result, it can serve as an intermediary in assessing greenness, biomass, and primary production.5 NDVI is a reliable spatial and temporal measurement of terrestrial photosynthetic activity used to monitor seasonal and long-term variations in biophysical parameters of the pastures in the study region [29]. NDVI is also one of the most widely used satellite-based vegetative indices in index insurance, with examples in Canada, the United States, Spain, Kenya, Ethiopia, and India [30].6
The product is structured to pay out between the ”attachment point” and the ”exhaustion point,” ranging from 20% to 100% of the sum insured, respectively. The payout percentages have a linear interpolation for the index values between the attachment and exhaustion points. If the index value for a specific month falls below the attachment point, there are no pay outs, while if it lies above the exhaustion point it pays out 100% of the sum insured. The index used was calibrated to provide a payout during the three worst droughts in the past twelve years, with one full and two partial historical payouts.7
Even though the product has not yet reached the market, largely due to delays in the regulatory process and the conclusion of the USAID DR CRII program, part of this study’s purpose was to inform how the product would be marketed. The commercial product was packaged for three- or four-month coverage, for the key drought prone periods of the year—the three-month option offered coverage from February to April and/or August to October, while the four-month option offered coverage from January to April and/or July to October. Each farmer could choose the coverage period. These coverage periods were defined through the program’s participatory design processes with dairy farmers. During the commercial pilot, the USAID CRII Program’s impact assessment component defined two options for selling the index insurance product through a local bank: a stand-alone voluntary product and a loan-linked product. After the first year, any farmer would be able to purchase either option.
4. Methods
4.1. Experimental Task
Individuals participated in a game protocol in which they were given 17 tokens each worth 25 DOP (60 cents USD) for a total of 425 DOP (or about 10 USD at the time). Following Norton et al. [4], producers could allocate their tokens between different financial instruments options for climate risk management: (1) taking the money home; (2) personal savings earning a 25% return; (3) community savings earning 10% return,8; and (4) commercial index insurance, which would provide a 3× payout once every six years in the event of a drought.9 This initial setup was similar to other interactive index insurance simulation exercises [4,13,33], and was meant to mimic actual insurance purchase decisions that could reflect commercial behavior.
The game endowment, 425 DOP (10 USD), equated to approximately two and a half days worth of dairy production during the rainy season.10 Note that the community savings option was binary, and we primarily included it to mimic the actual financial instruments that are available to farmers in this region. We restricted farmers to allocating a maximum of one token (25 DOP) to the community savings option to ensure a uniform investment across participants in each association, as disbursement would be made as one payment to the association. We chose a return of 25% for the personal savings to essentially ”quiet” the community savings option and better observe participants’ preferences between savings and insurance, where a 25% return presented a legitimate counter option to insurance. The insurance that participants purchased in the game was realized based on vegetation greenness (NDVI), which was measured throughout the remainder of the year until September 2014, as described in the previous section. In the case that vegetation greenness levels fell below the predetermined level, participants would receive three times their investment in the index insurance option.11
4.2. Experimental Treatments
We included two separate treatments in the design: (1) a monthly compared to a seasonally cumulative index option; and (2) a group versus individual purchasing option. Importantly, individuals were randomly assigned to monthly versus seasonal, and to group versus individual. As such, the estimates of the effects of each treatment should not be correlated, nor confounded, by other unobservables. Our primary interest was with the latter treatment, but we controlled for the index type throughout.12
4.2.1. Monthly Compared to Seasonally Cumulative Index Option
Half of the sessions were randomly chosen for the monthly index insurance product, while the other half were offered the seasonally cumulative index insurance product. Farmers did not choose which index they were offered. Guy Carpenter and Risk Managers to the Caribbean (CaribRM) created the two indices as part of the USAID DR CRII project. The indices reflected the driest periods for northwestern Dominican Republic at monthly or thee-month scales, using MODIS NDVI as a proxy for pasture greenness. The seasonally cumulative product was important because it was a feature requested by project partners to be explored, and it was meant to reflect the two types of time scales that farmers could insure.
4.2.2. Groups versus Individual Contracts
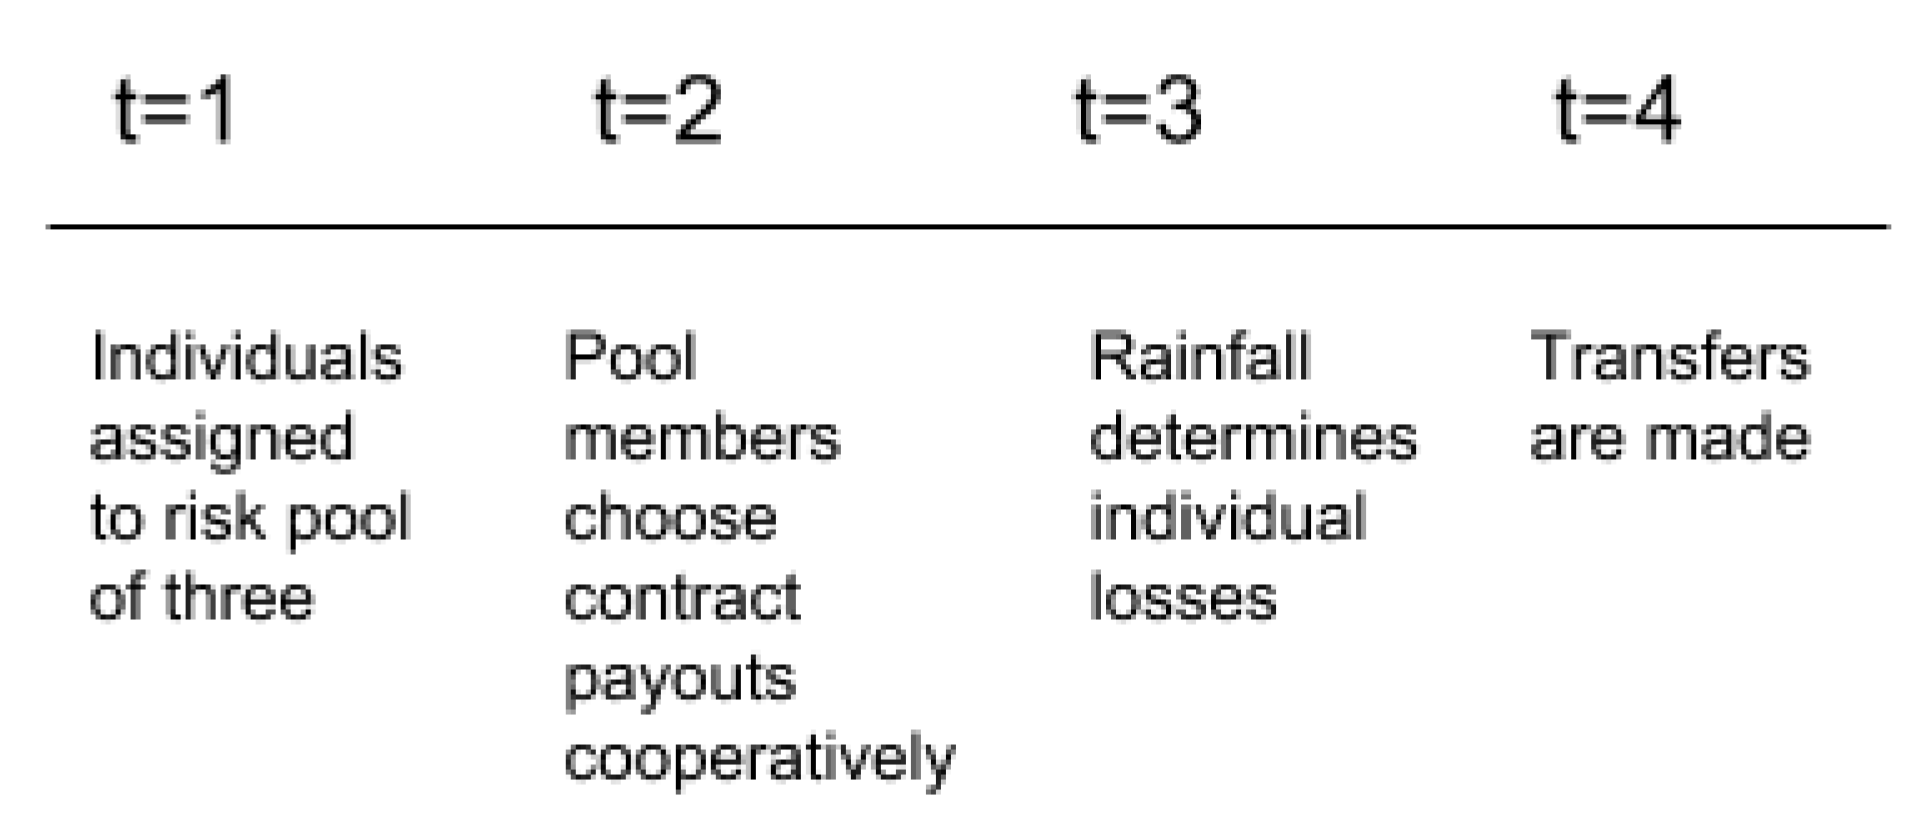
Our first treatment was to offer group insurance. First, we randomly selected which sessions were offered group index insurance. Within group sessions, participants were then randomly assigned to groups of three—the minimum number to form a group, which maximized the number of groups.13 Figure 1 depicts the timeline of decisions in a group contract. Participants were still permitted to purchase insurance individually if they opted out of the group insurance. Thus, in some cases, groups of three became groups of two. We gave groups the option on how they would like to divide payouts: divide potential payouts evenly or proportionally to individuals’ losses. This was done so that groups could arrive at their own optimal sharing rule.14 All of the negotiation of group contracts—how much each participant would contribute and how to divide payouts—was determined among the three group members verbally. This was the only time in which farmers were allowed to speak to one another during the experiment. In the remaining individual sessions, participants were only given the option to purchase insurance individually, and participants did not communicate with one another in these sessions.
4.3. Perceptions of Farm Size
For each association that was offered the group insurance option, we divided individuals randomly into two sub-groups (of approximately 15 individuals each, depending on the session size). Participants were not informed of this assignment. At the start of each session, respondents completed surveys listing the number of cows that they owned and the number of cows that they believed each individual in their sub-group owned. The survey question asked “How many productive cows do you believe the following individuals own?” followed by a list of participants in the room. Individuals in similar groups, which we term low-distance groups, were assigned to farmers who they believed owned a similar number of cows, while the remaining participants were grouped with farmers who they believed owned a dissimilar number of cows, which we term high-distance groups. Participants were not incentivized to respond to this survey in any way.
The similarity between two individuals was measured as from perspective: , where is what i believes j owns, and is what i truly owns. We divided by to normalize for the fact that an error in distance for large number of assets might differ from an error in distance for a small number of assets. Each i farmer had beliefs about the two individuals that he or she was paired with, and the distance measure reflected this perception. The overall belief of a farmer about his or her group with farmer j and farmer k was simply . After participants completed the surveys, the data were used to randomly assign participants to groups of three based on distance. A greedy algorithm, namely a search over all possible triplets, was used to evaluate the matrix of information values to choose the most similar groups. For example, there were possible combinations of more similar groups that we could have assigned, and we chose the five groups among those who had the most similar statistics in terms of our distance measure.
4.4. Procedures
We conducted the game with 354 participants in the Northwest Region of the Dominican Republic, with 13 dairy associations, approximately 30 participants per session, across eleven sessions between 28 and 31 January 2014.15 We ran a maximum of four sessions each day, two concurrent morning sessions and two concurrent evening sessions, with four assistants at each session. The associations and number of participants in each session is listed in Table 1. Each session consisted of registration, training in index insurance, concept discussion, and then the game. The game alone took 2 h, but the training was essential as index insurance was an unfamiliar and complex product, and past research has shown that training is important for uptake as well as for understanding the product [13,36].
We randomly selected 13 associations, representative of coastal and upland dairy farmer communities, from a list of associations for the monitoring and evaluation segment of a wider USAID DR CRII project. We then randomly selected participants from each association using a complete list of farmers’ names from within each farmer group. Together with our partners at the Rural Economic Development Dominicana (REDDOM) and farmer association heads, we invited randomly selected farmers to participate in the experiment, and notified them of the day and time that they could participate. Two co-authors fluent in Spanish from the Financial Instruments Sector Team (FIST) at the International Research Institute for Climate and Society at Columbia University facilitated the games by reading instructions and answering questions. A team of eight facilitators from USAID DR CRII and Rural Economic Development Dominicana (REDDOM) provided support during the game (by collecting recorded allocations and surveys). Swiss Reinsurance Company Ltd. (SwissRe), a global reinsurance company, provided resources to support the experiment. REDDOM, the project’s local implementing institution, facilitated the recruiting process in the region. The same set of moderators assisted participants across all sessions. Because the facilitators were from organizations that the farmers work with in development projects, readers should be aware that farmers may have biased their responses based on their perceptions of what would benefit these relationships.16
Each session progressed as follows. Upon registration, we assigned each dairy producer a unique number and provided him/her with an initial endowment of 17 tokens (425 DOP). In addition, farmers received a set of practice sheets and game sheets to record their decisions.17 Facilitators engaged dairy producers in a discussion intended to familiarize them with the different concepts of index insurance: introduction to index insurance, technical details such as contract windows, premium costs, index measures (satellite vegetation greenness), and basis risk. The latter discussion around basis risk determined what historical years would have had a payout, and compared them to the years identified in farmers’ discussions. Additionally, facilitators explained the experiment instructions in detail, including descriptions of endowment and allocation options.18
The game protocol was modified in the sessions in which we offered group insurance. Half of the participants in a group session were randomly selected to be in a low distance group and half to a high distance group. If a session had 30 participants, then half of the participants were to be assigned to a group of three individuals who would be “similar” to them, for a total of five “similar” groups. The remainder would be assigned to a group of three individuals who would be “dissimilar” to them, for a total of five “dissimilar” groups. Participants had no knowledge of this assignment. To determine the groups of three, participants completed a survey regarding the other participants assigned to low distance group. This survey was not conducted in the individual sessions, as participants in those sessions were not offered the option to purchase group insurance. This survey did extend the length of the meeting, but was completed comparatively quickly (approximately 15 min). In the survey, each producer recorded the number of productive cows that he or she thought the other individuals owned. Individuals who were then assigned to similar groups were individuals who perceived one another as owning a similar number of productive cows. Individuals assigned to dissimilar groups, were individuals who perceived one another as owning a different number of productive cows. Every individual in the group session was only assigned to one group.
Participants allocated their endowments in one practice round before the final round. For the practice round, participants revealed their preferences by allocating the 17 (25 DOP each) tokens across the different options on their game sheets. For the practice round, two orange ping-pong balls (representing severe drought) and ten white ping-pong balls (representing a normal season) were placed in an opaque bag. The balls represented the actual severe drought probabilities in the region. During the practice round, a participant randomly selected one out of 12 ping-pong balls to mimic a climatic realization of the season. For the seasonally cumulative insurance sessions, the ball was selected three times (one for each of the three seasons) to determine if there would be a hypothetical payout. Payouts were then added up and checked by facilitators.
Following the practice round, we asked participants to make their final allocation decision with the understanding that their choices were now binding. Any insurance purchased in the final round would be paid out according to the weather realization in the upcoming season and its impact on vegetation greenness.19 Insurance paid three times the insurance premium in the event of bad weather and nothing in the event of a normal season. The insurance payout was calculated to account for farmers receiving two full payouts in a twelve-year period. During each round participants recorded their allocations on practice sheets or game sheets. Following their allocations, participants completed exit surveys on demographics and assessment of their comprehension of index insurance. Facilitators collected worksheets and surveys, and paid participants who chose to take any of their endowment home. Savings and insurance payouts would be administered on a return visit.
5. Empirical Results
Our randomization design allows us to test two hypotheses: (1) offering group insurance does not change the amount of insurance purchased; and (2) heterogeneity in group farm size has no effect on purchasing group insurance.
5.1. Who Participated
Figure 2 illustrates the locations of each farmer association meeting center in the northwest of the Dominican Republic. The average participant is a male in his mid 50s, who has tertiary education, owns approximately 20 productive cows, and has four acres of irrigated pasture. Generally, participants were well-established farmers whose livelihoods are in agriculture.
Table 2 compares farmers in group versus individual sessions with respect to gender, education, cows and land owned, and age. Table 3 compares farmers in the group sessions who were assigned to high and low distance groups. In both tables, we observe that there is some imbalance with respect to age, and, therefore, we control for age throughout. A key point to note here is that the two groups are balanced on farm size. This is important because we can rule out other effects that could be driving our results—for example, if similar groups also had larger farms on average.
5.2. Demand for Insurance
Table 4 summarizes the overall game results. Participants place 73% of their endowment into insurance, 16% personal savings, 6% taking the money home, and 5% community savings.20 Sixty-four percent of individuals in group sessions choose to purchase insurance in a group for the upcoming season, and this is significantly different from 50% (t = 4.8 for a non-parametric sign rank test). The allocations are significantly different across the individual (IND) and group (GR) sessions without controls. Thus, there is positive demand for group contracts. That said, we cannot speak to the exact mechanism by which the group offering may have affected demand between the two different sessions. Participants may have preferred the group contract because they could communicate and explain the contract to one another, which participants in individual sessions did not have, or participants in group sessions may have been motivated by the general social cohesion that a group contract introduced rather than the contract itself. However, our results do reflect the real-world demand for group contracts.
In addition to whether farmers are interested in group contracts overall, we also test how group contracts affect how much insurance is purchased. We find that individuals in GR sessions purchased 38 DOP less insurance than individuals in IND sessions. We use the following regression framework for farmer i in session k to test the effects of the groups on insurance demand:
where is a continuous variable of how much insurance each individual i purchases; is a dummy that equals one, if the individual was in a group session, and zero if in a individual session; and is a dummy that equals one if offered monthly insurance and zero if seasonal insurance. We control for age throughout, given its imbalance across treatment and control. Standard errors are clustered at the session level when comparing group to individual sessions. Standard errors are clustered at the group level when evaluating only group sessions. Interaction within sessions only occurs in group sessions within the groups. In individual sessions, no interaction takes place between farmers.
Note that the estimate of is an intent-to-treat (ITT), because participants are not required to purchase group insurance or any insurance for that matter. Therefore, we first compare the amount of insurance purchased in group sessions, regardless of whether an individual chooses to purchase the insurance in a group or individually, versus the amount of insurance purchased in individual sessions.21 We do not focus on the monthly versus seasonal offerings in this paper, and unlike the group versus individual options, participants are not given a choice between monthly and seasonal indices; they are simply offered one of the two indices.22
Table 5 estimates Equation (1). Column 1 shows that being offered the group insurance reduces the average insurance premium purchased by 39 DOP, about a quarter of a day’s farm income, and is weakly significant. Note that, while participants in individual sessions did not interact, and these sessions should not require clustering of the standard errors [38], individuals in group sessions did interact; therefore, to be conservative, we cluster standard errors at the session level overall. (For regressions involving only the group sessions, we, more appropriately, clustered standard errors at the group level, since this was the level at which participants interacted.) However, with few clusters (13 sessions), we may be likely to over reject the null [39]. A common way to deal with few clusters is the wild cluster bootstrap [40]. We test the coefficient on the group treatment using standard errors that are calculated with the wild cluster bootstrap. The p-value and t-test are unchanged using the wild bootstrap (Stata version 14.2 boottest command) standard errors. That said, for fewer than 13 clusters (where we have exactly 13 sessions) even the wild cluster bootstrap may over or under reject. MacKinnon and Webb [41] show that sub-cluster wild bootstrap performs better when there are fewer than 13 clusters, and the ordinary wild bootstrap is a limiting case. In particular, it performs well even when cluster sizes vary by a factor of more than 6 as long as the number of treated clusters among the 13 is between 4 and 10, which is the case with this experiment. Referencing the latter methodology, we also perform our analysis clustering our standard errors at the session level but bootstrapping at the individual level using the boottest command [42]. Using this more conservative clustering procedure, our estimate of the GRP dummy is no longer significant at the 10% level, with a p-value of 0.13. Given this outcome, the most we can extrapolate from these results is that a significant percentage of farmers are willing to purchase group contracts in our sample; however, we cannot definitely say how the offering of group contracts affects the amount of insurance purchased, both because of the confounding factors mentioned above, and because of the clustering in participants’ choices.
5.3. Group Distance
We now turn to our main result in testing the impacts of heterogeneity in perceived farm size on demand. Table 6 summarizes the results across the two groups. We see that individuals in the low distance (similar) group are significantly more likely to enter into group contracts, but purchase significantly less insurance on average (in a group pool).
is now a dichotomous variable when we estimate whether individual i selects group versus individual insurance and is a continuous variable when we estimate how much insurance premium individual i purchases in group g, session k. is the distance measure calculated from the perspective of farmer i. , the effect of Distance, is our coefficient of interest.
Recall that, while we randomize individuals into groups, the range of our continuous distance measure alone is endogenous to the sessions’ participants. Namely, some sessions may have had farmers who had farms that were very similar in size. For this reason, we instrument our continuous measure with the treatment of being assigned to a high or low, High–Low, distance group.23
Table 7 presents the results of distance on the probability of entering into a group contract. Column 1 reports the results from a Probit regression first using only the dichotomous High–Low variable, where High = 1 and Low = 0. Column 2 reports the results from using the continuous variable instrumented by High–Low. Standard errors are clustered at the group level.24 We see that the effect of High–Low randomization is not significant. The effect of distance is significant and negative when instrumented, but the first-stage is weakly significant (see Appendix A for first-stage results in Table A1, Table A2 and Table A3), thus these are likely overestimates of the distance effect. A perceived average distance of one cow decreases the probability of purchasing in a group by 0.03. We know that the average farmer has 20 cows (see Table 4), and 56% of individuals purchased insurance in a group in the high distance groups (see Table 7), which implies that a 5% increase in perceived similarity for the average farmer (one cow) increases the probability of purchasing in a group by 5.3%.25
In Table 8, we estimate the effect of distance on how much insurance is purchased. Column 1 reports the results from an OLS regression using only the dichotomous High–Low variable and Column 2 reports the results from using the continuous variable instrumented by High–Low. Here, we see that conditional on having entered a group contract, greater perceived similarity in farm size decreases the amount of insurance purchased. A 5% (one cow) increase in farm size similarity reduces the amount of insurance purchased by about 2.37 DOP for each member in the group, a statistically significant effect. This can explain most of the differences in insurance purchased between the high and low distance groups. If individuals in high distance groups, where the average distance in farm size is 15.95, purchase approximately two more units of insurance for every unit increase in the distance measure, then they should be purchasing approximately 37 (2.37 × 15.95) more insurance units than low distance groups, which is approximately the difference we see in Table 6 (321 DOP versus 281 DOP).
Farm size is also an important determinant of purchasing agricultural insurance, and the collective farm size for each group could be another channel through which our intervention affected demand. Because assignment into groups was randomized based on perceived farm size, we can also check the degree to which total perceived farm size (not to be confused with farmers’ actual farm size) varied across high and low distance groups. First, on average, farmers tended to believe that they owned more cows (between three and six more for low and high distance groups) than their fellow group members. Next, we test whether total perceived farm size differs between high and low distance groups from the perspective of each farmer. We find that, on average, farmers in the low distance groups who purchase less insurance in groups, are assigned to groups where they perceive other group members to have larger farm sizes (a total of 30 cows for the other group members excluding their own cows in high distance groups versus 17 in low distance groups), and the difference is statistically different. Recall that this total is not the actual total number cows that each farmer reported, but rather the guess we elicited from each participant regarding other farmers’ farm size in the questionnaire. This measure is calculated from the initial participants’ responses regarding perceived farm size of other farmers. For example, if Farmer A, who has 30 cows, is assigned to a group where he perceives Farmer B’s farm size to be 10 and Farmer C’s farm size to be 20, then from Farmer A’s perspective the total that Farmers B and C own is 30.
In Table 9, we estimate the effect of the number of perceived cows that other group members own (from the perspective of each farmer) on the demand for group insurance. We instrument this total using the High–Low randomization, to capture only the exogenous variation in total cows per group that the assignment created. We also control for a farmer’s actual number of cows, as the two estimates are likely to be correlated. Table 9 shows that the fewer number of cows a farmer believed other group members owned, the more insurance that farmer purchased. One potential interpretation of this result is that if a farmer believed that other group members had less to insure than himself, then the farmer felt he had to contribute more to cover his own assets.
6. Comprehension
One might be concerned with the overall complexity involved in choosing the group insurance option and that this might be driving any discrepancies between the session outcomes. In our exit survey, we included four true or false questions regarding the basics of index insurance: “Premiums would be returned if no bad weather ever occurs”; “You can purchase insurance after a bad event occurs”; “If you have a bad year, you may not get a payment if the index measure indicates a good year”; and “Satellite based vegetation measure will always reflect the health of my own pasture.” In Table 10, we see no difference in comprehension of group insurance between individuals in the group and individual sessions. Overall comprehension of insurance was also relatively high, except for the question regarding satellite-based measures. Explaining satellite-based measurements is generally one of the more challenging components of index insurance, but necessary if we want farmers to understand how basis risk can arise. That said, comprehension regarding basis risk was still relatively high.
7. Conclusions
In 2018, fewer than 70 million farmers in developing countries had access to insurance among the world’s 450–500 million smallholder farmers [44]. In Latin America alone, less than one-third of smallholder farmers had access to any form of agricultural insurance. With the current G7 goal to scale index insurance to 400 million people within 2020, new innovations are clearly needed to help scale coverage quickly [44].
One of the characteristics of index insurance that has led to its success in reaching smallholder farmers is its lower transaction cost, which tends to translate into a lower premium. Offering index insurance as a group contract could help reduce transaction costs further, and has been posited as a potential instrument for increasing coverage of uninsured covariate risk in the developing world. In addition, working through cooperatives and farmers’ groups to market and administer group contracts could help strengthen the cooperative model, which is recognized as a key tool for reducing hunger and poverty by the United Nation’s 2030 Agenda for Sustainable Development [45].
There is significant literature on the determinants of individual index insurance contracts, but it is not well understood how group characteristics can help influence the uptake of group insurance contracts. In this paper, we empirically test the effects of offering index insurance at the group level. Specifically, we test the degree to which perceived similarity in farm size affects group insurance uptake. From an insurance standpoint, farm size is the primary determinant of insurance uptake for farmers. From a group and networks standpoint, individuals who perceive themselves to be more similar are often more likely to cluster together and more likely to help one another in terms of risk sharing. Thus, we exogenously vary the degree to which perceived farm size affects index insurance uptake at the group level.
First, we find that farmers are open to purchasing group index insurance contracts. Sixty-four percent of the farmers offered group contracts purchased index insurance in groups. This is an important benchmark for the literature on index insurance and for policy. Knowing that farmers are open to this delivery of group index insurance contracts creates new possibilities for insurance providers on how to structure loans and target more farmers. That said, we do not believe we can make more meaningful comparisons of farmers’ choices across group versus individual insurance sessions due to the limited of number of sessions that we held. Future research with a larger number of sessions comparing the two offerings would be needed. Next, we find that individuals randomly assigned to less similar groups with regards to farm size (productive cows) purchase more insurance on average. We also find that the randomization into less similar groups tends to include farmers who perceive other group members as smaller farm owners (this is distinct from what the farmers actually owned). Thus, one potential reason for why less similar groups purchase more insurance on average is because each farmer believes he has to shoulder more of his own risk. However, more research is necessary to identify this mechanism. Overall, we find that the composition of farmer groups impacts the demand for group insurance, and that perceptions of other farmers’ production characteristics (farm size) affect the demand for group insurance contracts. One potential policy implication from our findings is that if the demand for group contracts varies with group dynamics, then it may be optimal to offer both individual or group contracts. The latter strategy could still increase the number of farmers reached, without losing those farmers who would have preferred to purchase individually.
There are remaining inquiries that require future work. As mentioned above, although farmers in group sessions prefer group contracts over individual contracts, there are some confounding factors. For example, the ability to discuss and understand index insurance with peers and/or the ability to negotiate with peers can also contribute to farmers’ preference for group contracts. A study that isolates these effects could be conducted where group contracts are offered with and without group negotiation, or with and without knowledge of one’s group members. This would be possible in a lab experiment in the field where group members’ contributions are revealed to one another but their identities are not. In addition, understanding whether group contracts impact informal risk sharing outside of formal group contracts (as opposed to the reverse, which is being studied) would provide a large contribution to this literature.
Author Contributions
Conceptualization, K.V., S.M.S., R.S. and D.O.; Data curation, K.V., S.M.S., R.S.; Formal analysis, K.V.; Funding acquisition, D.O.; Investigation, K.V., S.M.S., R.S.; Methodology, K.V.; Project administration, S.M.S., R.S. and D.O.; Resources, D.O.; Supervision, D.O., K.V.; Validation, K.V.; Writing—original manuscript, K.V. Writing—editing, review, K.V., S.M.S., R.S. and D.O. All authors have read and agreed to the published version of the manuscript.
Funding
We gratefully acknowledge financial support from the Center for Research on Environmental Decisions (CRED) at Columbia University.
Acknowledgments
The authors are grateful to Eduardo Zambrano and Matthieu Delpierre for extensive discussions, and Jing Cai, Markus Mobius, Jacqueline Doremus, seminar participants at the Northeast Development Economics Conference (NEUDC), Microsoft Research New England, and the Center for Research on Environmental Decisions (CRED) Seminar at Columbia University for thoughtful comments. We gratefully acknowledge our partnerships with USAID, REDDOM, Guy Carpenter and SwissRe in this work.
Conflicts of Interest
The funders nor partners had no role in the design of the study; in the collection, analyses, or interpretation of data; in the writing of the manuscript, or in the decision to publish the results.
Appendix A

Table A1.
First and Second Stage of Table 7, IVPROBIT, and the Effects of Distance on the Uptake of Group Insurance.
Table A1.
First and Second Stage of Table 7, IVPROBIT, and the Effects of Distance on the Uptake of Group Insurance.
| (1) | (2) | |
|---|---|---|
| First Stage | Second Stage | |
| VARIABLES | Distance | Insurance |
| High–Low | 13.42 * | |
| (8.272) | ||
| Monthly | 10.10 | 0.137 |
| (9.584) | (0.561) | |
| Age | −0.216 | −0.0116 |
| (0.194) | (0.0113) | |
| Total Own Cows | −0.335 *** | −0.0105 ** |
| (0.128) | (0.00420) | |
| Distance | −0.0278 *** | |
| (0.00524) | ||
| Constant | 33.55 ** | 1.540 |
| (13.44) | (1.069) | |
| Observations | 125 | 125 |
| F-Stat | 3.26 | |
| (Prob > F ) | (0.0192) |
Standard errors clustered at the session level. F-stat tests joint significance of instruments in first stage. *** p < 0.01, ** p < 0.05, * p < 0.1.
Table A2.
First and Second Stage of Table 8, IVREG, and the Effects of Distance on the Amount of Insurance Purchased in Groups.
Table A2.
First and Second Stage of Table 8, IVREG, and the Effects of Distance on the Amount of Insurance Purchased in Groups.
| (1) | (2) | |
|---|---|---|
| First Stage | Second Stage | |
| VARIABLES | Distance | Insurance |
| High–Low | 25.27 * | |
| (14.26) | ||
| Monthly | 6.320 | 1.122 |
| (12.55) | (39.44) | |
| Age | −0.0282 | 0.389 |
| (0.276) | (0.709) | |
| Total Own Cows | −0.137 | 0.477 |
| (0.124) | (0.464) | |
| Distance | 2.388 * | |
| (1.389) | ||
| Constant | 12.83 | 219.2 *** |
| (16.25) | (49.26) | |
| Observations | 82 | 82 |
| R-squared | −0.940 | |
| F-Stat | 3.99 | |
| (Prob > F ) | (0.0095) |
Standard errors clustered at the session level. F-stat tests joint significance of instruments in first stage. *** p < 0.01, * p < 0.1.
Table A3.
First and Second Stage of Table 9, 2SLS, and the Effects of Perceived Farm Size on the Amount of Insurance Purchased in Groups.
Table A3.
First and Second Stage of Table 9, 2SLS, and the Effects of Perceived Farm Size on the Amount of Insurance Purchased in Groups.
| (1) | (2) | |
|---|---|---|
| First Stage | Second Stage | |
| VARIABLES | Total Perceived Cows | Insurance |
| High–Low | −17.90 *** | |
| (5.403) | ||
| Monthly | 0.607 | 18.26 |
| (6.608) | (29.02) | |
| Age | 0.167 | 0.885 * |
| (0.107) | (0.492) | |
| Total Own Cows | 0.291 | 1.132 |
| (0.278) | (1.067) | |
| Total Perceived Cows | −3.371 ** | |
| (1.341) | ||
| Constant | 16.94 | 306.9 *** |
| (10.45) | (47.15) | |
| Observations | 82 | 82 |
| F-Stat | 7.46 | |
| (Prob > F) | (0.0002) |
Standard errors clustered at the session level. F-stat tests joint significance of instruments in first stage. *** p < 0.01, ** p < 0.05, * p < 0.1.
References
- Cai, J.; de Janvry, A.; Sadoulet, E. The Impact of Insurance Provision on Household Production and Financial Decisions. Am. Econ. J. Econ. Policy 2016, 8, 44–88. [Google Scholar] [CrossRef] [Green Version]
- Cole, S.; Giné, X.; Vickery, J. How Does Risk Management Influence Production Decisions? Evidence from a Field Experiment. Rev. Financ. Stud. 2017, 30, 1935–1970. [Google Scholar] [CrossRef] [Green Version]
- Karlan, D.; Osei, R.; Osei-Akoto, I.; Udry, C. Agricultural decisions after relaxing credit and risk constraints. Q. J. Econ. 2014, 129, 597–652. [Google Scholar] [CrossRef] [Green Version]
- Norton, M.; Osgood, D.; Madajewicz, M.; Holthaus, E.; Peterson, N.; Diro, R.; Mullally, C.; Teh, T.L.; Gebremichael, M. Evidence of Demand for Index Insurance: Experimental Games and Commercial Transactions in Ethiopia. J. Dev. Stud. 2014, 50, 630–648. [Google Scholar] [CrossRef]
- Cai, J. The impact of contract design on insurance uptake. In Proceedings of the 2014 Symposium on Economic Experiments in Developing Countries (SEEDEC), Bergen, Norway, 10–11 December 2014. [Google Scholar]
- Clarke, D.J. A Theory of Rational Demand for Index Insurance. Am. Econ. J. Microecon. 2019, 8, 283–306. [Google Scholar] [CrossRef] [Green Version]
- Takahashi, K.; Barrett, C.; Ikegami, M. Does Index Insurance Crowd In or Crowd Out Informal Risk Sharing? Evidence from Rural Ethiopia. Am. J. Agric. Econ. 2019, 101, 672–691. [Google Scholar] [CrossRef]
- Jensen, N.; Barrett, C.; Mude, A. Index Insurance Quality and Basis Risk: Evidence from Northern Kenya. Am. J. Agric. Econ. 2016, 98, 1450–1469. [Google Scholar] [CrossRef] [Green Version]
- Cai, J.; Song, C. Do disaster experience and knowledge affect insurance uptake decisions? J. Dev. Econ. 2017, 124, 83–94. [Google Scholar] [CrossRef] [Green Version]
- Cai, J.; de Janvry, A.; Sadoulet, E. Social networks and the decision to insure. Am. Econ. J. Appl. Econ. 2015, 7, 81–108. [Google Scholar] [CrossRef] [Green Version]
- Cole, S.; Giné, X.; Tobacman, J.; Topalova, P.; Townsend, R.; Vickery, J. Barriers to Household Risk Management: Evidence from India. Am. Econ. J. Appl. Econ. 2013, 5, 104–135. [Google Scholar] [CrossRef] [Green Version]
- Vasilaky, K.; Diro, R.; Norton, M.; McCarney, G.; Osgood, D. Can Education Unlock Scale? The Demand Impact of Educational Games on a Large-Scale Unsubsidised Index Insurance Programme in Ethiopia. J. Dev. Stud. 2018, 48. [Google Scholar] [CrossRef]
- Gaurav, S.; Cole, S.; Tobacman, J. Marketing complex financial products in emerging markets: Evidence from rainfall insurance in India. J. Mark. Res. 2011, 48, 150–162. [Google Scholar] [CrossRef]
- Dercon, S.; Hill, R.V.; Clarke, D.; Outes-Leon, I.; Seyoum Taffesse, A. Offering rainfall insurance to informal insurance groups: Evidence from a field experiment in Ethiopia. J. Dev. Econ. 2014, 106, 132–143. [Google Scholar] [CrossRef]
- de Janvry, A.; Dequiedt, V.; Sadoulet, E. The Demand for insurance against common shocks. J. Dev. Econ. 2014, 106, 227–238. [Google Scholar] [CrossRef]
- Janssens, W.; Kramer, B. The social dilemma of microinsurance: Free-riding in a framed field experiment. J. Econ. Behav. Organ. 2016, 131, 47–61. [Google Scholar] [CrossRef] [Green Version]
- Boucher, S.; Delpierre, M. The impact of index-based insurance on informal risk-sharing networks. SSRN Electron. J. 2014. [Google Scholar] [CrossRef] [Green Version]
- Lenel, F.; Steiner, S. Insurance and Solidarity: Evidence from a Lab-in-theField Experiment in Cambodia. J. Econ. Behav. Organ. 2020. forthcoming. [Google Scholar]
- Vroege, W.; Dalhaus, T.; Finger, R. Index insurances for grasslands—A review for Europe and North-America. Agricultural systems. Sci. Rep. 2019, 168, 101–111. [Google Scholar]
- Dalhaus, T.; Musshoff, O.; Finger, R. Phenology information contributes to reduce temporal basis risk in agricultural weather index insurance. Sci. Rep. 2018, 8, 1–10. [Google Scholar] [CrossRef]
- Farrin, K.; Javier Miranda, M.; O’Donoghue, E. How Do Time and Money Affect Agricultural Insurance Uptake? A New Approach to Farm Risk Management Analysis. Econ. Res. Rep. 2016, ERR-212, 128–132. [Google Scholar]
- Sherrick, B.J.; Barry, P.J.; Ellinger, P.N.; Schnitkey, G.D. Factors Influencing Farmers’ Crop Insurance Decisions. Am. J. Agric. Econ. 2004, 86, 103–114. [Google Scholar] [CrossRef]
- Attanasio, O.; Rios-Rull, J.V. Consumption smoothing in island economies: Can public insurance reduce welfare? Eur. Econ. Rev. 2000, 44, 1225–1258. [Google Scholar] [CrossRef]
- McPherson, M.; Smith-Lovin, L.; Cook, J. Birds of a Feather: Homophily in Social Networks. Annu. Rev. Sociol. 2001, 27, 415–444. [Google Scholar] [CrossRef] [Green Version]
- De Weerdt, J. Risk-Sharing and Endogenous Network Formation. In Insurance Against Poverty; Dercon, S., Ed.; Oxford University Press: Cambridge, UK, 2005. [Google Scholar]
- Fafchamps, M.; Lund, S. Risk-sharing networks in rural Philippines. J. Dev. Econ. 2003, 71, 261–287. [Google Scholar] [CrossRef] [Green Version]
- Johnson, T.; Smirnov, O. Inequality as information: Wealth homophily facilitates the evolution of cooperation. Sci. Rep. 2018, 8, 1225–1258. [Google Scholar] [CrossRef] [PubMed] [Green Version]
- Collins, M.; Knutti, R.; Arblaster, J.; Dufresne, J.L.; Fichefet, T.; Friedlingstein, P.; Gao, X.; Gutowski, W.; Johns, T.; Krinner, G.; et al. Chapter 12—Long-term climate change: Projections, commitments and irreversibility. In Climate Change 2013: The Physical Science Basis; IPCC, Ed.; Cambridge University Press: Cambridge, UK, 2013. [Google Scholar]
- Overview of the radiometric and biophysical performance of the MODIS vegetation indices. Remote Sens. Environ. 2002, 83, 195–213. [CrossRef]
- Leblois, A.; Quirion, P. Agricultural insurances based on meteorological indices: Realizations, methods and research. Meteorol. Appl. 2012, 20, 1–9. [Google Scholar] [CrossRef] [Green Version]
- Brahm, M.; Vila, D.; Martinez, S.S.; Osgood, D. Can disaster events reporting be used to drive remote sensing applications? A Latin America weather index insurance case study. Meteorol. Appl. 2019, 92, 1–10. [Google Scholar] [CrossRef]
- Osgood, D.; Powell, B.; Diro, R.; Farah, C.; Enenkel, M.; Brown, M.; Husak, G.; Blakeley, S.L.; Hoffman, L.; McCarty, J. Farmer Perception, Recollection, and Remote Sensing in Weather Index Insurance: An Ethiopia Case Study. Remote Sens. 2019, 10, 1887. [Google Scholar] [CrossRef] [Green Version]
- Carter, M.R.; Barrett, C.B.; Boucher, S.; Chantarat, S.; Galarza, F.; Mcpeak, J.; Mude, A.; Trivelli, C. Insuring the Never Before Insured: Explaining Index Insurance. SSRN Electron. J. 2008, 1–8. [Google Scholar] [CrossRef] [Green Version]
- Gelman, A.; Carlin, J. Beyond Power Calculations: Assessing Type S (Sign) and Type M (Magnitude) Errors. Perspect. Pscychol. Sci. 2014, 9, 641–651. [Google Scholar] [CrossRef] [PubMed]
- Szucs, D.; Ioannidis, J. Empirical assessment of published effect sizes and power in the recent cognitive neuroscience and psychology literature. PLoS Biol. 2017, 15, e2000797. [Google Scholar] [CrossRef] [PubMed]
- Carpena, F.; Cole, S.; Shapiro, J.; Zia, B. Unpacking the Causal Chain of Financial Literacy; World Bank Policy Research Working Paper; World Bank: Washington, DC, USA, 2012. [Google Scholar]
- Duflo, E.; Kremer, M. Using Randomization in Development Economics Research: A Toolkit. In Handbook of Development Economics; Schultz, T.P., Strauss, J.A., Eds.; Elseiver: Amsterdam, The Netherlands; New York, NY, USA, 2008; Volume 4, Chapter 61; pp. 3935–3940. [Google Scholar]
- Fréchette, G.R. Session-effects in the laboratory. Exp. Econ. 2012, 15, 485–498. [Google Scholar] [CrossRef] [Green Version]
- Bertrand, M.; Duflo, E.; Mullainathan, S. How Much Should We Trust Differences-In-Differences Estimates? Q. J. Econ. 2004, 119, 249–275. [Google Scholar] [CrossRef] [Green Version]
- Cameron, A.C.; Gelbach, J.B.; Miller, D.L. Bootstrap-Based Improvements for Inference with Clustered Errors. Rev. Econ. Stat. 2008, 90, 414–427. [Google Scholar] [CrossRef]
- MacKinnon, J.G.; Webb, M.D. The wild bootstrap for few (treated) clusters. Econometr. J. 2018, 21, 114–135. [Google Scholar] [CrossRef] [Green Version]
- Roodman, D.; Nielsen, M.; MacKinnon, J.G.; Webb, M.D. Fast and wild: Bootstrap inference in Stata using boottest. Stat J. 2019, 19, 4–60. [Google Scholar] [CrossRef] [Green Version]
- Wooldridge, J. Introductory Econometrics: A Modern Approach; Southwestern Cengage Learning: Mason, OH, USA, 2008. [Google Scholar]
- Syngenta Foundation. New Routes to Smallholder Prosperity: Unlocking the Potential for Farm Insurance and Finance. In Syngenta Foundation Conference 2018; Syngenta Foundation for Sustainable Agriculture: Basel, Switzerland, 2018. [Google Scholar]
- Food and Agriculture: Key to Achieving the 2030 Agenda for Sustainable Development; Technical Report; Food and Agriculture Organization of the United Nations: Rome, Italy, 2016.
| 1. | While our study focuses on the developing country context, our setup could also extend to developed country contexts as well, where farmers have cooperatives and experience contemporaneous covariate risk. Vroege et al. [19] and Dalhaus et al. [20] cover index insurance in the developed country context. |
| 2. | The first dry season, typically with a widespread impact across the region, runs from December to March. The second dry season begins in July and lasts until September, usually affecting the coastal zones more dramatically. |
| 3. | On average, according to 2014 data, dairy producers receive 18 Dominican Pesos (DOP), or 0.42 USD, per liter of milk after accounting for handling fees. Production costs per cow each month range between 2175 and 3045 DOP (50 and 70 USD) during the dry season and rainy season, respectively. These costs typically include: supplementary feed, labor, veterinary costs, and pasture packs. |
| 4. | The raw NDVI image files from eMODIS were sourced via http://www.fews.net/, a USAID-supported drought and famine early warning program implemented by several US Federal agencies. |
| 5. | NDVI is a spectral transformation of the visible (red) and near-infrared (NIR) bands. |
| 6. | To estimate the land extent significant to the dairy farmers for the index, the USAID DR CRII modeling partner extracts the NDVI pixels that correspond with grassland data from The Food and Agriculture Organization land cover dataset (GLC-SHARE). The pentads are averaged at a municipal or district level, using the boundaries provided by the Dominican National Statistics Office. The pentads are then accumulated into months and payouts are defined at a threshold value based on normalized historical values, calibrated against yield data. For this study, the normal conditions for each pentad and geographical area are established for the reference period 2000 to 2014. |
| 7. | For the validation of the index and evaluation of the basis risk, we performed a product assessment exercise across four sample villages, funded by USAID, throughout 2013 and 2014. This exercise consisted of a series of focus group workshops with dairy farmer associations to discuss farmers’ perception of historical droughts compared to the historical years the index would have triggered. The exercise is based on the participatory processes used in the R4 project, https://www.wfp.org/r4-rural-resilience-initiative, and studied by Brahm et al. [31] and Osgood et al. [32]. The assessment shows that the model agreed with most of the historical drought years mentioned by the farmers. It also confirmed that the NDVI-based index design captured the severe drought events with more accuracy than the available yield data or previous index iterations based on rainfall data. |
| 8. | Community funds were used to implement community level risk management measures, which were not announced until game payments were made, to benefit only those who did contribute. |
| 9. | Note that the choice was not between allocating funds either into savings or into insurance, as the expected return to insurance in any given year would not exceed the returns to our savings account. However, conditional on the probability of drought being positive, it is always in the farmer’s interest to purchase some insurance. |
| 10. | Farmers receive approximately 20 DOP (before accounting for handling fees) for each liter of milk sold, and yield an average of 10 L per day during the rainy season. |
| 11. | The interest rates do not reflect the real market rates in the Dominican Republic. Further, a 3× payout reflected an index that would pay a full payout approximately once every six years, mimicking several active index insurance projects in the developing world and the expectations for the expected commercial implementation in the Dominican Republic. |
| 12. | Participants given the monthly index option could choose the particular months to be insured during the dry run period of February to September. Participants could allocate their tokens (425 DOP, 10 USD) to one month or allocate their tokens throughout all or some months. For example, if participants invested one token (25 DOP) in one month and another token to a different month, and, if both months were dry enough to trigger the index, producers would receive a three-token (75 DOP) insurance payout for each month that triggered. In the seasonally cumulative index insurance, participants were free to allocate their game endowment across three different periods: (1) February and March; (2) April, May, and June; and (3) July, August, and September. (January was excluded as the games took place from 28 to 31 January 2014.) For example, if participants put one token on Period 1 and another token on Period 2, and both three-month periods were dry enough to trigger the index, then producers would receive a three-token insurance payout for each of the different periods. |
| 13. | It is likely that group uptake would change with group size—a question we do not address here. |
| 14. | Note that farmers could defer this decision to the time of any eventual payouts in the season, although the majority (79%) chose to make this decision upfront. |
| 15. | The sample size was determined using power calculation for a two treatment arm study with = 0.8, = 0.05, effect size of 30, and = 80, and approximately 30 observations per cluster, which resulted in a required sample size of 84 in the control group and 168 for both treatment groups, with a minimum of nine clusters for the two treatment groups. sampsi 0 30, sd(80) ratio(2) power(.8) and sampclus, obsclus(30) were the commands used in Stata. We powered the group treatment sessions comparing high and low distance with = 0.8, = 0.10, effect size of 40, and = 80, and approximately three observations per cluster, with an ICC = 0.5, which resulted in a required sample size of 76 in each group and a minimum of 60 clusters. sampsi 0 40, sd(80) power(.8) and sampclus, obsclus(3) rho(0.10) were the commands used in Stata. Note that the ex-post intra-class correlation coefficient that we find in the data are higher than 0.1, ranging 0.25–0.5 for the session and group level, respectively. Therefore, we should be cautious in interpreting the magnitude of our results given that under-powered studies have a greater likelihood of overstating the magnitude of the effect size [34,35]. |
| 16. | For example, the overall insurance uptake in the game, and amounts of insurance purchased might be higher than would be observed commercially, particularly because farmers were given cash in the form of tokens alleviating any liquidity constraints, which typically hinder demand [11]. |
| 17. | The majority of participants were literate. In a few cases, we had an additional facilitator assisting illiterate farmers in recording their choices. |
| 18. | Due to concerns about contagion effects, discussions between farmers in sessions were discouraged. Farmers were not allowed to speak to one another during the framing and experimental choice process. The only time farmers were allowed to speak to one another was during the group insurance sessions within the assigned groups. |
| 19. | The upcoming season occurred between February and September 2014. Unlike the practice round, the insurance outcome in the final round was determined by the upcoming season’s pasture conditions and was not based on the outcome of a hypothetical draw. |
| 20. | Only 3 out of the 354 participants did not allocate any of their endowment to insurance. |
| 21. | We could also compare the amount of group insurance purchased in group sessions to the amount of insurance purchased in individual sessions, which would capture the treatment-on-the-treated (TOT). This estimate, however, would suffer from selection bias, given that only certain types individuals self-select into purchasing group insurance ([37], p. 3935). |
| 22. | While we did not design the study to be powered to test for interaction effects between the monthly index treatment and the group insurance treatment, the interaction effect of the two treatments is neither statistically nor economically significant when adding it as an additional term. |
| 23. | Instruments are significant at the first stage but not reported here. |
| 24. | In some instances for the instrumental variable approach, our models return a negative R-squared, which is feasible and does not detract from the estimators’ validity. As Wooldridge [43], p. 516 discusses, a R-squared statistic from an instrumental variable model is neither very useful nor has a natural interpretation as it does in OLS. |
| 25. | 0.05 × 20 cows = 1 cow; (0.59 − 0.56/0.56) = 0.053. |
Figure 1.
Timeline for Group Decisions.

Figure 2.
Location of Experiment.
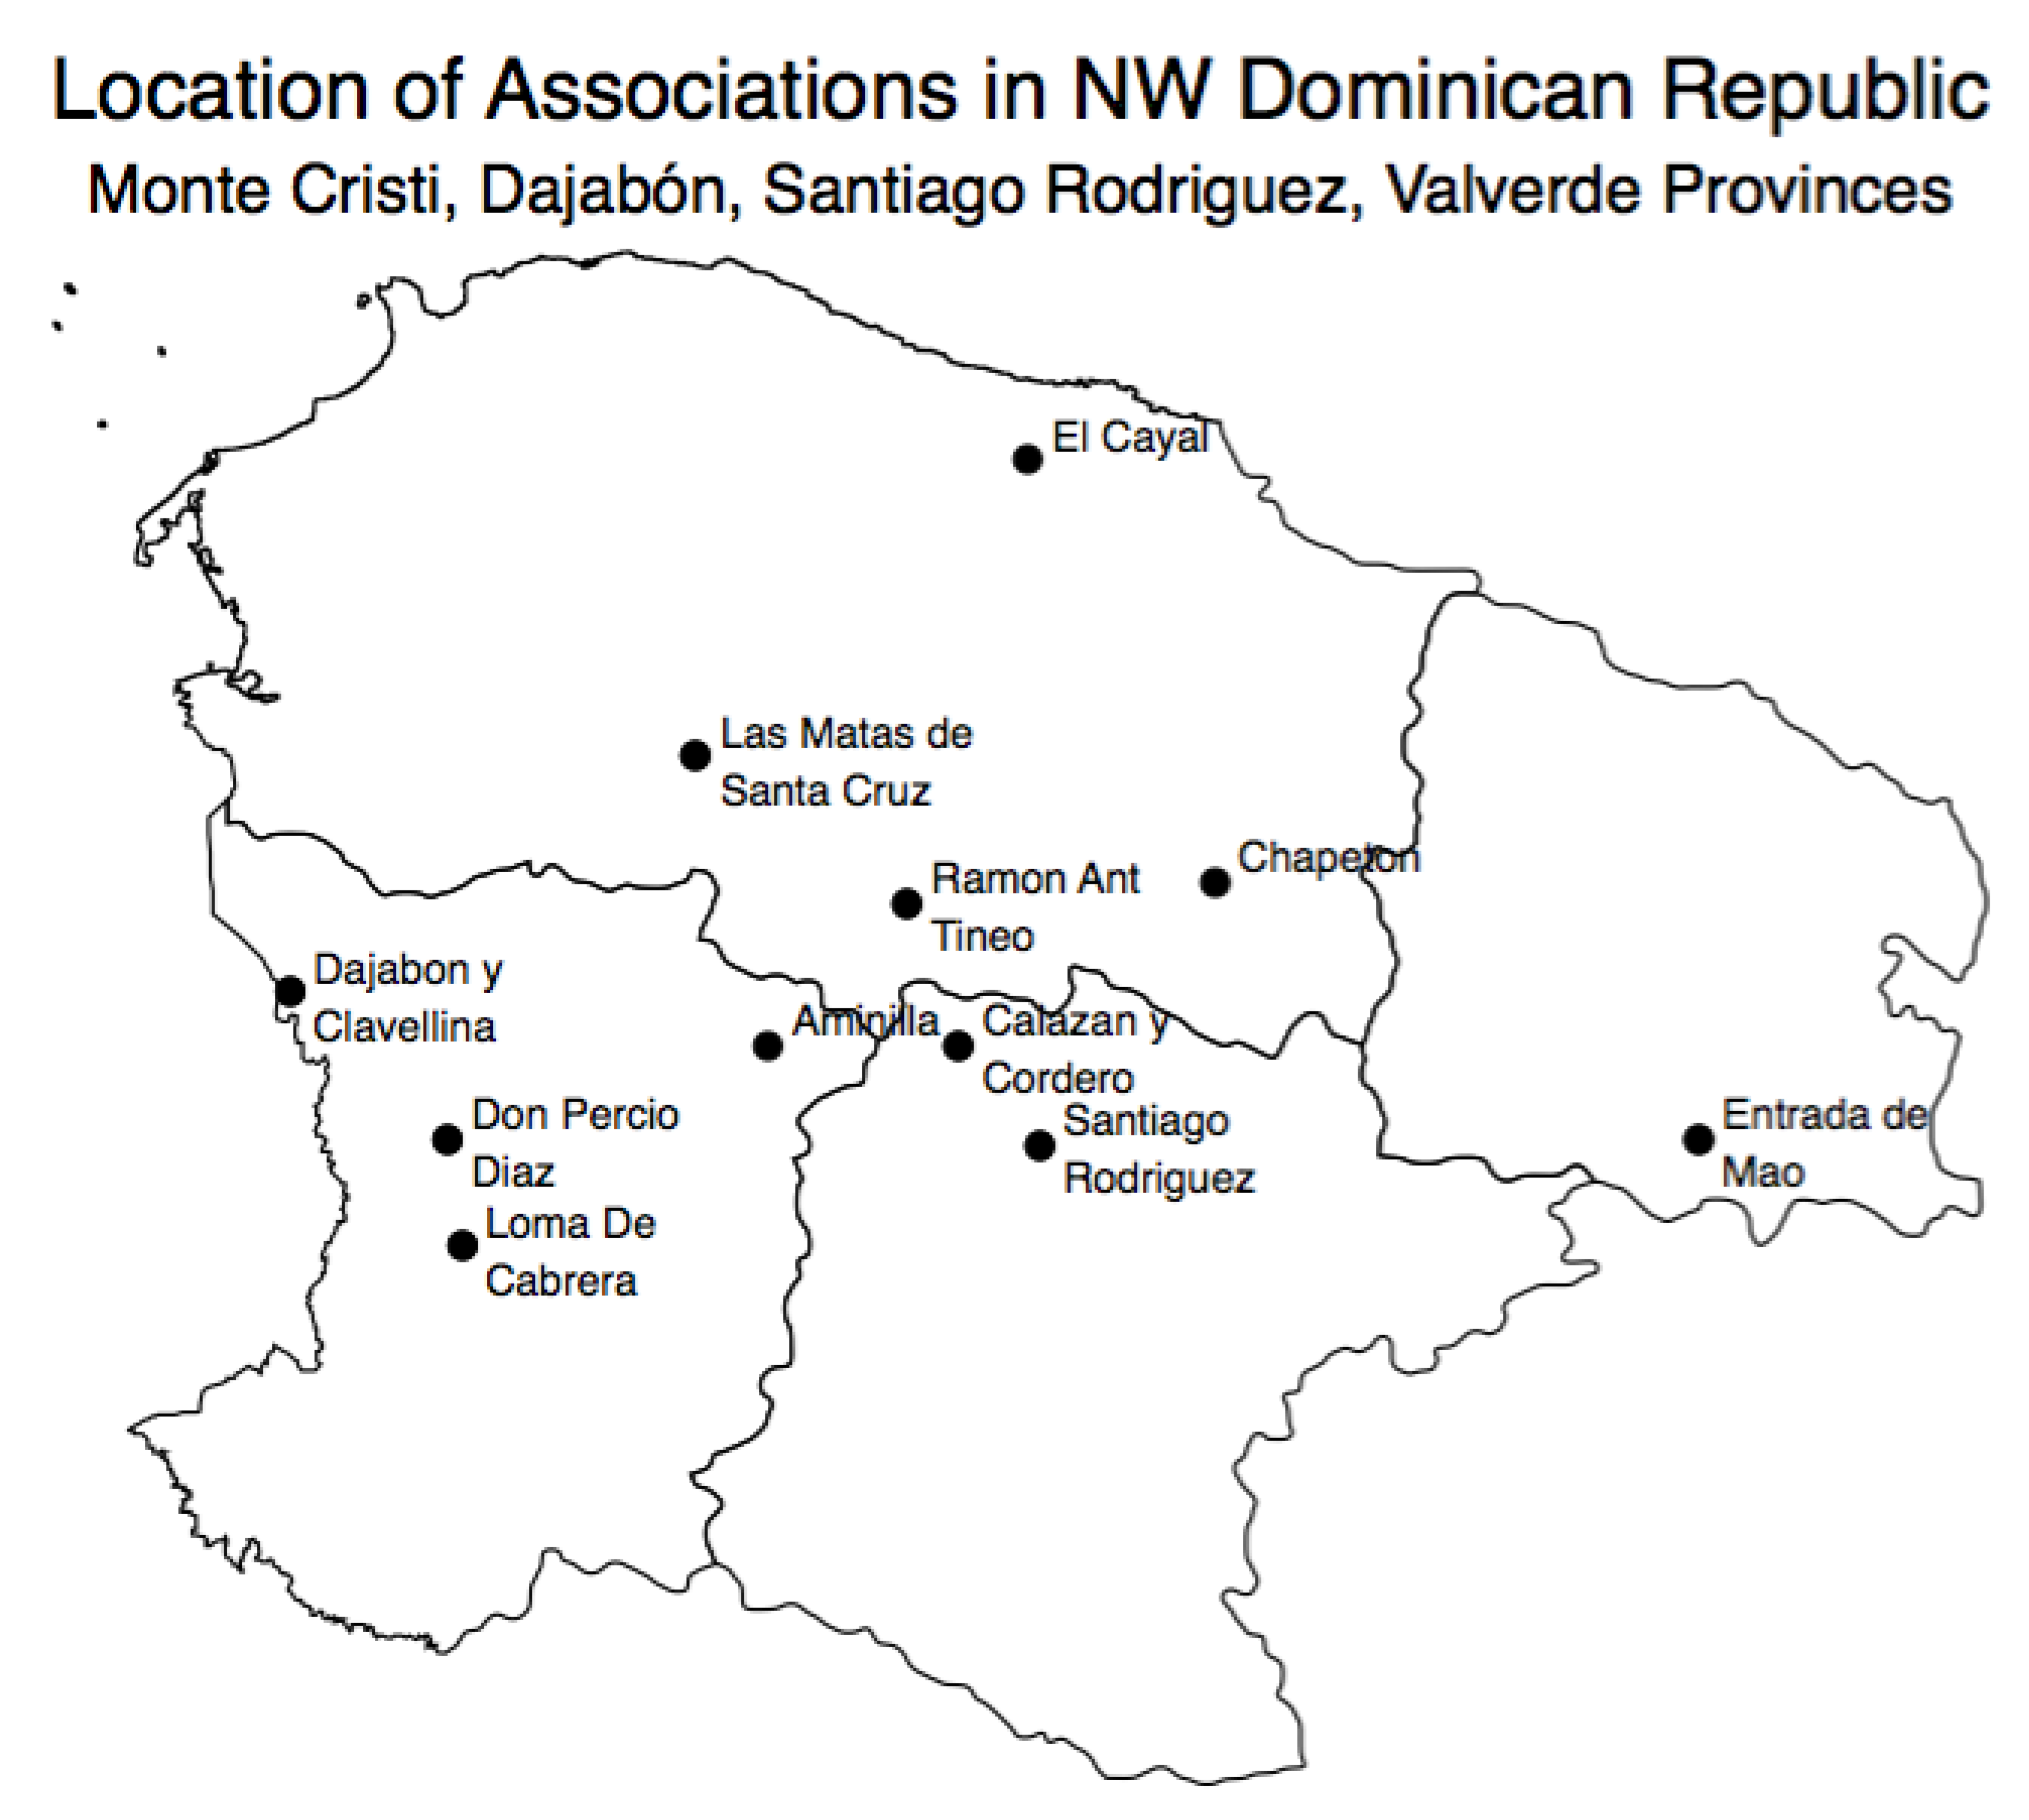
Table 1.
Number of Participants by Session.
| Association Name | N |
|---|---|
| Aminilla | 44 |
| Calazan y Cordero | 45 |
| Chapeton | 28 |
| Dajabon and Clavellina | 39 |
| Don Percio Diaz | 34 |
| El Cayal | 24 |
| Entrada de Mao | 36 |
| Las Matas de Santa Cruz | 21 |
| Loma De Cabrera | 27 |
| Ramon Ant Tineo | 32 |
| Santiago Rodriguez | 24 |
| Total | 354 |
Table 2.
Balance Across Group (GRP) and Individual (IND) Sessions.
| Variable | IND | GRP | IND SD | GRP SD | Pval | N |
|---|---|---|---|---|---|---|
| Age | 57.9 | 52.99 | 12.93 | 13.67 | 0.0029 *** | 341 |
| Male | 1.93 | 1.93 | 0.25 | 0.26 | 0.82 | 355 |
| Education * | 1.92 | 2.12 | 1.44 | 1.64 | 0.22 | 350 |
| No. Cows 2013 | 20.96 | 21.65 | 24.08 | 20.34 | 0.78 | 320 |
| No. Cows 2014 | 19.18 | 20.58 | 21.82 | 19.74 | 0.54 | 333 |
| Pasture (acre) | 35.24 | 34.42 | 38.94 | 50.86 | 0.87 | 338 |
| Irrigated pasture (acre) | 3.99 | 3.36 | 8.52 | 11.36 | 0.58 | 319 |
| Projected Labor Costs 2014 (DR Pesos) | 180,893 | 133,579 | 516,002 | 185,437 | 0.27 | 309 |
| Knows of insurance | 0.53 | 0.5 | 0.5 | 0.5 | 0.53 | 341 |
| Knows of index insurance | 0.2 | 0.17 | 0.4 | 0.37 | 0.39 | 326 |
p-value based on a t-test comparing means across IND versus GROUP sessions for age, gender, education* level, number of cows owned in 2013 and 2014, total pasture owned in acres, total irrigated pasture land in acres, total labor costs for the 2014, a binary variable of whether the participant was familiar with any insurance, and a binary variable for whether the participant was familiar with index insurance. * 1, Primary; 2, Secondary; 3, Tertiary; 5, College; 6, Beyond College. *** p < 0.01.
Table 3.
Balance Across High and Low Distance Groups.
| Variable | Low | High | Low Distance | High Distance | Pval | N |
|---|---|---|---|---|---|---|
| Age | 54.35 | 50.46 | 11.3 | 15.53 | 0.1 | 133 |
| Male | 1.93 | 1.9 | 0.26 | 0.31 | 0.57 | 135 |
| Education * | 2.21 | 2.22 | 1.78 | 1.63 | 0.98 | 134 |
| No. Cows 2013 | 24.22 | 18.58 | 22.32 | 18.5 | 0.14 | 119 |
| No. Cows 2014 | 20.51 | 17.55 | 14.84 | 22.17 | 0.38 | 127 |
| Pasture (acre) | 29.34 | 27.82 | 29.37 | 50.05 | 0.84 | 127 |
| Irrigated pasture (acre) | 2.61 | 2.2 | 4.71 | 3.86 | 0.61 | 117 |
| Projected Labor Costs 2014 (DR Pesos) | 121,615 | 129,261 | 103,957 | 212,156 | 0.8 | 119 |
| Knowledge of insurance | 0.46 | 0.54 | 0.5 | 0.5 | 0.38 | 126 |
| Knowledge of index insurance | 0.14 | 0.21 | 0.35 | 0.41 | 0.29 | 125 |
p-value based on a t-test comparing means across LOW versus HIGH distance groups in GRP sessions for age, gender, education* level, number of cows owned in 2013 and 2014, total pasture owned in acres, total irrigated pasture land in acres, total labor costs for the 2014, a binary variable of whether the participant was familiar with any insurance, and a binary variable for whether the participant was familiar with index insurance. * 1, Primary; 2, Secondary; 3, Tertiary; 5, College; 6, Beyond College. Low distance is synonymous with groups that perceived themselves to be more similar in farm size.
Table 4.
Mean Endowment Allocation Across Individual (IND) and Group (GRP) Treatments.
| Variable | IND | GRP | p-Value |
|---|---|---|---|
| Insurance Purchased | 330.29 | 296.03 | 0.0001 *** |
| Savings | 58.33 | 79.90 | 0.0008 *** |
| Community Savings | 18.11 | 21.11 | 0.01 ** |
| Take Home | 18.268 | 27.94 | 0.09 * |
p-value based on a t-test comparing means across groups. *** p < 0.01, ** p < 0.05, * p < 0.1.
Table 5.
Effect of Offering Group Insurance on the Amount of Insurance Purchased.
| (1) | (2) | |
|---|---|---|
| VARIABLES | OLS | OLS |
| Group | −38.81 * | −38.32 * |
| (21.59) | (21.43) | |
| Monthly | 25.61 | 25.65 |
| (21.64) | (21.66) | |
| Age | 0.115 | |
| (0.304) | ||
| Constant | 321.7 *** | 315.1 *** |
| (22.15) | (24.43) | |
| Observations | 354 | 354 |
| R-squared | 0.067 | 0.068 |
Standard errors clustered at the session level. *** p < 0.01, * p < 0.1.
Table 6.
Mean Values Across Low and High Distance Groups.
| Variable | Low Distance | High Distance | p-Value |
|---|---|---|---|
| (Similar) | (Dissimilar) | ||
| Distance | 5.26 | 15.95 | 0.0026 *** |
| Purchased in Group | 80% | 56% | 0.0058 *** |
| Premium Purchased | 281 | 321 | 0.0003 *** |
| Total Reported No. Group Cows | 51.59 | 32.31 | 0.0017 *** |
p-value based on a t-test comparing means across groups. Distance measures the average difference in cow ownership between members in a group. Low distance is synonymous with groups that perceived themselves to be more similar in farm size. Purchased in Group is the percent of participants in group sessions who chose to purchase group over individual insurance contracts. Premium Purchased is the amount of insurance (regardless of contract type) purchased in Dominican pesos. Total Reported No. Group Cows are the total number of cows that a farmer owned. *** p < 0.01.
Table 7.
Effect of Distance on Uptake of Group versus Individual Insurance.
| Marginal Effects, Group Sessions | ||
|---|---|---|
| (1) | (2) | |
| VARIABLES | Probit | IV Probit |
| Monthly | −0.173 | 0.142 |
| (0.136) | (0.554) | |
| Age | −0.00675 ** | −0.0110 |
| (0.00266) | (0.0110) | |
| Total Own Cows | −0.00139 | −0.0103 ** |
| (0.00220) | (0.00407) | |
| Distance | −0.0279 *** | |
| (0.00472) | ||
| High–Low | −0.173 | |
| (0.141) | ||
| Observations | 125 | 125 |
Standard errors clustered at the session level. *** p < 0.01, ** p < 0.05.
Table 8.
Effect of Distance on the Amount of Insurance Purchased in Groups.
| Group Sessions | ||
|---|---|---|
| (1) | (2) | |
| VARIABLES | OLS | IV Reg |
| Monthly | 16.21 | 1.122 |
| (18.31) | (39.44) | |
| Age | 0.322 | 0.389 |
| (0.424) | (0.709) | |
| Total Own Cows | 0.150 | 0.477 |
| (0.242) | (0.464) | |
| Distance | 2.388 * | |
| (1.389) | ||
| High–Low | 60.34 *** | |
| (17.96) | ||
| Constant | 249.8 *** | 219.2 *** |
| (25.78) | (49.26) | |
| Observations | 82 | 82 |
| R-squared | 0.266 | −0.940 |
Standard errors clustered at the group level. *** p < 0.01, * p < 0.1.
Table 9.
Effect of Perceived Farm Size on the Amount of Insurance Purchased in Groups.
| Group Sessions | |
|---|---|
| (1) | |
| VARIABLES | IV |
| Monthly | 18.26 |
| (29.02) | |
| Age | 0.885 * |
| (0.492) | |
| Total Own Cows | 1.132 |
| (1.067) | |
| Perceived Cows in Group | −3.371 ** |
| (1.341) | |
| Constant | 306.9 *** |
| (47.15) | |
| Observations | 82 |
Standard errors clustered at the group level. *** p < 0.01, ** p < 0.05, * p < 0.1.
Table 10.
Effect of Offering Group Insurance on Exit Survey Comprehension Questions.
| (1) | (2) | (3) | (4) | |
|---|---|---|---|---|
| Variable | Premium | After Rain | Basis Risk | Satellite |
| Group | −0.0232 | −0.0370 | 0.0392 | 0.108 |
| (0.0919) | (0.0701) | (0.0695) | (0.0838) | |
| Monthly | −0.0266 | −0.0798 | −0.156 * | −0.120 |
| (0.0940) | (0.0750) | (0.0749) | (0.0759) | |
| Age | 0.00395 *** | 0.000640 | 0.000671 | 0.00115 |
| (0.00126) | (0.00164) | (0.00183) | (0.00198) | |
| Constant | 0.00633 | 0.208 * | 0.688 *** | 0.770 *** |
| (0.0990) | (0.103) | (0.127) | (0.138) | |
| Observations | 254 | 265 | 268 | 260 |
| R-squared | 0.022 | 0.017 | 0.026 | 0.033 |
Standard errors clustered at the session level. *** p < 0.01, * p < 0.1. Premium: Premiums would be returned if no bad weather ever occurs (False). After Rain: You can purchase insurance after a bad event occurs (False). Basis Risk: If you have a bad year, you may not get a payment if the index measure indicates a good year (True). Satellite: Satellite-based vegetation measure will always reflect the health of my own pasture (False).
© 2020 by the authors. Licensee MDPI, Basel, Switzerland. This article is an open access article distributed under the terms and conditions of the Creative Commons Attribution (CC BY) license (http://creativecommons.org/licenses/by/4.0/).
Share and Cite
MDPI and ACS Style
Vasilaky, K.; Martínez Sáenz, S.; Stanimirova, R.; Osgood, D. Perceptions of Farm Size Heterogeneity and Demand for Group Index Insurance. Games 2020, 11, 15. https://doi.org/10.3390/g11010015
AMA Style
Vasilaky K, Martínez Sáenz S, Stanimirova R, Osgood D. Perceptions of Farm Size Heterogeneity and Demand for Group Index Insurance. Games. 2020; 11(1):15. https://doi.org/10.3390/g11010015
Chicago/Turabian StyleVasilaky, Kathryn, Sofía Martínez Sáenz, Radost Stanimirova, and Daniel Osgood. 2020. "Perceptions of Farm Size Heterogeneity and Demand for Group Index Insurance" Games 11, no. 1: 15. https://doi.org/10.3390/g11010015
Note that from the first issue of 2016, this journal uses article numbers instead of page numbers. See further details here.