1. Introduction
Recent studies on energy efficiency are moving towards more strategic energy management practices that highlight the need for an information system able to set goals, track performance and communicate results.
Some countries are developing their electric power grids in the direction of smart grids that combine information technology, communication technology, computer technology with generation, transmission and distribution power systems [
1]. It is quite clear that the development of the smart grid is a priority because it represents an opportunity to obtain a supply chain of electricity that is secure and reliable, efficient, economical, clean, green, flexible and integrated. In this scenario, ICT technologies are becoming the core of the smart grid vision and are necessary, for example, to improve the problems of restoring power outages or facilitate the integration of the renewable energy sources.
All that leads to a change in network design principles and in network operation and procedures and pushes towards the decomposition of the problem in three different areas: smart generation, smart grid and smart customer [
2].
The problem is very complex and when discussing about a smart vision for energy management it is necessary to refer not only the physical network [
3] but also to the adoption of fast analysis tools, wide area monitoring, measurement and control (WAMPAC). Moreover, the efficient management of energy sources is also a crucial problem for small-medium-large sized industrial companies and residential applications [
4].
The smart grid is changing the energy market and for large companies the availability of different providers that compete in the energy market is a good news which should theoretically lead to cost savings and advantage of energy quality. However, the single company is rarely able to follow the trend of the energy market and usually it does not have the information necessary to operate an energy efficiency improvement in almost real-time, compared to its actual needs. Typically the problem is solved by evaluating, for example, every couple of years the new offers on the market and deciding to change energy supplier. This approach is static and does not allow any type of optimization due to the different operating conditions of the plant, which normally shows a variable energy need in the same day and at different times of the year. Also, in the big companies this approach can be very expensive. In brief, it is difficult for a company to control its energy balance and a new approach is needed to provide advanced information, maybe in real-time, to stakeholders in order to facilitate the business plan.
Information technology comes powerfully into play to compensate the current lack of information and intelligence of electrical networks, and efficiently address the new technological and organizational challenges.
In this paper we describe an application in which the technology helps to monitor power system dynamics in real time within the ST Microelectronics industrial site of Catania from remote locations. The purpose of this on-line analysis tool is to create a system with the aim of acquiring information to determine the behavior of the energy system and to better support the future management decisions. To this purpose, the system is designed to capture data from electrical substations in real-time, and to transfer them to the control system which has to analyze the information, also using business intelligence methods. In this way information on the energy usage inside the plant will be available and analysts will be able to perform any kind of data computation in order to better set the plant or drive the energy purchase decisions. The solution permits a self-awareness of the system operation state that will improve operations and control strategies.
The technological solution we adopted is based on a Wireless Sensor Networks (WSNs) communication infrastructure. WSNs are typically used in dynamic and complex environments and are becoming important in a large variety of real applications, from scientific to military domains, such as surveillance or disaster recovery, monitoring and other applications. An example of their successful use is the environmental monitoring: nodes with sensing capabilities, wireless communication and computation are deployed in the physical environment and cooperatively monitor a variety of physical-environmental conditions [
5,
6,
7]. A communication task is correlated to the sensing activity of each node in order to send data (the measured values) to a central elaboration system. Such system is usually the company application (CRM, ERP, business intelligence system,
etc.) that is responsible for handling the data received from the remote devices.
The paper is organized as follow:
Section 2 presents the state of the art about energy monitor solution;
Section 3 introduces the architectural solution;
Section 4 focuses on technological issues;
Section 5 describes the real scenario;
Section 6 presents the implementation issues of the proposed application;
Section 7 reports an analysis of the experimental results obtained from the real testbed. The last section summarizes and provides future developments.
2. Related Works
Addressing smart energy management also implies to focus on how energy is supplied and also on how it is used.
There are many solutions to monitor and manage energy systems also based on the use of WSN. For example, in [
8] a WSN was proposed as a solution for energy evaluation and planning in an industry plant, after considering the disadvantages of the currently wired infrastructures used for data communications, such as high installation costs. WSNs are ideal for the implementation of low-cost solutions for energy evaluation in industrial plants.
In [
9], another application based on WSN was proposed and in particular a scheme for energy usage evaluation and condition monitoring for electric machines was considered. The importance of this scheme lies in its non-intrusive, intelligent, and low-cost nature of the adopted solution.
The smart home energy management system (SHEMS) presented in [
4] is a solution to address efficiency in energy consumption at home level, known as
green home. The solution integrates diversified physical sensing information and control of various consumer home devices, through active sensor networks having both sensor and actuator components.
In this paper, we propose our solution that is a real time tool able to analyze power consumption of an industrial site based on a three layers architecture. The main objectives are (1) a low-cost solution, (2) plug and play installation and (3) easy maintenance. Also we describe the features of the adopted WSN solution, the practical problems, the constraints and design decision tuned on the real objectives. In particular, we adopted a multi-hop routing protocol for WSN able to self-organize the network, to assure flexibility and scalability and finally to assure reliability. Another interesting component of the system is the adopted middleware able to solve the technological integration problems and to manage the big amount data acquired from the sensors.
With respect to the architecture proposed in [
8,
9] our proposal gives a complete integrated hardware and software architecture to monitor energy consumption of a wide industrial plant with a lot of multifunction network analyzers to check. In order to accomplish our mission, we paid particular attention to reliability of the data communication by using a swarm intelligence based routing algorithm; the advantages we obtained have been twofold: (1) a very reliable communication; and (2) a self-organizing network with plug and play capabilities.
The basic idea implemented in our application is similar to that presented in [
4] for the communication technology used. In that case, the authors create a very advanced tool with context aware capabilities thanks to the different kinds of information to manage and the possibility to drive devices according to the environmental events; to this aim they also implemented an ad hoc routing protocol to efficiently manage data exchange. Instead, our application does not support any context aware behavior due to the homogeneity of managed information and the well known location of monitored devices.
3. Architectural Solution
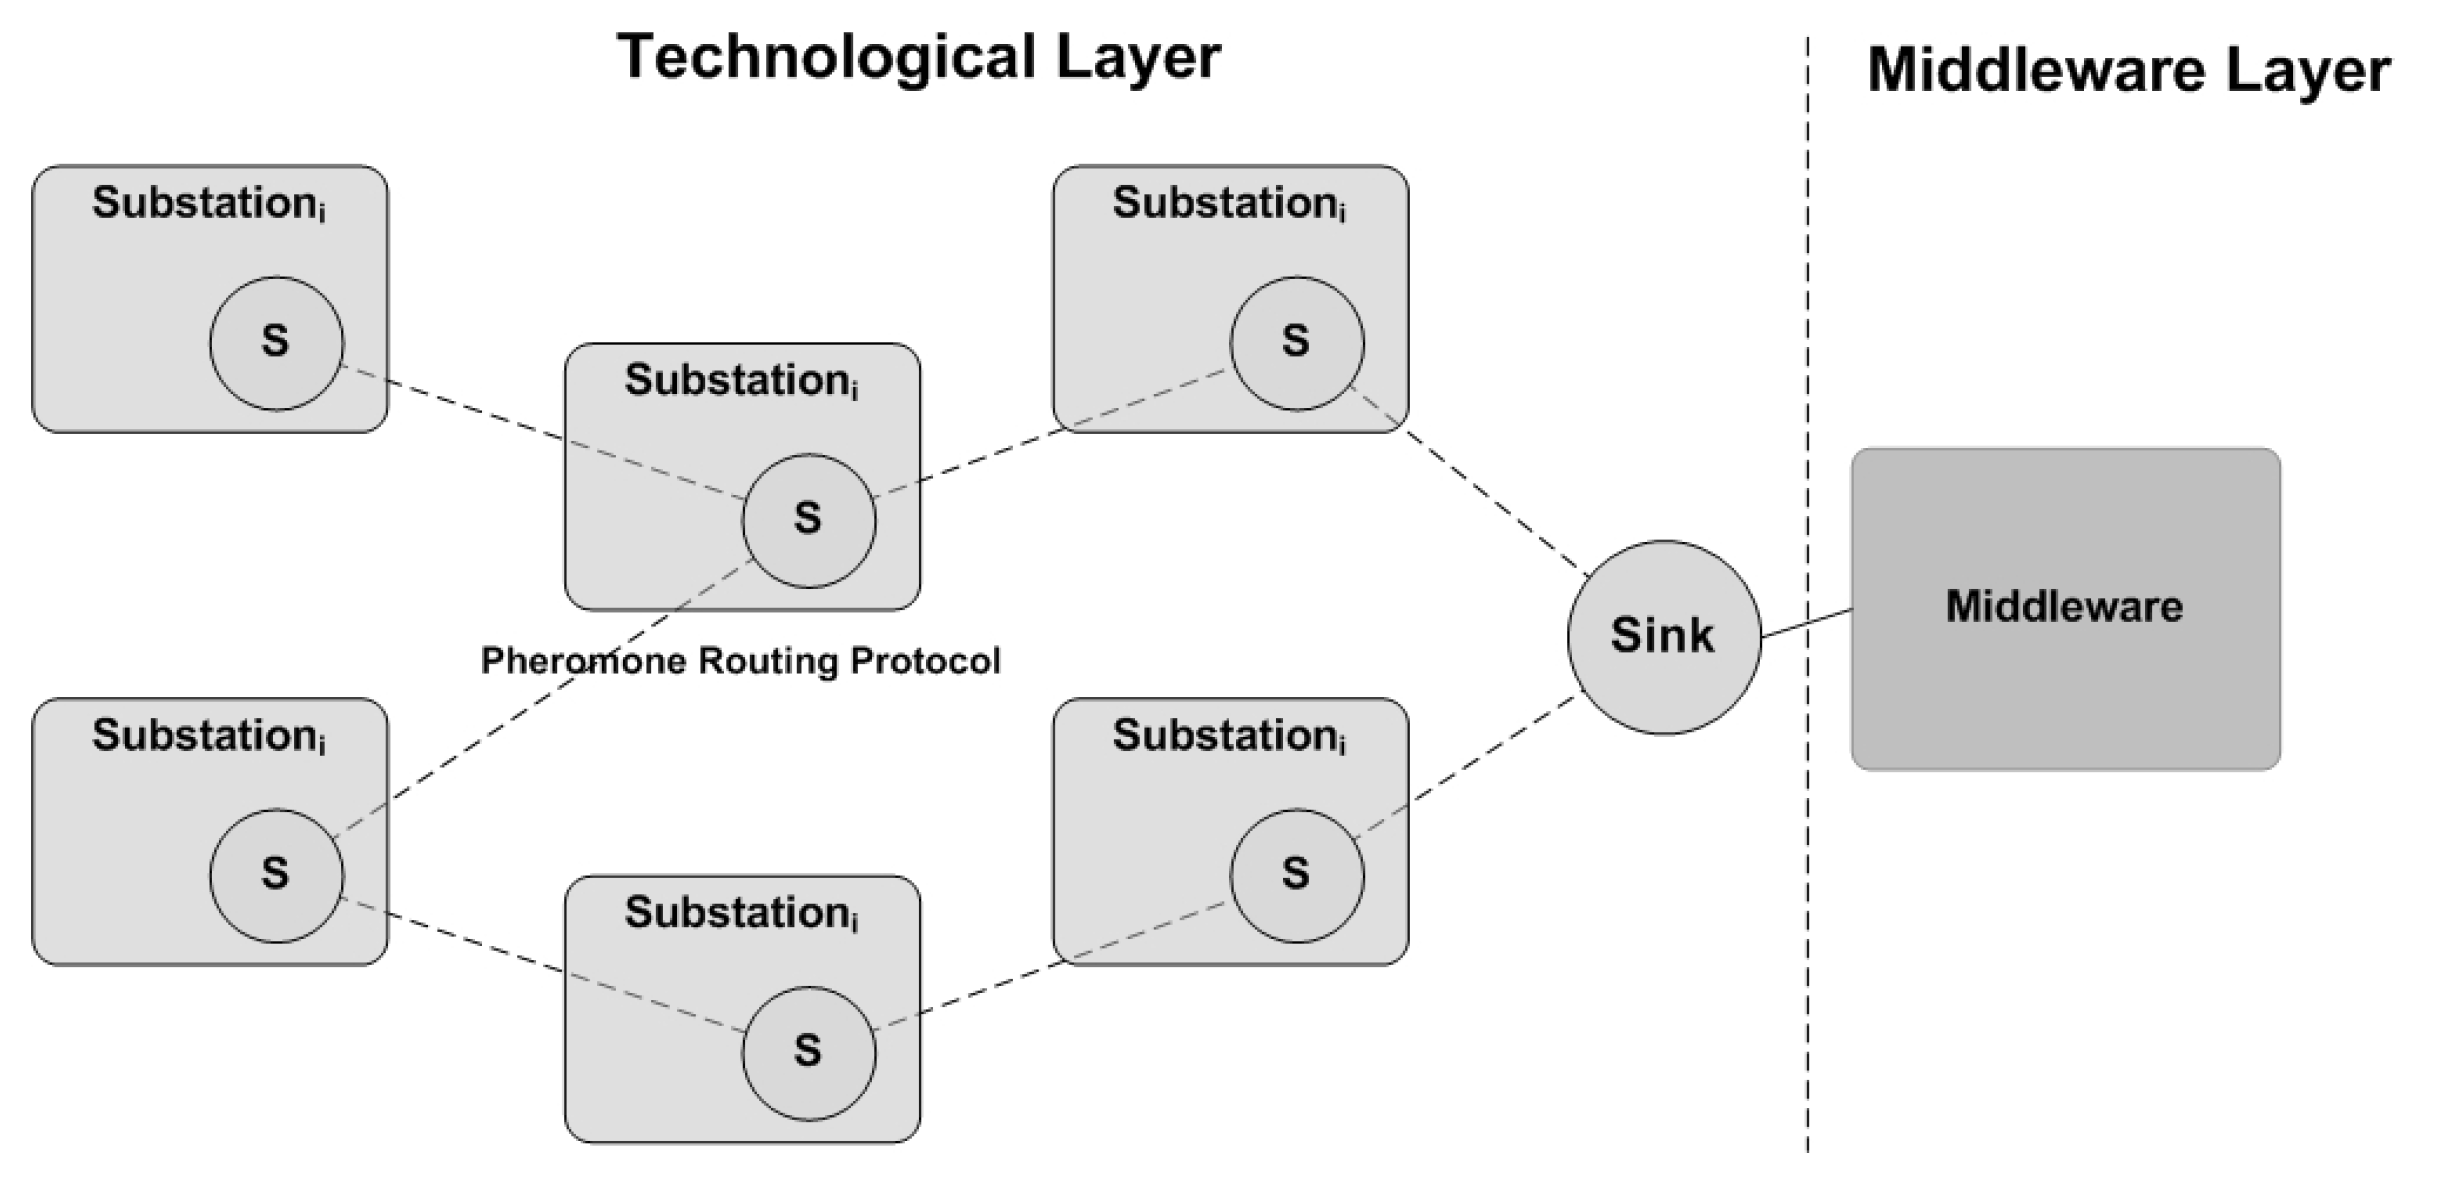
The architecture we designed for remote monitoring of energy consumption is made of three layers: the technological layer, the middleware layer and the application layer.
The technological layer is based on a sensor network that has to monitor the specified area. More specifically, the technological layer implements the monitoring activity of electrical substations and it makes use of two kinds of devices: sensor node and multifunction network analyzer. Sensor nodes have a twofold use: some of them are connected to multifunction network analyzers, which allow the sensing of all the main variables of an electric network, and act as an interface for the communication network; the remaining nodes have no sensing features because they just implement the communication network itself acting as routers towards a central node and allowing the data exchange with the middleware layer.
The reason justifying the use of WSNs in an industrial plant is the need to minimize the impact on the existing infrastructures. In fact, (1) a WSN does not require an underlying wired communication infrastructure; (2) the nodes do not need electrical connectivity if equipped with a battery pack and a solar panel; (3) the communication infrastructure is completely separated from the other internal networks. In addition, we provided the sensor nodes with physical isolation from any possible damage due to weather conditions, designing a water proof packaging system to host node, battery and all the related circuity.
The communication infrastructure works if the nodes are able to autonomously ensure connectivity, addressing and data routing. Thus, the role of the routing protocol becomes crucial to assure features such as adaptability, robustness, scalability and self-organizing capacity; to this purpose we used as routing protocol the
PH-Protocol (
Pheromone Protocol) [
10]. The protocol is based on two different processes. The
signalling process is responsible for the creation of a pheromone gradient towards the sink nodes. Each node estimates its pheromone level by perceiving the environment and by checking its internal state. Also, each node broadcasts its pheromone level to the neighbors using a signalling packet. Finally, each node creates and updates its routing table storing the pheromone level related to its neighbors. Sink nodes are the targets of all data packets in the network and they have the max pheromone level. In fact, the sink nodes broadcast the maximum level of pheromone to their neighbors. When a node receives the signalling packet, it updates its routing table by storing the pheromone of the neighbors. Periodically, each node performs the pheromone evaporation to decrease the pheromone level of its neighbors and updates its routing tables. The update of the pheromone level may occur also if a change on the internal state of the node is detected. In this way the pheromone gradient is created in the whole network. The evaporation mechanism is necessary to avoid that the pheromone level increases indefinitely and the system does not reach the steady state. The main task of the
routing process is delivering data packets towards the sink. The rule is straightforward: each node selects the next hop, among its neighbors, according the pheromone level stored in its routing table. In particular, each node forwards data packets to the hop with the highest pheromone level. In brief, data flow reaches the sink following the pheromone gradient in the network. Further details on the Pheromone Protocol and its performance can be found in [
10,
11,
12,
13].
The middleware layer is a software layer interposed between the technological layer and the application layer with the purpose to interface the software application with the physical devices. It process the data and sends them to the application layer.
Data processing is an heavy problem, certainly different from the data monitoring but by no means secondary. In general, to monitor a particular area we have many devices, also with different technologies, and the central system has to process a huge amount of data from different devices and, sometimes, from different networks. In brief, there is an integration problem between physical and application layer. In these cases, it is necessary to devote particular care to successfully ensure
data interchange and
technology integration [
14] with the use of an appropriate
middleware.
However, the matter is not primarily limited to technological integration. In fact, the availability of a powerful and reliable integration mechanism is crucial for the management of big amount of information received by the devices, to clean the data affected by errors and to filter them according to precise rules. Last but not least, the middleware becomes essential to make data available (dispatching) to the software applications in a simple and reliable way by favoring the integration towards the upper level [
15,
16,
17]. The middleware layer must assure flexibility and scalability, and must support the processes of integration by reducing costs and improving the effectiveness of the business processes.
WhereX [
18] is the solution we adopted as middlware layer. WhereX is an innovative
event-based [
19] middleware made by the Wireless and RFID laboratory of the University of Messina. WhereX is able to assure an effective technological abstraction, switching from a vision linked to specific interfacing issues (Sensor Network, GPS, WiFi, RFID device, ZigBee,
etc.) to the management of the events generated by each device. This approach allows to integrate the management logic of different devices. Furthermore, it includes a rule engine that can detect whether a specific condition holds, appropriately reacting by filtering, and potentially cleaning, all the events generated by the devices. Finally, the middleware is equipped with a very flexible and scalable software architecture based on SOA [
20,
21] and the XMPP communication protocol. All these characteristics ensure an appropriate guarantee towards future technological evolutions.
On the top of the reference architecture is the application layer that handles the data acquired by sensors (the measured values) and allows the manager to analyze the data of energy consumption both in real-time and in historical mode.
4. Technological Issues
To implement the proposed monitoring system we used the following software and hardware technologies.
4.1. The Sensor Node
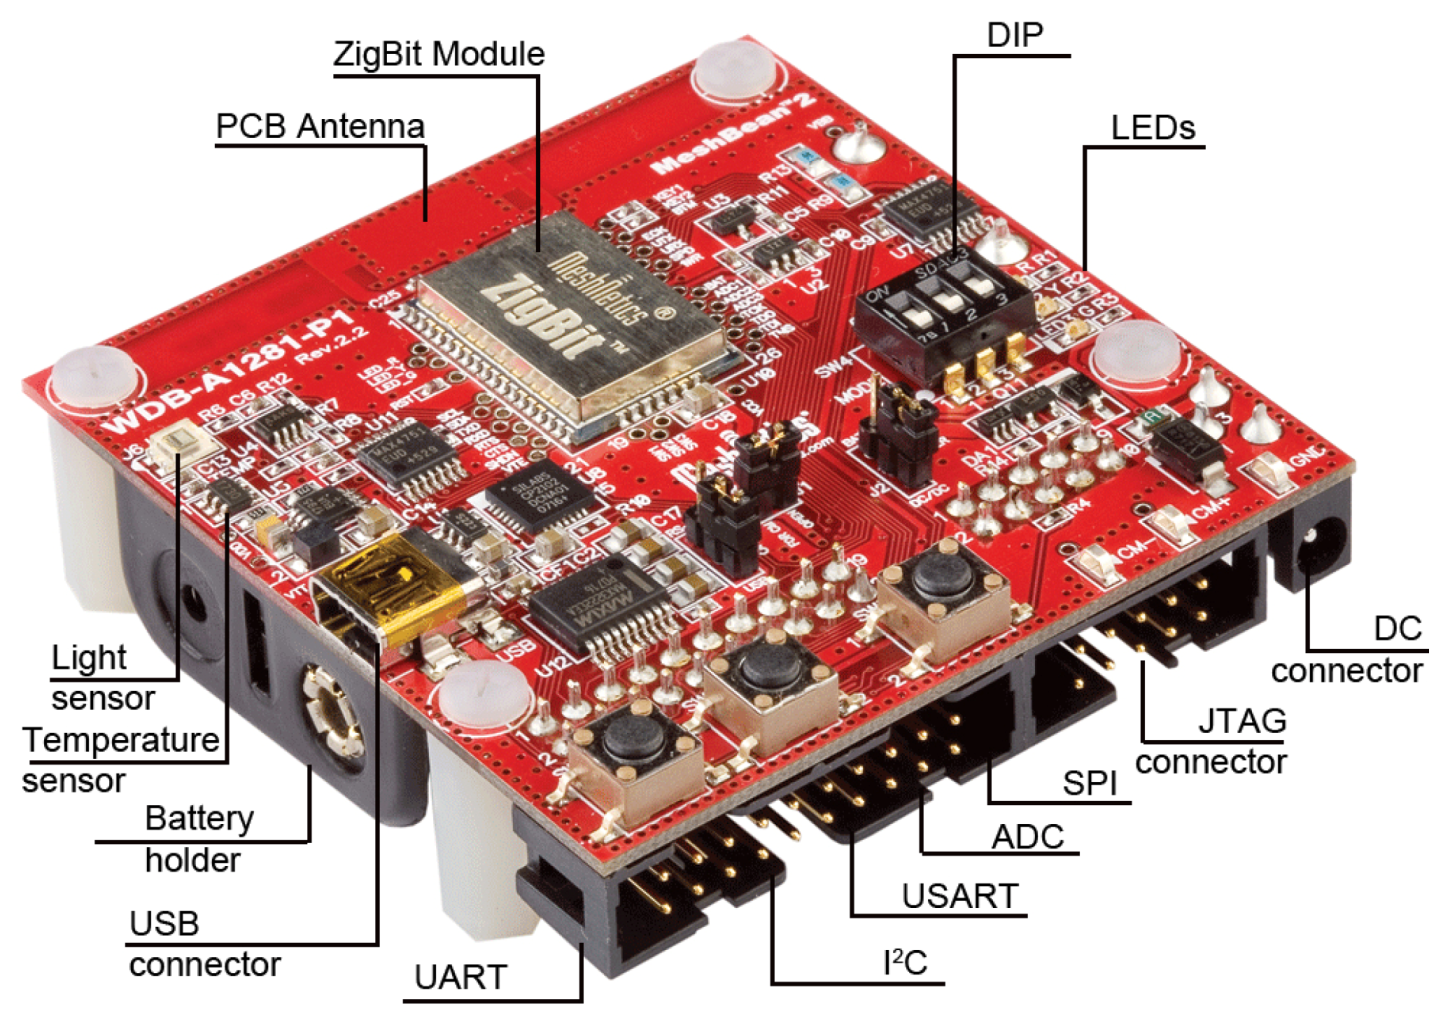
The sensor nodes used for our WSN are produced by MeshNetics. The board of each node (see
Figure 1) contains the ZigBit module, which operates as the ZigBee/802.15.4 transceiver. It also includes sensors, buttons, DIP-switches, and a set of interfaces including USB 2.0 port.
The main features of this component can be summarized as follows:
• ZigBit module: it is an ultra-compact, low-power, high sensitivity 2.4 GHz 802.15.4/ZigBee OEM module from MeshNetics. The ZigBit module is based on Atmel’s Z-Link 2.4 GHz platform and includes ATmega1281V Microcontroller and AT86RF230 RF Transceiver.
• Sensors: the board incorporates light sensor TSL2550T from TAOS and temperature sensor LM73CIMK from National Semiconductors. Both sensors are connected in parallel to the I2C BUS.
• USB to UART Bridge: CP2102, the USB to UART Bridge controller from Silicon Labs is installed on the board. It provides seamless USB interface to any RS-232 legacy device. The USB port is visible on the PC as generic COM port with a particular number.
• Silicon Serial for UID storage: UID (Unique Identifier) is HEX value, 8 bytes long. UID is used for setting unique MAC address of the node and is an hardware-defined value which is programmed into a chip (Silicon Serial Number DS2411R+ by Maxim/Dallas). UID is unique, and cannot be overwritten.
Figure 1.
The MeshNetics sensor board.
Figure 1.
The MeshNetics sensor board.
4.2. The Multifunction Network Analyser
Each electrical cabin is equipped at least with one FRER Q96U4 that is a multifunction network analyser. This device allows the visualization, on a single unit, of all the main variables of an electric network including active and reactive energy counting. In addition, an RS485 interface is available for connectivity purposes. The serial interface allows to integrate the instrument in supervision and/or energy management systems. The used protocol is ModBus in ASCII or RTU mode. Up to 99 instruments can be connected on the same RS485 line, at a maximum distance of 1200 meters.
The measurement of the main variables (currents and voltages) is performed through sampling which allows the correct computation of the True Root Mean Squared (TRMS) value even in presence of distorted waveforms, often encountered in modern electrical installation.
In addition, the device computes and provides additional information useful to verify the good behavior of the system, to evaluate the energy withdrawing and to prevent from exceeding the contractual limits. These additional measures are:
• the average current (thermal current) computed over a given time interval,
• the maximum value reached by the thermal current,
• the average active power computed over a given time interval,
• the maximum value reached by the average active power (maximum demand),
• the active energy,
• the reactive energy.
4.3 Event-Based Middleware Description
The role of the middleware layer is to offer the best solution to easily deal with data integration. A good definition of middleware could be “a layer of software that resides between the business application and the devices layer of heterogeneous platforms and protocols” [
22]. It decouples the business applications from any dependencies form the underlying layer, which consists of heterogeneous operating systems, hardware platforms and communication protocols. In other words, the presence of a middleware to build distributed systems relieves developers from knowledge of low-level details related to the network, like concurrency control, transaction management, network communication, so that they can focus only on application requirements. Some examples of middleware successfully used are: CORBA from the Object Management Group (OMG) [
23], Microsoft COM [
24], SUN Java RMI [
25], IBM’s MQSeries [
26], and Remote Procedure Calls (RPCs) introduced by SUN in ’80s.
WhereX introduces significant perspectives to enterprise system integration, by extending the interoperability concept and by promoting new forms of collaboration; moreover, it is based on a careful management of context awareness, mobility and seamless connectivity. Its final goal is to provide a solution compliant to the use of Web services and able to provide multichannel communications.
The purposes of the middleware can be summarized in: simultaneous management of many objects and readers, even with different technologies; management of many sensors placed on wide surfaces, not covered by previous infrastructures; high scalability to meet the requirements of modern and dynamic companies; on- and off-line interfacing with mobile devices.
The architecture has been created by paying attention to functional modularity, and for this reason the use of the SOA philosophy has been fundamental also for the internal processes of the middleware [
27]. This gives a high level of flexibility and scalability to the system. The main functional components of the middleware architecture are:
• Collection (Drivers and Hub): they are two distinct components that implement two solutions (Direct and Logical entities) that both aim at data acquisition from physical devices; in the Direct solution the physical devices are directly interfaced/connected to the middleware via Ethernet, USB, RS232, Bluetooth, or any other interface;
• Data Filtering (Filter): it is the component that filters data, removes the data affected by errors, removes redundant data, and aggregates information;
• Events Management (Rule): its task is to generate customisable events, depending on specific conditions. This component enables the separation of the event management from the specific physical device generating the event itself;
• Data Dispatching (Dispatcher): it dispatches data to and from the components of the system, and to the applications outside the system; it arranges information for communicating with software applications interacting with the middleware. The most recent communication protocols supported by the middleware, improving its integration in enterprise systems, are HTTP, XMPP, JMS, WS, SMS and Database; they can even be simultaneously adopted, thus providing a powerful multichannel communication feature.
• Data Storage (Local Repository): it plays two important roles; storing the configuration parameters of the system and keeping the history of the data detected in order to perform statistic processing or to create business intelligence.
• Middleware Configuration (Admin): it provides the interaction tools for the system administration by a powerful console made through a user-friendly web interface.
5. Scenario Description
The site where the application is installed is the ST Microelectronics of Catania (Italy) located in an area of roughly 250,000 m2.
In industrial areas, radio frequency devices can be affected by several external and environmental factors (like electromagnetic pollution, vibration, heat, and so on) that may impair the operating conditions. These factors can reduce reliability and consistency of information exchange. For these reasons, before installing the sensors, we analysed the site of interest with an electromagnetic detector field focusing the attention on the range of frequencies used for the communication. The purpose of the analysis was the identification of possible interferences due to the presence of electromagnetic fields. The result we got was negative; i.e., the area was free from interference in the range of frequencies used by the sensor nodes.
This allows the installation of the WSN by reducing the numbers of nodes required to cover the area. Also, this allows us to pre-determine and plan the ideal allocation of sensors, thus ensuring a more efficient network operation.
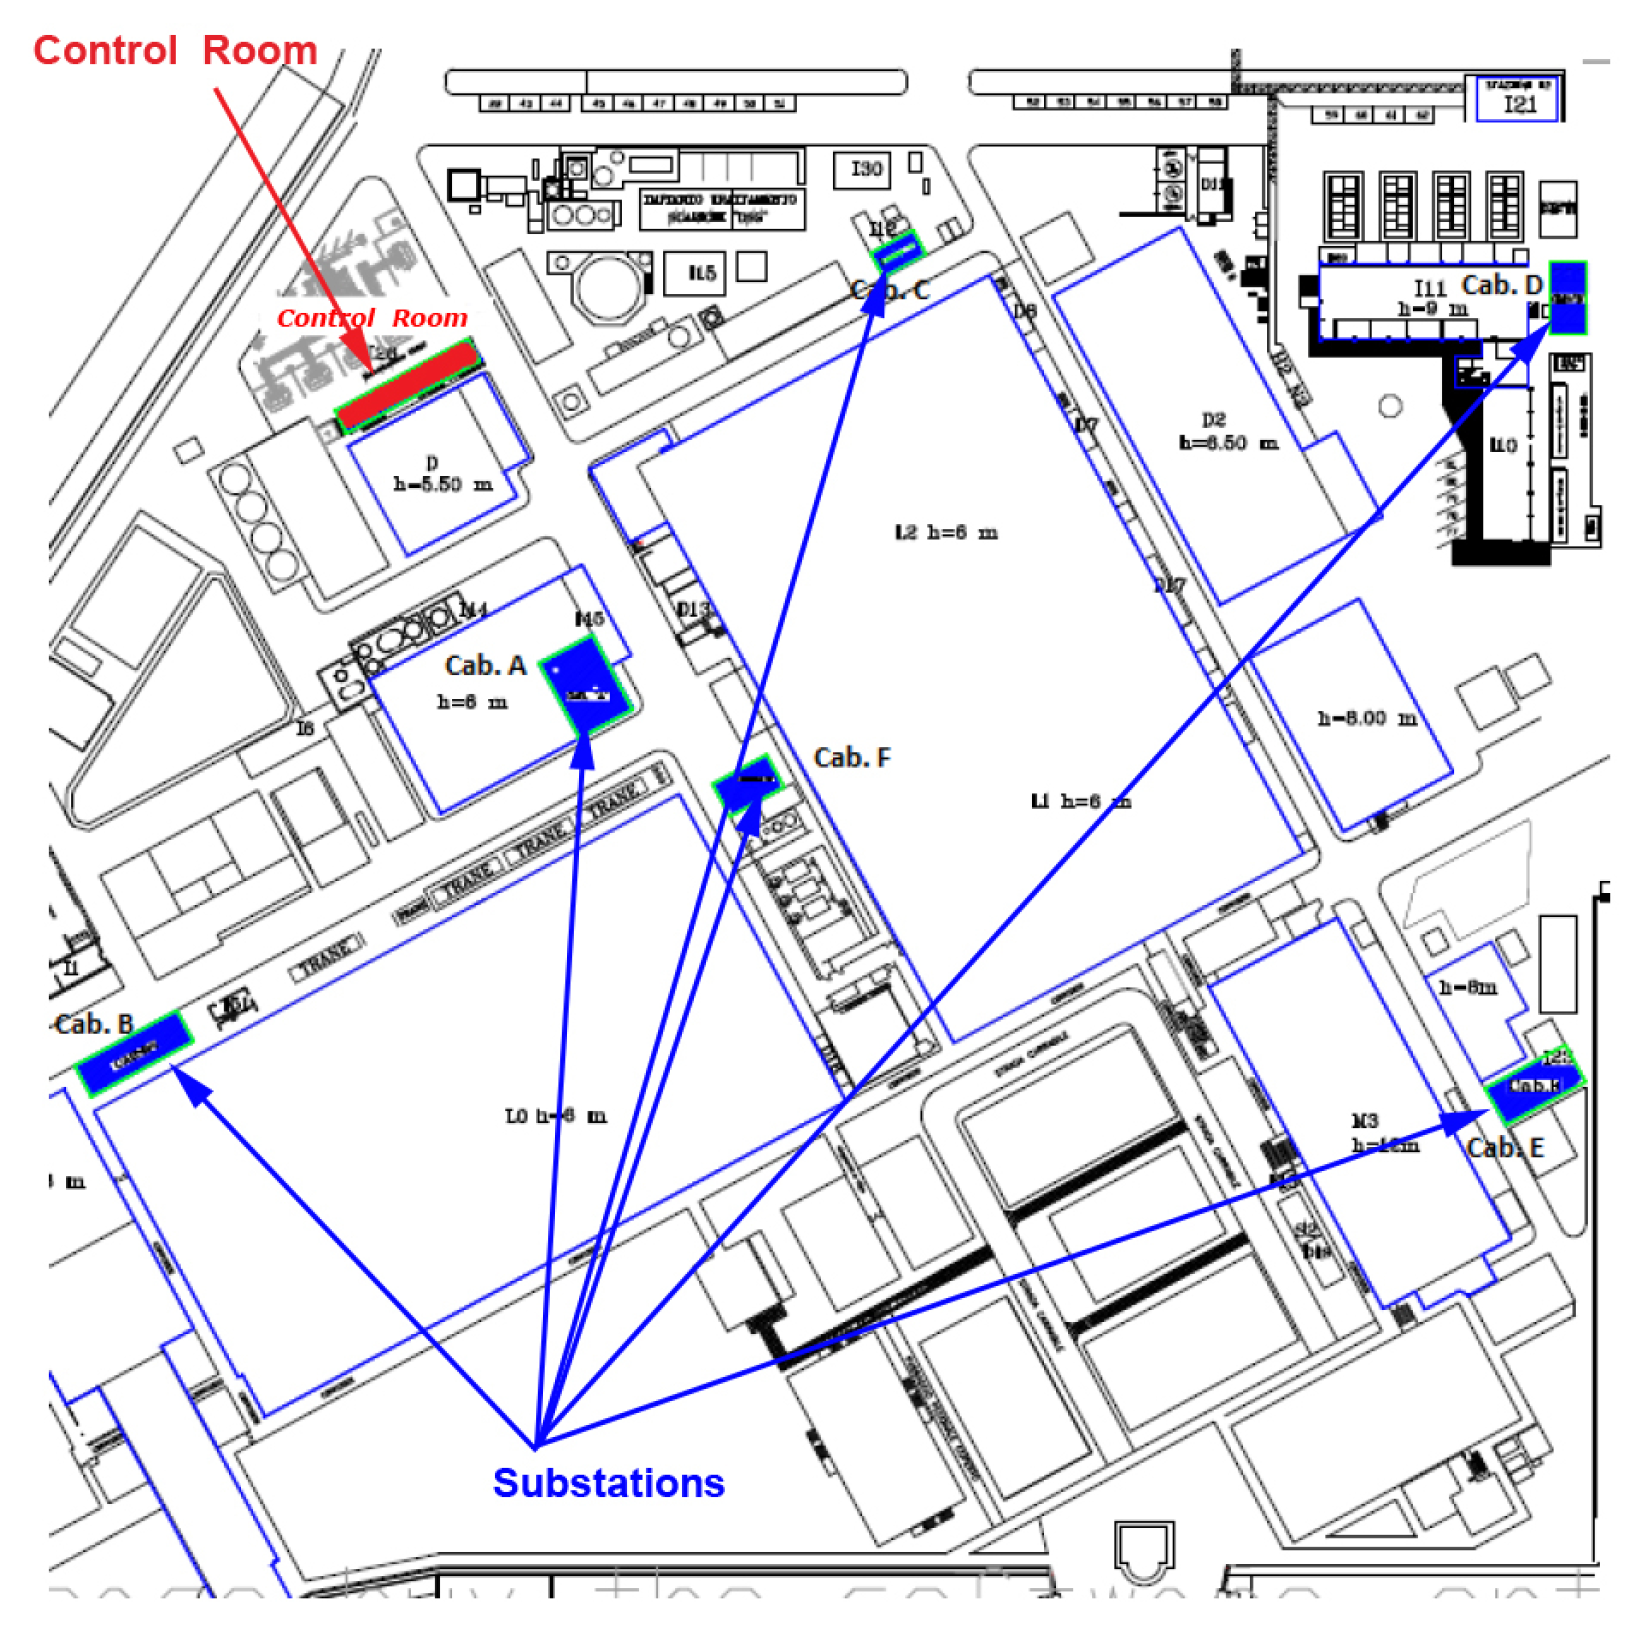
Moreover, in the installation site there are several buildings with different heights and size, thus increasing the complexity of the problem. In the site there are 12 electric substations to be monitored. During the design phase, we decided to for the first step limit the number of the electric substations to monitor to 6. We also faced the problem of having one substation located underground. All the acquired data from each substation have to be forwarded to the control room.
Figure 2 shows some details of the monitored area, the location of the sensor nodes (installed into the electrical substations) and the control room.
Figure 2.
Details of the monitored area.
Figure 2.
Details of the monitored area.
6. Application Description
The overall application has the goal of monitoring the ST industrial site with particular attention to the power consumption within the whole industrial site. The following layers were set up according to the architecture just described.
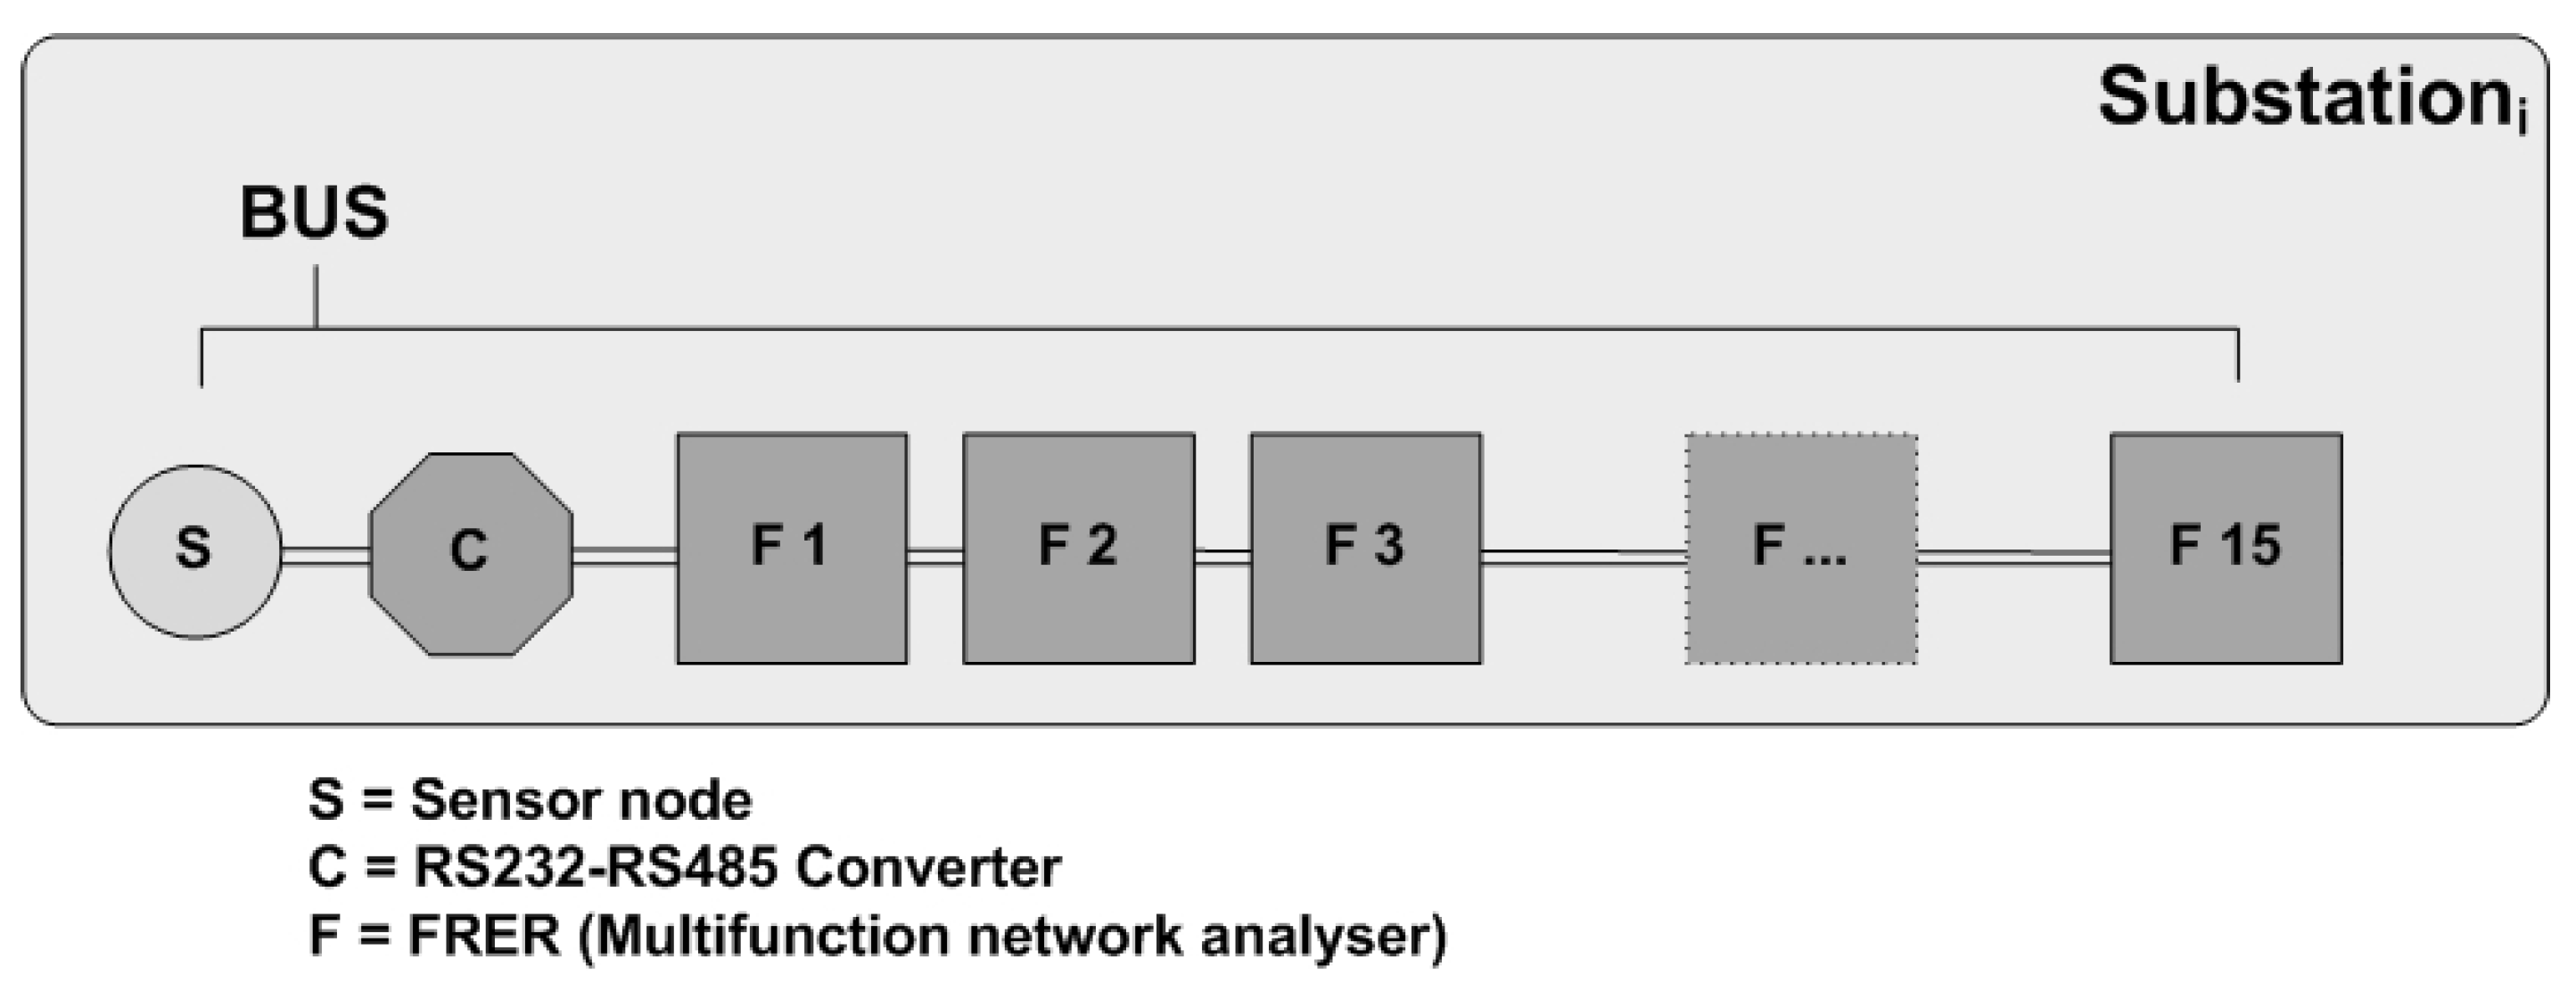
The technological layer is responsible for data acquisition from the electrical substations located inside the industrial site. This monitoring activity is achieved by a WSN. Inside the substations, the multifunction network analyzers (FRER Q96U4) provide the visualization of all the main characteristics of the electric network activities. Each electrical substation can have one or more BUS, each with a maximum of 12 multifunction network analyzers connected in parallel mode.
One sensor node is physically connected to the BUS via a serial interface converter RS232-RS485. Each FRER of each BUS is identified by a progressive number
Id, with
Id = 1,2,…,12. It is possible to install one or more BUS for each substation: each BUS is uniquely identified by the Mac Address of the wireless interface of the connected node.
Figure 3 shows how the devices are connected.
Figure 3.
Substation: devices connection schema.
Figure 3.
Substation: devices connection schema.
The multifunction network analyzer detects 45 different types of measures. The sensor node, connected to the BUS, cyclically queries each FRER acquiring such 45 values. These values, one by one, are forwarded to the sink node that further elaborates and transfers them to the middleware layer. We can note that, depending on the application requirements, it could be necessary to decrease the maximum number of monitored devices on the BUS to have a shorter polling cycle on them. Let be δ the mean time to read a value from a FRER, M the number of FRER connected on a BUS, and m the number of values to read from a FRER: the time interval incurring between two readings of the same measure is Δ = δ·M·m. If Δ is too long with respect to some specific application requirement, the two quantities M and m must be appropriately set to meet it. M depends on the nature of required measures and it can not be modified thus, in this scenario, the only possibility is to cut short the BUS. Since a sensor node serves as slave for each BUS, when the number of network analyzers in an electrical substation is high, the number of transmitting nodes increases, producing a high data loss rate due to packet collisions.
For the monitoring activity of the whole site, we used six nodes and one sink connected through the topology depicted in
Figure 4.
We solved the problem of battery discharge [
28,
29,
30] by installing solar panels in order to recharge the batteries (
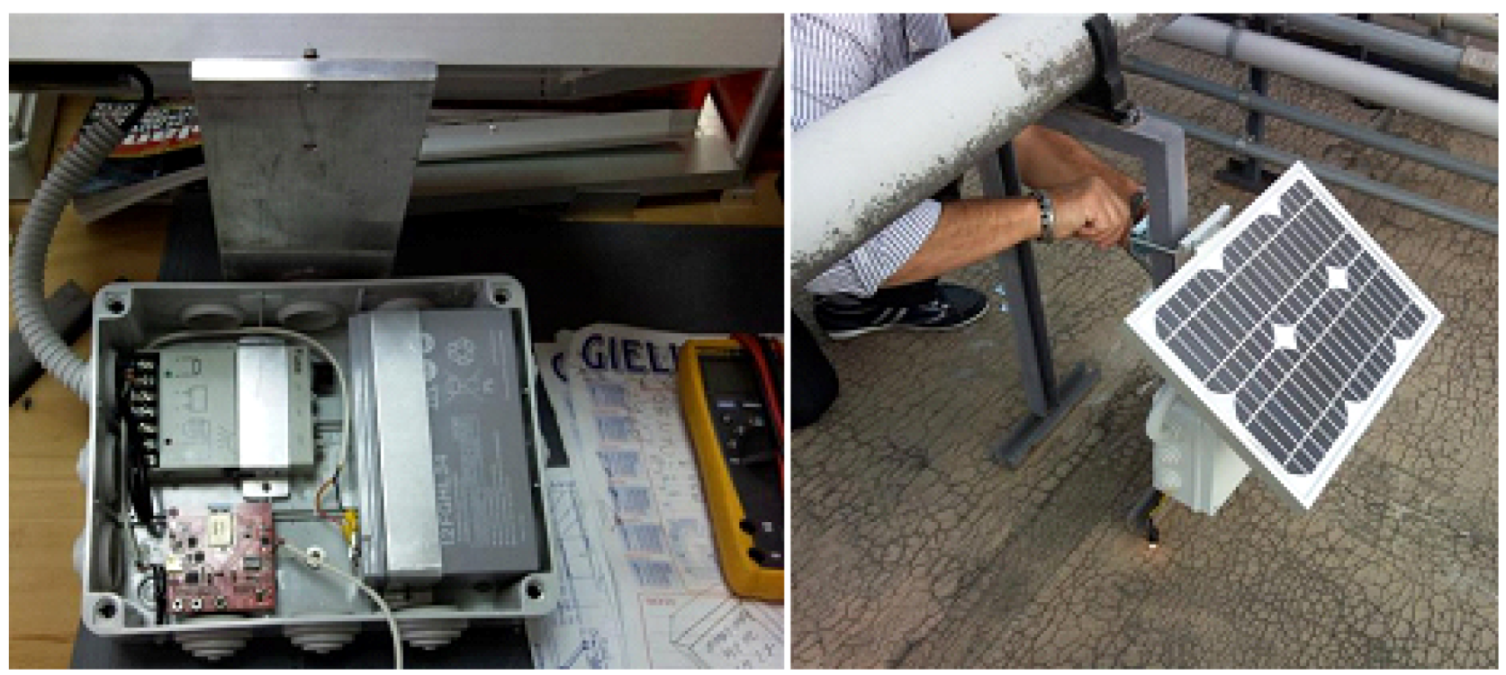
Figure 5 shows the final installation).
Figure 5.
Solar panel and battery charge circuit.
Figure 5.
Solar panel and battery charge circuit.
The middleware layer implements the integration between the technological layer (sensors and FRERs) and the application layer. WhereX receives data from the sink node to which it is interconnected via the USB interface. A specific driver was implemented and installed to properly interface and interact with the sync node. The middleware provides data aggregation, one record of 45 measures for each FRER, and then stores them into the database (through a db-event).
In general, to simplify the integration process it is necessary to improve the quality of the exchanged data. In fact, data are generally characterized by large volume, temporality, spatiality, inaccuracy, interferences, and limited active lifespan. Before a db-event is generated, the middleware executes a data filtering, which is necessary to remove the data affected by errors, and adapts them to the high-level application. All these operations are possible because WhereX gives the user the possibility to easily configure and personalize filters and rules to process the data. All these operations can be configured without restarting the middleware.
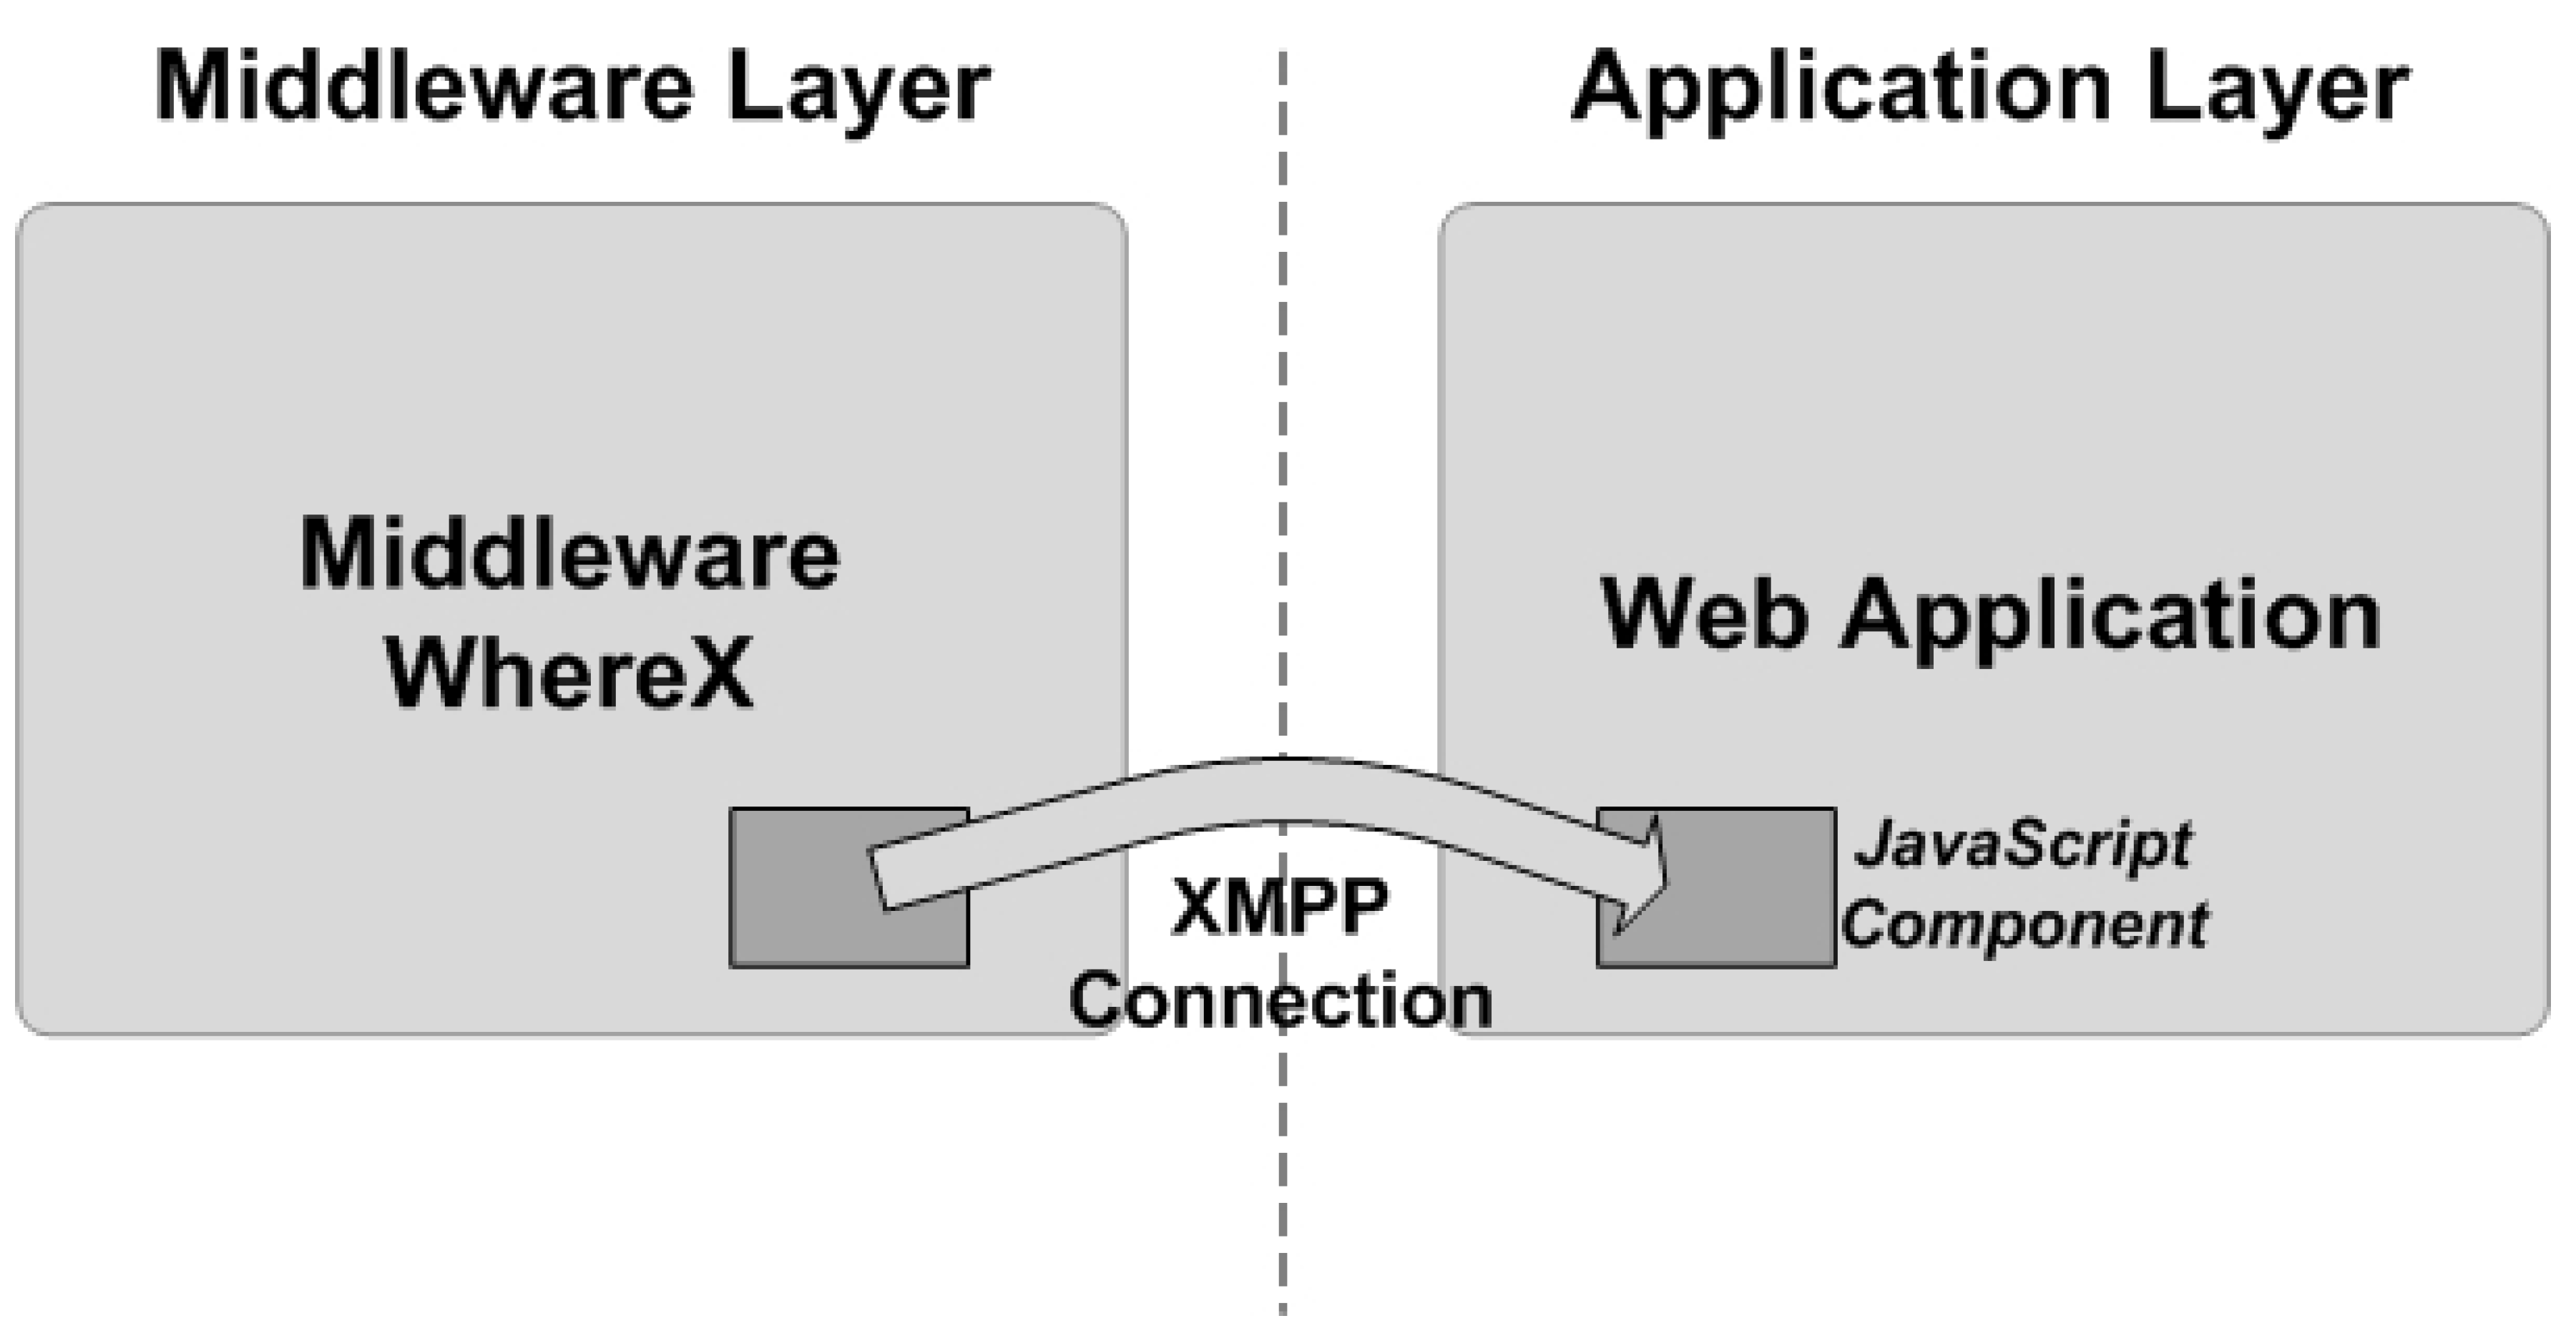
The middleware provides a JavaScript component that, once it is integrated in the static HTML pages, allows the creation of
Web-oriented platforms that can monitor the status of the devices almost in real-time. This component, depicted in
Figure 6, uses the XMPP communication protocol and converts the client-server solution into a Comet solution. The Comet solution describes a Web application model where an HTTP request allows a web server to push data to a browser, without the browser explicitly requesting it. Thus it acts like a bridge able to respond to events and to update the data in real-time. It also allows the updating of the contents into HTML pages automatically with no action by the user. Parameters related to sensor nodes (e.g., data acquisition rate, transmission rate,
etc.) are set during the installation phase, however the user is able to, at run-time, select and filter the data to be monitored as well as choose different sampling parameters. For example, if data are acquired every 10 seconds the user could choose to observe data at a different (lower) rate, e.g., every 1 minute.
Figure 6.
Interconnection schema between middleware layer and application layer.
Figure 6.
Interconnection schema between middleware layer and application layer.
The application is constituted by two functional blocks: the
real-time monitor and the
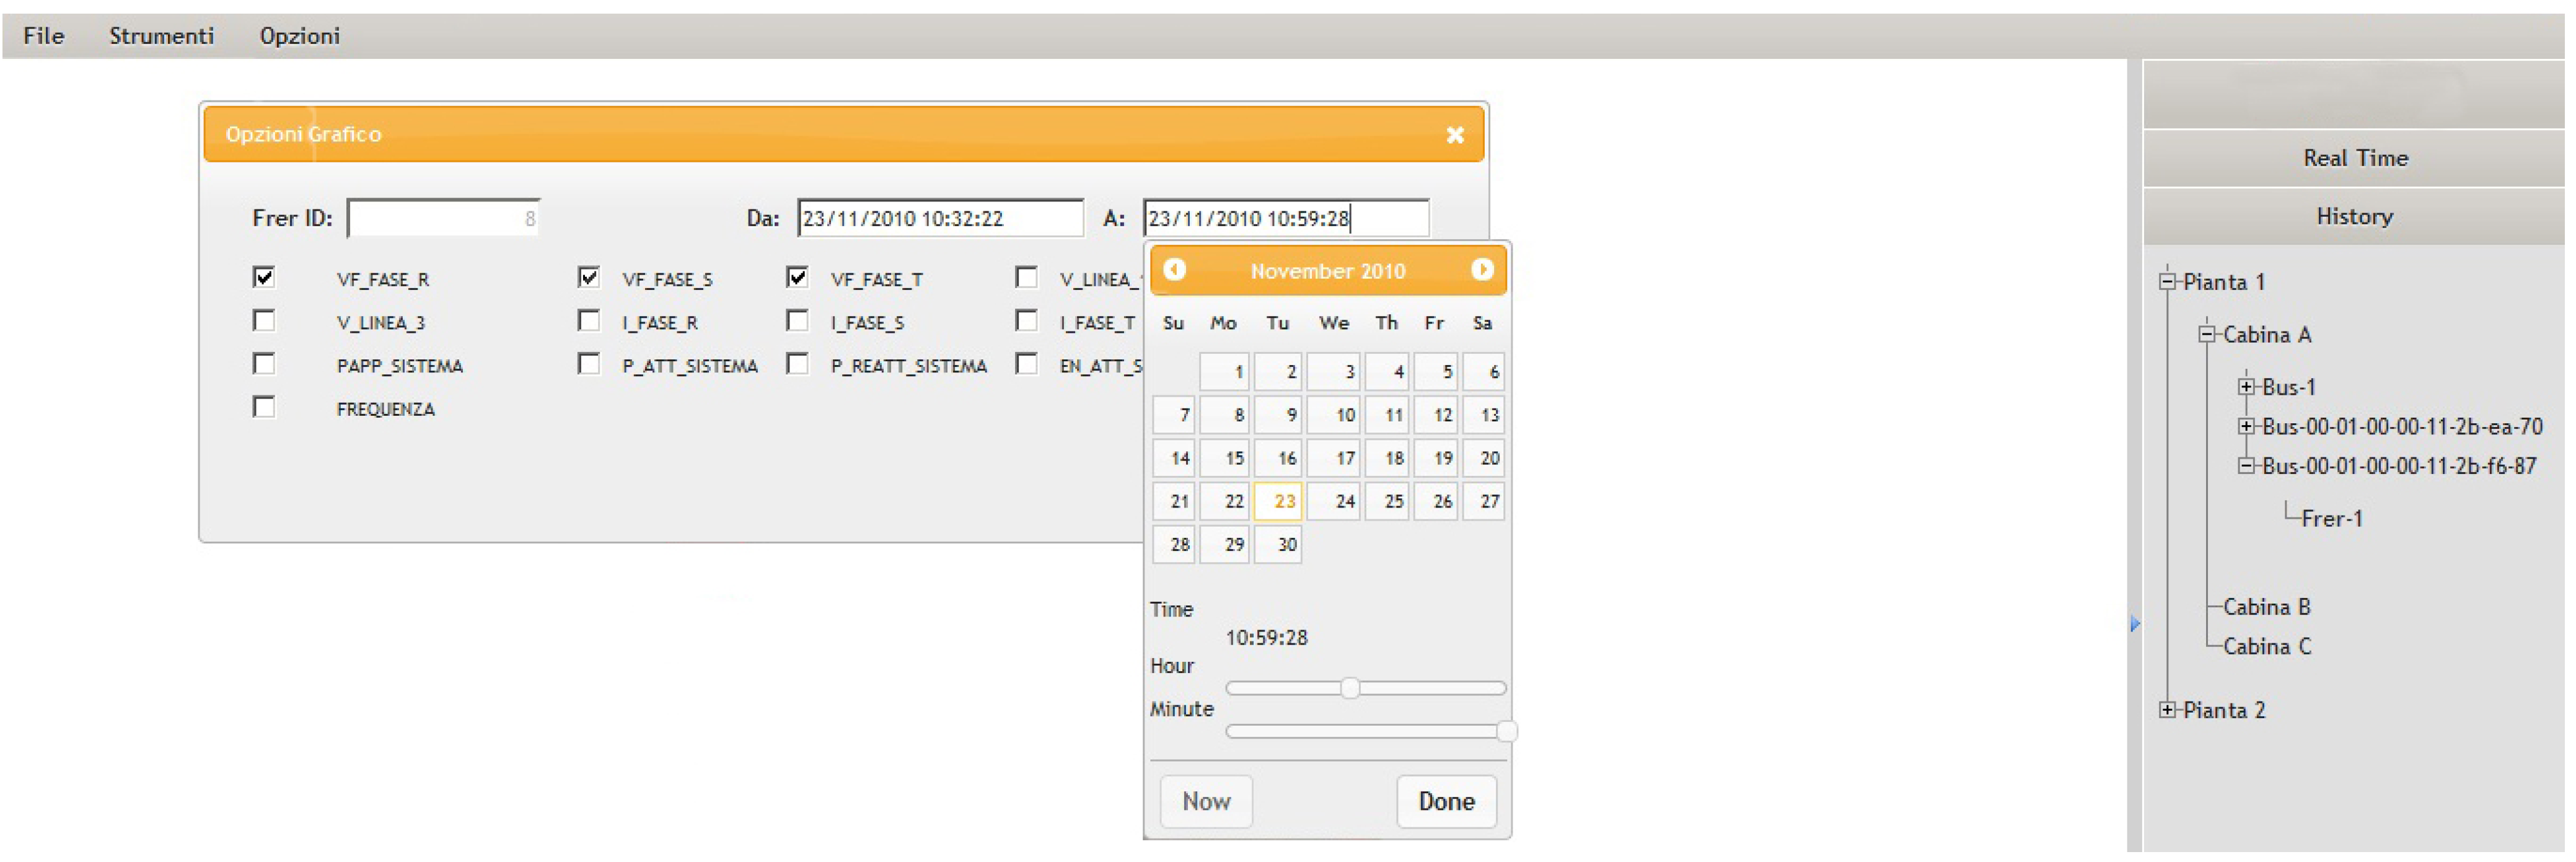
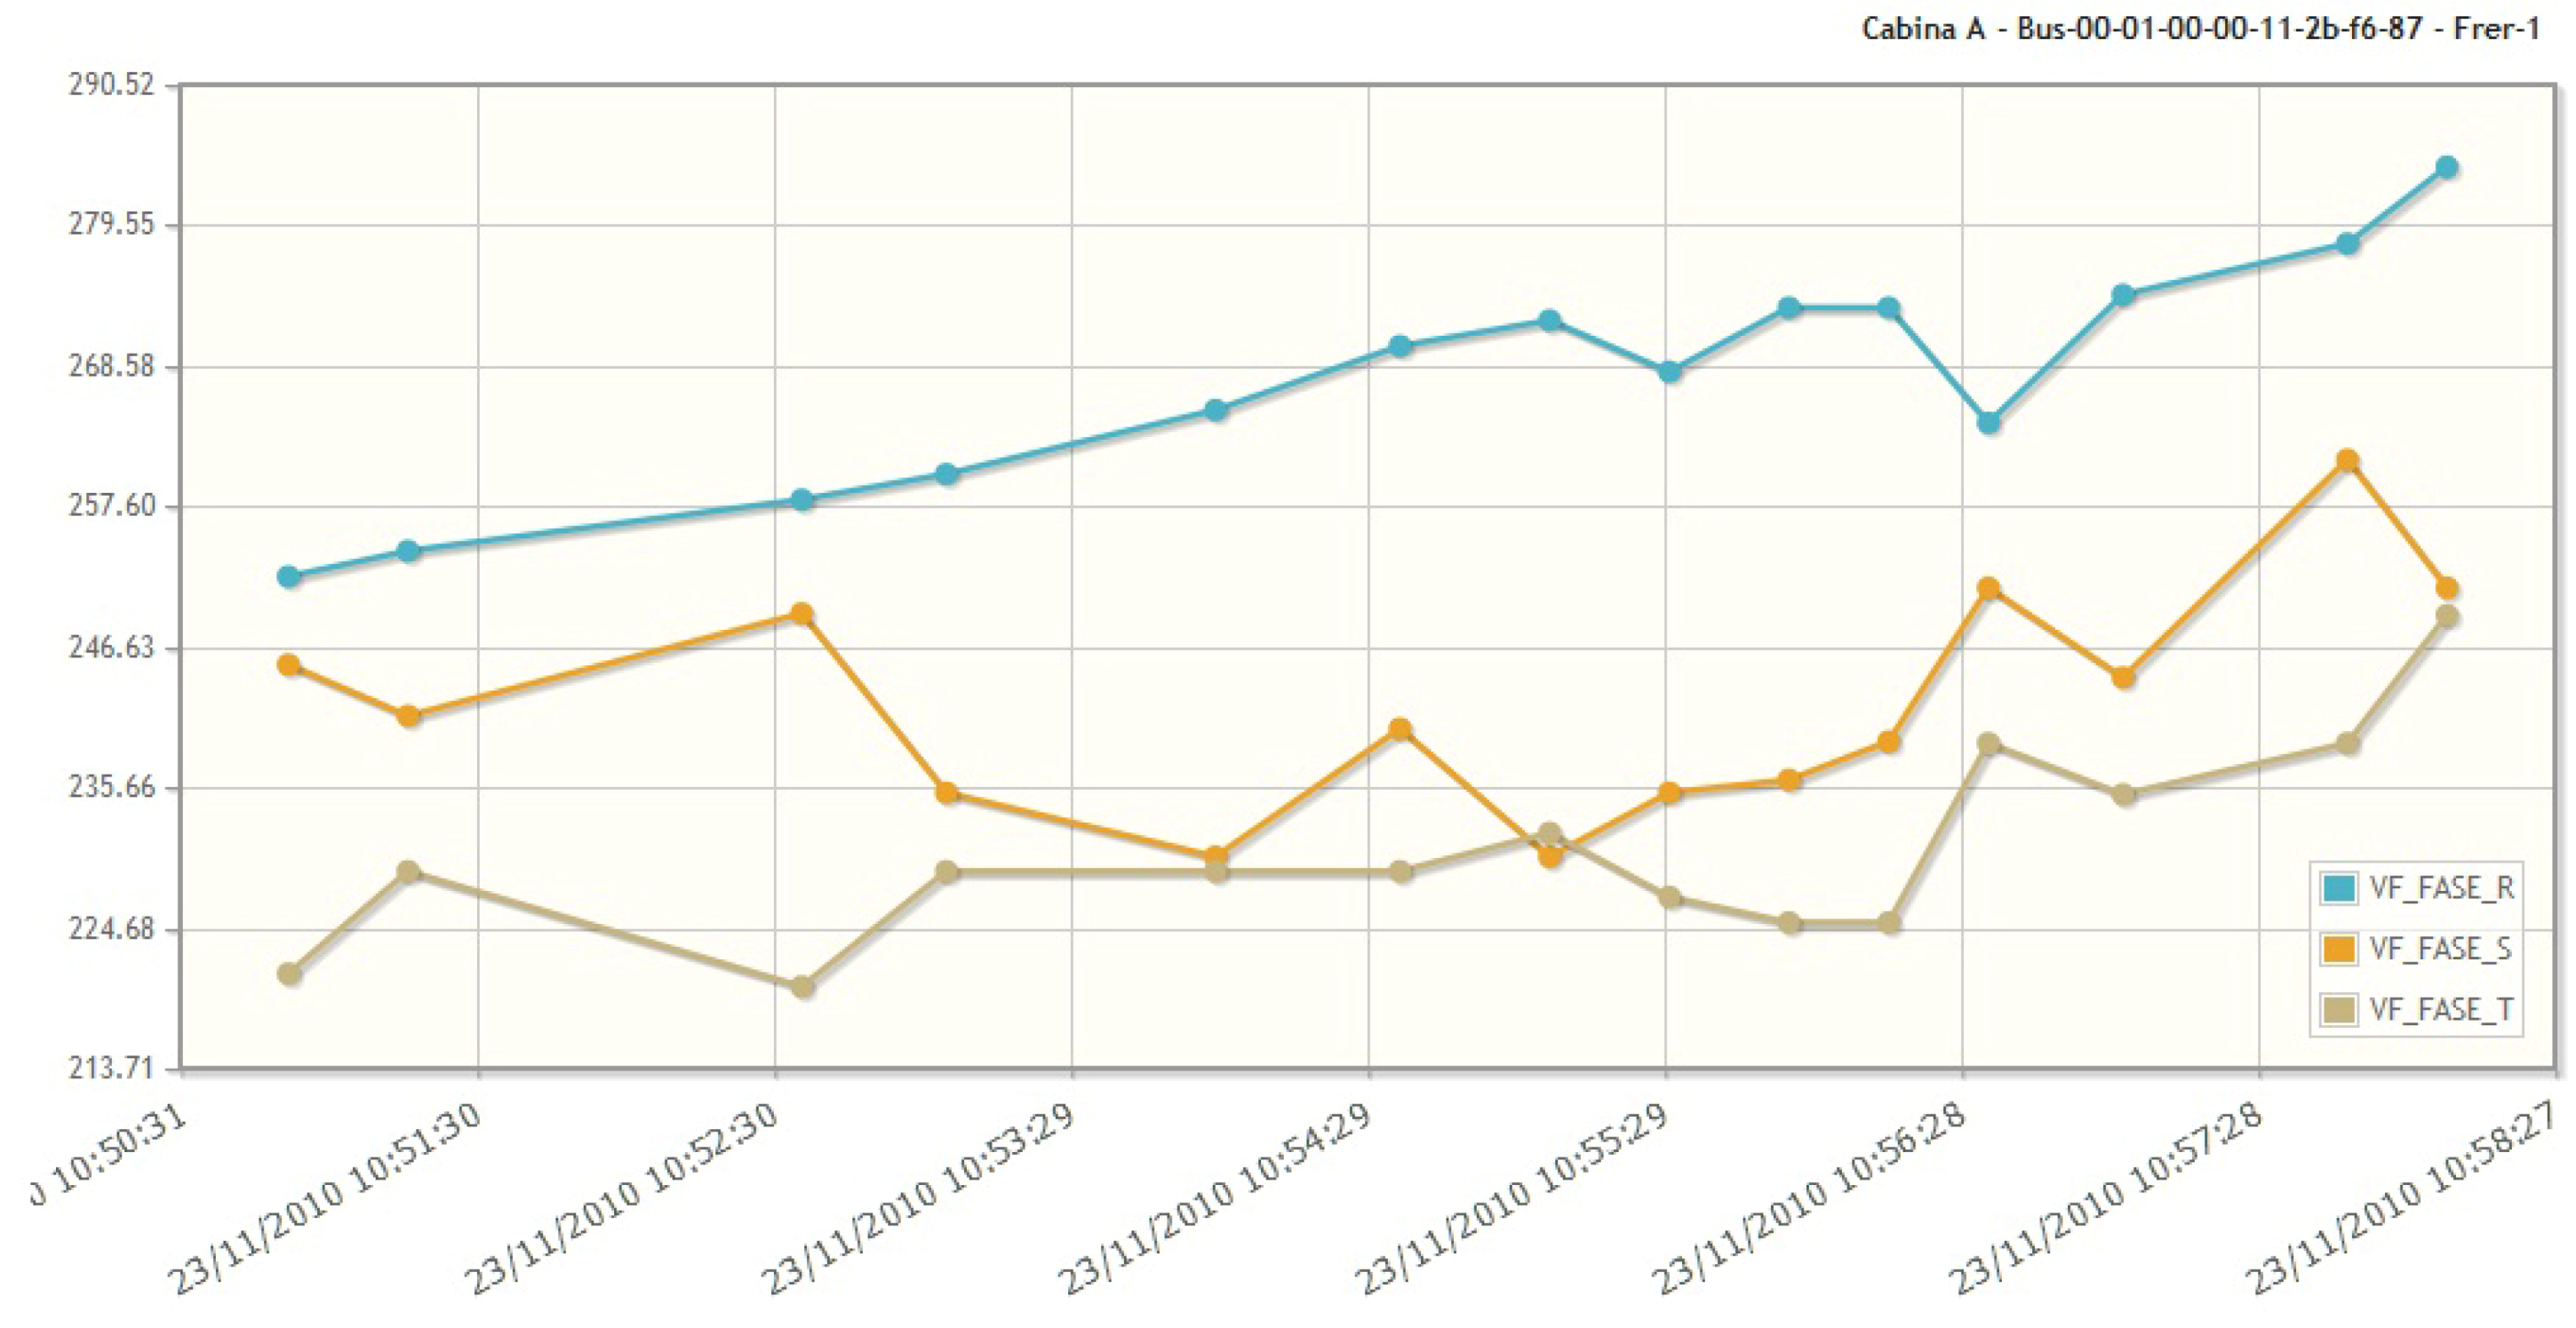
historical data analyzer. The real-time monitor shows the data in chart format. The user can select a specific substation, the BUS and each FRER belonging to the selected BUS. Upon the selection, different electrical parameters can be visualized.
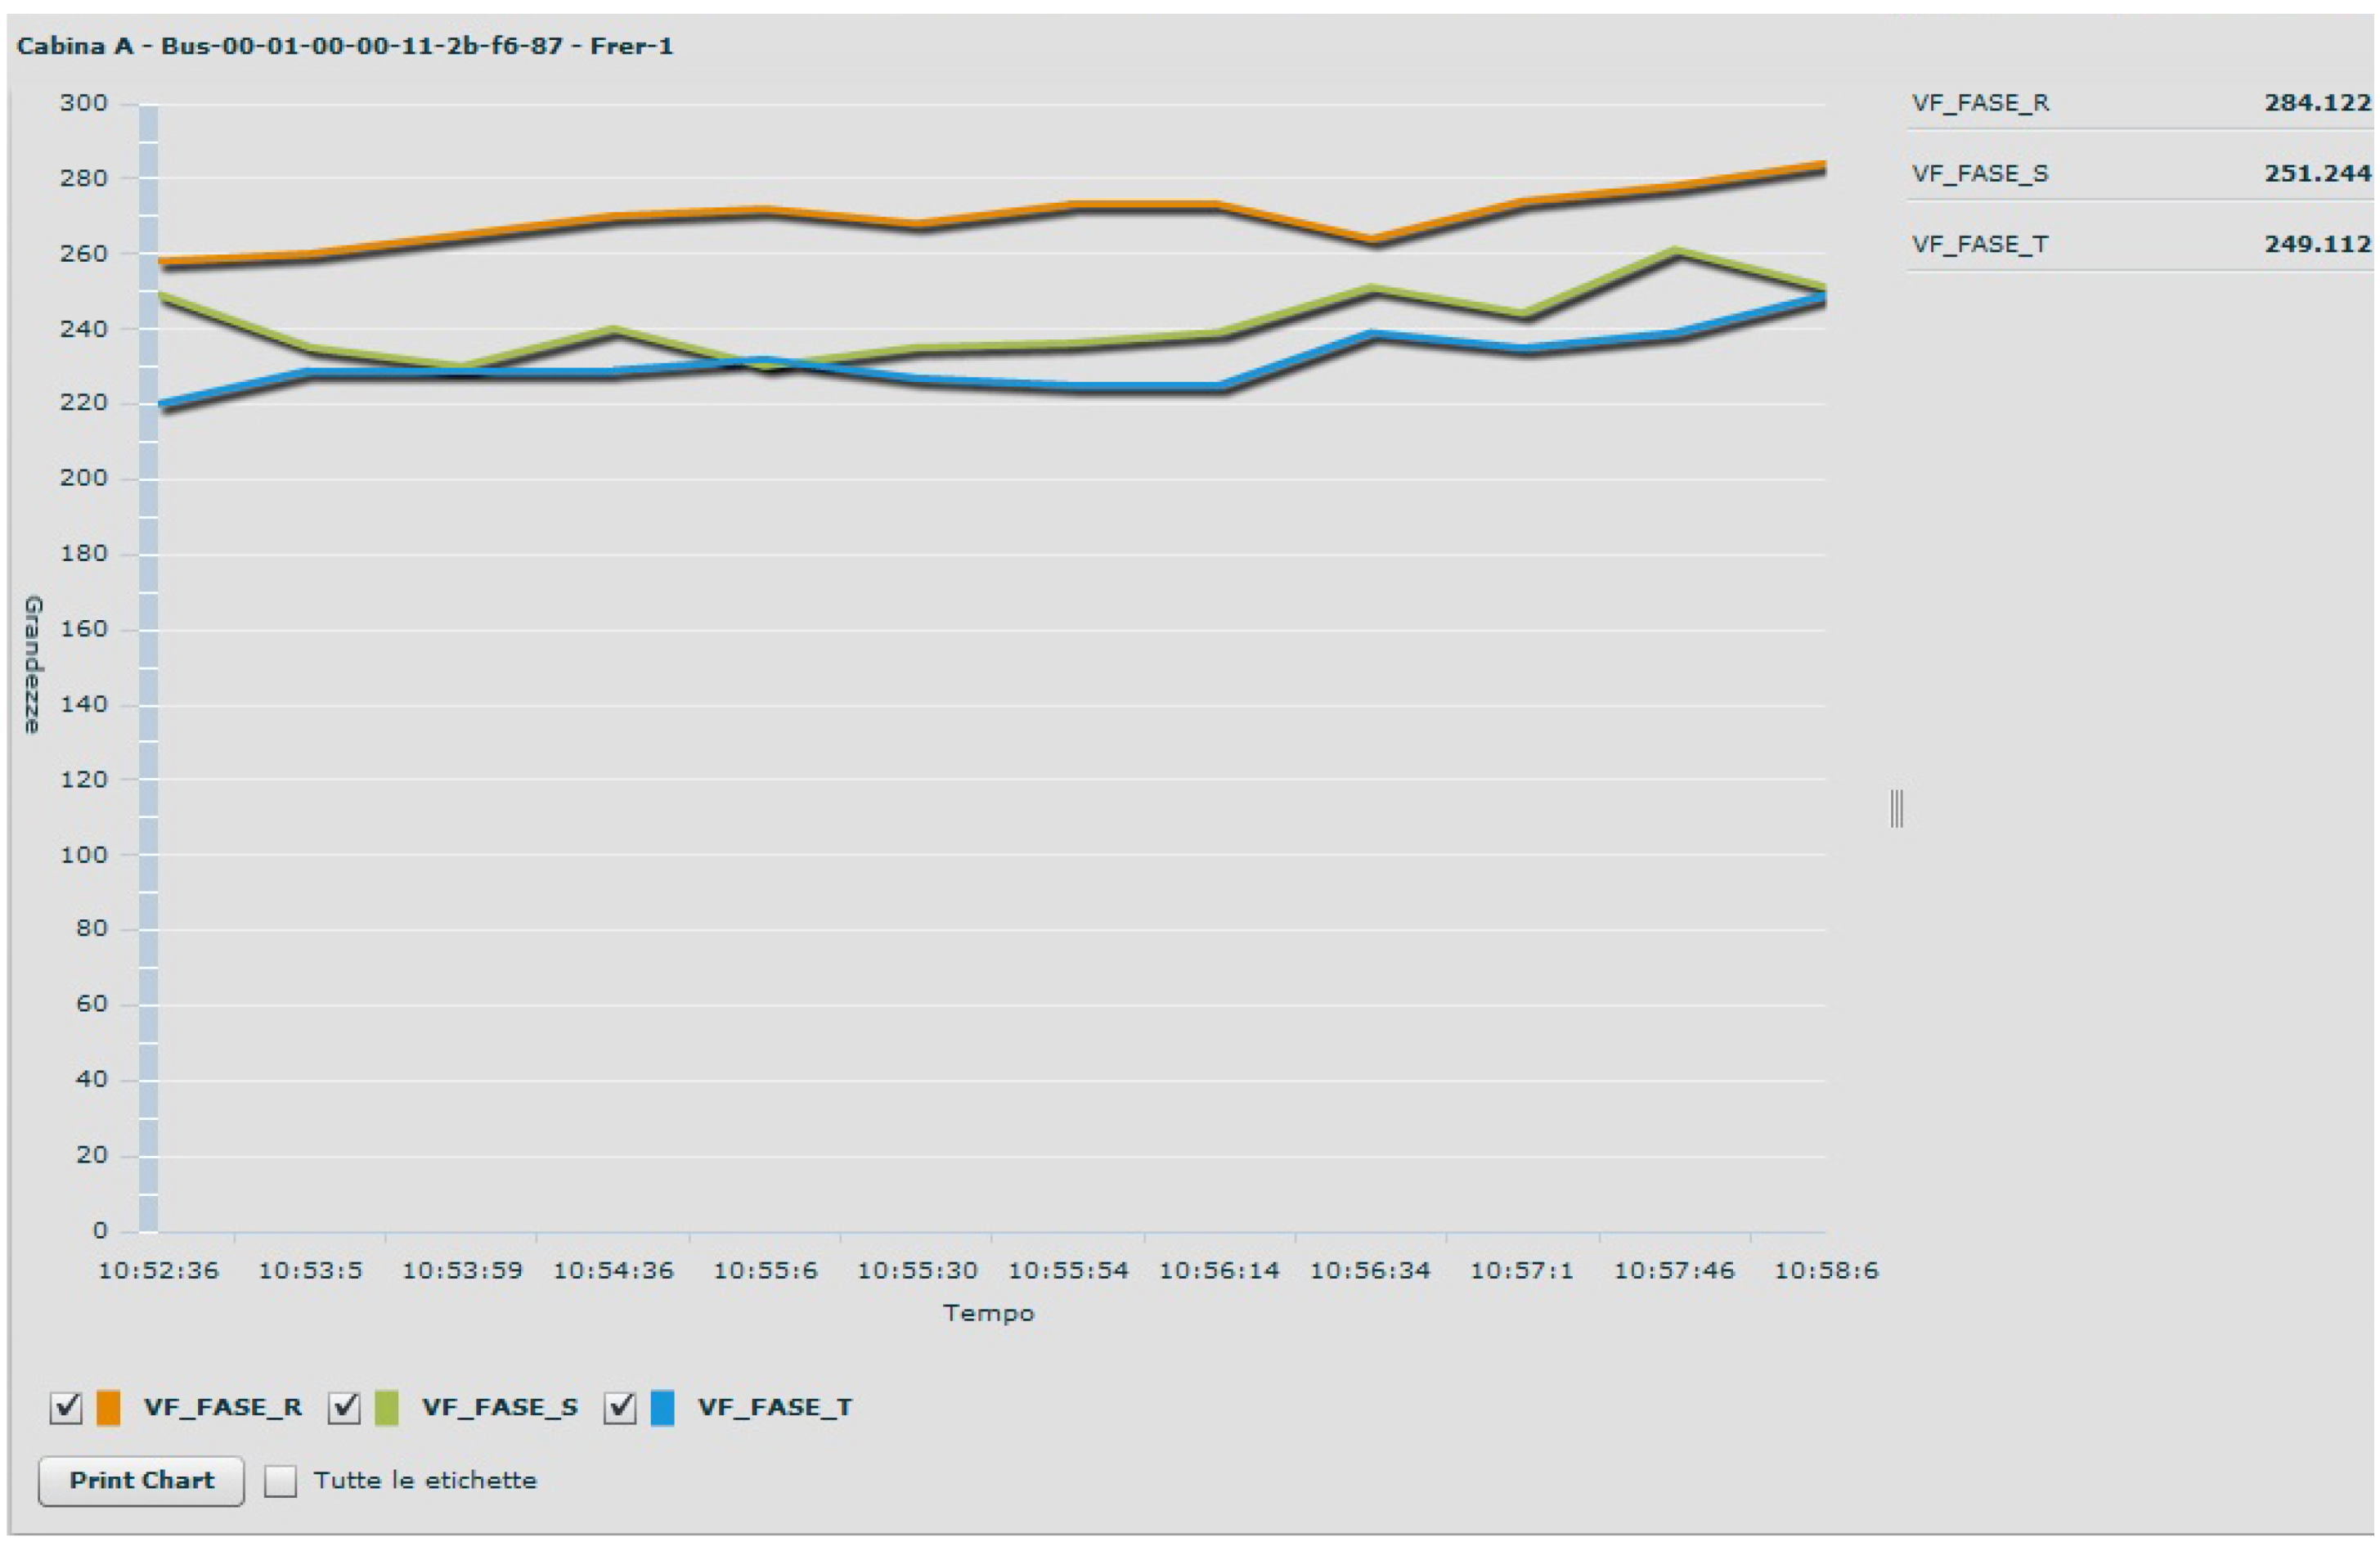
Figure 7 shows the panel where the user can select all the measures of interest, whereas in
Figure 8 an example of the temporal evolution of three different electrical parameters is depicted.
Figure 7.
Real-time and historical selection data panel.
Figure 7.
Real-time and historical selection data panel.
Figure 8.
Real-time chart screenshot.
Figure 8.
Real-time chart screenshot.
From the selection data panel (
Figure 7), the user can select all the parameters just described for the real-time case with the possibility to select a specific period of time in order to limit the amount of data.
The data extracted from the historical database can be viewed either as chart diagram or in a tabular format. The chart diagram shown in
Figure 9 is an example of diagram with three different electric measures. Finally, the capability to export such data in excel format is also supported.
Figure 9.
Historical data chart screenshot.
Figure 9.
Historical data chart screenshot.
7. Results
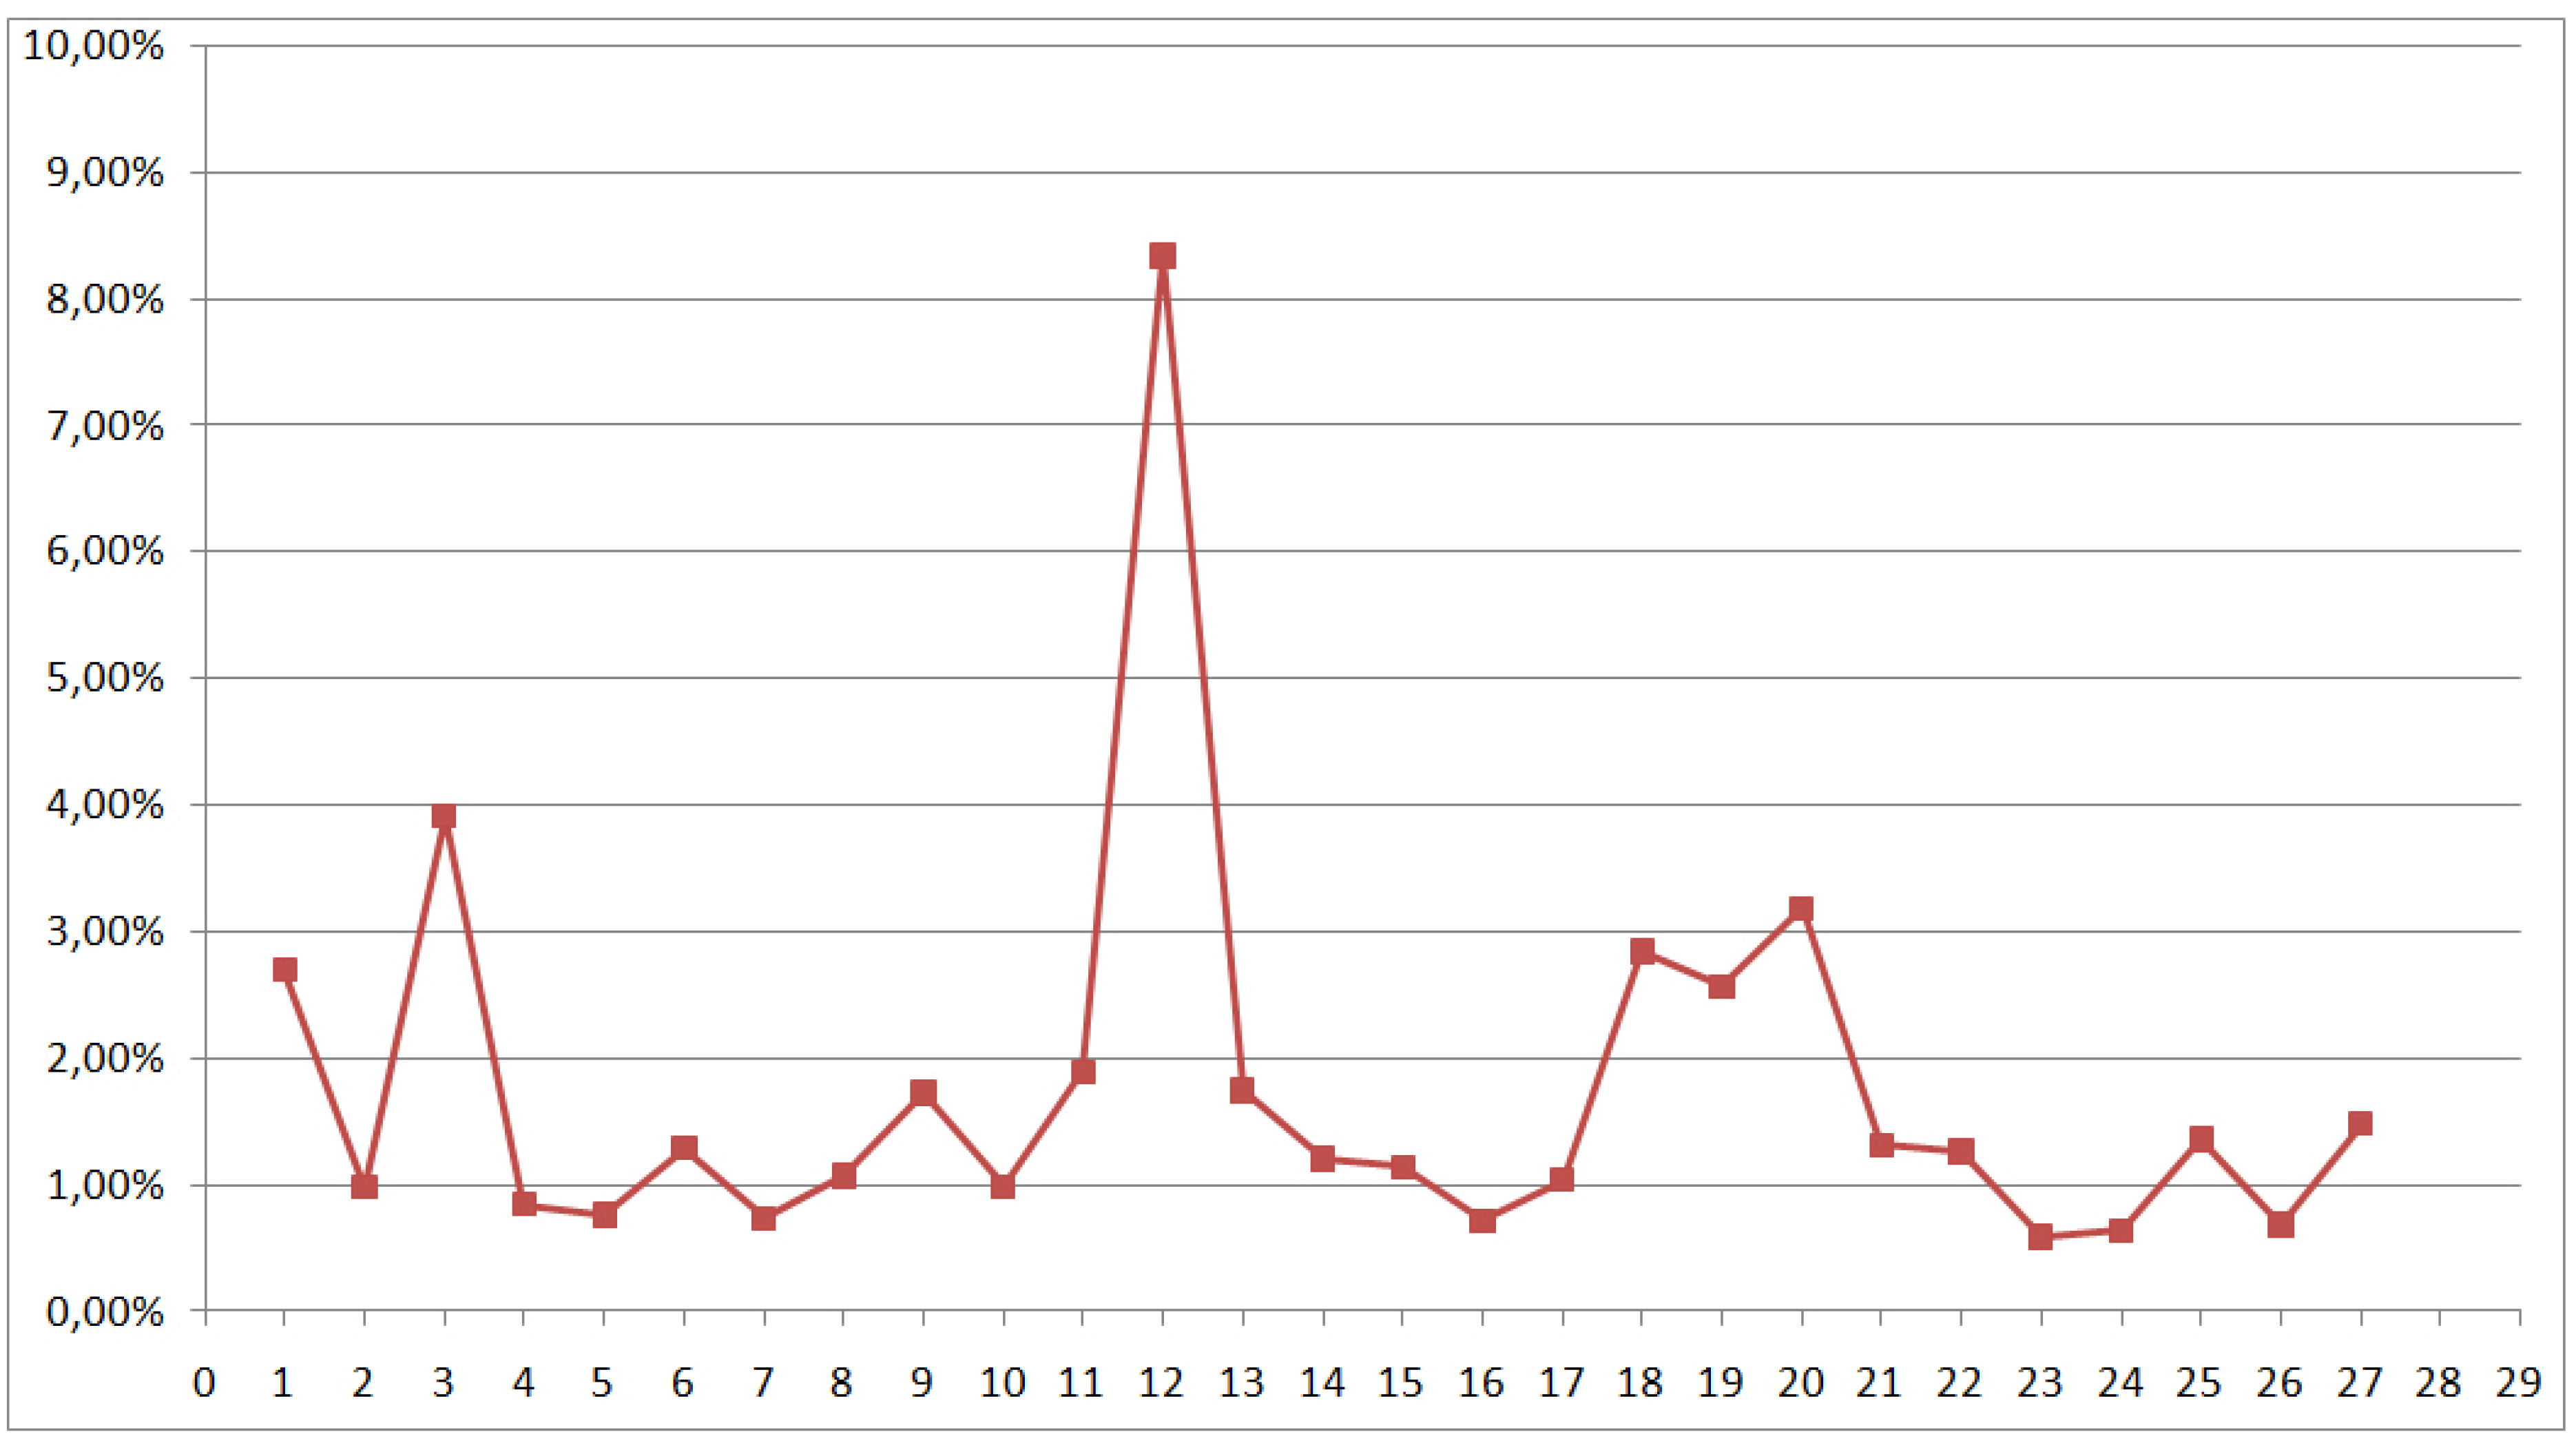
To assess the reliability of the proposed solution, we analyzed the real data in a month of observation and in particular the amount of data packets lost. We know that each sensor node, connected to the BUS, cyclically queries each FRER and acquires 16 values from 45 available. This is because not all the available measures are of interest for this application. Each measure is acquired every 2 seconds and the middleware aggregates one record when it receives all 16 measures. Theoretically 32 seconds are required to complete one record and in a day we expect 2700 records. The real amount of records stored in the database is less than the theoretical value, due to some loss in the WSN.
The graph of
Figure 10 shows the percentages of data loss for each day of one BUS and it is interesting to verify that in the worst case such a value is less than 4%. On March 12, 2011 we have measured a 9% of packets lost . This particular situation occurred when several metal cranes were operating in the industrial site, thus causing transmission interferences.
Such results confirm that the WSN approach allows to realize a reliable monitoring architecture. This is also due to the characteristic of the adopted routing protocol that is able to balance the load among all the possible redundant routes toward the sink. The solution is also scalable. In fact, if the number of substation to be monitored increases it is easily to install, in a plug-and-play way, new sensors in order to manage the corresponding load growth and/or to increase the coverage area.
Figure 10.
Percentage of packet lost vs. arrival day.
Figure 10.
Percentage of packet lost vs. arrival day.
8. Conclusions
In this paper we described an application to monitor the energy distribution within an industrial site. In particular, we adopted WSNs to acquire data from the electrical substations of the ST site of Catania (Italy). Also, we used an event-based middleware to solve the integration problems between the technological and the application layers. We also developed a software layer for the control room that analyzes the measured values. We are currently working to optimize the sensor activity and in particular we are testing aggregation algorithms able to reduce network traffic and to increase the overall efficiency of the monitoring network. The next step will be the analysis of historical and real-time data through business intelligence systems. This process will help to support the company choices in managing the energy distribution and to provide useful information on the occurrence of specific events and/or prevent abnormal patterns.
